Galaxea fascicularis - WUR eDepot
232
The influence of light and water flow on the growth and physiology of the scleractinian coral Galaxea fascicularis Miriam Schutter
-
Upload
khangminh22 -
Category
Documents
-
view
2 -
download
0
Transcript of Galaxea fascicularis - WUR eDepot

The influence of light and water flow
on the growth and physiology of the scleractinian coral
Galaxea fascicularis
Miriam Schutter

Thesis committee
Thesis supervisorsProf. Dr. J. A. J. VerrethProfessor of Aquaculture and FisheriesWageningen University
Prof. Dr. Ir. R. H. WijffelsProfessor of Bioprocess Engineering Wageningen University
Thesis co-supervisorDr. R. OsingaResearcher at Aquaculture and Fisheries GroupWageningen University
Other membersProf. Dr. R.P.M. BakUniversity of Amsterdam
Prof. Dr. J.L. van LeeuwenWageningen University
Prof. Dr. H.J. LindeboomWageningen University
Prof. Dr. B. RinkevichNational Institute of Oceanography, Israel
This research was conducted under the auspices of the Graduate School WIAS (Wageningen Institute of Animal Sciences).
The influence of light and water flow
on the growth and physiology of the scleractinian coral
Galaxea fascicularis
Miriam Schutter
Thesissubmitted in partial fulfillment of the requirements for the degree of doctor
at Wageningen Universityby the authority of the Rector Magnificus
Prof. dr. M.J. Kropff,in the presence of the
Thesis Committee appointed by the Doctorate Boardto be defended in public
on Monday 25 January 2010at 4 PM in the Aula.

Miriam SchutterThe influence of light and water flow on the growth and physiology of the scleractinian coral Galaxea fascicularis, 232 pages
Thesis, Wageningen University, Wageningen, NL (2010)With references, with summaries in Dutch and English
ISBN 978-90-8585-535-4

Table of contents Page
Chapter 1 General introduction 7
Chapter 2 The effect of different flow regimes on the growth and metabolic 27 rates of the scleractinian coral Galaxea fascicularis Submitted for publication
Chapter 3 The effect of irradiance on long-term skeletal growth of Galaxea 55 fascicularis under four light conditions Adapted after Schutter et al. 2008 (J Exp Mar Biol Ecol 367: 75–80)
Chapter 4 Photo-acclimation of the scleractinian coral Galaxea fascicularis 75 to photoperiod extension under light-saturating conditions Submitted for publication
Chapter 5 Modification of light utilization for skeletal growth by water flow in 95 the scleractinian coral Galaxea fascicularis Submitted for publication
Chapter 6 The biology and economics of coral growth 117 Submittted for publication, Chapter 7 General discussion 147
References 178
Summary in English 202
Summary in Dutch (Samenvatting) 210
Acknowledgements (Dankwoord) 218
About the author 224
WIAS Graduate School Training and Supervision Programme 228


Chapter 1
General introduction
Miriam Schutter
Chapter 1
8
11 Background
Scleractinian corals are the key organisms of tropical coral reefs and are, together with
crustose coralline algae, responsible for building the carbonate reef structure that pro-
vides the physical structure and ecological habitat to thousands of other reef organisms.
Coral reefs are “the tropical rainforests of the sea”: the most biodiverse marine ecosys-
tems in the world.
This intriguing and important ecosystem is threatened by both natural and anthropogenic
factors such as global warming and ocean acidification (Hoegh-Guldberg et al. 2007), eu-
trophication (Szmant 2002), pollution, sedimentation, terrestrial run-off (Fabricius 2005),
irresponsible dive tourism, overfishing (Scheffer et al. 2001; Jackson et al. 2001), de-
structive fishing (e.g. use of cyanide and blast fishing) and collection for aquarium trade
(Bruckner et al. 2001). In the last couple of decades there has been an increasing number
of bleaching events (Jones et al. 1997; Coles and Brown 2003), a large decrease in coral
cover (Gardner et al. 2003; Bellwood et al. 2004) and an overall decline of biodiversity
(Bellwood and Hughes 2001).
Concurrent with the gradual decline of coral reefs, there is a growing interest in keeping
this delicate and beautiful ecosystem in aquaria by both hobbyists and public aquaria.
The trade in marine ornamental species has become a multi million dollar industry. It is
the mission of zoos and public aquaria to create more public awareness about the im-
portance, beauty and sensitivity of the reef ecosystem. Therefore, to reduce additional
harvesting pressure on the coral reef, it is the policy of zoos and public aquaria to display
organisms that originate from sustainable breeding facilities. This policy has created an
increased effort to develop cost-effective in situ (open sea) and ex situ (aquarium) culture
of corals. To support this effort, the CORALZOO project was established and funded by
the European Union (contract nr. 012547). In this project, universities and public aquaria
collaborated to improve techniques for breeding and husbandry of scleractinian corals in
closed aquarium systems (Osinga et al. 2005; Osinga 2007, 2008). This thesis reports
research on factors controlling coral growth.
General introduction
9
1The relevance of this research project is two-fold. First, the deduction of universal mecha-
nisms of coral growth can be used for sustainable aquaculture of scleractinian corals in
public aquaria. Second, being successful in sustainable aquaculture of scleractinian cor-
als indirectly contributes to reef conservation. Aquaculture is increasingly mentioned as
a priority solution to reduce harvesting pressure on coral reefs (Parks et al. 2003; Hii et
al. 2008). Moreover, the conservation of coral reefs is also ensured through safeguarding
gene populations in aquaria for possible future restoration projects.
2 Closed aquarium systems
For a long time it was not possible to maintain living corals in closed aquarium systems,
since corals are very demanding and sensitive to changes in their environment. Proper
water chemistry is fundamental to keep corals alive and growing in aquaria (Wilkens
1973; Delbeek 2001). Obviously, this is less of a problem for open-system aquaria that
have unlimited access to natural seawater. However, closed-system aquaria are often
located far from the ocean and have to use artificial sea salt to make up their seawa-
ter. With the help of technological advances such as in the control of water chemistry,
new lighting equipment and technologies for simulating water movement, it is possible
to maintain corals ex-situ in a healthy condition for many years (Carlson 1999). Still,
much knowledge on coral husbandry is anecdotal (e.g. reported in hobby magazines and
popular books) and not scientifically based. A scientific approach is needed to validate
and improve the common practice, and to reveal the underlying mechanisms responsible
for well-being and growth.
Little is known yet about the impact of artificial environments upon scleractinian growth,
morphology, calcification, behaviour and reproduction (Clode and Marshall 2003). Com-
pared to the natural environment of coral reefs, closed aquarium systems are low in
diversity of plants and animals, deficient in natural zoo- and phytoplankton communi-
ties and relatively rich in bacteria. Harvesting zooplankton from the sea to feed corals
in closed aquarium systems is neither sustainable nor economically viable. Therefore,
usually brine shrimp (Artemia nauplii) are used to feed corals in captivity (Hii et al. 2008).
Chapter 1
10
1Artemia are also widely used as live food for the larval culture of fish and shrimp species
(Lavens and Sorgeloos 2000). Although Artemia nauplii are not the natural food source
for corals, they are well-accepted as a food source by many different coral species (Hii
et al. 2008; Houlbreque and Ferrier-Pagès 2009). Moreover, dormant Artemia cysts are
commercially widely available, can be stored for long periods and can be easily cultured
and enriched with different nutrients to meet specific nutritional needs.
Closed aquarium systems are generally high in nitrate and dissolved organic nutrients
and require significant effort to maintain calcium, pH and alkalinity levels. The small size
of most aquaria does not allow for much buffer capacity, which makes either frequent
water changes or chemical addition of (trace)elements necessary. Chemical additions,
on its turn, may lead to imbalances in sea water chemistry. Additionally, light intensity and
water flow rates are generally quite low compared to most reefs, ultraviolet light is virtually
absent, and the light field is usually unidirectional and unvarying, with no lunar cycles or
seasonality (Carlson 1999, 2008). Clearly, closed aquaria systems are not exact simula-
tions of nature. However, aquaria have the advantage of allowing a certain amount of
control of (known) biological and/or abiotic factors. Therefore, aquaria are an ideal setting
to study biological responses to environmental changes and factors controlling growth.
3 Biology of scleractinian corals
In order to understand coral growth, an introduction to the biology of scleractinian corals
is needed. Scleractinian or reef-building corals are member of the phylum Cnidaria and
are therefore closely related to other stinging animals such as jellyfish and sea anemo-
nes. In contrast to the solitary life form of anemones (being a single polyp), scleractinian
corals are mostly colonial modular animals that consist of numerous polyps that are inter-
connected by tissue (Figure 1).
General introduction
11
1
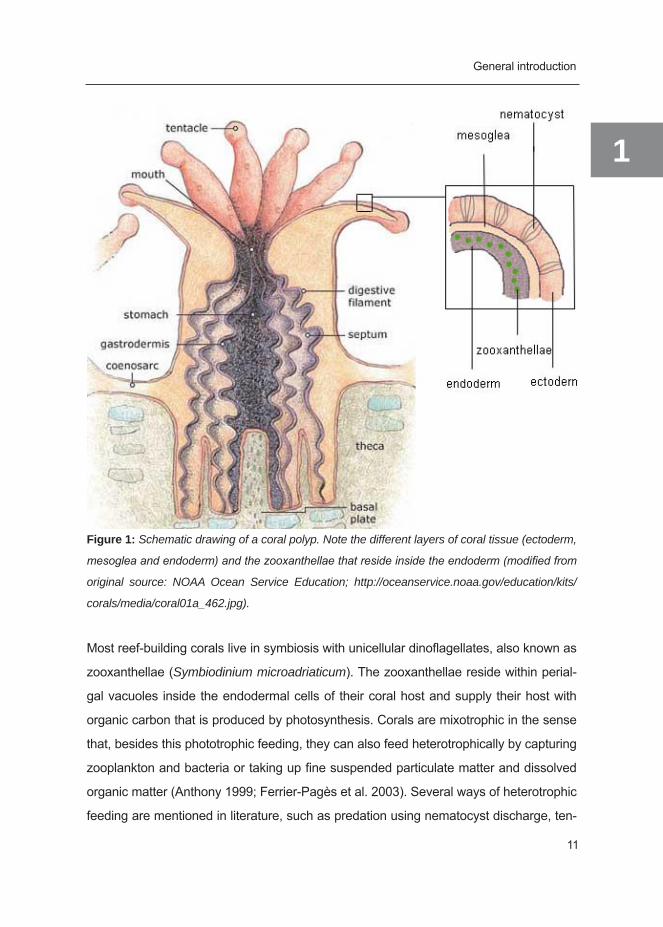
Figure 1: Schematic drawing of a coral polyp. Note the different layers of coral tissue (ectoderm,
mesoglea and endoderm) and the zooxanthellae that reside inside the endoderm (modified from
original source: NOAA Ocean Service Education; http://oceanservice.noaa.gov/education/kits/
corals/media/coral01a_462.jpg).
Most reef-building corals live in symbiosis with unicellular dinoflagellates, also known as
zooxanthellae (Symbiodinium microadriaticum). The zooxanthellae reside within perial-
gal vacuoles inside the endodermal cells of their coral host and supply their host with
organic carbon that is produced by photosynthesis. Corals are mixotrophic in the sense
that, besides this phototrophic feeding, they can also feed heterotrophically by capturing
zooplankton and bacteria or taking up fine suspended particulate matter and dissolved
organic matter (Anthony 1999; Ferrier-Pagès et al. 2003). Several ways of heterotrophic
feeding are mentioned in literature, such as predation using nematocyst discharge, ten-
Chapter 1
12
1tacle grabbing, ciliary feeding using mucus entrapment, absorbance of dissolved organic
matter, nutrient absorption from bacteria proliferating in mucus layer and possibly even
digestion of zooxanthellae (Titlyanov and Titlyanova 2002a; Houlbreque and Ferrier-
Pagès 2009).
The symbiosis allows for tight nutrient recycling which is a good adaptation for survival
under the oligotrophic circumstances in which these corals are usually living. The pho-
tosynthetically active zooxanthellae use light energy for fixation of inorganic carbon into
organic compounds such as sugars and glycerol. Inorganic nitrogen, such as ammonium
(NH4+), and phosphorous (which are needed for synthesis of proteins by the zooxan-
thellae) are absorbed from the environment by the coral or recycled from coral waste
products. The organic compounds produced by the zooxanthellae, also called photosyn-
thates, are used first to satisfy their own metabolic needs, after which the remainder will
be translocated to the coral host. It is estimated that circa 90% of the organic compounds
produced by the zooxanthellae is translocated to the coral host (Davies 1984), but this
varies between species. Once at the coral host, the photosynthates will either be re-
spired, stored as lipid (Crossland 1980; Anthony et al. 2002) and/or excreted as mucus
(Davies 1984; Crossland 1987; Brown and Bythell 2005). The oxygen produced during
zooxanthellar photosynthesis is used for respiration and, if needed, additional oxygen is
taken up from the environment (e.g. at night). Since photosynthates generally have a very
high C:N ratio (i.e. are low in nitrogen), these compounds do not provide the necessary
building blocks to support growth of the coral host. For this reason, these photosynthetic
products are also called “junk food” (Dubinsky and Jokiel 1994). Mucus production and
excretion was initially proposed to function primarily as an excretory pathway for excess
organic carbon produced via symbiont photosynthesis, i.e. junkfood (Davies 1984). It is
estimated that up to 45% of daily net photosynthates is being released as mucus and
dissolved organic carbon (Davies 1984; Crossland 1987; Bythell 1988; Edmunds and
Davies 1989). However, since the excretion of mucus seems not always a consequence
of a low quality (high C:N) diet or excess production (Crossland 1987; Brown and Bythell
2005) other physiological and ecological roles are also proposed, such as a possible
role in calcification, defense against damage by ultra violet radiation, defense against
General introduction
13
1smothering by sediment, defense against pathogens and defense against pollutants and
other stresses (Brown and Bythell 2005). Nutrients necessary for coral growth, such as
organic nitrogen and phosphorus, cannot be supplied by the zooxanthellae in sufficient
amounts, but can be obtained by feeding heterotrophically (Ferrier-Pagès et al. 2003) or
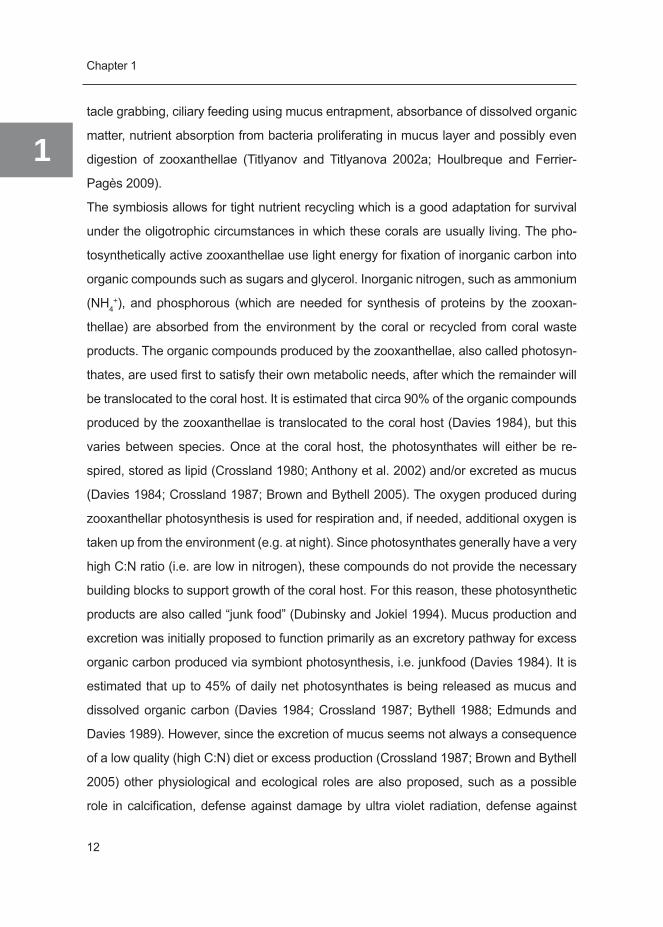
from absorption. See Figure 2 for a schematic overview of nutrient flows occurring within
the coral-algal symbiosis that may be relevant to the coral growth.
The evolution of the coral-algal symbiosis resulted in integration and adaptation of both
partners to each other and to the prevailing external circumstances. As a result, symbiotic
organisms are not simply the sum of each organism separately, but an integrated whole
(Yellowlees et al. 2008) that receives both benefits and constraints from their integration
(Furla et al. 2005).
Algaautotroph
Coral hostheterotroph
Translocation
Mucus excretion
Heterotrophic feeding
Catabolism
Organic C, N, P
Photos
ynthe
sis
Inorganic C, N, P
Absorption
CaCO3 Organic matrixCoral skeleton
Cal
cific
atio
n
Org
anic
mat
rix
synt
hesi
s
Catabo
lism
Organic C, N, P
Inorganic C, N, P
Organic C, N, P
Figure 2: Schematic illustration of cycling of organic and inorganic nutrients within the coral-algal
symbiosis (i.e. holobiont). C=carbon, N= nitrogen, P= phosphate.
Growth of scleractinian corals can be divided in three components: 1) skeletal growth
due to the deposition of an external skeleton of calcium carbonate aided by the synthesis
of an organic matrix in a process called calcification, 2) tissue growth and 3) growth of
Chapter 1
14
1zooxanthellae. Growth of scleractinian corals can predominantly be attributed to increas-
ing skeletal mass, i.e. calcification. Prerequisites for coral calcification are: a) the supply
of Ca2+ ions, b) the supply of an inorganic carbon source (either HCO3- taken up from
water column or metabolic CO2 from respiratory processes) c) a high aragonite saturation
state (Ω) that favors precipitation of calcium carbonate, d) the supply of precursors for the
organic matrix, either translocated by zooxanthellae (Muscatine and Cernichiari 1969;
Pearse and Muscatine 1971; Young et al. 1971; Barnes and Crossland 1978; Richevich
and Loya 1984) or supplied via heterotrophic feeding (Pearse and Muscatine 1971; Alle-
mand et al. 1998a) and e) energy (ATP) for e.g. the uptake and transport of Ca2+ through
different cellular layers.
According to the light-enhanced calcification theory (see Gattuso et al. 1999; Allemand et
al. 1998b for review), the symbiosis with zooxanthellae is aiding to the process of skeletal
growth. According to this theory, calcification of the coral host is enhanced by photo-
synthesis of zooxanthellae (Goreau and Goreau 1959; Pearse and Muscatine 1971; Al-
lemand et al. 2004). Indeed, on average, calcification in light is found to be around three
times higher than calcification in darkness (Gattuso et al. 1999). Although photosynthesis
and calcification are spatially separated processes (photosynthesis occurs in the oral
tissue layer and calcification in the aboral tissue layer), they do share a common pool of
inorganic carbon inside the coelenteron of the coral host, accounting for the interaction
between these two processes. The exact mechanisms of the enhancement of calcifica-
tion by photosynthesis are still a matter of debate (Gattuso et al. 1999; Furla et al. 2000).
The proposed hypotheses can be classified in two groups: 1) photosynthesis modifies the
inorganic (carbonate) chemistry (pH and Ω) and 2) photosynthesis modifies the organic
chemistry (e.g. ATP or organic matrix precursors) (see Gattuso et al. 1999; Allemand et
al. 2004 for review). The importance of the organic matrix for the process of calcification
is widely acknowledged (Allemand et al. 2004), just as the qualitative importance of the
supply of organic matrix precursors by either zooxanthellar photosynthesis or through
heterotrophic feeding. However, the quantitative importance of each source of precur-
sors remains largely unknown. Possibly, the importance of heterotrophic feeding for the
synthesis of the organic matrix is currently underestimated.

General introduction
15
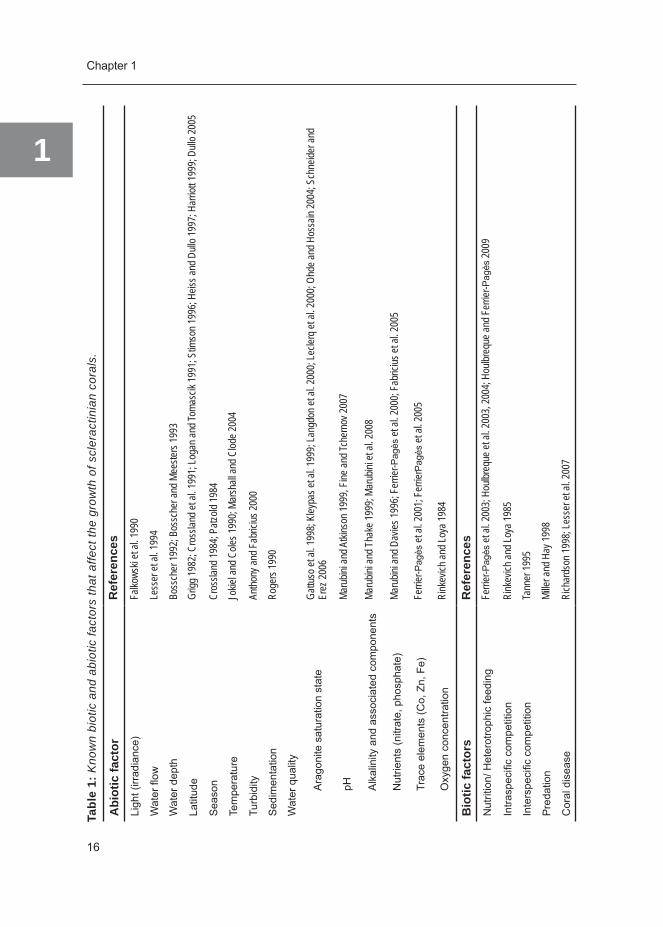
1Growth and survival of scleractinian corals can be influenced by various biotic and abiotic
factors (Table 1) and can be described in several ways, either directly by the result of the
process of calcification (e.g. skeletal mass, surface area, polyp number), or indirectly by
the process of calcification (e.g. calcium uptake, HCO3- depletion)
4 Environmentalinfluencesoncoralgrowth
Coral growth depends on various endogenic and exogenic factors. The relation of coral
growth with mixed environmental variables such as depth (Bosscher and Meesters 1993;
Heiss 1994), latitude (Grigg 1982; Crossland et al. 1991; Logan and Tomascik 1991;
Stimson 1996, Heiss and Dullo 1997, Harriott 1999; Dullo 2005 ) and season (Crossland
1984; Patzold 1984) have long been recognized. Growth rates of scleractinian corals
generally decrease with increasing water depth. However, due to the mixed nature of
this variable, this effect could be related to either light, water movement or resuspension
of sediments and organic matter. Similarly, there are several potential factors controlling
the decrease of growth rates with increasing latitude, such as decreasing temperature,
photoperiod (day length) and irradiance. Light was assumed to be the primary factor con-
trolling growth as a function of depth, while the decline in calcification rate with increased
latitude was attributed to the effects of reduced temperature and, to a lesser extent, re-
duced light (Lough and Barnes 2000)
In laboratory or field manipulation studies, environmental factors influencing coral growth
were studied separately, such as light (e.g. Marubini et al. 2001; Reynaud-Vaganay et al.
2001; Reynaud et al. 2004; Schlacher et al. 2007), water flow (Montebon and Yap 1997;
Kuffner et al. 2001; Sebens et al. 2003; Nakamura 2005), temperature (e.g. Jokiel and
Coles 1978; Crossland 1984; Marshall and Clode 2004), water quality (e.g. Marubini and
Davies 1996; Fabricius 2005), aragonite saturation state (Gattuso et al. 1998, Marubini et
al. 2001), and heterotrophic feeding (Ferrier-Pagès et al. 2003; Houlbreque et al. 2003,
2004; Houlbreque and Ferrier-Pagès 2009). Most of these studies involved short term
manipulations of factors.
Chapter 1
16
1
Tabl
e 1:
Kno
wn
biot
ic a
nd a
biot
ic fa
ctor
s th
at a
ffect
the
grow
th o
f scl
erac
tinia
n co
rals
.
Abi
otic
fact
or
Ref
eren
ces
Ligh
t (irr
adia
nce)
Falko
wski
et al.
1990
Wat
er fl
owLe
sser
et al
. 199
4
Wat
er d
epth
Boss
cher
1992
; Bos
sche
r and
Mee
sters
1993
Latit
ude
Grigg
1982
; Cro
sslan
d et a
l. 199
1; Lo
gan a
nd To
masc
ik 19
91; S
timso
n 199
6; He
iss an
d Dull
o 199
7; Ha
rriott
1999
; Dull
o 200
5
Sea
son
Cros
sland
1984
; Patz
old 19
84
Tem
pera
ture
Jokie
l and
Cole
s 199
0; Ma
rshall
and C
lode 2
004
Turb
idity
Antho
ny an
d Fab
ricius
2000
Sed
imen
tatio
nRo
gers
1990
Wat
er q
ualit
y
Ara
goni
te s
atur
atio
n st
ate
Gattu
so et
al. 1
998;
Kley
pas e
t al. 1
999;
Lang
don e
t al. 2
000;
Lecle
rq et
al. 2
000;
Ohde
and H
ossa
in 20
04; S
chne
ider a
nd
Erez
2006
pHMa
rubin
i and
Atki
nson
1999
, Fine
and T
cher
nov 2
007
Alk
alin
ity a
nd a
ssoc
iate
d co
mpo
nent
sMa
rubin
i and
Tha
ke 19
99; M
arub
ini et
al. 2
008
Nut
rient
s (n
itrat
e, p
hosp
hate
)Ma
rubin
i and
Dav
ies 19
96; F
errie
r-Pag
ès et
al. 2
000;
Fabr
icius
et al
. 200
5
Trac
e el
emen
ts (C
o, Z
n, F
e)Fe
rrier
- Pag
ès et
al. 2
001;
Ferri
erPa
gès e
t al. 2
005
Oxy
gen
conc
entra
tion
Rink
evich
and L
oya 1
984
Bio
tic fa
ctor
sR
efer
ence
sN
utrit
ion/
Het
erot
roph
ic fe
edin
g Fe
rrier
-Pag
ès et
al. 2
003;
Houlb
requ
e et a
l. 200
3, 20
04; H
oulbr
eque
and F
errie
r-Pag
ès 20
09
Intra
spec
ific
com
petit
ion
Rink
evich
and L
oya 1
985
Inte
rspe
cific
com
petit
ion
Tann
er 19
95
Pre
datio
nMi
ller a
nd H
ay 19
98
Cor
al d
isea
seRi
char
dson
1998
; Les
ser e
t al. 2
007
General introduction
17
1Although the mechanisms of calcification are still not completely understood (Furla et
al. 2000; Moya et al. 2008a), based on the fundamental requirements for calcification
some more specific hypotheses can be postulated regarding the environmental controls
of coral growth. Provided that the primary conditions (e.g. light, temperature, salinity) for
coral well-being are fulfilled, parameters that will directly favor the process of calcification
should:
1. increase the supply and/or availability of inorganic carbon, such as high alkalinity or
aragonite saturation state of the seawater, a higher water flow (HCO3-) and/ or a higher
respiration rate (metabolic CO2),
2. increase the availability of calcium (Marshall and Clode 2002),
3. favor the precipitation of calcium carbonate, such as an increased pH and aragonite
saturation state near the site of calcification (i.e. the coelenteron). The currently most
probable mechanism proposed in literature involves the photosynthetic release of OH-
which neutralizes H+ produced in calcification (Allemand et al. 2004),
4. increase the supply of precursors for the organic matrix, both via algal photosynthetic
products (Muscatine and Cernichiari 1969; Pearse and Muscatine 1971; Young et al.
1971; Barnes and Crossland 1978; Richevich and Loya 1984) and via heterotrophic
feeding (Pearse and Muscatine1971; Allemand et al. 1998a),
5. increase the energy available for processes such as calcium transport (Tambutté et
al. 1996), organic matrix synthesis (Wainwright 1963; Chalker and Taylor 1975) and
calcification, such as energy from photosynthesis and heterotrophic feeding, and
6. influence the functioning of enzymes, such as temperature. Important enzymes are
those which are needed for the transport and/or conversion of HCO3- to CO2 and the
other way round (i.e. carbonic anhydrase).
Different environmental factors will influence the different requirements for the process of
calcification (1 through 6) in different ways, and they might also interact.

Chapter 1
18
14.1 Waterflow
The importance of water flow for coral well-being and coral growth is often underesti-
mated (Borneman 2008). Water flow has many positive effects on coral biology. First,
it reduces the diffusive boundary layer around the coral (Shashar et al. 1996), thereby
facilitating mass transfer (i.e. supply/uptake and removal/excretion) of ions (Ca2+, HCO3-,
NH4+), dissolved organic matter (e.g. DOC) and gasses (supply of CO2 and removal of
O2). Water flow is therefore critical in optimizing metabolic rates, such as respiration, pho-
tosynthesis and uptake of HCO3- for calcification. Second, it increases the encounter rate
of suspended particles for sedentary animals such as corals and is therefore involved in
the level of heterotrophic feeding. Third, it aids in the removal of sediment and mucus
from the coral surface, thereby preventing suffocation.
It is hypothesized that the absence of flow will be detrimental to both growth and sur-
vival of corals, since it will impede any exchange with the environment (see Figure 3a).
Observations from natural coral reefs indicate a correlation between reduced water flow
and coral bleaching (Lesser et al. 1997; Nakamura and Van Woesik 2001; Nakamura et
al. 2003). Higher flow speeds will fulfill different requirements for growth by influencing
different parameters of the nutrient budget, such as absorption of solutes, respiration (ca-
tabolism) and photosynthesis (through the uptake of gasses), translocation of photosyn-
thates as a result of increased photosynthetic rates and uptake of organic food particles
(through increased encounter rate of food particles) (Figure 3b,c). It is not known whether
water flow has an effect on mucus production. At low irradiance, the importance of mucus
production as a component of the nutrient budget is expected to be negligible.
By stimulation of both photosynthesis and respiration on the one hand and heterotrophic
feeding on the other hand, increasing water flow will stimulate skeletal growth both through
enhancement of calcification and enhancement of organic matrix synthesis. The extent of
the effect of water flow on coral growth will obviously depend on nutrient concentrations,
availability of food and light regime. The relationship between increasing water flow and
coral growth is expected to follow a hyperbolic function: First, increasing water flow will
General introduction
19
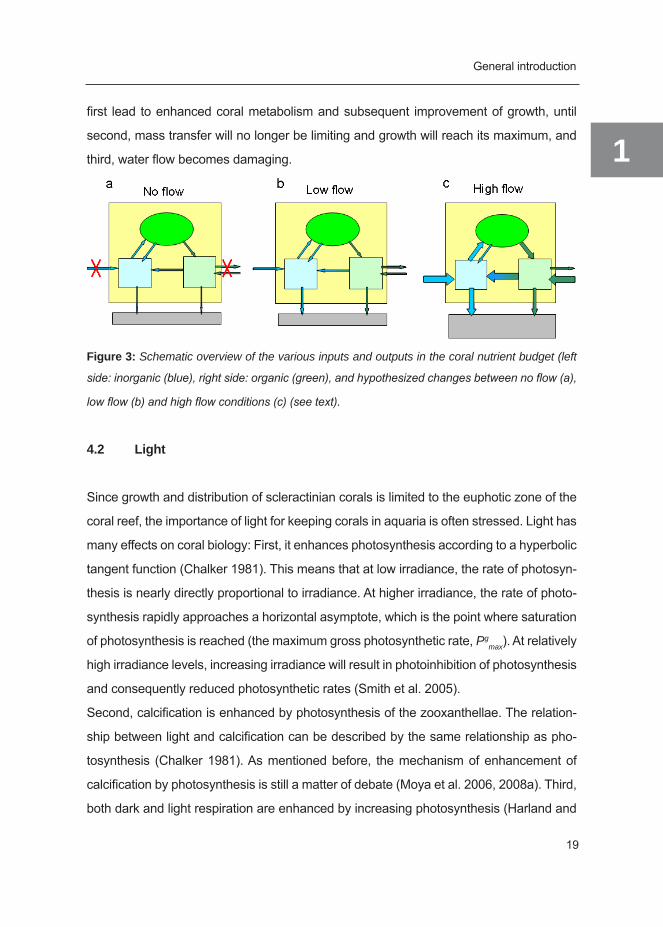
1first lead to enhanced coral metabolism and subsequent improvement of growth, until
second, mass transfer will no longer be limiting and growth will reach its maximum, and
third, water flow becomes damaging.
Figure 3: Schematic overview of the various inputs and outputs in the coral nutrient budget (left
side: inorganic (blue), right side: organic (green), and hypothesized changes between no flow (a),
low flow (b) and high flow conditions (c) (see text).
4.2 Light
Since growth and distribution of scleractinian corals is limited to the euphotic zone of the
coral reef, the importance of light for keeping corals in aquaria is often stressed. Light has
many effects on coral biology: First, it enhances photosynthesis according to a hyperbolic
tangent function (Chalker 1981). This means that at low irradiance, the rate of photosyn-
thesis is nearly directly proportional to irradiance. At higher irradiance, the rate of photo-
synthesis rapidly approaches a horizontal asymptote, which is the point where saturation
of photosynthesis is reached (the maximum gross photosynthetic rate, Pgmax). At relatively
high irradiance levels, increasing irradiance will result in photoinhibition of photosynthesis
and consequently reduced photosynthetic rates (Smith et al. 2005).
Second, calcification is enhanced by photosynthesis of the zooxanthellae. The relation-
ship between light and calcification can be described by the same relationship as pho-
tosynthesis (Chalker 1981). As mentioned before, the mechanism of enhancement of
calcification by photosynthesis is still a matter of debate (Moya et al. 2006, 2008a). Third,
both dark and light respiration are enhanced by increasing photosynthesis (Harland and

Chapter 1
20
1Davies 1996; Al-Horani et al. 2003). Dark respiration is postulated to be enhanced by
the presence of more translocated photosynthates, while light respiration is postulated
to be enhanced by the presence of photosynthetically produced oxygen. This leads to
a higher internal carbon cycle (Al-Horani et al. 2003b) and a higher availability of ATP
for energy-consuming processes such as calcium transport (Tambutté et al. 1996) and
organic matrix synthesis (Chalker and Taylor 1975; Palmer 1983). Additionally, higher
respiration rates result in the presence of a larger amount of metabolic CO2 that can be
used for calcification. Fourth, as a result of higher photosynthetic rate, the amount of
photosynthates that is translocated is also increased (about 90-95%; Davies 1984; Mus-
catine et al. 1984). These photosynthates might be used as a precursor of the organic
matrix (Muscatine and Cernichiari 1969; Pearse and Muscatine 1971; Young et al. 1971;
Barnes and Crossland 1978; Rinkevich and Loya 1984), thus simultaneously stimulating
calcification. Fifth, light plays a central role in mucus production (Crossland 1987; Brown
and Bythell 2005), which increases with irradiance. The effect of mucus production on
calcification is not known, although a possible role for mucus in calcification is suggested
(Brown and Bythell 2005).
Therefore, an increase in irradiance will positively influence different parameters of the
carbon budget: photosynthesis and respiration, calcification (i.e. precipitation of CaCO3),
translocation of photosynthates, organic matrix synthesis and mucus production (Figure
4a,b). Concurrently, different requirements for calcification are fulfilled: photosynthesis
will optimize both the inorganic and organic requirements for calcification (i.e. aragonite
saturation state at site of calcification and organic matrix precursors), respiration will in-
crease both the supply of inorganic carbon (metabolic CO2) and the supply of energy for
calcification and the transport of calcium. The extent of this effect will obviously depend
on nutrient concentrations, availability of food and flow regime.
Although the presence of light has a positive effect on calcification, it is not known wheth-
er light is truly beneficial to coral growth throughout the entire light range (up to 2000
μE m-2 s-1 in the field, Mass et al. 2007). Application of such high light intensities in the
aquarium is technically quite demanding, if not impossible, using standard available arti-
General introduction
21
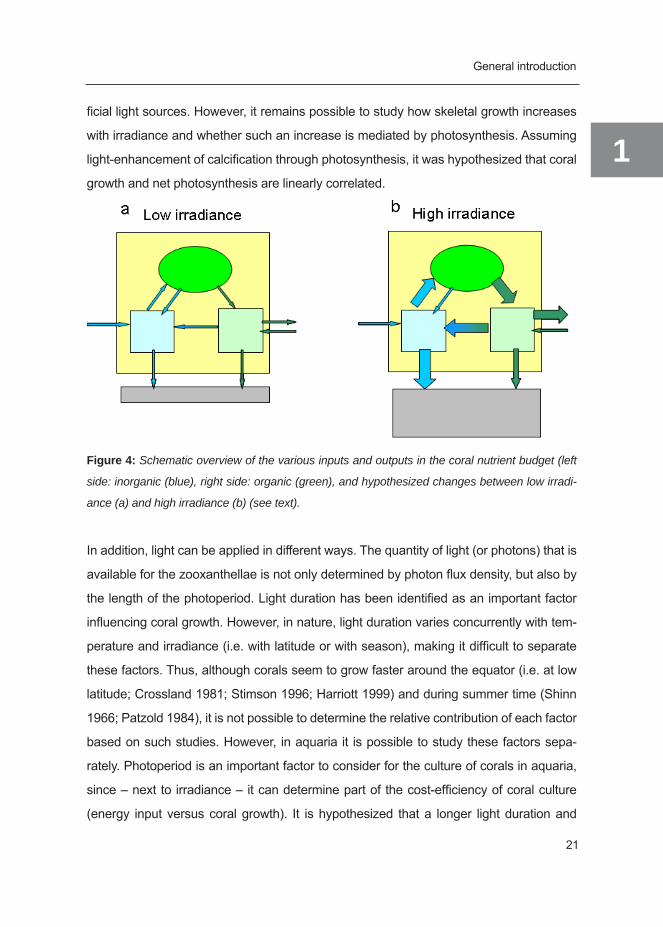
1ficial light sources. However, it remains possible to study how skeletal growth increases
with irradiance and whether such an increase is mediated by photosynthesis. Assuming
light-enhancement of calcification through photosynthesis, it was hypothesized that coral
growth and net photosynthesis are linearly correlated.
Figure 4: Schematic overview of the various inputs and outputs in the coral nutrient budget (left
side: inorganic (blue), right side: organic (green), and hypothesized changes between low irradi-
ance (a) and high irradiance (b) (see text).
In addition, light can be applied in different ways. The quantity of light (or photons) that is
available for the zooxanthellae is not only determined by photon flux density, but also by
the length of the photoperiod. Light duration has been identified as an important factor
influencing coral growth. However, in nature, light duration varies concurrently with tem-
perature and irradiance (i.e. with latitude or with season), making it difficult to separate
these factors. Thus, although corals seem to grow faster around the equator (i.e. at low
latitude; Crossland 1981; Stimson 1996; Harriott 1999) and during summer time (Shinn
1966; Patzold 1984), it is not possible to determine the relative contribution of each factor
based on such studies. However, in aquaria it is possible to study these factors sepa-
rately. Photoperiod is an important factor to consider for the culture of corals in aquaria,
since – next to irradiance – it can determine part of the cost-efficiency of coral culture
(energy input versus coral growth). It is hypothesized that a longer light duration and

Chapter 1
22
1consequently more hours of light-enhanced calcification will increase daily growth rates,
provided that the hourly calcification rate and photosynthetic rate remain unchanged.
4.3 Synergisticeffectsofirradianceandwaterflow
Irradiance and water flow are proposed to have synergistic effects. At higher irradiance,
increased photosynthesis will demand: 1) a higher supply of inorganic carbon, 2) a higher
removal rate of accumulating oxygen, and 3) a higher removal rate of mucus (to prevent
intoxication). All of this can be taken care of by sufficient water flow. The extent of the effect
of either parameter depends on the other. Moreover, both parameters affect coral growth in
a different ways. Increasing irradiance increases the supply of organic matrix precursors for
organic matrix synthesis through photosynthesis and optimizes inorganic carbonate chem-
istry for calcification, while increasing water flow increases the supply of organic matrix
precursors through increases supply of food particles and increases the availability of inor-
ganic carbon for calcification by increasing respiration. Thus, together, irradiance and water
flow can cover all the parameters of the nutrient budget and requirements for coral growth,
depending on external (in)organic nutrient concentrations and availability of food.
It is hypothesized that light and water flow have a strong interacting effect on coral growth,
since water flow is postulated to become more important at high irradiance levels. At low
flow, coral growth may be inhibited at high irradiance, due to the accumulation of oxygen
(i.e. oxidative stress) and the reduced interaction with the environment (e.g. absorption,
excretion) (Figure 5). Although also other factors seem to be important, it is expected that
photosynthesis might be an explanatory variable for the effect of light and water flow on
coral growth.

General introduction
23
1
Figure 5: Schematic overview of the various inputs and outputs in the coral carbon budget (left
side: inorganic (blue), right side: organic (green)), and hypothesized result under low flow x inter-
mediate ight (a), high flow x intermediate light (b), low flow x high light (c) and high flow x high light
(d) conditions (see text).
5 Aim and objectives of this thesis
The aim of this thesis is to create scientific knowledge on the eco-physiology of coral
growth, which can contribute to sustainable aquaculture of scleractinian corals in public
aquaria. Due to the growing interest in tropical coral reefs, there is an increasing demand
for marine ornamental species, such as scleractinian corals, for the aquarium trade. To
meet this demand, and concurrently reduce harvest from the wild, sustainable culture
Chapter 1
24
1of coral has to be warranted. However, much of the information on the aquaculture of
scleractinian corals is still anecdotal and not scientifically based. The influence of abiotic
factors and the mechanisms of coral growth are probably best studied by using existing
knowledge from the field and anecdotal knowledge from aquarium hobbyists, and to com-
bine this knowledge for the design of scientific experiments to systematically determine
the response to each (combination of) important factor(s). In this thesis, the influence of
light (irradiance and photoperiod) and water flow on coral growth was studied. The Indo-
Pacific coral species Galaxea fascicularis was chosen for this study, since this species is
easy to grow and since it is very easy to prepare coral nubbins (single polyp clones) of
this coral species due to the large size of its polyps.
The objectives of this thesis are:
1) to study the effect of water flow on the growth and physiology of G. fascicularis
(Chapter 2)
2) to study the effect of irradiance on growth of G. fascicularis and to relate this growth
to photosynthetic rate (Chapter 3)
3) to study the effect of photoperiod on growth and photoacclimation of G. fascicularis
(Chapter 4)
4) to study the interaction between light and water flow for growth and physiology of
G. fascicularis (Chapter 5)
5) to review factors controlling coral growth and assess the economic potential of
coral farming (Chapter 6)
A better understanding of how these abiotic factors influence coral growth will improve the
aquaculture of scleractinian corals and aid in the design of sustainable and cost- efficient
coral culture systems.
General introduction
25
16 Outline of the thesis
The focus of this thesis is to study how light and water flow affect the growth of the scler-
actinian coral G. fascicularis in closed aquarium systems. This thesis is composed of a
general introduction (Chapter 1), four experimental chapters (Chapter 2, 3, 4 and 5), one
review chapter on the biology and economics of coral growth (Chapter 6) and a final dis-
cussion with future perspectives (Chapter 7). The effect of light and water flow on growth
and physiology is first studied separately and then together using a factorial design.
In Chaptertwo, the influence of water flow on coral growth and physiology is studied.
This chapter also analyzes the growth kinetics of G. fascicularis. In Chapter three, the
influence of light on coral growth is studied and correlated to a photosynthesis-irradiance
curve. This enables us to say more about light-enhanced calcification throughout a range
of light intensities. In Chapter four, it was aimed to study the influence of photoperiod
on coral growth and physiology. However, since growth during this experiment was not
limited by irradiance, our data were used to study the mechanism of photoacclimation of
G. fascicularis under light-saturating conditions. In Chapterfive, the interaction between
light and water flow on coral growth and physiology was studied. Chapter six reviews the
biology and economics of coral growth, summarizing factors that either stimulate, limit or
inhibit coral growth and how this knowledge can contribute to economical coral farming.
Finally in Chapter seven, the overall results obtained during this thesis are discussed. A
synthesis is made of the underlying mechanisms of coral growth and which factors are
critical for optimizing coral growth in closed aquarium systems. Besides a critical reflec-
tion on the past four years of research, also directions for future research are given.

Chapter 2
The effect of different flow regimes on the growth and metabolic rates of the scleractinian coral Galaxea
fascicularis
Miriam Schutter1,2, John Crocker1, Anneke Paijmans1, Max Janse3, Ronald Osinga1,
Johan Verreth1 and René H. Wijffels2
1 Aquaculture and Fisheries Group, Wageningen University, P.O. Box 338 6700 AH Wageningen, The Netherlands
2 Bioprocess Engineering, Wageningen University, PO Box 8129 , 6700 EV Wageningen, The Netherlands
3 Burgers Zoo, Antoon van Hooffplein 1, 6816 SH Arnhem, The Netherlands

Chapter 2
2
28
Abstract
To study the effect of water flow on coral growth, four series of ten coral nubbins of Galaxea
fascicularis were exposed to four different flow regimes (0 cm s-1, 10 cm s-1, 20 cm s-1
and 25 cm s-1, bidirectional flow) for 42 weeks. Buoyant mass, surface area and polyp
number were measured at regular intervals. Net photosynthesis and dark respiration were
measured at the corresponding flow speeds and daily amount of photosynthetic carbon
left for coral growth was calculated. Finally, skeletal density and CN content, chlorophyll
concentration and dry mass of coral tissue were determined for each coral.
Specific growth rate (in day-1) decreased with time in each flow treatment. Absence of
flow resulted in significantly lower growth rates. Average specific growth rate was not
significantly different between 10 and 20 cm s-1, while it was significantly higher at 25 cm s-1.
However, differences in growth between treatments were not consistent between growth
intervals. From 10 to 25 cm s-1, average net photosynthetic rate decreased and average
dark respiration rate increased. Scope for growth based on phototrophic carbon decreased
with increasing flow.
Growth was not positively correlated with either photosynthesis, respiration or scope for
growth. It is suggested that higher flow rates reduce the chance of disturbance of coral growth
by competing algae, allowing corals to grow more often with the maximum specific growth
rate possible under the given environmental conditions. Also other effects of increased flow,
such as increased respiratory rates and increased (in)organic nutrient uptake, might have
been co-responsible for the increased growth of the corals in 25 cm s-1.
Keywords:coral growth, water flow, photosynthesis, respiration, Galaxea fascicularis

The effect of water flow
29
2
1. Introduction
Water flow is one of the most important abiotic factors influencing the growth of sedentary
marine invertebrates (Sebens 1987). Particularly interesting is the effect of flow on
the growth and metabolism of zooxanthellate scleractinian corals, due to the complex
physiology of these animals. Zooxanthellate scleractinian corals live in symbiosis with
unicellular algae, known as zooxanthellae, that translocate part of the carbon that is fixed
during photosynthesis to their animal host. This symbiotic relationship allows the coral to
benefit from both heterotrophic and phototrophic carbon sources.
The importance of water flow for different aspects of coral biology has received
considerable attention. Water flow affects physiological processes such as photosynthesis
and respiration by relieving diffusion limitation for dissolved gasses (Dennison and Barnes
1988; Patterson et al. 1991; Patterson 1992; Atkinson et al. 1994; Lesser et al. 1994;
Shashar et al. 1996; Bruno and Edmunds 1998). Flow also affects the encounter and
ingestion rate of food particles (Helmuth and Sebens 1993; Sebens 1997; Sebens et
al. 1997, 1998), the uptake of dissolved inorganic nutrients such as nitrate, phosphate
(Stambler 1991; Atkinson and Bilger 1992; Thomas and Atkinson 1997) and the uptake
of inorganic carbon (Lesser et al. 1994). Third, flow aids in removal of harmful waste
products such as oxygen radicals or its derivatives (Nakamura and Van Woesik 20015)
and in removal of sediments or nuisance algae that might otherwise suffocate the coral
(Rogers 1990; Anthony and Fabricius 2000; Box and Mumby 2007). On the other hand,
water flow can also have negative effects on coral biology, for example by stressing the
coral (Jokiel 1978) by damaging the delicate coral tissue, by breaking off branches of
skeleton, or by restricting particle capture due to deformation and flattening of the tentacles
(Sebens et al. 1997). Growth rates of corals will thus be determined by the sum of effects
that flow exerts on coral physiology. The different processes affected by flow (i.e., feeding
efficiency, gas exchange, waste removal) may each have their optimum at a different
flow rate. Furthermore, optimal flow rates may vary among species and even among
conspecific individuals. Indeed, some corals have been found to grow more rapidly when
flow increases (Jokiel 1978; Montebon and Yap 1997; Nakamura and Yamasaki 2005),
Chapter 2
2
30
while other corals were found to have comparable growth rates (Sebens et al. 2003) or
even decreased growth rates (Kuffner 2001). Khalesi et al. (2007) found a hyperbolic
profile of growth with increasing flow rate for a soft coral.
Most studies on the effects of flow on either growth or metabolic rates often examined
only “low” and “high” flow treatments and did not characterize their flow regimes with a
meaningful number for flow speed, or they examined only a limited range of flow speeds
(e.g., Sebens et al. 2003, 0-10 cm s-1). Besides that, different coral species – that might
respond differently to flow speed - were used in previous studies, thus making it difficult
to compare results. Therefore, it is hard to deduce optimal flow regimes for corals from
the available data.
The first aim of this work was to study the effect of water flow on the (skeletal) growth
of Galaxea fascicularis. For this, series of ten genetically identical coral nubbins of G.
fascicularis were cultured for a period of 42 weeks at a wide range of defined flow speeds
(0-25 cm s-1) in a controlled aquarium environment. Growth was measured at regular
intervals. It was expected to find a positive relationship between increasing water flow
rates and skeletal growth. Secondly, effect of flow on photosynthesis, respiration, and
the calculated daily amount of photosynthetic carbon left for coral growth were studied
and related to effects of flow on growth. It was expected to find a positive correlation
between phototrophic metabolism and growth. And third, at the end of the long-term and
short-term experiments, the effect of water flow on different coral biomass parameters
(CN content, chlorophyll concentration and ash-free dry mass of coral tissue and skeletal
density) was determined. Here, we expected to find that corals cultured at higher flow
regimes (i.e., higher hydrodynamic stress) would have a more dense skeleton, in order to
withstand physical damage (Schuhmacher and Plewka 1981; Scoffin et al. 1992; Bucher
et al. 1998).
The effect of water flow
31
2
2. Material and Methods
2.1 Long-termgrowthexperiment
2.1.1 Study species
Fourty (40) coral nubbins (single polyp clones) of G. fascicularis were created of coral
colonies that were grown at an irradiance of ca 60 µE m-2 s-1 (70W HQI) in a closed-
circuit coral aquaculture system in Burgers Ocean, Arnhem, The Netherlands. This 6800
l system consists of four 1300 l aquaria and two 800 l sumps, one with live rock and the
other without. The circulation system cycles 18 m3 h-1 and the system is connected to a
trickle tower, a 23.5 l self made Ca2+ reactor, and a Schuran Aquafloater AQ250 protein
skimmer. Each coral nubbin was fixed to a 7x7cm PVC plate using a two component
epoxy (Reef Construct, Aquamedic). To our knowlegde, no adverse effects of epoxy on
coral growth have been reported. After a three week acclimation period, each coral nubbin
was placed on one of four rectangular pegboards in two rows of five coral nubbins.
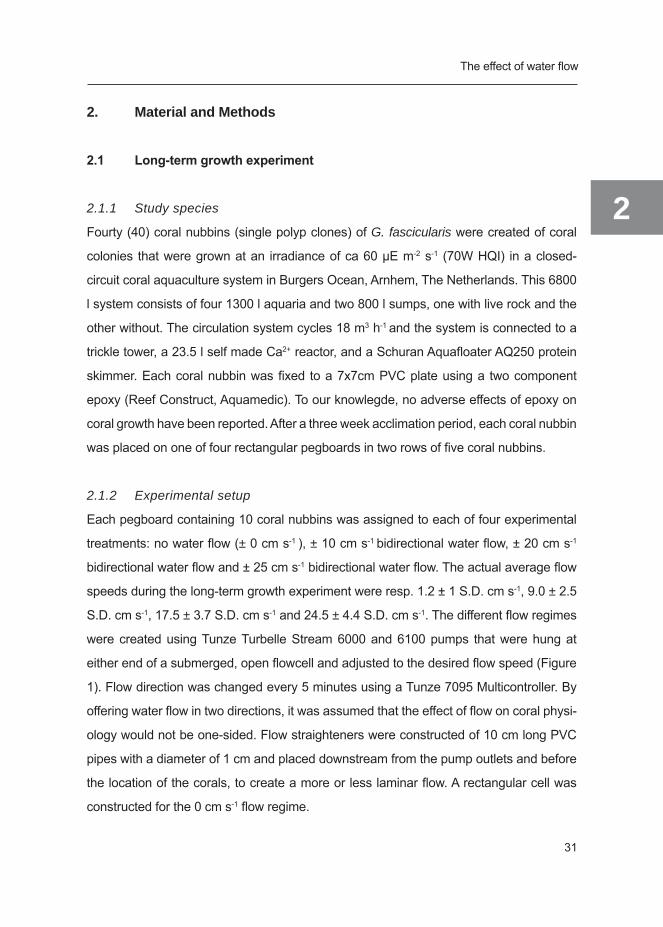
2.1.2 Experimental setup
Each pegboard containing 10 coral nubbins was assigned to each of four experimental
treatments: no water flow (± 0 cm s-1 ), ± 10 cm s-1 bidirectional water flow, ± 20 cm s-1
bidirectional water flow and ± 25 cm s-1 bidirectional water flow. The actual average flow
speeds during the long-term growth experiment were resp. 1.2 ± 1 S.D. cm s-1, 9.0 ± 2.5
S.D. cm s-1, 17.5 ± 3.7 S.D. cm s-1 and 24.5 ± 4.4 S.D. cm s-1. The different flow regimes
were created using Tunze Turbelle Stream 6000 and 6100 pumps that were hung at
either end of a submerged, open flowcell and adjusted to the desired flow speed (Figure
1). Flow direction was changed every 5 minutes using a Tunze 7095 Multicontroller. By
offering water flow in two directions, it was assumed that the effect of flow on coral physi-
ology would not be one-sided. Flow straighteners were constructed of 10 cm long PVC
pipes with a diameter of 1 cm and placed downstream from the pump outlets and before
the location of the corals, to create a more or less laminar flow. A rectangular cell was
constructed for the 0 cm s-1 flow regime.
Chapter 2
2
32
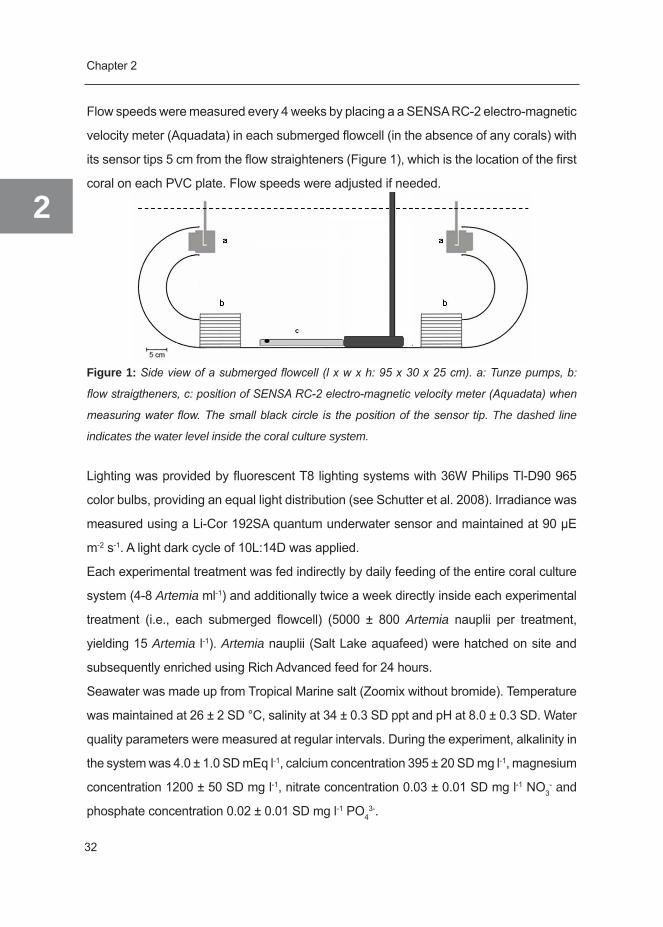
Flow speeds were measured every 4 weeks by placing a a SENSA RC-2 electro-magnetic
velocity meter (Aquadata) in each submerged flowcell (in the absence of any corals) with
its sensor tips 5 cm from the flow straighteners (Figure 1), which is the location of the first
coral on each PVC plate. Flow speeds were adjusted if needed.
Figure 1: Side view of a submerged flowcell (l x w x h: 95 x 30 x 25 cm). a: Tunze pumps, b:
flow straigtheners, c: position of SENSA RC-2 electro-magnetic velocity meter (Aquadata) when
measuring water flow. The small black circle is the position of the sensor tip. The dashed line
indicates the water level inside the coral culture system.
Lighting was provided by fluorescent T8 lighting systems with 36W Philips Tl-D90 965
color bulbs, providing an equal light distribution (see Schutter et al. 2008). Irradiance was
measured using a Li-Cor 192SA quantum underwater sensor and maintained at 90 µE
m-2 s-1. A light dark cycle of 10L:14D was applied.
Each experimental treatment was fed indirectly by daily feeding of the entire coral culture
system (4-8 Artemia ml-1) and additionally twice a week directly inside each experimental
treatment (i.e., each submerged flowcell) (5000 ± 800 Artemia nauplii per treatment,
yielding 15 Artemia l-1). Artemia nauplii (Salt Lake aquafeed) were hatched on site and
subsequently enriched using Rich Advanced feed for 24 hours.
Seawater was made up from Tropical Marine salt (Zoomix without bromide). Temperature
was maintained at 26 ± 2 SD °C, salinity at 34 ± 0.3 SD ppt and pH at 8.0 ± 0.3 SD. Water
quality parameters were measured at regular intervals. During the experiment, alkalinity in
the system was 4.0 ± 1.0 SD mEq l-1, calcium concentration 395 ± 20 SD mg l-1, magnesium
concentration 1200 ± 50 SD mg l-1, nitrate concentration 0.03 ± 0.01 SD mg l-1 NO3- and
phosphate concentration 0.02 ± 0.01 SD mg l-1 PO43-.

The effect of water flow
33
2
2.1.3 Growth parameters and analysis of growth kinetics
Growth was measured as an increase in buoyant mass, surface area and polyp number
of the coral nubbins. Determination of buoyant mass (using the so-called “ the buoyant
weighing technique”) is a good method to measure skeletal growth, since coral tissue
has a density which is similar to that of seawater and therefore does not contribute
significantly to the buoyant mass of the coral. Tissue only comprises 1% of the total
buoyant mass when tissue does not penetrate deep into the skeleton (Davies 1989).
Moreover, buoyant weighing is a simple and non-destructive technique, allowing long-
term monitoring of skeletal growth. It should be noted that buoyant mass is not a good
approximation of skeletal mass, since the net upward buoyancy force (i.e. the weight of
seawater displaced by the coral) will result in measuring only a fraction of the absolute
mass (i.e. a fractional mass). To convert buoyant mass into skeletal mass, one needs
to know the density of the seawater and the volume of the coral. Moreover, one needs
to assume a constant density of the coral skeleton during the experiment. However, for
the purpose of this study, knowledge of the magnitude of buoyant mass was sufficient to
calculate growth rates.
Buoyant mass was measured in the laboratory by suspending each coral (plus PVC
plate) on a hook in a defined volume of seawater at a constant depth. Seawater was
maintained at 26°C and 34 ppt salinity. The hook was attached to an underweighing
analytical balance (Kern&Sohn D-72458 Albstadt, type 870-13) using a thin nylon string
(Osinga et al. 1999). Buoyant mass of each coral was measured and the average of three
measurements was taken. The initial mass of the nubbins before their attachment to their
PVC-plate at t=0 was estimated by weighing 5 similar-sized nubbins of a G. fascicularis
colony on a weighing glass and taking the average. Using this parameter, it was possible
to estimate the mass of the PVC plate and the amount of Reef Construct that was used to
attach each coral to its plate. All our buoyant masss were corrected for this mass in order
to obtain the buoyant mass of the coral colony itself. This mass was used as parameter
for data analysis.
Surface area was measured as projected surface area. Pictures were taken perpendicular
to the coral directly inside the aquarium system using a Nikon Coolpix S1 5.1 mp digital
Chapter 2
2
34
camera in a Nikon WP-CP5 underwater housing. Surface area was determined by image
analysis using ImageJ (1.37v) by tracing the live part of the coral colony. Since tentacle
extension is variable over time, no tentacles that were extending beyond the skeleton
were traced for surface area. Polyp number was counted visually. Only live polyps were
counted. Newly formed polyps were only counted once they started projecting from the
basal skeletal plate.
Buoyant mass and polyp number were determined every six weeks, while surface area
was determined every three weeks for a 42 week period. For comparison with growth
rates from a previous study (Schutter et al. 2008), exponential growth was assumed and
specific growth rates (µ) were calculated using the formula:
μ = (ln BWn - ln BWn-1)/Δt [day-1]
where µ is the specific growth rate (day-1), BWn is buoyant mass at the end of a growth
interval, BWn-1 is buoyant mass at the start of a growth interval and ∆t is time between
measurements of buoyant mass in this growth interval. The same was done for surface
area and polyp number.
2.2 Short term physiological experiments
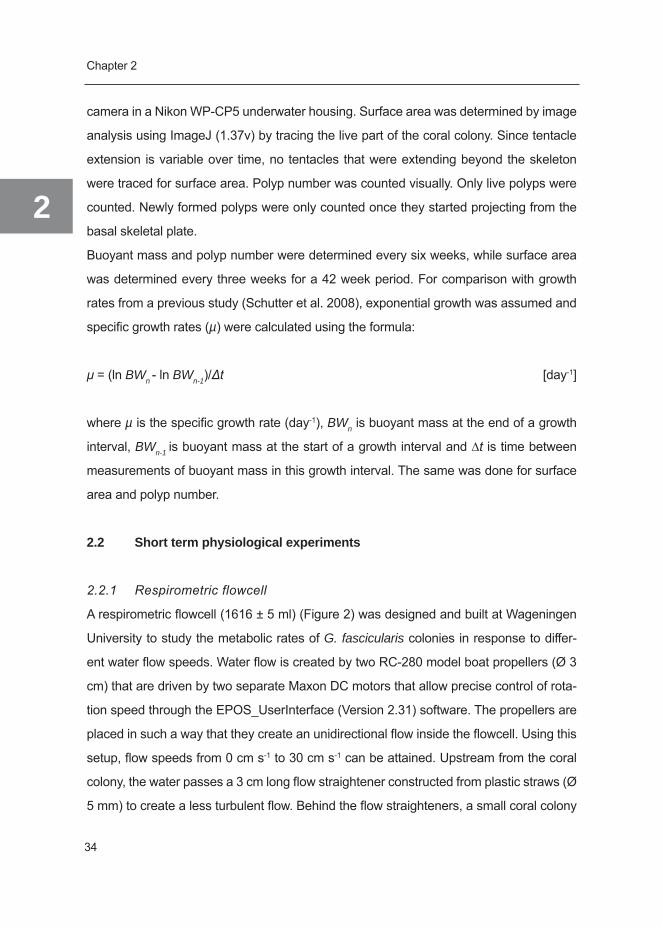
2.2.1 Respirometric flowcell
A respirometric flowcell (1616 ± 5 ml) (Figure 2) was designed and built at Wageningen
University to study the metabolic rates of G. fascicularis colonies in response to differ-
ent water flow speeds. Water flow is created by two RC-280 model boat propellers (Ø 3
cm) that are driven by two separate Maxon DC motors that allow precise control of rota-
tion speed through the EPOS_UserInterface (Version 2.31) software. The propellers are
placed in such a way that they create an unidirectional flow inside the flowcell. Using this
setup, flow speeds from 0 cm s-1 to 30 cm s-1 can be attained. Upstream from the coral
colony, the water passes a 3 cm long flow straightener constructed from plastic straws (Ø
5 mm) to create a less turbulent flow. Behind the flow straighteners, a small coral colony
The effect of water flow
35
2
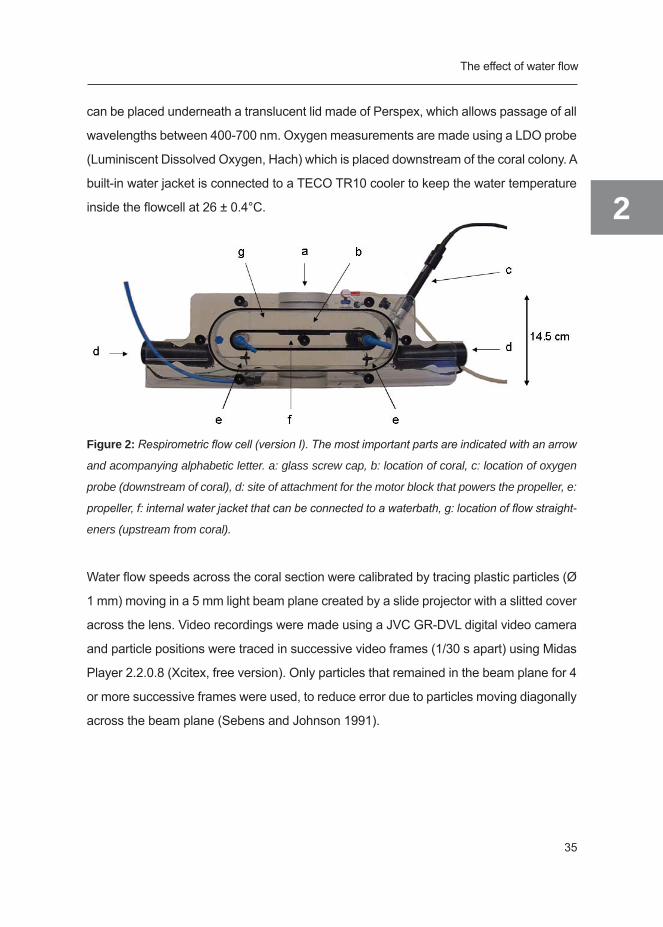
can be placed underneath a translucent lid made of Perspex, which allows passage of all
wavelengths between 400-700 nm. Oxygen measurements are made using a LDO probe
(Luminiscent Dissolved Oxygen, Hach) which is placed downstream of the coral colony. A
built-in water jacket is connected to a TECO TR10 cooler to keep the water temperature
inside the flowcell at 26 ± 0.4°C.
Figure 2: Respirometric flow cell (version I). The most important parts are indicated with an arrow
and acompanying alphabetic letter. a: glass screw cap, b: location of coral, c: location of oxygen
probe (downstream of coral), d: site of attachment for the motor block that powers the propeller, e:
propeller, f: internal water jacket that can be connected to a waterbath, g: location of flow straight-
eners (upstream from coral).
Water flow speeds across the coral section were calibrated by tracing plastic particles (Ø
1 mm) moving in a 5 mm light beam plane created by a slide projector with a slitted cover
across the lens. Video recordings were made using a JVC GR-DVL digital video camera
and particle positions were traced in successive video frames (1/30 s apart) using Midas
Player 2.2.0.8 (Xcitex, free version). Only particles that remained in the beam plane for 4
or more successive frames were used, to reduce error due to particles moving diagonally
across the beam plane (Sebens and Johnson 1991).
Chapter 2
2
36
2.2.2 Respirometric flow cell incubations
Three corals from each experimental flow treatment were randomly chosen at the end
of the long-term growth experiment and used to measure photosynthetic and respiratory
rates at their corresponding flow speeds. During the execution of these short-term experi-
ments the experimental flow treatments in the coral culture system were maintained as
before. It was not possible using our setup to get accurate oxygen reading for the corals
from the zero flow regime.
Each coral was measured on three different days, each day starting with a control incubation
in the light, three replicate 30 minute trials for photosynthesis, a control incubation in the
dark and three replicate 30 minute trails for respiration. Net photosynthetic production of
oxygen and respirometric consumption of oxygen was measured according to Schutter et
al. 2008. Temperature inside the respirometric flowcell was maintained at 26 ± 0.5 SD °C
and salinity at 34 ± 0.1 SD ppt.
Lighting was provided using a T5 lighting system (ATI) containing four 24W Aquablue
Spezial bulbs. Irradiance was adjusted to an irradiance of ca 90 µE m-2 s-1 using a Profilux
II aquatic computer-controller (GHL) and measured using a Li-Cor 192SA quantum
underwater sensor. This irradiance corresponded to the irradiance experienced in the
growth experiment.
Surface area, volume and buoyant mass of the experimental corals were determined
weekly during this experimental period (see section 2.1.3). Surface area was determined
in order to normalize the respirometric data. The volume of the coral was determined
using the water displacement technique in order to correct flowcell volume for the space
taken in by the coral. Buoyant mass was determined to monitor the growth during this
experimental period. Besides that, buoyant mass of all corals from the growth experiment
was determined before and after the respirometric flow cell incubations to test whether
the extra experimental handling had an effect on growth rates of these corals.
The effect of water flow
37
2
2.2.3 Scope for growth
Scope for growth, based on solely phototrophic feeding, was determined by calculating
the daily amount of carbon per cm2 of coral that is left after satisfying respiratory needs
(after Anthony and Fabricius 2000). This parameter indicates whether corals can satisfy
their daily respiratory needs using photosynthetic products translocated by their zooxan-
thellae only (i.e., are self-supporting with respect to carbon, scope for growth > 0) and
how much (phototrophic) carbon would be left for growth or other processes.
To be able to calculate scope for growth, net photosynthetic rates and dark respiratory
rates were converted to carbon equivalents, using the following equations:
Pc = Pnet x (12/32) [µmol C min-1 cm-2]
Rc = Rdark x (12/32) [µmol C min-1 cm-2]
where Pc is net photosynthetic rate in carbon equivalents (µmol C min-1 cm-2), Pnet is net
photosynthetic rate in oxygen equivalents (µmol O2 min-1 cm-2) and the factor (12/32) is
the molar conversion factor to convert oxygen equivalents (O2) to carbon equivalents
(C). Analogously, Rc is dark respiratory rate carbon equivalents (µmol C min-1 cm-2) and,
Rdark is the dark respiratory rate in oxygen equivalents. Since we do not know the exact
composition of substances that are produced during photosynthesis and that are respired
during respiration, no further corrections were applied using metabolic quotients (Gattuso
and Jaubert 1990).
Scope for growth was calculated using the following equation:
SfG = (Pc x 10) – (Rc x 14)
where SfG is scope for growth based on phototrophic feeding expressed in mg C h-1
cm-2, and Pc and Rc are photosynthetic and respiratory rates expressed in mg C h-1 cm-2.
Calculations were based on a light-dark period of 10L:14D.

Chapter 2
2
38
2.3 Coral biomass parameters
At the end of all respirometric flow cell incubations, buoyant mass, surface area and volume
were once more determined for all corals. An estimate of the skeletal (bulk) density of the
coral skeleton was calculated by dividing the buoyant mass (g) of the coral skeleton by the
total enclosed volume (ml) of the coral skeleton (Bucher et al. 1998). Then, all corals were
used for subsequent analysis of their tissue.
Corals were snap-fixed in 10% formaldehyde in 0.22 µm filtered seawater (FSW) (34
ppt) and then placed in 250-300 ml Ca2+-Mg2+-free artificial seawater (ASW) with ethylene
diamine tetracetic acid (EDTA). This solution was prepared according to Rinkevich et al.
2005. Coral tissue was splashed off after 30 minutes ultra-sonification by using sharp water
jets coming from small pipettes. Cell suspensions were collected, diluted with 0.22 µm FSW
and centrifuged twice for 10 minutes at 3°C at 4000 rpm, after which total volume was
determined.
Each tissue sample was homogenized using a LABOCAT X1030, after which subsamples
were taken for analyses of chlorophyll, ash-free dry mass, and CN content. Chlorophyll was
extracted by adding 9 ml 100% acetone to 900-1000 µl tissue homogenate and storing it
at -20°C overnight. Absorbance of the extract was measured in triplicate using a Beckman
Coulter DU 530 Spectrophotometer at 750, 664 and 630 nm. 90% acetone was used as a
blank. The concentrations of chlorophyll A and chlorophyll C2 were computed according to
the equations given by Jeffrey and Humphrey (1975) for dinoflagellates.
A duplicate of approx. 4-7 ml tissue homogenate of each coral was dried at 103°C until
constant mass and then burnt at 550°C until constant mass. Ash-free dry mass was calculated
by subtracting the mass of the ashes from dry mass. Due to the small amount of tissue of
the corals from the zero flow treatment, the tissue sample used for chlorophyll analysis was
recovered for analysis of ash-free dry mass by evaporating the acetone at 60°C inside a
fume hood and resuspending the pellet in a final volume of 1 ml 0.22 FSW (34 ppt).
CN analysis was done using an EA 1108 CHN-O from Fisons Instruments. Approximately 10
µl of wet tissue suspension (approx. 10-15 µg in dry mass) was used for each measurement,
measuring each coral in triplicate. Atropine was used as a standard.

The effect of water flow
39
2
2.4 Data analysis
Normality (p>0.05) and homogeneity of variance (p>0.05) of the data were tested using
Shapiro-Wilk and Levene’s test in SAS 9.1. Since our data did not satisfy the assump-
tions for ANOVA testing, we used Kruskall Wallis as a non-parametric test to detect sta-
tistical differences between treatments.

Chapter 2
2
40
3. Results
3.1 Growthparameters
3.1.1 Buoyant mass
All corals grew in buoyant mass during the experiment (p<0.001, Figure 3). The first signifi-
cant differences in buoyant mass between flow regimes became apparent after 12 weeks
(110 days after nubbing) (p=0.0005).
At the end of the growth experiment (week 42), the corals in the 0 cm s-1 flow treatment had
a significant lower buoyant mass compared to the corals in the 10, 20 and 25 cm s-1 flow
treatment (p=0.0002), while the corals in the 25 cm s-1 flow treatment had a significantly
higher buoyant mass compared to the corals in the 0, 10, and 20 cm s-1 flow treatment
(p<0.0005). No difference was detected between the corals I nthe 10 cm s-1 and 20 cm s-1
flow treatment (p=0.82). The corals in the 0 cm s-1 flow treatment appeared unhealthy, their
tissue was pale and showed regression from time to time.
Figure 3: The effect of flow regime on buoyant mass increase during the experimental period.
Values are mean ± SD, N=10.

The effect of water flow
41
2
3.1.2 Surface area
The increase in surface area during the experiment (Figure 4), gave a similar picture as
the increase in buoyant mass (Figure 3), except that differences in surface area between
treatments became apparent only at week 15 (135 days) (p<0.0001).
Growth in surface area was found to be not as continuous as in buoyant mass. When
growing, G. fascicularis appears to first create a layer of tissue around the coral (in
a circular fashion), in which ultimately some polyps will be formed. Thus, this type of
growth occurs in “bursts”. Skeletal growth, on the other hand, is an ongoing process
also occurring in the central part of the colony. Growth in surface area is also much more
hindered by algal competition than growth as buoyant mass (visual observation).
Figure 4: The effect of flow regime on surface area increase during the experimental period. Val-
ues are mean ± SD, N=10.
At the end of the growth experiment (week 42, 320 days), the relative differences in
growth as surface area between flow treatments were similar to the relative differences

Chapter 2
2
42
in growth as buoyant mass: 0 cm s-1 flow treatment had a significant lower surface area
compared to the corals in the 10, 20 and 25 cm s-1 flow treatment (p=0.0002), while the
corals in the 25 cm s-1 flow treatment had a significantly higher surface area compared
to the corals in the 0, 10, and 20 cm s-1 flow treatment (p≤0.0012). No difference was
detected between the corals in the 10 cm s-1 and 20 cm s-1 flow treatment (p=0.8206).
3.1.3 Polyp number
The increase in polyp number during the experiment (Figure 5) gives a slightly different
picture than the increase in buoyant mass (Figure 3) and surface area (Figure 4).
Figure 5: The effect of flow regime on polyp number increase during the experimental period.
Values are mean ± SD, N=10.
Just as with buoyant mass, the first significant differences in polyp number between flow
regimes became apparent at week 12 (110 days after nubbing) (p<0.0001). However, at
the end of the growth experiment (week 42), polyp numbers had significantly increased
The effect of water flow
43
2
with each flow regime. The 0 cm s-1 flow treatment had a significant lower polyp number
compared to the corals in the 10, 20 and 25 cm s-1 flow treatment (p<0.0003). The 10 cm
s-1 flow treatment had a significant lower polyp number compared to the corals in the 20
and 25 cm s-1 flow treatment (p <0.05) and the 20 cm s-1 flow treatment had a significantly
lower polyp number than the corals in the 25 cm s-1 flow treatment (p <0.005)
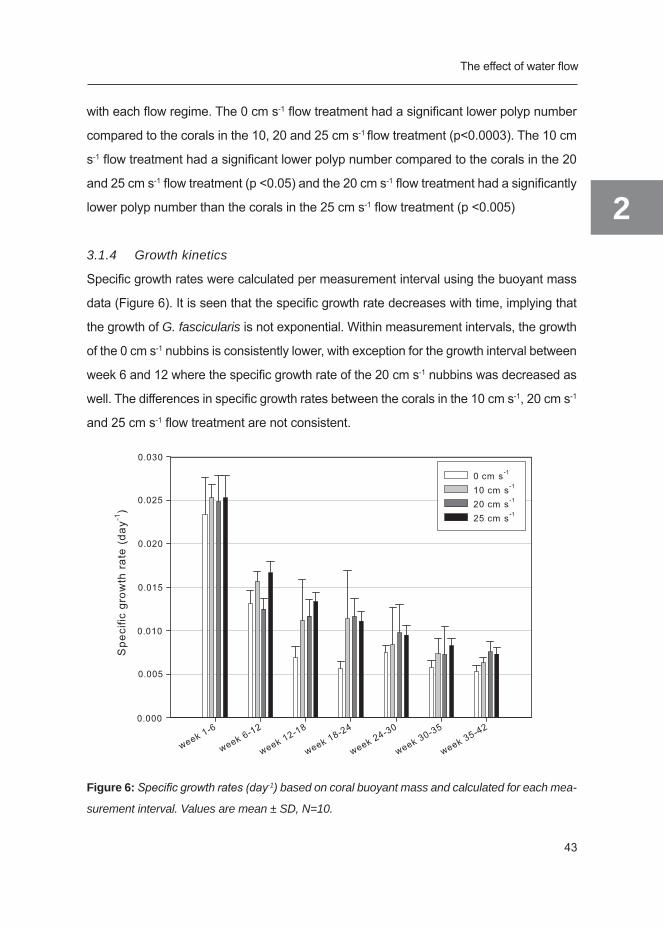
3.1.4 Growth kinetics
Specific growth rates were calculated per measurement interval using the buoyant mass
data (Figure 6). It is seen that the specific growth rate decreases with time, implying that
the growth of G. fascicularis is not exponential. Within measurement intervals, the growth
of the 0 cm s-1 nubbins is consistently lower, with exception for the growth interval between
week 6 and 12 where the specific growth rate of the 20 cm s-1 nubbins was decreased as
well. The differences in specific growth rates between the corals in the 10 cm s-1, 20 cm s-1
and 25 cm s-1 flow treatment are not consistent.
Figure 6: Specific growth rates (day-1) based on coral buoyant mass and calculated for each mea-
surement interval. Values are mean ± SD, N=10.
Chapter 2
2
44
On average over the entire experimental period (week 1- week 42), specific growth rate
was 0.0094 ± 0.0007 day-1 in the 0 cm s-1 flow treatment, 0.0119 ± 0.0004 day-1 in the 10
cm s-1 flow treatment, 0.0119 ± 0.0003 day-1 in the 20 cm s-1 flow treatment and 0.0128 ±
0.0006 day-1 in the 25 cm s-1 flow treatment.
3.2 Respirometric measurements
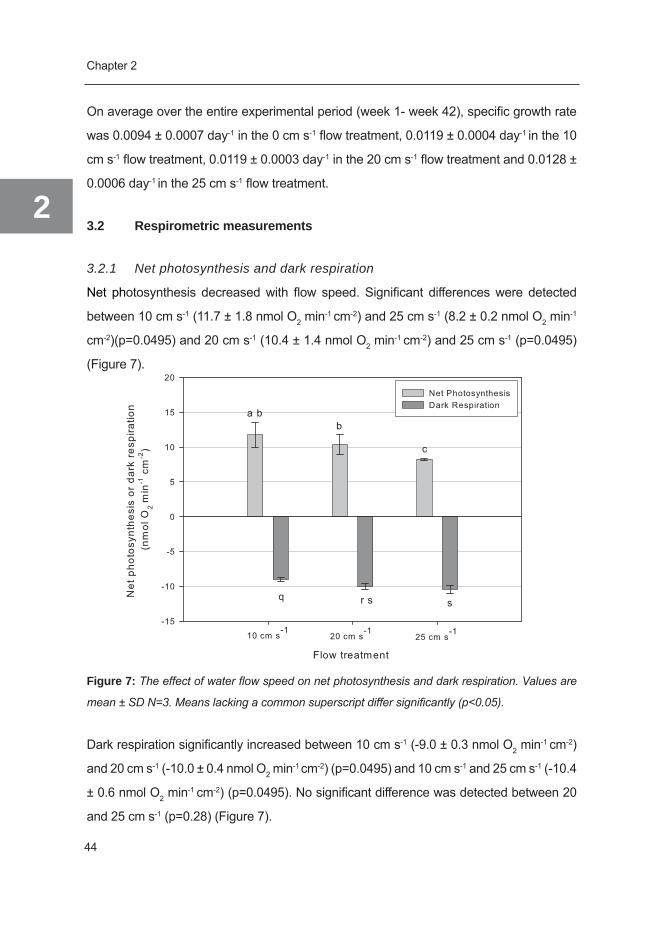
3.2.1 Net photosynthesis and dark respiration
Net photosynthesis decreased with flow speed. Significant differences were detected
between 10 cm s-1 (11.7 ± 1.8 nmol O2 min-1 cm-2) and 25 cm s-1 (8.2 ± 0.2 nmol O2 min-1
cm-2)(p=0.0495) and 20 cm s-1 (10.4 ± 1.4 nmol O2 min-1 cm-2) and 25 cm s-1 (p=0.0495)
(Figure 7).
Figure 7: The effect of water flow speed on net photosynthesis and dark respiration. Values are
mean ± SD N=3. Means lacking a common superscript differ significantly (p<0.05).
Dark respiration significantly increased between 10 cm s-1 (-9.0 ± 0.3 nmol O2 min-1 cm-2)
and 20 cm s-1 (-10.0 ± 0.4 nmol O2 min-1 cm-2) (p=0.0495) and 10 cm s-1 and 25 cm s-1 (-10.4
± 0.6 nmol O2 min-1 cm-2) (p=0.0495). No significant difference was detected between 20
and 25 cm s-1 (p=0.28) (Figure 7).
The effect of water flow
45
2
During these short-term incubation experiments, the skeletal growth rate (in day-1) of the
experimental corals (n=3) in each flow treatment was not significantly different (p>0.14)
from the corals that remained untouched in the flow experiment (n=7). Thus, during this
time period no significant effect of handling on skeletal growth rate was detected.
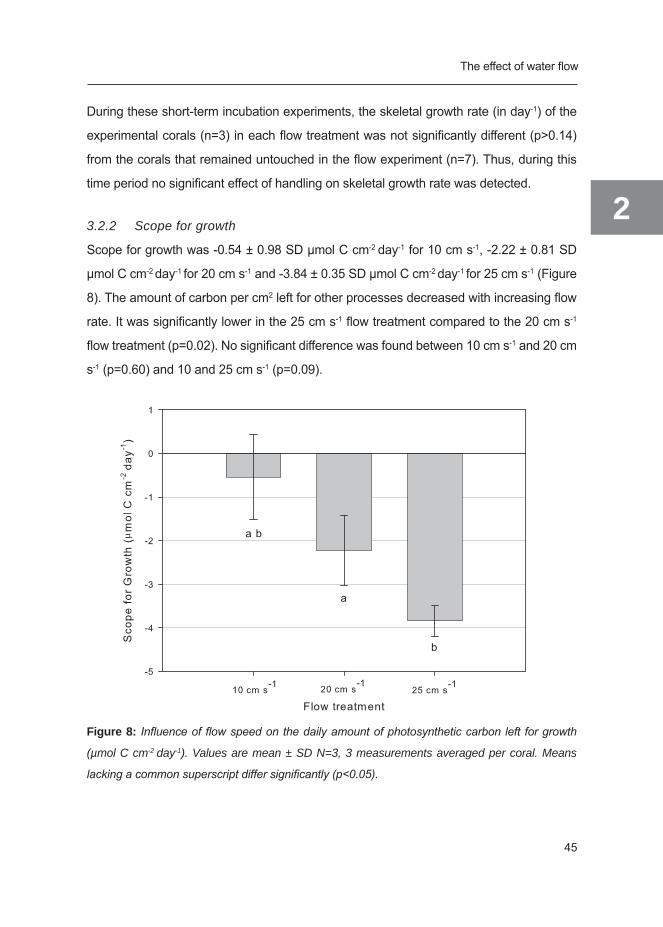
3.2.2 Scope for growth
Scope for growth was -0.54 ± 0.98 SD µmol C cm-2 day-1 for 10 cm s-1, -2.22 ± 0.81 SD
µmol C cm-2 day-1 for 20 cm s-1 and -3.84 ± 0.35 SD µmol C cm-2 day-1 for 25 cm s-1 (Figure
8). The amount of carbon per cm2 left for other processes decreased with increasing flow
rate. It was significantly lower in the 25 cm s-1 flow treatment compared to the 20 cm s-1
flow treatment (p=0.02). No significant difference was found between 10 cm s-1 and 20 cm
s-1 (p=0.60) and 10 and 25 cm s-1 (p=0.09).
Figure 8: Influence of flow speed on the daily amount of photosynthetic carbon left for growth
(µmol C cm-2 day-1). Values are mean ± SD N=3, 3 measurements averaged per coral. Means
lacking a common superscript differ significantly (p<0.05).

Chapter 2
2
46
3.3 Coral biomass parameters
Coral biomass parameters were determined after the ending of the short-term incubation
experiments. Since the health of corals in the 0 cm s-1 treatment became more and more
impaired after the 42 week growth experiment, the biomass parameters measured of the
corals in the 0 cm s-1 treatment do not necessarily reflect the status of these corals during
the growth experiment. The health of the corals in the other treatments was not impaired,
and therefore their biomass parameters are assumed to be representative of the status
of the corals during the entire experiment.
3.3.1 Skeletal density
A proxy of skeletal density was calculated by dividing buoyant mass of each coral (g) by
its volume (ml), after subtracting mass and volume of their PVC plates. This measure of
skeletal density was 0.18 ± 0.03 g ml-1 for the corals in the 0 cm s-1 treatment, 0.67 ± 0.06
g ml-1 for 10 cm s-1, 0.79 ± 0.11 g ml-1 for 20 cm s-1 and 0.75 ± 0.11 g ml-1 for 25 cm s-1. The
corals in the zero flow treatment had a significantly lower skeletal density than the others
(p<0.005), while the skeletal density of the corals in the other flow treatments were not
significantly different from each other (p>0.08)
3.3.2 Coral tissue parameters
Ash free dry mass of coral tissue per surface area was significantly lowest in the 0 cm s-1
treatment (3.6 ± 1.5 µg cm-2, p<0.008), while it was significantly highest for the corals in
the 10 cm s-1 treatment (8.4 ± 1.9 µg cm-2, p<0.03). No significant difference was found
between the corals in 20 cm s-1 (5.5 ± 1.1 µg cm-2) and 25 cm s-1 (5.4 ± 1.3 µg cm-2)
(p=0.74) (Figure 9).
The percentage of carbon in coral tissue (41.4 ± 7.6 %, calculated as mg C per mg ash free
dry mass of tissue x 100%) is not significantly different between treatments (p>0.12). The
percentage nitrogen in coral tissue, however, showed small, but significant differences
between 0 cm s-1 (7.41 ± 0.68) and 20 cm s-1 (5.99 ± 0.68) (p=0.015) and between 0 cm
s-1 and 25 cm s-1 (6.03 ± 0.35) (p=0.007), with a higher percentage nitrogen in the tissue

The effect of water flow
47
2
of the 0 cm s-1 corals. The C:N ratio is increasing slightly with flow speed: 5.65 ± 1.23 for
0 cm s-1, 6.07 ± 0.90 for 10 cm s-1, 6.56 ±1.17 for 20 cm s-1 and 7.18 ± 1.21 for 25 cm s-1.
The C:N ratio of coral tissue of corals maintained at 25 cm s-1 was significantly higher than
that of corals maintained at 0 cm s-1 (p=0.022).
Figure 9: The effect of flow regime on the ash free dry mass of coral tissue per surface are of coral
(mg cm-2). Values are mean ± SD N=10 for 0, 20 and 25 cm s-1, N=5 for 10 cm s-1. Means lacking
a common superscript differ significantly (p<0.05).
The amount of chlorophyll A (Chl A) and chlorophyll C2 (Chl C2) per coral surface area
was significantly lower for the corals in the 0 cm s-1 flow treatment (1.0 ± 0.3 µg Chl A cm-2
and 0.6 ± 0.2 µg Chl C2 cm-2 compared to the corals in the 10 cm s-1 flow treatment (3.8 ±
1.5 µg Chl A cm-2 and 2.7 ± 1.1 µg Chl C2 cm-2) and 25 cm s-1 flow treatment (4.1 ± 0.6 µg
Chl A cm-2 and 2.0 ± 0.5 µg Chl C2 cm-2)(p<0.005). No significant difference was detected
between 10 cm s-1 and 25 cm s-1 (p=0.48). The samples of the corals in the 20 cm s-1 were
lost. Since the values for OD664 of the corals from the 0 cm s-1 flow treatment were often
below the detection limit, the absolute values should be interpreted with caution.
Chapter 2
2
48
4. Discussion
4.1 Waterflowandgrowth
Skeletal growth of G. fascicularis increased with time in all flow treatments. Since differ-
ences in growth between treatments only started to become apparent at week 12, growth
experiments using G. fascicularis nubbins should last at least for 12 weeks.
This study demonstrates the importance of water flow to the growth of the scleractinian
coral G. fascicularis. Absence of flow resulted in significant lower specific growth rates.
An increase in growth was found between 0 and 10 cm s-1, which is in agreement with
the findings of Jokiel (1978) in the range of 2-15 cm s-1 for Pocillopora meandrina and
Pocillopora damicornis. However, no significant difference in growth was found between
the 10 cm s-1 and 20 cm s-1 flow treatments, while the corals in the 25 cm s-1 flow treatment
had a significant higher skeletal growth than the corals in the other flow treatments. The
same trend was found for surface area, while polyp number was significantly increased
with increasing flow. Surface area and polyp number are, however, more an expression
of morphology than of clear-cut skeletal growth.
Specific growth rate of G. fascicularis decreased with time, as observed before by Schut-
ter et al. (2008), and fell within the range of specific growth rates to be expected for G.
fascicularis at an irradiance of 90 µ E m-2 s-1 (± 0.012 day-1, Schutter et al. 2008). Although
the differences in specific growth rates between flow treatments were not consistent be-
tween measurement intervals (Figure 6), the specific growth rate calculated over the
entire experimental period showed the same trend as for the growth parameters.
4.2 Waterflowandphototrophicmetabolism
In the following paragraphs, the relation of net photosynthesis, dark respiration and scope
for growth with specific growth rate is discussed in an attempt to explain the relationship
between water flow and growth and possible relieve of mass transfer limitations. It can
be questioned whether it is legitimate to use metabolic rates of corals measured at the
The effect of water flow
49
2
end of the experiment to explain differences in the growth of these corals during the ex-
periment. First, it can be argued that each physiological measurement is just a random
indication of the metabolic rate at the time of measurement. However, by measuring the
metabolic rate of each coral at various times at different days this potential artifact is
reduced. Second, it can be argued that measurements cannot be extrapolated due to
differences in size. However, a strong linear correlation is found between metabolic rate
(mg O2 per min) and surface area (cm2) (Adj R2 =0.65, p<0.01 for photosynthesis, Adj R2
=0.91, p<0.01 for respiration) over a size range of 5-50 cm2, indicating that the measured
metabolic rates are representative for a large range of coral sizes.
4.2.1 Photosynthesis
Reduction of the diffusive boundary layer thickness with increasing water flow did not
result in increased net photosynthetic rates. In contrast, the net photosynthetic rate was
not significantly different between 10 cm s-1 and 20 cm s-1, and the net photosynthetic
rate at 25 cm s-1 was even significantly lower compared to 10 cm s-1 and 20 cm s-1. In this
study, net photosynthetic rates are thus not positively correlated with growth, in contrast
to Schutter et al. (2008). Obviously, photosynthates are not effectively channeled into
skeletal growth and possibly allocated to different processes than skeletal growth.
Different effects of water flow on photosynthesis have been reported. Sebens et al. (2003)
found no differences in the rate of net photosynthesis between 2, 5, 8 and 10 cm s-1 for
Agaricia tenuifolia, while Lesser et al. (1994) found a positive effect of increasing flow
on net photosynthesis of Pocillopora damicornis (mean flow: 0.2, 3.8 and 7.2 cm s-1).
The decline we found in net photosynthesis at flow rates higher than 10 cm s-1 cannot
be verified with other data from literature, since, to the best of our knowledge, no data
in literature are available for comparison. At low irradiances, such as used in this study,
water flow may have a smaller effect on photosynthesis, since the need for inorganic
carbon supply and/or removal of oxygen to optimize photosynthesis at low irradiance
levels is not as demanding as at high irradiance levels (Nakamura et al. 2005; Finelli et
al. 2006; Smith and Birkeland 2007).
Water flow did not have an effect on chlorophyll A and chlorophyll C2 content per surface

Chapter 2
2
50
area, which is in agreement with the findings of Stambler et al. (1991) and Lesser et al.
(1994) for Pocillopora damicornis and of Rex et al. (1995) for Porites cylindrica. Appar-
ently, irradiance has a dominant effect on photosynthesis and chlorophyll content, while
water flow rates can only modulate uptake and release rates of substances needed for
photosynthesis.
4.2.2 Respiration
Reduction of the diffusive boundary layer thickness with increasing water flow resulted in
increased dark respiratory rates between 10 cm s-1 and 20 cm s-1, and between 10 cm s-1
and 25 cm s-1. Sebens et al. (2003) reported an increase in dark respiration with increas-
ing flow speed for Agaricia tenuifolia between 2 and 10 cm s-1. However, our data cannot
be verified with data that have been collected at flow speeds above 10 cm s-1, since, to
the best of our knowledge, such data have not been reported.
Respiration increases the availability of metabolic CO2 that can be used as a source of
carbon for calcification (70% of DIC for calcification comes from metabolic CO2: Furla et
al. 2000) and generates energy that can be used for calcification. Therefore, respiration
could potentially be limiting for growth. The decreased growth of the corals in the 0 cm s-1
flow treatments compared to the other flow treatments could possibly be the result of a
limited supply of oxygen and consequently a reduced dark respiratory rate and reduced
availability of metabolic CO2. Nevertheless, the difference in growth between 20 cm s-1
and 25 cm s-1 cannot be explained with dark respiratory rates, since this difference was
not significantly different. Respiratory rates during the day (light respiration) will probably
be independent of flow-related mass transfer, since oxygen used for respiration is not
limiting due to photosynthetic production of oxygen in the light.
4.2.3 Scope for Growth
Scope for growth based on phototrophic feeding (i.e., daily amount of photosynthetic
carbon that is left for other processes after satisfying respiratory needs) was negatively
correlated with growth rate, indicating that phototrophic carbon was not instrumental in
supporting higher skeletal growth rates.

The effect of water flow
51
2
Since the average net photosynthetic rate in this study was 50% lower than what we
would expect based on previous photosynthesis-irradiance curves of G. fascicularis
measured under similar conditions (Schutter et al. 2008), and average respiratory rate was
threefold higher, absolute values should be interpreted with caution. Differences between
respirometric values could possibly be due to the short-term nature of the measurement
of a photosynthesis-irradiance curve and the influence of the growth irradiance on the
result. A photosynthesis-irradiance curve provides information about the potential to
adapt to another irradiance within a short time, while in the long run the photosynthetic
rate at a certain irradiance might be different due to long term adaptations of the coral’s
physiology. Nevertheless, these data do provide a qualitative indication of the effect of
flow on photosynthesis, respiration and scope for growth.
While the corals in the 10 cm s-1 flow treatment had the highest scope for growth, this did
not seem instrumental in supporting higher skeletal growth rates. It might be possible that
this carbon was not allocated to skeletal growth but to tissue growth, since ash free dry
mass of the coral tissue was significantly higher. Since the average C:N ratio of tissue
of the 10 cm s-1 corals was not significantly different from the other flow treatments, no
difference in the composition of the tissue is expected. This excludes the possibility that
the 10 cm s-1 corals had stored more (carbon rich) storage compounds (Glynn et al. 1985;
Harland 1992; Anthony et al. 2002), which would occur if the amount of translocated
carbon-rich photosynthetic products exceeds that what is necessary to keep pace with
skeletal growth (Anthony et al. 2002). The tissue mass thus seems normal. The average
C:N ratio of coral tissue (6.37 ± 1.26) found in this study (with exception of 0 cm s-1 corals)
is in line with values reported in literature for Montastrea annularis (7.5, Szmant and
Gassman 1990) and Pocillopora damicornis (8-10, Lesser et al. 1994) and suggests total
nutrient sufficiency.
4.3 Waterflowandenergyallocation
As evident from the previous, the increased growth at 25 cm s-1 compared to the growth
at 10 and 20 cm s-1 differences in growth between flow treatments cannot be explained
Chapter 2
2
52
by the availability of photosynthetic carbon. Alternative potential explanations are that: 1)
corals at high flow have better access to other sources of carbon (e.g., Artemia, DOC)
resulting in an increase in scope for growth (based on both sources of carbon) with water
flow speed (Atkinson and Bilger 1992), and/or 2) corals at high flow have increased sup-
ply of different requirements for calcification (e.g., HCO3-), and/or 3) different allocation
processes played a role energy was allocated among different biological functions. e.g.,
energy trade-off between skeletal growth, tissue growth and competition.
Tissue mass of the corals in the 20 cm s-1 and 25 cm s-1 flow treatment was significantly
lower compared to 10 cm s-1. The decreased availability of photosynthetic carbon with
flow does not seem to explain the decreased tissue mass, since a similar amount of
carbon was allocated to both the 20 cm s-1 and 25 cm s-1 corals. Moreover, despite a
lower availability of photosynthetic carbon, a significant amount of carbon was allocated
to skeletal growth in the case of the 25 cm s-1 corals. The corals in the 25 cm s-1 treatment
must therefore either have had more access to other sources of carbon, or the available
carbon was allocated to different processes. Since the corals in the 25 cm s-1 flow
treatment suffered the least competition with algae, it is possible that they were able to
allocate more energy to skeletal growth than to defense or repair mechanisms against
competing algae. The inconsistent differences in specific growth rates between growth
intervals among the corals in the 10 cm s-1, 20 cm s-1 and 25 cm s-1 treatment confirm
this differential energy allocation as well. Although the corals in the lower flow treatments
(10 cm s-1 and 20 cm s-1) were be able to express a similar growth potential as the corals
in the 25 cm s-1 flow treatment on some occasions, they did not express it as regularly.
Apparently, corals growing at higher water flow rates are less often disturbed in growth
by competing algae and will grow more often with higher specific growth rate. Therefore,
a combination of the individual growth potential under the given environmental conditions
and the individual presence of disturbances will determine the resulting specific growth
rate. Although differential energy allocation might be a possible explanation for our
contradictory findings (increased growth but decreasing phototrophic metabolism), more
research is needed to confirm this.
It is expected that phototrophic feeding and the modulation of photosynthesis by water flow
The effect of water flow
53
2
becomes more important at high irradiance. Further research describing the interaction
between water flow and irradiance level is in progress.
4.4 Waterflowandskeletaldensity
Skeletal density was significantly lower in the absence of flow. This can be considered
as abnormal, since the corals in the 0 cm s-1 flow treatment were unhealthy at the time of
sampling. They had very little pigmentation and a lower tissue biomass, which occurs in
bleached corals (Szmant and Gassman 1989).
G. fascicularis developed a denser skeleton at higher flow regimes. However, the absence
of differences in skeletal density with increasing flow rate (10, 20, 25 cm s-1) suggests
that they do not further strengthen their skeleton to withstand physical damage from
hydrodynamic energy (Schuhmacher and Plewka 1981; Bucher et al. 1998). Possibly,
it is not necessary for a massive mound-shaped coral like G. fascicularis to increase
skeletal strength, since its growth form does not obstruct the water flow as much as a
branching coral would.
Acknowledgements
This research is part of the European CORALZOO project that aims at improving coral
husbandry techniques for sustainable coral breeding in zoo’s and public aquaria. We
thank the staff of Burgers Ocean for their help in setting up the experiment. This work was
funded by the European Commission (Project CORALZOO-012547).

Chapter 3
The effect of irradiance
on long-term skeletal growth and net
photosynthesis in Galaxea fascicularis
under four light conditions
Miriam Schutter1,2, Bas Van Velthoven1, Max Janse3, Ronald Osinga1,*, Marcel Janssen2, René H. Wijffels2 and Johan Verreth1
1 Aquaculture and Fisheries Group, Wageningen University, P.O. Box 338 6700 AH Wageningen, The Netherlands
2 Bioprocess Engineering, Wageningen University, PO Box 8129 , 6700 EV Wageningen, The Netherlands
3 Burgers Zoo, Antoon van Hooffplein 1, 6816 SH Arnhem, The Netherlands
This chapter is an extended version of Schutter et al. (2008).
Chapter 3
3
56
Abstract
The relation between irradiance, skeletal growth and net photosynthesis was studied for
the scleractinian coral Galaxea fascicularis to provide experimental evidence for media-
tion of light-enhanced calcification through photosynthesis. The hypothesis was tested
that skeletal growth and photosynthesis are linearly correlated.
A long-term experiment was performed in a closed-circuit aquarium system, in which
four series of nine nubbins (single polyp clones of a coral colony) of G. fascicularis were
exposed to four light treatments (10L:14D): 144 W T8 fluorescent lighting providing an
irradiance of 68 µE m-2 s-1 and 70, 250 and 400 W Metal Halide lighting providing an ir-
radiance of 38 µE m-2 s-1, 166 µE m-2 s-1 and 410 µE m-2 s-1, respectively. Growth of these
nubbins was measured as buoyant mass at different time intervals in a 294 day experi-
ment. A light-saturation curve for photosynthesis was measured in a respirometric flow
cell using a 54 week G. fascicularis colony grown at 60 µE m-2 s-1.
No saturation of net photosynthesis of G. fascicularis was found at the irradiances test-
ed. The specific growth rate (µ, in day-1) of the coral nubbins increased with irradiance.
Whereas irradiance varied 11-fold (38 to 410 µE m-2 s-1), buoyant mass (increase after
294 days) increased 5.7 times (2243 to 12374 mg), specific growth rate (1-294 days)
increased 1.6 times (0.0103 to 0.0161 day-1), while net photosynthetic rate increased 8.9
times (0.009 µmol O2 min-1 cm-2 to 0.077 µmol O2 min-1 cm-2). The increase of specific
growth rate with irradiance was less than expected based on the increase in net photo-
synthetic rate with irradiance. This discrepancy between potential energy produced in
photosynthesis and energy used for skeletal growth indicates that skeletal growth is not
limited by photosynthetic potential at high irradiance levels.
Keywords:Scleractinian coral, Galaxea fascicularis, irradiance, skeletal growth, buoy-
ant mass, photosynthesis
The effect of irradiance
57
3
1 Introduction
Light is one of the most important abiotic factors influencing the growth of scleractinian
corals. Scleractinian corals live in symbiosis with unicellular algae, known as zooxan-
thellae, that reside in their endodermal tissue layers. In the light, zooxanthellae perform
photosynthesis, during which process they produce oxygen and organic compounds.
When their own respiratory needs are satisfied, zooxanthellae translocate the excess
photosynthetic products to the coral host (Muscatine and Cernichiari 1969; Muscatine et
al.1981). Zooxanthellae can thus provide a considerable part of the energy needed for
coral growth.
Growth of scleractinian corals can be divided in two components: first, skeletal growth
due to the deposition of an external skeleton of calcium carbonate aided by the synthesis
of an organic matrix in a process called calcification, and second, tissue growth. Accord-
ing to the light-enhanced calcification theory (see Gattuso et al. 1999 and Allemand et
al. 1998b for review), the symbiosis with zooxanthellae is aiding to the process of skel-
etal growth. According to this theory, calcification of the coral host is enhanced by pho-
tosynthesis of zooxanthellae (Goreau and Goreau 1959; Pearse and Muscatine 1971;
Allemand et al. 2004). Indeed, on average, calcification in light is found to be around
three times higher than calcification in darkness (review by Gattuso 1999). Although pho-
tosynthesis and calcification are spatially separated processes (photosynthesis occurs
in the oral tissue layer and calcification in the aboral tissue layer), they do share a com-
mon pool of inorganic carbon inside the coelenteron of the coral host, accounting for the
interaction between these two processes. The exact mechanisms of the enhancement
of calcification by photosynthesis are still a matter of debate (Gatusso et al. 1999; Furla
et al. 2000). Some of the proposed mechanisms include that: 1) photosynthesis provides
energy for the energy-demanding processes associated with calcification, such as cal-
cium transport and organic matrix synthesis (Wainwright 1963; Chalker and Taylor 1975),
and 2) photosynthesis raises intracellular pH and intracellular saturation state of calcium
carbonate, thereby favoring the precipitation of calcium carbonate (Goreau and Goreau
1959; Allemand et al. 1998).

Chapter 3
3
58
The relation between light and photosynthesis can be quantitatively described using light-
dependent models (Chalker 1981), resulting in photosynthesis-irradiance curves. At low
irradiance, the rate of photosynthesis is nearly directly proportional to irradiance. At higher
irradiance, the rate of photosynthesis rapidly approaches a horizontal asymptote, which
is the point where saturation of photosynthesis is reached (the maximum gross photosyn-
thetic rate, Pgmax). Calcification can be described using the same light-dependent models
(Chalker 1981).
Since scientists started to study coral calcification some 50 years ago, several authors
have found a positive correlation between light and calcification, either in the field (Boss-
cher and Meesters 1993) or through experimental work (e.g. Goreau 1959; Marubini
2001; Reynaud-Vaganay et al. 2001; Reynaud et al. 2004; Schlacher et al. 2007).
However, none of these authors coupled their growth data to a photosynthesis-irradiance
curve. Although it has been demonstrated by eg. Al-Horani et al. (2005) that higher rates
of skeletal growth in G. fascicularis are supported by higher rates of photosynthesis and
respiration in the adjacent polyp parts (Al Horani et al. 2005), it cannot be derived from ei-
ther of these studies to what extent an increase in photosynthesis leads to a proportional
increase in skeletal growth.
To the best of our knowledge, a study describing the relation between light, photosynthe-
sis and skeletal growth – i.e. the result of calcification - of individual corals followed in time
under controlled conditions is still lacking. We examined this relation by measuring the
growth of the scleractinian coral G. fascicularis under four different irradiance levels in a
closed-circuit aquarium system and comparing the results to a photosynthesis-irradiance
curve of this species. In this study, the hypothesis was tested that skeletal growth and
photosynthesis are linearly correlated.
The effect of irradiance
59
3
2 Materials and Methods
Thirty-six (36) coral nubbins (single polyp clones) of G. fascicularis were created of colo-
nies that were grown at a light intensity of ~ 60 μE m-2 s-1 (70W HQI) in a closed-circuit
coral aquaculture system “Quarantine system QU4” of Burgers Ocean, Arnhem, The
Netherlands. Each coral nubbin was fixed to a 5x5cm perforated PVC plate using Reef
Construct (Aquamedic). Nine plates of coral nubbins were fixed to one single square
plate and assigned to each of the following four experimental treatments: 70 W Metal
Halide (MH) lighting (BLV Hit-Lite, HIT-DE, 10.000K), 144 W fluorescent T8 lighting (2x
Philips TLD 36W/950 (5300 K), 2x Osram L 36W/67 (blue)), 250 W MH lighting and 400
W MH lighting. A light dark cycle of 10L:14D was applied. As a result of working inside
a public aquarium such as Burgers Ocean, we were constrained to incorporate our ex-
periments into existing systems, which limited our ability to standardize the experimental
setup. To standardize the light regimes, the average irradiance level was determined
within each experimental treatment by measuring irradiance (or photosynthetic photon
flux density) at different locations under the light source. Irradiance was measured using
a Li-Cor 192SA quantum underwater sensor, which measures light in the photosynthetic
active region (PAR, 400-700nm). The metal halide light sources had a quite variable light
distribution compared to the T8 light source. Using these light distribution patterns, the
average irradiance experienced by the coral nubbins was calculated for each treatment at
the start of the experiment: 38 (range: 35-45) µE m-2 s-1 for 70W MH treatment, 68 (range:
65-70) µE m-2 s-1 for 144W T8 treatment, 166 (range: 125-200) μE m-2 s-1 for 250W MH
treatment and 410 (range: 300-500) μE m-2 s-1 for 400W MH treatment. Irradiance levels
were measured at different times during the experiment and were found to decrease in
time (at most, a 17% decrease in 274 days).
Each PVC plate containing 9 coral nubbins was placed randomly in culture system QU4,
directly under the middle of each of the light sources. Flow direction inside this 1000 litre
culture system was changed every 2.5 minutes. Since several other coral species were
present in this coral culture system which likely influenced local flow regimes, water flow
rates were measured locally under each light source to obtain the average flow rates ex-
Chapter 3
3
60
perienced by our experimental corals. Each experimental treatment received respectively
5 ± 0 cm s-1, 5 ± 2 cm s-1, 15 ± 3 cm s-1, 6 ± 0 cm s-1 as measured using a SENSA-RC2
electromagnetic current meter (Aquadata).
Culture system QU4 is a 4000 l system consisting of two 1000 l aquaria and two 1000 l
sumps. The circulation system cycles 18 m3 h-1 and the system is connected to a trickle
tower, a Schuran Jet Stream 2 Ca2+ reactor, and a Schuran Aquafloater AQ250 protein
skimmer.
Seawater was made up from Tropical Marine salt (Zoomix). Temperature was maintained
at 26°C and salinity at 34 ppt. The system was fed 7 days a week using Artemia nauplii
(Salt Lake) that were hatched on site and subsequently enriched using Rich Advanced
feed for 24 hours. Since hatching efficiency is not constant, the amount of Artemia fed
each day is estimated to vary between 4-8 Artemia/ml. Water quality parameters were
measured at regular intervals.
2.1 Growthparameters
To measure growth, the buoyant mass of the coral nubbins was measured four times dur-
ing a 294 day period, at t=0 , t=111, t=179 and t=294 days. These intervals were the result
of practical circumstances prevailing at the facility where the experiments were carried
out (e.g., a public aquarium). In spite of their irregularity, both the frequency of measuring
points and the covered time range give sufficient security that the data enable to test the
hypothesis. Time is expressed as days after preparation of the nubbins.
Buoyant mass is a good method to determine of skeletal growth, since coral tissue has a
density which is similar to that of seawater and therefore does not contribute significantly
to the buoyant mass. Tissue only comprises 1% of the total buoyant mass when tissue
does not penetrate deep into the skeleton (Davies 1989). It should be noted that buoyant
mass is not a good approximation of skeletal mass, since the net upward buoyancy force
(i.e. the weight of seawater displaced by the coral) will result in measuring only a fraction
of the absolute mass (i.e. a fractional mass). To convert buoyant mass into skeletal mass,
one needs to know the density of the seawater and the volume of the coral. Moroever,
The effect of irradiance
61
3
one needs to assume a constant density of the coral skeleton during the experiment.
However, for the purpose of this study, knowledge of the magnitude of buoyant mass was
sufficient to calculate growth rates.
Buoyant mass was measured in the laboratory by suspending each coral (plus PVC
plate) on a hook in a defined volume of seawater at a constant depth. Seawater was
maintained at 26°C and 34 ppt salinity. The hook was attached to an underweighing
analytical balance (Kern&Sohn D-72458 Albstadt, type 870-13) using a thin nylon string
(Osinga et al. 1999). Buoyant mass of each coral was measured and the average of three
measurements was taken. The initial mass of the nubbins before their attachment to their
PVC-plate at t=0 was estimated by weighing 5 similar-sized nubbins of a G. fascicularis
colony on a weighing glass and taking the average. Using this parameter, it was possible
to estimate the mass of the PVC plate and the amount of Reef Construct that was used
to attach each coral to its plate. All our buoyant masses were corrected for this mass in
order to obtain the buoyant mass of the coral colony itself. This mass was used as pa-
rameter for data analysis.
The growth data of buoyant mass were also used to calculate specific growth rate (µ)
using the formula:
μ = (ln BWn - ln BWn-1)/Δt [day-1]
where µ is the specific growth rate (day-1), BWn is buoyant mass at the end of a growth
interval, BWn-1 is buoyant mass at the start of a growth interval and Δt is time between
measurements of buoyant mass in this growth interval.
2.2 Photosynthesis-irradiance curve
A photosynthesis-irradiance curve was measured for a G. fascicularis colony that was
grown under a 250 W Metal Halide lamp at an irradiance of ca 60 µE m-2 s-1. Since Goiran
et al. (1996) already measured a photosynthesis-irradiance curve for G. fascicularis , it
was repeated only once to verify its applicability for this study. Net photosynthetic pro-

Chapter 3
3
62
duction of oxygen was measured by means of intermittent flow respirometry in a 3500
cm3 respirometric flow cell at irradiances ranging from 40 to 500 µE m-2 s-1 using irradi-
ance intervals of ca 60 µE m-2 s-1. It was not possible to reach irradiances higher than
500 µE m-2 s-1 using our setup. However, the range of irradiances used corresponds to
the irradiances applied in the growth experiment. Respiratory consumption of oxygen
was measured in the dark. Lighting was provided by a T5 lighting system (ATI) contain-
ing eight 24W Aquablue Spezial bulbs. Irradiance was measured using a Li-Cor 192SA
quantum underwater sensor. A flow speed of ± 10 cm s-1 was applied to ensure adequate
mixing and to simulate the situation in the aquarium environment (5-15 cm s-1). At each
irradiance, the increase in oxygen concentration was measured every 10 seconds using
a luminescent oxygen probe (Hach) until a difference in concentration was detected of ±
1 mg O2 l-1. After each measurement the flowcell was flushed with “fresh” seawater from
the Quarantine tank to return the oxygen concentration to the initial value before the start
of the experiment and to remove possible accumulated waste products. Temperature
inside the respirometric flowcell was maintained at 26 ±0.5 °C and salinity at 34±0.1
ppt. Surface area and polyp number of the coral were determined in order to normalize
the respirometric data. urface area was measured as projected surface area. Pictures
were taken perpendicular to the coral directly inside the aquarium system using a Nikon
Coolpix S1 5.1 mp digital camera in a Nikon WP-CP5 underwater housing. Surface area
was determined by image analysis using ImageJ (1.37v) by tracing the live part of the
coral colony. Since tentacle extension is variable over time, no tentacles that were ex-
tending beyond the skeleton were traced for surface area. Polyp number was counted vi-
sually. Only live polyps were counted. Newly formed polyps were only counted once they
started projecting from the basal skeletal plate. The volume of the coral was determined
using the water displacement technique in order to correct flowcell volume for the space
taken in by the coral.
Photosynthetic rates at each irradiance were estimated by regressing oxygen concentra-
tion against time. Net photosynthetic rates were calculated according to the following
equation:

The effect of irradiance
63
3
Pnet = ((Vcell-Vcoral) x slope /S [μmol O2 min-1 cm-2]
Where Pnet is the rate of net photosynthesis (µmol O2 min-1 cm-2 ); Vcell is volume of re-
spirometric flowcell (l); Vcoral is volume of coral; slope is regression coefficient of dissolved
oxygen against time (µmol O2 l-1 min-1), and S is surface area of coral (cm2).
The P/I curve was fitted according to the model of Barnes and Chalker (1990) using
Sigmaplot 8.0.
Pnet = Rdark + Pgmax x tanh(I/Ik) [μmol O2 min-1 cm-2]
where Pnet is net photosynthesis as measured during respirometry in light and Rdark is rate
of respiration as measured during respirometry in darkness. Pgmax is the maximum gross
photosynthetic rate (defined as maximum net photosynthetic rate (Pnmax) minus dark res-
piration (R)), tanh is the hyperbolic tangent, I is irradiance and Ik is sub-saturation irradi-
ance (i.e. irradiance at which the initial linear slope of the curve intercepts the horizontal
asymptote).
2.3 Data analysis
Normality (p>0.05) and homogeneity of variance (p>0.05) of the data were tested using
Shapiro-Wilk and Levene’s test in SAS 9.1. Since our data did not satisfy the assump-
tions for ANOVA testing, we used Kruskall Wallis as a non-parametric test to detect sta-
tistical differences between treatments.
Chapter 3
3
64
3 Results
3.1 Culture system parameters
During the experiment (22/03/2005 till 03/07/2005) the alkalinity in the system was 3.23
± 0.54 S.D. mEq l-1, calcium concentration 393.75 ± 14.36 S.D. mg l-1, magnesium con-
centration 1290 ± 51.29 S.D. mg l-1, nitrate concentration 0.19 ± 0.08 S.D. mg NO3--N l-1,
nitrite concentration 0.014 ± 0.002 S.D. mg NO2--N l-1 and phosphate concentration 0.015
± 0.022 S.D. mg PO43- l-1.
3.2 Growthparameters
3.2.1 Buoyant mass
All corals grew during the experiment. The buoyant mass of the corals (Figure 1) increased
significantly in time in each treatment (p<0.001).
An increase in growth as buoyant mass with increasing irradiance was observed: at day
111 and day 179, the corals in the two highest light treatments (166 µE m-2 s-1 and 410 µE
m-2 s-1) had a significant higher calculated buoyant mass (p<0.01) compared to corals in
the two lowest light treatments (38 µE m-2 s-1 and 68 µE m-2 s-1). At Day 294, the corals in
the highest light treatment (410 µE m-2 s-1) had a significantly higher calculated buoyant
mass compared to the 166 µE m-2 s-1 treatment (p<0.01). On its turn, the corals in the 166
µE m-2 s-1 treatment had a significantly higher calculated buoyant mass (p<0.001) com-
pared to the corals in the two lowest light treatments (38 µE m-2 s-1 and 68 µE m-2 s-1).
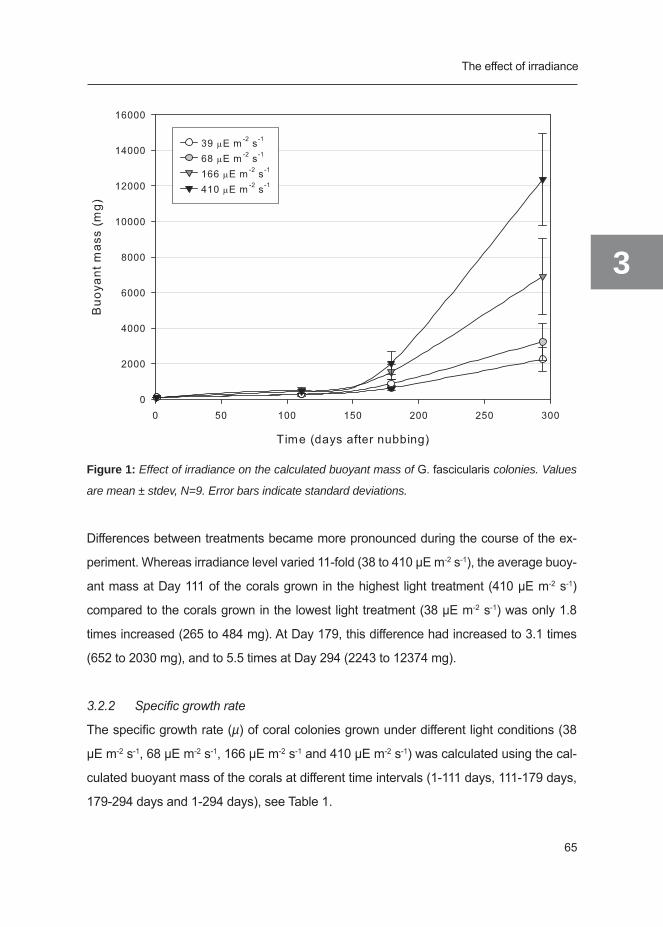
The effect of irradiance
65
3
Figure 1: Effect of irradiance on the calculated buoyant mass of G. fascicularis colonies. Values
are mean ± stdev, N=9. Error bars indicate standard deviations.
Differences between treatments became more pronounced during the course of the ex-
periment. Whereas irradiance level varied 11-fold (38 to 410 µE m-2 s-1), the average buoy-
ant mass at Day 111 of the corals grown in the highest light treatment (410 µE m-2 s-1)
compared to the corals grown in the lowest light treatment (38 µE m-2 s-1) was only 1.8
times increased (265 to 484 mg). At Day 179, this difference had increased to 3.1 times
(652 to 2030 mg), and to 5.5 times at Day 294 (2243 to 12374 mg).
3.2.2 Specific growth rate
The specific growth rate (µ) of coral colonies grown under different light conditions (38
µE m-2 s-1, 68 µE m-2 s-1, 166 µE m-2 s-1 and 410 µE m-2 s-1) was calculated using the cal-
culated buoyant mass of the corals at different time intervals (1-111 days, 111-179 days,
179-294 days and 1-294 days), see Table 1.
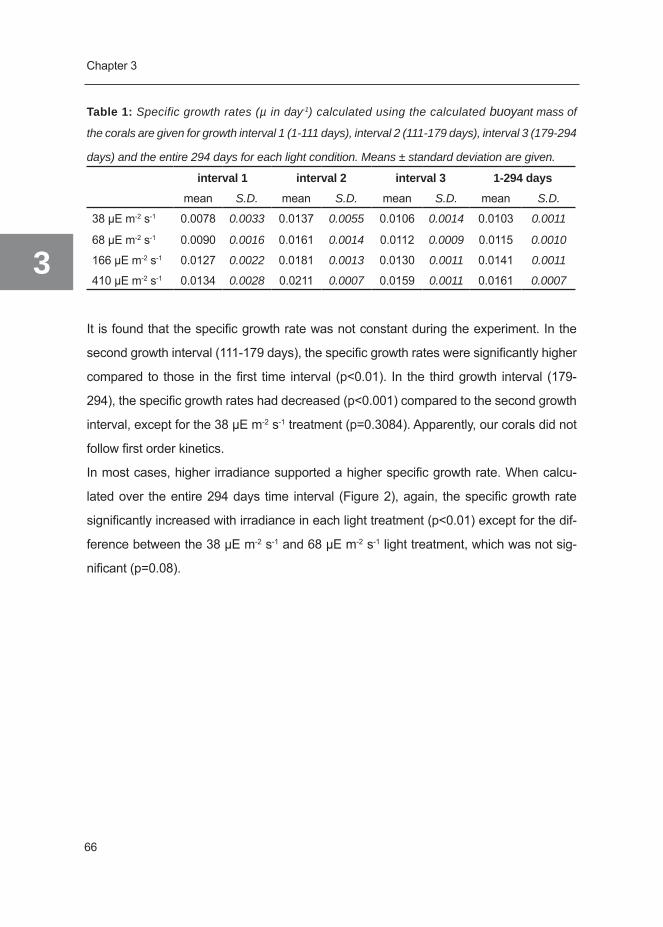
Chapter 3
3
66
Table 1: Specific growth rates (µ in day-1) calculated using the calculated buoyant mass of
the corals are given for growth interval 1 (1-111 days), interval 2 (111-179 days), interval 3 (179-294
days) and the entire 294 days for each light condition. Means ± standard deviation are given.
interval 1 interval 2 interval 3 1-294 daysmean S.D. mean S.D. mean S.D. mean S.D.
38 µE m-2 s-1 0.0078 0.0033 0.0137 0.0055 0.0106 0.0014 0.0103 0.0011
68 µE m-2 s-1 0.0090 0.0016 0.0161 0.0014 0.0112 0.0009 0.0115 0.0010
166 µE m-2 s-1 0.0127 0.0022 0.0181 0.0013 0.0130 0.0011 0.0141 0.0011
410 µE m-2 s-1 0.0134 0.0028 0.0211 0.0007 0.0159 0.0011 0.0161 0.0007
It is found that the specific growth rate was not constant during the experiment. In the
second growth interval (111-179 days), the specific growth rates were significantly higher
compared to those in the first time interval (p<0.01). In the third growth interval (179-
294), the specific growth rates had decreased (p<0.001) compared to the second growth
interval, except for the 38 µE m-2 s-1 treatment (p=0.3084). Apparently, our corals did not
follow first order kinetics.
In most cases, higher irradiance supported a higher specific growth rate. When calcu-
lated over the entire 294 days time interval (Figure 2), again, the specific growth rate
significantly increased with irradiance in each light treatment (p<0.01) except for the dif-
ference between the 38 µE m-2 s-1 and 68 µE m-2 s-1 light treatment, which was not sig-
nificant (p=0.08).

The effect of irradiance
67
3
Figure 2: Specific growth rate of G. fascicularis colonies grown under different light conditions
calculated over the total growth period (1-294 days) and plotted against irradiance. Values are
mean ± stdev, N=9.
3.3 Photosynthesis-irradiance:comparisonwithspecificgrowthrate
The relationship between photosynthetic rate and irradiance was determined for a 54
week old G. fascicularis colony that was grown at 60 µE m-2 s-1 receiving 144 W MH
lighting (Figure 3, black dots) and compared with the effect of irradiance on the specific
growth rate (from 1 to 294 days) (Figure 3, bar graph).
The photosynthesis-irradiance curve was fitted according to the model of Barnes and
Chalker (1990) (Figure 3, line graph) and was found to be similar to the one measured
by Goiran et al. (1996), verifying our result and its applicability for this study. Although
our data did not allow a legitimate estimation of Pgmax, we can assert and confirm from
the photosynthesis-irradiance curve measured by Goiran et al. (1996) that the irradiance
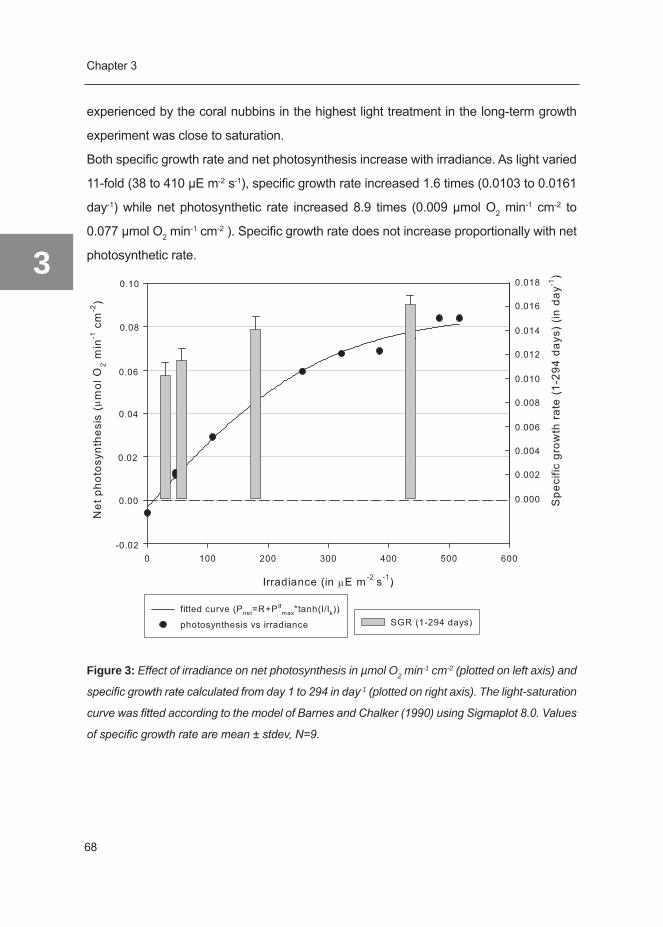
Chapter 3
3
68
experienced by the coral nubbins in the highest light treatment in the long-term growth
experiment was close to saturation.
Both specific growth rate and net photosynthesis increase with irradiance. As light varied
11-fold (38 to 410 µE m-2 s-1), specific growth rate increased 1.6 times (0.0103 to 0.0161
day-1) while net photosynthetic rate increased 8.9 times (0.009 µmol O2 min-1 cm-2 to
0.077 µmol O2 min-1 cm-2 ). Specific growth rate does not increase proportionally with net
photosynthetic rate.
Figure 3: Effect of irradiance on net photosynthesis in µmol O2 min-1 cm-2 (plotted on left axis) and
specific growth rate calculated from day 1 to 294 in day-1 (plotted on right axis). The light-saturation
curve was fitted according to the model of Barnes and Chalker (1990) using Sigmaplot 8.0. Values
of specific growth rate are mean ± stdev, N=9.
The effect of irradiance
69
3
4 Discussion
4.1 Growthandirradiance
Skeletal growth of G. fascicularis increased with increasing irradiance, which is in agree-
ment to the positive correlations of calcification with light found by Marubini et al. (2001)
for the stony coral Porites compressa, by Reynaud-vaganay et al. (2001) for Stylophora
pistillata and Acropora sp., by Reynaud et al. (2004) for the stony coral Acropora verweyi,
and by Schlacher et al. (2007) for Acropora solitaryensis.
The specific growth rate of G. fascicularis also increased with increasing irradiance. In-
herent to the assumption of exponential growth, the relative increase in specific growth
rate is less than the increase in buoyant mass over a 294 day period. However, for coral
breeding in captivity, small differences in specific growth rate can result in large differ-
ences in buoyant mass increase over long time intervals.
Growth of G. fascicularis in this experiment did not follow first order kinetics, since specific
growth rates differed between growth intervals. The first growth interval is biased be-
cause of a lag phase in growth due to regeneration after nubbing (Meesters et al. 1994).
However, when comparing the specific growth rates in the second and third growth inter-
val, it is notable that specific growth rates decrease in time. The same trend was found
for G. fascicularis in another long-term study (M. Schutter, unpublished results). Although
the exponential growth model is thus not applicable to the growth of G. fascicularis , it
remains a proper tool to evaluate differences in growth.
4.2 Growthandphotosynthesis
The relationship between net photosynthetic rate and irradiance could be approximated
by a hyperbolic tangent function. The Irradiance experienced by the coral nubbins in the
highest light treatment in the long-term growth experiment was close to saturation.
When comparing specific growth rates (from 1 to 294 days) in the different light treat-
ments with the photosynthesis-irradiance curve, it was observed that net photosynthesis
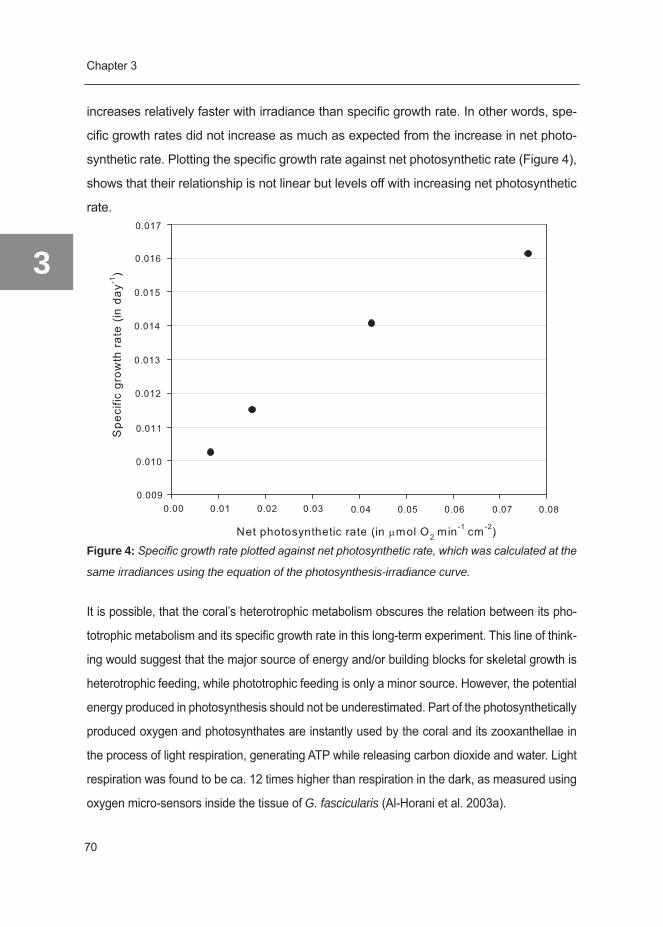
Chapter 3
3
70
increases relatively faster with irradiance than specific growth rate. In other words, spe-
cific growth rates did not increase as much as expected from the increase in net photo-
synthetic rate. Plotting the specific growth rate against net photosynthetic rate (Figure 4),
shows that their relationship is not linear but levels off with increasing net photosynthetic
rate.
Figure 4: Specific growth rate plotted against net photosynthetic rate, which was calculated at the
same irradiances using the equation of the photosynthesis-irradiance curve.
It is possible, that the coral’s heterotrophic metabolism obscures the relation between its pho-
totrophic metabolism and its specific growth rate in this long-term experiment. This line of think-
ing would suggest that the major source of energy and/or building blocks for skeletal growth is
heterotrophic feeding, while phototrophic feeding is only a minor source. However, the potential
energy produced in photosynthesis should not be underestimated. Part of the photosynthetically
produced oxygen and photosynthates are instantly used by the coral and its zooxanthellae in
the process of light respiration, generating ATP while releasing carbon dioxide and water. Light
respiration was found to be ca. 12 times higher than respiration in the dark, as measured using
oxygen micro-sensors inside the tissue of G. fascicularis (Al-Horani et al. 2003a).

The effect of irradiance
71
3
Although it is not tested whether this ratio changes with increasing irradiance, it is very
plausible that it does. This notion would signify that the poor increase in specific growth
rate compared to the increase in net photosynthetic rate is probably not due to a lack
of energy, but more likely due to a lack of (nitrogen-rich) building blocks. It is therefore
unlikely in this experiment that heterotrophic feeding obscured the relation between pho-
totrophic metabolism and specific growth rate.
It is generally assumed that photosynthesis and calcification are tightly coupled and that
an increase in photosynthesis will lead to an increase in calcification. Both processes fol-
low a hyperbolic tangent function when plotted against irradiance (Barnes and Chalker
1990). However, it is not established whether both processes are saturated at the same
irradiances. Comparing the studies from Houlbreque et al. (2004) and Moya et al. (2006)
on Stylophora pistillata, provides indications that these processes are not linearly corre-
lated. Houlbreque et al. (2004) fitted a hyperbolic tangent function to the photosynthetic
rate of S. pistillata (nmol O2 h-1 cm-2) grown at 175 µE m-2 s-1 and found an Ik (i.e. sub-
saturation irradiance) of ~203 µE m-2 s-1 for starved corals and ~404 µE m-2 s-1 for fed
corals. Moya et al. (2006) used the same coral species grown at the same irradiance and
measured the calcification rate (nmol Ca2+ mg protein-1 h-1) at different irradiances. They
found an optimal calcification rate at 100 µE m-2 s-1. Although these studies do not use the
same parameter to express their results (protein vs. surface area), these results do imply
that calcification rate reaches a maximum far before photosynthetic rate does.
Our results do fit in this view, considering the fact that no direct 1:1 relation between cal-
cification and photosynthesis was observed. Specific growth rate and net photosynthetic
rate continued to deviate with increasing irradiance. If photosynthesis were to support
calcification until saturation of photosynthesis, then it would be expected that a higher
photosynthetic rate would lead to a higher calcification rate. To test whether maximum
calcification was already reached at an intermediate irradiance level, we applied a right
rectangular hyperbola function, according to the procedure of Chalker (1981) (Figure 5).
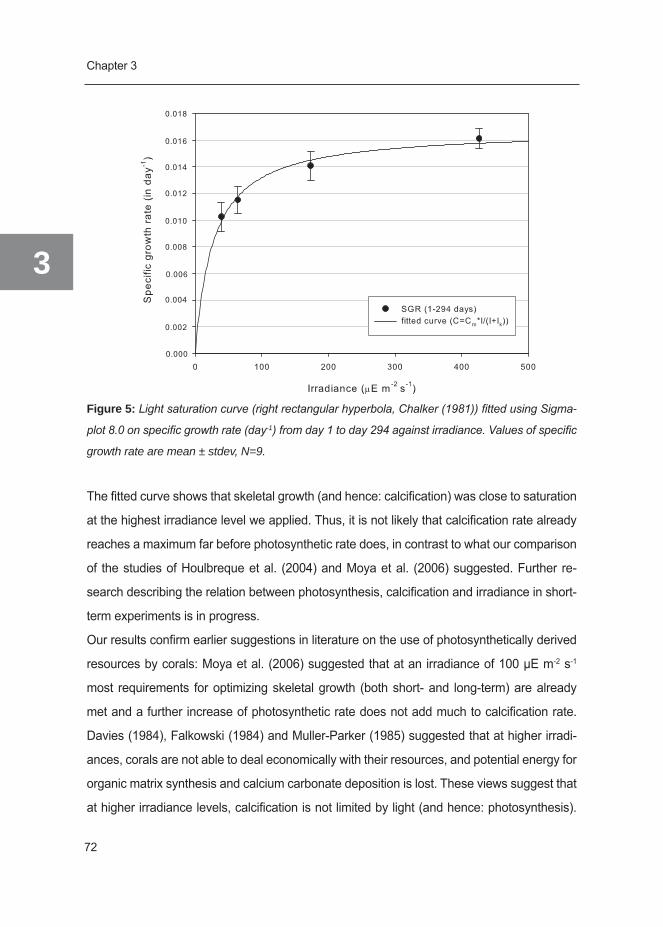
Chapter 3
3
72
Figure 5: Light saturation curve (right rectangular hyperbola, Chalker (1981)) fitted using Sigma-
plot 8.0 on specific growth rate (day-1) from day 1 to day 294 against irradiance. Values of specific
growth rate are mean ± stdev, N=9.
The fitted curve shows that skeletal growth (and hence: calcification) was close to saturation
at the highest irradiance level we applied. Thus, it is not likely that calcification rate already
reaches a maximum far before photosynthetic rate does, in contrast to what our comparison
of the studies of Houlbreque et al. (2004) and Moya et al. (2006) suggested. Further re-
search describing the relation between photosynthesis, calcification and irradiance in short-
term experiments is in progress.
Our results confirm earlier suggestions in literature on the use of photosynthetically derived
resources by corals: Moya et al. (2006) suggested that at an irradiance of 100 µE m-2 s-1
most requirements for optimizing skeletal growth (both short- and long-term) are already
met and a further increase of photosynthetic rate does not add much to calcification rate.
Davies (1984), Falkowski (1984) and Muller-Parker (1985) suggested that at higher irradi-
ances, corals are not able to deal economically with their resources, and potential energy for
organic matrix synthesis and calcium carbonate deposition is lost. These views suggest that
at higher irradiance levels, calcification is not limited by light (and hence: photosynthesis).
It either becomes inhibited by light (e.g. Ralph et al. 1999; Winters et al. 2003) or is limited
by another factor, such as the availability of bicarbonate (Marubini and Thake 1999) or the
availability of planktonic food, which may be needed for the synthesis of the organic matrix
(Allemand et al. 1998; Houlbreque et al. 2004). The results of the current study did not pro-
vide evidence to support the hypothesis that skeletal growth and photosynthesis are linearly
correlated and therefore this hypothesis has to be rejected. Most probably linearity cannot be
reached because at high irradiance, growth will be limited by other factors than irradiance.
5 Conclusion
This study demonstrates that the relationship between net photosynthesis and skeletal
growth is not proportional. Thus it seems that enhancement of calcification is not entirely
photosynthesis-driven: light enhanced calcification seems only to be mediated by photosyn-
thesis at lower irradiances, while at higher irradiances the relation between calcification and
photosynthesis is distorted. This finding has implications for the aquaculture of corals for
aquarium/restoration purposes, since it is generally believed that more light leads to more
(skeletal) growth.
The discrepancy between potential energy produced in photosynthesis and energy used for
skeletal growth can be caused by several possible factors which have been discussed in this
paper. Future studies should focus on the question to what extent these factors influence the
relationship between photosynthesis and calcification.
Acknowledgements
This research is part of the European CORALZOO project that aims at improving coral hus-
bandry techniques for sustainable coral breeding in zoo’s and public aquaria. In this project,
scientists and aquarists collaborate to provide a scientific basis for coral husbandry tech-
niques. The experiment described in this paper was aimed to determine the effect of irradi-
ance on growth of scleractinian corals.
We thank the staff of Burgers Ocean for their help in setting up the experiment. This work
was funded by the European Commission (Project CORALZOO-012547).

Chapter 4
Photoacclimation of the scleractinian
coral Galaxea fascicularis
to photoperiod extension under light-
saturating conditions
Miriam Schutter1,2, Rosa van der Ven1, Max Janse3, Johan Verreth1, René H. Wijffels2
and Ronald Osinga1*
1 Aquaculture and Fisheries Group, Wageningen University, P.O. Box 338 6700 AH Wageningen, The Netherlands
2 Bioprocess Engineering, Wageningen University, PO Box 8129 , 6700 EV Wageningen, The Netherlands
3 Burgers Zoo, Antoon van Hooffplein 1, 6816 SH Arnhem, The Netherlands

Chapter 4
4
76
Abstract
Light is one of the most important abiotic factors influencing the (skeletal) growth of scleractinian
corals. In order to make best use of the light available, corals are able to photoacclimate to
optimize their metabolic activity under a wide range of light intensities. Whereas photo acclimation
to different photon flux densities has been studied extensively, information on phenotypic
adaptations of the coral host and its symbionts to changes in photoperiod remains scarce, in
particular under conditions where light is not the limiting factor.
In this study, we used an experiment on coral growth where light was found not to be limiting
for growth to study photoacclimation to different photoperiods. Series of nine genetically
identical coral nubbins of Galaxea fascicularis were cultured for a period of 18 weeks at different
photoperiods (8h 150 µE m-2 s-1:16h dark, 12h 150 µE m-2 s-1:12h dark, 16h 150 µE m-2 s-1:8h
dark, 24h 150 µE m-2 s-1:0h dark) and different photon flux densities (8h 150 µE m-2 s-1:16h dark,
8h 225 µE m-2 s-1:16h dark and 8h 300 µE m-2 s-1:16 h dark). Growth during the experiment
was determined by measuring buoyant mass. To detect possible acclimation of the corals to an
increased light duration (8 hours versus 16 hours), net photosynthesis, dark respiration, daily P/R
ratio, zooxanthellae density and chlorophyll content were measured for colonies grown at 8h 150
µE m-2 s-1:16h dark and colonies grown at 16h 150 µE m-2 s-1:8h dark.
No increase in growth was detected with increasing photoperiod or irradiance. Continuous lighting
(24h 150 µE m-2 s-1:0h dark) resulted in immediate bleaching and the corals died after 14 weeks.
Both net photosynthetic rate and specific growth rate were reduced compared to other studies.
Daily net photosynthesis was not significantly different between the 8 hour light and 16 hour light
treatment, showing photo acclimation of the corals, which might explain the comparable growth
rates. No changes in chlorophyll A or zooxanthellae density were found.
Based on the results of this study it is proposed that G. fascicularis exhibited a form of self-
shading, which is a known behavioral response of several coral species to e.g. excess light.
Possibly, as a result of this photo-protective response, growth rates were not reduced when
exposed to an extended photoperiod under light saturating conditions.
Keywords: Galaxea fascicularis, light-saturation, photoacclimation, photoperiod photosynthesis
Photoperiod and photoacclimation
77
4
1 Introduction
Light is one of the most important factors influencing the growth and physiology of zooxanthellate
scleractinian corals due to their symbiotic relationship with phototrophic microalgae, the
zooxanthellae. In the light, zooxanthellae perform photosynthesis, hereby producing oxygen and
organic compounds. When their own respiratory needs are satisfied, zooxanthellae translocate
the excess photosynthetic products to the coral host (Muscatine and Cernichiari 1969; Muscatine
et al. 1981). Zooxanthellae can thus provide a considerable part of the resources needed for
coral growth, both for soft tissue growth and for skeletal growth. The latter process is commonly
referred to as light enhanced calcification. On average, calcification in light is found to be 3-4
times higher than in darkness (Gattuso et al. 1999). Although the exact mechanisms of this
enhancement are still a matter of debate (Gattuso et al.1999; Furla et al. 2000; Allemand et al.
2004, Moya et al. 2006, 2008a), the importance of light for coral growth is beyond doubt.
In order to make best use of the available light, corals exhibit photoacclimation to adapt to a
range of light intensities (3-15 m for G. fascicularis, Titlyanov and Latypov 1991; Crabbe and
Smith 2006) with minimum losses in their metabolic activity (Titlyanov and Titlyanova 2002b).
They may photoacclimate to maximize their photosynthetic rates under light-limiting conditions
(e.g. by increasing pigmentation and/or algal density), or to protect themselves against photo
inhibition and photo-oxidative stress under saturating light conditions (Levy et al. 2006). As a
result of the symbiotic relationship, photo-adaptive changes can be either host-controlled and/
or symbiont-controlled.
The amount of light or photons that is available to the zooxanthellae is not only determined
by photon flux density, but also by the length of the photoperiod. Whereas photoacclimation
to different photon flux densities has been studied extensively (Chalker et al. 1983; Iglesias-
Prieto and Trench 1994; Titlyanov and Titlyanova 2002b; Anthony and Hoegh-Guldberg 2003a),
information on photoadaptive changes to photoperiod remain scarce, in particular under
conditions where light is not the limiting factor.
In this paper, we give a description of the effect of photoperiod extension on several photoadaptive
parameters under light saturating conditions, using an experiment on coral growth and light
flux where light was found not to be limiting for growth since growth did not increase with
Chapter 4
4
78
irradiance. Series of nine genetically identical coral nubbins of G. fascicularis were cultured
for a period of 18 weeks at different photoperiods (8h 150 µE m-2 s-1:16h dark, 12h 150 µE m-2
s-1:12h dark, 16h 150 µE m-2 s-1:8h dark, 24h 150 µE m-2 s-1:0h dark) and different photon flux
densities (8h 150 µE m-2 s-1:16h dark, 8h 225 µE m-2 s-1:16h dark and 8h 300 µE m-2 s-1:16 h
dark). Photoacclimation of corals to different photoperiods (8 vs 16 hour light) under such light
saturating conditions, was studied by measuring net photosynthetic rate, dark respiration, daily
P/R ratio, zooxanthellae density and chlorophyll content. This is the first description of photo-
acclimation of a zooxanthellate scleractinian coral to variation in day length in a closed aquarium
system.
2 Material and Methods
2.1 Experimental setup
2.1.1 Preparatory phase
Coral nubbins (single polyp clones) of G. fascicularis were created of colonies that were
grown at a light intensity of 60 µE m-2 s-1 (70W HQI) in a closed-circuit coral aquaculture
system “Quarantine system QU3” of Burgers Ocean, Arnhem, The Netherlands. QU3 is
a 6000 l system consisting of four 1000 l aquaria and two 800 l sumps. The circulation
system cycles 24 m3 h-1 and the system is connected to a 23.5 l self made calcium reactor
(pH 6.2-6.4; Q=24 l h-1), and a Schuran Aquafloater AQ250 protein skimmer.
Each coral nubbin was fixed to a 7 x 7 x 0.4 cm PVC plate using Reef Construct
(Aquamedic). Nine PVC plates with coral nubbins were fixed to one single square plate
and maintained for four months in coral culture system QU3 at an irradiance of 150 µE
m-2 s-1 which was provided by ATI lighting armatures containing 10.000K T5 Coral Light
(Korallenzucht) bulbs. A light:dark cycle of 10L:14D was applied.
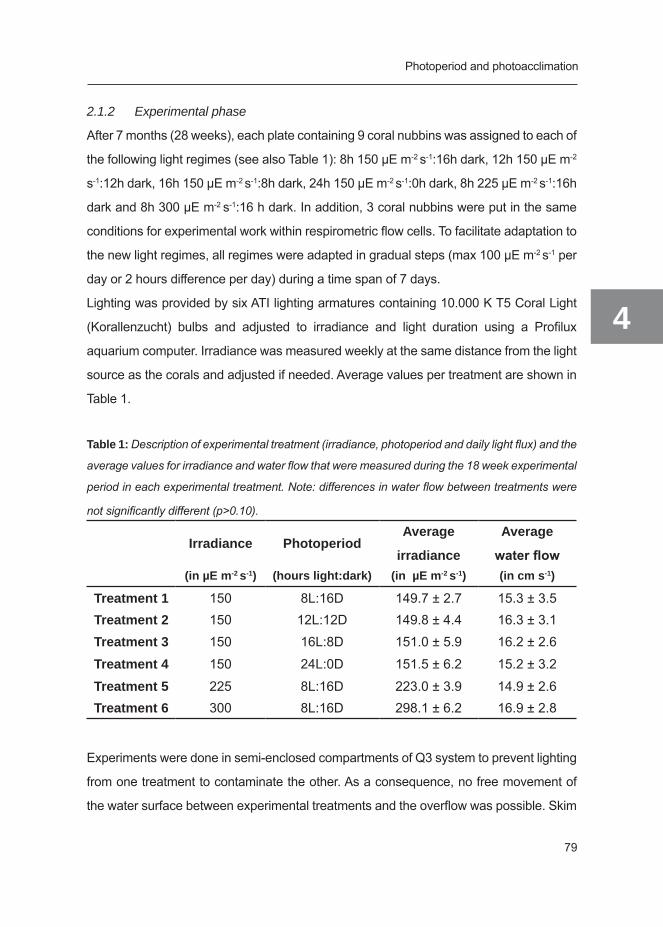
Photoperiod and photoacclimation
79
4
2.1.2 Experimental phase
After 7 months (28 weeks), each plate containing 9 coral nubbins was assigned to each of
the following light regimes (see also Table 1): 8h 150 µE m-2 s-1:16h dark, 12h 150 µE m-2
s-1:12h dark, 16h 150 µE m-2 s-1:8h dark, 24h 150 µE m-2 s-1:0h dark, 8h 225 µE m-2 s-1:16h
dark and 8h 300 µE m-2 s-1:16 h dark. In addition, 3 coral nubbins were put in the same
conditions for experimental work within respirometric flow cells. To facilitate adaptation to
the new light regimes, all regimes were adapted in gradual steps (max 100 µE m-2 s-1 per
day or 2 hours difference per day) during a time span of 7 days.
Lighting was provided by six ATI lighting armatures containing 10.000 K T5 Coral Light
(Korallenzucht) bulbs and adjusted to irradiance and light duration using a Profilux
aquarium computer. Irradiance was measured weekly at the same distance from the light
source as the corals and adjusted if needed. Average values per treatment are shown in
Table 1.
Table 1: Description of experimental treatment (irradiance, photoperiod and daily light flux) and the
average values for irradiance and water flow that were measured during the 18 week experimental
period in each experimental treatment. Note: differences in water flow between treatments were
not significantly different (p>0.10).
Irradiance PhotoperiodAverage
irradiance
Average
waterflow(in µE m-2 s-1) (hours light:dark) (in µE m-2 s-1) (in cm s-1)
Treatment 1 150 8L:16D 149.7 ± 2.7 15.3 ± 3.5Treatment 2 150 12L:12D 149.8 ± 4.4 16.3 ± 3.1Treatment 3 150 16L:8D 151.0 ± 5.9 16.2 ± 2.6
Treatment 4 150 24L:0D 151.5 ± 6.2 15.2 ± 3.2
Treatment 5 225 8L:16D 223.0 ± 3.9 14.9 ± 2.6Treatment 6 300 8L:16D 298.1 ± 6.2 16.9 ± 2.8
Experiments were done in semi-enclosed compartments of Q3 system to prevent lighting
from one treatment to contaminate the other. As a consequence, no free movement of
the water surface between experimental treatments and the overflow was possible. Skim
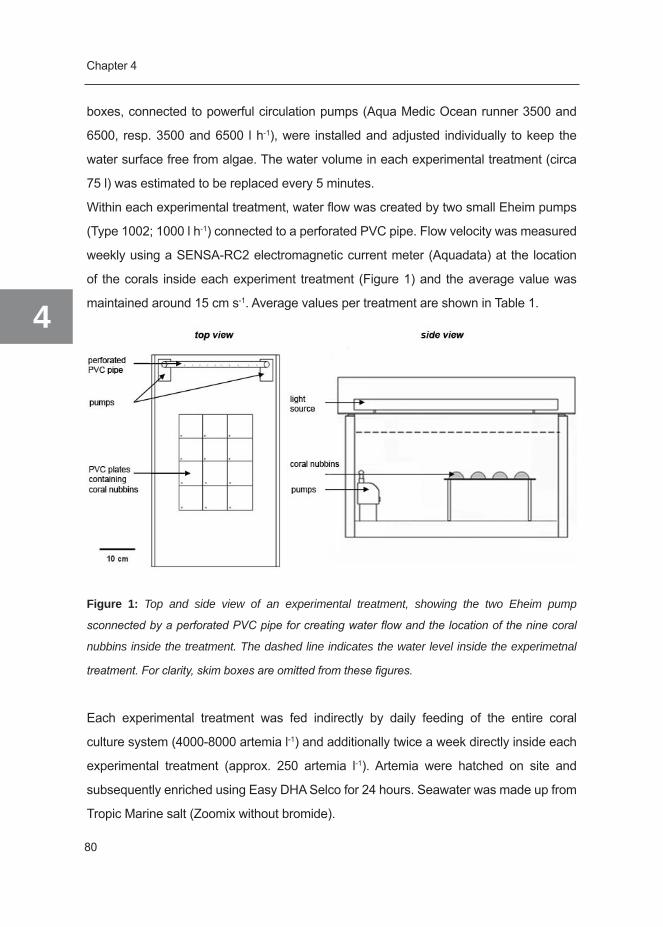
Chapter 4
4
80
boxes, connected to powerful circulation pumps (Aqua Medic Ocean runner 3500 and
6500, resp. 3500 and 6500 l h-1), were installed and adjusted individually to keep the
water surface free from algae. The water volume in each experimental treatment (circa
75 l) was estimated to be replaced every 5 minutes.
Within each experimental treatment, water flow was created by two small Eheim pumps
(Type 1002; 1000 l h-1) connected to a perforated PVC pipe. Flow velocity was measured
weekly using a SENSA-RC2 electromagnetic current meter (Aquadata) at the location
of the corals inside each experiment treatment (Figure 1) and the average value was
maintained around 15 cm s-1. Average values per treatment are shown in Table 1.
Figure 1: Top and side view of an experimental treatment, showing the two Eheim pump
sconnected by a perforated PVC pipe for creating water flow and the location of the nine coral
nubbins inside the treatment. The dashed line indicates the water level inside the experimetnal
treatment. For clarity, skim boxes are omitted from these figures.
Each experimental treatment was fed indirectly by daily feeding of the entire coral
culture system (4000-8000 artemia l-1) and additionally twice a week directly inside each
experimental treatment (approx. 250 artemia l-1). Artemia were hatched on site and
subsequently enriched using Easy DHA Selco for 24 hours. Seawater was made up from
Tropic Marine salt (Zoomix without bromide).
Photoperiod and photoacclimation
81
4
Temperature in the system was maintained at 25.8 ± 0.3 S.D. °C, salinity at 34.1 ± 0.1
S.D. ppt and pH 8.1 ± 0.1 S.D. Water quality parameters were monitored on regular basis.
During the experiment, the alkalinity in the system was 4.6 ±1.0 S.D. mEq l-1, calcium
concentration 395.9 ± 17.7 S.D. mg l-1, magnesium concentration 1203 ± 63.7 S.D. mg l-1,
nitrate concentration 0.195 ± 0.077 S.D. mg NO3--N l-1, phosphate concentration 0.018 ±
0.015 S.D mg PO43- l-1.
2.2 Growthparameters
Growth was measured as an increase in buoyant mass according to Schutter et al. (2008).
It should be noted that buoyant mass is not a good approximation of skeletal mass, since
the net upward buoyancy force (i.e. the weight of seawater displaced by the coral wehn
weighing it under water) will result in measuring only a fraction of the absolute mass (i.e.
a fractional mass). To convert buoyant mass into skeletal mass, one needs to know the
density of the seawater and the volume of the coral. Moroever, one needs to assume a
constant density of the coral skeleton during the experiment. However, for the purpose
of this study, knowledge of the magnitude of buoyant mass was sufficient to calculate
growth rates.
Specific growth rates for buoyant mass were calculated between week 4 and week 18 (in
weeks after the adjustment to the new light regimes), since it was assumed that corals
need approximately 4 weeks to adapt to a new light regime (Falkowski and Dubinsky
1981; Anthony and Hoegh-Guldberg 2003ab). Assuming exponential growth, specific
growth rates (µ) were calculated using the formula:
μ = (ln BWn - ln BWn-1)/Δt [day-1]
where µ is the specific growth rate (day-1), BWn is buoyant mass at the end of a growth
interval, BWn-1 is buoyant mass at the start of a growth interval and ∆t is time between
measurements of buoyant mass in this growth interval.
Chapter 4
4
82
2.3 Respirometric measurements
2.3.1 Net photosynthesis and respiration
Net photosynthesis and dark respiration were determined for corals maintained at a
photoperiod of 8 hours light and at a photoperiod of 16 hours light (irradiance: 150 µE m-2 s-1).
Three coral colonies of each treatment were measured on three different days by means of
intermittent flow respirometry in a 1616 ± 5 ml respirometric flow cell, according to Schutter
et al. (2008).
Net photosynthetic oxygen production was measured at an irradiance of 150 µE m-2 s-1 (i.e.
corresponding to the irradiance in the experimental treatment). Respiratory consumption
of oxygen was measured in the dark. Lighting was provided by a T5 lighting system (ATI)
containing eight 24 W coral light bulbs (Korallenzucht). A flow speed of ±10 cm s-1 was
applied to ensure adequate mixing for respirometry.
2.3.2 Daily P/R ratios
Daily P/R ratios were calculated to indicate whether the corals were self-supporting with
respect to carbon. The ratios indicate whether the coral could satisfy their daily respiratory
needs using photosynthetic products translocated by their zooxanthellae only (Muscatine
et al. 1981). Values greater or equal than 1 indicate that corals are self-sufficient with
respect to carbon, while values lower than 1 indicate that they are not and that they
need other sources of carbon to sustain their respiratory needs. To be able to calculate
daily P/R ratios, net photosynthetic and dark respiratory rates were converted to carbon
equivalents, using the following equations:
Pc = Pnet x (12/32) [µmol C min-1 cm-2]
Rc = Rdark x (12/32) [µmol C min-1 cm-2]
where Pc is net photosynthetic rate in carbon equivalents (µmol C min-1 cm-2), Pnet is net
photosynthetic rate in oxygen equivalents (µmol O2 min-1 cm-2) and the factor (12/32) is
Photoperiod and photoacclimation
83
4
the molar conversion factor to convert oxygen equivalents (O2) to carbon equivalents
(C), Analogously, Rc is dark respiratory rate carbon equivalents (µmol C min-1 cm-2) and,
Rdark is the dark respiratory rate in oxygen equivalents. Since we do not know the exact
composition of substances that are produced during photosynthesis and that are respired
during respiration, no further corrections were applied using metabolic quotients (Gattuso
and Jaubert 1990).
Daily P/R ratios were calculated using the following equation:
Daily P/R ratio = (Pc * L) / (Rc * D) [dimensionless]
where Pc and Rc are expressed in mg C hour-1 cm-2, and L and D correspond respectively
to the number of hours of light and dark per day. Although interpretation of daily P/R ratios
that are derived from short term measurements is not justified according to Muscatine et
al. (1981), it is used here as an approximation.
2.4 Analysis of coral tissue
2.4.1 Tissue removal
At the end of the experiment, corals were removed from their treatments, snap-fixed in
formaldehyde (3 minutes 10% formaldehyde in 0.22 µm filtered seawater (FSW) 34ppt),
rinsed shortly in 0.22 µm FSW 34 ppt, wrapped in tin foil and frozen at -20°C until further
processing (Broadbent et al. 2002).
Corals (n=9) from two treatments (8 hour light/150 µE m-2 s-1 and 16 hour light/150 µE m-2
s-1) were taken from the freezer and soaked in Ca2+-Mg2+-free artificial seawater (ASW)
with ethylene diamine tetracetic acid (EDTA) in a slowly moving water bath at 50°C
overnight in order to facilitate tissue removal. This solution was prepared according to
Rinkevich et al. (2005). Tissue was removed the next day using high pressured N2 (max
1.5 bar within plastic bag). Cell suspensions were collected, diluted with 34 ppt artificial
sea water (ASW) and centrifuged three times for 10 minutes at 4°C at 4000 rpm. The final
tissue pellets of each coral were collected in one tube and total volume was determined
Chapter 4
4
84
using a 5 ml pipette. After homogenization using a LABOCAT X1030, samples were taken
to count the number of zooxanthellae (200 µl) and for chlorophyll analysis (1 ml).
2.4.2 Chlorophyll analysis and zooxanthellae count
Chlorophyll was extracted by adding 9 ml 100% acetone to 1 ml tissue homogenate
and storing it at -20°C overnight. The next day, this suspension was homogenized again
using a LABOCAT X1030. After settlement of the pellet, the absorbance of the extract
was measured in triplicate using a Beckman Coulter DU 530 Spectrophotometer at 750,
664 and 630 nm. 90% acetone in demiwater was used as a blank. The concentrations
of chlorophyll A and chlorophyll C2 were computed according to the equations given by
Jeffrey and Humphrey (1975) for dinoflagellates. Each extinction value (OD664 and
OD630) was corrected for the absorbance at 750 nm, which is a correction for the turbidity
of the sample.
Zooxanthellae were counted using a Bürker-Turk counting chamber. Zooxanthellae
density was expressed in amount of zooxanthellae per cm2 surface area. Using the
chlorophyll data, the amount of chlorophyll per zooxanthellae was also calculated.
2.5 Data analysis
Normality (p>0.05) and homogeneity of variance (p>0.05) of the growth and respirometry
data were tested using Shapiro-Wilk and Levene’s test in SAS 9.1. Since our growth,
photosynthesis and respiration data did not satisfy the assumptions for ANOVA testing,
we used Kruskall Wallis as a non-parametric test to detect statistical differences between
treatments.
A Student T-test was used to detect statistical differences in chlorophyll content and
zooxanthellae density between the 8 hour light and 16 hour light treatment.
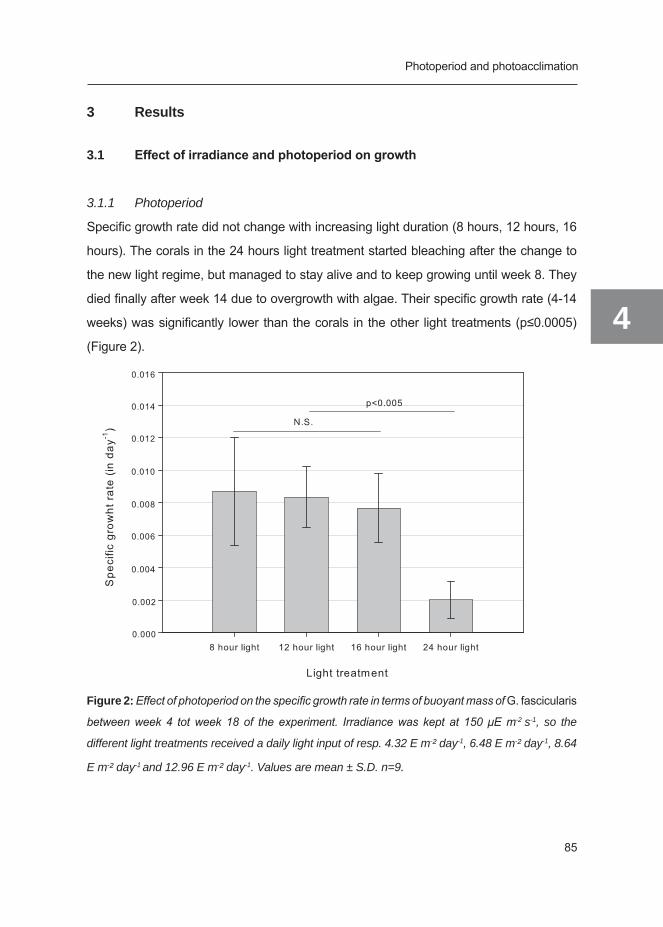
Photoperiod and photoacclimation
85
4
3 Results
3.1 Effectofirradianceandphotoperiodongrowth
3.1.1 Photoperiod
Specific growth rate did not change with increasing light duration (8 hours, 12 hours, 16
hours). The corals in the 24 hours light treatment started bleaching after the change to
the new light regime, but managed to stay alive and to keep growing until week 8. They
died finally after week 14 due to overgrowth with algae. Their specific growth rate (4-14
weeks) was significantly lower than the corals in the other light treatments (p≤0.0005)
(Figure 2).
Figure 2: Effect of photoperiod on the specific growth rate in terms of buoyant mass of G. fascicularis
between week 4 tot week 18 of the experiment. Irradiance was kept at 150 μE m-2 s-1, so the
different light treatments received a daily light input of resp. 4.32 E m-² day-1, 6.48 E m-² day-1, 8.64
E m-² day-1 and 12.96 E m-² day-1. Values are mean ± S.D. n=9.
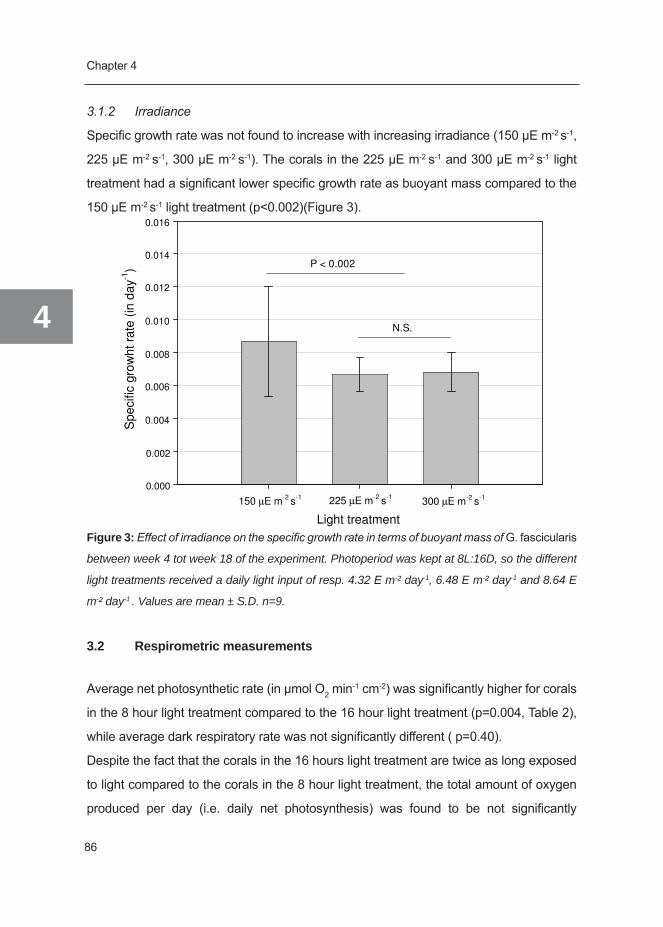
Chapter 4
4
86
3.1.2 Irradiance
Specific growth rate was not found to increase with increasing irradiance (150 µE m-2 s-1,
225 µE m-2 s-1, 300 µE m-2 s-1). The corals in the 225 µE m-2 s-1 and 300 µE m-2 s-1 light
treatment had a significant lower specific growth rate as buoyant mass compared to the
150 µE m-2 s-1 light treatment (p<0.002)(Figure 3).
Light treatment
Sp
ecific
gro
wh
t ra
te (
in d
ay
-1) P < 0.002
N.S.
150 µE m-2
s-1 225 µE m
-2 s
-1300 µE m
-2 s
-1
0.016
0.014
0.012
0.010
0.008
0.006
0.004
0.002
0.000
Figure 3: Effect of irradiance on the specific growth rate in terms of buoyant mass of G. fascicularis
between week 4 tot week 18 of the experiment. Photoperiod was kept at 8L:16D, so the different
light treatments received a daily light input of resp. 4.32 E m-² day-1, 6.48 E m-² day-1 and 8.64 E
m-² day-1 . Values are mean ± S.D. n=9.
3.2 Respirometric measurements
Average net photosynthetic rate (in µmol O2 min-1 cm-2) was significantly higher for corals
in the 8 hour light treatment compared to the 16 hour light treatment (p=0.004, Table 2),
while average dark respiratory rate was not significantly different ( p=0.40).
Despite the fact that the corals in the 16 hours light treatment are twice as long exposed
to light compared to the corals in the 8 hour light treatment, the total amount of oxygen
produced per day (i.e. daily net photosynthesis) was found to be not significantly

Photoperiod and photoacclimation
87
4
different between treatments (p=0.40). However, the total amount of oxygen respired in
the night was significantly higher for the corals in the 8 hour light treatment (p=0.003).
Consequently, the average daily P/R ratio was significantly higher for the corals in the 16
hour light treatment (p=0.009), i.e. the average daily P/R ratio for the corals in the 16 hour
light treatment was above 1 (1.59 ± 0.66 S.D), while the average daily P/R ratio for the
corals in the 8 hour light treatment was below 1 (0.90 ± 0.44 S.D).
Table 2: Overview of respirometric parameters of corals maintained at a photoperiod of 8 hour
light (8h 150 µE m-2 s-1: 16 dark) and at a photoperiod of 16 hour light (16h 150 µE m-2 s-1: 8h
dark). Values are mean ± S.D. P-values are given (one way ANOVA or Kruskall-Wallis test). N=9
observations for 8 hour light treatment, N= 5 observations for 16 hour light treatment.
8 hour light 16 hour lightmean S.D. mean S.D. p-value
net photosynthesis µmol O2 min-1cm-2 0.024 0.007 0.013 0.005 0.004
dark respiration µmol O2 min-1cm-2 -0.017 0.006 -0.020 0.005 0.27
daily net photosynthesis
µmol O2 cm-2 day-1 11.627 3.419 12.756 4.799 0.40
daily respiration µmol O2 cm-2 day-1 -16.303 5.414 -9.455 2.198 0.003
daily P/R ratio 0.902 0.438 1.585 0.659 0.0093
3.3 Chlorophyll and zooxanthellae
No significant difference in chlorophyll A content (in µg Chl A cm-2) and chlorophyll C2
content (in µg Chl C2 cm-2) was detected between the corals in the 8 hour light and
16 hour light treatment (T-test, resp. p=0.47 and p= 0.45), despite visual observation
suggesting that the corals in the 16 hour light treatment were less pigmented.
Zooxanthellae density (zoox cm-2) and amount of Chlorophyll per zooxanthellae (Chl A
zoox-1) were also not significantly different between the corals in the 16 hour light treatment
and the corals in the 8 hour light treatment (Table 3).
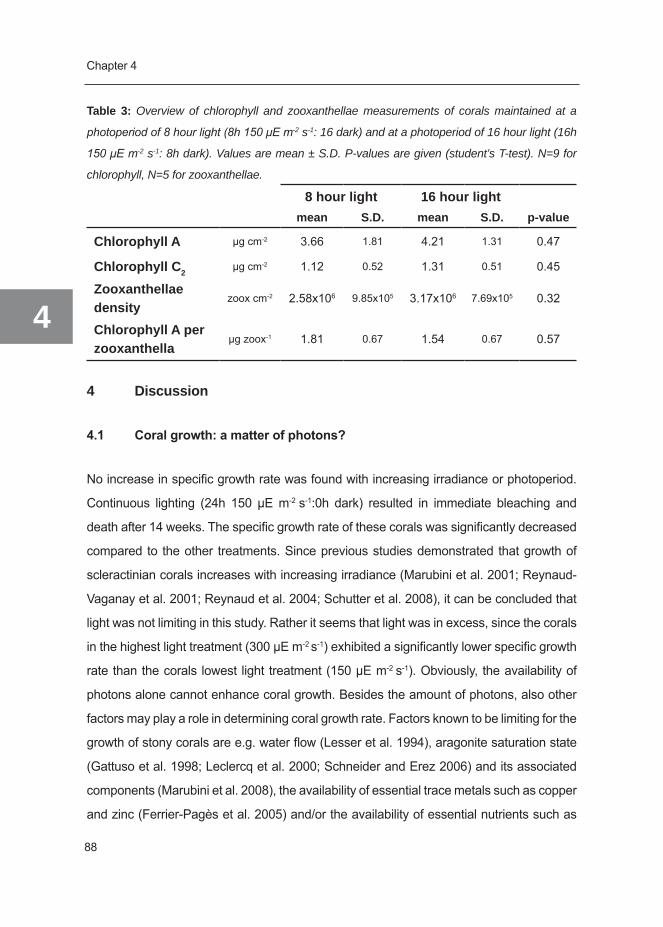
Chapter 4
4
88
Table 3: Overview of chlorophyll and zooxanthellae measurements of corals maintained at a
photoperiod of 8 hour light (8h 150 μE m-2 s-1: 16 dark) and at a photoperiod of 16 hour light (16h
150 μE m-2 s-1: 8h dark). Values are mean ± S.D. P-values are given (student’s T-test). N=9 for
chlorophyll, N=5 for zooxanthellae.
8 hour light 16 hour light mean S.D. mean S.D. p-value
Chlorophyll A μg cm-2 3.66 1.81 4.21 1.31 0.47
Chlorophyll C2 μg cm-2 1.12 0.52 1.31 0.51 0.45
Zooxanthellae density
zoox cm-2 2.58x10⁶ 9.85x10⁵ 3.17x10⁶ 7.69x10⁵ 0.32
Chlorophyll A per zooxanthella
μg zoox-1 1.81 0.67 1.54 0.67 0.57
4 Discussion
4.1 Coralgrowth:amatterofphotons?
No increase in specific growth rate was found with increasing irradiance or photoperiod.
Continuous lighting (24h 150 µE m-2 s-1:0h dark) resulted in immediate bleaching and
death after 14 weeks. The specific growth rate of these corals was significantly decreased
compared to the other treatments. Since previous studies demonstrated that growth of
scleractinian corals increases with increasing irradiance (Marubini et al. 2001; Reynaud-
Vaganay et al. 2001; Reynaud et al. 2004; Schutter et al. 2008), it can be concluded that
light was not limiting in this study. Rather it seems that light was in excess, since the corals
in the highest light treatment (300 µE m-2 s-1) exhibited a significantly lower specific growth
rate than the corals lowest light treatment (150 µE m-2 s-1). Obviously, the availability of
photons alone cannot enhance coral growth. Besides the amount of photons, also other
factors may play a role in determining coral growth rate. Factors known to be limiting for the
growth of stony corals are e.g. water flow (Lesser et al. 1994), aragonite saturation state
(Gattuso et al. 1998; Leclercq et al. 2000; Schneider and Erez 2006) and its associated
components (Marubini et al. 2008), the availability of essential trace metals such as copper
and zinc (Ferrier-Pagès et al. 2005) and/or the availability of essential nutrients such as

Photoperiod and photoacclimation
89
4
aspartic acid (Allemand et al. 1998a) that are mostly supplied by heterotrophic feeding
(Houlbreque and Ferrier-Pagès 2009). While factors known to have a inhibiting effect on
coral growth are e.g. elevated nutrient concentrations (Ferrier-Pagès et al. 2000; Fabricius
2005), increased iron concentration (Ferrier-Pagès et al. 2001), increased temperatures
(Jokiel and Coles 1990, Marshall and Clode 2004), competition (Rinkevich and Loya 1985,
Tanner 1995) and sedimentation (Rogers 1990). The fact that the specific growth rate of
G. fascicularis grown at 8h 150 µE m-2 s-1:16h dark was noticeably lower compared to G.
fascicularis grown at 10h 166 µE m-2 s-1:14h dark during a similar time period in a previous
study (0.0087 ± 0.0033 day-1 versus 0.0130 ± 0.0011 day-1, based on data Schutter et al.
(2008) suggests that one or more factors were limiting or inhibiting. However, the factor(s)
limiting or inhibiting coral growth in this study could not be conclusively determined.
4.2 Photo-acclimation to prolonged light duration under light-saturating
conditions
Since light was not limiting, corals in the 16 hour light treatment received excess light.
Despite receiving excess light, the corals in the 16 hour light treatment managed to retain
growth rates comparable to the corals in the 8 hour light treatment, i.e. there was no photo-
inhibition of growth. Therefore, some form of photo adaption must have played a role. Our
respirometric data demonstrate that the corals in the 16 hour light treatment adapted
to a longer photoperiod by decreasing the hourly rate of photosynthesis compared to
the corals in the 8 hour light treatment. As a result, daily net photosynthesis was not
significantly different between treatments, which is in agreement with their similar specific
growth rates. This result fits in the view that enhancement of calcification is mediated by
photosynthesis (Gattuso et al. 1999; Allemand et al. 2004), since neither growth nor daily
net photosynthesis were significantly different between the two treatments. However,
the daily P/R ratio was significantly different between treatments (1.59 ± 0.66 S.D for
16 hour light, 0.90 ± 0.44 S.D for 8 hour light), indicating that the corals in the 16 hour
light treatment potentially had more access to photosynthetic products translocated by
their zooxanthellae to satisfy their daily respiratory needs (Muscatine et al.1981) and to

Chapter 4
4
90
generate ATP that can be used for calcification. Despite having both a higher availability
of photosynthetic carbon (i.e. higher daily P/R ratio) and a longer time period during
which the intracellular saturation state of calcium carbonate is positively modified by
photosynthesis, this did not make a difference for the growth of the corals in the 16 hour
light treatment. This could be explained by an increasing need for defense mechanisms
(e.g. free radical scavenger enzymes, Levy et al. 2006) against harmful, reactive oxygen
species that are produced as a result of excess light in the 16 hour light treatment. The
increased availability of photosynthetic carbon might therefore have been allocated
towards defense mechanisms against photo-oxidative stress instead of skeletal growth,
explaining the absence of increased growth with increasing availability of photosynthetic
carbon. Energy allocation to photo-protective mechanisms remains to be studied in future
investigations.
Based on zooxanthellae density and chlorophyll content, it is not possible to distinguish
whether the adaption (photo-acclimation) to the longer light duration was host- or symbiont-
controlled, since neither differences in zooxanthellae density nor in chlorophyll content
were found. Generally, corals acclimate to increased light by regulating their light capture.
This can occur either by limiting light harvest and utilization of their photosystems (i.e. by
decreasing the amount of photosynthetic pigments per zooxanthellae, decreasing the
zooxanthellae density in polyp tissue, or increasing non-photochemical quenching) and/
or limiting light capture by self-shading of their photosynthetic surfaces (ie. by changes in
morphology and anatomy of coral colony) (Titlyanov et al. 2000; Anthony et al. 2005). Self-
shading can be either a morphological response (i.e. expressed in colony architecture,
long-term response) or a behavioral response (i.e. expressed as tissue retraction, short-
term response). Tissue retraction is often a response to stress, e.g. in response to sub-
aerial exposure, bright light or increased iron concentrations (Brown et al. 1991) and can
be expressed as polyp retraction or withdrawal of tentacles (Brown et al. 1994; Brown
et al. 2002). It is also known to occur in G. fascicularis (Brown et al. 1994). Since self-
shading does not involve the loss of either zooxanthellae or photosynthetic pigments
(Brown et al. 1994), it is possible that this occurred in the present study. Moreover, due
to the sudden change in light regime, the corals in the present study neither had the time

Photoperiod and photoacclimation
91
4
for morphological changes of the skeleton that normally occur during growth in a certain
light regime (Anthony et al. 2005). The reduced photosynthetic rates might therefore
be explained by lower light levels as a result of self-shading, and are hence host-
controlled. Tissue retraction is likely an effective mechanism to keep irradiance within
a physiologically optimal range, just like self-shading through morphological plasticity of
skeletal architecture (Anthony et al. 2005),
The mechanism to adapt to excess light might be the same for both excess light received
as irradiance and as light duration. In response to excess irradiance, in general corals
will engage in mechanisms for photo-protection and limit their light capture to prevent
photo inhibition, which in either way (limited light or photo-inhibition) will result in reduced
photosynthetic rates (Titlyanov et al. 2000; Anthony et al. 2005). The same was found
for excess irradiance as light duration. The only difference might be in the time of onset
of photo-adaptation or photo-inhibition, since if the irradiance itself is not stressful, the
amount of photons can accumulate to stressful amounts during the day. However, this
remains to be demonstrated.
The growth and physiological response of corals to increased light duration under light
limiting conditions remains to be investigated. The use of photosynthesis-irradiance
curves and/or PAM (pulse-amplitude modulation) measurements during day will provide
more insight into the photo-acclimative responses.
5 Conclusion
Coral growth is not only a matter of available photons. Under the given experimental
conditions, no positive correlation between light availability and growth was observed,
neither with increasing photoperiod, nor with increasing irradiance. This indicates that
light was not the limiting factor and was most probably in excess. Continuous lighting (24
h) resulted in immediate bleaching and finally death of the corals.
Corals were able to adapt to prolonged light duration under light saturating conditions by
decreasing their hourly rate of photosynthesis. As a result, daily net photosynthesis was
not significantly different between corals grown at 8 hours light and 16 hours light. This
Chapter 4
4
92
result fits in the view that enhancement of calcification is mediated by photosynthesis,
since neither growth nor daily net photosynthesis were significantly different between
the two treatments. Photoacclimation to prolonged photoperiod was not achieved by
changes in zooxanthellae density or chlorophyll content. It is proposed that the corals
exhibited a form of self-shading that reduced the amount of photons reaching the coral,
thereby reducing their photosynthetic rates and specific growth rates.
The growth and physiological response of corals to increased light duration under light
limiting conditions still remains to be investigated.
Acknowledgements
This research is part of the European CORALZOO project that aims at improving coral
husbandry techniques for sustainable coral breeding in zoo’s and public aquaria. In this
project, scientists and aquarists collaborate to provide a scientific basis for coral husbandry
techniques. We thank the staff of Burgers Ocean for their help in setting up the experiment.
This work was funded by the European Commission (Project CORALZOO-012547).


Chapter 5
Modification of light utilization for
skeletal growth by water flow
in the scleractinian coral Galaxea
fascicularis
Miriam Schutter1,2, Sander Kranenbarg3, René H. Wijffels2 , Johan Verreth1 and Ronald Osinga1
1 Aquaculture and Fisheries Group, Wageningen University, P.O. Box 338 6700 AH Wageningen, The Netherlands
2 Bioprocess Engineering, Wageningen University, PO Box 8129 , 6700 EV Wageningen, The Netherlands
3 Experimental Zoology, Wageningen University, P.O. Box 338 6700 AH Wageningen, The Netherlands
Chapter 5
96
6
5
Abstract
In this study we tested the hypotheses whether water flow stimulates (skeletal) growth more
at high irradiance than at intermediate irradiance, and whether such effect is mediated by
a water flow modulated effect on photosynthesis. Four series of nine nubbins of Galaxea
fascicularis were grown at either high (600 µE m-2 s-1) or intermediate (300 µE m-2 s-1)
irradiance in combination with either high (15-25 cm s-1) or low flow (5-10 cm s-1). Growth
was measured as buoyant mass and surface area. Photosynthetic rates were measured
at each coral’s specific experimental irradiance and flow speed. Water flow stimulated
(skeletal) growth more at high irradiance than at intermediate irradiance. Enhancement
of coral growth with either increasing water flow or increasing irradiance could not be
explained by net photosynthetic rates. Possibly, the need for costly photo-protective
mechanisms at low flow regimes can explain the differences in growth with flow.
Keywords: light, water flow, light-flow interaction, Galaxea fascicularis, skeletal growth,
photosynthesis

Interaction between light and flow
97
5
1. Introduction
Light and water flow are two of the most important factors influencing the growth of
scleractinian corals. Light stimulates coral growth by the process of light-enhanced
calcification (Gattuso et al. 1999; Allemand et al. 1998) which is mediated by zooxanthellar
photosynthesis. Consistent with this hypothesis, a higher photon flux density increases
net photosynthetic rate and long-term skeletal growth (Marubini et al. 2001; Reynaud-
Vaganay et al. 2001; Reynaud et al. 2004; Schutter et al. 2008). These increases might
be different at different flow velocities. Water flow reduces the diffusive boundary layer
around the coral. This layer acts as barrier to the supply and uptake of dissolved gasses,
nutrients and heterotrophic food but also as a barrier to the removal of sediment and
metabolic waste products such as oxygen, oxygen radicals and possibly mucus. Possibly
because one or more of the above mechanisms, increasing water flow rates correlate
with increased skeletal growth (Yokiel 1978; Montebon and Yap 1997; Sebens et al.
2003; Nakamuraet al. 2005).
Both abiotic factors have only been studied separately, while they might interact strongly
(Lesser et al. 1994). At high irradiance and with higher photosynthetic rates, there will
be a higher need for the removal of photosynthetically produced oxygen (Finelli et al.
2006; Finelli et al. 2007) and the supply of inorganic carbon (Lesser et al. 1994). Thus,
the thickness of the boundary layer needs to be smaller at higher irradiance than at lower
irradiance and consequently water flow needs to be higher at the higher irradiance level.
To investigate this interaction, the influence of water flow on light utilization for skeletal
growth of the scleractinian coral G. fascicularis was studied using a factorial design. To
test whether the observed effects on coral growth are related to the influence of water
flow on net photosynthesis, photosynthetic rates were determined of three coral colonies
from each experimental treatment by measuring them at their specific irradiance and flow
speed inside a respirometric flow cell.
Chapter 5
98
6
5
2. Material and Methods
2.1 Study species
Thirty-six (36) coral nubbins (single polyp clones) of G. fascicularis were created of
colonies that were grown at an irradiance of 60 µE m-2 s-1 (70W HQI) in a close-circuit
coral aquaculture system in Burgers Ocean, Arnhem, The Netherlands. Each coral nubbin
was fixed to a 7 x 7 x 0.4 cm PVC plate using Reef Construct (Aquamedic). Nine PVC
plates with coral nubbins were randomly fixed to each of four square pegboards. After
recovering for one week, they were transported to a 600 liter closed-circuit coral culture
system at Wageningen University.
2.2 Coral culture system
The coral culture system in Wageningen consisted of a 400 l aquarium and a 200 l sump
containing life rock. The system was connected to an ATI protein skimmer and a self-
assembled calcium reactor (6.2-6.4 pH, coral sand). Seawater was made up from Reef
Crystals®. Temperature was maintained at 26.1 ± 0.4 °C and salinity at 34.4 ± 1.5 ppt.
Water quality during experimental time was measured at regular intervals and maintained.
Alkalinity in the system over the course of the experiment was 3.3 ± 1.1 S.D. mEq l-1,
calcium concentration 388.1 ± 38.4 S.D. mg Ca2+ l-1, magnesium concentration 1348.8 ±
77.6 S.D. mg Mg2+ l-1, nitrate concentration between 0 and 2 mg NO3- l-1 and phosphate
concentration between 0 and 0.5 mg PO43- l-1.
2.3 Experimental setup
Each pegboard containing 9 nubbins was assigned to each of the following experimental
treatments: high irradiance x high flow (HI x HF), high irradiance x low flow (HI x LF),
intermediate irradiance x high flow (II x HF) and intermediate irradiance, low flow (II x LF).
During the experiment, the intermediate light regime was kept at an irradiance of approx. 300
µE m-2 s-1 and the high light regime was kept at an irradiance of approx. 600 µE m-2 s-1. Water
flow was kept between 15-25 cm s-1 for high flow, and between 5-10 cm s-1 for low flow.

Interaction between light and flow
99
5
Lighting was supplied using two ATI lighting armatures that each contained four 39 W
ATI Aquablue Spezial bulbs. A light:dark cycle of 12L:12D was applied. Irradiance was
measured using a Li-Cor 192SA quantum underwater sensor at the same distance from
the light source as the corals were located. A broad stream of unidirectional water flow
was created by connecting two Tunze TURBELLE ® nanostream 6055 pumps with a
perforated PVC pipe and controlled using a Tunze 7095 Multicontroller. A flow straightener
was placed after the first set of corals in the “high flow” treatment, so to reduce the flow
that reached the corals in the “low flow” treatment (Figure 1). Water flow was measured
in the absence of the corals by placing the SENSA RC-2 electro-magnetic velocity meter
(Aquadata) at the exact position of the corals. The corals were fed 7 days a week with
approx. 150.000 freshly hatched Artemia nauplii each day, yielding concentrations of 250
Artemia per liter in the rearing system.
Figure 1: Schematic drawing of the top view of the experimental setup of the light x flow experiment.
Water flow was created at the high flow side (thick arrows) and reduced by a flow straightener
to reach a lower flow rate at the low flow side (thin arrows). The lighting armatures were placed
perpendicular to the water streams.
Chapter 5
100
6
5
2.4 Growthparameters
Growth was measured as an increase in buoyant mass and surface area according to
Chapter 2. Determination of buoyant mass (known as “ the buoyant weighing technique”)
is a good method to measure skeletal growth, since coral tissue has a density which is
similar to that of seawater and therefore does not contribute significantly to the buoyant
mass of the coral. Tissue only comprises 1% of the total buoyant mass when tissue does
not penetrate deep into the skeleton (Davies 1989). Moreover, buoyant weighing is a
simple and non-destructive technique, allowing long-term monitoring of skeletal growth.
It should be noted that buoyant mass is not a good approximation of skeletal mass, since
the net upward buoyancy force (i.e. the weight of seawater displaced by the coral wehn
weighing it under water) will result in measuring only a fraction of the absolute mass (i.e.
a fractional mass). To convert buoyant mass into skeletal mass, one needs to know the
density of the seawater and the volume of the coral. Moroever, one needs to assume a
constant density of the coral skeleton during the experiment. However, for the purpose
of this study, knowledge of the magnitude of buoyant mass was sufficient to calculate
growth rates.
Surface area was measured as projected surface area. Pictures were taken perpendicular
to the coral directly inside the aquarium system using a Nikon Coolpix S1 5.1 mp digital
camera in a Nikon WP-CP5 underwater housing. Surface area was determined by image
analysis using ImageJ (1.37v) by tracing the live part of the coral colony. Since tentacle
extension is variable over time, no tentacles that were extending beyond the skeleton
were traced for surface area. Pictures were also taken of the coral nubbins before fixation
to their PVC plates. Specific growth rates were calculated using the formula:
SGR = ln (BMn/ BMn-1)/Δt [day-1]
where SGR is the specific growth rate (day-1), BMn is buoyant mass (or surface area)
at the end of the experiment, BMn-1 is buoyant mass (or surface area) at the start of the
experiment and ∆t is time between the measurements of buoyant mass.
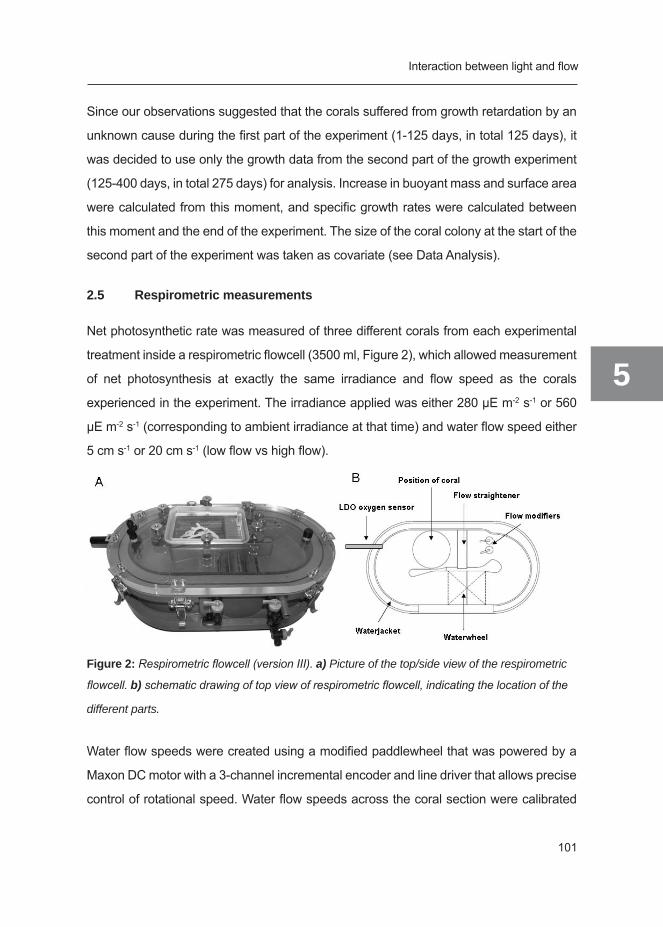
Interaction between light and flow
101
5
Since our observations suggested that the corals suffered from growth retardation by an
unknown cause during the first part of the experiment (1-125 days, in total 125 days), it
was decided to use only the growth data from the second part of the growth experiment
(125-400 days, in total 275 days) for analysis. Increase in buoyant mass and surface area
were calculated from this moment, and specific growth rates were calculated between
this moment and the end of the experiment. The size of the coral colony at the start of the
second part of the experiment was taken as covariate (see Data Analysis).
2.5 Respirometric measurements
Net photosynthetic rate was measured of three different corals from each experimental
treatment inside a respirometric flowcell (3500 ml, Figure 2), which allowed measurement
of net photosynthesis at exactly the same irradiance and flow speed as the corals
experienced in the experiment. The irradiance applied was either 280 µE m-2 s-1 or 560
µE m-2 s-1 (corresponding to ambient irradiance at that time) and water flow speed either
5 cm s-1 or 20 cm s-1 (low flow vs high flow).
Figure 2: Respirometric flowcell (version III). a) Picture of the top/side view of the respirometric
flowcell. b) schematic drawing of top view of respirometric flowcell, indicating the location of the
different parts.
Water flow speeds were created using a modified paddlewheel that was powered by a
Maxon DC motor with a 3-channel incremental encoder and line driver that allows precise
control of rotational speed. Water flow speeds across the coral section were calibrated

Chapter 5
102
6
5
using video recordings (30 fps, 480 x 860 pixels) of Artemia cysts (Ø max. 500 µm)
moving in a 5 mm light plane created by a slide projector with a slitted cover across the
lens. Video recordings were analyzed using a tailor-made program for particle tracing
in Matlab, which allowed less time-consuming and more efficient tracing of particles
across successive frames. Only particles that remained in the beam plane for 4 or more
successive frames were used for calculations. Lighting was provided by a T5 lighting
system (ATI) containing eight 24 W Aquablue Spezial bulbs. Irradiance was measured
submerged in seawater and underneath the plastic lid, at the exact same distance from
the light source for each coral.
Each incubation with a coral was preceded by a control incubation (seawater only). The
increase in oxygen concentration was measured every 10 seconds using a luminescent
oxygen probe (Hach) until a difference in concentration was detected of ±1 mg O2 l-1.
Seawater was replaced after each measurement with a coral, to prevent potential effects
of hyperoxia or hypoxia on the performance of the experimental corals and to remove
possible accumulated waste products.
Temperature inside the respirometric cell was maintained at 26 °C and salinity at 35
ppt. Surface area and volume were determined of each coral in order to normalize the
respirometric data. Photosynthetic and respiratory rates were calculated according to
Chapter 2.
2.6 Data analysis
Normality (p>0.05) and homogeneity of variance (p> 0.05) of the data were tested using
Shapiro-Wilk and Levene’s test in SAS 9.1. A two-way analysis of covariance (ANCOVA)
was used to test the main and interaction effects of light and water flow on the different
growth parameters, taking initial colony size as a covariate. Homogeneity of regression
was tested (p> 0.05) to make sure this assumption for ANCOVA was not violated. Post-
hoc comparisons were made using the bonferroni correction. Whenever a covariate was
found not to be significant, statistical differences were tested using a two-way ANOVA,
followed by multiple comparison using the bonferroni correction. The same approach was
followed for testing statistical differences in net photosynthetic rate.

Interaction between light and flow
103
5
3. Results
3.1 Growth
3.1.1 Increase in biomass
All corals grew during the experiment. Increase in buoyant mass and surface area was
highest in the high light x high flow treatment. Although buoyant mass and surface area of
the coral colonies at the start of this growth period accounted for a significant proportion
of the variation in growth (p<0.005), a significant interaction between irradiance and water
flow was found for both buoyant mass (p=0.0031) and surface area (p<0.0003) (Table 1,
Figure 3).
Table 1: ANCOVA interaction table giving the main effect of irradiance and flow and the interaction
effect between irradiance and flow (IxF) for increase in buoyant mass and surface area between
day 125 and day 400. Adjusted means ± S.E. are given for each experimental treatment. N=36. II
= intermediate irradiance, LF = low flow HF = high flow, HI= high irradiance.
Main effects Interaction effect
covariate effect Irradiance Flow I x F
p-value p-value p-value p-value
increase in buoyant mass 0.0018 <0.0001 <0.0001 0.0031
increase in surface area 0.0008 <0.0001 <0.0001 0.0003
light regimeII HI
flow rateLF HF LF HF
adj. means S.E. adj.
means S.E. adj. means S.E. adj.
means S.E.
increase in buoyant mass
(in mg) 1058.6 348.1 2537.1 292.2 2567.5 318.9 6108.4 297.6
increase in surface area
(in cm2) 3.42 1.64 13.38 1.49 9.03 1.54 31.92 1.49
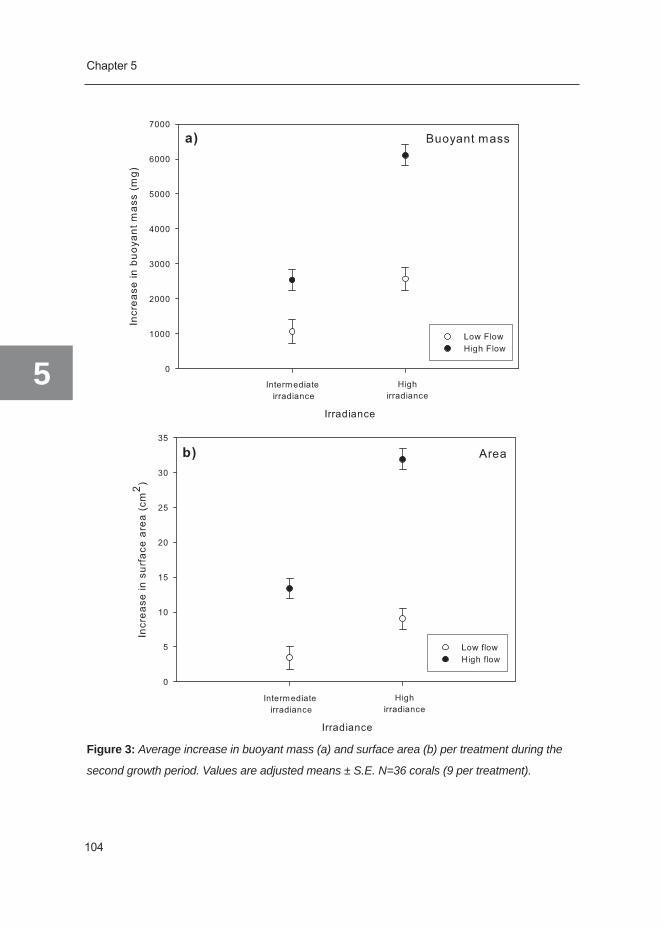
Chapter 5
104
6
5
Figure 3: Average increase in buoyant mass (a) and surface area (b) per treatment during the
second growth period. Values are adjusted means ± S.E. N=36 corals (9 per treatment).

Interaction between light and flow
105
5
At high irradiance, increasing water flow resulted in a significant increase in both buoyant
mass (p<0.0001) and surface area (p<0.0001). At intermediate irradiance, the effect
of increasing water flow also resulted in a significant increase in both buoyant mass
(p=0.017) and increase in surface area (p=0.0007). At low flow, increasing irradiance
resulted in a significant increase in buoyant mass (p=0.041), but no significant increase
in surface area (p=0.146). Whereas at high flow, increasing irradiance resulted both in a
significant increase in buoyant mass (p<0.0001) and surface area (p<0.0001) (table 2,
Figure 3). No significant difference in increase in biomass was found between high light x
low flow and intermediate light x high flow for either buoyant mass (p=1) or surface area
(p=0.2912).
Table 2: Results of the post hoc comparison test for the effect of light and flow on increase in
buoyant mass and increase in surface area. The percentage increase between treatments is also
given.
increase in
buoyant mass
increase in
surface areap-values % increase p-values % increase
effectflowat HI <0.0001 137.91 <0.0001 253.51at II 0.0172 139.66 0.0007 291.44
effect irradianceat HF <0.0001 140.76 <0.0001 138.60
at LF 0.0411 142.53 0.146 164.20
3.1.2 Specific growth rates
Specific growth rates were calculated over the second part of the growth experiment.
The buoyant mass of the coral colonies at the start of this growth period accounted for a
significant portion of variation in specific growth rate as buoyant mass (p=0.0120), while
surface area of the coral colonies at the start of this growth period did not significantly
influence the specific growth rate as surface area (p=0.7841). A significant interaction
was detected between irradiance and water flow for specific growth rate of buoyant mass
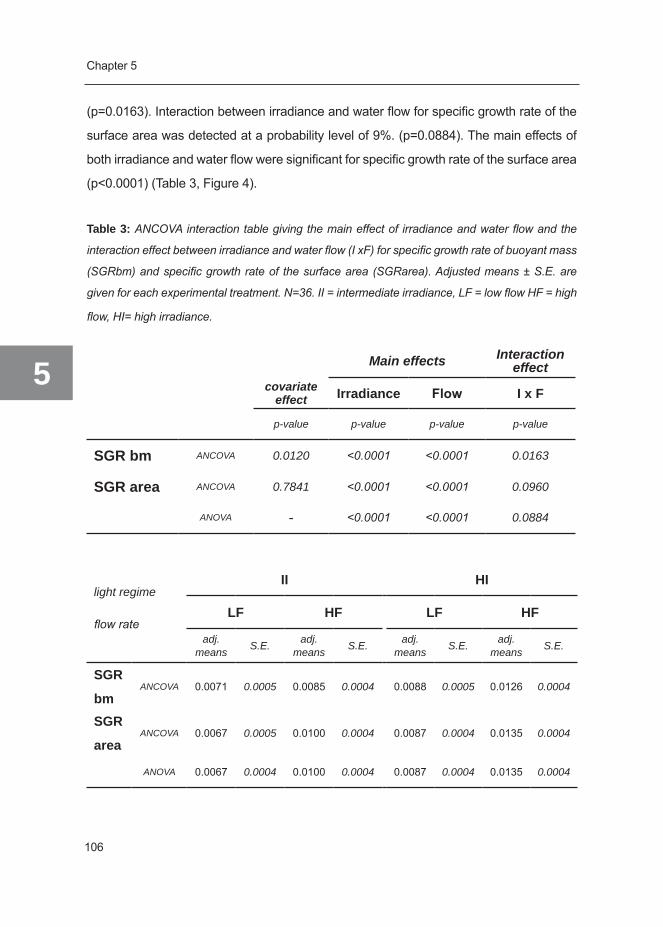
Chapter 5
106
6
5
(p=0.0163). Interaction between irradiance and water flow for specific growth rate of the
surface area was detected at a probability level of 9%. (p=0.0884). The main effects of
both irradiance and water flow were significant for specific growth rate of the surface area
(p<0.0001) (Table 3, Figure 4).
Table 3: ANCOVA interaction table giving the main effect of irradiance and water flow and the
interaction effect between irradiance and water flow (I xF) for specific growth rate of buoyant mass
(SGRbm) and specific growth rate of the surface area (SGRarea). Adjusted means ± S.E. are
given for each experimental treatment. N=36. II = intermediate irradiance, LF = low flow HF = high
flow, HI= high irradiance.
Main effects Interaction effect
covariate effect Irradiance Flow I x F
p-value p-value p-value p-value
SGR bm ANCOVA 0.0120 <0.0001 <0.0001 0.0163
SGR area ANCOVA 0.7841 <0.0001 <0.0001 0.0960
ANOVA - <0.0001 <0.0001 0.0884
light regimeII HI
flow rateLF HF LF HF
adj. means S.E. adj.
means S.E. adj. means S.E. adj.
means S.E.
SGR
bm ANCOVA 0.0071 0.0005 0.0085 0.0004 0.0088 0.0005 0.0126 0.0004
SGR
areaANCOVA 0.0067 0.0005 0.0100 0.0004 0.0087 0.0004 0.0135 0.0004
ANOVA 0.0067 0.0004 0.0100 0.0004 0.0087 0.0004 0.0135 0.0004

Interaction between light and flow
107
5
Specific growth rate of buoyant mass was highest in the high irradiance x high flow
treatment, compared to all other treatments (p<0.0001). Higher water flow resulted in a
significantly higher specific growth rate of buoyant mass at high irradiance (p<0.0001,
43.7% increase), but this increase was not significant at intermediate irradiance (p=0.2987,
19.6% increase). Higher irradiance also resulted in a significantly higher specific growth
rate of buoyant mass at high flow (p<0.0001, 48% increase), but this increase was not
significant at low flow (p=0.2548, 23.2% increase).
Specific growth rate of the surface area showed a similar picture, although in contrast
to specific growth rate of buoyant mass, all differences were significant. Specific growth
rate as surface area was highest in the high irradiance x high flow treatment, compared
to all other treatments (p<0.0001). Higher water flow resulted in a significant higher
specific growth rate of surface at both high irradiance (p<0.0001, 55.6% increase) and
intermediate irradiance (p<0.0001, 48.9% increase). Higher irradiance also resulted in
a significant higher specific growth rate of the surface area at both high flow (p<0.0001,
34.7%) and low flow (p<0.0084, 28.9%) (Table 4).
No significant difference in specific growth rate is found between high irradiance x low
flow and intermediate irradiance x high flow for either buoyant mass (p=1) or surface area
(p=0.1784) (not shown in Table).
Table 4: Results of the post hoc comparison test for the effect of irradiance and flow on specific
growth rate of buoyant mass (SGR bm) and specific growth rate of the surface area (SGR area).
The percentage increase of growth rates is also given.
SGRbm SGRarea
p-values % increase p-values % increaseeffectflow
at HI <0.0001 43.7 <0.0001 55.6at II 0.2987 19.6 <0.0001 48.9
effect irradianceat HF <0.0001 48.0 <0.0001 34.7
at LF 0.2548 23.2 0.0084 28.9

Chapter 5
108
6
5
Figure 4: Interaction plot for the effect of irradiance and water flow on a) specific growth rate
of buoyant mass, and b) specific growth rate of the surface area. Values are adjusted means ±
S.E.. N=36 corals (9 per treatment).
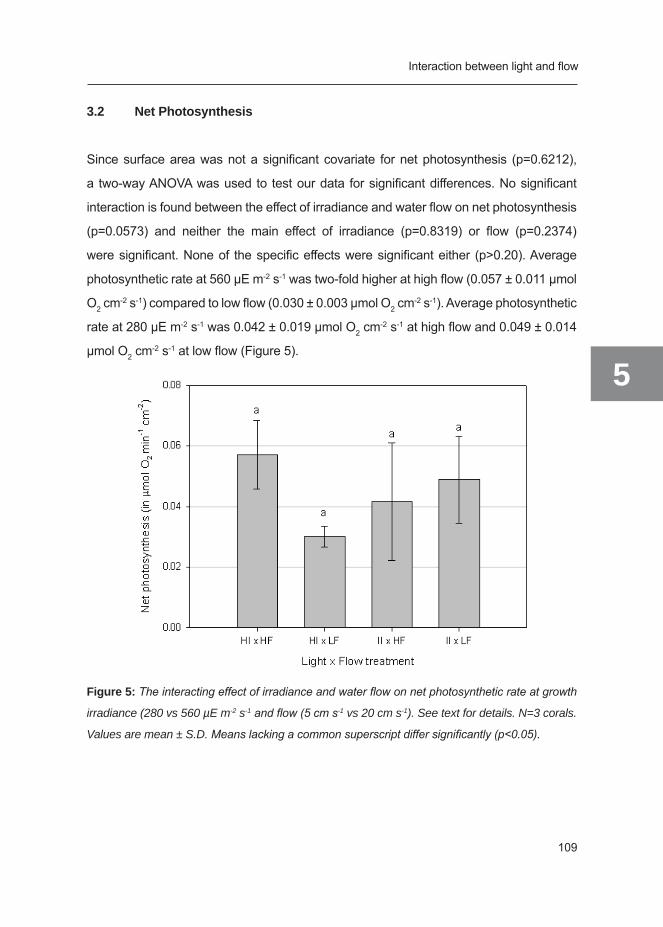
Interaction between light and flow
109
5
3.2 Net Photosynthesis
Since surface area was not a significant covariate for net photosynthesis (p=0.6212),
a two-way ANOVA was used to test our data for significant differences. No significant
interaction is found between the effect of irradiance and water flow on net photosynthesis
(p=0.0573) and neither the main effect of irradiance (p=0.8319) or flow (p=0.2374)
were significant. None of the specific effects were significant either (p>0.20). Average
photosynthetic rate at 560 µE m-2 s-1 was two-fold higher at high flow (0.057 ± 0.011 µmol
O2 cm-2 s-1) compared to low flow (0.030 ± 0.003 µmol O2 cm-2 s-1). Average photosynthetic
rate at 280 µE m-2 s-1 was 0.042 ± 0.019 µmol O2 cm-2 s-1 at high flow and 0.049 ± 0.014
µmol O2 cm-2 s-1 at low flow (Figure 5).
Figure 5: The interacting effect of irradiance and water flow on net photosynthetic rate at growth
irradiance (280 vs 560 µE m-2 s-1 and flow (5 cm s-1 vs 20 cm s-1). See text for details. N=3 corals.
Values are mean ± S.D. Means lacking a common superscript differ significantly (p<0.05).

Chapter 5
110
6
5
4. Discussion
4.1 Growth
A significant interaction was found between irradiance and water flow for increase in
buoyant mass and increase in surface area. Similarly, a significant interaction was
found between irradiance and water flow for specific growth rate of buoyant mass. The
interaction between irradiance and water flow for specific growth rate of the surface area
was not significant at the 5% probability level, but reached significance at a probability
level of 9%. Water flow stimulated growth more at high irradiance than at intermediate
irradiance, in agreement with our hypothesis. Growth as surface area was consistently
much higher than growth as buoyant mass. Since our aquarium system was dominated
by crustose coralline algae, this higher rate of surface area growth could be explained by
the lack of competition with nuisance/turf algae which allowed the corals to grow more in
the periphery.
Interaction between irradiance and water flow was hypothesized to be the result of a
limiting effect of low water flow at higher irradiance levels. Indeed, the limiting effect of low
water flow becomes obvious when comparing the specific growth rates of corals cultured
at high irradiance (600 µE m-2 s-1) and low flow conditions with intermediate irradiance (300
µE m-2 s-1) and high flow conditions. Despite having a two-fold difference in irradiance, the
specific growth rates at high light x low flow are comparable to the specific growth rates
at intermediate light x high flow. Low water flow can limit growth by several mechanisms:
1) limitation of nutrient and/or gas transport (Lesser et al. 1994), and/or 2) inhibition of
metabolism as a result of accumulation of oxygen and/ or oxygen radicals, accompanied
with light stress (Nakamura et al. 2005; Finelli et al. 2006; Finelli et al. 2007). Light stress
reduces coral growth due to energy allocation to (costly) stress responses (Anthony et al.
2002) such as the synthesis of heat shock protein and protecting pigments, 3) reduced
photosynthetic rates as a result of oxidative stress (Lesser 1996; Nakamura and Van
Woesik 2001; Finelli et al. 2006), potentially impairing light-enhanced calcification, 4)
decreased encounter rate of potential food particles (Sebens et al. 1997), and 5) increased
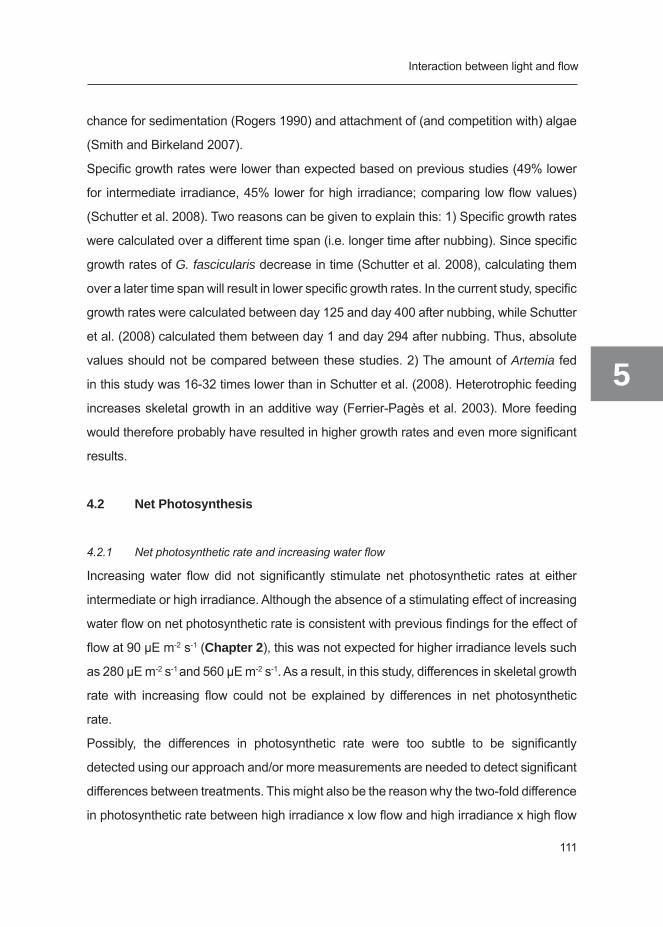
Interaction between light and flow
111
5
chance for sedimentation (Rogers 1990) and attachment of (and competition with) algae
(Smith and Birkeland 2007).
Specific growth rates were lower than expected based on previous studies (49% lower
for intermediate irradiance, 45% lower for high irradiance; comparing low flow values)
(Schutter et al. 2008). Two reasons can be given to explain this: 1) Specific growth rates
were calculated over a different time span (i.e. longer time after nubbing). Since specific
growth rates of G. fascicularis decrease in time (Schutter et al. 2008), calculating them
over a later time span will result in lower specific growth rates. In the current study, specific
growth rates were calculated between day 125 and day 400 after nubbing, while Schutter
et al. (2008) calculated them between day 1 and day 294 after nubbing. Thus, absolute
values should not be compared between these studies. 2) The amount of Artemia fed
in this study was 16-32 times lower than in Schutter et al. (2008). Heterotrophic feeding
increases skeletal growth in an additive way (Ferrier-Pagès et al. 2003). More feeding
would therefore probably have resulted in higher growth rates and even more significant
results.
4.2 Net Photosynthesis
4.2.1 Net photosynthetic rate and increasing water flow
Increasing water flow did not significantly stimulate net photosynthetic rates at either
intermediate or high irradiance. Although the absence of a stimulating effect of increasing
water flow on net photosynthetic rate is consistent with previous findings for the effect of
flow at 90 µE m-2 s-1 (Chapter 2), this was not expected for higher irradiance levels such
as 280 µE m-2 s-1 and 560 µE m-2 s-1. As a result, in this study, differences in skeletal growth
rate with increasing flow could not be explained by differences in net photosynthetic
rate.
Possibly, the differences in photosynthetic rate were too subtle to be significantly
detected using our approach and/or more measurements are needed to detect significant
differences between treatments. This might also be the reason why the two-fold difference
in photosynthetic rate between high irradiance x low flow and high irradiance x high flow
Chapter 5
112
6
5
(0.030 ± 0.003 versus 0.057 ± 0.011 µmol O2 cm-2 min-1) was not significant using a two-
way ANOVA. A decreased photosynthetic rate at high irradiance x high flow is plausible,
since oxygen accumulation within coral tissues under these conditions is thought to result
in photo-inhibition of photosynthesis (Lesser 1996; Nakamura and van Woesik 2001;
Finelli et al. 2006). Further research is needed to validate whether increased growth
rates with increasing flow at high irradiance are the result of the effect of flow on net
photosynthesis.
A second explanation for the differences in skeletal growth is the occurrence of oxidative
stress and subsequent need for photo-protection. Photo-protective mechanisms (e.g.
Asada 1999; Leggat et al. 1999; Shick and Dunlap 2002) are likely to be energetically
costly (Finelli et al. 2006; Hoogenboom et al. 2009). Possibly, more energy is allocated
to photo-protective mechanisms in the high irradiance x low flow treatment, resulting in
lower growth rates compared to the corals in the high irradiance x high flow treatment. It is
therefore likely that increased flow rates lead to increased coral growth at high irradiance
levels through the relief of oxidative stress. Possibly, increased heterotrophic feeding
(e.g. Artemia and/or dissolved organic matter) and/or nutrient uptake with increasing flow
(Sebens et al. 1997; Atkinson and Billiger 1992) also played a role. Kaandorp et al. (2005)
demonstrated the role of (hydro-dynamically created) gradients of inorganic carbon and
nutrients in controlling coral growth and morphology using diffusion–dominated computer
models. The importance and contribution of these factors should to be quantified in future
experimental research.
4.2.2 Net photosynthetic rate and increasing irradiance
Increasing irradiance also did not significantly stimulate net photosynthetic rates at either
low or high flow rates. Net photosynthetic rates could therefore not explain differences
in growth with increasing irradiance. This is in contradiction with the light-enhanced
calcification hypothesis that assumes that the enhancement of calcification is mediated
by photosynthesis (Allemand et al. 2004; Schutter et al. 2008). Schutter et al. (2008)
demonstrated a positive relationship between specific growth rate and net photosynthesis
for G. fascicularis. However, these findings were based on a (short-term) photosynthesis-

Interaction between light and flow
113
5
irradiance curve, which is possibly different from photosynthetic measurements of corals
that are long-term adapted to a certain irradiance. Corals are known to optimize their net
photosynthetic rate in order to minimize losses in their metabolic activity (Titlyanov and
Titlyanova 2002b). It is therefore possible that the net photosynthetic rates of both the
corals at 280 µE m-2 s-1 and at 560 µE m-2 s-1 were optimized to similar rates. Moreover,
differences in net photosynthetic rate are likely so subtle that significance of measurement
is not easily reached.
Besides photosynthesis, the most important factor likely to be co-responsible for increased
growth with increasing irradiance is light respiration. Light respiration occurs in the light and
is generally much higher than dark respiration due to the presence of photosynthetically
produced oxygen and possibly also due to the direct use of translocated photosynthetically
fixed carbon. Gross photosynthesis is postulated to be much higher at higher irradiance,
but after subtracting the postulated increased light respiration at higher irradiance, the
resulting net photosynthesis might be the same (postulated according to Al-Horani et al.
2003a, Figure 6). Light respiration results in a higher availability of metabolic CO2, which
is the major form of dissolved inorganic carbon that is used for calcification (70%, Furla
et al. 2000).
Figure 6: Postulated effect of irradiance on gross photosynthesis (Pgross), light respiration (Rlight)
and net photosynthesis (Pnet), based on Al-Horani et al. 2003a.
Chapter 5
114
6
5
The phototrophic enhancement of coral growth with increasing irradiance (i.e. light-
enhanced calcification) might thus not only be related to increased (net) photosynthesis,
but also to light respiration. A limited number of studies on light respiration in corals is
known, since it requires sophisticated techniques such as oxygen microsensors (Al-
Horani et al. 2003a) or other methods that can separate respiratory fluxes from concurrent
photosynthetic fluxes (e.g. oxygen isotopes (18O) (Grande et al. 1991). To the best of our
knowledge, the enhancement of light respiration with increasing irradiance has not been
studied in scleractinian corals. However, a positive relationship between irradiance and light
respiration has been found for several phytoplankton species (Lewitus and Kana 1995).
Nevertheless, differences in light respiration are not likely to explain the interaction between
irradiance and water flow. Since photosynthesis is postulated to supply the coral with more
oxygen and carbon compounds for respiration than water flow, the enhancing effect of
water flow on light respiration is postulated to be small compared to the enhancing effect
of irradiance. The most likely mechanism for the interaction between irradiance and water
flow is the reduction of oxidative stress and costs associated with photo-protection with
increasing water flow.
5. Conclusion
Water flow enhances coral growth both at intermediate and high irradiance. The importance
of flow is demonstrated at high irradiance levels, since coral growth at high irradiance x low
flow is comparable or even less than coral growth at lower irradiance levels. Thus, water
flow is of increasing importance to coral growth with increasing irradiance levels.
The enhancement of coral growth with either increasing flow or increasing irradiance could
not be explained by a corresponding change in photosynthetic rate. It is postulated that
photosynthetic rates were optimized in each treatment, but that a significant amount of
(photosynthetic) energy was allocated to photo-protective mechanisms and the response
to oxidative stress in the low flow treatments. Enhancement of coral growth with increasing
water flow would therefore be related to the relieve of oxidative stress. The potential effect
of light respiration needs further study.
Interaction between light and flow
115
5
Acknowledgements
This research is part of the European CORALZOO project that aims at improving coral
husbandry techniques for sustainable coral breeding in zoo’s and public aquaria. In
this project, scientists and aquarists collaborate to provide a scientific basis for coral
husbandry techniques. This work was funded by the European Commission (Project
CORALZOO-012547). We thank Eric Karruppannan, Evert Janssen and VINK
kunststoffen B.V. for helping us with the design and construction of the respirometric
flowcell. All procedures described herein comply with current laws of the Netherlands.
The authors declare that they have no conflict of interest.

Chapter 6
The biology and economics of coral
growth
Ronald Osinga1, Miriam Schutter1,2, Ben Griffioen1, René H. Wijffels2, Johan A. J. Ver-
reth1, Shai Shafir3, Stéphane Henard4, MauraTaruffi5, Sylvia Lavorano5
1 Aquaculture and Fisheries, Wageningen University, P.O. Box 338, 6700 AH Wageningen, The
Netherlands
2 Bioprocess Engineering, Wageningen University, PO Box 8129 , 6700 EV Wageningen, The
Netherlands
3 Israel Oceanographic and Limnological Research, National Institute of Oceanography, Tel Shik-
mona, P.O. Box 8030, Haifa 31080, Israel
4 NAUSICAA, Centre National de la Mer, PO Box 189, 62203 Boulogne-sur-Mer Cedex, France
5 Acquario di Genova, Ponte Spinola, Area Porto Antico, Genova 16100, Italy
Chapter 6
6
118
Abstract
To protect natural coral reefs, it is of utmost importance to understand how the growth of
the main reef-building organisms - the zooxanthellate scleractinian corals - is controlled.
Understanding coral growth is also relevant for coral aquaculture, which is a rapidly de-
veloping business. This review paper provides a comprehensive overview of factors that
can influence the growth of zooxanthellate scleractinian corals, with particular empha-
sis on interactions between these factors. Furthermore, the kinetic principles underlying
coral growth are discussed. The reviewed information is put into an economic perspective
by making an estimation of the costs of coral aquaculture.
Keywords:corals, growth, aquaculture, zooxanthellate Scleractinia
Biology and economics of coral growth
119
6
1 Introduction
Being the main builders of coral reefs, zooxanthellate scleractinian corals (i.e. calcifying
corals that live in symbiosis with microalgae – the zooxanthellae) are of crucial
importance for marine ecology. In addition, coral reefs represent a high economic value
as a source of food (Bryant et al 1998) and natural products (Fusetani 2000), by being
an attractive resource for tourism (Bryant et al. 1998) and by forming a natural protection
of coastlines. It has been estimated that approximately 10% of the world’s population is
directly or indirectly depending on coral reefs. However, reefs are currently under high
pressure, mainly caused by anthropogenic disturbances such as overfishing, pollution,
eutrophication and human-induced climate change (Hughes et al. 2003). Also the trade
in aquarium ornamentals has increased in the last decades, and is now also becoming
a threat for natural populations of reef organisms including scleractinian corals (Wabnitz
et al. 2003; Knittweis et al. 2009). This has resulted in an increased effort to develop
cost-effective in situ (sea-based) and ex situ (aquarium) coral aquaculture methods.
An example of this is the CORALZOO project, in which scientists and public aquaria
collaborated to improve techniques for breeding and husbandry of scleractinian corals
(Osinga 2008).
To understand reef development in a changing environment, it is crucial to identify
the factors that determine the growth rates of corals and to understand how these
factors interact. The same knowledge is needed for efficient breeding of corals ex situ.
Furthermore, in this respect, it is important to understand the kinetics of coral growth,
which determines how proliferation of biomass develops in time.
This mini-review presents an overview of studies describing effects of environmental
factors on coral growth rates. Based on this overview, we will try to explain how coral
growth is controlled. Our views will be further supported by new experimental data obtained
during the CORALZOO project, which have not been published elsewhere. Secondly, we
will discuss the kinetic principles underlying coral growth. Finally, the information will be
put into an economic perspective: the costs of coral culture will be analyzed in the view of
the biological information provided.

Chapter 6
6
120
2 Thecoralgrowthprocess
Zooxanthellate Scleractinia represent a true symbiosis. The coral provides shelter
and nutrients to the algae, while the algae translocate a substantial proportion of
their photosynthetically acquired organic carbon to the coral host. The translocated
photosynthetates are used by the host for respiration and biomass buildup (Muscatine
and Cernichiari 1969; Muscatine 1990). The coral also acquires organic carbon through
feeding on a wide range of particulate and dissolved organic materials (reviewed by
Houlbrèque and Ferrier-Pagès 2009). A third important characteristic of scleractinian
corals is that they form massive calcium carbonate skeletons through a process called
“calcification” (see review by Gattuso et al. 1999). To enable calcification, scleractinian
corals synthesize an organic matrix around which calcium carbonate is deposited
(Allemand et al. 1998). For a more detailed description of the physiology of zooxanthellate
corals, we refer to reviews by Muscatine (1990), Dubinsky and Jokiel (1994), Titlyanov
and Titlyanova (2002b) and Furla et al. (2005).
3 Factorsinfluencingcoralgrowth
Taking into account the three major physiological processes described above
(photosynthesis, heterotrophic feeding and calcification), the following basic requirements
(building blocks) for coral growth can be identified: light, carbon dioxide (CO2) and inorganic
nutrients (needed for photosynthesis); organic food (needed for organic tissue synthesis
and organic matrix synthesis); calcium and carbonate ions (Ca2+ and CO32-, needed for
skeleton formation). In addition to these basic requirements, water movement (flow) is an
important factor facilitating coral metabolism. Flow enhances the exchange of gases (O2,
CO2) and dissolved compounds (nutrients, metabolic waste products) between the coral
and its environment. Hence, insufficient flow may lead to depletion of resources and/or
accumulation of inhibiting substances.
Several other factors have been reported to influence coral growth, either positively or
negatively. These factors include temperature and pH (Reynaud et al. 2003; Langdon and
Biology and economics of coral growth
121
6
Atkinson 2005; Anthony et al. 2008), iron (Ferrier-Pagès et al. 2001), zinc (Ferrier-Pagès
et al. 2005), competition and predation (Fabricius 2005 and references therein), pollution
(Jones 2005; Haapkylä et al. 2007; Danovaro et al. 2008), sedimentation (Van Katwijk et
al. 1993; Torres 2001, Fabricius 2005), UV radiation (Jokiel and York 1982; Kuffner 2001;
Torres et al. 2007), and dissolved oxygen (DO). Despite its key role in metabolism, very
few scientists have investigated the potential role of DO as a growth-controlling agent for
corals, probably due to the technical complexity of working under low DO concentrations.
Rinkevich and Loya (1984) found that aeration of the water significantly enhanced
dark calcification in Stylophora pistillata. They suggested that under non-aerated
conditions, dark calcification in this species was limited by low DO due to the absence of
photosynthesis. Fossil records suggests that reductions in DO concentrations were one
of the causes of prehistoric mass extinction events of Scleractinia (Van de Schootbrugge
et al. 2007). In addition to being a potentially limiting factor, high DO concentrations inside
coral tissue are assumed to have a negative effect on coral metabolism (Lesser 1997,
Finelli et al. 2006).
In the following subsections, we will more extensively review studies on the primary
requirements for coral growth: light, inorganic nutrients, food, dissolved inorganic carbon
(DIC, which includes carbon dioxide, bicarbonate and carbonate), calcium and water
flow. We will also discuss the role of genetic variability.
3.1 Light
There is no doubt that light plays an important role in the growth of zooxanthellate corals.
The coral host is very well adapted to facilitate light capture by its symbiontic algae due to
the optimal light reflecting properties of the calcium carbonate skeleton: multiple scattering
on coral skeletons enhances light absorption by symbiotic algae (Enriquez et al. 2005).
Photon Flux Density (PFD, also known as irradiance) and growth/calcification are often
positively correlated (Goreau 1959; Chalker 1981; Marubini et al. 2001; Reynaud et al. 2004;
Schlacher et al. 2007; Schutter et al. 2008). Although a direct stimulation of calcification by
light was suggested by Al-Horani et al. (2003a), it is important to realize that the corals
themselves are mainly indirectly influenced by light, whereas the zooxanthellae can be

Chapter 6
6
122
directly light-limited. Light-related growth limitation in corals may have three causes: I.
Insufficient production of photosynthates (Titlyanov et al 2001). II. Insufficient translocation
of photosynthates, for example after enrichment of seawater with inorganic nutrients
(Marubini and Davies 1996, see also section on nutrients below). III. A decrease of the
internal pH due to lower photosynthesis, leading to less favorable conditions for calcification
(Schneider and Erez 2006). In addition, light may become inhibiting at high photon flux
densities. After long exposure to high PFD, the increase in maintenance energy required to
repair the light-induced damage to the photosystem will exceed the gain in photosynthetic
energy, leading to a retarded growth (photoinhibition, Iglesias-Prieto et al. 1992).
The coral-zooxanthellae holobiont adjusts its photosynthetic potential to the prevailing
environmental conditions. Such photoacclimation is achieved either by increasing/
decreasing the number of zooxanthellae per cm2 of coral surface (probably a host-
controlled mechanism: adaptive bleaching – Kinzie III et al. 2001; Fautin and Buddemaier
2004) or by adjusting the pigment density (a zooxanthellae-controlled mechanism). Both
processes occurred simultaneously within a period of 30 days after transplanting fragments
of Stylophora pistillata from high to intermediate PFD and from intermediate to low PFD
(Titlyanov et al. 2001). In addition, also the pigment composition of the zooxanthellae is
variable and adjusted to the available spectrum of light (Dustan 1982).
The in hospite photosynthetic potential of zooxanthellae in corals is usually determined
by measuring a Photosynthesis/Irradiance (PI) curve (Figure 1). PI curves can either
be obtained using direct assessment of electron transport rates (ETR) as a measure
for photosynthesis using Pulse-Amplitude Modulated fluorometry (PAM, e.g. Ulstrup et
al. 2006) or indirectly from oxygen evolution measurements. Oxygen-based PI curves
provide characteristic numbers such as the compensation point (i.e. the irradiance at
which photosynthetic oxygen production equals respiratory oxygen consumption) and the
saturation point Ik (the point on the X-axis of the curve where the initial, linear slope of the
curve intersects with the horizontal asymptote resembling maximal photosynthesis – see
Fig 1. This point is also referred to as Talling index (Barnes and Chalker 1990). Due to
photoacclimation, specimen of the same species growing under different light regimes may
show different PI curves (Figure 1).

Biology and economics of coral growth
123
6Figure 1: Photosynthesis/Irradiance curves of Galaxea fascicularis based on oxygen evolution
measurements (methodology according to Schutter et al. 2008, corals were incubated in 1500 cm3
incubation chambers equipped with a magnetic stirrer). The two curves each represent averages
of two groups of four colonies that had been raised under 300 (solid line) and 600 (dotted line),
respectively. The Talling index Ik is indicated for both curves.
Corals raised under low light may exhibit the same rate of net photosynthesis as corals
growing under high light. Hence, to assess the PFD at which light becomes limiting, it is
better to use a normalized PI curve, based upon measurements done on corals only at
their ambient PFD. The saturation point of such a normalized curve represents a species
specific saturation point (hereinafter referred to as Iks), below which photoacclimation
cannot longer compensate for the reduced influx of photons. Iks may vary as a result of
variability in other environmental conditions such as the flow regime around the corals
and the availability of inorganic nutrients and food (see next subsections).
Chapter 6
6
124
3.2 Inorganic nutrients
Both partners of the coral-zooxanthellae holobiont need nitrogen (N) and phosphorous
(P) as building blocks for synthesis of proteins and other biomass components. Whereas
the zooxanthellae can directly take up N and P in their inorganic forms (Dissolved
Inorganic Nitrogen – DIN and Dissolved Inorganic Phosphorous - DIP), the coral host
acquires its N and P through heterotrophic feeding (see Section 3.4) and via translocated
organic substances produced by the zooxanthellae. According to Falkowski et al. (1984),
translocated substances can become very low in nitrogen when the zooxanthellae are
DIN-limited. They introduced the term “junk food” to describe the low-N organic excretion
products of N-limited zooxanthellae: these substances only provide the coral host with
metabolic energy, and not with nitrogen-rich building blocks needed for biosynthesis. It
was suggested that the coral host expels the majority of this “junk food” as mucus.
Following this “junk food hypothesis”, it seems logic to assume that addition of DIN
can promote coral growth. Many authors have reported that addition of DIN promotes
zooxanthellae growth and augments the pigment production of the zooxanthellae thus
stimulating the overall net photosynthesis rates of the holobiont (Hoegh-Guldberg and
Smith 1989; Dubinsky et al. 1990; Stambler et al. 1991, 1994; Marubini and Davies 1996;
Marubini and Thake 1999; Ferrier-Pagès et al. 2000, 2001; Grover et al. 2002; Langdon
and Atkinson 2005; Tanaka et al. 2007), although the photosynthesis rate per algal cell
can decrease due to self-shading effects (Dubinsky et al. 1990). Most of these authors
(Stambler et al. 1991, Marubini and Davies 1996, Marubini and Thake 1999; Ferrier-
Pagès et al. 2000, 2001; Langdon and Atkinson 2005; Tanaka et al. 2007) also tested the
effects of DIN addition on skeletal growth of the corals, which was inhibited by DIN, or
(in the case of moderate nitrate enrichment - Tanaka et al. 2007) only slightly elevated.
Both forms of DIN applied (nitrate and ammonium) imposed a similar effect on corals
(Marubini and Davies 1996). In general, it can be concluded that raising the external
DIN concentration above ambient natural concentrations does not promote coral growth.
Apparently, coral growth is not limited by DIN under ambient natural DIN concentrations.
Grover et al. (2002) suggested an external concentration of ammonium as low as 0.6 µM
Biology and economics of coral growth
125
6
to be sufficient for sustaining zooxanthellae growth.
To explain the observed inhibition of skeletal growth by elevated [DIN], it has been
suggested that DIN enrichment disrupts the delicate balance between host metabolism
and zooxanthellae metabolism that is needed for optimal functioning of the symbiosis
(e.g. Marubini and Davies 1996). It is important to note here that the studies describing
effects of DIN-enrichment have all been done under relatively high irradiance levels (200
μE m-2 s-1 and higher), i.e. under conditions where light is not likely to be limiting. DIN
addition under low light (i.e. below Iks) is not expected to have any direct effect on either
the zooxanthellae or the coral.
Some studies on nutrient enrichment (eutrophication) on natural coral reefs (see reviews by
Dubinsky and Stambler 1996 and Fabricius 2005) confirm the experimental observations
described above (e.g. Kinsey and Davies 1979; Tomascik and Sander 1985; Tomascik
1990; Koop et al. 2001). However, other studies showed a positive correlation between
eutrophication and coral growth (Meyer and Schultz 1985; Grigg 1995; Bongiorni et al.
2003a,b). The conflicting results can be ascribed to indirect effects of DIN/DIP enrichment.
Enrichment will lead to higher concentrations of particulate and dissolved organic matter
in the water column, which may enhance coral growth (by providing additional food) in
free-floating nurseries (Bongiorni et al. 2003a,b) and in coral reefs subjected to high water
movement (Fabricius 2005). High particle loads may inhibit coral growth in more stagnant
waters due to increased sedimentation (Genin et al. 1995). Eutrophication also indirectly
affects coral growth by stimulating the growth of turf algae that compete for space with
corals (Genin et al. 1995; Fabricius 2005).
Most studies describing effects dissolved inorganic phosphate (DIP) on corals show that
DIP negatively affects coral growth, in particular when supplied without a corresponding
increase in DIN (Snidvongs and Kinzie III 1994; Ferrier-Pagès et al. 2000). The negative
effect of elevated DIP may be caused by the formation of poisonous polyphosphate
crystals (Simkiss 1964). There is also a record of DIP-limitation in zooxanthellate corals:
Steven and Broadbent (1997) found increased growth of Acropora palifera after pulsed
additions of phosphate, with or without concurrent enrichment in nitrate. A good overview
of studies relating to effects of both DIN and DIP is presented by Fabricius (2005).
Chapter 6
6
126
In addition to DIN and DIP, iron and zinc have been reported as agents that influence
coral growth. Iron enrichment can have effects on the coral-zooxanthellae symbiosis that
are comparable to DIN enrichment (Ferrier-Pagès et al. 2001). The role of zinc in coral
growth and metabolism has been clearly outlined in another paper by Ferrier-Pagès et
al (2005). Zinc is an essential structural component of many enzymes, among which
carbonic anhydrase (CA). CA is an ubiquitous enzyme in corals; it is involved in the uptake
of Dissolved Inorganic Carbon. As such, CA plays a key role in both photosynthesis and
calcification and therefore, zinc limitation may limit overall coral growth. Reversely, high
zinc concentrations may inhibit coral growth due to the formation of toxic free radicals,
which have been reported to inhibit microalgae growth (Sunda 1991).
3.3 Bicarbonate, carbonate, calcium and pH: the aragonite saturation state
In order to calcify, corals need Ca2+ and CO32-. Ca2+ and CO3
2- are commonly referred to as
Ω, the aragonite saturation state, which is the temperature dependent solubility product of
aragonite (Mucci 1983). Aragonite is the chrystalline form of calcium carbonate produced
by corals. Both Ca2+ ions and CO32- ions are actively concentrated in the calicoblastic
fluid (this is a thin liquid layer between the skeleton and the calicoblastic cells, the
cellular layer that secretes the organic matrix of the skeleton) to facilitate precipitation
of calcium carbonate. Ca2+ is actively transported across the calicoblastic membrane
into the calicoblastic fluid by a Ca2+ dependent ATP-ase, which exchanges Ca2+ for H+
ions (Al Horani et al. 2003). This is a process that consumes metabolic energy (ATP).
The mechanisms by which HCO3- and/or CO3
2- are transported across the calicoblastic
membrane are hitherto unknown. However, by removing protons from the calicoblastic
fluid, the pH of the calicoblastic fluid is increased, which shifts the equilibrium between
HCO3- and CO3
2- in favor of the latter: a pH of 9.28 and an Ω of 25 were measured inside
the calicoblastic fluid of Galaxea fascicularis (Al Horani et al. 2003), which is well above
reference seawater levels (8.2 and 4, respectively). These measurements were done
under simulated daylight conditions. The calicoblastic pH and Ω were not elevated when
the corals were incubated in the dark, indicating that light stimulates calcification. Indeed,
Biology and economics of coral growth
127
6
calcification is on average three times higher during the day than at night (light-enhanced
calcification - Gattuso et al. 1999). The mechanism by which light promotes calcification
is most likely a combination of a higher availability of ATP and a higher internal pH inside
the coral, which both result from photosynthetic activity of the zooxanthellae.
It is generally agreed that Ω is positively correlated with coral growth (Schneider and
Erez 2006; Marubini et al. 2008) and reef growth (Anthony et al. 2008, Jokiel et al. 2008,
De’ath et al. 2009). The concentrations of both ionic components of Ω have been reported
to influence coral growth in a similar way (for effects of [Ca2+], see Chalker 1976; Gattuso
et al. 1998; Marshall and Clode 2004; for effects of [HCO3-] and [CO3
2-], see Marubini and
Thake 1999; Marubini et al. 2001; Schneider and Erez 2006; Herfort et al. 2008; Marubini
et al. 2008). Hence, [Ca2+] and [CO32-], are of equal importance in controlling coral growth.
Whereas [CO32-] may vary due to short-term and long-term changes in ocean pH (Gattuso
et al. 1999; Kleypas et al. 1999), [Ca2+] is rather stable in oceanic waters. Therefore, [Ca2+]
is not considered as a very relevant factor with respect to the effect of climate change on
calcifying organisms. However, in an aquarium situation, where the ratio between water
volume and coral volume is orders of magnitude lower than in nature, the concentration
of Ca2+ can diminish rapidly and should be adequately monitored and controlled.
3.4 Food
The heterotrophic feeding biology of zooxantellate corals has recently been reviewed by
Houlbrèque and Ferrier-Pagès (2009). Here, we will briefly summarize some important
observations on the effects of feeding on coral metabolism and growth.
One of the proposed benefits of feeding is that it supplies the coral holobiont with nitrogen
(Dubinsky and Jokiel 1994). In contrast to the effect of DIN addition, which stimulates
zooxanthellae, but inhibits growth (see Subsection 3.2), it was shown by Ferrier-Pagès et
al. (2003) and Houlbrèque et al. (2003, 2004) that feeding stimulated both zooxanthellae
(numbers, pigmentation and photosynthetic activity) and growth of Stylophora pistillata.
Analogously, we found that high feeding increased both the specific growth rate (Figure
2A) and the photosynthetic capacity (Figure 2B) in colonies of Seriatopora caliendrum.
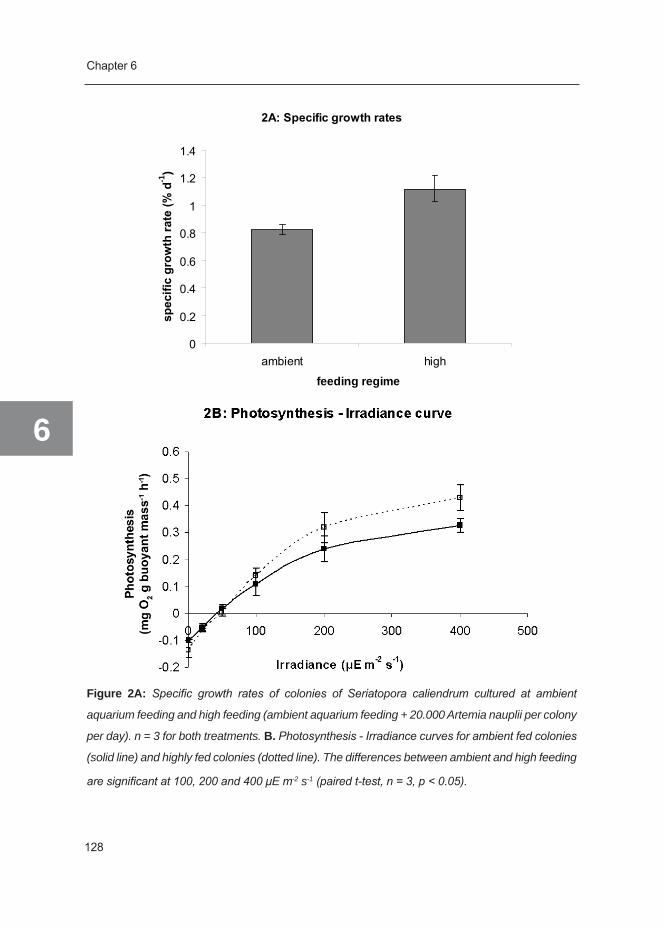
Chapter 6
6
128
2A:Specificgrowthrates
0
0.2
0.4
0.6
0.8
1
1.2
1.4
ambient high
feeding regime
specificgrow
thra
te(%
d-1
)
Figure 2A: Specific growth rates of colonies of Seriatopora caliendrum cultured at ambient
aquarium feeding and high feeding (ambient aquarium feeding + 20.000 Artemia nauplii per colony
per day). n = 3 for both treatments. B. Photosynthesis - Irradiance curves for ambient fed colonies
(solid line) and highly fed colonies (dotted line). The differences between ambient and high feeding
are significant at 100, 200 and 400 μE m-2 s-1 (paired t-test, n = 3, p < 0.05).
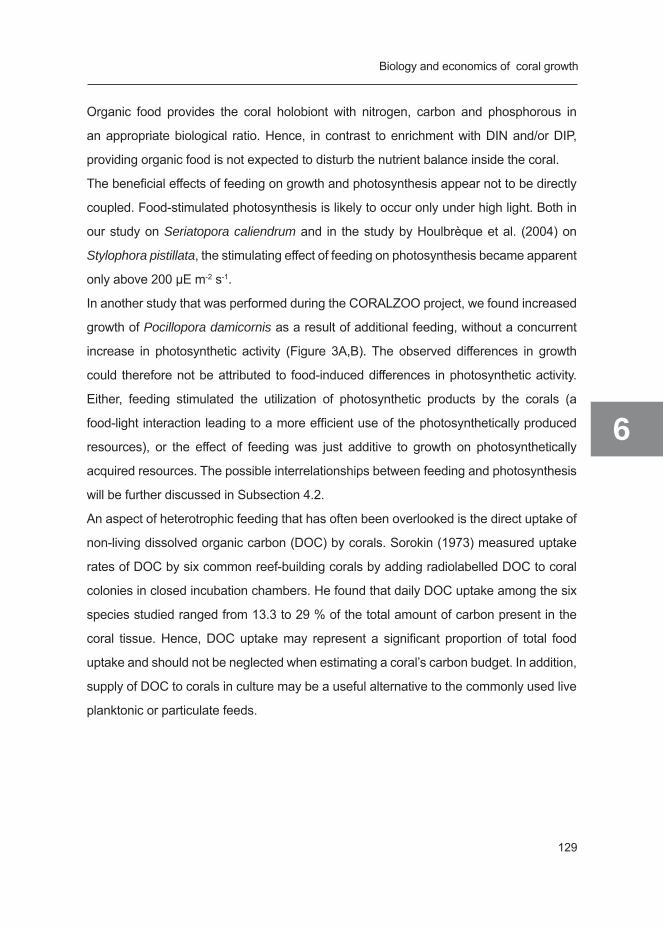
Biology and economics of coral growth
129
6
Organic food provides the coral holobiont with nitrogen, carbon and phosphorous in
an appropriate biological ratio. Hence, in contrast to enrichment with DIN and/or DIP,
providing organic food is not expected to disturb the nutrient balance inside the coral.
The beneficial effects of feeding on growth and photosynthesis appear not to be directly
coupled. Food-stimulated photosynthesis is likely to occur only under high light. Both in
our study on Seriatopora caliendrum and in the study by Houlbrèque et al. (2004) on
Stylophora pistillata, the stimulating effect of feeding on photosynthesis became apparent
only above 200 μE m-2 s-1.
In another study that was performed during the CORALZOO project, we found increased
growth of Pocillopora damicornis as a result of additional feeding, without a concurrent
increase in photosynthetic activity (Figure 3A,B). The observed differences in growth
could therefore not be attributed to food-induced differences in photosynthetic activity.
Either, feeding stimulated the utilization of photosynthetic products by the corals (a
food-light interaction leading to a more efficient use of the photosynthetically produced
resources), or the effect of feeding was just additive to growth on photosynthetically
acquired resources. The possible interrelationships between feeding and photosynthesis
will be further discussed in Subsection 4.2.
An aspect of heterotrophic feeding that has often been overlooked is the direct uptake of
non-living dissolved organic carbon (DOC) by corals. Sorokin (1973) measured uptake
rates of DOC by six common reef-building corals by adding radiolabelled DOC to coral
colonies in closed incubation chambers. He found that daily DOC uptake among the six
species studied ranged from 13.3 to 29 % of the total amount of carbon present in the
coral tissue. Hence, DOC uptake may represent a significant proportion of total food
uptake and should not be neglected when estimating a coral’s carbon budget. In addition,
supply of DOC to corals in culture may be a useful alternative to the commonly used live
planktonic or particulate feeds.
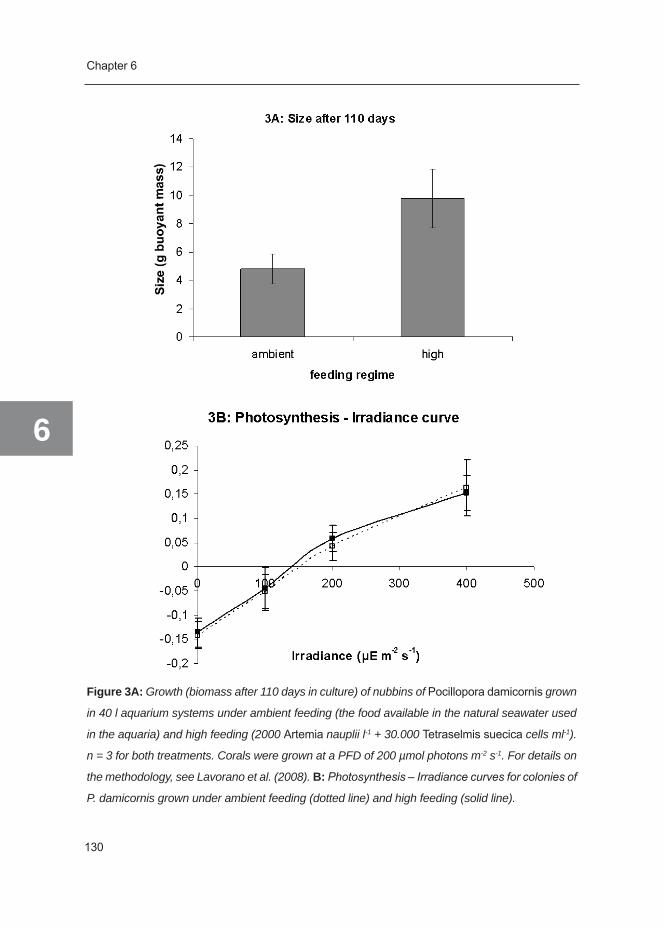
Chapter 6
6
130
Figure 3A: Growth (biomass after 110 days in culture) of nubbins of Pocillopora damicornis grown
in 40 l aquarium systems under ambient feeding (the food available in the natural seawater used
in the aquaria) and high feeding (2000 Artemia nauplii l-1 + 30.000 Tetraselmis suecica cells ml-1).
n = 3 for both treatments. Corals were grown at a PFD of 200 µmol photons m-2 s-1. For details on
the methodology, see Lavorano et al. (2008). B: Photosynthesis – Irradiance curves for colonies of
P. damicornis grown under ambient feeding (dotted line) and high feeding (solid line).
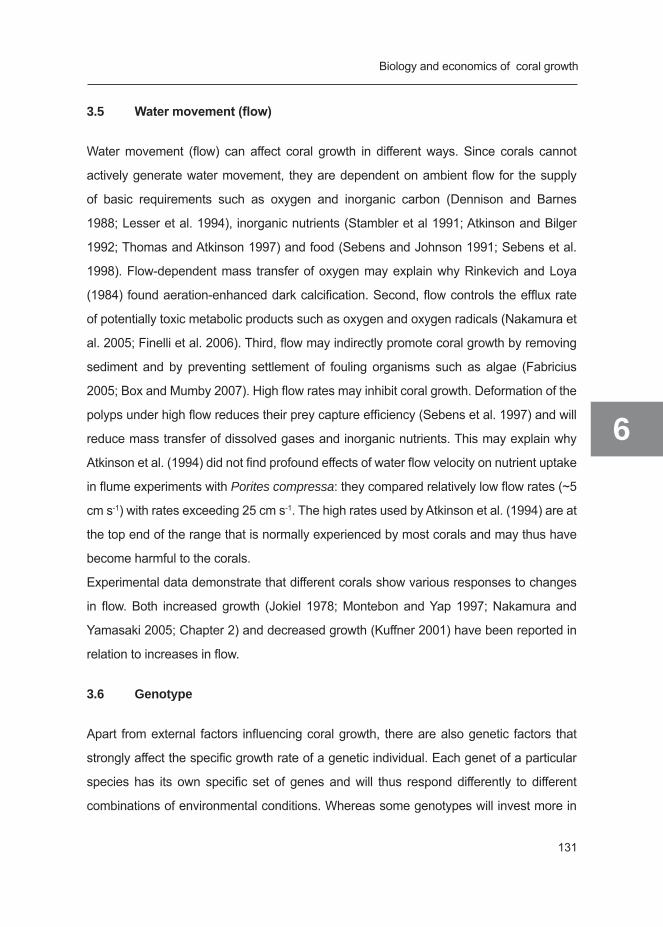
Biology and economics of coral growth
131
6
3.5 Watermovement(flow)
Water movement (flow) can affect coral growth in different ways. Since corals cannot
actively generate water movement, they are dependent on ambient flow for the supply
of basic requirements such as oxygen and inorganic carbon (Dennison and Barnes
1988; Lesser et al. 1994), inorganic nutrients (Stambler et al 1991; Atkinson and Bilger
1992; Thomas and Atkinson 1997) and food (Sebens and Johnson 1991; Sebens et al.
1998). Flow-dependent mass transfer of oxygen may explain why Rinkevich and Loya
(1984) found aeration-enhanced dark calcification. Second, flow controls the efflux rate
of potentially toxic metabolic products such as oxygen and oxygen radicals (Nakamura et
al. 2005; Finelli et al. 2006). Third, flow may indirectly promote coral growth by removing
sediment and by preventing settlement of fouling organisms such as algae (Fabricius
2005; Box and Mumby 2007). High flow rates may inhibit coral growth. Deformation of the
polyps under high flow reduces their prey capture efficiency (Sebens et al. 1997) and will
reduce mass transfer of dissolved gases and inorganic nutrients. This may explain why
Atkinson et al. (1994) did not find profound effects of water flow velocity on nutrient uptake
in flume experiments with Porites compressa: they compared relatively low flow rates (~5
cm s-1) with rates exceeding 25 cm s-1. The high rates used by Atkinson et al. (1994) are at
the top end of the range that is normally experienced by most corals and may thus have
become harmful to the corals.
Experimental data demonstrate that different corals show various responses to changes
in flow. Both increased growth (Jokiel 1978; Montebon and Yap 1997; Nakamura and
Yamasaki 2005; Chapter 2) and decreased growth (Kuffner 2001) have been reported in
relation to increases in flow.
3.6 Genotype
Apart from external factors influencing coral growth, there are also genetic factors that
strongly affect the specific growth rate of a genetic individual. Each genet of a particular
species has its own specific set of genes and will thus respond differently to different
combinations of environmental conditions. Whereas some genotypes will invest more in
Chapter 6
6
132
growth, others may be better in resisting overgrowth and diseases. Here, we present an
experimental example obtained during the CORALZOO project, which shows how genotypic
variability affects coral growth. Groups of 10 clones originating from 10 genetically different
individuals of Stylophora pistillata were grown for 1.5 years under the same conditions in
an aquarium. Two out of ten genotypes did not survive in the aquarium. The remaining
eight genotypes showed remarkable differences in growth (Figure 4).
-20
0
20
40
60
80
100
120
1 2 3 4 5 6 7 8
Genotype number
Ecol
ogic
al v
olum
e (m
l)
Figure 4: Biological volumes (determined according to Rinkevich and Loya 1983) of eight genotypes
of Stylophora pistillata after being in culture for 1.5 years. Error bars represent standard deviations
(n = variable, depending on the number of clones that survived). These results are part of a larger
study on genotypic variability, which will be described elsewhere.
This example clearly demonstrates that studies aiming to provide general information on the
growth of a species should take into account genetic heterogeneity and present averages
obtained from different genotypes. Working with clones obtained from a single genotype only
provides information on that particular genotype and cannot be extrapolated to the species
level. On the other hand, general physiological mechanisms are best studied using coral
fragments that are genetically identical. It remains to be determined to what extent genetic
differences in zooxanthellae populations can account for the observed genetic variability.

Biology and economics of coral growth
133
6
4 Interactions
Interactions between factors influencing coral growth can be defined as the extent to which
one factor increases or decreases the effect of another factor. Many factors described in
Section 3 interact, only the most important interactions will be highlighted here.
Light will interact with water flow, because water flow determines both the rate of supply of
DIC and inorganic nutrients needed for photosynthesis and the efflux rate of oxygen and
oxygen radicals that may inhibit photosynthesis (Finelli et al. 2006). Indeed, a significant
interaction between light and flow was found to affect the growth of Galaxea fascicularis.
A combination of high light and high flow had a stronger positive effect on growth than
the individual factors. Hence, a positive correlation between irradiance and growth will be
stronger under high-flow conditions (Chapter 5).
Light also interacts with the concentration of bicarbonate (HCO3-) in seawater. The positive
effect of irradiance on growth is enhanced by adding HCO3- (Marubini et al. 2001), which
suggests that DIC is limiting coral growth. This is explained by the fact that two of the major
physiological processes in corals, calcification and photosynthesis, compete for the same
substrate (DIC). Such internal competition for DIC was also suggested by Marubini and
Davies (1996) to explain the negative effects of DIN addition on calcification: enhanced
photosynthesis resulting from DIN enrichment increases the photosynthetic demand for
DIC at the expense of calcification. Marubini and Thake (1999) demonstrated that the
inhibiting effects of DIN could indeed be stopped by doubling the concentration of HCO3-
in the seawater.
Reversely, it has been suggested also that calcification supports photosynthesis by
converting HCO3- into membrane-permeable CO2 (the substrate for the photosynthetic
key enzyme RuBisco), thus reducing the need for carbonic anhydrase-based carbon
concentrating mechanisms (Furla et al. 2005) to supply DIC to the zooxanthellae. This so-
called “trans-calcification model” (McConnaughey and Whelan 1997) provides an elegant
evolutionary explanation for the massive formation of external skeletons by scleractinian
corals. Marshall and Clode (2002) presented data that support this view. These authors
used enrichment with Ca2+ (the other component of Ω), which stimulated both calcification

Chapter 6
6
134
and the incorporation of photosynthetically acquired carbon into coral tissue. Increasing
[Ca2+] may lower the amount of metabolic energy required for transport of [Ca2+] into the
calicoblastic layer and may in this way compensate for the increased metabolic effort to
acquire CO32- for calcification. However, the trans-calcification model appears to be in
contradiction with the suggested internal competition for DIC. Moreover, it is based upon
the questionable assumptions that HCO3- freely diffuses into the central cavity of the coral
(see review by Allemand et al. 2004).
An interesting addition to this discussion is the potential role of heterotrophic feeding
in the internal dynamics of DIC, N, P and pH. The reason that feeding gives a similar
response of zooxanthellae to enrichment with inorganic nutrient, but without a concurrent
decrease in coral growth may be found in the fact that respiration of organic food will
simultaneously yield DIN, DIP and DIC in a biologically appropriate ratio. However,
since the DIC provided by food digestion is in the form of CO2, excessive feeding may
decrease the pH inside a coral, thus slowing down calcification. Since this effect will
be stronger in the absence of light (in the light, the CO2 produced by respiration will
be quickly assimilated by the zooxanthellae), it appears logic to feed aquarium corals
during daytime. Indeed, Lavorano et al. (2008) found that daytime feeding of Pocillopora
damicornis had a stronger positive effect on growth than nocturnal feeding.
4.1 Autotrophyversusheterotrophy:interactionsbetweenlightandfeeding
As reviewed by Houlbrèque and Ferrier-Pagès (2009), there is an ongoing debate on
the roles of autotrophy and heterotrophy in zooxanthellate corals. The prevailing views,
however, are that heterotrophy provides an alternative for phototrophy (additive effect) and
that the balance between phototrophy and heterotrophy is dependent on light conditions.
The shifting roles of autotrophy and heterotrophy as described by Anthony and Fabricius
(2000) for corals facing increased turbidity and by Grottoli et al. (2006) for bleached corals
support this view.
It is very likely that apart from providing an additional source of carbon, nitrogen and
phosphorous for both host and symbionts, heterotrophy also supplies several essential
components (building blocks) for the biosynthesis of the coral host that it can hardly or not

Biology and economics of coral growth
135
6
obtain from translocated photosynthetic products. Such a dependency on heterotrophy for
specific components implies that the rate of heterotrophic feeding can actually directly limit
coral growth. There are three facts that support this view:
There are, to the best of our knowledge, no records of 100% phototrophy in scleractinian 1.
corals.
Supplementing the water with nutrients stimulates photosynthesis and symbiont density, 2.
but does not augment coral growth (Marubini and Davies 1996), even when bicarbonate
is added to prevent internal DIC-limitation (Marubini and Thake 1999).
The organic component of reef coral biomass is to a large extent of heterotrophic origin 3.
(Muscatine and Kaplan 1994, Grottoli 2000). Some components, in particular in the
organic matrix of the coral skeleton, appear to be almost exclusively of non-phototrophic
origin (e.g. Allemand et al. 1998).
These observations put the observed beneficial effects of feeding (Anthony and Fabricius
2000; Bongiorni et al. 2003a,b; Ferrier-Pagès et al. 2003; Houlbrèque et al. 2003, 2004;
Lavorano et al. 2008) on coral growth in a slightly different perspective: feeding does not
only provide alternative sources of carbon, nitrogen and phosphorous, it will also augment
the utilization of phototrophically acquired resources, leading to a more efficient use of these
resources and reduced loss by excretion and mucus production (a lower release of “junk
food”).
There are two studies that support this view. Houlbrèque et al. (2004) found an increased
calcification coinciding with an increased deposition of aspartate when comparing fed colonies
of Stylophora pistillata to starved colonies and proposed that feeding-induced organic matrix
synthesis is determining calcification rates. A second study was done recently by members
of our team. The interactive effects of irradiance and food availability on the growth of the
branching coral Pocillopora damicornis were tested. Nubbins of this species were prepared
and cultured as described in Lavorano et al. (2008). Two photon flux densities (100 and
300 µE m-2 s-1) were tested against two feeding regimes: low, ambient feeding (through the
regular supply of fresh natural seawater to the system) versus high feeding, where ambient
food was supplemented with a daily batch of freshly hatched nauplii of Artemia (starting
concentration: 2000 nauplii dm-3). High feeding stimulated growth at the highest PFD, while

Chapter 6
6
136
no effect of adding food was observed at 100 µE m-2 s-1 (Fig 5), indicating an interaction
between light and feeding.
Figure 5: Interacting effect of irradiance and feeding on the growth of Pocillopora damicornis.
Contrasting with these results, however, is the study by Ferrier-Pagès et al. (2003), who
found no interaction between light and feeding on the growth of Stylophora pistillata. Their
data suggested that the effect of feeding was additive to the effect of light. Ferrier-Pagès et al.
(2003) gave no details about the ambient flow velocity in their experimental aquaria, except
for the general remark that water motion was generated by an air-stone. Hence, it cannot be
excluded that flow-related limitations have occurred under the high light conditions applied in
this study, which can mask potential interactive effects between light and feeding.
In general, the uptake of organic food appears to be the most balanced way for a coral to
supply itself with a number of resources, including DIN, DIP and DIC for photosynthesis and
calcification and essential organic building blocks that cannot be provided by photosynthesis.
If food supply is in good balance with light supply and flow velocity, the beneficial effect of
feeding on coral growth is likely to be more than just additional to the effect of light.
Biology and economics of coral growth
137
6
5 Synopsis:whatdeterminescoralgrowth?
Obviously, there is not one single factor that limits the growth of zooxanthellate Scleractinia.
Multiple, interacting factors influence coral growth, which may all become limiting/
inhibiting within their naturally occurring ranges. Furthermore, there is variation among
species and within species with respect to growth limitation: genotypic variability is large,
different genotypes may have developed different strategies to survive in a fluctuating
environment. For example, under a given combination of environmental conditions, light
availability may limit the growth of a specific coral individual, but under the same set of
environmental conditions, another factor may be limiting the growth of another individual,
even when these individuals are conspecifics. This explains why many aquarists report
conflicting results when growing individuals of the same species. It also shows that
optimization of coral culture is a tedious process, in which many factors should be taken
into account. Therefore, large, multi-factorial growth experiments are desired, not only to
maximize the productivity for coral aquaculture, but also to further unravel the interactions
between potentially limiting and inhibiting factors. Information on interaction may shed
new light on the mechanisms that determine coral growth rates.
Despite this complexity, we have attempted to deduce some general mechanisms that
may help to explain the phenomena that we observe both in nature and in culture and that
may provide guidance for future research. The following working mechanism is proposed
for corals growing under natural oceanic conditions in non-stagnant water:
Under a broad range of photon flux densities, the coral-zooxanthellae holobiont is
capable to adjust its photosynthetic apparatus in such a way that photosynthesis
is always optimal for coral growth (photoacclimation). Below the specific saturation
irradiance (Iks), photoacclimation can no longer compensate for the lower photon flux.
Under these circumstances, light availability can limit coral growth due to a reduced input
of translocated photosynthetates. Increased heterotrophy can partially compensate for
this reduced photosynthetic input. Above Iks, light is not limiting: the zooxanthellae may
become nutrient limited, and the coral host is limited by another factor (e.g. essential
food components or DIC). Taking away these limitations will result in a higher growth,

Chapter 6
6
138
partially caused by a more efficient use of translocated photosynthetates. Crucial in this
respect is the role of water movement: when water flow is low or absent, mass transfer
of DIC or food may become limiting for coral growth, even below Iks. In addition, Iks itself
may decrease due to DIC limitation of the zooxanthellae. Furthermore, insufficient water
movement will cause inhibition of coral growth under higher irradiance levels, because
an increasing proportion of the photosynthetically acquired carbon will then be used for
stress responses (i.e. mechanisms to cope with negative effects of accumulated oxygen,
oxygen derivatives and metabolic wastes) instead of growth.
6 Growthkinetics
Most studies concerning growth of corals deal with growth rates (see review by Dullo
2005), factors influencing growth (see references in earlier sections) and morphogenesis
(Kaandorp and Kubler 2001; Kruszinski et al 2007; Shaish et al. 2006). Only few
researchers analyzed the kinetics of coral growth. An elegant and extensive study on
the growth of five Caribbean coral species was done by Bak (1976), who reported that
the growth of all species studied developed in an exponential way. However, the specific
exponential growth rate (i.e. the percentage increase in body mass per unit of time)
decreased with increasing colony size. It is important to realize that a growing proportion
of the scleractinian coral body mass – the skeleton - is not actively participating to the
growth process. Therefore, Bak (1976) related growth to the living surface area (to be
precise: to the area covered by the calicoblastic epithelium) and found, by comparing
growth rates of small and large colonies, that the rate of calcification per surface area
remained unchanged over a long period of time.
Sipkema et al. (2006) presented four hypothetical growth models for sponges, which
appear suitable to be applied to corals as well:
1. Linear growth (zero order kinetics), described by:
Xt = X0 + kt (1)
in which Xt is the size of the coral after time t, X0 is the size of the coral at t=0
and k is the linear growth rate constant (e.g. in mm day-1).
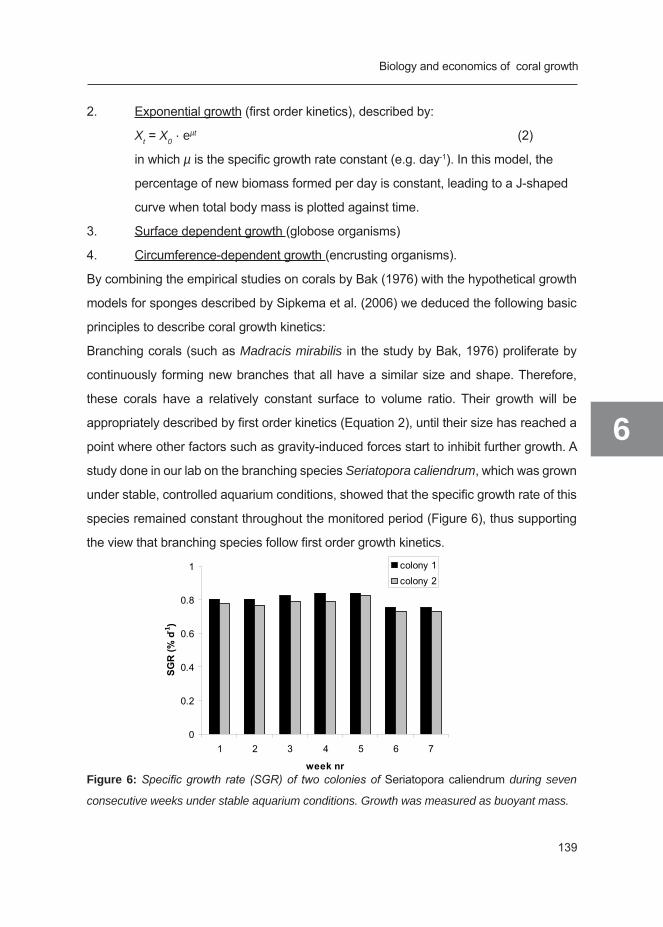
Biology and economics of coral growth
139
6
2. Exponential growth (first order kinetics), described by:
Xt = X0 · eµt (2)
in which µ is the specific growth rate constant (e.g. day-1). In this model, the
percentage of new biomass formed per day is constant, leading to a J-shaped
curve when total body mass is plotted against time.
3. Surface dependent growth (globose organisms)
4. Circumference-dependent growth (encrusting organisms).
By combining the empirical studies on corals by Bak (1976) with the hypothetical growth
models for sponges described by Sipkema et al. (2006) we deduced the following basic
principles to describe coral growth kinetics:
Branching corals (such as Madracis mirabilis in the study by Bak, 1976) proliferate by
continuously forming new branches that all have a similar size and shape. Therefore,
these corals have a relatively constant surface to volume ratio. Their growth will be
appropriately described by first order kinetics (Equation 2), until their size has reached a
point where other factors such as gravity-induced forces start to inhibit further growth. A
study done in our lab on the branching species Seriatopora caliendrum, which was grown
under stable, controlled aquarium conditions, showed that the specific growth rate of this
species remained constant throughout the monitored period (Figure 6), thus supporting
the view that branching species follow first order growth kinetics.
Figure 6: Specific growth rate (SGR) of two colonies of Seriatopora caliendrum during seven
consecutive weeks under stable aquarium conditions. Growth was measured as buoyant mass.
0
0.2
0.4
0.6
0.8
1
1 2 3 4 5 6 7
weeknr
SGR(%
d-1
)
colony 1colony 2
Chapter 6
6
140
Mass parameters such as wet mass, buoyant mass and dry mass are suitable to monitor
growth of these coral species, because they linearly correlate with other commonly used
biomass estimators such as surface area, volume, or biological or ecological volume
(Rinkevich and Loya 1983).
Boulder-shaped corals and plate-shaped corals follow different growth kinetics. Boulder-
shaped corals continuously secrete new layers of calcium carbonate upon their old
skeleton, thus continuously increasing the proportion of skeletal mass to total body mass.
The living tissue of these corals may either grow with a continuous rate or with a rate that
slowly decreases (e.g. Montastrea annularis - Bak 1976). In case of continuous tissue
growth, total coral growth can best be described by using a surface dependent growth
rate constant (Equation 3 in the paper by Sipkema et al. 2006, or similar derivatives
for conically shaped objects, etc). Growth of these corals is best determined by using
surface area as an estimator for biomass. Plate-shaped corals are most likely to follow
circumference-dependent growth kinetics (Equation 4 in the paper by Sipkema et al. 2006,
or derivatives thereof). Hence, growth of these corals is best determined by measuring
surface area or linear extension rates.
It should be noted that these basic principles only represent a broad generalization.
More sophisticated modeling approaches are needed for an exact description of species
specific coral growth kinetics. For example, Crabbe (2007) reported that a 3:3 rational
polynomial model described the growth of a branching species (Acropora palmata)
more accurately than the simple first order kinetics model represented by Equation 2.
Notwithstanding this, the basic principles outlined above provide a suitable tool to design
coral aquaculture systems, as will be discussed in the next section.
7 Theeconomicsofcoralgrowth
It has been estimated that economic activities related to corals and coral reefs represent
an annual turnover of 375 billion dollars worldwide (Wilkinson 1996, Bryant et al. 1998).
The private and home aquarium trade represents a growing proportion of this economic
value: the trade in aquarium corals only had an estimated market size of approximately

Biology and economics of coral growth
141
6
60 million US$ per year in the period between 1997 and 2001 (Wabnitz et al. 2003), which
justifies research efforts focused on optimization of coral aquaculture.
In this section, we present a case study on commercial coral breeding. Daily costs for
building and maintenance of coral culture systems (Table 1) were calculated per m2
culture system surface. Calculation are based upon figures from a coral farm in a public
aquarium (Nausicaa, France), where several coral species are being bred for use in
public aquaria. The figures presented here concern the branching species Seriatopora
caliendrum, one of the species that is in culture at the Nausicaa aquarium.
For the commercial aquarium trade, a colony of S. caliendrum should have the size of a
fist, which corresponds to a wet mass of approximately 100g. A one m2 aquarium system
can host up to 100 colonies of this size.
Table 1: Overview of costs per category and total operational costs for coral culture systems at
Nausicaa aquarium per day. All costs are given in euro’s. Systems are depreciated in 10 years.
Cost category Lowfeedscenario High feed scenarioManpower 6.53 6.53Materials 1.42 1.42Energy 0.22 0.22Food 0.50 2.00Depreciation of system 1.10 1.10Tax and insurance 0.16 0.16Total costs 9.93 11.43
We calculated the production costs for 100 g colonies, using fragments that have an initial
mass of 10 g as a starting point. Production costs were calculated for two real-life feeding
scenario’s that had been applied to this coral species (see Figure 3 and its explanation).
Annual production of S. caliendrum biomass (in kg wet mass) and the corresponding
production costs were calculated for both feeding scenarios. The growth of S. caliendrum
was assumed to be exponential, following first order kinetics (see Section 6: equation 2
and Figure 6). In Figure 5, it is shown that as a result of additional feeding with Artemia
nauplii, the specific growth rate (µ) for S. caliendrum increased from 0.0084 d-1 to 0.0115
Chapter 6
6
142
d-1 (i.e. a 35% increase). Both rates were used to calculate the production period, i.e. the
time (t) needed for a fragment to grow from a size of 10 g (X0) to a size of 100 g (Xt):
t = ln (Xt/X0) µ-1 [days]
The price per colony of 100 g was calculated as follows:
Price (€ colony-1) = costs of production system (€ m-2 day-1) * culture
time (days) / colony density (colonies m-2)
It was hereby taken into account that for continuation of the culture, 10% of the harvest is
needed as broodstock for the next culture.
Also, the annual production was calculated:
Colonies year-1 = production period (days) * 365 (days year-1) * number
of colonies per production period (colonies)
Since stony corals are a potential resource of natural products with pharmacological
properties (e.g. Alam et al. 2001), cultured corals may also be needed as biological
materials for drug development studies. For this purpose, the size of the coral individuals
harvested is not important. In this particular case, the best strategy for production is
to continuously maintain the maximal sustained standing stock (in the example: 100
colonies of 100 g wet mass), and to harvest every day the excess growth (in the example:
0.84 % day-1 and 1.15 % day-1). Productivity for S. caliendrum was also calculated for this
culture approach, hereby again comparing the low-feeding scenario to the high-feeding
scenario.
The results of the calculations are summarized in Table 2 and Table 3. This case study
shows that optimization can be rewarding: as a result of optimized feeding, productivity
increased with 35% while production costs increased with only 15%. The results also
show that continuous harvesting reduces the production costs per kg coral considerably.
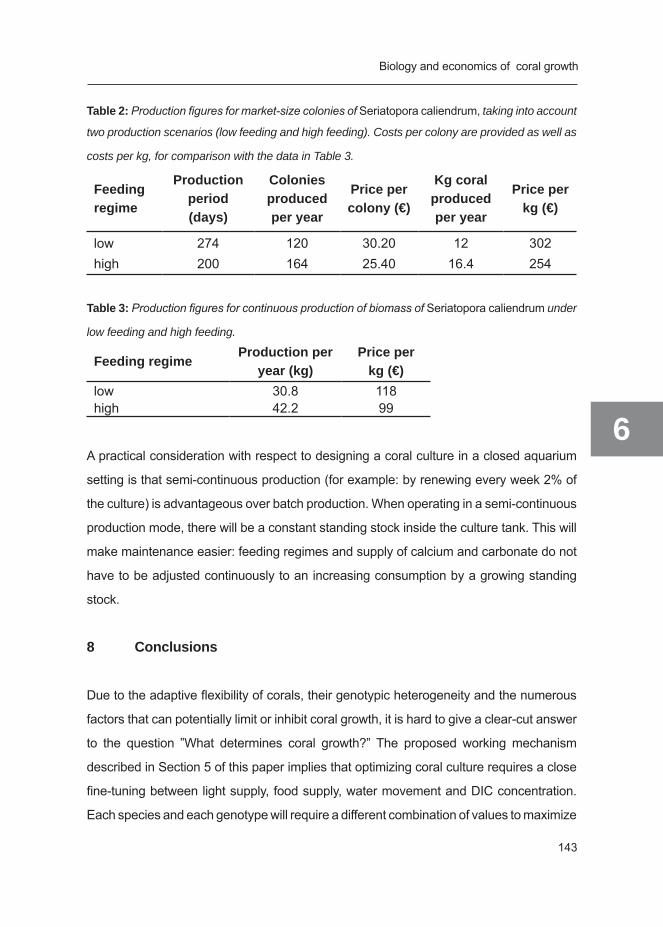
Biology and economics of coral growth
143
6
Table 2: Production figures for market-size colonies of Seriatopora caliendrum, taking into account
two production scenarios (low feeding and high feeding). Costs per colony are provided as well as
costs per kg, for comparison with the data in Table 3.
Feeding regime
Production period (days)
Colonies produced per year
Price per colony (€)
Kg coralproduced per year
Price per kg (€)
low 274 120 30.20 12 302high 200 164 25.40 16.4 254
Table 3: Production figures for continuous production of biomass of Seriatopora caliendrum under
low feeding and high feeding.
Feeding regimeProduction per
year (kg)Price per
kg (€)low 30.8 118high 42.2 99
A practical consideration with respect to designing a coral culture in a closed aquarium
setting is that semi-continuous production (for example: by renewing every week 2% of
the culture) is advantageous over batch production. When operating in a semi-continuous
production mode, there will be a constant standing stock inside the culture tank. This will
make maintenance easier: feeding regimes and supply of calcium and carbonate do not
have to be adjusted continuously to an increasing consumption by a growing standing
stock.
8 Conclusions
Due to the adaptive flexibility of corals, their genotypic heterogeneity and the numerous
factors that can potentially limit or inhibit coral growth, it is hard to give a clear-cut answer
to the question ”What determines coral growth?” The proposed working mechanism
described in Section 5 of this paper implies that optimizing coral culture requires a close
fine-tuning between light supply, food supply, water movement and DIC concentration.
Each species and each genotype will require a different combination of values to maximize
Chapter 6
6
144
its growth rate. Therefore, efficient high-density coral culture is best achieved by having
the individual species and genotypes in separate culture systems.
Acknowledgements
This study was funded by the European Commission (project CORALZOO 012547
– breeding and husbandry of stony corals in zoo’s and public aquaria) and is a joint
achievement of many CORALZOO participants. Daniela Corsino and Anne Reijbroek are
acknowledged for analytical support.


Chapter 7
General Discussion
Miriam Schutter

Chapter 7
7
148
1 Introduction
The general aim of this thesis was to study the influence of the abiotic factors light and
water flow on the growth and physiology of Galaxea fascicularis in closed aquarium sys-
tems.
The following objectives were aimed for:
to study the effect of water flow on the growth and physiology of 1. G. fascicularis
(Chapter 2)
t2. o study the effect of irradiance on growth of G. fascicularis and to relate this growth
to photosynthetic rate (Chapter 3)
to study the effect of photoperiod on growth and photo-acclimation of 3. G. fascicularis
(Chapter 4)
to study the interaction between light and water flow for growth and physiology of 4. G.
fascicularis (Chapter 5)
In this Chapter, I will highlight the main findings of the thesis work and indicate future
directions for research for each factor studied (light, water flow, photoperiod and photoac-
climation). Progressing on the review on coral growth and aquaculture in Chapter 6, I will
discuss how the findings in this thesis can lead to improvement of coral aquaculture and
production. Finally, the general conclusions of this thesis will be given.
2 Waterflow
2.1 Mainfindingsforwaterflow
Being sedentary marine invertebrates, scleractinian corals are both dependent on and
constrained by the presence of water flow. Water flow affects the exchange rate of dis-
solved gasses and (in)organic nutrients, prey capture efficiency and removal of sediment
and mucus. Some corals have been found to grow more rapidly when flow increases
(Jokiel 1978; Montebon and Yap 1997; Nakamura and Yamasaki 2005), showing even
an hyperbolic profile of growth with increasing flow rate (Khalesi et al. 2007), while growth
rate of other corals was not effected by flow rate (Sebens et al. 2003) or growth even de-
General Discussion
149
7
creased with flow rate (Kuffner 2001). However, further research is required because in
most studies the water flow rates were not accurately measured, the water flow rate was
not sufficiently varied to see an effect or experiments were done for a too short period.
Since zooxanthellate scleractinian corals are symbiotic organisms, relying for a large part
on photosynthetic energy from their symbionts, coral growth is expected to be related to
the rate of photosynthesis.
In this thesis the effect of flow regime on long-term growth and photosynthesis and res-
piration rates was measured (Chapter 2 and Chapter 5). The importance of water flow
to the growth and well-being of G. fascicularis was demonstrated in Chapter 2. In the
absence of flow, corals grew significantly slower and appeared unhealthy. In the pres-
ence of flow (10, 20 and 25 cm s-1), growth rate significantly increased. There was no
significant difference in growth rate between the corals grown at 10 cm s-1 and 20 cm
s-1, while the growth rate of the corals grown at 25 cm s-1 was significantly higher. The
low specific growth rate in the absence of flow was related to a lower respiration rate.
Although the light-enhanced calcification theory proposes that coral growth is enhanced
through photosynthesis, this could not be demonstrated. Differences in growth rates at
low light intensity (90 μE m-2 s-1) between the corals grown at 10 cm s-1, 20 cm s-1 and 25
cm s-1 could not be explained by either net photosynthetic rates, respiration rates, or the
amount of phototrophic carbon left for growth.
Light-enhancement of calcification could either be a qualitative process (i.e. enhance-
ment is related to the presence of light and hence the presence of photosynthesis; i.e.
light is needed, but the amount of light is not important - provided that it is not near zero)
or a quantitative process (i.e. enhancement is related to the amount of light and hence
the rate of photosynthesis). Although the net photosynthetic rate of the corals grown at 10
cm s-1 was higher than at 25 cm s-1, the corals grown at 10 cm s-1 grew slower. Therefore,
in this study, the enhancement of coral growth by photosynthesis is suggested to be a
qualitative process.
It was expected that phototrophic feeding and the modulation of photosynthesis by water
flow would become more important at high irradiance. Therefore, the interaction between
light and water flow was studied in Chapter 5. In this Chapter it was demonstrated that
Chapter 7
7
150
water flow indeed becomes more important for skeletal growth at high irradiance. How-
ever, since differences in net photosynthetic rate were not significant, also here mediation
by net photosynthesis could no be demonstrated.
Summarizing, there was a positive effect of increasing water flow on growth both at an
irradiance of 90 μE m-2 s-1(Chapter 2), 300 μE m-2 s-1 and 600 μE m-2 s-1(Chapter 5). Nei-
ther of these differences in growth were supported by a significant increase in net photo-
synthetic rate, in contrast to our expectations. The positive effect of increasing water flow
on coral growth is probably a consequence of both external and internal mechanisms.
External mechanisms, such as decreased algal competition and sedimentation, probably
allowed the corals to channel more energy to coral growth instead of competition and
regeneration (Rinkevich and Loya 1985, Rinkevich 1996). The internal biological mecha-
nisms are not clear yet. Besides photosynthesis, the enhancement of coral growth with
increasing water flow could potentially also be related to: 1) increased heterotrophic feed-
ing (i.e. organic nutrient uptake), 2) relief of photo-oxidative stress and therefore reduced
energy allocation to expensive photo-protective mechanisms, 3) increased dark respira-
tion (Lesser et al. 1994; Bruno and Edmunds 1998; Chapter 2), and/or 4) increased in-
organic nutrient uptake such as nitrate or phosphate (Stambler et al. 1991; Atkinson and
Bilger 1992; Thomas and Atkinson 1997).
It is suggested that the mechanism of enhancement of coral growth by water flow is dif-
ferent at different irradiance levels. At low and intermediate irradiance, increased growth
with increasing water flow might be more related to the increased access to organic
carbon sources, possibly to offset a lack of photosynthetic carbon. On the other hand, at
high irradiance, the beneficial effect of water flow might be more related to the reduction
of photo-oxidative stress through increasing the efflux of oxygen from coral tissue (Finelli
et al. 2006). As a consequence, less energy is needed for costly photo-protective mecha-
nisms, permitting higher energy allocation towards growth.
Additionally, the increased supply of (in)organic nutrients with increasing water flow might
satisfy the increased need of essential nutrients (e.g. nitrogen and phosphorous) at high
irradiance levels.
General Discussion
151
7
Since no interaction was found between light and heterotrophic feeding in previous studies
(Ferrier-Pagès et al. 2003, Houbrèque and Ferrier-Pagès 2009), the most likely mechanism
for the observed interaction between light and water flow is the differential energy allocation
due to the relief of oxidative stress with increasing water flow. However, this remains to be
confirmed in future studies.
2.2 Futureperspectivesofwaterflow
2.2.1 Flow-enhanced calcification
The mechanisms of calcification are still a matter of debate and are being studied at various
levels of the coral organism using different approaches. Our holistic approach (measuring
calcification as buoyant mass and looking at the coral-algal symbiosis as holobiont) revealed
several aspects of coral biology which make it worth to look at the mechanisms behind it:
Carbon balance: It is suggested that, once the inorganic requirements for calcification are
met, calcification will depend on the amount of organic carbon available from both pho-
totrophic and heterotrophic sources. More data are required to estimate the total amount of
organic carbon that can potentially be channeled towards skeletal growth. In general, but
in this instance with respect to flow, carbon balances should be made under the different
experimental conditions. For that we should determine:
all carbon inputs, 1.
amount of photosynthetic carbon that is translocated to the coral host (Muscatine 2.
1984; Dubinsky and Jokiel 1994; Dubinsky and Berman-Frank 2001),
amount of carbon that is actually assimilated from the food taken up, 3.
carbon losses via mucus production, dark- and light respiration, 4.
partitioning of carbon between tissue and skeleton (Anthony et al. 2002). 5.
Light stress: At high irradiance levels, it is proposed that increasing water flow reduces oxida-
tive stress thereby reducing energy allocation towards costly photo-protective mechanisms,
resulting in a higher biomass yield on light. This hypothesis could be tested by measuring the
energy dissipation rate using Pulse Amplitude Modulated (PAM) fluorometry and the con-
centration of photo-protective enzymes (e.g. superoxide dismutase) and photo-protective
pigments (e.g. xanthophyll pigments) at different flow regimes.
Chapter 7
7
152
2.2.2 Reduction of experimentation time
Coral growth experiments take a long time and only show overall effects. To understand
effects of flow we should in the future make use of shorter mechanistic studies and apply
them at a wide range of flows, including unidirectional, bidirectional or oscillatory flow,
and turbulent versus laminar flow. These mechanistic studies include:
1) Computer models simulating water flow and boundary layer, and gradients of inorganic
carbon and nutrients on different 3D morphologies of corals (e.g. Kaandorp et al. 2003).
2) Measurements of micro-flow patterns, diffusive boundary layers, local absorption of
nutrients and gasses and local uptake of food particles to validate the computer models.
Sophisticated techniques such as flow microsensors (e.g heated flow thermistor, Labar-
bera and Vogel 1976; Brand et al. 2007) and microsensors for nutrients (e.g nitrate, De
Beer et al. 1997 or dissolved organic carbon, Neudörfer and Meyer-Reil 1997) would be
required to measure such parameters experimentally.
2.2.3 Coral morphology
It has been shown that flow affects coral morphology (Chamberlain and Graus 1975; Jok-
iel 1978; Lesser et al. 1994; Bruno and Edmunds 1998). By adapting its morphology, the
coral is able to minimize its diffusional boundary layer thickness and maximize metabolic
rates under a variety of flow regimes. For example, the stony coral Pocillopora damicornis
has a compact growth form under high flow conditions, while its growth form gradually
changes into a branching shape when the amount of water flow decreases (Veron and
Pichon 1976; Kaandorp et al. 1996). Transplantation of coral colonies from high flow
conditions (the outer reef) to low flow conditions (calm bay) is not always successful; the
majority of Pocillopora meandrina transplanted from the turbulent outer reef into a calm
bay died (Maragos 1972). The relationship between coral morphology and coral growth
needs further study.
2.2.4 Species
Finally, since the sensitivity to water flow is species-specific (Finelli et al. 2006; Carpenter
and Patterson 2007), research on a wide range of species is needed to deduce general
rules for optimal flow regimes for the aquaculture of scleractinian corals.
General Discussion
153
7
3 Irradiance
3.1 Main findings for irradiance
Light is one of the most important abiotic factors influencing the growth of zooxanthellate
scleractinian corals. According to the light-enhanced calcification theory (see Gattuso et
al. 1999 and Allemand et al. 1998b for review), calcification of the coral host is enhanced
by photosynthesis of zooxanthellae (Goreau and Goreau 1959; Pearse and Muscatine
1971; Allemand et al. 2004). Indeed, on average, calcification in light is about three times
higher than calcification in darkness (review by Gattuso et al. 1999). The exact mecha-
nisms of the enhancement of calcification by photosynthesis are still a matter of debate
(Gattuso et al. 1999; Furla et al. 2000, Moya et al. 2006, 2008a). According to Moya et al.
(2008a), the proposed mechanisms can be classified into two groups,
1) modification of the inorganic chemistry (e.g. carbonate chemistry as site of calcifica-
tion), and
2) modification of the organic chemistry (e.g. supply of ATP or organic matrix precur-
sors).
The importance of irradiance to coral skeletal growth and the relation with net photosyn-
thesis was studied in Chapter 3. It was expected that skeletal growth rate would increase
with a higher irradiance because of an increase in net photosynthesis. In Chapter 5, the
modulating effect of water flow on light use was studied, while the effect of light duration
on coral growth was explored in Chapter 4.
The positive effect of irradiance on skeletal growth of G. fascicularis was demonstrated
in both Chapter 3 and 5: specific growth rate as buoyant mass increased significantly
with increasing irradiance. In these studies, the light-enhancement of coral growth was a
quantitative process (i.e. related to the amount of light). In contrast, no positive effect of
irradiance on skeletal growth was found in Chapter 4.
In Chapter 3, specific growth rate was related to a photosynthesis-irradiance curve. Both
specific growth rate and net photosynthesis increased with irradiance, however, this re-
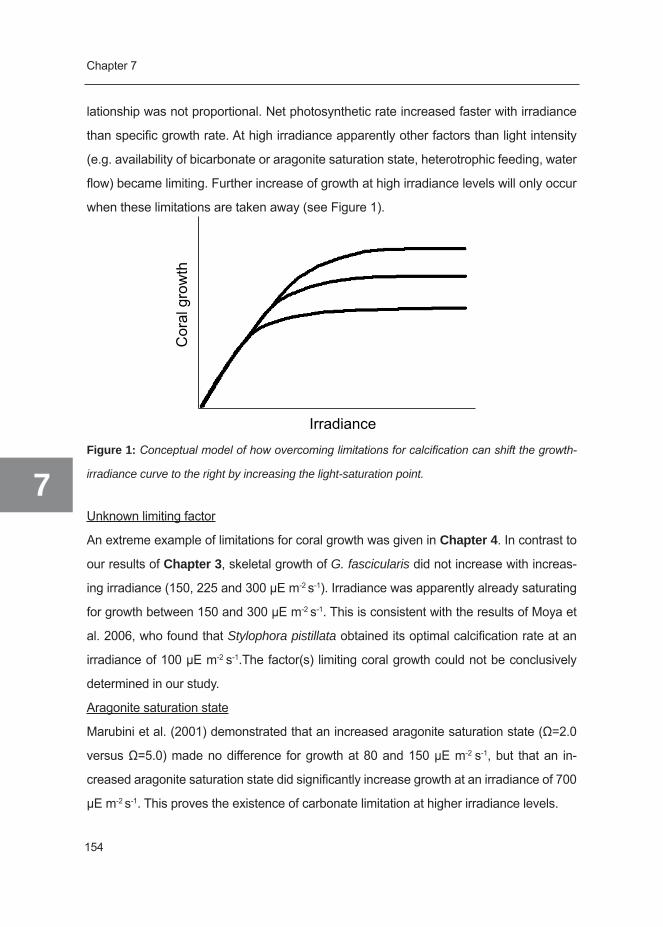
Chapter 7
7
154
lationship was not proportional. Net photosynthetic rate increased faster with irradiance
than specific growth rate. At high irradiance apparently other factors than light intensity
(e.g. availability of bicarbonate or aragonite saturation state, heterotrophic feeding, water
flow) became limiting. Further increase of growth at high irradiance levels will only occur
when these limitations are taken away (see Figure 1).
Cor
al g
row
th
Irradiance
Figure 1: Conceptual model of how overcoming limitations for calcification can shift the growth-
irradiance curve to the right by increasing the light-saturation point.
Unknown limiting factor
An extreme example of limitations for coral growth was given in Chapter 4. In contrast to
our results of Chapter 3, skeletal growth of G. fascicularis did not increase with increas-
ing irradiance (150, 225 and 300 μE m-2 s-1). Irradiance was apparently already saturating
for growth between 150 and 300 μE m-2 s-1. This is consistent with the results of Moya et
al. 2006, who found that Stylophora pistillata obtained its optimal calcification rate at an
irradiance of 100 μE m-2 s-1.The factor(s) limiting coral growth could not be conclusively
determined in our study.
Aragonite saturation state
Marubini et al. (2001) demonstrated that an increased aragonite saturation state (Ω=2.0
versus Ω=5.0) made no difference for growth at 80 and 150 μE m-2 s-1, but that an in-
creased aragonite saturation state did significantly increase growth at an irradiance of 700
μE m-2 s-1. This proves the existence of carbonate limitation at higher irradiance levels.
General Discussion
155
7
Water flow
In Chapter 5 it was demonstrated that water flow can relieve certain limitations for re-
sources, or relieve inhibition by harmful substances. A significant interaction between
light and water flow was detected: the enhancing effect of light on specific growth rate as
buoyant mass was much higher at high flow (48%, p<0.0001) than at low flow (23.2%,
N.S.), which suggests an effect of flow on light utilization. However, no significant differ-
ences were found in net photosynthetic rate, suggesting that enhancement of skeletal
growth between 280 and 560 μE m-2 s-1 was not mediated by net photosynthesis. Water
flow could have increased growth by relieving light stress or relieving limitation by (in)
organic nutrients.
Heterotrophic feeding
Heterotrophic feeding could be another potential limiting resource for coral growth, as
indicated when comparing the studies of Moya et al. 2006 and Houlbrèque et al. 2004
on Stylophora pistillata. Moya et al. 2006 found that calcification of S. pistillata already
obtained its optimal calcification rate at an irradiance level of ca 100 μE m-2 s-1, while in a
separate study Houlbrèque et al. 2004 found that additional heterotrophic feeding could
increase the photosynthetic potential of S. pistillata at high irradiance levels. This sug-
gests a specific limitation for e.g. N, P or organic nutrients at high irradiance levels and
therefore, a similar effect of heterotrophic feeding was expected for calcification (Figure
2) and hence coral growth.
In a preliminary experiment the hypothesis was tested that heterotrophic feeding can
overcome growth limitation at high irradiance levels, by measuring differences in short-
term calcification (alkalinity anomaly technique, Chisholm and Gattuso 1991) between
ambient and enhanced fed corals (n=3) at an irradiance of either 200 or 400 μE m-2 s-1.
Although growth did increase in response to additional feeding, our results in this prelimi-
nary study were not conclusive. Suggestions for different approaches are done in section
7.3.2.

Chapter 7
7
156
Measurement of photosynthesis
We studied the relation between the rate of photosynthesis and growth rate. In future re-
search more attention should be given to the methodology of measurement of photosyn-
thesis. Photosynthesis is measured in short term experiments. When corals are taken out
of the culture tank to measure photosynthesis they might either be un-adapted to the new
situation (i.e. short-term exposure to different irradiation levels, photosynthesis-irradiance
curve, Chapter 3) or adapted (i.e. long-term exposure to its growth irradiance, Chapter
5). In case the corals are adapted it is expected that results are more reliable.
Figure 2: Comparison of the net photosynthetic rate of the scleractinian coral S. pistillata mea-
sured under starved (open circles) and fed (closed circles) conditions (Houlbrèque et al. 2004)
(n=10, values are means ± S.D.) with the calcification rate of S. pistillata measured in a different
study under normal feeding conditions (Moya et al. 2006) (n=3). The dotted line is the assumed
maximum calcification rate for irradiance levels 400 – 800 μE m-2 s-1, while the dashed line (closed
circles) is the postulated calcification rate under enhanced feeding conditions.
General Discussion
157
7
Light respiration and mucus production
It is possible that calcification is not directly enhanced by the process of photosynthesis
itself, but by increased amount of translocated carbon (Falkowski et al. 1984), increased
light respiration (Lewitus and Kana 1995) and/or increased mucus production (Crossland
1987). Further support for the concept that growth is not directly enhanced by photosyn-
thesis, comes from the observation that flow-enhanced photosynthesis is not positively
related to skeletal growth at an irradiance of 90 μE m-2 s-1(Chapter 2). It remains to be
determined whether this is true for all irradiance levels.
3.2 Future perspectives for irradiance
3.2.1 Light-enhanced calcification
Since Chapter 3 and Chapter 5 gave conflicting results with respect to the enhancement
of growth by photosynthesis, another approach is needed to answer the question whether
light-enhanced calcification is indeed mediated by net photosynthetic rate, and whether this
enhancement occurs throughout the entire light range. Using the holistic approach, creat-
ing light-saturation curves for specific growth rate and net photosynthesis, several points
of our initial experimental setup can be refined. First, since corals will acclimate to the light
intensity at which they are cultured, possibly leading to similar photosynthetic rates at a
range of light intensities, photosynthesis of each coral should be measured at its ambient
growth irradiance (i.e. each coral is adjusted to its tested irradiance). Second, more data
points are needed to draw a solid conclusion. Both the number of irradiance levels at which
corals are cultured and the number of corals measured for photosynthesis per irradiance
level should be increased to be able to construct reliable light-saturation curves for specific
growth rate and net photosynthesis. Also, more refined measurements could be used to
detect subtle differences. Third, light-enhanced calcification can be measured more directly
by using e.g. the alkalinity anomaly technique at a certain irradiance. The calculation of
specific growth rate based on buoyant masses also incorporates lower calcification rates
during the night, which results in lower estimates of coral growth than the direct measure-
ment of calcification (i.e. the deposition of calcium carbonate) under a certain light regime.
Chapter 7
7
158
Ideally, the corals would be cultured in flow-though respirometric cells in which metabolism
(photosynthesis and calcification) could be measured throughout a (short) growth period
without disturbing the coral. In such a way, a direct correlation between photosynthesis and
its effect on deposition of calcium carbonate could be established, providing more insight
into the mechanism of calcification. Fourth, we would like to measure light respiration. If the
rate of light respiration increases, a larger amount of metabolic CO2 as source of carbon
for calcification is available. The potential acidifying effect of increased metabolic CO2 is
neutralized simultaneously by the secretion of OH- during photosynthesis (Allemand et al.
2004) and the conversion of CO2 to HCO3- by carbonic anhydrase (Moya et al. 2008b).
3.2.2 Importance of phototrophic feeding versus heterotrophic feeding
The relative importance of phototrophic versus heterotrophic feeding remains poorly un-
derstood (Houlbrèque and Ferrier-Pagès 2009). For the work in this thesis it was assumed
that phototrophic feeding is of key importance for growth of zooxanthellate scleractinian
corals, while under natural, oligotrophic circumstances the importance of heterotrophic
feeding lies in the supply of potentially limiting nutrients, such as nitrogen, phosphorus
and aspartate (i.e. a more qualitative contribution).
Facts in support of this view are:
Heterotrophic feeding is considered to be essential for the supply of potentially limit-a.
ing nutrients, such as nitrogen, phosphorus and aspartate (Allemand et al. 1998a,
Houlbrèque and Ferrier-Pagès 2009). Photosynthates are considered as junk food,
since they are generally deficient in nitrogen and phosphorus. Supplementing the
water with inorganic nutrients stimulates photosynthesis and zooxanthellae density,
but does not augment coral growth (Marubini and Davies 1996), indicating depen-
dency on heterotrophic feeding for specific components.
The ability to change trophic mode seems to be a mechanism for sustaining a posi-b.
tive energy balance under less beneficial conditions. Heterotrophic feeding can
therefore become quantitatively important under conditions where phototrophic input
is reduced, e.g. with depth (Palardy et al. 2006), bleaching (Grottoli et al. 2006) and
turbidity (Anthony and Fabricius 2000).
General Discussion
159
7
Since the influence of heterotrophic feeding on coral growth under different light con-c.
ditions is merely additive (Ferrier-Pagès et al. 2003, Houlbrèque and Ferrier-Pagès
2009), it seems that once basic qualitative requirements for coral growth are met,
increased growth is mostly due to the increased availability of carbon from either a
heterotrophic or phototrophic food source.
The quantitative importance of heterotrophic feeding to coral growth might be underes-
timated in aquaria, since usually more emphasis is put on light requirements. In aquaria
increased heterotrophic feeding is unwanted because it puts increased demands on fil-
tration in order to maintain proper water quality.
To test whether enhanced feeding has an additive or interactive effect on coral growth,
the following should be taken into account. In our preliminary study, the expected (interac-
tive) effect of heterotrophic feeding on coral growth (i.e. relieving growth-limitation at high
irradiance levels) was not evident between 200 μE m-2 s-1 and 400 μE m-2 s-1. However,
it is possible that the effect of heterotrophic feeding takes place between different irradi-
ance levels. It is suggested to construct light-saturation curves for calcification of both
ambient and enhanced fed corals (see Figure 2) by measuring calcification at a range
of (growth) irradiance levels. Using such curves, it would be possible to test whether the
point of light-saturation for calcification increases with increased heterotrophic feeding.
The question how heterotrophic feeding increases coral growth also awaits further in-
vestigation. The qualitative or “nutrient”-hypothesis, i.e. that heterotrophic feeding stimu-
lates coral growth through an increased supply of N, P and organic nutrients, can be
further split up in the following two hypotheses. First, heterotrophic feeding enhances
coral growth directly by supplying precursors for the organic matrix (e.g. aspartic acid).
Second, heterotrophic feeding enhances coral growth indirectly by increasing photosyn-
thesis and the translocation of photosynthates of a higher quality. The first hypothesis
can be tested by adding different amounts of [14C] labeled aspartate (Allemand et al.
1998a) and relating the amount of [14C] labeled aspartate that is incorporated under dif-
ferent feeding conditions to coral growth. Although it has been demonstrated that supply
of aspartic acid through heterotrophic feeding is needed for organic matrix synthesis, it is
not known if the supply of aspartic acid is limiting under normal conditions. The second
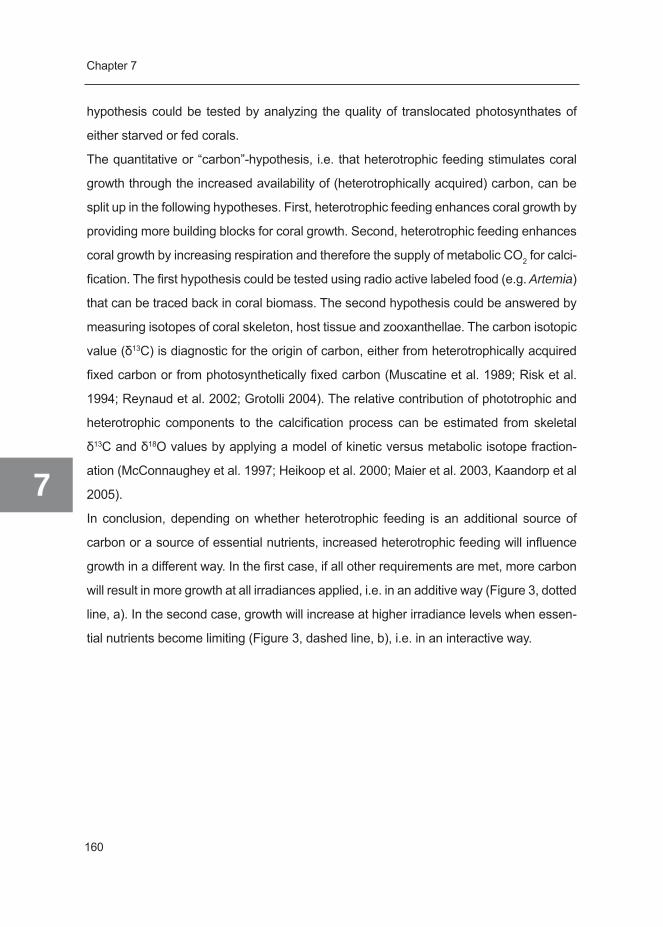
Chapter 7
7
160
hypothesis could be tested by analyzing the quality of translocated photosynthates of
either starved or fed corals.
The quantitative or “carbon”-hypothesis, i.e. that heterotrophic feeding stimulates coral
growth through the increased availability of (heterotrophically acquired) carbon, can be
split up in the following hypotheses. First, heterotrophic feeding enhances coral growth by
providing more building blocks for coral growth. Second, heterotrophic feeding enhances
coral growth by increasing respiration and therefore the supply of metabolic CO2 for calci-
fication. The first hypothesis could be tested using radio active labeled food (e.g. Artemia)
that can be traced back in coral biomass. The second hypothesis could be answered by
measuring isotopes of coral skeleton, host tissue and zooxanthellae. The carbon isotopic
value (δ13C) is diagnostic for the origin of carbon, either from heterotrophically acquired
fixed carbon or from photosynthetically fixed carbon (Muscatine et al. 1989; Risk et al.
1994; Reynaud et al. 2002; Grotolli 2004). The relative contribution of phototrophic and
heterotrophic components to the calcification process can be estimated from skeletal
δ13C and δ18O values by applying a model of kinetic versus metabolic isotope fraction-
ation (McConnaughey et al. 1997; Heikoop et al. 2000; Maier et al. 2003, Kaandorp et al
2005).
In conclusion, depending on whether heterotrophic feeding is an additional source of
carbon or a source of essential nutrients, increased heterotrophic feeding will influence
growth in a different way. In the first case, if all other requirements are met, more carbon
will result in more growth at all irradiances applied, i.e. in an additive way (Figure 3, dotted
line, a). In the second case, growth will increase at higher irradiance levels when essen-
tial nutrients become limiting (Figure 3, dashed line, b), i.e. in an interactive way.
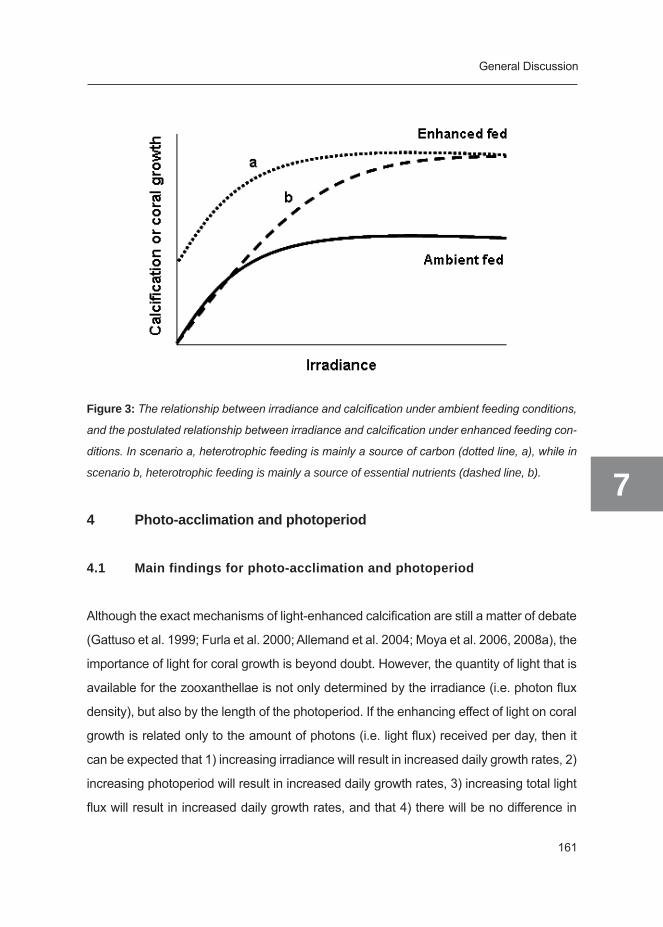
General Discussion
161
7
Figure 3: The relationship between irradiance and calcification under ambient feeding conditions,
and the postulated relationship between irradiance and calcification under enhanced feeding con-
ditions. In scenario a, heterotrophic feeding is mainly a source of carbon (dotted line, a), while in
scenario b, heterotrophic feeding is mainly a source of essential nutrients (dashed line, b).
4 Photo-acclimation and photoperiod
4.1 Main findings for photo-acclimation and photoperiod
Although the exact mechanisms of light-enhanced calcification are still a matter of debate
(Gattuso et al. 1999; Furla et al. 2000; Allemand et al. 2004; Moya et al. 2006, 2008a), the
importance of light for coral growth is beyond doubt. However, the quantity of light that is
available for the zooxanthellae is not only determined by the irradiance (i.e. photon flux
density), but also by the length of the photoperiod. If the enhancing effect of light on coral
growth is related only to the amount of photons (i.e. light flux) received per day, then it
can be expected that 1) increasing irradiance will result in increased daily growth rates, 2)
increasing photoperiod will result in increased daily growth rates, 3) increasing total light
flux will result in increased daily growth rates, and that 4) there will be no difference in
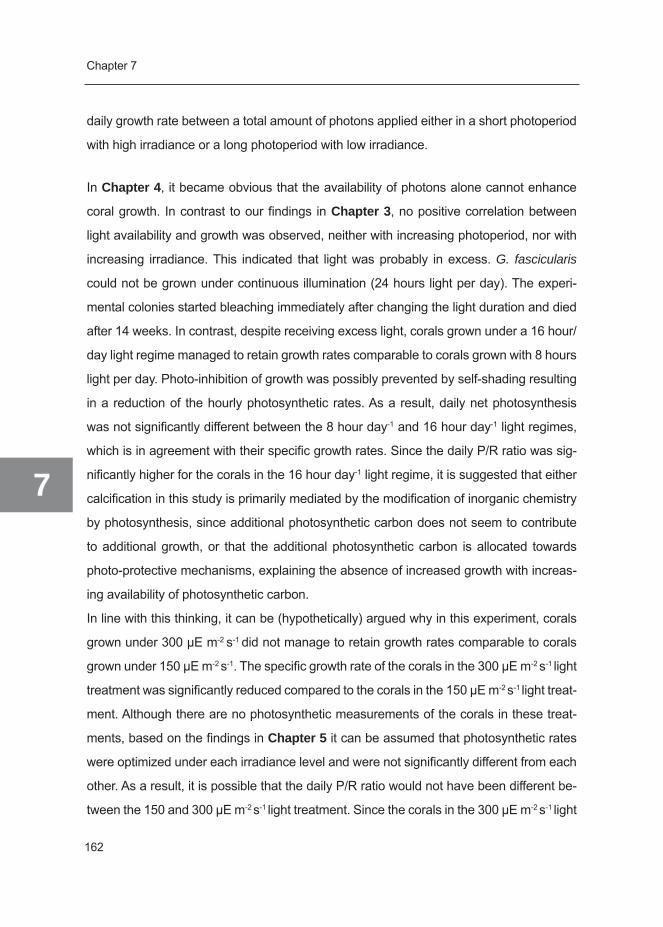
Chapter 7
7
162
daily growth rate between a total amount of photons applied either in a short photoperiod
with high irradiance or a long photoperiod with low irradiance.
In Chapter 4, it became obvious that the availability of photons alone cannot enhance
coral growth. In contrast to our findings in Chapter 3, no positive correlation between
light availability and growth was observed, neither with increasing photoperiod, nor with
increasing irradiance. This indicated that light was probably in excess. G. fascicularis
could not be grown under continuous illumination (24 hours light per day). The experi-
mental colonies started bleaching immediately after changing the light duration and died
after 14 weeks. In contrast, despite receiving excess light, corals grown under a 16 hour/
day light regime managed to retain growth rates comparable to corals grown with 8 hours
light per day. Photo-inhibition of growth was possibly prevented by self-shading resulting
in a reduction of the hourly photosynthetic rates. As a result, daily net photosynthesis
was not significantly different between the 8 hour day-1 and 16 hour day-1 light regimes,
which is in agreement with their specific growth rates. Since the daily P/R ratio was sig-
nificantly higher for the corals in the 16 hour day-1 light regime, it is suggested that either
calcification in this study is primarily mediated by the modification of inorganic chemistry
by photosynthesis, since additional photosynthetic carbon does not seem to contribute
to additional growth, or that the additional photosynthetic carbon is allocated towards
photo-protective mechanisms, explaining the absence of increased growth with increas-
ing availability of photosynthetic carbon.
In line with this thinking, it can be (hypothetically) argued why in this experiment, corals
grown under 300 μE m-2 s-1 did not manage to retain growth rates comparable to corals
grown under 150 μE m-2 s-1. The specific growth rate of the corals in the 300 μE m-2 s-1 light
treatment was significantly reduced compared to the corals in the 150 μE m-2 s-1 light treat-
ment. Although there are no photosynthetic measurements of the corals in these treat-
ments, based on the findings in Chapter 5 it can be assumed that photosynthetic rates
were optimized under each irradiance level and were not significantly different from each
other. As a result, it is possible that the daily P/R ratio would not have been different be-
tween the 150 and 300 μE m-2 s-1 light treatment. Since the corals in the 300 μE m-2 s-1 light
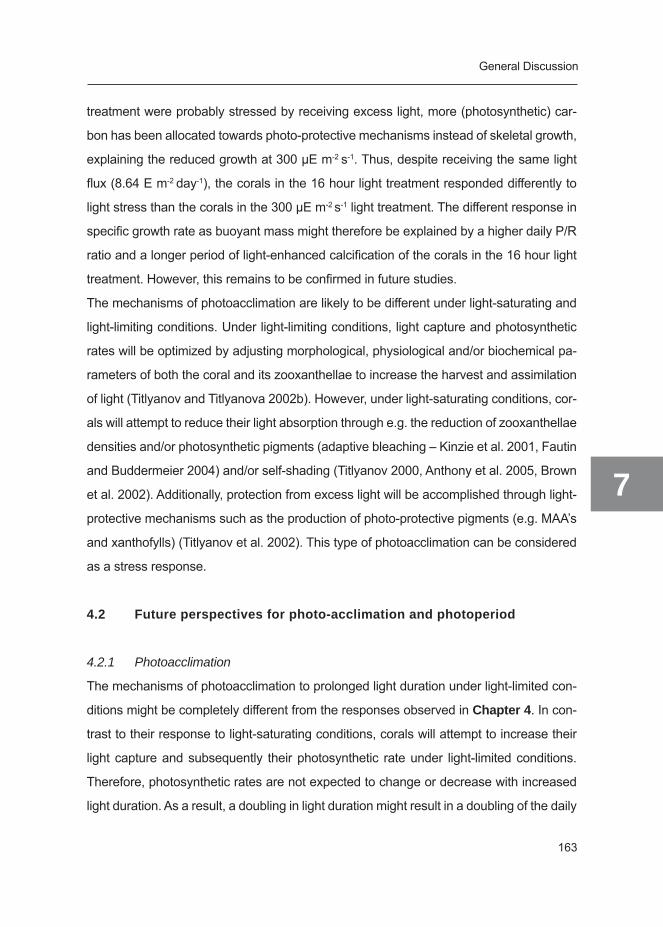
General Discussion
163
7
treatment were probably stressed by receiving excess light, more (photosynthetic) car-
bon has been allocated towards photo-protective mechanisms instead of skeletal growth,
explaining the reduced growth at 300 μE m-2 s-1. Thus, despite receiving the same light
flux (8.64 E m-2 day-1), the corals in the 16 hour light treatment responded differently to
light stress than the corals in the 300 μE m-2 s-1 light treatment. The different response in
specific growth rate as buoyant mass might therefore be explained by a higher daily P/R
ratio and a longer period of light-enhanced calcification of the corals in the 16 hour light
treatment. However, this remains to be confirmed in future studies.
The mechanisms of photoacclimation are likely to be different under light-saturating and
light-limiting conditions. Under light-limiting conditions, light capture and photosynthetic
rates will be optimized by adjusting morphological, physiological and/or biochemical pa-
rameters of both the coral and its zooxanthellae to increase the harvest and assimilation
of light (Titlyanov and Titlyanova 2002b). However, under light-saturating conditions, cor-
als will attempt to reduce their light absorption through e.g. the reduction of zooxanthellae
densities and/or photosynthetic pigments (adaptive bleaching – Kinzie et al. 2001, Fautin
and Buddermeier 2004) and/or self-shading (Titlyanov 2000, Anthony et al. 2005, Brown
et al. 2002). Additionally, protection from excess light will be accomplished through light-
protective mechanisms such as the production of photo-protective pigments (e.g. MAA’s
and xanthofylls) (Titlyanov et al. 2002). This type of photoacclimation can be considered
as a stress response.
4.2 Future perspectives for photo-acclimation and photoperiod
4.2.1 Photoacclimation
The mechanisms of photoacclimation to prolonged light duration under light-limited con-
ditions might be completely different from the responses observed in Chapter 4. In con-
trast to their response to light-saturating conditions, corals will attempt to increase their
light capture and subsequently their photosynthetic rate under light-limited conditions.
Therefore, photosynthetic rates are not expected to change or decrease with increased
light duration. As a result, a doubling in light duration might result in a doubling of the daily
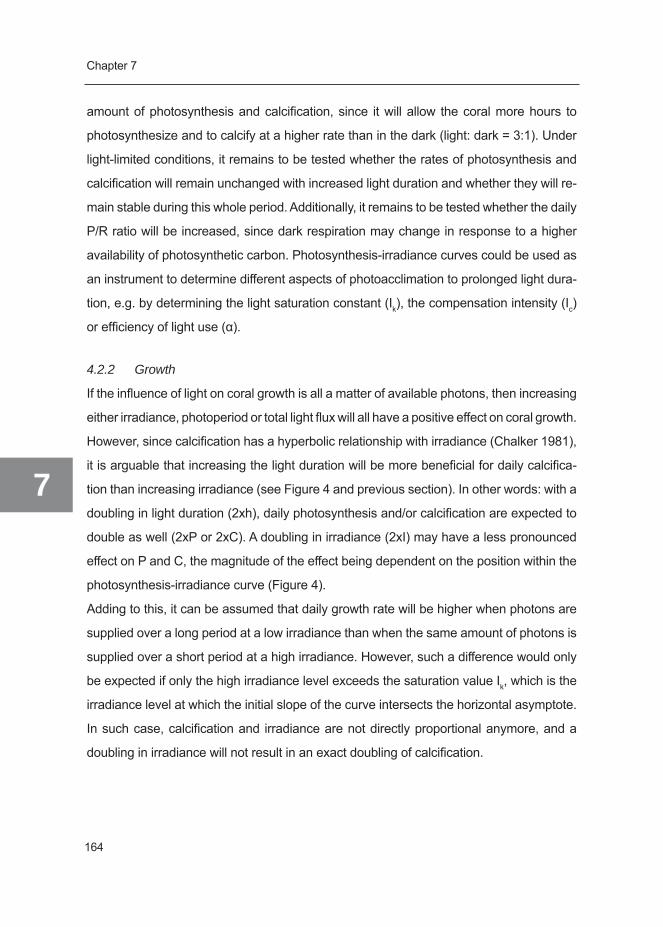
Chapter 7
7
164
amount of photosynthesis and calcification, since it will allow the coral more hours to
photosynthesize and to calcify at a higher rate than in the dark (light: dark = 3:1). Under
light-limited conditions, it remains to be tested whether the rates of photosynthesis and
calcification will remain unchanged with increased light duration and whether they will re-
main stable during this whole period. Additionally, it remains to be tested whether the daily
P/R ratio will be increased, since dark respiration may change in response to a higher
availability of photosynthetic carbon. Photosynthesis-irradiance curves could be used as
an instrument to determine different aspects of photoacclimation to prolonged light dura-
tion, e.g. by determining the light saturation constant (Ik), the compensation intensity (Ic)
or efficiency of light use (α).
4.2.2 Growth
If the influence of light on coral growth is all a matter of available photons, then increasing
either irradiance, photoperiod or total light flux will all have a positive effect on coral growth.
However, since calcification has a hyperbolic relationship with irradiance (Chalker 1981),
it is arguable that increasing the light duration will be more beneficial for daily calcifica-
tion than increasing irradiance (see Figure 4 and previous section). In other words: with a
doubling in light duration (2xh), daily photosynthesis and/or calcification are expected to
double as well (2xP or 2xC). A doubling in irradiance (2xI) may have a less pronounced
effect on P and C, the magnitude of the effect being dependent on the position within the
photosynthesis-irradiance curve (Figure 4).
Adding to this, it can be assumed that daily growth rate will be higher when photons are
supplied over a long period at a low irradiance than when the same amount of photons is
supplied over a short period at a high irradiance. However, such a difference would only
be expected if only the high irradiance level exceeds the saturation value Ik, which is the
irradiance level at which the initial slope of the curve intersects the horizontal asymptote.
In such case, calcification and irradiance are not directly proportional anymore, and a
doubling in irradiance will not result in an exact doubling of calcification.
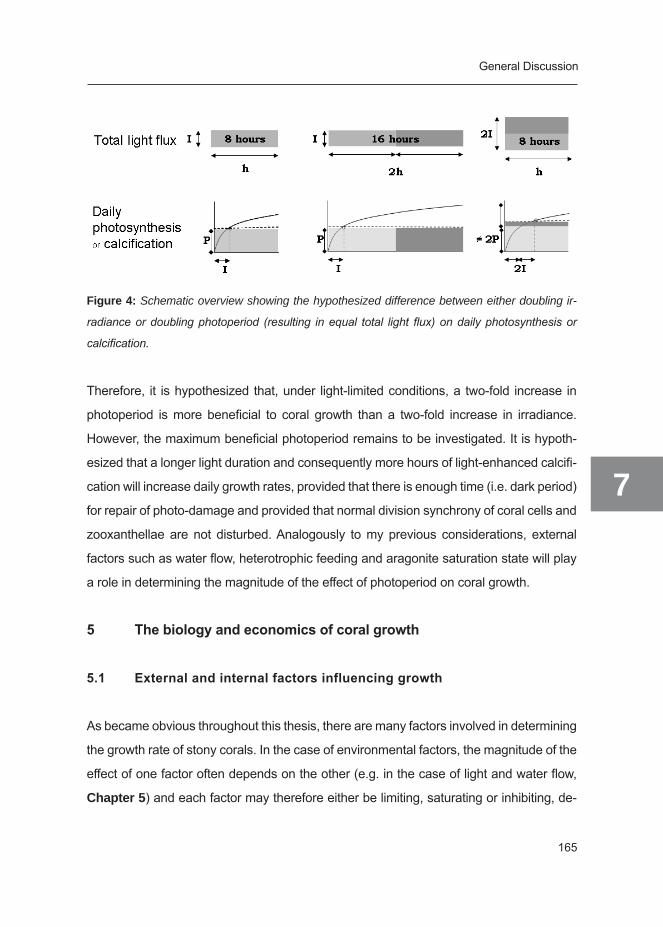
General Discussion
165
7
Figure 4: Schematic overview showing the hypothesized difference between either doubling ir-
radiance or doubling photoperiod (resulting in equal total light flux) on daily photosynthesis or
calcification.
Therefore, it is hypothesized that, under light-limited conditions, a two-fold increase in
photoperiod is more beneficial to coral growth than a two-fold increase in irradiance.
However, the maximum beneficial photoperiod remains to be investigated. It is hypoth-
esized that a longer light duration and consequently more hours of light-enhanced calcifi-
cation will increase daily growth rates, provided that there is enough time (i.e. dark period)
for repair of photo-damage and provided that normal division synchrony of coral cells and
zooxanthellae are not disturbed. Analogously to my previous considerations, external
factors such as water flow, heterotrophic feeding and aragonite saturation state will play
a role in determining the magnitude of the effect of photoperiod on coral growth.
5 Thebiologyandeconomicsofcoralgrowth
5.1 Externalandinternalfactorsinfluencinggrowth
As became obvious throughout this thesis, there are many factors involved in determining
the growth rate of stony corals. In the case of environmental factors, the magnitude of the
effect of one factor often depends on the other (e.g. in the case of light and water flow,
Chapter 5) and each factor may therefore either be limiting, saturating or inhibiting, de-
Chapter 7
7
166
pending on the level of other factors. Chapter 6 gives an overview of important external
factors that can limit or inhibit coral growth and points out interactions between factors.
Besides external environmental factors, also internal genetic factors affect the growth
rate of an individual. Each genet will respond differently to a different set of environmental
factors (Chapter 6; Shai Shafir, pers. comm.).
As mentioned before in this thesis, there is a lack of scientific studies focusing on op-
timizing coral husbandry. Throughout this thesis, a trade-off has been made between
relevance for fundamental coral science and applicability in coral husbandry, which was
the main aim of the CORALZOO project.
5.1.1 Relevance for fundamental coral science
By using genetically identical nubbins of G. fascicularis we were able to deduce general
mechanisms of coral growth. General physiological mechanisms are best studied using
coral colonies of a single genotype, since this will leave out variability due to genetic dif-
ferences. Besides, when using a single genotype, less coral colonies will be required to
obtain statistical significant results. As a consequence, less aquarium space and less
time and effort for maintaining and analyzing all coral colonies is needed. Additionally,
coral nubbins of G. fascicularis are easy to create, since their large polyps (average Ø
4mm, in this study) can be easily cut apart using a knife and tweezers. Survival of these
nubbins is usually nearly 100%, which makes G. fascicularis very suitable as a model
species for laboratory studies. Nevertheless, G. fascicularis is not the ideal coral spe-
cies to study coral growth mechanisms. First, its slow growth rate resulted in very long
experimental times (up to a year) if we wanted to detect significant differences between
treatments. Second, its specific experimental growth rate was not constant in time (and
thus dependent on size), making comparisons between sizes difficult.
Based on the data in this thesis and on literature data, the following universal mechanism
for coral growth is proposed: the coral-algal symbiosis will adapt to the prevailing light
regime by optimizing light capture and light processing at different levels of the organism
(Titlyanov and Titlyanova 2002ab), in an attempt to maximize light use. Depending on ex-
ternal environmental conditions, photoacclimation may not always be sufficient to obtain
General Discussion
167
7
light saturation for coral growth. Under light-limited conditions, the coral will try to com-
pensate for its reduced phototrophic input by heterotrophic feeding or by reducing poten-
tial losses (e.g. by lowering respiration and/or mucus production). Under light-saturating
conditions, other environmental factors start to limit or inhibit coral growth, e.g. inorganic
nutrients, heterotrophic food, inorganic carbon or the presence of water flow. Water flow
is very important in both situations, since without flow it is difficult to adapt to both a het-
erotrophic life style (no supply of food) and to a phototrophic life style (light stress due to
lack of removal of inhibiting substances produced during photosynthesis).
The scientific approach would benefit from multi-factorial experiments (e.g. Chapter 5),
since such experiments will provide more insight in the interactions between factors.
Such insight will provide indications on mechanisms and might thus serve as guidelines
for mechanistic studies. The potential disadvantage of the multi-factorial approach is the
requirement of more coral colonies, more aquarium space, more time for monitoring and
maintenance. However, although single-factor experiments require less space and time,
such experiments only allow evaluation of the factor under study under the conditions
of the experiment, thus yielding much less information. Ultimately, multi-factorial experi-
ments will produce more information while using less coral colonies, especially when
using statistical designs.
Besides using multi-factorial growth experiments, experiments could be improved by
shortening experimental time (e.g. by using short term measurements) and, depending
on the question asked, choosing more specific measurements of coral growth (e.g. calci-
um carbonate deposition or organic matrix synthesis). As explained in section 6.3.2., the
mechanism of light-enhanced calcification can be studied more precisely by measuring
calcification instead of coral growth. Specific, but destructive methods such as measuring
the incorporation of radioisotopes into the skeleton (Tambutté et al. 1995, 1996) or organ-
ic matrix (Allemand et al. 1998a) can be used. However, in such case, only a single set
of experimental conditions can be studied per incubation. If one wants to study changes
in growth over time and/or under different experimental conditions (e.g. constructing a
light saturation curve for skeletal growth or calcification), non-destructive measurements
of coral growth should be used. Examples of non destructive measurements are the
Chapter 7
7
168
buoyant weighing technique for skeletal growth (Jokiel 1978, Davies 1989) or the alkalin-
ity anomaly technique for calcification (Chisholm and Gattuso 1991). Downside of using
more specific measurement of coral growth is that coral growth parameters such as 14Ca
incorporation into the skeleton are not easily extrapolated to relevant biomass parameter
for coral culture.
5.1.2 Relevance and applicability in coral husbandry
The relevance of our experiments for aquarium practices lies in the long-term monitor-
ing of coral growth and measuring a biomass parameter that is relevant for aquaculture
(i.e. the experiments approximate real-life coral production scenarios). Measurement of
growth at regular intervals gives insight in growth kinetics, which can be a helpful tool for
estimating coral aquaculture productivity (see next section). Nevertheless, our results are
specific for the particular genet of G. fascicularis that was used for the experiments. Since
the magnitude of the effect of a given factor on coral growth depends both on the species
and on the genet, the results on a single genotype cannot be extrapolated to the spe-
cies level and certainly not to the level of Scleractinia (Chapter 6). Therefore, our results
should not be used as a blueprint for coral aquaculture. The value of our experiments for
coral aquaculture lies in the fact that knowledge of mechanisms and relative importance
of factors allows targeted optimization of coral growth. Hence, the information in this the-
sis can be used as a blueprint for targeted optimization studies. In particular, knowledge
on interactions allows targeted optimization of coral growth and maximization of produc-
tivity for coral culture. An example of this in this thesis is the interaction between light and
water flow, which implies that these factors should be evaluated simultaneously and not
separately. The aquarium industry will thus also benefit from multi-factorial experiments,
since such experiments will uncover interactions and facilitate extrapolation of the results
to different coral culture conditions (within the framework of the experiment) and will thus
increase the value of the experiment for coral culture purposes.
Practical experiments could additionally be improved by shortening experimental time,
e.g. by using a fast-growing genet of each species to be cultured and/or high resolution
measurements of coral growth. As a result of genetic variability, each coral species and
General Discussion
169
7
genet should be optimized separately (principles are the same, specific optimal combina-
tion of conditions is variable between species and genets). Depending on the extent to
which different species or genotypes need different culture conditions for optimal growth,
individual species and genotypes should be kept in separate culture systems. Drawbacks
of such ‘monoculture’ is a higher vulnerability of the population to stressors due to the lack
of genetic diversity. Therefore it can be recommended to keep a ‘back up’ of each species
in a different system.
5.2 Growthmodels
Knowledge of growth kinetics of a coral species can be used as a tool to predict growth
in mariculture. Theoretically, if a model appropriately describes growth there should be no
correlation between the growth rate constant and the size of the coral. However, as shown
in Chapter 3, specific exponential growth rate of G. fascicularis decreases with time and
increasing colony size. With the help of more sophisticated modeling approaches, a more
constant specific growth rate could be reached. Such a model could enable more realistic
estimates of long-term coral production and ease the comparison of growth rates between
culture conditions. Growth of G. fascicularis (expressed as the increase in buoyant mass)
was found to have a better fit to a surface-dependent growth model (Sipkema et al. 2006)
than to an exponential growth model (see Table 1). Since calcification only occurs in the
calicoblastic epithelium of the coral tissue, skeletal growth is limited to the surface area of
the coral’s tissue. It is therefore the size of the surface and not of the volume of the colony
that is determining the rate of calcification (Bak 1976). As result, the most appropriate
model to describe the skeletal growth of a mound-shaped coral like G. fascicularis must be
a model describing surface-area related growth of half a sphere (which is an approxima-
tion of the shape of a mound-shaped coral). Another approach is using surface area as
a growth parameter for two-dimensional growth analysis. The circumference-dependent
growth model (Sipkema et al. 2006) also had a higher fit than the exponential growth
model (Table 2) for the corals in the 10 cm s-1, 20 cm s-1 and 25 cm s-1 flow treatment. The
selection of a growth model and its corresponding growth parameter depends on whether
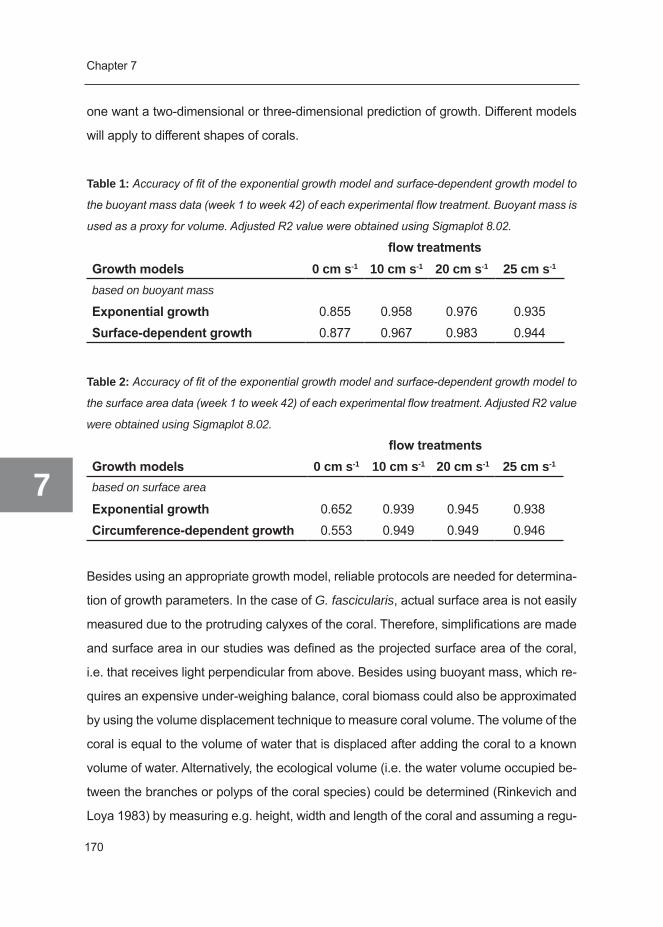
Chapter 7
7
170
one want a two-dimensional or three-dimensional prediction of growth. Different models
will apply to different shapes of corals.
Table 1: Accuracy of fit of the exponential growth model and surface-dependent growth model to
the buoyant mass data (week 1 to week 42) of each experimental flow treatment. Buoyant mass is
used as a proxy for volume. Adjusted R2 value were obtained using Sigmaplot 8.02.
flowtreatmentsGrowthmodels 0 cm s-1 10 cm s-1 20 cm s-1 25 cm s-1
based on buoyant mass
Exponentialgrowth 0.855 0.958 0.976 0.935Surface-dependentgrowth 0.877 0.967 0.983 0.944
Table 2: Accuracy of fit of the exponential growth model and surface-dependent growth model to
the surface area data (week 1 to week 42) of each experimental flow treatment. Adjusted R2 value
were obtained using Sigmaplot 8.02.
flowtreatmentsGrowthmodels 0 cm s-1 10 cm s-1 20 cm s-1 25 cm s-1
based on surface area
Exponentialgrowth 0.652 0.939 0.945 0.938Circumference-dependentgrowth 0.553 0.949 0.949 0.946
Besides using an appropriate growth model, reliable protocols are needed for determina-
tion of growth parameters. In the case of G. fascicularis, actual surface area is not easily
measured due to the protruding calyxes of the coral. Therefore, simplifications are made
and surface area in our studies was defined as the projected surface area of the coral,
i.e. that receives light perpendicular from above. Besides using buoyant mass, which re-
quires an expensive under-weighing balance, coral biomass could also be approximated
by using the volume displacement technique to measure coral volume. The volume of the
coral is equal to the volume of water that is displaced after adding the coral to a known
volume of water. Alternatively, the ecological volume (i.e. the water volume occupied be-
tween the branches or polyps of the coral species) could be determined (Rinkevich and
Loya 1983) by measuring e.g. height, width and length of the coral and assuming a regu-
General Discussion
171
7
lar shape (Bongiorni et al. 2003b). (Ecological) volume is a useful parameter for aquarium
purposes, since it gives a reliable estimate of the space it needs in the aquarium system
that cannot be used by other organisms
5.3 Potential cost reductions for coral aquaculture
5.3.1 Adjusting environmental factors
Besides optimizing coral growth, also cost reductions can be made when knowing the
interactions between factors. In such case, factors can be adjusted to each other to reach
maximum benefit for coral production. Examples of this are:
Irradianceandwaterflow,a. as demonstrated in Chapter 5. A significant interaction
was found between irradiance and water flow, confirming that the stimulating effect
of light on coral growth of G. fascicularis colonies is much more enhanced at high(er)
water flow rates. It seems even that coral growth is inhibited at the combination of
high irradiance with low flow. Consequently, it is a waste of money and energy to
apply a high irradiance without applying sufficient flow, since there will be no propor-
tional return in coral production. However, one needs to remain cautious, because
different coral species may respond differently. These results stress the importance
of the availability of sufficient water flow for optimal light utilization for growth.
Irradiance and aragonite saturation stateb. , as demonstrated by Marubini et al.
(2001). A significant interaction was found between irradiance and aragonite satura-
tion state, confirming that the stimulating effect of light on coral growth is much more
enhanced at a high(er) aragonite saturation state. Coral growth of Porites compressa
benefited from a higher aragonite saturation state at very high irradiances (700 µE
m-2 s-1). Consequently, application of more light is more beneficial when having a
higher aragonite saturation state. The costs of running a calcium reactor at a higher
level and using more coral sand to fuel it are nothing compared to the benefits of a
higher coral production. Most of the calcium carbonate that is dissolved inside the
calcium reactor will eventually return in the form of newly formed carbonate skel-
eton.
Chapter 7
7
172
Light and feedingc. . In the aquarium world, for many years the belief persisted that
more light resulted in more growth and that additional feeding was not important. Sev-
eral studies showed that coral growth can benefit from additional heterotrophic feeding
(Houlbrèque et al. 2003, 2004, Ferrier-Pagès et al. 2003). Ferrier-Pagès et al. (2003)
reported that Stylophora pistillata had increased growth with increasing irradiance (80
and 300 μE m-2 s-1) both under fed and starved conditions. On the other hand, addition-
al feeding could be a waste of money when it is not additive. For example, Lavorano et
al. 2008 did not find a difference in growth of P. damicornis between different feeding
regimes (0, 2000, 4000 and 8000 art l-1, 5 days a week, 5 hours feeding time) after 126
days. This indicates that feeding was not additive for this species under the circum-
stances of the experiment. Possibly, the level of irradiance (200 μE m-2 s-1) was limiting
in this study, since in a later study they did find a difference in growth between feeding
regimes at an irradiance of 300 μE m-2 s-1. Corals fed with 2000 art l-1 grew significantly
more than corals fed with 0 or 500 art l-1 (Chapter 6, Sylvia Lavorano pers. comm.).
Similarly, the data of Houlbrèque et al. 2003 indicate that neither control nor fed corals
of S. pistillata had increased growth with increasing irradiance (80, 200 and 300 μE m-2
s-1). It is not known which factor was limiting coral growth in that study.
An outline of costs should be made for each situation and coral species to estimate the
benefits for increased heterotrophic feeding for coral growth against the possible drawback
of needing more filtration power to maintain proper water quality. A solution for maintain-
ing proper water quality while maintaining high feeding levels is using a plankton friendly
aquarium system that stimulates the natural build-up of plankton populations and enhances
natural cycles for nutrient decomposition inside the aquarium.
5.3.2 Adjusting aquarium technology
Also cost reductions can be made by using efficient lighting i.e. a cost-efficient lamp type
and cost-efficient lighting strategy (see section 6.4.2). Many different types of artificial light
sources are available nowadays, i.e. with different light outputs, light spectra (often de-
scribed by the manufacturer as color temperature in degrees Kelvin, which is a rough ap-
proximation for light spectrum) and energy-saving properties.
General Discussion
173
7
Blue and white light were found to promote more skeletal growth in P. damicornis and
Montipora verrucosa than green or red light in (Kinzie et al. 1984). Whether blue light is
the deciding factor in promoting growth remains to be investigated, since Riddle (2008)
did not find a correlation between the amount of blue light and growth rate of Acropora
solitaryensis. In contrast, consistent with the findings of Kinzie et al. (1984), Riddle (2008)
found a negative correlation between the amount of red light and growth rate. Since red
light does not penetrate deeply into the water column (i.e. it is absorbed at relatively shal-
low depths), many corals are found in environments deficient in red light. ‘Strong’ red light
is therefore unnatural and might be inhibiting coral growth. A blue-white light spectrum is
often used in coral aquaculture and is thought to be most efficient light spectrum for coral
growth.
A new entrant into the market of aquarium lighting is LED (Light Emitting Diode) lighting.
Besides having a lower energy consumption per amount of light emitted, LED lighting
has many other advantages over traditional light sources (such as fluorescent lighting
and metal halides), including a longer life time and the nearly complete absence of heat
build-up. Besides this, LED lighting is also available in many different colors and light
spectra, it is possible to adjust the light output by dimming and their light is focused into
the aquarium without the use of external reflectors. The downside of LED lighting is the
initial costs of purchase. However, due to the longer life time, this initial cost of purchase
can be recovered in time with low running costs (electricity usage reduction) and less
bulb replacements. Although there is yet little (scientific) experience with LED aquarium
lighting, the technique looks promising and awaits investigation.
Appeal to market
Next to the efficiency of coral growth and its production costs, the economics of the cul-
ture of scleractinian corals for commercial purposes is also affected by the size, price,
morphology (shape) and coloration of the final product (Delbeek 2001). Of these factors,
color is by far the most important to increase the chance of market penetration and gain-
ing the largest share of that market (Delbeek 2001). Pronounced coloration of corals (i.e.
bright blue, green, purple or pink) is mostly due to the presence photo-protective pig-
Chapter 7
7
174
ments (e.g. fluorescent pigments and chromo proteins) that are synthesized in response
to stressful amounts of light, as occurs in nature in shallow reef environments (Salih et al.
2000). Thus, although “more light” might not be needed for more coral growth and might
even stress corals, more light can produce nicer colors for the aquarium industry. How-
ever, also other factors, such as genetics, ultraviolet radiation, light spectrum and even
low amounts of light can trigger the production of colorful pigments (Schlichter et al. 1986;
Dunlap and Shick 1998; D’Angelo et al. 2008). The exact mechanisms for triggering the
production of different coral pigments remain largely unknown. Future research on this
topic would benefit the coral aquarium industry.

General Discussion
175
7
6 Main conclusions
Objective1:Doeswaterflowaffecttheskeletalgrowthofcorals?Isthiseffectre-
latedtophotosynthesis?
Yes, increasing water flow increases the skeletal growth of Galaxea fascicularis. The ex-
tent of the effect depends on the irradiance level. Especially at high irradiance, the effect
of water flow is important to relieve oxidative stress. The mechanism of enhancement of
coral growth with increasing water flow was not conclusively demonstrated to be related
to photosynthesis at each irradiance level (90, 300 and 600 μE m-2 s-1). It is suggested that
it might be related to the relief of limitation by algal overgrowth, the supply of (in)organic
nutrients, and, at high irradiance levels, the relief of oxidative stress.
Objective2:Doesirradianceaffecttheskeletalgrowthofcorals?Isthiseffectre-
latedtophotosynthesis?
Yes, skeletal growth of G. fascicularis increases with increasing irradiance. The enhanc-
ing effect of irradiance on skeletal growth is positively related to net photosynthesis. How-
ever, this relationship was not directly proportional, indicating that the enhancement of
calcification by light is not entirely photosynthesis-driven. At high irradiance levels, there
was a discrepancy between the potential energy produced in photosynthesis and energy
used for skeletal growth, which could potentially be overcome by removing limitations for
other factors such as heterotrophic feeding, aragonite saturation state and water flow.
Objective3:Doeslightdurationaffecttheskeletalgrowthofcorals?Isthiseffect
relatedtophotosynthesis?
The effect of light duration on skeletal growth of G. fascicularis is not yet known under
light-limiting circumstances. Light was probably in excess. Corals in the 24 hour light
treatment were not able to adapt to prolonged light duration under light saturating condi-
tions: they bleached immediately and died after 14 weeks. Corals in the 16 hour light
treatment were able to adapt to prolonged light duration under light saturating conditions
by decreasing their hourly rate of photosynthesis, possibly as a result of self-shading.
Chapter 7
7
176
Since neither daily net photosynthesis nor skeletal growth were different between differ-
ent photoperiods (8 hour versus 16 hour), it is suggested that enhancement of calcifica-
tion is mediated by photosynthesis. Conversely, the corals in the 16 hour light treatment
had access to more photosynthetic carbon (higher daily P/R ratio), which did not have a
positive effect on the growth of these corals. It is suggested that the increased availabil-
ity of photosynthetic carbon is allocated towards defense mechanisms against oxidative
stress. However, this should be topic of future research.
Objective4:Isthereaninteractionbetweentheinfluenceofirradianceandwater
flowontheskeletalgrowthofcorals?
Yes, a significant interaction was found between the influence of irradiance and water
flow on the skeletal growth of G. fascicularis, indicating that this effect is more than ad-
ditive. Water flow is of increasing importance to coral growth with increasing irradiance
levels. A coral grown at high irradiance but low flow might grow at a comparable rate as
a coral grown at a lower irradiance but high flow. The enhancement of coral growth could
not conclusively be related to net photosynthesis. It is suggested that enhancement of
coral growth with increasing flow is related to the relief of oxidative stress and therefore
reduced energy allocation towards photo-protective mechanisms.
Objective5:Biologyandeconomicsofcoralgrowth-implicationsforcoralaquaculture
Knowledge of the factors controlling coral growth can contribute to developing cost-effi-
cient coral aquaculture. As a result of the large amount of factors that can either stimulate,
limit or inhibit coral growth, optimization of coral aquaculture implies close fine-tuning
of different factors. Since many of these factors also interact, it is proposed that future
research should focus on multi-factorial rather than single factor studies. Since each spe-
cies and each genotype will require a different combination of values to maximize its
growth rate, efficient high-density coral culture is best achieved by having the individual
species and genotypes in separate culture systems. Growth models describing coral
growth kinetics of a particular species can be used as a tool to design coral aquaculture
systems and to calculate the costs of aquaculture until market size.


References

References
179
AAlam N, Bae BH, Hong J, Lee CO, Im KS, Jung JH, 2001. Cytotoxic diacetylenes from the stony coral Montipora species. J Nat Prod 64: 1059-1063.
Al-Horani FA, Al-Moghrabi SM, De Beer D, 2003a. The mechanism of calcification and its relation to photosynthesis and respiration in the scleractinian coral Galaxea fascicularis. Mar Biol 142: 419-426.
Al-Horani FA, Al-Moghrabi SM, De Beer D, 2003b. Microsensor study of photosynthesis and cal-Microsensor study of photosynthesis and cal-cification in the scleractinian coral Galaxea fascicularis: active internal carbon cycle. J Exp Mar Biol Ecol 288: 1-15.
Al-Horani FA, Ferdelman T, Al-Mograbi SM, De Beer D, 2005. Spatial distribution of calcification and photosynthesis in the scleractinian coral Galaxea fascicularis. Coral Reefs 24 (1): 173-180.
Allemand D, Furla P, Benazet-Tambutté S, 1998a. Mechanisms of carbon acquisition for endosymbiont photosynthesis in Anthozoa. Can J Bot 76: 925-941.
Allemand D, Tambutté E, Girard JP, Jaubert J, 1998b. Organic matrix synthesis in the scleractinian coral Stylophora pistillata: role in biomineralization and potential target of the organotin tributyltin. J Exp Biol 201(13): 2001-2009.
Allemand D, Ferrier-Pagès C, Furla P, Houlbrèque F, Puverel S, Reynaud S, Tambutté E, Tambutté S, Zoccola D 2004. Biomineralisation in reef-building corals: from molecular mechanisms to environmental control. C R Palevol 3: 453-467.
Anthony KRN 1999. Coral suspension feeding on fine particulate matter. J Exp Mar Biol Ecol 232: 85-106.
Anthony KRN and Fabricius KE 2000. Shifting roles of heterotrophy and autotrophy in coral enegetics under varying turbidity. J Exp Mar Biol Ecol 252: 221-253.
Anthony KRN, Connolly SR, Willis BL, 2002. Comparative analysis of energy allocation to tissue and skeletal growth in corals. Limnol Oceanogr 47(5): 1417-1429.
Anthony KRN and Hoegh-Guldberg O 2003a. Kinetics of photoacclimation in corals. Oecologia 134: 23-31.
Anthony KRN and Hoegh-Guldberg O 2003b. Variation in coral photosynthesis, respiration and growth characteristics in contrasting light microhabitats: an analogue to plants in forest gaps and understoreys? Funct Ecol 17: 246-259.
References
180
Anthony KRN, Hoogenboom MO, Connolly SR, 2005. Adaptive variation in coral geometry and the optimization of internal colony light regimes. Funct Ecol 19: 17-26.
Anthony KRN, Kline DI, Diaz-Pulido G, Dove S, Hoegh-Guldberg O, 2008. Ocean acidification causes Bleaching and productivity loss in coral reef builders. PNAS 105(45): 17442-17446.
Arvedlund M, Craggs J, Pecorelli J, 2003. Coral culture: possible future trends and directions, in: Cato JC and Brown CL (Ed.) 2003. Marine ornamental species: collection, culture and conserva-tion. pp. 233-248.
Asada K 1999. The water cycle in chloroplasts: scavenging of active oxygens and dissipation of excess photons. Annu Rev Plant Physiol Plant Mol Biol 50: 601–639.
Atkinson MJ and Bilger RW 1992. Effects of water velocity on phosphate uptake in coral reef-flat communities. Limnol Oceanogr 37(2): 273-279.
Atkinson MJ, Kotler E, Newton P, 1994. Effects of water velocity on respiration, calcification and ammonium uptake of a Porites compressa community. Pac Sci 48(3): 296-303.
B
Bak RPM 1976. The growth of coral colonies and the importance of crustose coralline algae and burrowing sponges in relation with carbonate accumulation. Neth J Sea Res 10(3): 285-337.
Barnes DJ and Crossland CJ 1978. Diurnal productivity and apparant 14C calcification in the stag-horn coral Acropora acuminata. Comp Biochem Physiol 59A: 133-138.
Barnes DJ and Chalker BE 1990. Calcification and photosynthesis in reef-building corals and algae. In: Dubinsky Z (Ed.), Coral Reefs: Ecosystems of the World, Vol. 25. Elsevier Scientific Publishing Co. Inc. New York, pp.109-131.
Bellwood DR and Hughes TP 2001. Regional-scale assembly rules and biodiversity of coral reefs. Science 292: 1532-1534.
Bellwood DR, Hughes TP, Folke C, Nyström M, 2004. Confronting the coral reef crisis. Nature 429: 827-833.
Bongiorni L, Shafir S, Rinkevich B, 2003a. Effects of particulate matter released by a fish farm (Eilat, Red Sea) on survival and growth of Stylophora pistillata coral nubbins. Mar Poll Bull 46: 1120-1124.
Bongiorni L, Shafir S, Angel D, Rinkevich B, 2003b. Survival, growth and gonad development of two hermatypic corals subjected to in situ fish-farm nutrient enrichment. Mar Ecol Prog Ser 253: 137-144.
References
181
Borneman E 2008. Chapter 1: Introduction to the husbandry of corals in aquariums: A review. In: Ad-vances in Coral Husbandry in Public aquariums. Public aquarium husbandry series, Vol. 2. Leeuwis RJ and Janse M (eds.) pp. 3-14.
Bosscher H and Meesters EH 1993. Depth related changes in the growth rate of Montastrea annula-ris. Proc 7th Int Coral Reef Symp 1: 507-512.
Box SJ, and Mumby PJ 2007. Effect of macroalgal competition on growth and survival of juvenile Caribbean corals. Mar Ecol Prog Ser 342: 139-149.
Brand A, Müller B, Wüest A, Dinkel C, Revsbech NP, Nielsen LP, Pedersen O, Damgaard LR, Larsen LH, Wehrli B, 2007. Microsensor for in situ flow measurements in benthic boundary layers at submil-limeter resolution with extremely slow flow. Limnol Oceanogr: Methods 5: 185-191.
Broadbent AD, Jones GB, Jones RJ, 2002. DMSP in Corals and Benthic Algae from the Great Barrier Reef. Estuar Coast Shelf S 55: 547-555.
Brown BE and Bythell JC 2005. Perspectives on mucus secretion by reef corals. Mar Ecol Prog Ser 296: 291-309.
Brown BE, Tudhope AW, Le Tissier MDA, Scoffin TP, 1991. A novel mechanism for iron incorporation into coral skeletons. Coral Reefs 10: 211-215.
Brown BE, Le Tissier MDA, Dunne RP, 1994. Tissue retraction in the scleractinian coral Coeloseris mayeri, its effect upon coral pigmentation, and preliminary implications for heat balance. Mar Ecol Prog Ser 105: 209-218.
Brown BE, Downs CA, Dunne RP, Gibb SW, 2002. Preliminary evidence for tissue retraction as a fac-tor in photoprotection of corals incapable of xanthophyll cycling. J Exp Mar Biol Ecol 277: 129- 144.
Bruno JF and Edmunds PJ 1998. Metabolic consequences of phenotypic plasticity in the coral Ma-dracis mirabilis (Duchassaing and Michelotti): the effect of morphology and water flow on aggregate respiration. J Exp Mar Biol Ecol 229: 187-195.
Bruckner AW 2001. Tracking the trade in ornamental coral reef organisms: The importance of CITES and its limitations. Aquar Sci Conserv 3: 79-94.
Bryant D, Burke L, McManus J, Spalding M, 1998. Reefs at Risk. A map-based indicator of threats to the world’s coral reefs. World Resources Institute, Washington, DC.
Bucher DJ, Harriott VJ, Roberts LG, 1998. Skeletal micro-density, porosity and bulk density of Acro-porid corals. J Exp Mar Biol Ecol 228: 117-136.
Bythell JC 1988. A total nitrogen and carbon budget for the elkhorn coral Acropora palmata (La-marck). Proc 6th Int Coral Reef Symp 2: 535-540.

References
182
C
Carlson BA 1999. Organism responses to rapid change: what aquaria tell us about nature. Am Zool 39: 44-55.
Carlson BA 2008. General introduction: advances in coral husbandry in public aquaria. In: Advan-ces in Coral Husbandry in Public aquariums. Public aquarium husbandry series, Vol. 2. Leeuwis RJ and Janse M (eds.) pp: ix-xv.
Carpenter LW and Patterson MR 2007. Water flow influences the distribution of photosynthetic ef-ficiency within colonies of the scleractinian coral Montastrea annularis (Ellis and Solander, 1786); implications for coral bleaching. J Exp Mar Biol Ecol 351: 10-26.
Chalker BE 1981. Simulating light-saturation curves for photosynthesis and calcification by reef-building corals. Mar Biol 63, 135-141.
Chalker BE and Taylor DL 1975. Light-enhanced calcification, and the role of oidative phosphory-lation in calcification of the coral Acropora cervicornis. Proc R Soc Lond [Biol] 190, 323-331.
Chalker BE, Dunlap WC, Oliver JK, 1983. Bathymetric adaptations of reef-building corals at Da-vies reef, great barrier reef, Australia. II. Light saturation curves for photosynthesis and respiration. J Exp Mar Biol Ecol 73(1): 37-56.
Chamberlain JA and Graus RR 1975. Water flow and hydromechanical adaptations of branched reef corals. Bull Mar Sci 25: 112-125.
Chisholm JRM and Gattuso J-P 1991. Validation of the alkalinity anomaly technique for investi-gating calcification and photosynthesis in coral reef communities. Limnol Oceanogr 36(6): 1232-1239.
Clode PL and Marshall AT 2003. Variation in skeletal microstructure of the coral Galaxea fascicu-laris: effects of an aquarium environment and preparatory techniques. Biol Bull 204: 138-145.
Coles SL and Brown BE 2003. Coral Bleaching - capacity for acclimatization and adaptation. Adv Mar Biol 46: 183-223.
Crabbe MJC and Smith DJ 2006. Modelling variations in corallite morphology of Galaxea fascicu-laris coral colonies with depth and light on coastal fringing reefs in the Wakatobi Marine National Park (SE Sulawesi, Indonesia). Comput Biol Chem 30: 155-159.
Crossland CJ 1981. Seasonal growth of Acropora cf. formosa and Pocillopora damicornis on a high latitude reef (Houtman Abrolhos, Western Australia). Proc 4th Int Coral Reef Symp 1: 663-667.
References
183
Crossland CJ 1984. Seasonal variations in the rates of calcification and productivity in the coral Acropora formosa on a high-latitude reef. Mar Ecol Prog Ser 15: 135-140.
Crossland CJ 1987. In situ release of mucus and DOC-lipid from the corals Acropora variabilis and Stylophora pistillata in different light regimes. Coral Reefs 6: 35-42.
Crossland CJ, Barnes D J, M A. Borowitzka, 1980. Diurnal lipid and mucus production in the stag-horn coral Acropora acuminate. Mar Biol 60(2-3): 81-90.
Crossland CJ, Hatcher BG, Smith SV, 1991. Role of coral reefs in global ocean production. Coral Reefs 10: 55-64.
D
D’Angelo C, Denzel A, Vogt A, Matz MV, Oswald F, Salih A, Nienhaus U, Wiedenmann J, 2008. Blue light regulation of host pigment in reef-building corals. Mar Ecol Prog Ser 364: 97-106.
Danovaro R, Bongiorni L, Corinaldesi C, Giovanelli D, Damiani E, Astolfi P, Greci L, Pusceddu A, 2008. Sunscreens cause coral bleaching by promoting viral infections. Env Health Persp 116(4): 441-447.
Davies PS 1984. The role of zooxanthellae in the nutritional energy requirements of Pocillopora eydouxi. Coral Reefs 2: 181-186.
Davies PS 1989. Short-term growth measurements of corals using an accurate buoyant weighing technique. Mar Biol 101: 389-395.
De’ath G, Lough JM, Fabricius KE, 2009. Declining coral calcification on the Great Barrier Reef. Science 353 (5910): 116-119.
De Beer D, Schramm A, Santegoeds CM, Kuhl M, 1997. A nitrite microsensor for profiling environ-mental biofilms. Appl Environ Microbiol 63(3): 973-977.
Delbeek JC 2001. Coral farming: past, present and future trends. Aquar Sci Conserv 3(1-3): 171-181.
Dennison WC and Barnes DJ 1988. Effect of water motion on coral photosynthesis and calcifica-tion. J Exp Mar Biol Ecol 115: 67-77.
Dubinsky Z and Berman-Frank I 2001. Uncoupling primary production from population growth in photosynthesizing organisms in aquatic ecosystems. Aquat Sci 63: 4-17.
References
184
Dubinsky Z and Jokiel PL 1994. Ratio of energy and nutrient fluxes regulates symbiosis between zooxanthellae and corals. Pac Sci 48(3): 313-324.
Dubinsky Z and Stambler N 1996. Marine pollution and coral reefs. Glob Change Biol 2: 511-526.
Dubinsky Z, Stambler N, Ben-Zion M, Mccloskey LR, Muscatine L, Falkowski PG, 1990. The effect of external nutrient resources on the optical properties and photosynthetic efficiency of Stylophora pistillata. Proc R Soc Lond [Biol] 239(1295): 231-246.
Dullo W-C 2005. Coral growth and reef growth: a brief review. Facies 51: 33-48.
Dunlap WC and Shick JM 1998. Review: ultraviolet radiation-absorbing mycosporine-like amino acids in coral reef organisms: a biochemical and environmental perspective. J Phycol 34: 418-430.
Dustan P 1982. Depth-dependent photoadaptation by zooxanthellae of the reef coral Montastrea annularis. Mar Biol 68: 253-264.
E
Edmunds PJ 2005. Effect of elevated temperature on aerobic respiration of coral recruits. Mar Biol 146: 655-663.
Edmunds PJ and Davies PS 1989. An energy budget for Porites porites (scleractinia), growing in a stressed environment. Coral Reefs 8: 37-43.
Enriquez S, Mendez ER, Iglesias-Prieto R, 2005. Multiple scattering on coral skeletons enhances light absorption by symbiotic algae. Limnol Oceanogr 50(4): 1025-1032.
FFabricius KE 2005. Effects of terrestrial runoff on the ecology of corals and coral reefs: review and synthesis. Mar Pollut Bull 50: 125-146.
Falkowski PG and Dubinsky Z 1981. Light-shade adaptation of Stylophora pistillata, a hermatypic coral from the Gulf of Eilat. Nature 289: 172-174.
Falkowski PG, Dubinsky Z, Muscatine L, Porter JW, 1984. Light and the Bioenergetics of a Sym-biotic Coral. Bioscience 34(11): 705-709.
References
185
Falkowski PG, Jokiel PL , Kinzie III RA, 1990. Irradiance and corals. Ecosystems of the world (25); Coral Reefs; chapter 5. Elsevier Scientific PuBL ishing Co. Inc. New York pp. 89-107.
Fautin DG and Buddemeier RW 2004. Adaptive bleaching: a general phenomenon. Hydrobiologia 530/531: 459-467.
Ferrier-Pagès C, Gattuso J-P, Cauwet G, Jaubert J, Allemand D, 1998. Release of dissolved organic carbon and nitrogen by the zooxanthellate coral Galaxea fascicularis. Mar Ecol Prog Ser 172: 265-274.
Ferrier-Pagès C, Gattuso J-P, Dallot S, Jaubert J, 2000. Effect of nutrient enrichment on growth and photosynthesis of the zooxanthellate coral Stylophora pistillata. Coral Reefs 19: 103-113.
Ferrier-Pagès C, Schoelzke V, Jaubert J, Muscatine L, Hoegh-Guldberg O, 2001. Response of a scleractinian coral, Stylophora pistillata, to iron and nitrate enrichment. J Exp Mar Biol Ecol 259(2): 249-261.
Ferrier-Pagès C, Witting J, Tambutté E, Sebens KP, 2003. Effect of natural zooplankton feeding on the tissue and skeletal growth of the scleractinian coral Stylophora pistillata. Coral Reefs 22: 229-240.
Ferrier-Pagès C, Houlbrèque F, Wyse E, Richard C, Allemand D, Boisson F, 2005. Bioaccumula-Houlbrèque F, Wyse E, Richard C, Allemand D, Boisson F, 2005. Bioaccumula- F, Wyse E, Richard C, Allemand D, Boisson F, 2005. Bioaccumula-tion of zinc in the scleractinian coral Stylophora pistillata. Coral Reefs 24(4): 636-645.
Fine M and Tchernov D 2007. Scleractinian coral species survive and recover from decalcification. Science 315(5820): 1811.
Finelli CM, Helmuth BST, Pentcheff ND, Wethey DS, 2006. Water flow influences oxygen trans-port and photosynthetic efficiency in corals. Coral Reefs 25(1): 47-57.
Finelli CM, Helmuth BS, Pentcheff ND, Wethey DS, 2007. Intracolony variability in photosynthesis by corals is affected by water flow: role of oxygen flux. Mar Ecol Prog Ser 349: 103-110.
Fitt WK 2000. Cellular growth of host and symbiont in a cnidarian-zooxanthellar symbiosis. Biol Bull 198: 110-120.
Furla P, Galgani I, Durand I, Allemand D, 2000. Sources and mechanisms of inorganic carbon transport for coral calcification and photosynthesis. J Exp Biol 203, 3445-3457.
Furla P, Allemand D, Shick JM, Ferrier-Pagès C, Richier S, Plantivaux A, Merle P, Tambutté S, 2005. The symbiotic anthozoan: A physiological chimera between alga and animal. Integr Comp Biol 45(4): 595-604.
Fusetani N (Ed) 2000. Drugs from the Sea. Karger, Basel.

References
186
G
Gardner TA, Côté IM, Gill JA, Grant A, Watkinson AR, 2003. Long-term region-wide declines in Caribbean corals. Science 301: 958-960.
Gattuso J-P and Jaubert J 1990. Effect of light on oxygen and carbon dioxide fluxes and on meta-bolic quotients measured in situ in a zooxanthellate coral. Limnol Oceanogr 35: 1796-1804.
Gattuso J-P, Frankignoulle M, Bourge I, Romaine S, Buddemeier RW, 1998. Effect of calcium carbonate saturation of seawater on coral calcification. Global Planet Change 18: 37-46.
Gattuso J-P, Allemand D, Frankignoulle M, 1999. Photosynthesis and calcification at cellular, or-ganismal and community levels in coral reefs: a review on interactions and control by carbonate chemistry. Am Zool 39(1): 160-183.
Genin A, Lazar B, Brenner S, 1995. Vertical mixing and coral death in the Red Sea following the eruption of Mount Pinatubo. Nature 377(6549): 507-510.
Glynn PW, Perez M, Gilchrist, SL, 1985. Lipid decline in stressed corals and their crustacean symbionts. Biol Bull 168: 276-284.
Goiran C, Al-Moghrabi S, Allemand D, Jaubert J, 1996. Inorganic carbon uptake for photosynthe-sis by the symbiotic coral-dinoflagellate association I. Photosynthetic performances of symbionts and dependence on sea water bicarbonate. J Exp Mar Biol Ecol199: 207-225.
Goreau TF 1959. The physiology of skeleton formation in corals. I. A method for measuring the rate of calcium deposition by corals under different conditions. Biol Bull 116: 59-75.
Goreau TF and Goreau NI 1959. The physiology of skeleton formation in corals. II. Calcium depo-sition by hermatypic corals under various conditions in the reef. Biol Bull 117 (2): 239-250.
Goreau TF, Goreau NI, Goreau TJ, 1979. Corals and Coral Reefs. Sci Am 241(2): 124-136.
Grande KD, Bender ML, Irwin B, Platt T, 1991. A comparison of net and gross rates of oxygen production as a function of light intensity in some natural plankton populations and in a Synecho-coccus culture. J Plankton Res 13(1): 1-16.
Grigg RW 1982. Darwin point: A threshold for atoll formation. Coral Reefs 1: 29-34.
Grigg RW 1995. Coral reefs in an urban embayment in Hawaii: a complex case history controlled by natural and anthropogenic stress. Coral Reefs 14(4): 253-266.
Grottoli AG 2000. Stable carbon isotopes (δ13C) in coral skeletons. Oceanography 13(20): 93-97.

References
187
Grottoli AG, Rodrigues, LJ, Juarez C, 2004. Lipids and stable carbon isotopes in two species of Hawaiian corals, Porites compressa and Montipora verrucosa, following a bleaching event. Mar Biol 145: 621-631.
Grottoli AG, Rodrigues LJ, Palardy JE, 2006. Heterotrophic plasticity and resilience in bleached corals. Nature 440(7088): 1186-1189.
Grover R, Maguer J, Reynaud-Vaganay S, Ferrier-Pagès C, 2002. Uptake of ammonium by the scleractinian coral Stylophora pistillata: Effect of feeding, light and ammonium concentrations. Limnol Oceanogr 47(3): 782-790.
H
Haapkylä J, Ramade F, Salvat B, 2007. Oil pollution on coral reefs: A review of the state of know-ledge and management needs. Vie Milieu 57: 95-111.
Harland AD and Davies PS 1995. Symbiont photosynthesis increases both respiration and photo-synthesis in the symbiotic sea anemone Anemonia viridis. Mar Biol 123(4): 715 - 722.
Harland AD, Davies, PS, Fixter LM, 1992. Lipid content of some Caribbean corals in relation to depth and light. Mar Biol 113: 357-361.
Harriott VJ 1999. Growth of the staghorn coral Acropora formosa at Houtman Abrolhos, Western Australia. Mar Biol 132: 319-325.
Heikoop JM, Dunn JJ, Sandeman IM, 2000. Separation of kinetic and metabolic isotope effects in carbon-13 records preserved in reef coral skeletons. Geochim Cosmochim Acta 64(6): 975-987.
Heiss GA 1994. Coral reefs in the Red Sea: Growth production and stable isotopes. GEOMAR Report 32: 1–141.
Heiss GA and Dullo W-C 1997. Stable isotope record from recent and fossil Porites sp. in the Northern Red Sea. Coral Res Bull 5: 161-169.
Helmuth B and Sebens KP 1993. The influence of colony morphology and orientation to flow on particle capture by the scleractinian coral Agaricia agaricites (Linnaeus). J Exp Mar Biol Ecol 165: 25l-278.
Herfort L, Thake B, Taubner I, 2008. Bicarbonate stimulation of calcification and photosynthesis in two hermatypic corals. J Phycol 44: 91-98.
Hii Y-S, Soo C-L, Liew HC, 2008. Feeding of scleractinian coral, Galaxea fascicularis, on Artemia salina nauplii in captivity. Aquacult Int 17(4): 363-376.
References
188
Hoegh-Guldberg O 1994. The population dynamics of symbiotic zooxanthellae in the coral Pocil-lopora damicornis exposed to elevated ammonium (NH4Cl) concentrations. Pac Sci 48: 263-272.
Hoegh-Gulberg O and Smith GJ 1989. The effect of sudden changes in temperature, light and salinity on the population density and export of zooxanthellae from the reef corals Stylophora pistillata Esper and Seriatopora hystrix Dana. J Exp Mar Biol Ecol 129: 279-303.
Hoegh-Guldberg O, Mumby PJ, Hooten J, Steneck RS, Greenfield P, Gomez E, Harvell CD, Sale PF, Edwards AJ, Caldeira K, Knowlton N, Eakin CM, Iglesias-Prieto R, Muthiga N, Bradbury RH, Dubi A, Hatziolos ME, 2007. Coral reefs under rapid climate change and ocean acidification. Sci-ence 318: 1737-1742.
Hoogenboom MO, Connolly SR, Anthony KRN, 2009. Effects of photoacclimation on the light niche of corals: a process-based approach. Mar Biol 156(12): 2493-2503.
Houlbrèque F and Ferrier-Pagès C 2009. Heterotrophy in tropical scleractinian corals. Biol Rev 84: 1-17.
Houlbrèque F, Tambutté E, Ferrier-Pagès C, 2003. Effect of zooplankton availability on the rates of photosynthesis, and tissue and skeletal growth in the scleractinian coral Stylophora pistillata. J Exp Mar Biol Ecol 296: 145- 166.
Houlbrèque F, Tambutté E, Allemand D, Ferrier-Pagès C, 2004. Interactions between zooplankton feeding, photosynthesis and skeletal growth in the scleractinian coral Stylophora pistillata. J Exp Biol 207: 1461-1469.
Hughes TP, Baird AH, Bellwood DR, Card M, Connolly SR, Folke C, Grosberg R, Hoegh-Guldberg O, Jackson JBC, Kleypas J, Lough JM, Marshall P, Nyström M, Palumbi SR, Pandolfi JM, Rosen B, Roughgarden J, 2003. Climate change, human impacts, and the resilience of coral reefs. Sci-ence 301 (5635): 929-933.
I
Iglesias-Prieto R and Trench RK 1994. Acclimation and adaptation to irradiance in symbiotic di-noflagellates. I. Responses of the photosynthetic unit to changes in photon flux density. Mar Ecol Prog Ser 113: 163-175.
Iglesias-Prieto R, Matta JL, Robbins WA, Trench RK, 1992. Photosynthetic response to elevated temperature in the symbiotic dinoflagellate Symbiodinium microadriaticum in culture. PNAS 89 (21): 10302-10305.

References
189
J
Jackson JBC, Kirby MX, Berger WH, Bjorndal KA, Botsford LW, Bourque BJ, Bradbury RH, Cooke R, Erlandson J, Estes JA, Hughes TP, Kidwell S, Lange CB, Lenihan HS, Pandol JM, Peterson CH, Steneck RS, Tegner MJ, Warner RR, 2001. Historical overfishing and the recent collapse of coastal ecosystems. Science 293: 629 - 638.
Jeffrey SW and Humphrey GF 1975. New spectrophotometric equations for determining chlorop-hylls a, b, c1 and c2 in higher plants, algae and natural phytoplankton. Biochem Physiol Pflanz 167: S191-194.
Jokiel PL 1978. Effects of water motion on reef corals. J Exp Mar Biol Ecol 35: 87-97.
Jokiel PL and Coles SL 1990. Response of Hawaiian and other Indo-Pacific reef corals to elevated temperature. Coral Reefs 8: 155-162.
Jokiel PL and York RH 1982. Solar ultraviolet photobiology of the reef coral Pocillopora damicornis and symbiotic zooxanthellae. Bull Mar Sci 32: 301-315.
Jokiel PL, Rodgers KS, Kuffner IB, Andersson AJ, Cox EF, Mackenzie FT, 2008. Ocean acidifica-tion and calcifying reef organisms: a mesocosm investigation. Coral Reefs 27: 473-483.
Jones R 2005. The ecotoxicological effects of Photosystem II herbicides on corals. Mar Poll Bull 51: 495-506.
K
Kaandorp JA and Kübler JE 2001. The algorithmic beauty of seaweeds, sponges and corals. Springer-Verlag, Heidelberg, New York.
Kaandorp JA, Lowe CP, Frenkel D, Sloot PMA, 1996. Effect of nutrient diffusion and flow on coral morphology. Phys Rev Lett 77(11): 2328-2331.
Kaandorp JA, Koopman EA, Sloot PMA, Bak RPM, Vermeij MJA, Lampmann LEH, 2003. Simula-tion and analysis of flow patterns around the scleractinian coral Madracis mirabilis (Duchassaing and Michelotti). Phil Trans R Soc Lond B 358: 1551-1557.
Kaandorp JA, Sloot PMA, Merks RMH, Bak RPM, Vermeij MJA and Maier C, 2005. Morphogene-sis of the branching reef coral Madracis mirabilis. Proc R Soc Lond [Biol] 272: 127-133.
Khalesi MK, Beeftink HH, Wijffels RH, 2007. Flow-dependent growth in the zooxanthellate soft coral Sinularia flexibilis. J Exp Mar Biol Ecol 351(1-2): 106-113.
References
190
Kinsey DW and Davies PJ 1979. Effects of elevated nitrogen and phosphorus on coral reef growth. Limnol Oceanogr 24: 935-940.
Kinzie RA III, Jokiel PL, York R, 1984. Effects of light of altered spectral composition on coral zooxanthellae associations and on zooxanthellae in vitro. Mar Biol 78(3): 239-248.
Kinzie RA III, Takayama M, Santos SR, Coffroth MA, 2001. The adaptive bleaching hypothesis: experimental tests of critical assumptions. Biol Bull 200: 51-58.
Kleypas JA, Buddemeier RW, Archer D, Gattuso J-P, Langdon C, Opdyke BN, 1999. Geochemical consequences of increased atmospheric carbon dioxide on coral reefs. Science 284: 118-120.
Knittweis L, Kraemer WE, Timm J, Kochzius M, 2009. Genetic structure of Heliofungia actinifor-mis (Scleractinia: Fungiidae) populations in the Indo-Malay Archipelago: Implications for live coral trade management efforts. Conserv Genet 10(1): 241-249.
Koop K, Booth D, Broadbent A, Brodie J, Bucher D, Capone D, Coll J, Dennison W, Erdmann M, Harrison P, Hoegh-Guldberg O, Hutchings P, Jones GB, Larkum AWD, O’Neil J, Steven A, Tentori E, Ward S, Williamson J, Yellowlees D, 2001. ENCORE: The effect of nutrient enrichment on coral reefs. Synthesis of results and conclusions. Mar Poll Bull 42: 91-120.
Kruszynski K, Kaandorp JA, Van Liere R, 2007. A computational method for quantifying morpho-A computational method for quantifying morpho-logical variation in scleractinian corals. Coral Reefs 26: 831-840.
Kuffner IB 2001. Effects of ultraviolet radiation and water motion on the reef coral, Porites com-pressa Dana: a flume experiment. Mar Biol 138: 467-476.
L
LaBarbera M and Vogel S 1976. An inexpensive thermistor flowmeter for aquatic biology. Limnol Oceanogr 21( 5): 750-756.
Langdon C, Takahashi T, Sweeney C, Chipman D, Goddard J, Marubini F, Aceves H, Barnett H, Atkinson MJ, 2000. Effect of calcium carbonate saturation state on the calcification rate of an experimental coral reef. Global Biogeochem Cy 14(2): 639-654.
Langdon C and Atkinson MJ 2005. Effect of elevated pCO2 on photosynthesis and calcification of corals and interactions with seasonal change in temperature/ irradiance and nutrient enrichment. J Geophys Res-Oceans 110: 1-54.
Lavens P and Sorgeloos P 2000. The history, present status and prospects of the availability of Artemia cysts for aquaculture. Aquaculture 181: 397-403.
References
191
Lavorano S, Gili C, Muti C, Taruffi M, Corsino D, Gnone G, 2008. Chapter 3: The CORALZOO project - preliminary results of the evaluation of different types and concentrations of zooplankton food on the growth of Pocillopora damicornis (Linnaeus, 1758) comparing diurnal and nocturnal feeding. In: Leewis RJ and Janse M (Eds.), 2008. Advances in coral husbandry in public aquari-ums. Public aquarium husbandry series, vol. 2. pp. 19-25.
Leclercq N, Gattuso J-P, Jaubert J, 2000. CO2 partial pressure controls the calcification rate of a coral community. Glob Change Biol 6(3): 329-334.
Leggat W, Badger MR, Yellowlees D, 1999. Evidence for an inorganic carbon-concentrating me-chanism in the symbiotic dinoflagellate Symbiodinium sp. Plant Physiol 121: 1247–1255.
Lesser MP 1996. Elevated temperatures and ultraviolet radiation cause oxidative stress and inhi-bit photosynthesis in symbiotic dinoflagellates. Limnol Oceanogr 41(2): 271-283.
Lesser MP 1997. Oxidative stress causes coral Bleaching during exposure to elevated tempera-tures. Coral Reefs 16: 187-192.
Lesser MP, Weis VM, Patterson MR, Jokiel PL, 1994 Effects of morphology and water motion on carbon delivery and productivity in the reef coral, Pocillopora damicornis (Linnaeus): Diffusion bar-riers, inorganic carbon limitation, and biochemical plasticity. J Exp Mar Biol Ecol 178: 153-179.
Lesser MP, Bythell JC, Gates RD, Johnstone RW, Hoegh-Guldberg O, 2007. Are infectious disea-ses really killing corals? Alternative interpretations of the experimental and ecological data. J Exp Mar Biol Ecol 346: 36-44.
Levy O, Achituv Y, Yacobi YZ, Stambler N, Dubinsky Z, 2006. The impact of spectral composition and light periodicity on the activity of two antioxidant enzymes (SOD and CAT) in the coral Favia favus. J Exp Mar Biol Ecol 328: 35-46.
Lewitus AJ and Kana TM 1995. Light respiration in six estuarine phytoplankton species: contrasts under photoautotrophic and mixotrophic growth conditions. J Phycol 31(5): 754-761.
Logan A and Tomascik T 1991. Extension growth rates in two coral species from high-latitude reefs of Bermuda. Coral Reefs 10(3): 155-160.
Lough JM, Barnes DJ 2000. Environmental controls on growth of the massive coral Porites. J Exp Mar Biol Ecol 245: 225-243.
M
Maier C, Pätzold J, Bak RPM, 2003. The skeletal isotopic composition as an indicator of ecological and physiological plasticity in the coral genus Madracis. Coral Reefs 22: 370-380.
References
192
Maragos JE 1972. A study of the ecology of Hawaiian coral reefs. Ph.D. thesis. University of Ha-waii. Honolulu, 290 pp.
Marshall AT and Clode PL 2002. Effect of increased calcium concentration in sea water on calcifica-tion and photosynthesis in the scleractinian coral Galaxea fascicularis. J Exp Biol 205, 2107-2113.
Marshall AT and Clode PL 2004. Calcification rate and the effect of temperature in a zooxanthellate and an azooxanthellate scleractinian reef coral. Coral Reefs 23: 218-224.
Marubini F and Atkinson MJ 1999. Effects of lowered pH and elevated nitrate on coral calcification. Mar Ecol Prog Ser 188: 117-121.
Marubini F and Davies PS 1996. Nitrate increases zooxanthellae population density and reduces skeletogenesis in corals. Mar Biol 127(2): 319-328.
Marubini F and Thake B 1999. Bicarbonate addition promotes coral growth. Limnol Oceanogr 44(3): 716-720.
Marubini F, Barnett H, Langdon C, Atkinson MJ, 2001. Dependence of calcification on light and carbonate ion concentration for the hermatypic coral Porites compressa. Mar Ecol Prog Ser 220: 153-162.
Marubini F, Ferrier-Pagès C, Furla P, Allemand D, 2008. Coral calcification responds to seawater acidification: a working hypothesis towards a physiological mechanism. Coral Reefs 27(3): 491-499.
McConnaughey TA and Whelan JF 1997. Calcification generates protons for nutrient and bicarbo-nate uptake. Earth-Science Reviews 42: 95-117.
McConnaughey TA, Burdett J, Whelan JF, Paull CK, 1997. Carbon isotopes in biological carbona-tes: respiration and photosynthesis. Geochim Cosmochim Acta 61(3): 611-622.
Meesters EH, Noordeloos M, Bak RPM, 1994. Damage and regeneration: Links to growth in the reef-building coral Montastrea annularis. Mar Ecol Prog Ser 112(1-2): 119-128.
Meyer JL and Schultz ET 1985. Migrating haemulid fishes as a source of nutrients and organic matter on coral reefs. Limnol Oceanogr 30: 146-156.
Miller MW and Hay ME 1998. Effects of fish predation and seaweed competition on the survival and growth of corals. Oecologia 113: 231-238.
Montebon ARF and Yap HT 1997. Metabolic responses of the scleractinian coral Porites cylindrica Dana to water motion. II. Growth studies. Proc 8th Int Coral Reef Symp 2: 1065-1070.
Moya A, Tambutté S, Tambutté E, Zoccola D, Caminiti N, Allemand D, 2006. Study of calcification
References
193
during a daily cycle of the coral Stylophora pistillata: implications for `light-enhanced calcification’. J Exp Biol 209, 3413-3419.
Moya A, Ferrier-Pagès C, Furla P, Richier S, Tambutté E, Allemand D, Tambutté S, 2008a. Calci-fication and associated physiological parameters during a stress event in the scleractinian coral Stylophora pistillata. Comp Biochem Physiol Part A 151: 29-36.
Moya A, Tambutté S, Bertucci A, Tambutté E, Lotto S, Vullo D, Supuran CT, Allemand D, Zoccola D, 2008b. Carbonic anhydrase in the scleractinian coral Stylophora pistillata. characterization, lo-calization and the role in biomineralization. J Biol Chem 283(37): 25475-25484.
Mucci A 1983. The solubility of calcite and aragonite in seawater at various salinities, temperatu-res, and one atmosphere total pressure. Am J Sci 283: 780-799.
Muller-Parker G 1985. Effect of feeding regime and irradiance on the photophysiology of the sym-biotic sea anemone Aiptasia pulchella. Mar Biol 90: 65-74.
Muscatine L 1990. The role of symbiotic algae in carbon and energy flux in reef corals. In: Mus-catine L (Ed). Ecosystems of the world (25); Coral Reefs; chapter 4. Elsevier Scientific Publishing Co. Inc. New York, pp. 75-87.
Muscatine L, Cernichiari E, 1969. Assimilation of photosynthetic products of zooxanthellae by a reef coral. Biol Bull 137: 506-523.
Muscatine L and Kaplan IR 1994. Resource partitioning by reef corals as determined from stable isotope composition. II. δ15N of zooxanthellae and animal tissue versus depth. Pac Sci 48: 304-312.
Muscatine L, McCloskey LR, Marian RE, 1981. Estimating the daily contribution of carbon from zooxanthellae to coral animal respiration. Limnol Oceanogr 26 (4): 601-611.
Muscatine L, PG Falkowski JW Porter, Dubinsky Z, 1984. Fate of photosynthetic fixed carbon in light- and shade-adapted colonies of the symbiotic coral Stylophora pistillata. Proc R Soc Lond [Biol] 222 (1227): 181-202.
Muscatine L, Porter JW, Kaplan IR, 1989. Resource partitioning by reef corals as from stable iso-tope composition I. δ13C of zooxanthellae and animal tissue vs depth. Mar Biol 100: 185-193.
N
Nakamura T and Van Woesik R 2001. Water-flow rates and passive diffusion partially explain dif-ferential survival of corals during the 1998 Bleaching event. Mar Ecol Prog Ser 212: 301-304.
References
194
Nakamura T and Yamasaki H 2005. Requirement of water-flow for sustainable growth of Pocil-loporid corals during high temperature periods. Mar Pollut Bull 50(10): 1115-1120.
Nakamura T, Yamasaki H, Van Woesik R, 2003. Water flow facilitates recovery from Bleaching in the coral Stylophora pistillata. Mar Ecol Prog Ser 256: 287-291.
Nakamura T, Van Woesik R, Yamasaki H, 2005. Photoinhibition of photosynthesis is reduced by water flow in the reef-building coral Acropora digitifera. Mar Ecol Prog Ser 301: 109-118.
Neudörfer F and Meyer-Reil L-A 1997. A microbial biosensor for the microscale measurement of bioavailable organic carbon in oxic sediments. Mar Ecol Progr Ser 147: 295-300.
O
Ohde S and Hossain MMM 2004. Effect of CaCO3 (aragonite) saturation state of seawater on calcification of Porites coral. Geochem J 38: 613-621.
Osinga R 2007. CORALZOO, an update. EAZA News 60: 38-39.
Osinga R 2008. Chapter 17: An example of public aquaria sciences: the CORALZOO project. In: Advances in coral husbandry in public aquariums. Public aquarium husbandry series, Vol. 2. Leeuwis RJ and Janse M (eds.) pp 3-14.
Osinga R, Redeker D, De Beukelaer PB, Wijffels RH, 1999. Measurement of sponge growth by projected body area and underwater weight. Mem Qld Mus 44: 419-426.
Osinga R, Janse M, Jones R, 2005. Towards coral reefs in tanks: the CORALZOO project. EAZA News 52: 10-12.
P
Palardy JE, Grottoli AG, Matthews KA, 2006. Effect of naturally changing zooplankton concen-trations on feeding rates of two coral species in the Eastern Pacific. J Exp Mar Biol Ecol 331: 99-107.
Palmer AR 1983. Relative cost of producing skeletal organic matrix versus calcification: evidence from marine gastropods. Mar Biol 75: 287-292.
Parks JE, Pomeroy RS, Balboa CM, 2003. The economic of live rock and live coral aquaculture. In: Cato JC, Brown CL (eds.) Marine ornamental species: collection culture and conservation. Iowa State Press, Ames, pp. 185-206.
References
195
Patterson MR 1992. A chemical engineering view of cnidarian symbioses. Amer Zool 32: 566-582.
Patterson MR, Sebens KP, Olson RR, 1991. In situ measurements of flow effects on primary pro-duction and dark respiration in reef corals. Limnol Oceanogr 36: 936-948.
Pätzold J 1984. Growth rhythms recorded in stable isotopes and density bands in the reef coral Porites lobata (Cebu, Philippines). Coral Reefs 3: 87-90.
Pearse VB and Muscatine L 1971. Role of symbiotic algae (zooxanthellae) in coral calcification. Biol Bull 141, 350-363.
R
Ralph PJ, Gademann R, Larkum AWD, Schreiber U, 1999. In situ underwater measurements of photosynthetic activity of coral zooxanthellae and other reef-dwelling dinoflagellate endosymbi-onts. Mar Ecol Prog Ser 180: 139-147.
Reynaud S, Ferrier-Pagès C, Sambrotto R, Juillet-Leclerc A, Jaubert J, Gattuso J-P, 2002. Ef-fect of feeding on the carbon and oxygen isotopic composition in the tissues and skeleton of the zooxanthellate coral Stylophora pistillata. Mar Ecol Prog Ser 238: 81-89.
Reynaud S, Leclercq N, Romaine-Lioud S, Ferrier-Pagès C, Jaubert J, Gattuso J-P, 2003. Inter-acting effects of CO2 partial pressure and temperature on photosynthesis and calcification in a scleractinian coral. Glob Change Biol 9(11): 1660-1668.
Reynaud S, Ferrier-Pagès C, Boisson F, Allemand D, Fairbanks RG, 2004. Effect of light and temperature on calcification and strontium uptake in the scleractinian coral Acropora verweyi. Mar Ecol Prog Ser 279: 105-112.
Reynaud-Vaganay S, Juillet-Leclerc A, Jaubert J, Gattuso J-P, 2001. Effect of light on skeletal δ13C and δ18O, and interaction with photosynthesis, respiration and calcification in two zooxanthellate scleractinian corals. Palaeogeogr, Palaeoclimateol, Palaeoecol 175(1): 393-404.
Rex A, Montebon F, Yap HT, 1995. Metabolic responses of the scleractinian coral Porites cylin-drica Dana to water motion. I. Oxygen flux studies. J Exp Mar Biol Ecol 186: 33-52.
Richardson LL 1998. Coral diseases: what is really known? Trends Ecol Evol 13(11): 438-443.
Riddle D 2008. Feature Article: The Best Lamp Is... Advanced Aquarist’s online magazine. VII-12 http: //www.advancedaquarist.com/2008/12/aafeature1 (last accessed December 2009).
References
196
Rinkevich B 1996. Do reproduction and regeneration in damaged corals compete for energy al-location? Mar Ecol Prog Ser 143: 297-302.
Rinkevich B and Loya Y 1983. Short term fate of photosynthetic products in a hermatypic coral. J Exp Mar Biol Ecol 73: 175-184.
Rinkevich B and Loya Y 1984. Does light enhance calcification in hermatypic corals? Mar Biol 80 (1): 1-6.
Rinkevich B and Loya Y 1985. Intraspecific competition in a reef coral: effects on growth and re-production. Oecologia (Berlin) 66: 100-105.
Rinkevich B, Avishai N, Rabinowitz C, 2005. UV incites diverse levels of DNA breaks in different cellular compartments of a branching coral species J Exp Biol 208: 843-848.
Risk MJ, Sammarco PW, Schwarcz HP, 1994. Cross-continental shelf trends in δ13C in coral on the Great Barrier Reef. Mar Ecol Prog Ser 106: 121-130.
Rogers CS 1990. Responses of coral reefs and reef organisms to sedimentation. Mar Ecol Prog Ser 62: 185-202.
S
Salih A, Larkum A, Cox G, Kühl M, Hoeg-Guldberg O, 2000. Fluorescent pigments in corals are photoprotective. Nature 408: 850-853.
Scheffer M, Carpenter S, Foley JA, Folke C, Walkerk B, 2001. Catastrophic shifts in ecosystems. Nature 413: 591-596.
Schlacher TA, Stark J, Fischer ABP, 2007. Evaluation of artificial light regimes and substrate types for aquaria propagation of the staghorn coral Acropora solitaryensis. Aquaculture 269: 278-289.
Schlichter D, Fricke HW, Weber W, 1986. Light harvesting by wavelength transformation in a symbiotic coral of the Red Sea twilight zone. Mar Biol 91: 403-407.
Schneider K and Erez J 2006.The effect of carbonate chemistry on calcification and photosynthe-sis in the hermatypic coral Acropora eurystoma. Limnol Oceanogr 51(3): 1284-1293.
Schumacher H and Plewka M 1981. The adaptive significance of mechanical properties versus morphological adjustments in skeletons of Acropora palmata and Acropora cervicornis (Cnidaria, Scleractinia). Proc 4th Int Coral Reef Symp 2: 121-128.
References
197
Schutter M, Van Velthoven B, Janse M, Osinga R, Janssen M, Wijffels R, Verreth J, 2008. The effect of irradiance on long-term skeletal growth and net photosynthesis in Galaxea fascicularis under four light conditions. J Exp Mar Biol Ecol 67: 75-80.
Scoffin TP, Tudhope AW, Brown BE, Chansang H, Cheeney RF, 1992. Patterns and possible envi-ronmental controls of skeletogenesis of Porites lutea, South Thailand. Coral Reefs 11: 1-11.
Sebens KP 1987. Coelenterata. In: Pandian TJ, Vernberg FJ (eds.) Animal Energetics, Vol 1. Academic Press, New York, pp. 55-120.
Sebens KP 1997. Adaptive responses to water flow: morphology, energetics and distribution of reef corals. Proc 8th Int Coral Reef Symp 2: 1053-1058.
Sebens KP and Johnson AS 1991. Effects of water movement on prey capture and distribution of reef corals. Hydrobiologia 226: 91-101.
Sebens KP, Witting J, Helmuth B, 1997. Effects of water flow and branch spacing on particle capture by the reef coral Madracis mirabilis (Duchassaing and Michelotti). J Exp Mar Biol Ecol 211: 1-28.
Sebens KP, Grace SP, Helmuth B, Maney Jr EJ, Miles JS, 1998. Water flow and prey capture by three scleractinian corals, Madracis mirabilis, Montastrea cavernosa and Porites porites, in a field enclosure. Mar Biol 131: 347-360.
Sebens KP, Helmuth B, Carrington E, Agius B, 2003. Effects of water flow on growth and energe-tics of the scleractinian coral Agaricia tenuifolia in Belize. Coral Reefs 22: 35-47.
Shaish L, Abelson A, Rinkevich B, 2006. Branch to colony trajectory in a modular organism: pat-tern formation in the Indo-Pacific coral Stylophora pistillata. Dev Dynam 235: 2111-2121.
Shashar N, Kinaneb S, Jokiel PL, Patterson MR, 1996. Hydromechanical boundary layers over a coral reef. J Exp Mar Biol Ecol 199: 17-28.
Shick JM and Dunlap WC 2002. Mycosporine-like amino acids and related gadusols: biosyn-thesis, accumulation, and UV-protective functions in aquatic organisms. Annu Rev Physiol 64: 223– 262.
Shinn EA 1966. Coral growth-rate, an environmental indicator. J Paleontol 40: 233–241.
Simkiss K 1964. Phosphates as crystal poisons of calcification. Biol Rev 39: 487-505.
Sipkema D, Yosef NAM, Adamczewski M, Osinga R, Mendola D, Tramper J, Wijffels RH, 2006. Hypothesized kinetic models for describing the growth of globular and encrusting demosponges. Mar Biotechnol 8: 40-51

References
198
Smith LW and Birkeland C 2007. Effects of intermittent flow and irradiance level on back reef Po-rites corals at elevated seawater temperatures. J Exp Mar Biol Ecol 341: 282-294.
Smith DJ, Suggett DJ, Baker NR, 2005. Is photoinhibition of zooxanthellae photosynthesis the primary cause of thermal Bleaching in corals? Glob Change Biol 11: 1-11.
Snidvongs A and Kinzie III RA 1994. Effects of nitrogen and phosphorus enrichment on in vivo symbiotic zooxanthellae of Pocillopora damicornis. Mar Biol 118: 705-711.
Sorokin YI 1973. On the feeding of some scleractinian corals with bacteria and dissolved organic matter. Limnol Oceanogr 18(3): 380-385.
Stambler N, Popper N, Dubinsky Z, Stimson J, 1991. Effects of nutrient enrichment and water motion on the coral Pocillopora damicornis. Pac Sci 45(3): 299-307.
Stambler N, Cox EF, Vaga R, 1994. Effect of ammonium enrichment on respiration, zooxanthellar densities, and pigment concentrations in two species of Hawaiian corals. Pac Sci 48: 284-290.
Steven ADL and Broadbent AD 1997. Growth and metabolic responses of Acropora palifera to long term nutrient enrichment . Proc 8th Intern Coral Reef Symp 1: 867-872.
Stimson J 1996. Wave-like outward growth of some table- and plate-forming corals, and a hypo-thetical mechanism. Bull Mar Sci 58: 301-313.
Sunda WG 1991. Trace metal interactions with marine phytoplankton. Biol Oceanogr 12: 411-418.
Szmant AM and Gassman NJ 1990. The effects of prolonged “bleaching” on the tissue biomass and reproduction of the reef coral Montastrea annularis. Coral Reefs 8: 217-224.
Szmant AM 2002. Nutrient enrichment on coral reefs: Is it a major cause of coral reef decline? Estuar Coast 25 (4): 743-766.
TTambutté E, Allemand D, Bourge I, Gattuso J-P, Jaubert J, 1995. An improved 45Ca protocol for investigating physiological mechanisms in coral calcification. Mar Biol 122: 453-459.
Tambutté E, Allemand D, Mueller E, Jaubert J, 1996. A compartmental approach to the mecha-nism of calcification in hermatypic corals. J Exp Biol 199: 1029-1041.
Tanaka Y, Miyajima T, Koike I, Hayashibara T, Ogawa H, 2007. Imbalanced coral growth between organic tissue and carbonate skeleton caused by nutrient enrichment Limnol Oceanogr 52(3): 1139-1146.
References
199
Tanner JE 1995. Competition between scleractinian corals and macroalgae: An experimental in-vestigation of coral growth, survival and reproduction. J Exp Mar Biol Ecol 190(2): 151-168.
Thomas FIM and Atkinson MJ 1997. Ammonium uptake by coral reefs: Effects of water velocity and surface roughness on mass transfer. Limnol Oceanogr 42(1): 81-88.
Titlyanov EA and Latypov YY 1991. Light-dependence in scleractinian distribution in the sublittoral zone of South China Sea Islands. Coral Reefs 10: 133-138.
Titlyanov EA and Titlyanova TV 2002a. Reef-Building Corals—Symbiotic Autotrophic Organisms: 1. General Structure, Feeding Pattern, and Light-Dependent Distribution in the Shelf. Russ J Mar Biol 28: 1-15.
Titlyanov EA and Titlyanova TV 2002b. Reef-Building Corals—Symbiotic Autotrophic Organisms: 2. Pathways and Mechanisms of Adaptation to Light. Russ J Mar Biol 28(1): S16-S31.
Titlyanov E, Bil’ K, Fomina I, Titlyanova T, Leletkin V, Eden N, Malkin A and Dubinsky Z, 2000. Ef-fects of dissolved ammonium addition and host feeding with Artemia salina on photoacclimation of the hermatypic coral Stylophora pistillata. Mar Biol 137(3): 463-472.
Titlyanov EA, Titlyanova TV, Yamazato K, Van Woesik R, 2001. Photo-acclimation dynamics of the coral Stylophora pistillata to low and extremely low light. J Exp Mar Biol Ecol 263: 211-225.
Titlyanov EA, Titlyanova TV, Van Woesik R, Yamazato K, 2002. Acclimation of the hermatypic coral Stylophora pistillata to bright light. Russ J Mar Biol 28(1): S41-S46.
Tomascik T 1990. Growth rates of two morphotypes of Montastrea annularis along a eutrophica-tion gradient, Barbados, W.I. Mar Poll Bull 21: 376-381.
Tomascik T and Sander F 1985. Effects of eutrophication on reefbuilding corals. 1. Growth rate of the reef-building coral Montastrea annularis. Mar Biol 87: 143-155.
Torres JL 2001. Impacts of sedimentation on the growth rates of Montastraea annularis in sout-hwest Puerto Rico. Bull Mar Sci 69 (2): 805-818.
Torres, JL, Armstrong RA, Corredor JE, Gilbes F, 2007. Physiological responses of Acropora cer-vicornis to increased solar irradiance. Photochem Photobiol 83: 839-851.
U
Ulstrup KE, Ralph PJ, Larkum AWD, Kuhl M, 2006. Intra-colonial variability in light acclimation of zooxanthellae in coral tissues of Pocillopora damicornis. Mar Biol 149: 1325-1335.

References
200
V
Van de Schootbrugge B, Tremolada F, Rosenthal Y, Bailey TR Feist-Burkhardt S, Brinkhuis H, Pross J, Kent DV, Falkowski PG, 2007. End-Triassic calcification crisis and blooms of organic-walled “disaster species”. Palaeogeogr Palaeoclimatology Palaeoecol 244: 126-141.
Van Katwijk MM, Meier NF, Van Loon R, Van Howe EM, Giesen WBJT, Van der Velde G, 1993. Sabaki River sediment loading and coral stress: correlation between sediments and condition of the Malindi-Watamu reefs in Kenya (Indian Ocean). Mar Biol 117: 675-683.
Veron JEN and Pichon M 1976. Australian Institute of Marine Science Monograph Series Vol. 1, Scleractinia of Eastern Australia Part 1 (Australian Government Publishing Service, Canberra).
W
Wabnitz C, Taylor M, Green E, Razak T, 2003. From ocean to aquarium. The global trade in ma-rine ornamental species. UNEP-WCMC report, Cambridge, UK.
Wainwright SA 1963. Skeletal organization in the coral, Pocillopora Damicornis. Q J Microsc Sci s3-104: 169-183.
Wilkens P 1973. The saltwater aquarium for tropical marine invertebrates. Englebert Pfriem Ver-lag. Wuppertal, Germany, 216 pp.
Wilkinson CR 1996. Global change and coral reefs: impacts on reefs, economies and human cultures. Global Change Biol 2: 547-558.
Winters G, Loya Y, Rottgers R, Beer S, 2003. Photoinhibition in shallow-water colonies of the coral Stylophora pistillata as measured in situ. Limnol Oceanogr 48(4): 1388-1393.
Y
Yellowlees D, Alwyn T, Rees V, Leggat W, 2008. Metabolic interactions between algal symbionts and invertebrate hosts. Plant, Cell Environ 31: 679-694.
Young SD 1971. Organic material from scleractinian coral skeletons. I. Variation in composition between several species, Comp Biochem Physiol 40B: 113-120.


Summary

Summary
203
Chapter 1: IntroductionScleractinian or stony corals are sessile colonial modular animals that live in
symbiosis with unicellular dinoflagellates, known as zooxanthellae. They can feed
both phototrophically (i.e. by using translocated photosynthetic carbon from their
zooxanthellae) and heterotrophically (i.e. by capturing zooplankton or taking up dissolved
organic matter), allowing for tight nutrient recycling and enabling their survival in an
oligotrophic environment. Scleractinian corals are key organisms of tropical coral reefs
and responsible for building the large carbonate reef frame work that provides habitat to
thousands of other reef organisms.
The intriguing reef ecosystem is increasingly threatened by both natural and anthropogenic
factors. Concurrently with the gradual decline of coral reefs, there is a growing interest in
keeping this delicate ecosystem in aquaria. The trade in marine ornamental species has
become a multi million dollar industry. To reduce pressure on the reef, it is the policy of
zoos and aquaria to display organisms that originate from sustainable breeding facilities.
In support of the development of cost-effective aquaculture of corals for aquaria a project
(CORALZOO, EU-funded, nr. 012547) was established to provide a scientific basis for
coral husbandry techniques. The aim of this thesis was to study the influence of light and
water flow on coral growth.
Chapter2:WaterflowBeing sedentary marine invertebrates, scleractinian corals are both dependent on and
constrained by the presence of water flow. Water flow affects the exchange rate of
dissolved gasses and (in)organic nutrients, prey capture efficiency and the removal of
sediment and mucus. Growth rates of corals will therefore be determined by the sum
of effects that flow exerts on coral physiology. Since scleractinian corals are symbiotic
organisms, constricted to the euphotic zone of the coral reef and relying for a large part
on photosynthetic energy from their symbionts, the effect of water flow was expected
to be related to a water flow modulated effect on photosynthesis. Therefore, the effect
of different flow regimes on long-term growth of Galaxea fascicularis was studied and
related to respirometric measurements of photosynthesis and respiration. Four series
Summary
204
of ten coral nubbins of Galaxea fascicularis were exposed to four different flow regimes
(0 cm s-1, 10 cm s-1, 20 cm s-1 and 25 cm s-1) for 42 weeks at an irradiance of 90 µE m-2
s-1. Coral growth was measured as buoyant mass, surface area and polyp number. Net
photosynthesis and respiration were measured at their specific flow conditions inside a
respirometric flow cell.
In the absence of flow, corals grew significantly slower and appeared unhealthy. In the
presence of flow (10, 20 and 25 cm s-1), growth rates significantly increased. However,
no proportional increase of growth with increasing water flow was observed: average
specific growth rate was not significantly different between 10 and 20 cm s-1, while it was
significantly higher at 25 cm s-1. From 10 to 25 cm s-1, average net photosynthetic rate
decreased and average dark respiration rate increased. As a result, scope for growth
based on phototrophic carbon decreased with flow.
Differences in growth rates could not be explained by a flow-modulated effect on
either photosynthetic rate or photosynthetic carbon left for growth. It is suggested that
higher flow rates reduce the chance of disturbance of coral growth by competing algae,
allowing corals to grow more often with the maximum specific growth rate that is possible
under the given environmental conditions. Also other effects of increased flow, such as
increased respiratory rates and increased (in)organic nutrient uptake, might have been
co-responsible for the increased growth of the corals in 25 cm s-1. It is expected that
phototrophic feeding and the modulation of photosynthesis by water flow will become
more important at high irradiance.
Chapter 3: IrradianceAs a consequence of living in symbiosis with phototrophic algae, corals are dependent
on light. According to the light-enhanced calcification theory, calcification of the coral host
is enhanced by photosynthesis of the zooxanthellae. However, the exact mechanism of
the enhancement of calcification by photosynthesis is still a matter of debate. Although
several researchers found a positive correlation between skeletal growth and irradiance, it
was not yet demonstrated whether the enhancing effect was mediated by photosynthesis
throughout a range of light intensities. To provide experimental evidence for mediation of
Summary
205
light-enhanced calcification by photosynthesis, the relation between irradiance, skeletal
growth and net photosynthesis was studied in Galaxea fascicularis. Coral nubbins of
Galaxea fascicularis were exposed to four different light treatments that provided an
irradiance of 38, 68, 166 and 410 µE m-2 s-1 for 294 days. Growth of these nubbins
was measured as buoyant mass at different time intervals. A light-saturation curve for
photosynthesis was measured in a respirometric flow cell using a Galaxea fascicularis
colony grown at 60 µE m-2 s-1.
Both skeletal growth and photosynthesis increased with irradiance. However, skeletal
growth and photosynthesis were not directly proportional. The increase of specific
growth rate with irradiance was less than expected based on the increase in net
photosynthetic rate with irradiance. This discrepancy between potential energy produced
in photosynthesis and energy used for skeletal growth indicates that skeletal growth is
not limited by photosynthetic potential at high irradiance levels. It is suggested that either
growth became inhibited by light or limited by other factors such as heterotrophic feeding
or the availability of bicarbonate (i.e. aragonite saturation state).
Chapter 4: Photoperiod and photoacclimationThe quantity of light that is available for coral growth is not only determined by irradiance
level, but also by the length of the photoperiod. Coral nubbins of Galaxea fascicularis
were cultured for a period of 18 weeks at different photoperiods (8h 150 µE m-2 s-1:16h
dark, 12h 150 µE m-2 s-1:12h dark, 16h 150 µE m-2 s-1:8h dark, 24h 150 µE m-2 s-1:0h dark)
and irradiances (8h 150 µE m-2 s-1:16h dark, 8h 225 µE m-2 s-1:16h dark and 8h 300 µE
m-2 s-1:16 h dark). Growth during the experiment was determined by measuring buoyant
mass. More light, either as irradiance or as photoperiod, did not result in more growth.
Since in this experiment light was found not to be limiting for growth, the experiment was
used to study photoacclimation of Galaxea fascicularis to different photoperiods under
light-saturating conditions. To detect photoacclimation of the corals to an increased light
duration, net photosynthesis, dark respiration, daily P/R ratio, zooxanthellae density and
chlorophyll content were measured for corals grown at 8h 150 µE m-2 s-1: 16h dark and
corals grown at 16h 150 µE m-2 s-1:8h dark.
Summary
206
Continuous lighting (24h 150 µE m-2 s-1:0h dark) resulted in immediate bleaching and the
corals died after 14 weeks. The corals in the other treatments were able to adapt to the
prolonged light duration. The corals grown at 16h 150 µE m-2 s-1:8h dark had decreased
their hourly rate of photosynthesis compared to the corals grown at 8h 150 µE m-2 s-1:16h
dark. As a result, daily net photosynthesis was not significantly different between the 8
hour light and 16 hour light treatment, showing photoacclimation of the corals, which may
explain the comparable growth rates. Photoacclimation was not achieved by changes
in chlorophyll A or zooxanthellae density, since no significant differences were found in
these parameters.
Based on the results of this study it is proposed that Galaxea fascicularis exhibited a form
of self-shading, which is a known behavioral response of several coral species to e.g.
excess light. Possibly, as a result of this photo-protective response, growth rates were
not further reduced when exposed to an extended photoperiod under light saturating
conditions.
Chapter5:InteractionbetweenwaterflowandirradianceBased on the findings in Chapter 2, it was expected that the modulation of photosynthesis
by water flow would become more important for coral growth at higher irradiance
levels. To study the interaction between irradiance and water flow on coral growth
and photosynthesis, a 2x2-factorial design was employed (Chapter 5): high irradiance
(600 µE m-2 s-1) vs. intermediate irradiance (300 µE m-2 s-1) and high flow (15-25 cm s-1)
vs. low flow (5-10 cm s-1). Growth was measured as buoyant mass and surface area.
Photosynthetic rates of each coral was measured at its specific light and flow conditions
inside a respirometric flow cell. A significant (p<0.02) interaction between light and water
flow was found with respect to specific growth rate measured as buoyant mass, while
the interaction between light and water flow on the specific growth rate of the surface
area reached significance at a probability level of 9%. Water flow stimulated growth more
at 600 µE m-2 s-1 than at 300 µE m-2 s-1. The corals had the highest growth rate at high
irradiance in combination with high flow. Net photosynthetic rates were not significantly
different between treatments. Enhancement of coral growth with both increasing water

Summary
207
flow and increasing irradiance could not be explained by a corresponding increase in net
photosynthetic rates. Possibly, the need for costly photo-protective mechanisms at low
flow regimes can explain the differences in growth with flow.
Chapter6:ThebiologyandeconomicsofcoralgrowthTo provide more insight in the contradictory findings of the relationship between the amount
of light and coral growth, an overview of factors that control coral growth was made.
Besides numerous environmental factors that can potentially limit or inhibit coral growth,
also genetic variability plays a role in determining coral growth rates. Since the magnitude
of the effect of one factor often depends on the other, it is of importance for the future to
perform multi-factorial experiments to provide more insight in interactions between factors.
Due to the multiple interactions, optimization of coral aquaculture implies close fine-tuning
of different factors. Each species and each genotype will require a different combination
of values to maximize its growth rate. Growth models describing coral growth kinetics of
a particular species can be used as a tool to design coral aquaculture systems. A proper
growth model can reliably extrapolate the size of a coral nubbin to its market size and
therefore help to calculate the costs of aquaculture and help determining the best culture
strategy. It is shown that optimization can be rewarding, since for example optimizing
feeding of Seriatopora caliendrum increased productivity with 35% while production costs
increasing only with 15%.
Chapter 7: General discussion The potential importance of interactions between factors for the understanding of coral
growth and improvement of coral aquaculture is stressed. Moreover, a limitation concept
for coral growth is introduced to explain different results for the relationship between light
and skeletal growth. The following working mechanism for coral growth is proposed: the
coral-algal symbiosis will adapt to the prevailing light regime by optimizing light capture
and light processing at different levels of the organism, in an attempt to maximize light
use. Depending on external environmental conditions, photoacclimation may not always
be sufficient to obtain light saturation for coral growth. Under light-limited conditions, the

Summary
208
coral will try to compensate for reduced carbon/energy input by heterotrophic feeding
or reducing their losses. Under light-saturating conditions, other environmental factors
start to limit or inhibit coral growth, e.g. inorganic nutrients, heterotrophic food, inorganic
carbon or the presence of water flow. Water flow is very important in both situations,
since without flow it is difficult to adapt to either heterotrophic living (no supply of food) or
phototrophic living (light stress). Finally, it is discussed how this thesis work can contribute
to the improvement of aquaculture of corals. The information in this thesis should not be
used as a blueprint for coral aquaculture, however, its value lies in providing a blueprint
for targeted optimization studies of coral aquaculture.


Samenvatting

Samenvatting
211
Hoofdstuk 1: IntroductieSteenkoralen zijn sessiele, kolonievormende en rifvormende dieren die in symbiose
leven met eencellige algen, ook wel zoöxanthellen genoemd. Een koraalkolonie kan zich
daardoor zowel fototroof (i.e. gebruik makend van de producten die de zoöxanthellen
produceren tijdens fotosynthese) als heterotroof (i.e. gebruik makend van zelf gevangen
zooplankton of opgenomen opgeloste organische stoffen) voeden. Door efficiënte
recycling van nutriënten is het koraal in staat om te overleven in een nutriënt-arme
omgeving.
Steenkoralen bouwen kalkskeletten door het afscheiden van calciumcarbonaat en
zijn daardoor verantwoordelijk voor de bouw van de enorme kalkstructuren die aan
duizenden andere riforganismen een habitat bieden. Dit bijzondere ecosysteem wordt
in toenemende mate bedreigd door zowel natuurlijke als antropogene factoren zoals
klimaatverandering, destructieve vistechnieken, overbevissing en vervuiling. Door de
geleidelijke achteruitgang van de koraalriffen en het groeiende bewustzijn van de waarde
van dit ecosysteem, is er een groeiende interesse ontstaan voor het houden van dit
kwetsbare ecosysteem in aquaria. De handel in koralen en andere riforganismen (marine
ornamental species) is lucratief geworden.
Ook bij publieke aquaria is er een trend om levende koraalriffen aan het publiek
te laten zien. Om de druk op natuurlijke koraalpopulaties te verminderen, hebben
dierentuinen en publieke aquaria het beleid om zoveel mogelijk dieren te laten zien die
voortkomen uit duurzame kweek programma’s. Ter ondersteuning van de ontwikkeling
van duurzame kweek programma’s voor steenkoralen voor aquaria, is er door een
groep Europese dierentuinen en onderzoeksinstellingen een project (CORALZOO, EU-
gefinancierd, nr. 012547) uitgevoerd om een wetenschappelijke basis voor koraalkweek
technieken te verschaffen. Dit promotieonderzoek maakte deel uit van het CORALZOO
onderzoeksprogramma. Het doel van dit promotieonderzoek was het bestuderen van de
invloed van licht en stroming op koraalgroei. De Indopacifische soort Galaxea fascicularis
werd hierbij gebruikt als model-organisme.
Samenvatting
212
Hoofdstuk 2: StromingDoordat steenkoralen een sessiel bestaan leiden zijn ze voor veel processen afhankelijk
van de aanwezigheid van stroming. Stroming beïnvloedt de opname en afgifte van
opgeloste gassen en (an)organische nutriënten, de efficiëntie waarmee plankton gevangen
wordt en de verwijdering van sediment en koraalslijm (mucus). De groeisnelheid van
koralen kan daarom worden beschouwd als de resultante van de verschillende effecten
die stroming heeft op de fysiologie van koralen. Aangezien symbiotische steenkoralen
grotendeels afhankelijk zijn van de fotosynthetische capaciteit van hun symbionten, en
daardoor beperkt zijn tot de eufotische zone van het koraalrif, werd verondersteld dat het
effect van stroming op koraalgroei gerelateerd was aan fotosynthese.
Om deze reden werd in een eerste experiment de invloed van verschillende
stromingsbehandelingen op de lange-termijn groei van G. fascicularis bestudeerd en
gerelateerd aan respirometrische metingen van fotosynthese en respiratie. Vier reeksen
van 10 nubbins (nubbins zijn fragmenten/stekken met een begingrootte van slechts
één poliep) van werden blootgesteld aan vier verschillende stromingsbehandelingen (0
cm s-1, 10 cm s-1, 20 cm s-1 en 25 cm s-1), gedurende 42 weken bij een lichtintensiteit
van 90 µE m-2 s-1. Koraalgroei werd gemeten als onderwatermassa, oppervlakte en het
aantal poliepen. Netto fotosynthese en respiratie werden gemeten onder de specifieke
stromingscondities van het koraal in een respirometrische stromingscel.
In afwezigheid van stroming groeiden de koralen significant minder en zagen ze
er ongezond uit. In de aanwezigheid van stroming (10, 20 and 25 cm s-1) waren
groeisnelheden significant hoger. Echter, er werd geen consistente toename in groei met
toenemende stromingssnelheid waargenomen: de gemiddelde specifieke groeisnelheid
was niet significant verschillend tussen 10 cm s-1 en 20 cm s-1, terwijl deze significant
hoger was bij 25 cm s-1. Van 10 tot 25 cm s-1 daalde de gemiddelde netto fotosynthese,
terwijl de gemiddelde donker respiratie toenam. Als gevolg daarvan nam de groeipotentie
(scope for growth) op basis van fototroof koolstof af met toenemende stroomsnelheid.
Verschillen in groeisnelheid konden niet worden verklaard door middel van een stimulerend
effect van stroming op fotosynthese of de groeipotentie op basis van fototroof koolstof.
Het is mogelijk dat hogere stroomsnelheden de kans op inhibitie van koraalgroei door
Samenvatting
213
concurrerende algen verminderen, waardoor koralen vaker kunnen groeien met hun
maximaal mogelijke specifieke groeisnelheid onder de heersende omstandigheden. Ook
andere effecten van toenemende stroomsnelheid, zoals verhoogde respiratiesnelheden
en verhoogde opname van (an)organische nutriënten, kunnen mede verantwoordelijk
zijn geweest voor de toegenomen groei van de koralen bij 25 cm s-1. Dit experiment
is uitgevoerd bij een relatief lage lichtintensiteit. Vermoedelijk worden zowel de
fototrofe levensstijl als het effect van stroming op fotosynthese belangrijker bij hogere
lichtintensiteiten. Deze hypothese is getoetst in Hoofdstuk 5.
Hoofdstuk 3: Licht intensiteitDoor hun symbiose met fotosynthetische algen zijn koralen afhankelijk van licht. Volgens
de theorie van lichtgestimuleerde kalkvorming (light-enhanced calcification) wordt de
afscheiding van het kalkskelet door de koraal gastheer gestimuleerd door fotosynthese
van de zoöxanthellen. Echter, het precieze mechanisme achter de stimulatie van
kalkvorming door fotosynthese is nog steeds onderwerp van debat. Ondanks het feit
dat verschillende onderzoekers een positieve relatie tussen skeletgroei en lichtintensiteit
hebben gevonden, is het nog niet bekend of de stimulatie van groei over een reeks
lichtintensiteiten gerelateerd is aan fotosynthese. Om experimenteel bewijs te leveren voor
het belang van fotosynthese voor lichtgestimuleerde kalkvorming werd de relatie tussen
licht intensiteit, skeletgroei en netto fotosynthese bestudeerd in G. fascicularis. Nubbins
van G. fascicularis werden blootgesteld aan vier verschillende lichtbehandelingen die een
lichtintensiteit Boden van 38, 68, 166 and 410 µE m-2 s-1 gedurende een periode van 294
dagen. Groei van deze nubbins werd gemeten als onderwatermassa over verschillende
tijdsintervallen. Een verzadigingscurve voor licht en fotosynthese werd gemeten in een
respirometrische stromingscel, gebruikmakend van een G. fascicularis kolonie die was
opgegroeid bij 60 µE m-2 s-1
Zowel skeletgroei als fotosynthese namen toe met lichtintensiteit. Echter, toename in
skeletgroei en fotosynthese waren niet evenredig. De toename in specifieke groeisnelheid
met lichtintensiteit was minder dan werd verwacht op basis van de toename van
fotosynthese met lichtintensiteit. Dit contrast tussen de potentiële hoeveelheid energie

Samenvatting
214
geproduceerd tijdens fotosynthese en de energie gebruikt voor skeletgroei wijst er
op dat skeletgroei niet gelimiteerd wordt door fotosynthese bij hoge lichtintensiteiten.
Mogelijke verklaringen voor de resultaten verkregen in deze studie zijn dat koraalgroei
ofwel geïnhibeerd werd door licht, of werd gelimiteerd door andere factoren zoals de
beschikbaarheid van heterotroof voedsel of the beschikbaarheid van bicarbonaat (de
aragoniet verzadigingswaarde dat is niet hetzelfde!)
Hoofdstuk 4: Fotoperiode en fotoacclimatieDe hoeveelheid licht beschikbaar voor koraalgroei wordt niet alleen bepaald door
de intensiteit van het licht, maar ook door de lengte van de fotoperiode. Het effect van
fotoperiode op koraal groei is bestudeerd in Hoofdstuk 4. Nubbins van G. fascicularis werden
gedurende 18 weken geweekt bij verschillende fotoperioden (8 uur 150 µE m-2 s-1:16 uur
donker, 12 uur 150 µE m-2 s-1:12 uur donker, 16 uur 150 µE m-2 s-1:8 uur donker, 24 uur
150 µE m-2 s-1:0 uur donker) en verschillende lichtintensiteiten (8 uur 150 µE m-2 s-1:16
uur donker, 8 uur 225 µE m-2 s-1:16 uur donker and 8 uur 300 µE m-2 s-1:16 uur donker).
Groei gedurende het experiment werd gemeten als toename in onderwatermassa. Het
aanbieden van meer licht, (zowel het verhogen van de lichtintensiteit als het verlengen
van de fotoperiode), leidde niet tot meer groei in dit experiment. Omdat licht blijkbaar niet
limiterend was voor groei, werd dit experiment gebruikt om de fotoacclimatie (adaptatie)
van G. fascicularis aan verlengde fotoperiode onder licht verzadigende omstandigheden
te bestuderen. Hiertoe werden de netto fotosynthese, donker respiratie, dagelijkse P/R
ratio, zoöxanthellen dichtheid en chlorofyl concentratie bepaald van koralen die bij 8 uur
150 µE m-2 s-1:16 uur donker groeiden en bij 16 uur 150 µE m-2 s-1:8 uur donker.
Continue belichting (24 uur 150 µE m-2 s-1:0 uur donker) resulteerde in onmiddellijke
verbleking (bleaching) van de koralen en sterfte na 14 weken. De koralen in de andere
lichtbehandelingen waren in staat zich te adapteren aan de verlengde fotoperiode. De
koralen die groeiden bij 16 uur 150 µE m-2 s-1:8 uur donker hadden een significant lagere
fotosynthesesnelheid dan de koralen die groeiden bij 8 uur 150 µE m-2 s-1:16 uur donker.
Dientengevolge was de dagelijkse netto fotosynthese niet significant verschillend tussen
de 8 uur en 16 uur licht behandeling, hetgeen wijst op adaptatie van de koralen aan
Samenvatting
215
de verlendge lichtperiode (fotoacclimatie). Deze adaptatie verklaart mogelijk dat de
groeisnelheden onder beide lichtperiodes vergelijkbaar waren. Fotoacclimatie werd niet
bereikt door veranderingen in chlorofyl of zoöxanthellen dichtheid, aangezien hierin geen
significante verschillen werden gevonden.
Onze gegevens duiden erop dat het mogelijk is dat G. fascicularis zichzelf beschermde
tegen teveel licht door hun weefsel in te trekken en zichzelf hierdoor te ‘beschaduwen’,
hetgeen een bekende gedragsmatige reactie is van verschillende koraalsoorten op
bijvoorbeeld overmatig sterke belichting. Mogelijk is dit licht-beschermende mechanisme
verantwoordelijk voor het feit dat de groeisnelheden niet verder reduceerden ten gevolge
van verlengde fotoperiode onder lichtverzadigende condities
Hoofdstuk 5: Interactie tussen stroming en lichtintensiteit Gebaseerd op onze bevindingen in Hoofdstuk 2, werd verwacht dat de modulatie
van fotosynthese door stroming belangrijker zou worden voor koraalgroei bij hogere
licht intensiteiten. Om de interactie tussen licht en stroming en het effect op groei en
fotosynthese van G. fascicularis te bestuderen werd een 2x2 factoriëel ontwerp gebruikt:
hoge lichtintensiteit (600 µE m-2 s-1) versus middelmatige lichtintensiteit (300 µE m-2
s-1) en hoge stroming (15-25 cm s-1) versus lage stroming (5-10 cm s-1). Groei werd
gemeten als onderwatermassa en oppervlakte. Netto fotosynthese van koralen uit elke
behandeling werd gemeten bij hun eigen specifieke licht en stromingscondities in een
respirometrische stromingscel. Een significante interactie tussen licht en stroming werd
gevonden voor specifieke groeisnelheid als onderwatermassa, terwijl de interactie tussen
licht en stroming voor specifieke groeisnelheid als oppervlakte significantie bereikte bij
een waarschijnlijkheid van 9%. Stroming stimuleerde groei meer bij 600 µE m-2 s-1 dan
bij 300 µE m-2 s-1. De koralen hadden de hoogste groeisnelheid bij hoge lichtintensiteit
en hoge stroming. Netto fotosynthesesnelheden waren niet significant verschillend
tussen de behandelingen. Toename van koraalgroei met zowel toenemende stroming als
lichtintensiteit kon daarom niet worden verklaard met netto fotosynthese. Mogelijk kan
de noodzaak voor kostbare licht-beschermende mechanismen bij lage stroming en hoge
lichtintensiteit de verschillen in groei met stroming verklaren.
Samenvatting
216
Hoofdstuk 6: De biologie en economie van koraalgroei Om meer inzicht te verschaffen in de tegenstrijdige bevindingen betreffende de relatie
tussen de hoeveelheid licht en koraalgroei is een overzicht van factoren die koraalgroei
beïnvloeden gemaakt. Naast talrijke omgevingsfactoren die mogelijk koraalgroei kunnen
limiteren of inhiberen, speelt ook genetische achtergrond een rol in het bepalen van de
uiteindelijke groeisnelheid van koralen. Omdat de mate van het effect van één factor
vaak afhangt van de andere factor, is het van belang voor de toekomst om te focussen
op multi-factoriële experimenten om meer inzicht krijgen in de interacties tussen
factoren. Optimalisatie van koraalkweek komt daarom neer op het nauw afstemmen
van verschillende factoren. Iedere koraalsoort en ieder genotype vereist een specifieke
combinatie van factoren met verschillende waarden om zijn groeisnelheid te kunnen
maximaliseren. Groeimodellen die de groeikinetiek van een bepaalde koraalsoort
beschrijven kunnen gebruikt worden als een instrument om koraal aquacultuur systemen
te ontwerpen. Een nauwkeurig passend groeimodel kan betrouwbaar de grootte
van een koraal nubbin extrapoleren naar de uiteindelijke marktgrootte en is daardoor
bruikbaar voor het berekenen van de kosten van aquacultuur en het bepalen van de
beste kweekstrategie. In dit hoofdstuk wordt aangetoond dat optimalisatie van factoren
belonend kan zijn, aangezien bijvoorbeeld in het geval van optimalisatie van voer
regime voor Seriatopora caliendrum de productiviteit verhoogd werd met 35%, terwijl
productiekosten slechts stegen met 15%.
Hoofdstuk 7: DiscussieIn de discussie wordt het potentiële belang van interacties tussen factoren voor inzicht
in koraal groei en de verbetering van koraalkweek verder benadrukt. Daarnaast
wordt een limitatie concept voor koraalgroei geïntroduceerd om de verschillende
resultaten aangaande de relatie tussen licht en skeletgroei te verklaren. Het volgende
werkingsmechanisme voor koraalgroei wordt voorgesteld: de koraal-algen symbiose
zal adapteren aan het heersende lichtregime door middel van het optimaliseren van
zowel de hoeveelheid licht die ingevangen wordt als de efficientie van de verwerking
van dit licht, in een poging om het lichtgebruik te maximaliseren. Afhankelijk van externe
omgevingsfactoren, zal fotoacclimatie bij afnemende lichtintensiteit niet altijd voldoende
zijn om lichtverzadiging voor koraalgroei te bewerkstelligen. Onder lichtgelimiteerde
omstandigheden zal het koraal proberen zijn energie en koolstof tekort te compenseren
door zich meer heterotroof te gaan voeden of verliezen te minimaliseren. Onder
lichtverzadigende omstandigheden zullen andere omgevingsfactoren koraalgroei gaan
limiteren of inhiberen, zoals bv anorganische nutriënten, heterotrofe voeding, anorganisch
koolstof of de aanwezigheid van stroming. De aanwezigheid en de sterkte van de stroming
is zeer belangrijk in beide situaties, aangezien het in de afwezigheid van stroming bijna
onmogelijk is om te adapteren aan een heterotrofe levensstijl (want zonder stroming geen
aanvoer van voedsel) of aan een fototrofe levensstijl (zonder stroming meer lichtstress).
Tenslotte wordt bediscussieerd hoe dit proefschrift kan bijdragen aan de verbetering van
de aquacultuur van koralen. De informatie in dit proefschrift biedt nog geen recept voor
de aquacultuur van steenkoralen. De waarde van dit proefschrift ligt juist in het feit dat het
een recept biedt voor de optimalisatie van aquacultuur van steenkoralen.

Acknowledgements

Acknowledgements
219
This adventure all started after coming back from the tropical island Curaçao to the rainy
and cold Netherlands… I was offered this PhD position while I was still wondering what
I was doing again in this country!! It took me some time to adapt and then I took this chance
to continue working with coral reefs.. be it in closed aquarium systems!
This scientific journey involved a lot of travelling, exploring scientific and personal boundaries,
discovering new places and meeting new people. Of course, also problems were encountered
and setbacks were overcome. However, like all adventures, this scientific adventure could
not have been successfully completed without the help of others.
I would like to mention the most important people that took part in my scientific journey and
that helped me develop into a real scientist.
Ronald Osinga, my daily supervisor and co-promotor – Without you this adventure could
have never started! Starting up a new research line and building up a coral lab from scratch
was not always easy. Thank you for your faith and optimism and for guiding me throughout this
scientific adventure! I loved our discussions where we often strayed off from one interesting
topic to another! Als het denkwerk maar goed is! I hope we get the chance to work together
again in the future! I really like your research line as it developed during the last four years!
Johan Verreth, my first promotor - Thanks for your faith in me and for offering me the
opportunity and tools for this PhD project! I believe that your detailed comments to my papers
really improved my science. Thanks for helping me develop into a good scientist, but too bad
you didn’t succeed in making me a Belgian beer lover!
Rene Wijffels, my second promotor – Being located at a different research group and in a
different building, I unfortunately saw you mostly during our meetings. Thanks for responding
so quickly to my papers while giving it a critical review. And thanks for giving me the opportunity
to join the PhD trip to Japan!
Max Janse – Although you are not officially one of my supervisors, you are to me just
as important as the rest! I learned a lot from you, both personally and professionally! And
despite your busy schedule, being the curator of both the Ocean, the Bush ánd the Desert,
you always had some time left for discussions. It was great to be working with you and I hope
we can work together more in the future!
Acknowledgements
220
Starting to work at Aquaculture and Fisheries (AFI) meant entering a men’s world with a
high cultural diversity. I have had colleagues from Portugal, Eritrea, Tanzania, Bangladesh,
Colombia, Iran, Germany, Spain, Vietnam, Indonesia, India, Greece and Poland. And,
being one of the few females in our group, I have been asked many times to be one of
the paranimphs at the graduation ceremony of our male PhD students. This gave me the
opportunity to practice being on stage in the Aula in front of many people for not less than 5
times!! Thanks for this Titu, Yonas, Iyob, Mohammad and Pascal! I would also like to thank
all the other people from AFI for my pleasant time at AFI. In particular, I would like to thank
Ronald Booms for his support in the lab and for his critical thinking when devising a new
lab method for analyzing corals; Helene Willems for her positive presence and sociability;
Pascal for being – for a long time – my only Dutch PhD colleague and of course for helping
me with SAS (statistics), Bob for his practical insights and helping me devise an efficient
coral tissue remover setup, and Julia and Christos for being dear colleagues and also very
nice friends!
Although our Coral Research group started out from scratch, it soon became quite popular
among BSc and MSc students and our coral lab space also grew significantly. First located
next to the catfish in the big hall of the Hatchery, later on we got assigned our own coral room.
Since keeping salt-water aquaria was a time-consuming job next to the regular scientific
work, we hired Tim Wijgerde (who is also a coral reef aquarium hobbyist) to take the role
of aquarist and to assist in research projects. He helped to improve our aquarium systems
even further and developed our aquarium systems into prosperous reef aquaria. When
Tim left, his job was taken over by our former MSc student Anneke and - after she left - by
the people from the Hatchery (Sietze Leenstra, Wian Nusselder, Aart Hutten and Sander
Visser). I would like to thank Tim, Anneke and the Hatchery people for their supportive work
and the Hatchery people also for being so hospitable to host our corals amidst all the fish in
the Fish Palace! Thanks also go to Nico Post who, as a aquarium hobbyist, donated many
colonies of Seriatopora caliendrum to our project. This species proved to be a much quicker
grower and also an easier species to work with compared to Galaxea fascicularis. Future
research in our lab will certainly benefit from using this species!
Acknowledgements
221
I would also like to thank my students that helped me during my PhD work: Bas, John,
Anneke, Rosa, Nanne and Ben. Thanks for all your input and efforts! You all did a large
amount of work and without you it would not have been possible to finish a PhD thesis on
coral growth in time!!! I hope we will stay in touch!
At the Technical Workplace of Zodiac I would like to thank Eric Karruppannan and Evert
Janssen for their skilful help in (technically) developing research equipment tailored to
my research needs. It was great to come to you and develop my research needs into
a concrete plan and design! For example, Eric and I designed and developed the first
two prototypes of the respirometric flow cells that I used for my research, while Evert
helped me with further improvements and contracting out the third one. I learnt a lot about
technical stuff and really respect and appreciate your expertise! Next to that, I enjoyed
drinking coffee with you, which is not only because you made much better coffee than that
brownish liquid that comes from the regular University coffee machines! Special thanks
go to Eric, for having a lot of fun, laughing a lot and all his support and encouraging
words whenever I needed them! At the Technical Workplace of the Biotechnion I would
like to thank Hans Meijer and Reinoud Hummelen for their electric support and providing
equipment for powering the paddlewheel in my respirometric flowcell.
At Burgers Zoo, I would like to thank the whole animal keeper team of Burgers Ocean
(Miranda, Arjan, Dennis, Leon, Marieke, Frank, Tim, Rob and Rik). Thank you all for
facilitating my research and making me feel at home in Burgers Ocean! I appreciate
everything you did, from feeding my corals to helping my students feel at home and find
their way when I was not there! Thanks also to Arjan and Dennis for having a great diving
holiday in Spain!! My sincere apologies for being so difficult to wake up in the middle of
the night when you are ready to leave to Spain! ;)
Also, I would like to thank CORALZOO and my CORALZOO colleagues for giving me
the opportunity to visit so many different public aquaria around Europe! Working on this
project really changed my perception of (public) aquaria. I now know about all the effort
that goes into designing and managing an attractive (coral) exhibit and can distill different
Acknowledgements
222
views on aquarium keeping. Thank you for your collaboration and your reflection on my
research during my presentation at the CORALZOO meetings. I would also like to thank
Muki Sphigel for hosting me at the National Centre for Mariculture in Eilat and Michal Raz-
bahat and Buki Rinkevich for hosting me at the Israel Oceanographic and Limnological
Research (IOLR) institute in Haifa during my trip to Israel.
Next to doing a PhD there is of course more in life… ! Although many of my non-scientific
and/or non-Wageningen friends mabye did not understand what it was like to do a PhD, I
would like to thank them for having a good time with me without talking about PhD-related
stuff! However, it is funny to see that even a hairdresser in Wageningen knows what a
PhD is… which to my opinion indicates how interwoven our scientific community is with
the regular society in Wageningen.
I would like to thank Rogier, Marianne, Annemarie, Erna, Jan-Hans, Katja, Amancio,
Cyrina and others for being a great party crew at the many parties and summer festivals
that we went! Thanks Rogier for your helpful insights into management-related topics;
such insights are helpful in every part of life and in any job, be it in science or in business!
Thanks also Maria for having a great time together! I still miss you as my housemate!!
And thanks Deby making me laugh and have silly talks! I also would like to thank my
Wageningen and/or scientific friends for being able to share concerns and insights about
doing a PhD and for looking at things the scientific way. Thanks Julia, Christos, Annette,
Michael, David, Mara, Dirk (my coral collegue!), Rixt, Pedro, Jazzper, Michel, Heike,
Joost, Anke, Aafke, Nigel, Robert, Bob, Irene, Sander, Rob, Haike, Marcel and everyone
I have forgotten now in the rush of this moment.
Erwin, I met you only during the last few months of my PhD.. and I wish we had met much
earlier!! Thanks for all you positive energy and for sharing so many morals and interests!
I feel really at home with you! I hope we can and will enjoy each other for much much
longer!!! Dikke kus!!!
Acknowledgements
223
Last but not least, I would like to thank my mum, dad and sister Kirsten for their
confidence, support and pride during my scientific adventure. Additionally I would like to
thank my grandparents Oma Kooi, Opa Kooi (R.I.P.) and Opa Schutter (R.I.P.) for their
unconditional love and support. Also Tante Gert and Oom Aait get a special place here at
the end of this chapter, since they are also as much as family to me!
As with most adventures, this scientific adventure made me grow both as a person and
as a scientist. Now it’s time for a new adventure!

About the author
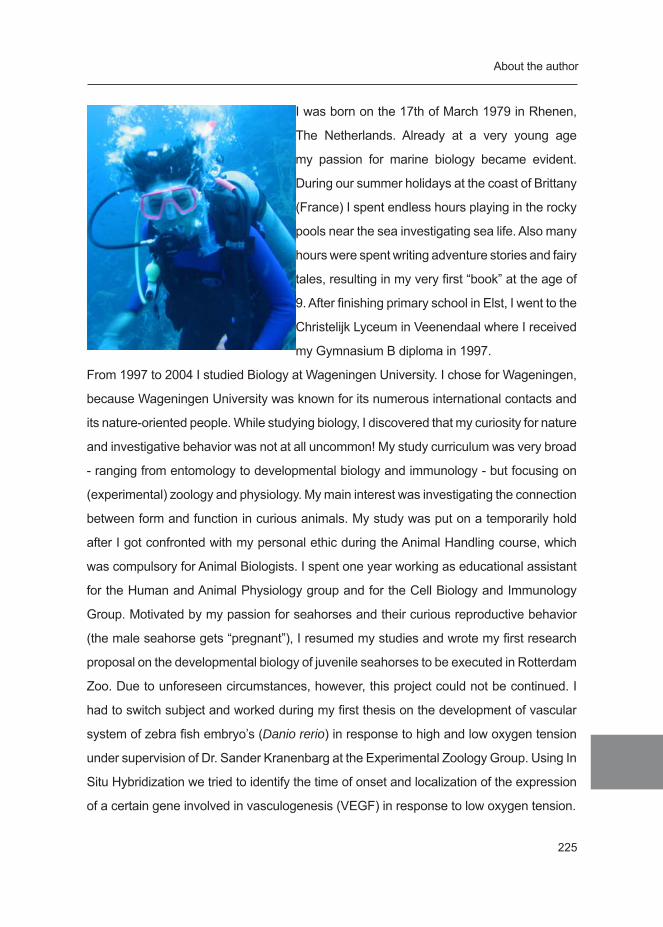
About the author
225
I was born on the 17th of March 1979 in Rhenen,
The Netherlands. Already at a very young age
my passion for marine biology became evident.
During our summer holidays at the coast of Brittany
(France) I spent endless hours playing in the rocky
pools near the sea investigating sea life. Also many
hours were spent writing adventure stories and fairy
tales, resulting in my very first “book” at the age of
9. After finishing primary school in Elst, I went to the
Christelijk Lyceum in Veenendaal where I received
my Gymnasium B diploma in 1997.
From 1997 to 2004 I studied Biology at Wageningen University. I chose for Wageningen,
because Wageningen University was known for its numerous international contacts and
its nature-oriented people. While studying biology, I discovered that my curiosity for nature
and investigative behavior was not at all uncommon! My study curriculum was very broad
- ranging from entomology to developmental biology and immunology - but focusing on
(experimental) zoology and physiology. My main interest was investigating the connection
between form and function in curious animals. My study was put on a temporarily hold
after I got confronted with my personal ethic during the Animal Handling course, which
was compulsory for Animal Biologists. I spent one year working as educational assistant
for the Human and Animal Physiology group and for the Cell Biology and Immunology
Group. Motivated by my passion for seahorses and their curious reproductive behavior
(the male seahorse gets “pregnant”), I resumed my studies and wrote my first research
proposal on the developmental biology of juvenile seahorses to be executed in Rotterdam
Zoo. Due to unforeseen circumstances, however, this project could not be continued. I
had to switch subject and worked during my first thesis on the development of vascular
system of zebra fish embryo’s (Danio rerio) in response to high and low oxygen tension
under supervision of Dr. Sander Kranenbarg at the Experimental Zoology Group. Using In
Situ Hybridization we tried to identify the time of onset and localization of the expression
of a certain gene involved in vasculogenesis (VEGF) in response to low oxygen tension.
About the author
226
Still motivated to pursue my studies on seahorse
biology, I got in contact with Dr. Mark Lokman of the
Marine Science Group at the University of Otago,
New Zealand through Prof. Dr. Johan Verreth of the
Aquaculture and Fisheries Group of Wageningen
University. Dr. Mark Lokman was planning to
study the reproductive biology of seahorses and
was willing to host me for my second MSc thesis.
Seahorses have an interesting reproductive
biology, since the males get pregnant and keep
the embryo’s in their brood pouch (an external skin
fold of their abdomen) in the until after hatching
Since it was already known that the hormone prolactin plays a role in paternal care in
sticklebacks, which species is closely related to the seahorse, this hormone was also
implicated to play a role in paternal care of seahorses. In a preliminary research, I studied
the influence of this paternity hormone on physiological, morphological and behavioral
changes associated with male pregnancy, by employing a diverse array of techniques
such as histology, immunocytochemistry and radio immunoassays.
After my graduation in March 2004, I spent six months in Curaçao, the Dutch Antilles,
as the project coordinator of a coral reef conservation project. As part of this project, I
developed and implemented an environmental education program for local schoolchildren
and (co)-organized snorkel courses, swimming lessons, community meetings and reef
monitoring events, in collaboration with the local government, NGOs, beach resorts and
media. From my experience on Curacao I learnt that I love to work with different cultures,
to live in an tropical environment and to make scientific knowledge accessible in creative
ways.
After returning to the Netherlands, Prof. Dr. Johan Verreth offered me a PhD position
within the European CORALZOO project at the Aquaculture and Fisheries Group at
Wageningen University. This PhD project focused on studying the influence of abiotic
About the author
227
factors on the growth and physiology of stony corals in closed aquarium systems and most
of the results of this project are presented in my second “book”, this thesis. Since there
was no previous experience with corals or coral husbandry at Wageningen University, we
started out with next to nothing in terms of facilities, hands-on experience and scientific
expertise. Most of my long-term growth experiments were executed at the large coral
aquaculture facilities in Burgers Zoo. Meanwhile, we also set up a coral aquaculture
facility and research lab at Wageningen University. Additionally, in cooperation with the
technical workplace of the Animal Science Group, I designed respirometric flow cells for
physiological measurement of coral colonies under different light, flow and/or feeding
conditions. Until now we attracted many students that want to do their MSc thesis with
us!
After working hours, most of my leisure time is spent listening to music, meeting with
friends, dancing at parties, cooking, and enjoying nature. Besides, I love to travel and do
water sports (surfing, diving).

WIAS Graduate School
Training and Supervision Program

Training activities
229
Education and Training 2005-2009 ECTS
The Basic Package 3
WIAS Introduction Course -Course on philosophy of science and ethics -
ScientificExposure: conferences, seminars and workshops| among others: 23
Conferences
International Society for Reef Studies, European Meeting, Bremen, -Germany, 2006 (poster presentation);
WIAS science day 2006, 2007 (poster and oral presentation); -Dutch Coral Research Symposium at University of Amsterdam, The -Netherlands, 2007 (oral presentation);
Coral Husbandry Symposium at Burgers Zoo, The Netherlands, 2007 -(poster presentation);
CORE Mini-symposium, Munchen, 2008 (oral presentation, invited -speaker);
11th International Coral Reef Symposium, Florida, 2008 (poster -presentation;
Second Symposium on The Ocean in a High-CO - 2 World. Musée
Océanographique, Monaco, 2008.
Seminars and Workshops
1st SECORE Workshop, Rotterdam, 2005; -CORALZOO meetings: Genua 2006, Ancona 2007, Eilat 2008, -Wageningen 2008 and Genua 2009 (oral presentations);
EUAC congress, Lisboa, Portugal, 2005; -Workshop Electrochemical measurements at Hach Lange, 2006. -
Training activities
230
ECTS
In-Depth Studies: Disciplinary and interdisciplinary courses 10
Aqualabs - Design and operation of Recirculation Technologies - -Wageningen 2005;
WIAS course: Biology underpinning animal sciences: broaden your -horizon;
WIAS Advanced Statistics course: Experimental Design; -Coral Reef Ecosystems, University of Amsterdam. -
Professional Skills Support Courses 3
Time Planning and Project Management; -Organising and supervising MSc thesis work; -Techniques for Writing and Presenting a Scientific Paper. -
Research Skills Training 8
Preparing own PhD research proposal (2005); -External training period at IOLR, Israel (2006); -PhD study tour to Japan, visiting institutes and universities (2008). -
Didactic Skills Training 15
Supervised Aquaculture and Fisheries practical (2 afternoons per year); -Supervised 6 MSc students; -Supervised excursion of student group to Burgers Ocean. -
Total (1 ECTS credit equals 28h study load) 62


The research described in this thesis was financially supported by The European Com-mission.
Thesis layout and cover design by Miriam Schutter. Illustration/adaptations by Miriam Schutter. Cover photos are taken in the Burgers Ocean of Burgers Zoo, Arnhem, The Netherlands and are courtesy of Max Janse.
Thesis printed by Wöhrmann Print Service, Zutphen (2010)