Effects of sintering temperatures on microstructures and ...

Mollusc shell microstructures and crystallographic textures
D. Chateignera,*, C. Hedegaardb, H.-R. Wenkc
aLaboratoire de Physique de l'Etat CondenseÂ, Universite Du Maine, Le Mans, FrancebInstitute of Biology, Department of Ecology and Genetics, University of Aarhus, Aarhus, Denmark
cDepartment of Geology and Geophysics, University of California, Berkeley, CA, USA
Received 30 November 1999; accepted 26 June 2000
Abstract
X-ray diffraction is used to characterise textures of the aragonite layers of shells from monoplacophoras, bivalves, cephalopods and
gastropods. Textures vary in strength, pattern and through the thickness of the shells. The texture patterns exhibited in the studied taxa, which
can be quantitatively described by a limited number of parameters, are compared with the microstructure types observed with scanning
electron microscopy. Whereas for simple crystallite arrangements, such as nacres, there is a good correspondence between texture and
microstructure, this is often not the case in more complex microstructures such as in crossed lamellar layers. Morphologically similar
microstructures may have different crystallographic textures, and the same textures may be found in microstructures with different morphol-
ogy. These two kinds of measurements are shown to be complementary since they provide non-redundant information for many taxa, which
suggests that they may be valuable phylogenetic indicators. q 2000 Elsevier Science Ltd. All rights reserved.
1. Introduction
The investigation of mollusc shell microstructures, built
of complex calcite and/or aragonite layer intergrowths, is of
interest in many ®elds of science. In geology, since shells
are the most commonly preserved parts in fossils, they are
used to determine the phylogenetic evolution and specify
the stratigraphic age of geological formations. Palaeontol-
ogy has largely relied on scanning electron microscopy for a
precise description of shell microstructures (Taylor et al.,
1973; Carter, 1980; Carter and Clark, 1985; Hedegaard,
1990; Hedegaard, 1997). Nacre is signi®cant in medicine.
Maya Indians of Honduras already used nacre for dental
implants 2000 years ago (Bobbio, 1972). In modern ortho-
paedic medicine, aragonite of Pinctada maxima stimulates
bone growth by human osteoblasts (Silve et al. 1992).
Natural processes driving biomineralisation of calcium
carbonate are still enigmatic, though much progress has
been made, linking shell formation to protein substrates
and templates (Crick, 1989; Suga and Nakahara, 1991;
Weiner and Traub, 1984).
Microstructural properties of mollusc shells were inves-
tigated extensively by means of thin sections (Bùggild,
1930). Among the microstructural characteristics, the
orientation distribution of crystallographic axes (texture)
dominates the anisotropic properties of aggregates (Kocks
et al., 1998). However, only few papers consider the aggre-
gate properties of shells (Bùggild, 1930; Wenk, 1965;
Wilmot et al., 1992). Mutvei (1978, 1980) hypothesised
about the crystallographic properties of nacre tablets, but
his conclusions have been at least partly refuted by recent
investigations (Hedegaard and Wenk, 1998).
In order to use the microstructural information in phylo-
geny, one has to explore if all the components of the micro-
structure (crystallographic textures and grain morphology,
grain sizes and boundaries) are not redundant. We investi-
gate the relationship between texture and the morphological
elements (as seen with a scanning electron microscope
(SEM)) of mollusc shell microstructures. Two questions
that arise are:
1. whether the microstructural elements are'simple crys-
tals', that is whether textures re¯ect the geometry of
the structural elements;
2. whether there is a one-to-one relationship between
textures and microstructures and a given microstructure
always has a speci®c texture pattern, or if a given texture
pattern only occurs in one microstructure type.
This work is part of an on-going systematic analysis
of mollusc shell textures to build a new character set for
phylogenetic analysis, equally applicable to extant and
fossil taxa.
Journal of Structural Geology 22 (2000) 1723±1735
0191-8141/00/$ - see front matter q 2000 Elsevier Science Ltd. All rights reserved.
PII: S0191-8141(00)00088-2
www.elsevier.nl/locate/jstrugeo
* Corresponding author.
E-mail address: [email protected] (D. Chateigner).
2. Material
We examined nearly 50 species as representatives of the
taxa (Table 1), with up to four different layers being
explored for some species. We sampled most of the major
molluscan clades and several taxa with each of the main
shell structures (Bùggild, 1930; Taylor, et al., 1969, 1973;
Hedegaard, 1990). For technical reasons, sampling is skewed
towards larger individuals. Samples for texture analysis need
to be close to planar, and should comprise a small portion of
the investigated shell. Curved or uneven samples cause
defocusing of the X-rays and uncontrolled absorption of
the beam. Samples of approximately 1 cm in diameter do
not cause geometrical effects and generally allow quantita-
tive results. Mostly we had to investigate smaller samples,
as small as approximately 5 mm in diameter.
3. Texture and microstructure analyses
For all analyses, the principal directions within the shells
were ®rst de®ned with an optical microscope. We decided to
use the following macroscopic sample reference frame for
texture and SEM descriptions:
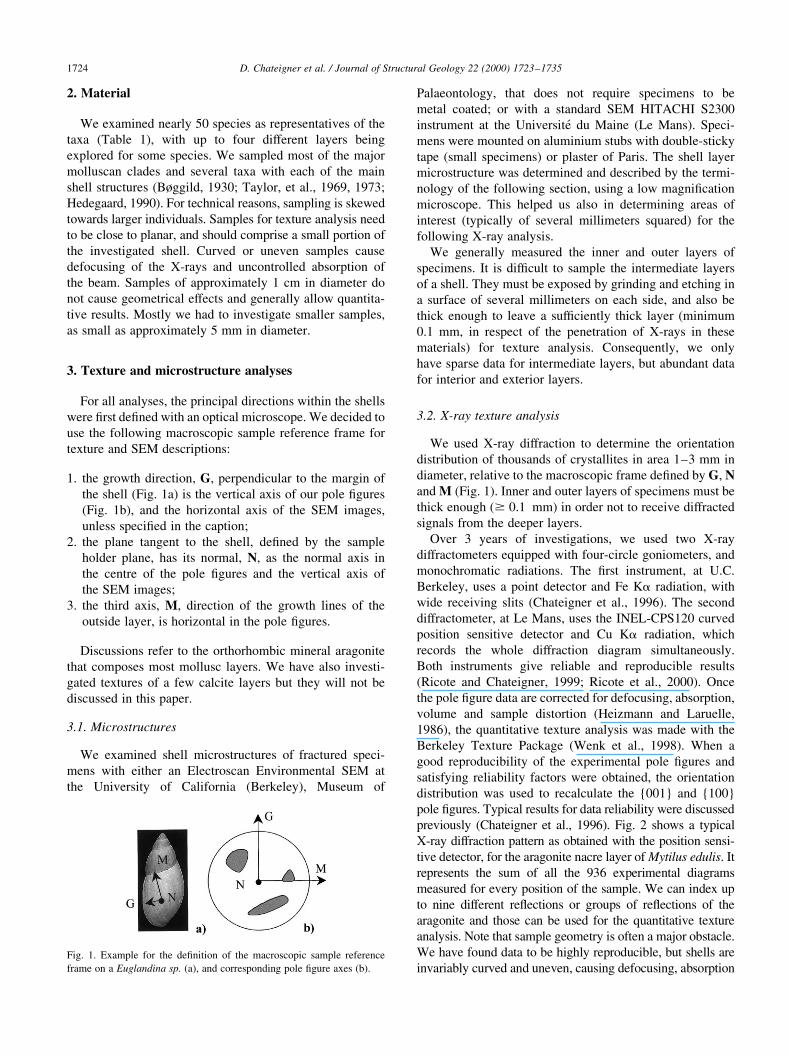
1. the growth direction, G, perpendicular to the margin of
the shell (Fig. 1a) is the vertical axis of our pole ®gures
(Fig. 1b), and the horizontal axis of the SEM images,
unless speci®ed in the caption;
2. the plane tangent to the shell, de®ned by the sample
holder plane, has its normal, N, as the normal axis in
the centre of the pole ®gures and the vertical axis of
the SEM images;
3. the third axis, M, direction of the growth lines of the
outside layer, is horizontal in the pole ®gures.
Discussions refer to the orthorhombic mineral aragonite
that composes most mollusc layers. We have also investi-
gated textures of a few calcite layers but they will not be
discussed in this paper.
3.1. Microstructures
We examined shell microstructures of fractured speci-
mens with either an Electroscan Environmental SEM at
the University of California (Berkeley), Museum of
Palaeontology, that does not require specimens to be
metal coated; or with a standard SEM HITACHI S2300
instrument at the Universite du Maine (Le Mans). Speci-
mens were mounted on aluminium stubs with double-sticky
tape (small specimens) or plaster of Paris. The shell layer
microstructure was determined and described by the termi-
nology of the following section, using a low magni®cation
microscope. This helped us also in determining areas of
interest (typically of several millimeters squared) for the
following X-ray analysis.
We generally measured the inner and outer layers of
specimens. It is dif®cult to sample the intermediate layers
of a shell. They must be exposed by grinding and etching in
a surface of several millimeters on each side, and also be
thick enough to leave a suf®ciently thick layer (minimum
0.1 mm, in respect of the penetration of X-rays in these
materials) for texture analysis. Consequently, we only
have sparse data for intermediate layers, but abundant data
for interior and exterior layers.
3.2. X-ray texture analysis
We used X-ray diffraction to determine the orientation
distribution of thousands of crystallites in area 1±3 mm in
diameter, relative to the macroscopic frame de®ned by G, Nand M (Fig. 1). Inner and outer layers of specimens must be
thick enough ($ 0:1 mm) in order not to receive diffracted
signals from the deeper layers.
Over 3 years of investigations, we used two X-ray
diffractometers equipped with four-circle goniometers, and
monochromatic radiations. The ®rst instrument, at U.C.
Berkeley, uses a point detector and Fe Ka radiation, with
wide receiving slits (Chateigner et al., 1996). The second
diffractometer, at Le Mans, uses the INEL-CPS120 curved
position sensitive detector and Cu Ka radiation, which
records the whole diffraction diagram simultaneously.
Both instruments give reliable and reproducible results
(Ricote and Chateigner, 1999; Ricote et al., 2000). Once
the pole ®gure data are corrected for defocusing, absorption,
volume and sample distortion (Heizmann and Laruelle,
1986), the quantitative texture analysis was made with the
Berkeley Texture Package (Wenk et al., 1998). When a
good reproducibility of the experimental pole ®gures and
satisfying reliability factors were obtained, the orientation
distribution was used to recalculate the {001} and {100}
pole ®gures. Typical results for data reliability were discussed
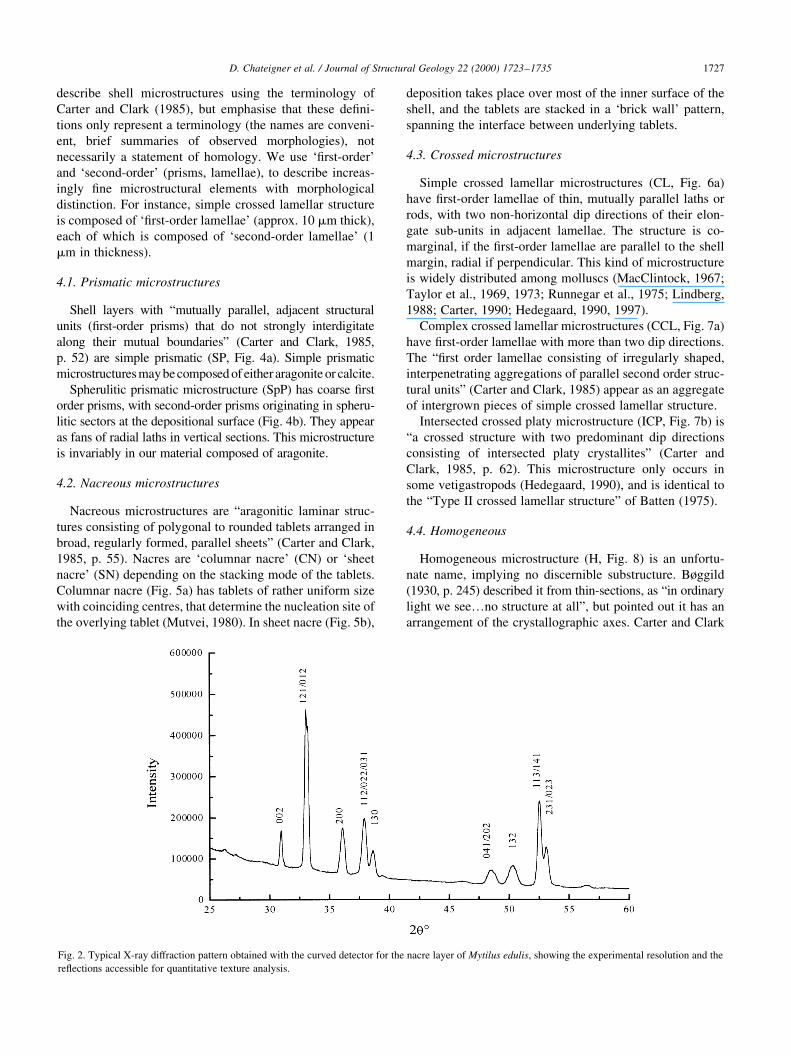
previously (Chateigner et al., 1996). Fig. 2 shows a typical
X-ray diffraction pattern as obtained with the position sensi-
tive detector, for the aragonite nacre layer of Mytilus edulis. It
represents the sum of all the 936 experimental diagrams
measured for every position of the sample. We can index up
to nine different re¯ections or groups of re¯ections of the
aragonite and those can be used for the quantitative texture
analysis. Note that sample geometry is often a major obstacle.
We have found data to be highly reproducible, but shells are
invariably curved and uneven, causing defocusing, absorption
D. Chateigner et al. / Journal of Structural Geology 22 (2000) 1723±17351724
Fig. 1. Example for the de®nition of the macroscopic sample reference
frame on a Euglandina sp. (a), and corresponding pole ®gure axes (b).
D. Chateigner et al. / Journal of Structural Geology 22 (2000) 1723±1735 1725
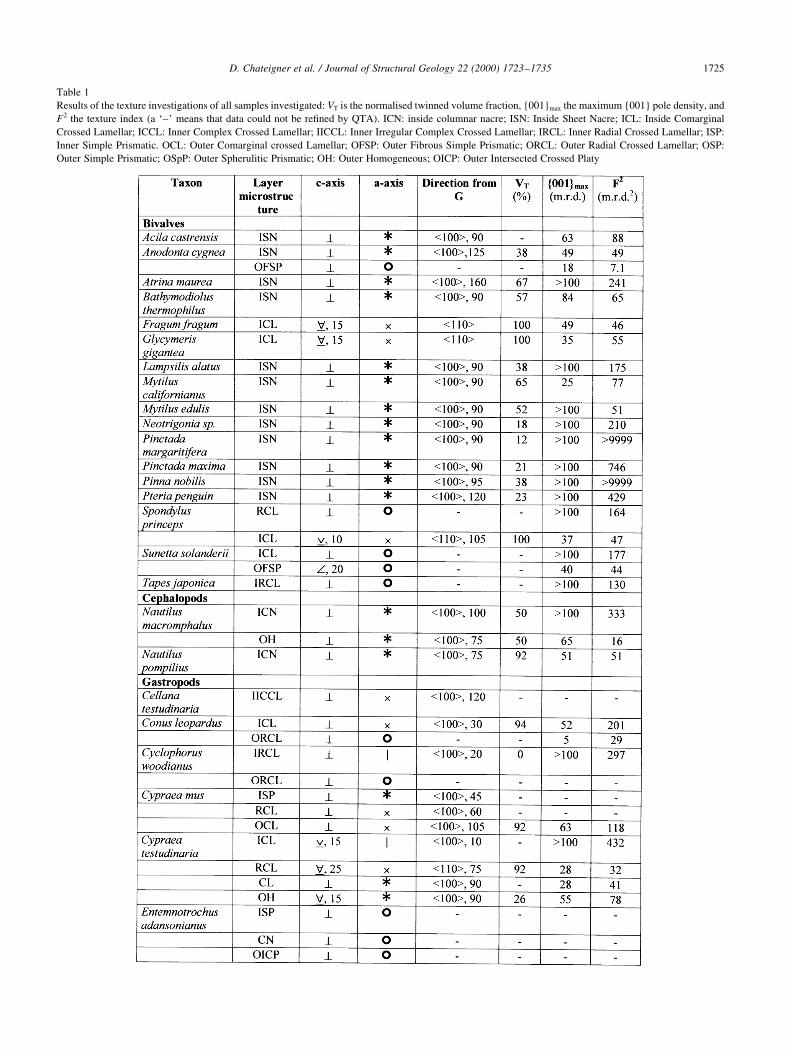
Table 1
Results of the texture investigations of all samples investigated: VT is the normalised twinned volume fraction, {001}max the maximum {001} pole density, and
F2 the texture index (a `±' means that data could not be re®ned by QTA). ICN: inside columnar nacre; ISN: Inside Sheet Nacre; ICL: Inside Comarginal
Crossed Lamellar; ICCL: Inner Complex Crossed Lamellar; IICCL: Inner Irregular Complex Crossed Lamellar; IRCL: Inner Radial Crossed Lamellar; ISP:
Inner Simple Prismatic. OCL: Outer Comarginal crossed Lamellar; OFSP: Outer Fibrous Simple Prismatic; ORCL: Outer Radial Crossed Lamellar; OSP:
Outer Simple Prismatic; OSpP: Outer Spherulitic Prismatic; OH: Outer Homogeneous; OICP: Outer Intersected Crossed Platy

and volume variations. Consequently, in some instances we
had to omit data within a sample. Using the point detector
we used the {111}, {021}, {102/200}, {121/012} and {221}
pole ®gures, while making use of the PSD allowed to
also use the {002}, {112/022/031/130}, {041/202} and
{113/141/231/023} groups.
A measure of the texture strength is given for samples
with satisfactory reliability. It is given as bulk `texture
index', or F2 (Bunge, 1981), and as the maximum pole
density of the {001} pole ®gure. The former gives an overall
measure of the strength, while the latter is only related to the
dispersion of the c-axes. Both criteria increase with the
strength of the texture. We estimate that measurements
and calculations are reliable within 10%. We performed
experiments on different locations of a curved shell surface
of Helix aspersa (Fig. 3). The texture calculations provide a
texture index of 80 m.r.d.2 and 92 m.r.d.2, and a maximum
density of the {001} pole ®gure of 42 m.r.d. and 38 m.r.d.,
illustrated in Fig. 3 (a) and (b) respectively.
4. Microstructures observed with the SEM
The terminology of shell microstructures is usually based
on the morphology of sub-units as observed in thin-sections
with a petrographic microscope or with an SEM. We
D. Chateigner et al. / Journal of Structural Geology 22 (2000) 1723±17351726
Table 1 (continued)
describe shell microstructures using the terminology of
Carter and Clark (1985), but emphasise that these de®ni-
tions only represent a terminology (the names are conveni-
ent, brief summaries of observed morphologies), not
necessarily a statement of homology. We use `®rst-order'
and `second-order' (prisms, lamellae), to describe increas-
ingly ®ne microstructural elements with morphological
distinction. For instance, simple crossed lamellar structure
is composed of `®rst-order lamellae' (approx. 10 mm thick),
each of which is composed of `second-order lamellae' (1
mm in thickness).
4.1. Prismatic microstructures
Shell layers with ªmutually parallel, adjacent structural
units (®rst-order prisms) that do not strongly interdigitate
along their mutual boundariesº (Carter and Clark, 1985,
p. 52) are simple prismatic (SP, Fig. 4a). Simple prismatic
microstructures maybecomposed of either aragonite or calcite.
Spherulitic prismatic microstructure (SpP) has coarse ®rst
order prisms, with second-order prisms originating in spheru-
litic sectors at the depositional surface (Fig. 4b). They appear
as fans of radial laths in vertical sections. This microstructure
is invariably in our material composed of aragonite.
4.2. Nacreous microstructures
Nacreous microstructures are ªaragonitic laminar struc-
tures consisting of polygonal to rounded tablets arranged in
broad, regularly formed, parallel sheetsº (Carter and Clark,
1985, p. 55). Nacres are `columnar nacre' (CN) or `sheet
nacre' (SN) depending on the stacking mode of the tablets.
Columnar nacre (Fig. 5a) has tablets of rather uniform size
with coinciding centres, that determine the nucleation site of
the overlying tablet (Mutvei, 1980). In sheet nacre (Fig. 5b),
deposition takes place over most of the inner surface of the
shell, and the tablets are stacked in a `brick wall' pattern,
spanning the interface between underlying tablets.
4.3. Crossed microstructures
Simple crossed lamellar microstructures (CL, Fig. 6a)
have ®rst-order lamellae of thin, mutually parallel laths or
rods, with two non-horizontal dip directions of their elon-
gate sub-units in adjacent lamellae. The structure is co-
marginal, if the ®rst-order lamellae are parallel to the shell
margin, radial if perpendicular. This kind of microstructure
is widely distributed among molluscs (MacClintock, 1967;
Taylor et al., 1969, 1973; Runnegar et al., 1975; Lindberg,
1988; Carter, 1990; Hedegaard, 1990, 1997).
Complex crossed lamellar microstructures (CCL, Fig. 7a)
have ®rst-order lamellae with more than two dip directions.
The ª®rst order lamellae consisting of irregularly shaped,
interpenetrating aggregations of parallel second order struc-
tural unitsº (Carter and Clark, 1985) appear as an aggregate
of intergrown pieces of simple crossed lamellar structure.
Intersected crossed platy microstructure (ICP, Fig. 7b) is
ªa crossed structure with two predominant dip directions
consisting of intersected platy crystallitesº (Carter and
Clark, 1985, p. 62). This microstructure only occurs in
some vetigastropods (Hedegaard, 1990), and is identical to
the ªType II crossed lamellar structureº of Batten (1975).
4.4. Homogeneous
Homogeneous microstructure (H, Fig. 8) is an unfortu-
nate name, implying no discernible substructure. Bùggild
(1930, p. 245) described it from thin-sections, as ªin ordinary
light we see¼no structure at allº, but pointed out it has an
arrangement of the crystallographic axes. Carter and Clark
D. Chateigner et al. / Journal of Structural Geology 22 (2000) 1723±1735 1727
Fig. 2. Typical X-ray diffraction pattern obtained with the curved detector for the nacre layer of Mytilus edulis, showing the experimental resolution and the
re¯ections accessible for quantitative texture analysis.

(1985, p. 63) describe it as ªaggregations of more or less
equidimensional, irregularly shaped crystallites lacking
clear ®rst-order structural arrangement except for possible
accretion bandingº. In other words, when a shell structure
has no other identi®able elements than minute granules, it is
homogeneous.
5. Texture patterns
Fig. 9 summarises the texture patterns that have been
observed in {001} and {100} pole ®gures. Table 1 presents
the qualitative and quantitative results of the texture analy-
sis for all the analysed taxa and the shell structures of the
analysed layers. In this table, a `±' in the F2 column means
that quantitative texture analysis (QTA) was not possible
from the acquired data, usually because the geometry of
the shell was not regular enough to ensure a constant X-
ray irradiated surface. In ®bre textures, a `±' for `twinned
volume fraction' indicates that this parameter cannot be
found by QTA for this texture type, and for `direction //
G' that all directions of the (a, b) planes have an equal
probability to be aligned with G. When the texture strength
equals or exceeds the maxima imposed by the software, we
enter .100 and .9999 in Table 1 to indicate that the
maximum pole density of the {001} pole ®gure and the
texture index are larger than 100 m.r.d. and 9999 m.r.d.2,
respectively.
Previously, noting that characteristic texture patterns
exist in most shells, we found it useful to develop a systema-
tic terminology (Chateigner et al., 1999). Fig. 9 gives
examples of the distributions of c- and a-axes (left and
right column respectively), and their corresponding
symbols. For c axes, ' symbolises a c-axis texture maxi-
mum with a centre aligned with N (Fig. 9a), whereas /
means that the maximum has an angle a with N (Fig. 9b).
If the c-axis maximum is dispersed by an angle a at half
maximum, the representation is ; (Fig. 9c), while ¢ indicates
D. Chateigner et al. / Journal of Structural Geology 22 (2000) 1723±17351728
Fig. 3. {001} Pole ®gures of two specimens of Helix aspersa showing the
reliability of the texture analysis: (a) specimen A (max� 42 m.r.d.); (b)
Specimen B (max� 38 m.r.d.). Logarithmic density scale, equal area
projection.
Fig. 4. SEM image of prismatic microstructures: (a) regular simple pris-
matic of the innermost layer of Turbo petholatus (scale bar� 15mm); (b)
irregular spherulitic prismatic layer of Tectus conus (scale bar� 20 mm).
Fig. 5. SEM image of nacreous microstructures: (a) columnar nacre of
Turbo undulatus (scale bar� 20 mm); (b) sheet nacre of Pinctada margar-
itifera (scale bar� 40 mm). The c-axes are orthogonal to the hexagonal
platelets.

a split of the component with an angle a between the two
individuals (Fig. 9d).
For the a-axis distribution, we use the u symbol for a single
crystal-like pattern (Fig. 9e), and an angle b gives the location
of the a-axes relative to G. If the {100} pole ®gure exhibits
four maxima (two orientation components), a £ (Fig. 9f) is
used, while a * is assigned for six maxima (three components,
Fig. 9g). These latter features are referred to as single or
double twinning (on {110} planes) respectively. However,
X-ray texture analysis probes several thousands of cristallites,
and we can not distinguish if individual crystallites are intrin-
sically twinned or if the observed pole ®gures result from a
regular stacking of single crystals. A more local investigation,
e.g. transmission electron microscopy would be needed to
prove that twinning actually occurs in individual crystallites
of aragonite (Wilmot et al., 1992). Finally, a perfectly random
distribution of the a-axes around c (®bre texture) is indicated
by W (Fig. 9h).
When twin-like patterns are observed, it is possible to
estimate the relative volume fractions associated to each
of the components of the twin, taking the density ratios of
the components in {100} pole ®gures. For instance, if the
sample is entirely twinned, a double twin pattern has three
orientations and a third of the total volume will be in each
orientation, corresponding to three equally strong intensities
in the {100} pole ®gure. Frequently we observe one orientation
is considerably stronger than the others, and we calculate the
D. Chateigner et al. / Journal of Structural Geology 22 (2000) 1723±1735 1729
Fig. 6. (a) SEM backscattering image of the interface of Euglandina sp.
(scale bar� 100 mm). The outer comarginal crossed lamellar layer (OCL)
is on top of the image, the inner radial crossed lamellar layer at bottom
(IRCL). Note the well-de®ned crossed microstructure. (b) {100} and {001}
Pole ®gures of the OCL (max� 23 m.r.d., min� 0). (c) {100} And {001}
pole ®gures of the IRCL (max .100 m.r.d., min� 0). Note the single
crystal texture pattern. Linear density scale, equal area projection.
Fig. 7. SEM image of (a) irregular complex crossed lamellar layer of
Fissurellidea aperta (scale bar� 20 mm), horizontal axis is M, and (b)
intersected crossed platy layer of Liota granulosa (scale bar� 5 mm),
horizontal axis is G.
Fig. 8. SEM image of the homogeneous outermost layer of Liota granulosa
(scale bar� 5 mm), horizontal axis is M.
normalised percentage of twinned fraction, using the maxi-
mum densities of the recalculated {100} poles. This is the
ratio between the sum of the two weakest components to the
total density, normalised to 66.67% (double twin patterns)
or 50% (single twin patterns). As an example, a fully double
twinned sample will have a third of the intensity in each of
three orientations and have a normalised twinned volume
fraction of 100% (close to the case of Muricanthus nigritus,
Table 1). Similarly, a fully single twinned sample has 50%
of the re¯ections from each of the two orientations, and the
normalised twinned volume fraction is 100% (case of
Fragum fragum). This measure allows us to easily compare
the amount of twinned material across samples with differ-
ent textures.
Mollusc shells have very strong textures; the nacre tablets
of Pinctada maxima are perfectly aligned, and large domains
of the shell show a common alignment of axes, resembling a
single-crystal or textures observed in epitaxial ®lms. Only an
insigni®cant portion of crystallites is randomly oriented.
Pinctada maxima is an extreme case, but all the samples
investigated exhibit minimal volume fractions of randomly
oriented crystallites. As mentioned above, the strength of
the observed textures reaches in some cases extreme values
(e.g. Pinctada margaritifera). However, even for such a high
texture strength, our calculations indicate a full texture peak
width at half maximum in the c-axis distribution of less than
58, which is consistent with the angular dispersions observed
by Weiner and Traub (1981) in Pinctada radiata.
It is dif®cult to compare our results with data from the
literature. We were only able to ®nd some diffraction
studies, generally performed on thin sections. Wise (1970)
and Weiner and Traub (1981), described the nacre layer of
Tectus dentatus with a random distribution of a- and b-axes
around c, which is the same as we observe in the closely
related specimen of Tectus niloticus. Weiner and Traub
(1981) observed strong three dimensional textures in the
nacres of Nautilus repertus, Pinctada radiata and Neotri-
gonia margariticea, as our Nautilus, Pinctada and Neotri-
gonia specimens with twinned textures. The authors also
mention a poor in-plane alignment of Mytilus californianus
for which we observe a double twin texture, but with a
comparatively low texture strength.
6. Discussion
Table 2 summarises the relationship between shell micro-
structural elements and texture patterns. This is not a
D. Chateigner et al. / Journal of Structural Geology 22 (2000) 1723±17351730
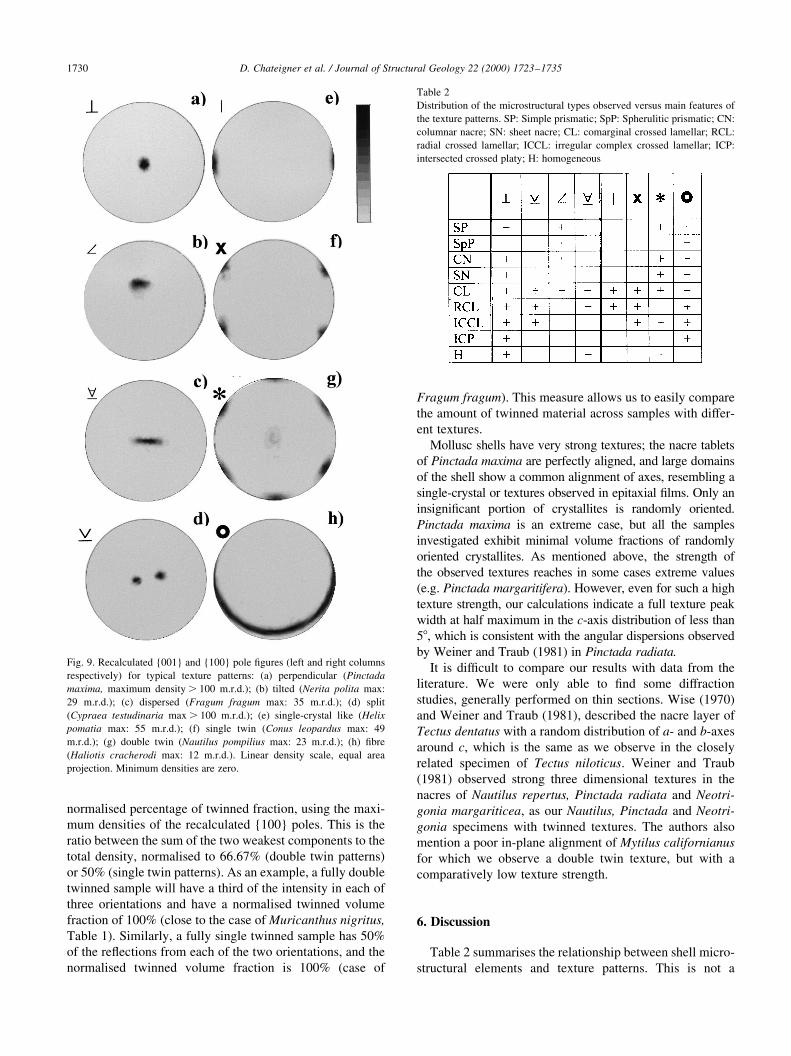
Fig. 9. Recalculated {001} and {100} pole ®gures (left and right columns
respectively) for typical texture patterns: (a) perpendicular (Pinctada
maxima, maximum density . 100 m.r.d.); (b) tilted (Nerita polita max:
29 m.r.d.); (c) dispersed (Fragum fragum max: 35 m.r.d.); (d) split
(Cypraea testudinaria max . 100 m.r.d.); (e) single-crystal like (Helix
pomatia max: 55 m.r.d.); (f) single twin (Conus leopardus max: 49
m.r.d.); (g) double twin (Nautilus pompilius max: 23 m.r.d.); (h) ®bre
(Haliotis cracherodi max: 12 m.r.d.). Linear density scale, equal area
projection. Minimum densities are zero.
Table 2
Distribution of the microstructural types observed versus main features of
the texture patterns. SP: Simple prismatic; SpP: Spherulitic prismatic; CN:
columnar nacre; SN: sheet nacre; CL: comarginal crossed lamellar; RCL:
radial crossed lamellar; ICCL: irregular complex crossed lamellar; ICP:
intersected crossed platy; H: homogeneous

quantitative statistical study, because the number of exam-
ined taxa is small, and our data merely show the span of
data. However, one can see that c-axes are mostly aligned
parallel to the N direction (without splitting or dispersion),
irrespective of the layers in the microstructure. When a split
or a dispersion appears in the c-axis pattern, the average still
remains aligned with N. Splitting and dispersions are
common in crossed lamellar microstructures, while inclined
c-axes are found in nacre or in prismatic microstructures.
Also, the a-axis distributions appear more often as ®bre
textures than single crystal-like, with intermediate occur-
rences for double and single twinned layers. While none
of the analysed shells shows random texture, the comarginal
crossed lamellar layers exhibit the largest diversity in
textural pattern. Both, intersected crossed platy and spheru-
litic prismatic layers, are characterised by a unique texture
type, while complex crossed lamellar layers only show
perpendicular c-axes. The a-axis distribution of nacre is
more diverse for columnar than for sheet layers, while the
opposite tendency is observed for the c-axes diversity.
The taxa where we sampled several layers (Anodonta
cygnea, Conus leopardus, Muricanthus nigritus, Nautilus
macromphalus, Scutus antipodes, Sunetta solanderii,
Viana regina, but not Spondylus princeps, Cypraea testudi-
naria and Oliva miniacea) usually have stronger textures
(larger F2 value) on the inside than on the outside of the
shell. This could result from epitaxial-like relationships
between crystalline and/or organic layers and environmental
effects.
Environmental effects are beyond the scope of this study
since we would need data on textures for various develop-
ment stages of a species. Texture analysis provides some
information about the nature of shell growth. If the epitaxial-
like texture increase was coming from purely crystalline
interactions, one would expect a continuation of the micro-
structure type with a better alignment to a common frame.
This is obviously not the case for Anodonta cygnea,
Cypraea testudinaria and Nautilus macromphalus. At
least in these species, the amount of organisation of layers
increases even if layer microstructures are different, i.e.
without common crystal lattice for epitaxy. Our diffraction
technique provides no information on organic materials
such as polypeptides, chitins and proteins which are related
to preferred growth of calcium carbonate. This relationship
has been investigated by Weiner and Traub (1980, 1981)
and Weiner et al. (1983) for Nautilus repertus, using both X-
ray and electron diffraction. These materials could be
equally responsible for texture strength as they are for
texture pattern, e.g. systematic changes through the thick-
ness of the shells. This hypothesis is consistent with the
observation that `late layers', deposited on the outside of
the adult shell by some species (Oliva miniacea, Cypraea
testudinaria), have a larger texture strength than the
younger inside layers. The glycoprotein control of growth
has been studied in synthetic aragonite and calcite (Falini et
al., 1996), in calcitic sponge spicules, and biogenic calcite
crystals (Aizenberg et al., 1996; Aizenberg et al., 1997;
Weiner and Addadi, 1997).
We observe single twinned layers in several crossed
lamellar layers. This signi®es that the organisms can differ-
entiate between symmetry-related directions of the arago-
nite, and discriminate one member of the family. Aizenberg
et al. (1996) observed a similar behaviour in calcitic sponge
spicules in individual crystals. This is to our knowledge the
®rst time that it is observed for aragonite at the macroscopic
scale. The ªanisotropic environment for crystal growingº
invoked by Aizenberg et al. (1996) could then be respon-
sible for the resulting single-twinned textures.
The simple prismatic structure of Entemnotrochus adan-
sonianus (Table 1) has a ®bre texture and the c-axis perpen-
dicular to the shell layer. The c-axis is parallel to the
maximum dimensions of the prisms, but the a- and b-axes
of the individual prisms are not aligned relative to each
other. The simple prismatic structure of Cypraea mus has
a double twin texture and the c-axis is perpendicular to the
shell layer, i.e. all the a- and b-axes of the individual prisms
are in a well-de®ned orientation relationship. This demon-
strates that morphologically similar layers with a similar
position in the shell (on the inside) can have different
textures.
Our samples with spherulitic prismatic microstructure
originate from putatively closely related taxa and have
®bre texture with the c-axis inclined relative to the shell
surface. This texture occurs in other microstructures of addi-
tional taxa (columnar nacre of Haliotis cracherodi, ®brous
simple prismatic layer of Sunetta solanderii) in a larger
clades, and is thus not restricted to spherulitic prismatic
microstructures. If each of the individual needles of the
spherulitic prismatic microstructures were crystallographi-
cally identical (e.g., crystallographic c-axis parallel to prism
axis), we would expect a rather diffuse (weak) texture
pattern resulting in low texture indexes and weak {001}
maxima. Indeed, near the surface of the shell, the individual
second-order prisms are arranged in a spherical radiating
pattern, that would decrease the texture strength (Fig. 4b).
This is evidently not the case (see Tectus niloticus and
Tectus pyramis) and we can conclude that the second-
order prisms are morphologically similar but crystallo-
graphically non-equivalent. The crystallographic orienta-
tion is retained through non-repetitive morphological
boundaries. Moreover, the parameters provided by both
techniques (scanning electron microscopy and texture)
could be taken into account in phylogenic discussions,
since they are not redundant.
Mutvei (1978, 1980) observed striations formed by etch-
ing on nacre tablets and interpreted them as evidence for
individual nacre tablets to be made of cyclic domains,
related to each other by a {110} twin, giving rise to the
pseudo-hexagonal symmetry of aragonite. Looking at the
angles between Mutvei's striations, Hedegaard and Wenk
(1998) suggested they may be crystallographically non-
equivalent, time-synchronous growth sectors with different
D. Chateigner et al. / Journal of Structural Geology 22 (2000) 1723±1735 1731

composition and solubility. None of the available informa-
tion, including X-ray texture analysis, allows us to deter-
mine whether the individual tablets are single crystals (that
may or may not be aligned in a twin-like pattern), a peculiar
intergrowth of single twins (Mutvei, 1978, 1980), pseudo-
hexagonal {110} trillings, or whether even Mutvei's sectors
are mosaics of twinned domains and a detailed TEM study
would be necessary to resolve this issue. Gastropod nacre is
particularly troublesome, as the platelets are composed of a
variable number of sectors in radiating aggregates, forming
the platelets (Hedegaard, 1990), and the ®bre texture is less
oriented than that of other nacres. Swamy (1935) describes
the nacres of Pinctada vulgaris and Haliotis spp. as single
crystals, albeit in different orientation, emphasising a
considerably smaller alignment in Haliotis sp. Swamy's
data are unequivocal, but we can not verify them, as he
did not indicate the species examined.
From our data it is clear that nacre textures differ between
members of the major clades bivalves, cephalopods, gastro-
pods, and monoplacophoras (Table 3). While all nacres
exhibit perpendicular c-axes, double twin textures only
appear in bivalves and cephalopods, ®bre textures only in
gastropods and cephalopods. Consequently, the crystallo-
graphic features of nacre tablets, e.g. of gastropods, differ
from those of cephalopods (or bivalves versus monoplaco-
phoras), which is not evident from scanning electron micro-
scopy images. Furthermore, in bivalves, the twin volume
fractions are impossible to determine by scanning electron
microscopy, while texture analysis demonstrates consider-
able twin fractions.
Bùggild (1930) describes two orientations of optic axes in
the second-order lamellae of simple crossed lamellar micro-
structures indicating that neighbouring lamellae are
morphologically and crystallographically identical but
rotated 1808 relative to each other. Hedegaard and Wenk
(1998) ®nd the two c-axis maxima in the crossed lamellar
layers of Scutellastra tabularis and Fragum fragum are
inclined about 20±258 to the surface normal and (110)
poles aligned perpendicular to the shell margin, correspond-
ing to the two dip directions of the lamellae. This indicates
that basal planes are parallel to the lamellae. It is reassuring
to ®nd two independent orientations in a shell structure with
two main physical orientations of the shell microstructure
observed by scanning electron microscopy. But we also ®nd
other textures (single crystal, single twin, double twin and
®bre) in crossed lamellar layers, that are morphologically
similar. This corresponds to our single twin pattern in Oliva
miniacea, Scutellastra tabularis and Fragum fragum. Fig. 6
illustrates this for the inner radial and outer comarginal
crossed lamellar layers of Euglandina sp., both single crys-
tal like (with a larger dispersion for the outer layer) where a
split was expected because both are crossed layers, and as is
seen with scanning electron microscopy. The lack of the
pole splitting in {001} pole ®gures for crossed lamellae is
even more evident in the case of the inner radial crossed
lamellar layer of Cyclophorus woodianus. In this case
(Fig. 10) successive lamellae are inclined at approximately
608 to each other, while the {001} pole maximum is one of
the best localised, with a very high texture strength.
Wilmot et al. (1992) found that textures of the crossed
lamellar layers of Oliva sayana and Littorina littorea differ
from each other, but report that individual second-order
lamellae are twinned in both. That is, the twinning pattern
does not correspond to the dip directions of the second-order
lamellae. Each lamella is profusely twinned on (1±10)
(Wilmot et al. 1992).
The specimens of Helix aspersa have very thin shells with
®ve distinct shell layers of, listing from outside to inside,
D. Chateigner et al. / Journal of Structural Geology 22 (2000) 1723±17351732
Table 3
The main characteristics of nacre in the main molluscan clades. S and C
stand for sheet and Columnar nacres respectively
Fig. 10. (a) SEM backscattering image of the inner radial crossed lamellar
layer of Cyclophorus woodianus (scale bar� 20 mm). (b) Corresponding
{001} and {100} pole ®gures (max . 100 m.r.d., min� 0). Logarithmic
density scale, equal area projection.
homogeneous (very thin), comarginal crossed lamellar,
radial crossed lamellar, comarginal crossed lamellar and
simple prismatic microstructure, of which the outer co-
marginal crossed lamellar layer is the thickest. Due to the
thin shell and the X-ray beam penetration, several of these
layers certainly contributed to the single crystal texture
signal, and we conclude the layers are crystallographically
aligned, even if morphologically different. Conversely, we
found (Chateigner et al., 1996) different textures in neigh-
bouring layers of very similar appearing comarginal, radial,
and comarginal crossed lamellar microstructures in Cypraea
testudinaria.
Irregular complex crossed lamellar layers emphasise the
uncoupling of morphology and crystallography. Every irre-
gular complex crossed lamellar layer has multiple morpho-
logical orientations of the lamellae, with distinct uniform
crystallographic orientations (Cellana testudinaria, Fissur-
ella oriens and Nerita scabricosta). Lamellae are morpho-
logically similar but crystallographically non-equivalent.
Bùggild (1930) describes the optic axes of complex crossed
lamellar layers as varying between two extremes, equivalent
to our dispersed c-axis pattern, which we do not observe in
this microstructure type. Bùggild's description is obviously
not valid for all complex crossed lamellar layers, but
unquestionably for some.
Intersected crossed platy microstructure only occurs in
vetigastropods (Hedegaard, 1990; Ponder and Lindberg,
1997), and all our samples have a ®ber texture pattern
with c-axis perpendicular to the shell (Entemnotrochus
adansonianus, Phasianella australis, Perotrochus quoyanus
and Turbo petholatus), as for nacres from vetigastropods,
and we suspect the ®bre texture with c-axis orthogonal to the
shell surface is a typical vetigastropod character. We can not
determine whether the platelets of intersected crossed platy
microstructure are crystallographically equivalent and the
®bre pattern is due to a partly random orientation of plate-
lets, or whether the axes are differently oriented relative to
the morphology of the platelets.
The homogenous microstructure is widely distributed in
molluscs (Taylor et al., 1969, 1973; Hedegaard, 1990) and
some of the simple prismatic microstructures observed in
thin sections by Bùggild (1930) appear as `homogeneous'
when investigated by scanning electron microscopy
(Hedegaard, 1990). Bùggild (1930), however, also describes
a homogeneous microstructure, seemingly with a local
orientation of optic axes, albeit variable over the range of
a shell layer. This may correspond to our results for the outer
homogeneous layer of Cypraea testudinaria. The important
point is that homogeneous layers with little or no physical
organisation from the scanning electron microscopy point of
view (Carter and Clark, 1985), show distinct crystallo-
graphic orientations (see Nautilus macromphalus, Cypraea
testudinaria), and even very strong textures (Oliva
miniacea). Up to now we have seen only homogenous layers
that are highly organised, not haphazard deposits of
aragonite.
For differently represented clades, one can point out some
tendencies. The sheet nacres from bivalves differ from that
of monoplacophoras in their a-axis distribution, double
twinned in the former while ®brous in the latter. The
columnar nacre of cephalopods appears double twinned,
while it is ®bre textured in inside layers of gastropods.
Inside a family, we observe similar texture patterns for
closely related taxa. For instance, bivalve nacres only exhi-
bit double twins with perpendicular c-axes. But in bivalves,
the twin fraction still varies and is regrouped around main
values: very closely related species like Bathymodiolus
thermophilus and Mytilus edulis show comparable twinned
volumes, while more distant species exhibit quite different
percentage of twins (e.g. Pinctada sp. versus Mytilus sp.).
Texture types are not identical for the same micro-
structural layer type, that scanning electron microscopy
investigations cannot differentiate, and similar shell shape
(the outer crossed lamellar layers of Euglandina and Helix
species for instance), indicating a different a-axis alignment
relative to the growth direction.
Finally, for one species and very similar layers (i.e. the
crossed lamellae inside and outside Viana regina), there
still exists a difference in the texture strength, the former
layer exhibiting a larger texture index, pointing to a higher
organisation.
7. Conclusions
This work points out that X-ray diffraction texture
patterns may differ, even though the associated microstruc-
tures are similar. It shows that there is not a trivial relation-
ship between these two complementary aspects of shell
morphology. This may be explained by the strong inter-
action between the organic constituents that are controlling
the growth (present at every step of the crystallisation of the
shell) and the aragonite microstructure. Aragonite is a meta-
stable phase of calcium carbonate under normal conditions,
but is clearly stabilised in microstructures, which results in
high mechanical strengths of the whole shells.
We conclude that there is not a simple one-to-one rela-
tionship between shell microstructures and crystallographic
orientation, and neither is one merely a re®nement of the
other. Crystallography does not determine shell structure
morphology, nor does shell structure morphology determine
the crystallography. This means that both features add
important, independent, and complementary characters for
a phylogenetic discussion.
We have shown the wide variety of texture patterns and
some systematic trends. In the future it will be interesting to
apply these methods to fossil shells where aragonitic nacre
has either been preserved or recrystallised, and to extend the
study to calcite layers. While shells of living molluscs have
not much relationship to structural geology, they neverthe-
less may become signi®cant for studying the evolution of
molluscs through geologic time with methods that are
D. Chateigner et al. / Journal of Structural Geology 22 (2000) 1723±1735 1733

routinely applied by structural geologists to investigate the
deformation history of rocks.
Acknowledgements
We wish to thank the Museum of Palaeontology, Univer-
sity of California (Berkeley) USA for providing study
material and facilities for C.H.; the United State National
Museum of Natural History (Smithsonian Institution), for
the specimens of Entemnotrochus adansonianus and Pero-
trochus quoyanus (USNM 878154); the Zoologisk Museum
(Copenhagen) Denmark, for access to Neopilina galatheae
(specimen V, Station 716); M. Laulier and F. Denis, Labor-
atoire de Biologie et GeÂneÂtique Evolutive, Universite du
Maine (Le Mans) France and the MARVEL (1997) expedi-
tion for providing the specimen Anodonta cygnea and
Bathymodiolus thermophilus; C.P. Meyer of University of
California (Berkeley) kindly made Cypraeidae available
from his research material. Barry Roth kindly identi®ed
the specimen of Helminthoglypta nickliniana anachoreta,
straying into our sample material. We thank C. Porter,
University of Guam; for making specimens available and
some identi®cations.
The French MinisteÁre de l'Education Nationale, de la
Recherche et des Technologies, funded D.C.'s stay at
University of California at Berkeley and two months at
Universite du Maine for C.H.. H.-R.W. is appreciative for
support from the France-Berkeley Fund and the National
Science Foundation. We acknowledge constructive reviews
by K. Bandel (Hamburg) and J. Reitner (GoÈttingen).
References
Aizenberg, J., Ilan, M., Weiner, S., Addadi, L., 1996. Intracrystalline
macromolecules are involved in the morphogenesis of calcite sponge
spicules. Connective Tissue Research 34 (4), 255±261.
Aizenberg, J., Hanson, J., Koetzle, T.F., Weiner, S., Addadi, L., 1997.
Control of macromolecule distribution within synthetic and biogenic
single calcite crystals. Journal of the American Chemical Society 119,
881±886.
Batten, R.L., 1975. The ScissurellidaeÐAre they neotenously derived
®ssurellids? (Archaeogastropoda). American Museum Novitates 2567,
1±29.
Bobbio, A., 1972. The ®rst endosseous alloplastic implant in the history of
man. Bulletin of the Historical Dentology 20, 1±6.
Bùggild, O.B., 1930. The shell structure of the mollusks, Det Kongelige
Danske Videnskabernes Selskabs Skrifter, Naturvidenskabelige og
Mathematiske Afdeling, 9. R kke, II.2: 231±325, pl. I±XV.
Bunge (Ed.), H.-J., 1981. Textures in Materials Science. Butterworth,
London.
Carter, J.G., 1980. Guide to bivalve shell microstructures. In: Rhoads, D.C.,
Lutz, R.A. (Eds.), Skeletal Growth of Aquatic Organisms. Plenum, New
York.
Carter, J.G., 1990. Skeletal Biomineralisation: Patterns, Processes and
Evolutionary Trends. Van Nostrand Reinhold, New York.
Carter, J.G., Clark II, G.R., 1985. Classi®cation and phylogenetic signi®-
cance of molluscan shell microstructure. In: Bottjer, D.J., Hickman,
C.S., Ward, P.D., Broadhead, T.W. (Eds.), Molluscs, Notes for a
Short Course. University of Tenessee, Department of Geological
Sciences Studies in Geology, pp. 50±71.
Chateigner, D., Hedegaard, C., Wenk, H.-R., 1996. Texture analysis of a
gastropod shell: Cypraea testudinaria. In: Liang, Z., Zuo, L., Chu, Y.
(Eds.), Textures of Materials 2, pp. 1221±1226.
Chateigner, D., Hedegaard, C., Wenk, H.-R., 1999. Quantitative character-
isation of mollusc shell textures. In: Szpunar, J.A. (Ed.), Textures of
Materials, 2. NRC Research Press, Ottawa, Ontario, pp. 1495±1500.
Crick, R.E., 1989. Origin, Evolution, and Modern Aspects of Biominerali-
zation in Plants and Animals. Plenum Press.
Falini, G., Albeck, S., Weiner, S., Addadi, L., 1996. Control of aragonite or
calcite polymorphism by mollusk shell macromolecules. Science 271,
67±69.
Hedegaard, C., 1990. Shell Structures of the Recent Archaeogastropoda.
PhD Thesis, University of Aarhus, Denmark, Vols. 1 and 2.
Hedegaard, C., 1997. Shell Structures of the recent Vetigastropoda. Journal
of Molluscan Studies 63, 369±377.
Hedegaard, C., Wenk, H.-R., 1998. Microstructure and texture patterns of
mollusc shells. Journal of Molluscan Studies 64, 133±136.
Heizmann, J.-J., Laruelle, C., 1986. Simultaneous measurement of several
X-ray pole ®gures. Journal of Applied Crystallography 19, 467±472.
Kocks, U.F., TomeÂ, C., Wenk, H.-R., 1998. Texture and Anisotropy:
Preferred Orientations in Polycrystals and Their Effect on Materials
Properties. Cambridge University Press.
Lindberg, D.R., 1988. The patellogastropoda. Malacological Review,
supplement 4, 35±63.
MacClintock, C., 1967. The shell structure of patelloid and bellerophontoid
gastropods (Mollusca). Peabody Museum of Natural History. Yale
University Bulletin 22, 1±140.
Mutvei, H., 1978. Ultrastructural characteristics of the nacre in some
gastropods. Zoologica Scripta 7, 287±296.
Mutvei, H., 1980. The nacreous layer in molluscan shells. In: Omori, M.,
Watabe, N. (Eds.), The Mechanisms of Biomineralisation in Animals
and Plants. Tokai University Press, pp. 49±56.
Ponder, W.F., Lindberg, D.R., 1997. Towards a phylogeny of gastropod
molluscs: an analysis using morphological characters. Zoological
Journal of the Linnean Society 119, 83±265.
Ricote, J., Chateigner, D., 1999. Quantitative texture analysis applied to the
study of preferential orientations in ferroelectric thin ®lms. Boletin de la
Societad EspanÄola de CeraÂmica y Vidrio 38 (6), 587±591.
Ricote, J., Chateigner, D., Pardo, L., AlgueroÂ, M., Mendiola, J., Calzada,
M.L., 2000. Quantitative analysis of preferential orientation compo-
nents of ferroelectric thin ®lms. Ferroelectrics 241, 167±174.
Runnegar, B., Pojeta Jr., J., Morris, N.J., Taylor, J.D., Taylor, M.E.,
Mcclung, G., 1975. Biology of the Hyolitha. Lethaia 8, 181±191.
Silve, C., Lopez, E., Vidal, B., Smith, D.C., Camprasse, S., Camprasse, G.,
Couly, G., 1992. Nacre initiates biomineralization by human osteoblasts
maintained in vitro. Calci®ed Tissue International 51, 363±369.
Suga, N., 1991. Mechanisms and Phylogeny of Mineralization in Biological
Systems. Springer Verlag.
Swamy, S., 1935. X-ray analysis of the structure of iridescent shells. Part II,
The Haliotid. Proceedings of the Indian Academy of Sciences II (4),
345±351 pl. XVII±XVIII.
Taylor, J.D., Kennedy, W.J., Hall, A., 1969. The shell structure and
mineralogy of the Bivalvia, introduction. Nuculacea±Trigonacea.
Bulletin of the British Museum (Natural History), Zoology supplement
3, 1±125.
Taylor, J.D., Kennedy, W.J., Hall, A., 1973. The shell structure and miner-
alogy of the Bivalvia, Part II, Lucinacea±Clavagellacea. Bulletin of the
British Museum (Natural History) Zoology 22 (9), 253±294.
Weiner, S., Addadi, L., 1997. Design strategies in mineralized biological
materials. Journal of Materials Chemistry 7 (5), 689±702.
Weiner, S., Talmon, Y., Traub, W., 1983. Electron diffraction of mollusc
shell organic matrices and their relationship to the mineral phase. Inter-
national Journal of Biological Macromolecules 5, 325±328.
Weiner, S., Traub, W., 1980. X-ray diffraction study of the insoluble
organic matrix of mollusk shells. FEBS letters 111, 311±316.
D. Chateigner et al. / Journal of Structural Geology 22 (2000) 1723±17351734
Weiner, S., Traub, W., 1981. Structural aspects of recognition and assem-
bly. In: Balaban, M., Sussman, J.L., Traub, W., Yonath, A. (Eds.),
Biological Macromolecules, Balaban ISS, Rehovot and Philadelphia,
pp. 467±482.
Weiner, S., Traub, W., 1984. Macromolecules in mollusc shells and their
functions in biomineralisation. Philosophical Transactions of the Royal
Society, London Series B304, 425±434.
Wenk, H.-R., 1965. Eine photographische Roentgen-Gefuegeanalyse.
Schweiz. mineral. petrog. Mitt. 45, 517±550.
Wenk, H.-R., Matthies, S., Donovan, J., Chateigner, D., 1998. beartex: A
Windows based program for quantitative texture analysis. Journal of
Applied Crystallography 31, 262±269.
Wilmot, N.V., Barber, D.J., Taylor, J.D., Graham, A.L., 1992. Electron
microscopy of molluscan crossed-lamellar microstructure. Philosophi-
cal Transactions of the Royal Society, London Series B337, 21±35.
Wise, S.W., 1970. Microarchitecture and mode of formation of nacre
(mother-of-pearl) in Pelecypods, Gastropods, and Cephalopods.
Eclogae Geologicae Helveticae 63, 775±797.
D. Chateigner et al. / Journal of Structural Geology 22 (2000) 1723±1735 1735
Copyright © 2022 FDOKUMEN