influence of stabilizers on the fermentation rate and nutritive ...
145
1 INFLUENCE OF STABILIZERS ON THE FERMENTATION RATE AND NUTRITIVE VALUE OF SET YOGHURT A THESIS SUBMITTED TO THE DEPARTMENT OF FOOD SCIENCE AND TECHNOLOGY, IN PARTIAL FULFILLMENT OF THE REQUIREMENTS FOR THE AWARD OF THE DEGREE OF MASTER OF SCIENCE (M.Sc) OF THE UNIVERSITY OF NIGERIA BY OBODOECHI, CHINAZOM M. PG/M.Sc/10/ 57616 DEPARTMENT OF FOOD SCIENCE AND TECHNOLOGY, UNIVERSITY OF NIGERIA, NSUKKA SUPERVISOR: PROF. T. M. OKONKWO
-
Upload
khangminh22 -
Category
Documents
-
view
2 -
download
0
Transcript of influence of stabilizers on the fermentation rate and nutritive ...

1
INFLUENCE OF STABILIZERS ON THE FERMENTATION
RATE AND NUTRITIVE VALUE OF SET YOGHURT
A THESIS SUBMITTED TO THE DEPARTMENT OF FOOD SCIENCE AND
TECHNOLOGY, IN PARTIAL FULFILLMENT OF THE REQUIREMENTS
FOR THE AWARD OF THE DEGREE OF MASTER OF SCIENCE (M.Sc) OF
THE UNIVERSITY OF NIGERIA
BY
OBODOECHI, CHINAZOM M.
PG/M.Sc/10/ 57616
DEPARTMENT OF FOOD SCIENCE AND TECHNOLOGY,
UNIVERSITY OF NIGERIA, NSUKKA
SUPERVISOR: PROF. T. M. OKONKWO

i
INFLUENCE OF STABILIZERS ON THE FERMENTATION
RATE AND NUTRITIVE VALUE OF SET YOGHURT
A THESIS SUBMITTED TO THE DEPARTMENT OF FOOD SCIENCE AND
TECHNOLOGY, IN PARTIAL FULFILLMENT OF THE REQUIREMENTS
FOR THE AWARD OF THE DEGREE OF MASTER OF SCIENCE (M.Sc) OF
THE UNIVERSITY OF NIGERIA
BY
OBODOECHI, CHINAZOM M.
PG/M.Sc/10/ 57616
DEPARTMENT OF FOOD SCIENCE AND TECHNOLOGY,
UNIVERSITY OF NIGERIA, NSUKKA
SUPERVISOR: PROF. T. M. OKONKWO

ii
APPROVAL PAGE
This thesis has been approved for the award of Master of Science Degree in Food Science and
Technology, University of Nigeria, Nsukka.
_______________________ _____________________
PROF. T.M. OKONKWO PROF. J. S. ALAKALI
PROJECT SUPERVISOR EXTERNAL SUPERVISOR
_______________________ _______________________
PROF. T.M. OKONKWO PROF. (MRS). NNAM
HEAD OF DEPARTMENT DEAN OF FACULTY

iii
CERTIFICATION
I, Obodoechi Chinazom, Martina a postgraduate student in the Department of Food Science and
Technology, Faculty of Agriculture, University of Nigeria, Nsukka has satisfactorily completed
the requirements for the award of the Degree of Master of Science (M.Sc) in Food Science and
technology. The work embodied in this dissertation is original and has not been submitted in part
or full for any other diploma or degree of this or any other University.
____________________________ ___________________________
PROF. T.M. OKONKWO DATE
PROJECT SUPERVISOR
____________________________ ____________________________
PROF. T.M. OKONKWO DATE
HEAD OF DEPARTMENT

iv
DEDICATION
This work is dedicated to my three friends, the Trinity who did not allow me to fall or
falter on the way but whose great love, wisdom, understanding and supernatural guidance helped
me throughout the course of this research work. Thank you my FRIENDS.

v
ACKNOWLEDGEMENT
I want to express my sincere gratitude to God Almighty for His encouragement, love, good health,
knowledge and understanding to put this work together. May His name be glorified forever. Amen.
I also want to thank my supervisor, Prof. T.M. Okonkwo, for his fatherly support, encouragement,
suggestions and advice in writing of this dissertation. May the Good Lord continue to bless,
enriched protect him and his family. I specially want to appreciate all the lecturers of the
Department of Food Science and Technology for their encouragement and support.
I shall ever remain grateful to my treasured parents, Sir and Lady M.U. Obodoechi. Their love,
proper parental care, encouragement and financial support helped make this work a reality.
I am indebted to my Siblings, Chike and Ijeoma Obodoechi, Emma, Adol and Ogechi, Emenike,
Chukwudi and Ebere Utoh for their encouragement and love. I will not forget my nephews and
nieces, Kosi, Chima, Ifunanya, Ebube, Onyinye, Daniel, Ife and Chisom. I love you all.
My thanks go to all my colleagues and friends Pastor Samuel Abah, Mummy Chinelo, David,
Ijeoma, Chidi, Nkechi, Ada, Oghale, Anita, and others for their immeasurable support, prayer and
help. I am grateful to my Daddy in the Lord and his wife Pastor and Mrs. Okechukwu Nwankwo
for their prayers and encouragement. Daddy and Mummy I love you.
I will not forget Chinasa who typed this work.

vi
TABLE OF CONTENTS
Title Page i
Approval Page ii
Certification iii
Dedication iv
Acknowledgement v
Table of Contents vi
List of Tables ix
List of Figures xi
Abstract xiii
CHAPTER ONE: INTRODUCTION
1.0 Background of the Study 1
1.1 Statement of Research Problem 3
1.2 Justification 4
1.3 Objectives 4
1.4 Significance of the Study 5
CHAPTER TWO: LITERATURE REVIEW
2.1 Yoghurt as a Fermented Dairy Product 6
2.2 Fermentation 7
2.3 Fermented Foods 9
2.4 Yoghurt Production 10
2.5 Processing of Yoghurt 13
2.5.1 Modifying the composition of milk 13
2.5.2 Pasteurization and Homogenization 15
2.5.3 Homogenization 15
2.5.4 Fermentation 15
2.6 Factors that affect fermentation rate of yoghurt 16
2.6.1 Temperature 16
2.6.2 Sugar content 17
2.6.3 Starter culture concentration 18
vii
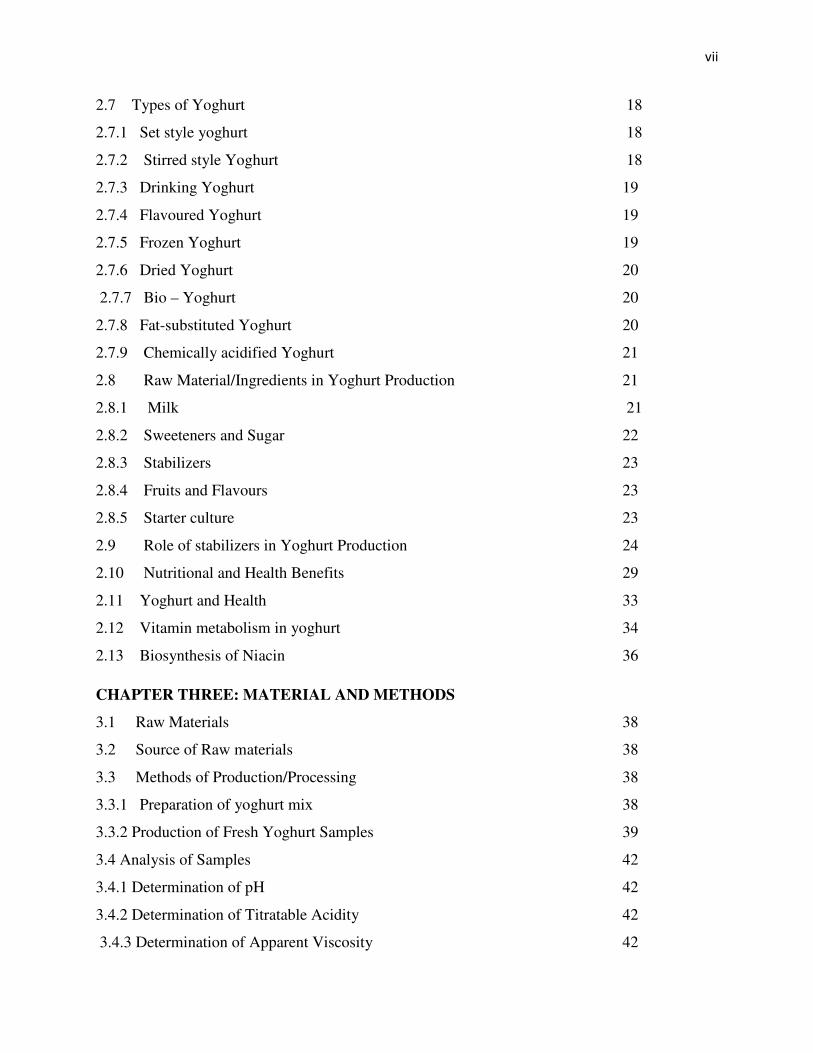
2.7 Types of Yoghurt 18
2.7.1 Set style yoghurt 18
2.7.2 Stirred style Yoghurt 18
2.7.3 Drinking Yoghurt 19
2.7.4 Flavoured Yoghurt 19
2.7.5 Frozen Yoghurt 19
2.7.6 Dried Yoghurt 20
2.7.7 Bio – Yoghurt 20
2.7.8 Fat-substituted Yoghurt 20
2.7.9 Chemically acidified Yoghurt 21
2.8 Raw Material/Ingredients in Yoghurt Production 21
2.8.1 Milk 21
2.8.2 Sweeteners and Sugar 22
2.8.3 Stabilizers 23
2.8.4 Fruits and Flavours 23
2.8.5 Starter culture 23
2.9 Role of stabilizers in Yoghurt Production 24
2.10 Nutritional and Health Benefits 29
2.11 Yoghurt and Health 33
2.12 Vitamin metabolism in yoghurt 34
2.13 Biosynthesis of Niacin 36
CHAPTER THREE: MATERIAL AND METHODS
3.1 Raw Materials 38
3.2 Source of Raw materials 38
3.3 Methods of Production/Processing 38
3.3.1 Preparation of yoghurt mix 38
3.3.2 Production of Fresh Yoghurt Samples 39
3.4 Analysis of Samples 42
3.4.1 Determination of pH 42
3.4.2 Determination of Titratable Acidity 42
3.4.3 Determination of Apparent Viscosity 42

viii
3.4.4 Determination of Total solids 42
3.4.5 Determination of Ash content 43
3.4.6 Determination of Moisture Content 43
3.4.7 Determination of fat content 44
3.4.8 Determination of crude Protein 44
3.4.9 Determination of Niacin (Vitamin B3) 45
3.5 Microbial Analysis 47
3.6 Sensory Evaluation 48
3.7 Data Analysis 48
CHAPTER FOUR: RESULT AND DISCUSSION
4.1 Effect of Stabilizers on the Physicochemical Characteristics of short set and
long set Yoghurt 49
4.1.1 Moisture Content of Short Set and Long Set Yoghurt 49
4.1.2 Fat Content of Short Set and Long set Yoghurt 54
4.1.3 Protein Content of Short set and Long set yoghurt 56
4.1.4 Ash Content of Short Set and Long Set Yoghurt 62
4.1.5 Total Solids Content of Short Set and Long Set Yoghurt 65
4.1.6 Viscosity (Cp) of Short Set and Long Set Yoghurt 66
4.1.7 Total Titratable Acidity (%) of Short Set and Long Set Yoghurt 72
4.1.8 pH of Short Set and Long Set Yoghurt 77
4.2 Vitamin B3 (Niacin) (mg/ml) Content of Short Set and Long Set Yoghurt 81
4.3 Microbial Count (cfu/ml) of Short Set and Long set Yoghurt 85
4.4 Sensory Evaluation of short set and long set yoghurt 92
CHAPTER FIVE: CONCLUSION AND RECOMMENDATION
5.1 Conclusion 98
5.2 Recommendation 98
References 100
Appendix 109

ix
LIST OF TABLES
TABLES PAGE
Table 1: Chemical composition (g 100-1
) of milk of different species of mammals 22
Table 2: Commercial composition of cow’s milk (g 100 g-1
) (average expected) 23
Table 3: Classification and functions of Gums which could be used during the
manufacture of Yoghurt 28
Table 4: Vitamin contents of milk and yoghurt 30
Table 5: Nutritional Composition of Yoghurt 32
Table 6: Some of the typical values of the major constituents of milk and
yoghurt (all units 100 g-1
) 33
Table 7: Vitamin contents of different milks and yoghurtsa 35
Table 8: Ingredient mixes for production of yoghurt sample * 40
Table 9: HPLC conditions for separation and identification of Nicotinamide
in yoghurt samples 47
Table 10: Rate of Fermentation Change per Hour in some selected parameters
of both Short Set and Long Set Yoghurt 54
Table 11: Sensory Analysis for colour of short set yoghurt 93
Table 12: Sensory Analysis for flavour of short set yoghurt 94
Table 13: Sensory Analysis for taste of short set yoghurt 94
Table 14: Sensory Analysis for mouthfeel of short set yoghurt 95
Table 15: Sensory Analysis for overall acceptability of short set yoghurt 95
Table 16: Sensory Analysis for colour of long set yoghurt 96
Table 17: Sensory Analysis for flavour of long set yoghurt 96
Table 18: Sensory Analysis for taste of long set yoghurt 96
Table 19: Sensory Analysis for mouthfeel of long set yoghurt 97
Table 20: Sensory Analysis for overall acceptability of long set yoghurt 97
Table 21: Effect of Stabilizers on the Moisture Content of Short Set Yoghurt 110
Table 22: Effect of Stabilizers on the Fat Content of Short Set Yoghurt 110
Table 23: Effect of Stabilizers on the Protein Content of Short Set Yoghurt 111
Table 24: Effect of Stabilizers on the Ash Content of Short Set Yoghurt 111
Table 25: Effect of Stabilizers on the Total solid Content of Short Set Yoghurt 112
Table 26: Effect of Stabilizers on the Viscosity (Cp) of Short Set Yoghurt 112
Table 27: Effect of Stabilizers on the pH of Short Set Yoghurt 113

x
Table 28: Effect of Stabilizers on the Total titratable acidity of Short Set Yoghurt 113
Table 29: Effect of Stabilizers on the total viable count of Short Set Yoghurt 114
Table 30: Effect of Stabilizers on the LAB Count of Short Set Yoghurt 114
Table 31: Effect of Stabilizers on the Vitamin B3 Content of Short Set Yoghurt 115
Table 32: Effect of Stabilizers on the Moisture Content of Long Set Yoghurt 115
Table 33: Effect of Stabilizers on the Fat Content of Long Set Yoghurt 116
Table 34: Effect of Stabilizers on the Protein Content of Long Set Yoghurt 116
Table 35: Effect of Stabilizers on the Ash Content of Long Set Yoghurt 117
Table 36: Effect of Stabilizers on the Total solids Content of Long Set Yoghurt 117
Table 37: Effect of Stabilizers on the viscosity (Cp) of Long Set Yoghurt 118
Table 38: Effect of Stabilizers on the pH of Long Set Yoghurt 118
Table 39: Effect of Stabilizers on the Total titratable acidity of Long Set Yoghurt 119
Table 40: Effect of Stabilizers on the Total Viablecount of Long Set Yoghurt 119
Table 41: Effect of Stabilizers on the Lactic acid of bacteria count Long Set Yoghurt 120
Table 42: Effect of Stabilizers on the Lactic acid of bacteria count Long Set Yoghurt 120

xi
LIST OF FIGURES
FIGURES PAGE
Figure 1: Flow chart for yoghurt production 14
Figure 2: Some possible Scheme for the biosynthesis of niacin by yoghurt
micro-organism 37
Figure 3: Flowchart for the production of set style yoghurt 41
Figure 4: Changes in moisture content of short set yoghurt during fermentation 51
Figure 5: Changes in moisture content of long set yoghurt during fermentation 52
Figure 6: Changes in Fat content of short set yoghurt during fermentation 57
Figure 7: Changes in the fat content of long set yoghurt during fermentation 58
Figure 8: Changes in the protein content of short set yoghurt during fermentation 60
Figure 9: Changes in the protein content long set yoghurt during fermentation 61
Figure 10: Changes in the ash content of short set yoghurt during fermentation 63
Figure 11: Changes in ash content of long set yoghurt during fermentation 64
Figure 12: Changes in Total solids of short set yoghurt during fermentation 67
Figure 13: Changes in total solids of long set yoghurt during fermentation. 68
Figure 14: Changes in the viscosity of short set yoghurt during fermentation 69
Figure 15: Changes in viscosity of long set yoghurt during fermentation. 70
Figure 16: Changes in Total Titratable Acidity of short set yoghurt during
fermentation 74
Figure 17: Changes in Titratable acidity of long set yoghurt during fermentation 75
Figure 18: Changes in the pH values of short set yoghurt during fermentation 78
Figure 19: Changes in pH of long set yoghurt during fermentation 79
Figure 20: Changes in Vitamin B3 (mg/ml) content of short set yoghurt during
Fermentation 82
Figure 21: Changes in Niacin Vitamin B3 (mg/ml) content of long set yoghurt
During fermentation 83
Figure 22: Changes in Total viable count of short set yoghurt during fermentation 87
Figure 23: Changes in Total Viable count of long set yoghurt during fermentation 88
Figure 24: Changes in LAB count of short set yoghurt during fermentation 89
Figure 25: Changes in LAB count of long set yoghurt during fermentation 90

xii
LIST OF APPENDICES
Appendix I: Standard Calibration Curve for niacin (Vit B3) 109
Appendix II: Physicochemical properties of short set and long set yoghurt 110
Appendix III: ANOVA table for short set and long set yoghurt 121

xiii
ABSTRACT
Stabilized yoghurt samples were produced by reconstituting powdered milk in water along with
sugar and 0, 0.5 and 1.0 % concentrations of carboxyl methyl cellulose (CMC), Corn starch and
gum acacia before fermentation. The yoghurt samples were either produced as short set yoghurt
by incubating at 42 oC for 5 hours or incubating at 30 ± 2
oC (room conditions) for 24 hours as
long set yoghurt. Samples were analyzed at intervals of 1 h for 5 h for the short set yoghurt and
at intervals of 4 h for 24 h for long set yoghurt. The proximate, physicochemical, niacin content,
microbial and sensory evaluation were carried out in the yoghurt samples as fermentation
progressed for both short set and long set yoghurt. Results showed that the addition of stabilizers
reduced moisture content from 88.54 ± 0.02 % (no stabilizer) to 84.59 ± 0.02 % (CMC), 85.59 ± 0.02 %
(corn starch) and 86.70 ± 0.02 % (gum acacia). Due to dilution effect, addition of stabilizers depressed
protein contents from 3.37 ± 0.04 % (no stabilizer) to 3.28 ± 0.51 % (CMC), 3.08 ± 0.03 % (corn starch)
and 3.32 ± 0.03 % (gum acacia). Total solids increased on addition of stabilizers from 11.64 ± 0.02 % (no
stabilizer) to 15.41 ± 0.02 % (CMC), 14.47 ± 0.02 % (corn starch) and 13.30 ± 0.02 % (gum acacia).
Increase in stabilizer concentration and fermentation time decreased moisture content but increased total
solids, protein, fat, ash and sugars. The viscosity of the yoghurt samples significantly (p < 0.05) increased
with addition of stabilizers from 1.48 ± 0.03 Cp (no stabilizer) to 78.03 ± 1.14 Cp (CMC), 2.74 ± 0.04 Cp
(corn starch) and 1.99 ± 0.03 Cp (gum acacia), with CMC having the highest increase (p < 0.05) and gum
acacia the least. Viscosity significantly increased (p < 0.05) as stabilizer concentration and fermentation
time increased. Although CMC increased the pH from 6.19 ± 0.03 (no stabilizer) to 6.26 ± 0.02, corn
starch did not affect pH (6.18 ± 0.02) while gum acacia reduced pH to 5.94 ± 0.03. Increase in stabilizer
concentration and fermentation time increased pH. Addition of stabilizers increased the titratable acidity
from 0.29 ± 0.01 % (no stabilizer) to 0.39 ± 0.01 %( CMC), 0.32 ± 0.01 % (corn starch) and 0.45 ± 0.00
% (gum acacia). Lactic acid production reduced as concentration of stabilizers increased, but increased as
fermentation time increased. Vitamin B3 (niacin) increased with the addition of stabilizers from 0.15 ±
0.00 (no stabilizer) to 0.175 ± 0.02 mg/ml (CMC), 0.185 ± 0.01 mg/ml (corn starch) and 0.185 ± 0.00
mg/ml (gum acacia). Niacin production increased as stabilizer concentration and fermentation time
increased. The total viable bacteria significantly (p < 0.05) reduced with increase in concentration of
stabilizer and fermentation time, while lactic acid bacteria decreased with increase in stabilizer
concentration it increased as the fermentation time increased. Significant (p < 0.05) interactions were
observed between stabilizers and their concentrations for all parameters studied. Sensory results indicated
that yoghurt produced with 1.0 % concentration of CMC gave the best mouth feel while yoghurt produced
with corn starch produced the most desirable taste and flavor. Results showed that reaction rates were
higher for the short set yoghurt for all parameters studied, resulting to achieving an equivalent effect in 5
h in short set yoghurt compared to the same effect achieved in 24 h in the long set yoghurt.

1
CHAPTER ONE
INTRODUCTION
1.0 BACKGROUND OF THE STUDY
Dairy products are generally defined as foods produced from commercially domesticated
cows, goats or buffalo’s milk (United Kingdom food Standard Agency, 2009). They are usually
high energy-yielding food products. Raw milk for processing of dairy products comes mainly
from cows and to a lesser extent from other mammals such as goats, sheep, yaks, camel or horses.
Dairy products are commonly found in the European, middle-Eastern and Indian cuisines,
whereas they are almost unknown in Eastern cuisines. The United Kingdom Food Standards
Agency defined Dairy as “foodstuffs” made from mammalian milk (Bandler and Singh, 2009).
Most dairy products contain large amounts of saturated fat and most of them are usually
fermented. Examples of dairy products include Cheese, Kefir, yoghurt, etc.
Fermented dairy products, also known as cultured dairy foods or cultured milk products,
are dairy foods that have been fermented with lactic acid bacteria such as Lactobacillus,
Lactococcus and Leuconostoc. The fermentation process increases the shelf-life of the product as
well as adds to the taste and improves the digestibility of milk (Canadian dairy Commission,
2007). There is evidence that fermented milk products have been produced since around 10,000
B.C, and a range of different Lactobacilli strains has been grown in laboratories for a wide range
of cultured milk products with different tastes.
Fermented milk products are sour tasting milk products which have been made by either
fermenting the milk naturally or by the use of starter culture to produce the desirable milk
product. Examples of fermented milk in Africa, Syria, Asia and America are Cheese, nono,
buttermilk, yoghurt, irgo, kadam, laban, shenineh, dahi, shirkand, mahi, etc (Ajayi, 2006).

2
Yoghurt, as a fermented dairy product, is a semi-solid milk product and the best known of
all fermented milk products. It is obtained by souring of milk using a pure culture of
Lactobacillus bulgaricus and Streptococcus thermophilus (Chandan and Shahani, 1993). It can be
manufactured from liquid cow milk, powdered milk and vegetable milk (Soy milk) as base
material (Adolfsson et al., 2004). Lactic acid and the other molecules that are formed during
fermentation of milk make yoghurt a food product that is both acidic and creamy, appreciated for
its taste and nutritional qualities notably for its calcium content (Buttriss, 1997). Yoghurt is thus a
very convenient food as compared to milk which is very fragile. Due to the health benefits and
taste, it is known to constitute an appreciable proportion of total daily food consumption or even
just as a refreshing beverage in several countries (Khan et al., 2008). It is regarded as a
nutritionally balanced food, containing almost all the nutrients present in milk and in a more
assimilable form (Younus et al., 2002). Yoghurt is a source of highly nutritive protein, energy
from added cane sugar, milk fat and unfermented lactose as well as vitamins (Ihekoronye and
Ngoddy, 1985). It is actually considered to be more nutritive than milk in terms of vitamins
content, digestibility and as a source of calcium and phosphorus (Foissy, 1983). It is believed that
yoghurt has valuable “therapeutic properties” and helps in curing gastro intestinal disorders
(Adolfsson et al., 2004). It also prevents and controls diarrhoea, capable of modulating the
inflammatory response produced by carcinogens, helps in reducing the inflammatory response
through an increase in apoptosis.
Yoghurt is characterized as a smooth viscous gel with specific taste of sharp acid and
green apple flavor (Bodyfelt et al., 1988). Some yoghurts exhibit a heavy consistency that closely
resembles custard of milk pudding, in contrast to others that are purposely soft boiled and are
essentially drinkable (Connolly et al.,1984). The most important textural characteristics of

3
yoghurt are firmness and the ability to retain water which is a factor of the type and
concentrations of stabilizers used. The type of culture used is also an important factor affecting
microstructure and the textural properties of yoghurt (Hussan et al., 1999).
Stabilizers and thickeners are important in several manufactured products and dairy
products such as chocolate dressing, milk drinks, ice-cream and yoghurt. These substances
prevent separation of various ingredients, increase the viscosity and inhibit the formation of large
crystals. Substances used as stabilizers and thickeners include vegetable or tree gums such a gum
tragacanth and gum Arabic, agar, cornstarch, gelatin and pectin. Cellulose compounds like
methylcellulose and CMC (sodium carboxyl methyl cellulose) are also used (Awan, 1995).
Yogurt is mainly classified based on its chemical composition (full-fat, reduced fat and
low-fat), manufacturing method (set and stirred yogurt), flavour type or post incubation process.
Yoghurt on the basis of method of production prior to incubation, cooling and final packaging
exists as set and stirred yoghurt. Set yoghurt is a type of yoghurt which when produced is
incubated and cooled in the final retail package and it is characterized by a firm jelly-like texture
(White, 1995). On the other hand, stirred yoghurt is a type of yoghurt that is produced and
incubated in a tank and the final coagulum is “broken” by stirring prior to cooling, addition of
flavours and packaging (Skriver et al., 1993; White, 1995).
1.1 STATEMENT OF RESEARCH PROBLEM
From previous researches, it is noteworthy to say that fermentation increases the vitamin
content of products, more especially some B-complex vitamins due to microbial activities during
fermentation where synthesis and breakdown of substances occur (Ochanda et al., 2010). Yoghurt
starter cultures utilize some vitamins present in milk during fermentation for their growth.
However, this increment depends on the rate of the inoculation, the strain of yoghurt starter

4
cultures and the fermentation conditions (Tamime and Robinson, 1999). Stabilizers or hydrophilic
colloids bind water, prevent separation of various ingredients, increase the viscosity and inhibit
the formation of large crystals which are attributes for consumer acceptability. It is, therefore,
necessary to rebuild yoghurt with stabilizers and thickeners at such concentrations that will give
the desired body to the final product. This goal will be achieved by optimum selection of
stabilizers with protective colloid properties, by assessing how the activities of the fermenting
organisms will be enhanced or inhibited by the hydrocolloids used with respect to vitamin
synthesis by evaluating the chemical, microbiological, nutritional and sensory properties of
yoghurt produced under controlled incubation fermented at 42 oC for 5 hours and 24 hours at 30
oC respectively.
1.2 JUSTIFICATION
Yoghurt is a fermented product obtained through anaerobic fermentation of lactose in milk
by relevant micro-organism, most of which are classified as probiotic. It is a very nutritious
product in terms of vitamin content, digestibility and has valuable “therapeutic properties”. Much
research has been carried out in yoghurt in terms of final product. Stabilizer used in yoghurt
production are many and varied but there is little information on how some of the stabilizers
locally used in Nigeria influence the fermentation rate of yoghurt and consequently the nutritive
value for which yoghurt is consumed.
1.3 OBJECTIVES
The main objective of this study is to produce yoghurt with different stabilizers and
evaluate their nutritional characteristics.

5
Specific Objectives
1. To evaluate the effect of the stabilizers on the physicochemical characteristics of the
yoghurt during fermentation.
2. To compare the effect of the different types and concentrations of stabilizers with respect
to their influence on the changes in the vitamin B3 content during fermentation.
3. To evaluate the changes in the microbial population during fermentation of yoghurt
produced with different stabilizers.
4. To evaluate the effects of different types and concentrations of stabilizers on their sensory
characteristics of yoghurt.
1.4 SIGNIFICANCE OF THE STUDY
Traditionally produced natural yoghurt will require little or no stabilizer to produce a firm,
fine gel. However, commercially produced yoghurt that has to be pumped, stirred, fruited and
filled would often breakdown to a runny liquid without the addition of stabilizers. So there is need
to introduce these stabilizers to prevent separation of whey from yoghurt, a problem known as
syneresis (Ramaswamy and Basak, 1992). The use of cellulose compounds like CMC as
stabilizers for yoghurt, pectin, gelatin, agar, corn starch, etc, is very popular. In recent times, the
use of tree gums or gum tree secretions or exudates has also been introduced in yoghurt
production. Examples of such tree gums are Acacia gum, gum tragacanth, carageenans, gum
Arabic, etc. Their ability to produce high viscosity in water at low concentrations is a major
property that gives them a valuable and widespread use. This will also help in harnessing these
tree gums and prevent post harvest losses, which is of great economic importance. It is therefore
hoped that the outcome of this research work will provide an insight on the inhibitory or elaborate
effects of selected stabilizers and their quantities in the multiplication of microorganisms, production
of lactic acid and synthesis of B vitamins.

6
CHAPTER TWO
LITERATURE REVIEW
2.1 Yoghurt as a Fermented Dairy Product
Yoghurt is a fermented milk product obtained by souring of milk using a pure culture of
Lactobacillus bulgaricus and Streptococcus thermophilus (Chandan and Shahani, 1993). It can be
manufactured from liquid cow milk, powdered milk and vegetable milk (soy milk) as base
material (Adolfsson et al., 2004). It is one of the oldest popular foods of the world that contain
probiotics and has high nutritional and therapeutic values in the human diet (Zahoor et al., 2002).
Lactic acid and the other molecules that are formed during fermentation of milk make yoghurt a
food product that is both acidic and creamy, appreciated for its taste and nutritional qualities,
notably for its calcium content (Butriss, 1997). Due to its acidity, yoghurt may be stored for much
longer periods of time ( 21 days) under refrigeration temperature for fresh yoghurt (NIS, 2004)
than milk, 8 – 12 weeks for pasteurized or thermized yoghurt (Early, 1992). It is a very
convenient food as compared to fresh milk which is very fragile; it is easily digestible and
enjoyed everywhere in the world for its beneficial properties.
The initial popularity of yoghurt in the Western Europe owed much to the work of the
Russian bacteriologist and 1908 Nobel Prize Laureate, E. Metchnikoff, who at the turn of the
century studied the bacteria used to produce yoghurt. In his book “The Prolongation of Life”,
written in 1907, he attributed the good health and longevity of Balkan peasants to the effects of
certain bacteria in the yoghurt they consumed. He postulated the theory that prolongation of life
would follow ingestion of a lactic acid bacterium named Bulgarian bacillus. The presence of this
organism in yoghurt was supposed to inhibit the growth of putrefactive organisms in the intestine.
The Bulgarian bacillus is in fact, Thermobacterium bulgaricum, later designated as Lactobacillus
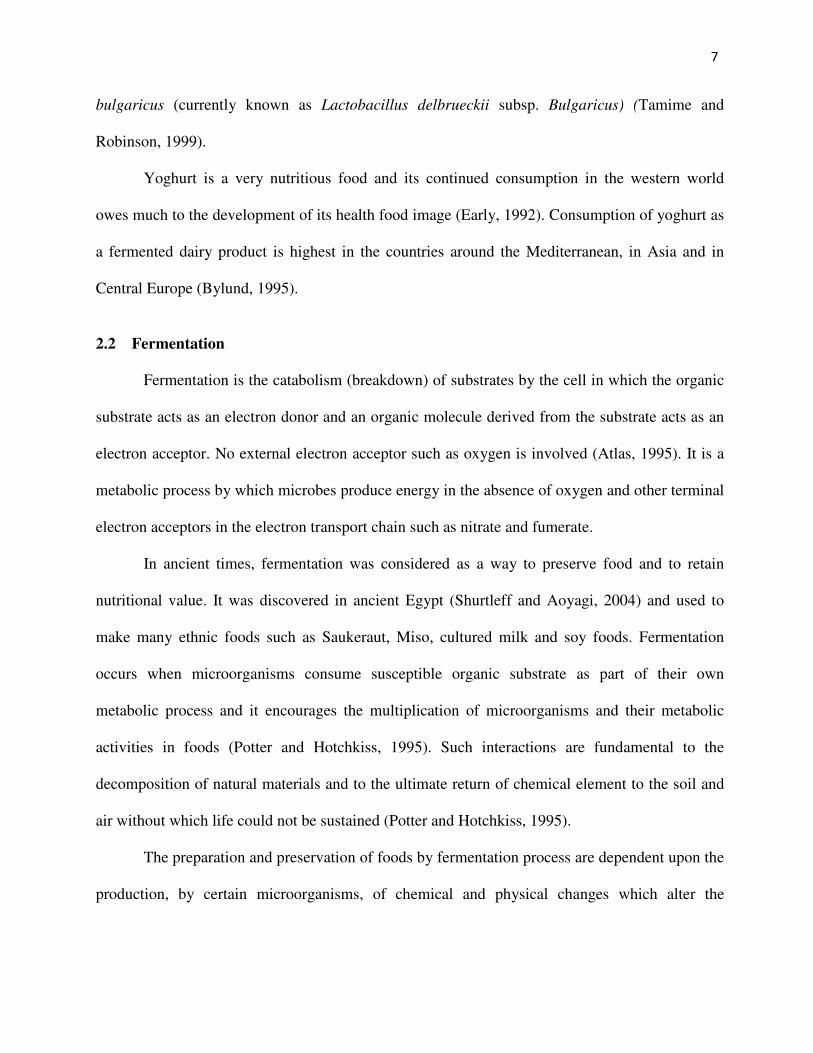
7
bulgaricus (currently known as Lactobacillus delbrueckii subsp. Bulgaricus) (Tamime and
Robinson, 1999).
Yoghurt is a very nutritious food and its continued consumption in the western world
owes much to the development of its health food image (Early, 1992). Consumption of yoghurt as
a fermented dairy product is highest in the countries around the Mediterranean, in Asia and in
Central Europe (Bylund, 1995).
2.2 Fermentation
Fermentation is the catabolism (breakdown) of substrates by the cell in which the organic
substrate acts as an electron donor and an organic molecule derived from the substrate acts as an
electron acceptor. No external electron acceptor such as oxygen is involved (Atlas, 1995). It is a
metabolic process by which microbes produce energy in the absence of oxygen and other terminal
electron acceptors in the electron transport chain such as nitrate and fumerate.
In ancient times, fermentation was considered as a way to preserve food and to retain
nutritional value. It was discovered in ancient Egypt (Shurtleff and Aoyagi, 2004) and used to
make many ethnic foods such as Saukeraut, Miso, cultured milk and soy foods. Fermentation
occurs when microorganisms consume susceptible organic substrate as part of their own
metabolic process and it encourages the multiplication of microorganisms and their metabolic
activities in foods (Potter and Hotchkiss, 1995). Such interactions are fundamental to the
decomposition of natural materials and to the ultimate return of chemical element to the soil and
air without which life could not be sustained (Potter and Hotchkiss, 1995).
The preparation and preservation of foods by fermentation process are dependent upon the
production, by certain microorganisms, of chemical and physical changes which alter the

8
appearance, body and flavor of the original materials (Ihekoronye and Ngoddy, 1985). This
means that the knowledge of microorganisms is essential to understand the fermentation process.
Fermentation became popular with the dawn of civilization because it not only preserved
food but also gives it a variety of taste, form and other sensory sensations. Slowly, people have
realized the nutritional as well as the therapeutic value of fermented foods and drinks and this has
made fermented foods even more popular. Fermentation is, therefore, a process that transforms
the starting material into a product that may have enhanced nutritional and/or organoleptic
characteristics (Edward, 2003).
Fermentation is a very vital step in the production of yoghurt and over the last several
thousand years, fermentation has been a major way of preserving food. Microbial growth, either
of natural or inoculated population, causes chemical and or textural changes to form a product that
can be stored for extended periods (Prescott et al., 2005).
Fermentation is one of the oldest methods of food processing. The history of fermented
foods has early records in Southeast Asia, where China is regarded as the cradle of mold-
fermented foods and in Africa where the Egyptians developed the concept of the combined
brewery-bakery. The early Egyptian beers were probably quite similar to some of the traditional
opaque sorghum, maize or millet beers found in various African countries today.
In technologically developed regions, the crafts of baking, brewing, wine making and
dairying have evolved into the large-scale industrial production of fermented consumer goods,
including Cheese, pickles, wines, beers, spirits, fermented meat products, soy sauces and cultural
milk (Gaden et al., 1992). Fermentation is also an aspect of food biotechnology and with recent
discoveries; biotechnology is utilized to improve fermentation process with improvement in the
raw material and starter culture through recombinant DNA technology of enzymes as processing

9
aids as well as application of advanced batch and continuous fermentation technologies (Joshi and
Pandey, 1999). The increasing application of biotechnology and genetic engineering techniques to
food production is bringing added importance to food fermentation (Montville, 1990). Different
varieties of fermented foods are now being produced as a result of the new developments
resulting from the application of biotechnology in food.
2.3 Fermented Foods
Fermented foods are among the oldest processed foods and have formed a traditional part
of the diet in almost all countries for millennia. Today, they continue to form major sectors of the
food processing industry (Fellow, 2009).
Fermented foods are defined as those foods that have been subjected to the action of
microorganism or enzymes so that desirable biochemical changes cause significant modification
to the food (Joshi and Pandey, 1999). The term fermented foods is used to describe a special class
of food products characterized by various kinds of carbohydrate breakdown, but seldom is
carbohydrate the only constituent acted upon. Most fermented foods contain a complex mixture of
carbohydrates, proteins, fats and so on, undergoing modification simultaneously or in some
sequence, under the action of a variety of microorganism and enzymes (Potter and Hotchkiss,
1995).
All fermented foods are produced as a result of microbial action and specific organisms are
required to act on a given substrate to give the desired product (Edward, 2003). Certain mold
species also play a very important role in some fermented foods. Examples of fermented foods are
yoghurt, kefir, sauerkraut, garri, fufu, burukutu, wara, tempeh, sausages, butters, cheese, bread,
and miso, among others.

10
Fermented foods were very likely among the first foods consumed by human beings. This
was not because early humans had actually planned on or had intended to make a particular
fermented food, but rather because fermentation was simply the inevitable outcome that resulted
when raw food materials were left in an otherwise preserved state (Hutkins, 2006). When for
example, several thousands of years ago, milk was collected from a domesticated cow, goat or
camel, it was either consumed within a few hours or else it would sour and curdle, turning into
something we might today call buttermilk or fermented milk.
The characteristics of fermented foods are determined by the nature and quality of the
food itself, the changes that occur as a result of the action of the inherent enzymes in the food, the
alterations that occur as a result of microbial fermentation and the interactions that occur between
the products of these activities and constituents of the foods (Ihekoronye and Ngoddy, 1985).
Some examples of food fermenting organisms are the lactic acid producing bacteria, acetic acid
producing bacteria and some alcoholic producing yeast (Ihekoronye and Ngoddy, 1985). In
traditional fermented food preparation microbes are used to prepare and preserve food products
(Achi, 2005). Fermentation of food has many advantages such as improvement of nutritional
value and ‘protection’ against bacterial pathogens (Gadaga et al., 2004)
2.4 Yoghurt Production
The process of yoghurt making is an ancient craft which dates back thousands of years and
possibly even to the domestication of the cow, sheep or goat, but it is safe to assume that prior to
the nineteenth century the various stages involved in the production of yoghurt were little
understood (Tamime and Robinson, 1999). In order to ensure the production of good quality
yoghurt the practices of yoghurt manufacturers should be evaluated to ascertain adequate
compliance to the regulatory standards so as to boost the consumer’s health. It is noteworthy to

11
mention that there are different types of yoghurt. The variation may be due the use of live and
active cultures for inoculation, the use of plain (natural and or fruit flavour) and the use of milk
from different species of animal and plants hence, the variation factor allows for the utilization of
soybeans, tiger nut and coconut milk and other plant sources.
Natural milk is milk gotten from animals while imitation milk is milk obtained from plant
sources that is processed to serve as natural milk or replacer. Interest in dairy foods was lost on
the discovery of lactose intolerance (lactose is a carbohydrate in milk) in some populations and
milk allergy, which is an adverse reaction to milk protein. The high price of cow milk also makes
it not affordable to the low-income earners (Annon. 2011a). The increase in population has made
the quick use of non-dairy beverage sources as well as the availability of the ready plant sources
as pulses, legumes, roots and tubers, cereals, nuts among others to provide for a milk source.
Soybean (Glycine max) a plant protein which is cheaper could serve as an alternative to
cow milk. Soybean is richer in protein than most animal milk. It contains up to 40 % protein
compared with 1.0 % to 56 % protein content of most animal milk (Burton, 1985). Soymilk is
processed from soybean. The intake of fermented soymilk improves the ecosystem in the
intestinal tract by increasing the amount of probiotics (Chang et al., 2005). Pinthong et al. (1980)
reported that yoghurt could be produced from soymilk supplemented with glucose and yeast
extract through fermentation of lactic acid bacteria.
Coconut milk is a complete protein food when taken in its natural form (Ukwoma and
Mauanya, 2003) and it helps in fighting heart diseases while the protein and energy content in
soymilk are highly digestible. The qualities of these plants protein sources stimulated their
inclusion in the preparation of yoghurt as to provide protein rich product at affordable price in
place of animal which is scarce and expensive. Coconut milk is high in calories and so, it has to

12
be consumed in moderation. About 100 grams of fresh coconut milk extracted with water contains
230 calories of energy, 2.3 g of protein, 23.8 g of fat, 5.5 g of carbohydrates, 2.3 g of dietary fibre
and 3.35 g of sugar. Coconut milk can also be used to produce beverages like coco soy beverages.
Mepba (2006) reported that coco soy beverage (50:50, v/v coconut milk + soymilk) had 3.51 %
protein, 3.53 % fat and 5.17 % carbohydrate. Coco soy beverage compared with whole coconut
milk and reconstituted whole milk powder, show significantly higher total solids contents and
viscosity but lower pH.
Tiger nut and coconut could be used in the production of non-dairy drinks. The use of
blends from plant sources would have a complementary or synergistic effect and offer improved
quality nutrient. Tiger nut is a cosmopolitan perennial plant that is distributed throughout the
world (Annon. 2011b). The plant is fairly widely distributed in West Africa where it is cultivated
mainly for the edible tubers. The tubers are sweet and have nutty flavor. The tuber contains
between 20 to 36 % oil and has been suggested as potential oil crop for the production of
biodiesel. The nut is found to be rich in myristic acid, oleic acid, linoleic acid (Eteshola and
Oraedu, 1996).The protein, fat and sucrose contents were put at 8 %, 25.50 % and 17.4 %,
respectively.
The nut is also rich in minerals and oil contents. The oil was implicated as lauric acid. The nut
was equally valued for the high starch dietary fibre and carbohydrate (mono, di and
polysaccharides). Tiger nuts are regarded as digestive tonic and also help in the treatment of
indigestion, colic diarrhea, dysentery and excessive thirst (Martinez, 2003). The nut is found in
preventing heart attacks, thrombosis and activates blood circulation. It also helps in preventing
cancer due to high content of soluble glucoses. It was reported that tiger nut helps in reducing the
risk of colon cancer. Additionally, the nut is suitable for diabetic persons and also helps in losing

13
weight (Martinez, 2003). Tiger nut is an excellent source of some useful minerals such as iron and
calcium which are essential for body growth and development (Oladele and Aina, 2007). Tiger
nuts have long been recognized for their nutritional benefits as they are high in fibre, proteins and
natural sugar. They have a high content of soluble glucose and oleic acid. Along with high energy
content (starch, fats, sugars and proteins) they are rich in minerals such as phosphorus, potassium,
calcium, magnesium and iron and vitamins such as E and C (Naijarules, 2011).
Tiger nut milk free from sugar can be consumed by diabetic people due to its content of
carbohydrates with a base of sucrose and starch (without glucose) and its content of arginine,
which liberates the hormone that produces the insulin. It is also an ideal drink for people who do
not tolerate gluten or cow milk and its derivatives (Articlebase, 2011). It can be milled to extract
milk which serves as a good replacer to those with lactose intolerance or those who want to
reduce their body cholesterol.
2.5 Processing of Yoghurt
The general process of yoghurt making includes modifying the composition of milk,
pasteurizing and homogenizing the milk, fermenting at warm temperature, cooling it and adding
fruits and flavors, sugars and other materials (Dannon, 2002). A typical flow diagram for the
production of yoghurt is shown in fig. 1.
2.5.1 Modifying the composition of milk
When the milk arrives at the plant, its composition is modified before it is used to make
yoghurt. This standardization process typically involves reducing the fat content and increasing
the total solids (Tamime and Robinson, 1999). The fat content is reduced by using a standardizing
clarifier and a separator (a device that relies upon centrifugation to separate fat from milk). From
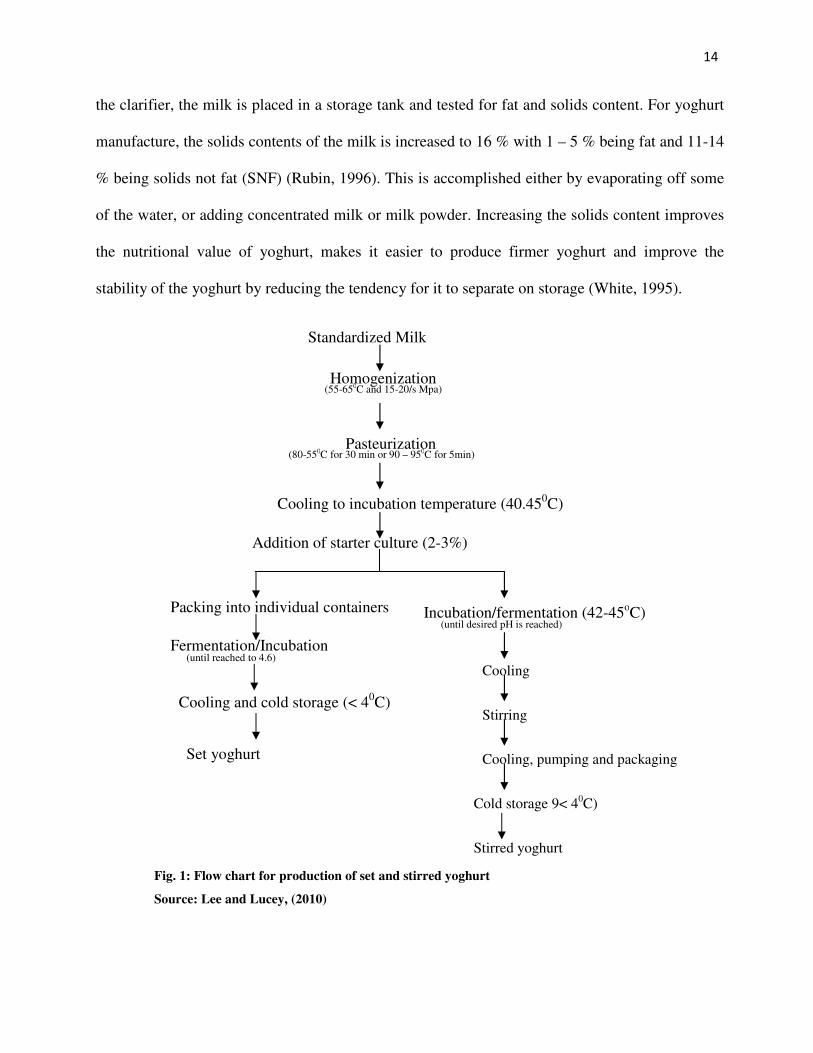
14
the clarifier, the milk is placed in a storage tank and tested for fat and solids content. For yoghurt
manufacture, the solids contents of the milk is increased to 16 % with 1 – 5 % being fat and 11-14
% being solids not fat (SNF) (Rubin, 1996). This is accomplished either by evaporating off some
of the water, or adding concentrated milk or milk powder. Increasing the solids content improves
the nutritional value of yoghurt, makes it easier to produce firmer yoghurt and improve the
stability of the yoghurt by reducing the tendency for it to separate on storage (White, 1995).
Standardized Milk
Homogenization (55-650C and 15-20/s Mpa)
Pasteurization (80-550C for 30 min or 90 – 950C for 5min)
Cooling to incubation temperature (40.450C)
Addition of starter culture (2-3%)
Packing into individual containers Incubation/fermentation (42-45oC)
(until desired pH is reached)
Cooling
Stirring
Cooling, pumping and packaging
Cold storage 9< 40C)
Stirred yoghurt
Fermentation/Incubation (until reached to 4.6)
Cooling and cold storage (< 40C)
Set yoghurt
Fig. 1: Flow chart for production of set and stirred yoghurt
Source: Lee and Lucey, (2010)

15
2.5.2 Pasteurization and Homogenization
After the solids composition has being adjusted and stabilizers are added (Chandan and
Shahani, 1993), the milk is pasteurized. This step has many benefits. First, it would destroy the
entire microorganism in the milk that may interfere with the controlled fermentation process.
Second, it will denature the whey protein in the milk which would give the final yoghurt product
better body and texture (Adolfsson et al., 2004). Thirdly, it helps to release the compounds in milk
that will stimulate the growth of the starter culture (Edward, 2003). Pasteurization involves heating
the milk to a relatively high temperature (82 – 93 oC) and holding it there for 30 to 60 minutes
(Adam and Moss, 1995). After the milk is heat-treated, it is then homogenized.
2.5.3 Homogenization: This is a process in which the fat globules in milk are broken down into
smaller more consistently dispersed particles (Edward, 2003). This produces a much smoother and
creamier product. Homogenization is accomplished by using a homogenizer or viscolizer. In this
machine, the milk is forced through a small orifice at a high pressure of typically 100 – 2000 kg
cm-2
at 50 to 60 oC to reduce the size of the fat globules to below 2 µm (Adam and Moss, 1995).
2.5.4 Fermentation
When pasteurization and homogenization are complete, the heat treated milk is cooled to
fermentation temperature of about 40 oC – 43
oC which is a compromise between the optimal of
the two starter organisms, Streptococcus salivaricus sub species thermophilus ( 39 oC) and
Lactobacillus delbrueckii sub species burglaricus (45 0C) (Adam and Moss, 1995). The starter
culture is added at a level of about 2 % by volume to give an initial concentration of 107 – 10
8 cfu/
ml-1
composed of roughly equal numbers of the two organisms (Adam and Moss, 1995).

16
In general, the milk is fermented at 40 – 45 0C, that is, the optimum growth condition for
the mixed culture – the short incubation method. In some cases the incubation period can be as
short as 2 ½ hours, assuming that the starter culture (3 %) is an active one and the ratio between
the rods and the cocci is well balanced (Tamime and Robinson, 1999). However, the longer
incubation method, (i.e. overnight) can be used and the incubation conditions are 30 oC for around
16 – 18 hours or until the desired acidity is reached.
Adolfsson et al. (2004) reported that fermentation takes about 3 to 4 hours and during this time, the
bacteria metabolizes certain compounds in the milk producing the characteristic yoghurt flavor. An
important bi-product of this process is lactic acid. The lactic acid level is used to determine when
the yoghurt is ready. The acid level is measured by taking a sample of the product and titrating
with sodium hydroxide. A value of at least 7.5 % acidity is the minimum standards for yoghurt
manufacture (NIS, 2004).
2.6 Factors that affect fermentation rate of yoghurt
The fermentation rate of yoghurt is measured by the temperature of the coagulum, sugar
content and concentration of the starter culture used.
2.6.1 Temperature
The most important component in controlling the rate of yoghurt fermentation is
temperature. Temperature affects the rate of yoghurt fermentation through controlling the Growth
rate of the microorganism. As an increase in temperature generally increases the rate of reaction, it
would make sense to hypothesize that an increase in temperature would increase the rate of
fermentation. If the temperature is too low, the culture grows too slowly to adequately acidify milk
and to achieve a good texture. (Boulevard, 2008). The commercial starter is a mixed culture of
Streptococcus thermophilus and Lactobacillus burglaricus. If the temperature is too high, it might

17
end up destroying the cultures. Temperature will affect the taste of the yoghurt produced and the
formations as secretion of metabolites which contribute to the overall taste are dependent on the
growth rate. The temperature range of proper yoghurt fermentation is quite small i.e. from 42 0C to
44 0C. Higher temperatures tend to give sweeter yoghurt as the rate of metabolism is higher. It
will also make the yoghurt to set faster. It is very important that once the desired acidity is reached
the fermentation is halted by low temperatures. This cooling step is of most importance in the
industrial production of yoghurt, if not the taste of yoghurt will be affected (Boulevard, 2008).
Clark (2002) used a hypothesis to prove the effect of temperature on the fermentation rate of
yoghurt. He hypothesized that an increase in temperature would increase the rate of fermentation.
This hypothesis can be investigated by raising or lowering the temperature of different yoghurt
containers to a set temperature and adding starter culture and observing the fermentation reactions
over a set amount of time and by measuring the amount of carbondioxde produced. The yoghurt
container which produces the most acidity will have the highest level of fermentation.
2.6.2 Sugar content
Starter culture is simply the catalyst in the fermentation reaction. It is sugar that is broken
down to produce alcohol and carbondioxide by the action of this starter culture. By this logic, you
would expect the yoghurt with the highest sugar content to be the yoghurt that would yield the
highest level of fermentation. This theory could be tested by checking the sugar content of each
yoghurt, by adding starter culture. Record the release of carbondioxide for a set amount of time
and determine which yoghurt allowed fermentation to take place most readily (Clark, 2002).

18
2.6.3 Starter culture concentration
The starter culture is the catalyst in the fermentation reaction, so it stands to reason that
increasing the quantity of starter culture in the mixture will increase the rate of fermentation by
keeping all the other factors such as temperature, sugar content and size of sample constant.
2.7 Types of Yoghurt
Successful preparation of yoghurt depends upon the proper symbiotic relationship between
the two organisms at equal proportion (Rahman et al., 1999). Strains belonging to the same species
may show more or less marked activities and give clearly different products (Bianchi- salvadori et
al., 1995). Yoghurt is usually classified into different groups depending on the method used during
the production and also the types of ingredients or flavours that are added. The different types of
yoghurt include.
2.7.1 Set style yoghurt
This type of yoghurt, (Figure 1) is characterized by a firm jelly like texture (White, 1995).
It is packaged immediately after inoculation with starter culture, incubated and cooled in the final
package. It is heat-treated in the retail containers at about 85 oC for 30 mins (Chandan and
Shahani, 1993). Set yoghurt is formed in retail pots as lactic acid bacteria ferment lactose into
lactic acid giving a continuous gel structure in the consumer container (Lee and Lucey, 2010). Set
yoghurt exhibits a viscoelastic behavior and highly time dependent shear thinning in flow (Mc
Carthy, 2002).
2.7.2 Stirred style Yoghurt
This type of yoghurt, (Figure 1) is incubated in a tank and the final coagulum is “broken”
by stirring prior to cooling and packaging (Skriver et al., 1993 and White, 1995).Stirred yoghurt is

19
a non- Newtonian fluid, obtained by promoting the growth of Lactobacillus delbrueckii. subsp.
bulgaricus and streptococcus salivarius subsp. thermophilus at a mild temperature (between 40oC
and 43oC ) until a desired acidity level is reached. In stirred yoghurt, milk is inoculated and
incubated in a fermentation tank, the yoghurt gel being broken up during the stirring, cooling and
packaging stages (Aswal et al. (2012).
2.7.3 Drinking Yoghurt
Drinking yoghurt is essentially stirred yoghurt which has a total solid content not exceeding
11 % and which has undergone homogenization to further reduce the viscosity (Goff, 1999).
Flavouring and colouring are invariably added. Heat treatment may be applied to extend the
storage life. High temperature short time (HTST) pasteurization with aseptic processing will give a
shelf-life of several weeks at 2 – 4 oC, while ultra High temperature (UHT) processes with aseptic
packaging will give a shelf- life of several weeks at room temperature (Tamime and Robinson,
1999).
2.7.4 Flavoured Yoghurt
This type of yoghurt is in existence because yoghurt with various flavours and aromas have
become very popular (Ramaswamy and Basak, 1992). The flavours are usually added at or just
prior to filling into pots. Most common additives are fruits or berries, usually as a puree or as
whole fruits in syrup (Tamime and Robinson, 1999). These additives often have as much as 50 %
sugar in them; the use of “fruit sugars” in the form of concentrated apple juice is sometimes found
as a way of avoiding “added sugar” on the ingredients declaration.
2.7.5 Frozen Yoghurt
Frozen yoghurt is classified into three main categories soft, hard or mousse. These products
resemble ice-cream in their physical state and they are characterized simply as having the sharp

20
acidic taste of yoghurt combined with the coldness of ice cream (Tamime and Robinson, 1999).
They also contain high level of sugar and stabilizers/emulsifiers compared with yoghurt since these
compounds are required during the freezing process to maintain the air-bubble structure.
2.7.6 Dried Yoghurt
Dried yoghurt is produced when traditionally natural plain yoghurt which is low on fat is
concentrated, shaped into flat rolls and sun dried. The primary objective of manufacturing yoghurt
in powder form is to store the product in a stable and readily utilizable state (Tamime and
Robinson, 1999). The first attempt to produce dried yoghurt lacked a high viable cell count of
starter culture organism, as well as the pleasant taste, firm body/texture and the attractive
appearance of ordinary yoghurt. Recently, efforts have been made to improve the quality of dried
yoghurt and in general the powder forms are now divided into two different types. In the first type,
the reconstituted yoghurt is incubated for a few hours to allow the coagulation process to take
place, while in the second type the gel is formed within a very short period of time-so- called
instant yoghurt.
2.7.7 Bio – Yoghurt
Bio-yoghurt is yoghurt that is often manufactured for dietetic or therapeutic purposes. The
fact that most stains of Lactobacillus delbrueckii subsp. bulgaricus and Streptococcus
thermophilus do not survive in the intestinal tract maybe a limiting factor if yoghurt is used for
antibiotics therapy or any other medicinal purpose
2.7.8 Fat-substituted Yoghurt
The use of fat substitutes is employed in the manufacture of low fat, light or low calorie
yoghurt to replace the fat in the milk base.

21
2.7.9 Chemically acidified Yoghurt
This type of yoghurt involves the addition of organic acids to milk which results in the
formation of a coagulum at pH < 4.6. The end product is referred to as directly or chemically
acidified yoghurt which resembles yoghurt in appearance, delicate gel, body and texture but it
lacks the typical aroma, flavour and the therapeutic qualities of cultured yoghurt.
2.8 Raw Material/Ingredients in Yoghurt Production
Yoghurt is made with a variety of ingredients including milk, sugar, stabilizers, fruits and
flavours and a bacteria culture (Tamime and Robinson, 1999). Although the consistency, flavour
and aroma may vary from one region to another, the basic ingredient and manufacturing are
essentially consistent. The ingredients and functions are as follows:
2.8.1 Milk
Milk of various animals has been used for yoghurt production in various parts of the world,
(Table 1) but most of the industrialized yoghurt production uses cow’s milk (Goff, 1999), whose
composition from different breeds are shown in table 2. Whole milk, partially skimmed milk, skim
milk or cream may be used. In order to ensure the development of the yoghurt culture the
following criteria for the raw milk must be met.
• Low bacteria count.
• Free from antibiotics, sanitizing chemicals, mastitis milk, colostrums and rancid milk.
• No contamination by bacteriophages.
The sugar in milk known as lactose is fermented to acid (Lactic acid) and it is this that
causes the characteristic curd to form. The acid denatures or spoils the milk protein and sets it
solid. In this process the milk starts to taste sour and its pH drops.

22
2.8.2 Sweeteners and Sugar
Dissaccharide sugars such as sucrose or monosaccharide such as glucose and others which
are high intensity sweeteners (e.g. aspartame) can be used alone or in conjunction to produce the
level of sweetness required. Prior to the incubation, sugar levels greater than 10% should be added
to yoghurt. This is because the changes in osmotic pressure would adversely affect the starter
culture (Keating and White, 1990). The addition of sugar often improves the “body” and mouth
feel of the yoghurt. The main objective of adding sweetening agents to yoghurt is to tone down the
acidity of the product and the level of incorporation is dependent on type of sweetening compound
used, Consumer preference, type of fruit used, possible inhibitory effect on the yoghurt starter
organism, legal aspects, economic consideration (Tamime and Robinson, 1999).
Table 1: Chemical composition (g 100-1
) of milk of different species of mammals
Species Water Fat Protein Lactose Ash
Ass 89.0 2.5 2.0 6.0 0.5
Buffalo 82.1 8.0 4.2 4.9 0.8
Camel 87.1 4.2 3.7 4.1 0.9
Cow 87.4 3.9 3.3 4.7 0.7
Goat 87.0 4.5 3.3 4.6 0.6
Horse 88.8 1.9 2.6 6.2 0.5
Reindeer 63.3 22.5 10.3 2.5 1.4
Sheep 81.6 7.5 5.6 4.4 0.9
Yak 82.7 6.5 5.3 4.6 0.9
Zebu 86.5 4.8 3.3 4.7 0.7
Source: Tamime and Robinson, (1999).

23
Table 2: Commercial composition of cow’s milk (g 100 g-1
) (average expected)
Breed Fat Protein Lactose Ash
Ayrshire 3.85 3.35 4.95 0.69
Friesian 3.40 3.15 4.60 0.73
Guernsey 4.90 3.85 4.95 0.75
Jersey 5.14 3.80 5.00 0.75
Short horn 3.65 3.30 4.80 0.69
Source: Tamime and Robinson, (1999).
2.8.3 Stabilizers
Stabilizers, sometimes referred to as hydrocolloids, are used to prevent the separation of
whey from the yoghurt, a problem known as syneresis (Ramaswamy and Basak, 1992). The
consistency and self stability of yoghurt can be improved by the inclusion of these stabilizers such
as gelatin, food starch, carboxymethylcellulose, locust bean gum, guar gum, alginates,
carrageenans, whey protein concentrate (White, 1995). Hydrophilic colloids would bind water and
consequently increase the viscosity of yoghurt. These stabilizers are used because they do not have
a significant impact on the final flavour.
2.8.4 Fruits and Flavours
These include natural and artificial flavouring, colour, etc. These are added in order to
improve taste and provide a variety of flavours. The popular fruits added include blueberries,
banana, strawberries and peaches but almost any fruit can be added (Keating and White, 1990).
Other fruits and flavourings which can be added include vanilla, chocolate, coffee and even mint.
2.8.5 Starter culture
The starter culture for most yoghurt production is a symbiotic blend of Streptococcus
salivarius subsp. thermophilus (ST) and Lactobacillus delbrueckii subsp. bulgaricus (LB).

24
Although they can grow independently, the rate of acid production is much higher when used
together than either of the two organisms grown individually. Streptococcus thermophilus (ST)
grows faster and produces both acid and carbon dioxide (Goff, 1999). The formate and carbon
dioxide produced stimulate Lactobacillus bulgaricus (LB) growth. On the other hand, the
proteolytic activity of LB produces stimulatory peptides and amino acids for use by ST. These
microorganisms are ultimately responsible for the formation of typical yoghurt flavour and texture
(Goff, 1999). The yoghurt mixture coagulates during fermentation due to the drop in pH. The
streptococci are responsible for the initial pH of the yoghurt mix to approximately 5.0. The
Lactobacilli is responsible for a further decrease in pH to 4.0.
Lactic acid bacteria are widely distributed in nature and their nutritional requirements are
very complex (Tamime, 1999). S. thermophilus and L.delbrueckii subsp. Bulgaricus and many
other lactic acid bacteria are unable to synthesize a full complement of amino acids and this
deficiency dictates their natural habitat. Milk is a nutritionally rich medium which will support the
growth of many microorganisms but the processing of milk provides control over the type of
growth necessary to achieve a desirable product (Chandrakanth et al., 1993).
2.9 Role of stabilizers in Yoghurt Production
Stabilizers and/or emulsifiers or hydrocolloids are used during the manufacture of some
dairy products, but in yoghurt making only stabilizers are added to the milk base. These stabilizers
are classified as follows:
• Natural gums (those found in nature such as tree gums)
• Modified natural or semi-synthetic gums (i.e. chemically modified natural gums or gum-like
materials).
• Synthetic gums (those prepared by chemical synthesis).

25
For the purpose of this work, natural gums, (tree gums) and modified natural or semi-
synthetic gums will be used. They are Gum acacia, gum tragacanth which are classified as natural
gums and carboxymethlcellulose classified as modified gums.
Tree gums: These form the hydrophilic part of “gum trees” secretion. Examples are Acacia gum,
karaya, tragacanth, gum Arabic, etc.
Acacia gum (also known as gum Arabic): is an all-natural sap that exudes from stems and
branches of Acacia trees (Leguminosae) which grows in the Sahel zone of Africa. The only two
botanical species allowed for food application are Acacia Senegal and Acacia seyal (Baray, 2009).
The former is used most, yielding gum Arabic or ‘Senegalese gum’.
Acacia gums are neutral or slightly acid salts of poly sugars, with a very complex branched
structure, made up of 5 monosaccharides in variable proportion (Alais and Linden, 1999). This
natural polysaccharide is made up of neutral sugars and uronic acids (95 % of the dry weight),
protein (1 % to 2 %) depending on the species (Baray, 2009).
Karaya or Tragacanth: This is an Indian tree which yields a similar sort of gum like the acacia
gum. It replaces tragacanth gum, which comes from a bush found in semi-desert regions, which is
more costly and has a different chemical structure (Alais and Linden, 1999).
The ability of polysaccharides to produce high viscosity in water at low concentrations is a
major property of polysaccharides that gives them valuable and widespread use in the food and
non-food industries. Polysaccharide gums have mainly been used for thickening, modification of
texture, gelling, formation of protective films and for stabilization of emulsion, foams and
suspensions (Kossori et al., 2000; Euston and Hirst, 2000).
The primary aim of adding stabilizers to the milk base is to enhance and maintain the
desirable characteristics in yoghurt, for example body and texture, viscosity/consistency,

26
appearance and mouth feel (Tamime and Robinson, 1999). This is because the yoghurt coagulum
is often subjected to mechanical treatment during manufacture such as:
• Stirring of the coagulum in the fermentation tank at the end of the incubation period or for in-
tank cooling.
• Pumping of the coagulum to a plate/tubular coolers.
• Mixing to incorporate the fruit/flavours into the coagulum, followed by pumping to the
filling/packaging machine.
• Subsequent post fermentation heat treatment of the coagulum for the manufacture of
pasteurized, ultra high temperature (UHT) or long-life yoghurt and as a result the yoghurt may
become less viscous, or in extreme cases may show whey separation, so the addition of
stabilizers can overcome these defects. Therefore, the mode of action of stabilizers which are
sometimes referred to as hydrocolloids in yoghurt includes the binding of water and promotion
of an increase in viscosity (Tamime and Robinson, 1999).
Some classification and functions of stabilizers/gums that could be used in the manufacture
of yoghurt is shown in the table 3.
It is note worthy to mention that different stabilizers have been used at different concentrations to
produce yoghurt and yoghurt like products and it all gave good quality yoghurt.
Alakali et al. (2007) reported that the addition of carboxymethylcellulose at the levels of
0.50, 0.75, and 1.00 depressed the production of lactic acid; also the addition of gelatin did not
impede the production of titratable acidity. Also, corn starch had less inhibitory effect on the
production of titratable acidity compared to gelatin and carboxymethylcellulose at similar levels or
concentrations (Alakali et al. 2007). The addition of special stabilizers is sometimes recommended
but on average of < 1 g 100 g-1
is added depending on the type used.

27
• Carrageenan and starch plus citrate
• Xanthan and guar gum mixture at a ratio of 2:1 plus sodium phosphate.
• The use of Gelodan which is a mixture of starch, pectin, gelatin and milk proteins.
• Agar, carrageenan or pectin plus citric acid.
• However, Petersen (1989) reported that carrageenan is added as a texturiser and to rebuild the
rheological properties of the product after heating (Tamime and Robinson, 1999). Also, Jimoh
and Kolapo (2007) reported that cassava starch and corn starch which were used to produce
soy-yoghurt showed that the stabilizers prevented whey separation on storage though there was
evidence of gas production on the 8th
day of storage, therefore this result suggested cassava
starch as a probable alternative stabilizers in soy-yoghurt production.

28
Table 3: Classification and functions of Gums which could be used during the manufacture of Yoghurt
Natural Modified Synthetic
Plant
Exudates
Arabic
Tragacanthb
Karayab
Extracts
Pectin
Seed flour
Carob
Guar
Sea weeds
Extracts
Agar
Alginates
Carrageenanb
Furcelleranb
Cereal starches
Wheat
Corn
Animal
Gelatin
Casein
Vegetable
Soy protein
Cellulose Derivatives
Carboxymethylcellulose
Methylcellulose
Hydroxyethylcelluslose
Hydroxypropylcellulose
Hyroxypropylmethylcellulose
Microcrystalline cellulose
Microbial Fermentation
Dextran
Xanthanb
Miscellaneous Derivatives
Low-methoxy pectin
Propylene glycole alginate
Pregelatinised starches
Modified starches
Carboxymethyl starch
Hydroxyethyl starch
Hydroxypropyl starch
Polymers
Polyvinyl derivativesa
Polyethylene derivatives
a = Limited in their application in yoghurt
b = stabilizers permitted by FAO/WHO (1990) and the permitted level (singly or combination with others)
is 5 g/kg except for pectin, gelatin and/or starch derivatives where it is 10 g/kg
Source: Tamime and Robinson, (1999).

29
2.10 Nutritional and Health Benefits
Yoghurt is nutritionally rich in protein, calcium, riboflavin, vitamin B6 and vitamin B12
among others. It has nutritional benefits beyond those of milk. Also the nutritional composition of
yoghurt is affected by the species and strains of bacteria used in the fermentation, the source and
type of milk solids that maybe added before fermentation and the temperature and duration of the
fermentation process. Since dairy products are excellent sources of high quality protein, calcium,
potassium, phosphorus, magnesium, Zinc and B vitamins, a much greater loss of vitamins than
minerals may occur during processing of yoghurt because vitamins are more sensitive to changes
in environmental factors than are minerals. Heat treatment and pasteurization, ultra filtration,
agitation and oxidative conditions are some other factors that are important during the processing
of milk and are known to have an adverse effect on the vitamin content of yoghurt. The vitamin
content of milk and yoghurt is shown in Table 4. The relative availability of vitamins in yoghurt is
much more difficult to assess because unlike minerals, many vitamins are sensitive to the
conditions of processing. Thus, the method of fortification for example, the addition of milk
powder or membrane processing, the heat treatment of the milk base, the strains of starter bacteria
used and the conditions of fermentation can all alter the concentrations of the more important
vitamins (Noh et al., 1994).
The specie or strain of bacteria culture used during fermentation process can also influence
the vitamin content of the yoghurt. For instance, B vitamin that is utilized by lactic acid bacteria is
vitamin B12 and loss of vitamin B12 can be corrected by the careful use of supplementary lactic acid
bacteria culture that are capable of synthesizing vitamin B12 (Kneifel et al., 1993).

30
Table 4: Vitamin contents of milk and yoghurt
Vitamins (Units/100 g) Milk Yoghurt
Whole Skim Full fat Low fat
Vitamin A(IU) 148 - 140 70
Thiamin (B1) (µg) 37 40 30 42
Riboflavin (B2) (µg) 160 180 190 200
Pyridoxine (B6) (µg) 46 42 46 46
Cyanocobalamine (B12) (µg) 0.39 0.4 - 0.23
Vitamin C (mg) 1.5 1.0 - 0.7
Vitamin D (IU) 1.2 - - -
Vitamin E (IU) 0.13 - - Trace
Folic acid (µg) 0.25 - - 4.1
Nicotin acid (µg) 480 - - 125
Pantothenic acid (µg) 371 370 - 380
Biotin (µg) 3.4 1.6 1.2 2.6
Choline (mg) 12.1 4.8 - 0.6
Source: Tamime and Robinson, 1999.
Some lactic acid bacteria species synthesize folate and depending on the strain used, the folate
content of yoghurt can vary widely ranging from 4 to 9 µg/100 g (Kneifel and Mayer, 1991). It is
of interest that certain B group vitamins are synthesized by the starter culture. Kniefel et al. (1993)
monitored these vitamins in yoghurt during fermentation and they concluded that using short time
(i.e. 3 – 4 hours) incubation at 42 0C, the starter cultures enriched the vitamins during fermentation
by more than 20 %. It was also observed that fermenting milk at 30 0C for 14 – 16 hours led to a
lower production of folic acid, but an increased concentration of thiamin and nicotinic acid.
Therefore, it is important to use selected strains of the yoghurt starter cultures and processing
conditions in order to maintain the nutritional properties of yoghurt.
Folic acid (vitamin B9) is the most important vitamin for some lactic acid bacteria. Folic acid
produced by S. thermophilus in milk fermentation, is subsequently used for growth of L.

31
bulgaricus. By selecting high folic acid-producing strains or by using relatively high amounts of S.
thermophilus compared to L.bulgaricus, manufactured yoghurts could contain high folic acid
(Tamime and Robinson, 1999). Since folic acid is an essential component in human nutrition, it is
important to get enough folic acid in diet. However, it is conspicuously absent at very low levels in
many food products, so yoghurts manufactured using high folic acid producing strains have critical
importance
Proteins in yoghurt are of excellent biological quality, as compared to that in milk, because
the nutritional value of milk proteins is well preserved during the fermentation process (Buttriss,
1997). Proteins from yoghurt are more easily digested than protein from milk as bacteria
predigestion of milk protein in yoghurt may occur (Kneifel et al., 1993). This is supported by
evidence of a higher content of free amino acid, especially proline and glycine in yoghurt than in
milk (Beshkova et al., 1998).
Minor amounts of free fatty acids are released as a result of lipase activity. This is as a result of the
biochemical changes that occur in the milk fat during fermentation process (Chandan and Shahani,
1993). Yoghurt, however, has been shown to have a higher concentration of conjugated linoleic
acid, a long chain biohydrogenated derivatives of linoleic acid, than does the milk from which the
yoghurt was processed (Shantha et al., 1995).
Most dairy products such as milk, yoghurt and cheese provide most of the highly
bioavailable calcium in the typical western diet (Buttriss, 1997). Yoghurt is also an excellent
source of calcium and phosphorus and the acidic pH of yoghurt ionizes calcium and thus facilitates
intestinal calcium uptake.
Yoghurt is not just a food accompaniment, a dessert or mainly a diet food, it is considered
as health food because of its therapeutic value (Elson and Haas, 2005). There is growing evidence

32
that yoghurt is packed with microscopic warriors-beneficial bacteria that are for good health.
People who are moderately lactose intolerant can consume yoghurt without ill effects, because
much of the lactose in the milk precursors is converted to lactic acid by the bacterial culture.
Yoghurt containing the ‘live cultures’ is sometimes used in an attempt to prevent antibiotic
associated diarrhea (Ripudaman and Beniwal, 2003). Increased yoghurt consumption enhances
immune response which in turn increases resistance to immune related disease (Granessha, 2005).
A study published in the International Journal of Obesity also found that the consumption of low
fat yoghurt can promote weight loss, especially due to the calcium in the yoghurt. Other health
benefits derived from consuming yoghurt containing active cultures include the prevention of
intestinal infections, improved urogenital health, therapeutic effects on colon cancer as suggested
by epidemiologic evidence and animal studies (Wollowski et al., 1999) among others. The
nutritional composition of yoghurt is shown in Table 5. Some of the typical values of the major
constituents of milk and yoghurt are shown in Table 6.
Table 5: Nutritional Composition of Yoghurt
Nutritional value per 100 g (3.5 0z)
Energy 257KJ (61 kcal)
Carbohydrate 4.7 g
Fat 3.3 g
- saturated 2.1 g
- mono saturated 0.9 g
Protein 3.5 g
Vitamin A equivalent 27 µg (3 %)
Riboflavin (vitamin B2) 0.14 mg (9 %)
Calcium 121 mg (12 %)
Lactose content diminishes during storage
Percentage is relative to US recommendation for adults
Source: Wikipedia, (2011c).

33
Table 6: Some of the typical values of the major constituents of milk and yoghurt (all
units 100 g-1
)
Constituents Milk Yoghurt
Whole Skim Full fat Low fat Low fat Fruits
Water (g) 87.8 91.1 81.9 84.9 77.0
Energy (Kcal) 66 33 79 56 90
Protein (g) 3.2 3.3 5.7 5.1 4.1
Fat (g) 3.9 0.1 3.0 0.8 0.7
Carbohydrate (g) 4.8 5.0 7.8 7.5 17.9
Calcium (mg) 115 120 200 190 150
Phosphorus (mg) 92 95 170 160 120
Potassium (mg) 140 150 280 250 210
Zinc (mg) 0.4 0.4 0.7 0.6 0.5
Source: Holland et al., (1991) and Buttriss, (1997).
2.11 Yoghurt and Health
The Lactic acid bacteria in yoghurt are tolerant of a low pH, whereas most bacteria show
optimum growth and metabolism around neutrality. Therefore, as the acidic yoghurt passes along
the intestine, the lactic acid in the food and perhaps, that still being secreted by the bacteria would
kill the undesirable micro flora. Secondly, it was further suggested that this effect of the yoghurt
was enhanced by the ability of L. delbrueckii subsp. bulgaricus to become established in the
intestine, and gradually to dominate the resident micro flora. This latter change ensured the
continued absence of the putrefactive organisms even during periods of reduced yoghurt
availability and hence the vitality of the consumer would be maintained (Tamime and Robinson,
1999).

34
2.12 Vitamin metabolism in yoghurt
Milk contains both fat and water soluble vitamins. Table 7 indicates the levels of these
vitamins in different milk and in the corresponding yoghurt. The content of these vitamins changes
during manufacture for the following reasons.
1. An excess of dissolved oxygen and or a moderate heat treatment of milk can reduce
significantly its vitamin content and the most susceptible vitamins are C, B6, B12 and folic
acid.
2. Excessive heat treatment of the milk can even cause greater loss of the vitamins e.g. B12.
3. The yoghurt starter bacteria utilize some of the vitamins present in milk during the
fermentation period to meet their growth requirements. This factor contributes, to some
extent, to a reduction in the nutritional properties of the product. However, the quantities
consumed are dependent on the rate of inoculation, the strain of yoghurt starter and the
conditions of fermentation (Friend et al., 1983).
During yoghurt manufacture, Reedy et al. (1976) observed losses of folic acid and vitamin
B12, respectively during the storage of yoghurt at 5 oC for 16 days. The same author also observed
a decrease in the biotin content. They attributed these losses to the combined effect of microbial
catabolism during the incubation period and chemical decomposition of these vitamins during cold
storage. These losses were contributed in yoghurt made by the direct acidification method rather
than by microbial fermentation (Sharma et al., 1996; Saidi and Warthesen, (1993).

35
Table 7: Vitamin contents of different milks and yoghurtsa
Vitamin/units Cow Cow Goat Sheep Soya
SS milkb Yoghurt
c Milk
d Yoghurt
e Milk Yoghurt Milk Yoghurt Milk Yoghurt
I. (µg 100 g-1
)
Retinol 1 8 52 28 44 N 88 86 0 23
Carotene Tr 5 21 21 Tr Tr Tr Tr Tr Tr
Vitamin D Tr 0.01 0.03 0.04 0.11 N 0.18 0.24 0 0
Vitamin B12 0.4 0.2 0.4 0.2 0.1 Tr 0.6 0.2 0 0
Folate 5 17 6 18 1 7 5 3 19 N
Biotin 1.9 2.9 1.9 2.6 3 0.5 2.5 N N N
II. (mg 100 g-1
)
Vitamin E Tr 0.01 0.09 0.05 0.03 0.03 0.11 0.73 0.74 1.49
Thiamin 0.04 0.05 0.03 0.06 0.04 0.04 0.08 0.05 0.06 N
Riboflavin 0.17 0.25 0.17 0.27 0.13 0.17 0.32 0.33 0.27 N
Niacin 0.09 0.15 0.08 0.18 0.31 0.27 0.41 0.41 0.11 N
Tryptophan 60 0.78 1.20 0.75 1.33 0.73 0.83 1.27 1.27 0.52 0.88
Vitamin B6 0.06 0.09 0.06 0.10 0.06 0.06 0.08 0.08 0.07 N
Pantothenate 0.32 0.45 0.35 0.50 0.41 0.23 0.4 0.45 N N
Vitamin C 1 1 1 1 1 1 1 1 0 0
a Plain or natural yoghurt.
b Semi-skimmed milk (1.6 g fat 100 g
-1).
c Low fat yoghurt (0.8 g fat 100 g
-1).
d Full fat milk (3.9 g
fat 100 g-1
). e Full fat yoghurt (3.0 g fat 100 g
-1).
f The product may be fortified with retinol and vitamin E.
Tr: Trace.
N: Nutrient is present in significant quantities, but there is no reliable information on the amount.
Source: Tamime and Robinson, (1999)
Kneifel et al. (1993) reported that a long incubation of yoghurt (i.e. incubation at 30 oC for
14 – 16 hours) decreased the synthesis of folic acid, but increased the content of nicotinic acid in
the product. Furthermore, it was found that vitamin which increases during the actual manufacture
of yoghurt are niacin and folic acid, because they are actively synthesized by the starter cultures
(Tamime and Robinson, 1999).

36
2.13 Biosynthesis of Niacin
Niacin activity is exhibited by nicotinic acid and nicotinamide (Figure 2). The former
compound constitutes part of the structure of two important co-enzymes, that is, nicotinamide
adenine dinucleotide (NAD) and nicotinamide adenine dinucleotide phosphate (NADP). These two
co-enzymes are composed of adenylic acid and nicotinamide riboticle linked through thin
phosphate groups however; NADP contains an additional phosphate group. As NAD and or NADP
are essential for many oxidative/ reductive biochemical reactions, the niacin synthesized by S.
thermophilus and L. delbrueckii subsp.bulgaricus may originate from the nicotinamide fraction
arising during the formation of NAD and/or NADP. The biosynthesis of these nucleotides
basically involves the following steps:
1. The synthesis of sugar moiety (possibly derived from available milk sugars)
2. The synthesis of the pyrimidine or purine base.
Alternatively, after this formation of NAD and/or NADP, the nicotinamide fraction could be
released as a result of the degradation of these nucleotides but whether nicotinic acid could be
achieved from the released nicotinamide must be subject to further investigation.
However, nicotinic acid is derived by a few bacteria from the metabolism or breakdown of
tryptophan, a pathway which is dependent on the availability of certain vitamins (e.g. thiamine,
riboflavin and vitamin B6), to activate the required enzymes (Lenter, 1986). As S .thermophlius
and L.delbrueckii subsp. bulgaricus utilize these vitamins and tryptophan does not accumulate
during yoghurt production, it is possible that these organisms use the vitamins for the synthesis of
niacin.

Fig. 2: Some possible Scheme for the biosynthesis of niacin by yoghurt micro
Source: Tamime and Robinson, (1999)
: Some possible Scheme for the biosynthesis of niacin by yoghurt micro
Robinson, (1999)
37
: Some possible Scheme for the biosynthesis of niacin by yoghurt micro-organism

38
CHAPTER THREE
MATERIAL AND METHODS
3.1 Materials
The materials include:
Milk (peak)
Granulated sugar
Yoghurt culture (yogomet)
The stabilizers used in this study were carboxyl methylcellulose (CMC), Gum acacia and Corn
starch and these were purchased from Ogige market Nsukka, Enugu State. Other equipments used
were: Blender, muslin cloth, sterile bottles and plastic containers for packaging, measuring
cylinder, beakers, sterile pots, hot plate.
3.2 Source of Raw materials
All the raw materials were purchased from Ogige main market in Nsukka, Enugu State of
Nigeria.
3.3 Methods of Production/Processing
3.3.1 Preparation of yoghurt mix
Dried milk sample (250 g) was dissolved in water and made up to 2 litres to produce an
equivalence of fresh milk. To these two litres was added 10 g of sugar and mixed properly. This
represented the control containing no stabilizer (sample A). Six additional yoghurt mixes were
produced in the same way as sample A, but they contained different types of stabilizers at different
concentrations. One mix was homogenized with 0.5 % (10 g) of CMC (v/w) (sample B1) while
another was homogenized with 1 % (20 g) CMC (v/w) and called sample B2. Also, the third mix

39
was homogenized with 0.5 % (10 g) of corn starch (v/w) and designated as sample C1 while the
fourth mix was homogenized with 1 % (20 g) of corn starch (v/w) and designated as sample C2.
The fifth mix was homogenized with 0.5 % (10 g) of gum acacia (v/w) and designated as sample
D1 and the sixth mix was homogenized with 1 % (20 g) of gum acacia (v/w) and designated as
sample D2. The ingredients combinations for the yoghurt mixes are as shown in Table 8.
3.3.2 Production of Fresh Yoghurt Samples
Each yoghurt mix with its stabilizer proportion was pasteurized at 80 oC for 60 seconds to
hasten hydration and solubilization of the solid ingredients and more importantly, destroy
organisms present in the mix. This was followed by homogenization of the yoghurt sample using a
blender which helped to homogenize all the ingredients especially the stabilizers and also helped to
break down fat globules in milk into smaller more consistently dispersed particles which gave a
smoother and creamier product. Cooling to inoculation temperature of 40- 43 oC allowed to
achieve the cooling effect that is suitable for the culture. Inoculation with starter culture was done
with 2 % of yogomet culture (Streptococcus thermophilus and Lactobacillus bulgaricus). After
inoculation with yogomet each sample was divided into 2 portions of one litre each. Each one litre
of the sample was dispensed into 10 incubation plastic bottles of 100 ml. The first set of I litre
from each sample was used to produce short set yoghurt by incubating at 40-43 oC for 5 hours
while the other portion of 1 litre from the same sample was used to produce long set yoghurt by
incubating at room temperature of 30 oC ± 2
oC for 24 hours. Soon after homogenizing with
yogomet, samples were withdrawn from each portion of 1 litre for analysis for the zero hour of
incubation. Thereafter, samples were withdrawn at intervals of 1 hour within the fermentation
period of 5 hours for short set yoghurt and 4 hours interval fermentation period of 24 hours for
long set yoghurt. Parameters analyzed were moisture content, ash content, fat content, crude

40
protein, viscosity, titratable acidity, pH, and vitamin B3 and these were analyzed at each sampling
interval for both short and long set yoghurts. The production flow chart is as shown in Fig 3.
Table 8: Ingredient mixes for production of yoghurt sample *
Sample
code
Stabilizer Stabilizer
concentrations g
(%)
Liquid milk+ (ml) Yogomet
(starter
culture)
Sugar
A Control (No stabilizer) 0.00 2000 10 g 10g
10g
B1 CMC 10 g (0.5 %) 2000 10 g 10g
B2 20 g (1.0 %) 2000 10 g 10g
10g
C1 Corn Starch 10 g (0.5 %) 2000 10 g 10g
C2 20 g (1.0 %) 2000 10 g 10g
10g
D1 Gum Acacia 10 g (0.5 %) 2000 10 g 10g
D2 20 g (1.0 %) 2000 10 g 10g
1. + Liquid milk produced by dissolving 250 g powdered milk + 10 g of sugar and made up to 2 litres with water.
2. *Each sample was further divided into two portions and one portion was used to produce short set yoghurt
while the other was used to produce long set yoghurt.

41
Whole milk + sugar
Addition of stabilizers
CMC
0.5 % 0 % 1.0 %
Corn Starch
0.5 % 0 % 1.0 %
Gum Acacia
0.5 % 0 % 1.0 %
Pasteurization (80 oC for 60 secs)
Fig 3: Flowchart for the production of set style yoghurt
Homogenization
Cooling to inoculation temperature (40 – 43 oC)
Inoculation with starter culture
Packaging into small retail bottles
Fermentation in individual sealed containers
Short set yoghurt
(41 ± 1 oC for 5 h)
Long set yoghurt
(30 ± 2 oC for 24 h)

42
3.4 Analysis of Samples
The following analyses were carried out on the various samples.
3.4.1 Determination of pH
A standard pH meter (model 20pH conductivity meter, Denver Instrument, United Nations
Inventory Database), beakers, pH meter, buffer solution was used for the determination. The pH
meter was standardized using buffer solutions of pH 4.0 and 9.0. The pH electrode was dipped into
the yoghurt and after a few minutes of equilibration, the pH of the yoghurt sample was taken.
3.4.2 Determination of Titratable Acidity
Beakers, conical flask, Pipette, distilled water, sodium hydroxide solution, Phenolphthalein
indicator was used for the determination. The total titratable acidity was determined using the
AOAC method (2010). The sample (5 ml) at 25 oC was measured into a flask and diluted to twice
its volume with distilled water. Phenolphthalein indicator (2 ml) was added to each yoghurt
sample and titrated with 0.I M NaOH to the first permanent pink colour. The acidity was reported
as the percentage lactic acid by weight
Titratable acidity (%) =sampleyoghurtofQuantity
xxmlNaOHofQuantity 100009.0)(
3.4.3 Determination of Apparent Viscosity
The viscosity was determined by using 10 % (w/v) of each of the different yoghurt samples. The
determination was done with a viscometer according to the manufacturer’s instruction.
3.4.4 Determination of Total solids
The total solids content of the freshly prepared yoghurt with different concentrations of stabilizers
was determined using AOAC (2010). The sample (5 g) was dried to a constant weight in hot air
oven (Gallenkamp) at 130 oC. Then the total solid content was obtained as percentage (%) total
solids.

43
3.4.5 Determination of Ash content
The ash content of the freshly prepared yoghurt samples was determined according to the
standards of AOAC (2010). A preheated and cooled crucible was weighed (W1) and 2 gram
sample was weighed into the preheated cooled crucible (W2). The sample was charred on a Bunsen
flame inside a fume cupboard. The charred sample in the crucible was transferred into a preheated
muffle furnace at 550 oC for 2 hours until a white or light grey ash was obtained (W3). It was
cooled in a dessicator, weighed and documented.
T1 Ash content 10012
13 xWW
WW
−
−=
Where
W1 = weight of empty crucible
W2 = weight of crucible + weight of sample before ashing
W3 = weight of crucible + weight of sample after ashing
3.4.6 Determination of Moisture Content
The moisture content of the samples was determined according to the standard method of
Association of official Analytical Chemist (AOAC, 2010). The crucibles were washed thoroughly
and afterwards dried in the oven at 100 oC for 1 hour. The hot dried crucibles were cooled and then
noted down (W1). The sample (2 g) was weighed into the crucible (W2) and dried at 70 oC until a
constant weight was obtained (W3)
% moisture content = 10012
32 xWW
WW
−
−=
Where
W1 = Initial weight of empty crucible
W2 = weight of crucible + weight of sample before drying
44
W3 = weight of dish + weight of sample after drying
3.4.7 Determination of fat content
The fat content of the yoghurt samples was determined using the standard AOAC (2010)
method. A Soxhlet extractor with a reflux condenser and a 500 ml round bottom flask was fixed.
The yoghurt sample (2 g) was weighed into a labelled thimble and petroleum ether (300 ml) was
filled into the round bottom flask. The extraction thimble was sealed with cotton wool. The
Soxhlet apparatus after assembling was allowed to reflux for about 6 hours. The thimble was
removed with care and the petroleum ether collected on the top and drained into a container for
reuse. When the flask was free of ether, it was removed and dried at 70 oC for 1 hour in an oven. It
was cooled in desiccators and then weighed.
% fat content 1
100x
sampleofweight
fatofweight=
3.4.8 Determination of crude Protein
The protein content of the samples was determined according to the standard methods of AOAC
(2010), using Kjeldahl’s method.
a. Digestion of the sample
The yoghurt sample (5 ml) was weighed into Kjeldahl digestion Flask, and addition of 1
tablet of Kjeldahl catalyst was followed. Twenty five milliliters (25 ml) of concentrated H2SO4
was added with few boiling chips. The flask with its content was heated in the fume chamber until
a clear solution was obtained. The solution was cooled to room temperature after which it was
transferred into a 250 ml volumetric flask and made up to the level with distilled water.

45
b. Distillation
The distillation unit was cleaned and the apparatus set up. A 100 ml conical flask
(receiving flask) containing 5 ml of 2 % boric acid was placed under the condenser with the
addition to 2 drops of methyl red indicator. A digest of 5 ml was pipetted into the apparatus
through the small funnel, washed down with distilled water followed by the addition of 5 ml of 60
% NaOH (sodium hydroxide) solution. The digestion flask was heated until 100 ml of distillate
(ammonium sulphate) was collected in the receiving flask. The solution in the receiving flask was
titrated with about 0.04 M HCl to get a pink colour. The same procedure was carried out on the
blank.
% Nitrogen of yoghurt sample (%N) 1000401.0 xxW
xNacidVVs b−
Where
Vs = volume (ml) of acid required to titrate the sample
Vb = volume (ml) of acid required to titrate the blank
Nacid = Normality of acid (0.1N)
W = Weight of sample in gram
% crude protein = % N x 6.25 (conversion factor)
3.4.9 Determination of Niacin (Vitamin B3)
Reagents and Solvents
All the chemicals and reagents used were of analytical grade and included HPLC grade methanol,
water, acetonitrile (ACN) and Trifloroacetic acid (TFA).
Standard preparation
Standard stock solution for nicotinamide was prepared by dissolving 10 mg of the nicotinamide
salt in 10 ml distilled water in a sample bottle to obtain a concentration of 1 mg/ml (1000 µg/ml)

46
of stock solution. The working standards for single standard was prepared from 0.1 mg/ml stock
solution by taking 1 ml of 1 mg/ml concentration of the stock solution and adding 9 ml of water
which is 100 µg/ml (0.1 mg/ml) for different concentrations of serial dilution of standards for 100,
50, 25, 10, 5 µg/ml, respectively which was then put in a vial and run in order to obtain suitable
calibration curve.
Water soluble Vitamins analysis
Simultaneous extraction of nicotinamide in the yoghurt samples was carried out, buffer preparation
and HPLC conditions for water soluble vitamins analysis was as described by Junaid et al., (2008),
with some slight modifications in the HPLC conditions. 10 ml of each yoghurt sample was
weighed out and thoroughly shaken. The final volume was made up to 20 ml with distilled water in
a beaker and put in a centrifuge at 360 rpm for 10 min. Thereafter, the samples were filtered using
double filter paper of 5 mm size.
Buffer preparation
Trifloroacetic acid (TFA) (0.5 ml) was dissolved in 500 ml of water to get 0.1 % TFA, 5 ml of
acetonitrile HPLC grade was added to the solution. The mobile phase consisted of a mixture of 0.1
% TFA and Acetonitrile HPLC grade in the ratio of 98: 2.
HPLC analysis
The Vitamin B3 contents of the samples were determined by reversed – phase high performance
liquid chromatography technique using Agilent 1100 series Model HPLC system equipped with
degasser quaternary pump, auto sampler, UV detector and column (Zorbax XDB- C8, 100 × 4.6
mm, and 5 µm particle size) in an isocratic elution mode and at a constant flow rate of 1 ml/min
using Agilent pump. The separation conditions for nicotinamide were tabulated in table 9. Stable

47
operating LC conditions were established before HPLC analysis by equilibrating for 30 min with
mobile phase (approximately 1 ml/min). Standard blanks respectively were injected before
analysis to confirm absence of chromatographic activity at retention time for the vitamins.
The individual peaks in the samples were identified by comparison of retention times to the
standard. The concentration of Vitamin B3 mg/ml of the fresh yoghurt samples was calculated
using the formula
Vitamin concentration (mg/ml)=(á+b)×Is×v/Iv/wt/1000
Where á = peak area of vitamin
b = Intercept
Is = inverse of slope
v = volume of filtrate (ml)
Iv= injection volume (µg/ml)
Wt = sample weight (ml)
Table 9: HPLC conditions for separation and identification of Nicotinamide in yoghurt
samples
HPLC Conditions
Parameters Water soluble vitamins (ACN -TFA extraction)
Mobile phase Acetanitrile HPLC grade + TFA (Trifloroacetic acid)
0.1% TFA: ACN
98: 2
Flow rate 1ml/min
Temperature 300C
Column Zorbax Eclipse XDB-C18 (100 x 4.6mm), 5um
Injection Volume 20µ1
Detection 254nm
3.5 Microbial Analysis
Microbiological analysis was carried out on the yoghurt samples. A serial dilution of the
sample was done. The sample was placed at ambient temperature. Total viable count was

48
performed at intervals of 1 hour within the fermentation period of 5 hours for short set yoghurt and
4 hours interval fermentation period of 24 hours for long set. Total viable count (TVC) and mould
count was determined by pour plate method on nutrient agar and Sabaroud Dextrose Agar (SDA)
respectively as described by Prescott et al., (2005).
3.6 Sensory Evaluation
The sensory evaluation was carried out according to Ihekoronye and Ngoddy (1985) using
a 20 man semi-trained panelist. The panelists were instructed to indicate their preference of the
samples. According to Iwe (2002), a nine-point Hedonic scale, where 9 was the highest score and 1
was the lowest score for each characteristic such as colour, flavour, mouth feel, and overall
acceptability was determined.
3.7 Data Analysis
The experimental design was laid out in a split-plot design. Analysis of variance was
conducted on the obtained data using GENSTAT RELEASE 10.3 DE. Least significant difference
(LSD) was used to compare the treatment means. Statistical significance was accepted at (p < 0.05)
(Steel and Torrie, 1980).

49
CHAPTER FOUR
RESULT AND DISCUSSION
4.1 Effect of Stabilizers on the Physicochemical Characteristics of short set and long set
Yoghurt
4.1.1 Moisture Content of Short Set and Long Set Yoghurt
The moisture contents of short set (Fig.4) and long set yoghurt (Fig.5) prepared with
three different stabilizers carboxyl methylcellulose (CMC), corn starch and Gum acacia, show
significant differences (p < 0.05). The values ranged from 85.52 ±1.60 % to 84.44±1.65 % and
85.34±1.44 % to 83.97±1.83 % for short set and long set yoghurts, respectively.
The CMC stabilized sample had the lowest moisture content (84.44±1.64 %, 83.97±1.38
%) while sample stabilized with Gum Acacia had the highest moisture content (85.52±1.60 %,
85.34±1.44 %) for short set and long set yoghurts, respectively. The low moisture content could
be attributed to the ability of CMC to increase the viscosity of the sample which makes it to
exhibit useful properties of thickening, stabilization in agreement with Davidson, 1980. On the
other hand, gum acacia has higher water solubility (up to 50 % w/v) and relatively low viscosity
compared to other exudate gums (Dragnet, 2000).
The concentration effect of the different stabilizers also show significant effect (p < 0.05)
at different levels in both short set and long set yoghurts. This is evident to the fact that
concentrations of 1.0 % stabilizer had lower moisture content when compared to 0.5 % and 0 %
concentrations of the stabilizers. This indicates that moisture content decreased in both short set
and long set yoghurts, with increase in concentrations of the stabilizers.
It was observed that fermentation time had significant effect (p < 0.05) on the moisture
content of both short set and long set yoghurts. The moisture content of short set yoghurt
decreased (88.54±0.02 % to 82.26±0.03 %) with increase in fermentation time (0 to 5 hours) as

50
shown in Figure 4. Similarly, the moisture content of long set yoghurt decreased with increasing
fermentation time (Fig. 5). The values ranged from 88.54±0.02 % to 82.47±0.03 % for a period
of 0 to 24 h, though it was observed that towards the end of fermentation there was slight
increase in the moisture content. This slight increase could be as a result of thinning effect
caused by depletion of fermentable carbohydrate and effect of acidity produced (Adam, 1990).
The decrease in moisture content from the start could be attributed to the fact that fermentation
increases the proportion of dry matter in the food and the concentration of vitamin, minerals and
protein appear to increase when measured on the dry weight basis (Adam, 1990).
The interaction effect of stabilizers and concentrations on moisture content of short set and long
set yoghurt show significant differences (p < 0.05). This indicates that the behaviour of the
stabilizers were not the same at different concentrations. The interaction effect shows that at 0 %
concentration the different stabilizers behaved the same way, having similar proportions of
moisture. However, higher concentration of different stabilizers magnified the differences
between the stabilizer in the moisture content of short set and long set yoghurts, respectively. At
0.5 % concentration, yoghurt containing gum acacia had higher moisture content followed by
corn starch while yoghurt containing CMC had the least moisture content. At 1.0 %
concentration, this trend was observed but the differences were wider. In Figure 4, it was
observed that there was a sudden fall in sample A (control), this is as a result of increased
production of lactic acid by the microorganisms as a result of free mobility of the reacting
microorganisms.

Fig 4: Changes in moisture content of short set yoghurt during fermentation.
A= Yoghurt with No stabilizer (0 %), Sample B1 = Yoghurt with 0.5 % concentration of CMC,
Sample B2= Yoghurt with 1.0 % concentration of CMC, Sample C1= Yoghurt with 0.5 %
concentration of corn starch, Sample C2= Yoghurt with 1.0 % concentration of corn starch,
Sample D1= Yoghurt with 0.5 % concentration of Gum Acacia, Sample D2= Yoghurt with 1.0
% concentration of Gum Acacia.
82
83
84
85
86
87
88
89
90
0 1
Mois
ture
con
ten
t (%
)
Fermentation time (hours)
: Changes in moisture content of short set yoghurt during fermentation.
A= Yoghurt with No stabilizer (0 %), Sample B1 = Yoghurt with 0.5 % concentration of CMC,
Sample B2= Yoghurt with 1.0 % concentration of CMC, Sample C1= Yoghurt with 0.5 %
concentration of corn starch, Sample C2= Yoghurt with 1.0 % concentration of corn starch,
Sample D1= Yoghurt with 0.5 % concentration of Gum Acacia, Sample D2= Yoghurt with 1.0
% concentration of Gum Acacia.
2 3 4
Fermentation time (hours)
51
: Changes in moisture content of short set yoghurt during fermentation. A= Yoghurt with No stabilizer (0 %), Sample B1 = Yoghurt with 0.5 % concentration of CMC,
Sample B2= Yoghurt with 1.0 % concentration of CMC, Sample C1= Yoghurt with 0.5 %
concentration of corn starch, Sample C2= Yoghurt with 1.0 % concentration of corn starch,
Sample D1= Yoghurt with 0.5 % concentration of Gum Acacia, Sample D2= Yoghurt with 1.0
5
A
B1
B2
C1
C2
D1
D2

52
Fig 5: Changes in moisture content of long set yoghurt during fermentation. A= Yoghurt with No stabilizer (0 %), Sample B1 = Yoghurt with 0.5 % concentration of CMC,
Sample B2= Yoghurt with 1.0 % concentration of CMC, Sample C1= Yoghurt with 0.5 %
concentration of corn starch, Sample C2= Yoghurt with 1.0 % concentration of corn starch,
Sample D1= Yoghurt with 0.5 % concentration of Gum Acacia, Sample D2= Yoghurt with 1.0
% concentration of Gum Acacia.
82
83
84
85
86
87
88
89
90
O 4 8 12 16 20 24
Mo
istu
re C
on
ten
t (%
)
Fermentation time (hours)
A
B1
B2
C1
C2
D1
D2

53
Comparison of short set and long set yoghurts showed that lower moisture content was indicated
by the short set yoghurt at 5th hour of fermentation compared with long set yoghurt for the
comparable period. This is attributable to the higher reaction rate in the short set yoghurt
compared to the long set yoghurt. As shown in Table 10, at 0 % concentration of CMC, moisture
was lost at rate of 1.36 % per hour in the short set yoghurt compared to a slower rate of 0.36 %
per hour in the long set yoghurt. Similarly, at 0.5 % concentration of the CMC, moisture was lost
at rate of 0.28 % per hour in the short set yoghurt compared to a slower rate of 0.07 % per hour
in the long set yoghurt. At 1.0 % concentration of CMC, moisture was lost at a rate of 0.33 % per
hour in the short set yoghurt compared to 0.09 % per hour in the long set yoghurt. Similar trends
were observed for corn starch and gum acacia with respect to rates of moisture content changes
in relation to type of production (short set and long set).
It could be seen, from table 10 that CMC had the least rate of change per hour at both
short set and long set at 0.5 % compared to corn starch and gum acacia. Similar observations
were made for the 1 % concentrations.

54
Table 10: Rate of Fermentation of Short Set and Long Set Yoghurt Samples.
Short Set
yoghurt
stabilizers
concentration
(%)
M.C
(%/h)
Viscosity
(Cp/h)
TTA
(%/h)
pH
(unit/h)
TVC
(cfu/ml/h)
LAB
(cfu/ml/h)
Vit B3
mg/ml/h
CMC 0 1.36 28.13 0.12 0.46 0.65 0.36 0.08
0.5 0.28 36.94 0.09 0.45 1.76 0.6 0.02
1.0 0.33 32.54 0.04 0.43 0.13 0.34 0.01
Corn Starch 0 1.36 28.13 0.12 0.46 0.65 0.36 0.08
0.5 0.35 47.41 0.07 0.39 0.58 0.32 0.01
1.0 0.62 20.48 0.09 0.37 0.53 0.44 0.01
Gum Acacia 0 1.36 28.13 0.12 0.46 0.65 0.36 0.08
0.5 0.54 28.14 0.06 0.36 0.77 1.28 0.02
1.0 0.50 29.52 0.13 0.37 0.90 0.27 0.02
Long set
yoghurt
CMC
0 0.39 12.31 0.04 0.10 0.35 0.15 0.00
0.5 0.07 11.57 0.03 0.07 0.28 0.08 0.00
1.0 0.09 9.13 0.02 0.10 0.39 0.15 0.01
Corn Starch 0 0.39 12.31 0.04 0.10 0.35 0.15 0.00
0.5 0.16 14.41 0.04 0.09 0.26 0.09 0.01
1.0 0.14 14.44 0.04 0.09 0.33 0.13 0.01
Gum Acacia 0 0.39 12.31 0.04 0.10 0.35 0.15 0.00
0.5 0.16 8.86 0.01 0.08 0.09 0.04 0.00
1.0 0.14 3.12 0.05 0.06 0.12 0.08 0.00 M.C-Moisture content. TVC-Total Viable count. LAB-Lactic acid bacteria. TTA-Total titratable Acidity.VitB3-Niacin
4.1.2 Fat Content of Short Set and Long set Yoghurt
The stabilizer effect on the fat content of short set ( Fig. 6) and long set (Fig. 7) yoghurt
indicate that significant differences (p < 0.05) were observed in both short and long set yoghurt.
The fat content for short set yoghurt ranged from 2.92±0.24 % to 3.22±0.09 % and that of long
set ranged from 3.07±0.17 % to 3.23 ± 0.09 %. Corn starch recorded the highest value of 3.22±
0.09 % probably due to residual oil in corn starch while gum acacia recorded the least fat
content.
The effect of concentration of stabilizers on fat content was found to be significant (p <
0.05) for both short set and long set yoghurt. The values obtained for short set did not differ

55
significantly (p > 0.05) from the values obtained for long set yoghurt. The fat content obtained is
in agreement with similar work by Tamime and Robinson (1999) who reported that fat content
ranging from 2.6 to 3.24 % are yoghurt grouped as low fat and should contain less than 3.5 % fat
while full fat yoghurt contains more than 3.5 %. The yoghurt sample can hence be classified as
low fat yoghurt.
Fermentation time had significant effect (p < 0.05) on the fat content of both short set and
long set yoghurts. Increase in fat content was observed with increase in fermentation time and
the values ranged from 2.65 ± 0.01 % to 3.42 ± 0.05 % for short set and 2.67 ± 0.01 % to 3.44 ±
0.03 % for long set yoghurts, respectively. Shaker et al. (2000) studied the effect of milk fat
content on the acid development during fermentation and rheological properties of plain yoghurt.
The authors indicated increasing fat content as fermentation proceeded.
The interaction effect of stabilizers and concentrations of fat content of short set and long
set yoghurt indicates that the behaviour of the stabilizers were different at different
concentrations. Therefore, the differences between stabilizers were magnified by concentrations
used. At 0 % concentrations the stabilizers had similar fat contents. However, at 0.5 %
concentration corn starch (C1) had a higher fat content compared to CMC while gum acacia had
the least fat content. Also at 1.0 % concentration corn starch (C2) had a higher concentration
than CMC with gum acacia being the least, but the differences were wider at 1.0 % concentration
than at 0.5 % concentration.
Results also indicate that due to higher reaction rates at short set fermentation, higher fat
content was observed in the short set yoghurt at 5th hour of fermentation compared to the long
set yoghurt at similar period. This can be explained by higher loss of moisture at short set
compared to long set production methods.

56
4.1.3 Protein Content of Short set and Long set yoghurt
The different stabilizers had significant effect (p < 0.05) on the protein content of both
short set (Fig. 7) and long set (Fig.8) yoghurts. The protein values ranged from 3.33 ± 0.11 % to
3.45 ± 0.13 % and 3.44 ± 0.16 % to 3.57 ± 0.16 % for short set and long set yoghurts,
respectively. The stabilizer effect on the protein content of short set and long set yoghurt shows
that CMC gave the highest protein content followed by Gum acacia, with corn starch having the
lowest protein value of 3.33 ± 0.11 % for short set and 3.44 ± 0.16 % for long set yoghurt. This
is in contrast with the reported work of Alakali et al. (2007). Gum acacia gave high protein
content close to that of CMC for short set and long set yoghurt, this could be attributed to the fact
that gum acacia has a covalent association with a protein moiety rich in hydroxyproline, serine
and proline (Dragnet, 2000).
Concentration of the different stabilizers also had significant effect (p < 0.05) on the
protein content of short set and long set yoghurts respectively. The protein content significantly
(p < 0.05) decreased with increase in the concentration of the stabilizers for short set and long set
yoghurts. This is also in line with Alakali et al. 2007. It is important to note that higher
concentration of stabilizers reduced the nutritional quality of yoghurt sample by causing a
reduction in the protein content of yoghurt due to dilution effect.

57
Fig. 6: Changes in Fat content of short set yoghurt during fermentation.
A= Yoghurt with No stabilizer (0 %), Sample B1 = Yoghurt with 0.5 % concentration of CMC,
Sample B2= Yoghurt with 1.0 % concentration of CMC, Sample C1= Yoghurt with 0.5 %
concentration of corn starch, Sample C2= Yoghurt with 1.0 % concentration of corn starch,
Sample D1= Yoghurt with 0.5 % concentration of Gum Acacia, Sample D2= Yoghurt with 1.0
% concentration of Gum Acacia.
2.4
2.6
2.8
3
3.2
3.4
0 1 2 3 4 5
Fat
con
ten
t (%
)
Fermentation time (hours)
A
B1
B2
C1
C2
D1
D2

58
Fig. 7: Changes in the fat content of long set yoghurt during fermentation.
A= Yoghurt with No stabilizer (0 %), Sample B1 = Yoghurt with 0.5 % concentration of CMC,
Sample B2= Yoghurt with 1.0 % concentration of CMC, Sample C1= Yoghurt with 0.5 %
concentration of corn starch, Sample C2= Yoghurt with 1.0 % concentration of corn starch,
Sample D1= Yoghurt with 0.5 % concentration of Gum Acacia, Sample D2= Yoghurt with 1.0
% concentration of Gum Acacia.
2.4
2.6
2.8
3
3.2
3.4
0 4 8 12 16 20 24
Fat
Con
ten
t (%
)
Fermentation time (hours)
A
B1
B2
C1
C2
D1
D2

59
Protein contents significantly (p < 0.05) increased with increase in fermentation time, in
short set and long set yoghurt shown in figs. 8 and 9. This could be as a result of concentrations
of proteins in yoghurts due to moisture loss which cause increase of other components. The
protein content values ranged from 3.06 ± 0.02 % to 3.71 ± 0.02 % for short sort set and 3.06 ±
0.02 % to 3.79 ± 0.03 % for long set yoghurts, respectively. The values obtained are lower than
protein values reported by Ehirim et al. (2004) who reported protein to range from 3.76 % to
5.08 % of other brands of yoghurt sold in Owerri, Imo state.
The interaction effect between stabilizers and concentrations was found to be significant
(p < 0.05). This indicates that the effects of the stabilizers were different at different
concentrations. It was observed that 0 % concentration of all the stabilizers had similar effects on
the protein contents since the absence of the stabilizers did not cause a dilution effect. At 0.5 %
CMC samples had higher protein content than corn starch. Also, at 1 % concentration similar
trends was observed but the differences in protein content was wider and smaller at 1 %
concentration due to greater moisture loss and increased dilution effect at 1 % concentration.
Fermented milk products are good sources of high quality protein with high biological value
(Canadian Dairy Commission, 2007) therefore it was observed that dilution effect caused
differences with the type and quantity of stabilizers used. It was observed in short set samples
that gum acacia gave high protein content at 1.0 % concentration due to higher reaction rates,
higher quantity of protein was observed at higher temperature of incubation for short set yoghurt
compared to the lower temperature of incubation for long set yoghurt. All these differences are
therefore dependent on how these types of production affected moisture changes.

60
Fig. 8: Changes in the protein content of short set yoghurt during fermentation.
A= Yoghurt with No stabilizer (0 %), Sample B1 = Yoghurt with 0.5 % concentration of CMC,
Sample B2= Yoghurt with 1.0 % concentration of CMC, Sample C1= Yoghurt with 0.5 %
concentration of corn starch, Sample C2= Yoghurt with 1.0 % concentration of corn starch,
Sample D1= Yoghurt with 0.5 % concentration of Gum Acacia, Sample D2= Yoghurt with 1.0
% concentration of Gum Acacia.
3
3.2
3.4
3.6
3.8
4
0 1 2 3 4 5
Pro
tein
co
nte
nt
(%)
Fermentation time (hours)
A
B1
B2
C1
C2
D1
D2

61
Fig. 9: Changes in the protein content long set yoghurt during fermentation.
A= Yoghurt with No stabilizer (0 %), Sample B1 = Yoghurt with 0.5 % concentration of CMC,
Sample B2= Yoghurt with 1.0 % concentration of CMC, Sample C1= Yoghurt with 0.5 %
concentration of corn starch, Sample C2= Yoghurt with 1.0 % concentration of corn starch,
Sample D1= Yoghurt with 0.5 % concentration of Gum Acacia, Sample D2= Yoghurt with 1.0
% concentration of Gum Acacia.
3
3.2
3.4
3.6
3.8
4
0 4 8 12 16 20 24
Pro
tein
Co
nte
nt
(%)
Fermentation time (hours)
A
B1
B2
C1
C2
D1
D2

62
4.1.4 Ash Content of Short Set and Long Set Yoghurt
The ash content of short set (Fig. 10) and long set (Fig. 11) yoghurts to which different
stabilizers were added showed that addition of CMC, corn starch and gum acacia, each at levels
of 0, 0.5 and 1.0 % concentrations caused significant differences (p < 0.05) between the
stabilizers. CMC recorded the highest percent ash content presumably due to the high sodium
content of CMC (Edali et al., 2001).
Concentration effect of stabilizers was found to be significant (p < 0.05) at levels of 0,
0.5 and 1.0 % for short set and long set yoghurt. Ash content was highest at 1.0 % concentration
and lowest at 0 % concentration due to higher quantity of stabilizer at 1 % concentrations.It was
observed that percent ash content generally increased with increase in fermentation time. This
increase was found to be highly significant (p < 0.05) due to concentrations effect resulting from
moisture loss. There was increase in ash content from 0.34 ± 0.02 % to 0.79 ± 0.01 % for short
set and from 0.34 ± 0.02 % to 0.80 ± 0.02 % for long set yoghurt as fermentation time
progressed as shown in Figs. 10 and 11. The values obtained could be compared with the range
given by Mbaeyi and Awaziem (2007) who reported yoghurt to contain ash from 0.49 % to 0.98
%.
Interaction effects between stabilizers and concentrations for ash content of short set and
long set yoghurts were found to be significant (p < 0.05). This is in contrast with reported work
of Alakali et al. (2007). This significant interaction suggests that the differences in ash content
due to stabilizers were different at different concentrations.

63
Fig. 10: Changes in the ash content of short set yoghurt during fermentation.
A= Yoghurt with No stabilizer (0 %), Sample B1 = Yoghurt with 0.5 % concentration of CMC,
Sample B2= Yoghurt with 1.0 % concentration of CMC, Sample C1= Yoghurt with 0.5 %
concentration of corn starch, Sample C2= Yoghurt with 1.0 % concentration of corn starch,
Sample D1= Yoghurt with 0.5 % concentration of Gum Acacia, Sample D2= Yoghurt with 1.0
% concentration of Gum Acacia.
0.2
0.3
0.4
0.5
0.6
0.7
0.8
0.9
0 1 2 3 4 5
Ash
co
nte
nt
(%)
Fermentation time (hours)
A
B1
B2
C1
C2
D1
D2

64
Fig 11:Changes in ash content of long set yoghurt during fermentation.
A= Yoghurt with No stabilizer (0 %), Sample B1 = Yoghurt with 0.5 % concentration of CMC,
Sample B2= Yoghurt with 1.0 % concentration of CMC, Sample C1= Yoghurt with 0.5 %
concentration of corn starch, Sample C2= Yoghurt with 1.0 % concentration of corn starch,
Sample D1= Yoghurt with 0.5 % concentration of Gum Acacia, Sample D2= Yoghurt with 1.0
% concentration of Gum Acacia.
0.2
0.3
0.4
0.5
0.6
0.7
0.8
0.9
0 4 8 12 16 20 24
Ash
Co
nte
nt
(%)
Fermentation time (hours)
A
B1
B2
C1
C2
D1
D2

65
4.1.5 Total Solids Content of Short Set and Long Set Yoghurt
The result of total solids of short set (Fig. 12) and long set (Fig. 13) yoghurts stabilized
with 0 %, 0.5 % and 1.0 % concentrations of CMC, corn starch and gum acacia show that
significant differences were found between the stabilizers (p < 0.05). CMC gave the highest total
solids content. This could be due to the fact that each polymer chain in a dilute solution of CMC
is hydrated and extended and exhibited a stable viscosity (Edali et al., 2001). This was followed
by corn starch while Gum acacia had the least total solids contents.
It was observed that total solids increased (p < 0.05) with increase in concentration of
each stabilizer, for short set and long set yoghurt respectively. At 0, 0.5 and 1.0 % concentrations
for short set yoghurt, the total solid content values obtained were 14.61 %, 15.1 1% and 15.60 %.
For long set yoghurt, concentration at levels of 0, 0.5 and 1.0 % gave total solids content of
15.69 %, 15.45 % and 15.86 %, respectively. This is could be attributed to the fact that the
stabilizers used are solids (Alakali et al., 2007) and therefore increased the total solids as
concentration increased.
The total solid content for short set and long set yoghurt increased with increase in
fermentation time. This result is in agreement with the findings of Sahid et al. (2002) who
reported total solids content to range from 13.80 % to 18.30 %. This result shows that total solids
accumulate as fermentation progresses, due to the fact that moisture was lost. The interaction
effect between stabilizer and concentrations on the total solids contents for short set and long set
yoghurts was found to be significant (p < 0.05). The increase has been attributed to accumulation
of solid matter during fermentation. CMC significantly had the greatest total solids compared to
other stabilizers while 1.0 % concentration recorded the highest total solids compared to other

66
concentrations. Therefore, the differences in the effect of the stabilizers were magnified by the
concentrations used.
It was also found that fermentation for 5 hours in the short set yoghurt achieved the same
effect to that achieved in 24 hours in the long set. This has been attributed to higher reaction
rates at the temperatures at which short set yoghurt was fermented.
4.1.6 Viscosity (Cp) of Short Set and Long Set Yoghurt
The viscosity values obtained for short set (Fig. 14)and long set (Fig.15) yoghurts
stabilized with CMC, corn starch and gum acacia at levels of 0, 0.5 and 1.0 % concentrations
shows that significant differences (p < 0.05) were found between the different stabilizers. The
differences in viscosities have been attributed in chemical and physical characteristics of the
stabilizers used. CMC has the ability to form high viscous colloidal solutions with water,
insoluble in ethanol and slightly hygroscopic (Dragnet, 2000). Corn starch has ability to disperse
and suspend other ingredients or particulate matter, thereby forming gels and provides the body
to food product (Erickson, 2006). On the other hand, gum acacia dissolves easily in water (up to
50 %) and the resulting solution does not interact easily with other chemical compound (ITC,
2008). Therefore, a comparison of the viscosity of gum acacia with sodium carboxyl
methylcellulose, which are common thickening agents, shows that even at concentration above
30 % gum acacia solution has a lower viscosity than 1 % sodium carboxyl methylcellulose at low
shear rates. In addition, while gum acacia is Newtonian in behaviour with viscosity being shear
rate independent, sodium carboxyl methylcellulose display non-Newtonian shear thinning
characteristics (Williams et al., 1990).

67
Fig. 12: Changes in Total solids of short set yoghurt during fermentation.
A= Yoghurt with No stabilizer (0 %), Sample B1 = Yoghurt with 0.5 % concentration of CMC,
Sample B2= Yoghurt with 1.0 % concentration of CMC, Sample C1= Yoghurt with 0.5 %
concentration of corn starch, Sample C2= Yoghurt with 1.0 % concentration of corn starch,
Sample D1= Yoghurt with 0.5 % concentration of Gum Acacia, Sample D2= Yoghurt with 1.0
% concentration of Gum Acacia.
10.5
11.5
12.5
13.5
14.5
15.5
16.5
17.5
18.5
0 1 2 3 4 5
To
tal s
oli
ds
(%)
Fermentation time (hours)
A
B1
B2
C1
C2
D
1
D
2

Fig. 13: Changes in total solids of long set yoghurt during fermentation.
A= Yoghurt with No stabilizer (0 %), Sample B1 = Yoghurt with 0.5 % concentration of CMC,
Sample B2= Yoghurt with 1.0 %
concentration of corn starch, Sample C2= Yoghurt with 1.0 % concentration of corn starch,
Sample D1= Yoghurt with 0.5 % concentration of Gum Acacia, Sample D2= Yoghurt with 1.0
% concentration of Gum Acacia.
: Changes in total solids of long set yoghurt during fermentation.
A= Yoghurt with No stabilizer (0 %), Sample B1 = Yoghurt with 0.5 % concentration of CMC,
Sample B2= Yoghurt with 1.0 % concentration of CMC, Sample C1= Yoghurt with 0.5 %
concentration of corn starch, Sample C2= Yoghurt with 1.0 % concentration of corn starch,
Sample D1= Yoghurt with 0.5 % concentration of Gum Acacia, Sample D2= Yoghurt with 1.0
ia.
68
A= Yoghurt with No stabilizer (0 %), Sample B1 = Yoghurt with 0.5 % concentration of CMC,
concentration of CMC, Sample C1= Yoghurt with 0.5 %
concentration of corn starch, Sample C2= Yoghurt with 1.0 % concentration of corn starch,
Sample D1= Yoghurt with 0.5 % concentration of Gum Acacia, Sample D2= Yoghurt with 1.0

69
Fig. 14: Changes in the viscosity of short set yoghurt during fermentation.
A= Yoghurt with No stabilizer (0 %), Sample B1 = Yoghurt with 0.5 % concentration of CMC,
Sample B2= Yoghurt with 1.0 % concentration of CMC, Sample C1= Yoghurt with 0.5 %
concentration of corn starch, Sample C2= Yoghurt with 1.0 % concentration of corn starch,
Sample D1= Yoghurt with 0.5 % concentration of Gum Acacia, Sample D2= Yoghurt with 1.0
% concentration of Gum Acacia.
0
50
100
150
200
250
300
0 1 2 3 4 5
Vis
cosi
ty (
cP)
Fermentation time ( hours)
A
B1
B2
C1
C2
D1
D2

70
Fig. 15: Changes in viscosity of long set yoghurt during fermentation.
A= Yoghurt with No stabilizer (0 %), Sample B1 = Yoghurt with 0.5 % concentration of CMC,
Sample B2= Yoghurt with 1.0 % concentration of CMC, Sample C1= Yoghurt with 0.5 %
concentration of corn starch, Sample C2= Yoghurt with 1.0 % concentration of corn starch,
Sample D1= Yoghurt with 0.5 % concentration of Gum Acacia, Sample D2= Yoghurt with 1.0
% concentration of Gum Acacia.
1.48
31.48
61.48
91.48
121.48
151.48
181.48
211.48
241.48
271.48
0 4 8 12 16 20 24
Vis
cosi
ty (
%)
Fermentation time (hours)
A
B1
B2
C1
C2
D1
D2

71
The viscosity of gum acacia decreased in the presence of electrolytes due to charge
screening and at low pH when the carboxyl groups become undissociated (Williams et al., 1990).
At 1.0 % concentration, CMC recorded the highest viscosity compared to other stabilizers.
Viscosity increased significantly (p < 0.05) with increase in concentration of each stabilizer with
CMC having the greatest effect. CMC increased from 58.33 ±1.79 Cp at 0 % concentration to
152.74 ± 3.21 Cp at 1.0 % concentration, corn starch increased from 58.33 ± 1.79 Cp to 88.23 ±
0.05 Cp and gum acacia increased from 58.33 ± 1.79 Cp to 58.76 ± 0.08 Cp. The rate of increase
in viscosity of short set yoghurt as shown in Table 10 shows that the increase in viscosity caused
by CMC and corn starch peaked at 0.5 % concentration, therefore further addition of CMC and
corn starch would not appear to further increase the viscosity of short set yoghurt. Gum acacia
shows a linear relationship, and this implies that as concentration of the stabilizer increases
viscosity increases. It was observed in long set yoghurt, that CMC and gum acacia had the same
effect. This means that rate of change per hour of viscosity decreased with increase in
concentration of CMC and gum acacia, but 0.5 % concentration was optimum. Corn starch
showed an increase as concentration increased per rate change. This suggests that corn starch
adds to the viscous effect of the yoghurt samples.
It was observed that there was increase in viscosity of short set and long set yoghurt as
fermentation time increased (Figs. 14 and 15). This could be attributed to coagulation of the
protein and carbohydrate during fermentation (Amankwah et al., 2009) as pH decreased.
However, due to higher reaction rate caused by elevated temperature of incubation in the short
set yoghurt, higher viscosity was achieved in the short set yoghurt within 5 hours compared to
the corresponding 5 hours in the long set yoghurt. Nevertheless, long set yoghurt was able to
reach comparable viscosity only at 24 hours of incubation.

72
Interaction effects between stabilizers and concentration were found significant (p <
0.05). The behaviours of the stabilizers at different concentrations were different for different
stabilizers. Thus, increase in the concentrations of stabilizers magnified the differences in effect
between stabilizers.
4.1.7 Total Titratable Acidity (%) of Short Set and Long Set Yoghurt
Titratable acidity values of short set (Fig. 16) and long set (Fig. 17) yoghurts stabilized
with CMC, cornstarch and Gum acacia at 0 %, 0.5 % and 1.0 % concentrations show significant
differences (p < 0.05) between stabilizers with Gum acacia giving the highest values for TTA.
The differences caused by concentrations of stabilizers on the short set and long set
yoghurt were found to be significant (p < 0.05). It was observed that the addition of CMC at the
level of 1.0 % concentration, depressed the production of lactic acid. This is clearly shown in
Table 10 by the rate of production of lactic acid in the presence of high level of CMC. It is
shown that at 0 % concentration the rate of production of lactic acid was 0.12 % per hour in the
short and long set yoghurts but this depressed to 0.09 % per hour and 0.03 % per hour in the
short and long set yoghurts when CMC increased to 0.5 %. When CMC increased to 1 %
concentration the lactic acid production depressed further to 0.04 % per hour in the short set
yoghurt and 0.02 % per hour in the long set yoghurt.
CMC is an anionic, water soluble polymer capable of forming very viscous solution.
CMC is insoluble in acidic conditions and more soluble in alkali conditions and the solubility is
pH dependent (Dragnet, 2000). Therefore, the low acid production could be attributed to its
formation of highly viscous systems which caused diffusion resistance that reduced mobility of
reactants and the consequence was reduction of the rate at which the reacting species came
together for fermentation to take place (Alakali et al., 2007). Gum acacia did not impede the

73
production of titratable acidity. Instead, the higher concentration of gum acacia used resulted in
higher rate of production of lactic acid (table 10). It is seen that at 0.5 % concentrations, rate of
lactic acid production by gum acacia was 0.01 % per hour, while at 1.0 % concentration it
increased to 0.05 % per hour. Gum acacia is a stabilizer which functions as an emulsifying agent
in milk products by producing firmer texture (Roeper, 2014).
Gum acacia has high water solubility (up to 50 %. w/v) and relatively low viscosity
compared to other exudate gums. The highly branched molecular structure and relatively low
molecular weight of this polymer are responsible for these properties (Dragnet, 2000). The low
viscosity of Gum acacia allowed greater freedom of mobility of reactants which enabled reacting
species to come together for fermentation to take place. The titratable acidity of short set and
long set yoghurt stabilized with corn starch at level of 0 %, 0.5 % and 1.0 % concentrations had
less inhibitory effect on the production of titratable acidity compared to CMC at similar
concentrations. It is seen from Table 10 that the rate of change at 0.5 % concentration was 0.07
% and 0.09 % per hour in the short set while there was no change in the long set which were 0.04
% and 0.04 % per hour respectively at 0.5 % and 1.0 % concentrations. Therefore, effects
produced at 0.5 and 1.0 % concentration were similar for short set yoghurt but differed from that
of long set yoghurt. This is as a result of the high concentration of starch. Erickson (2006)
reported that starch molecules hydrate and increased in size, immobilize much of the water
present, thicken the aqueous system and form a paste on cooling.

Fig. 16: Changes in Total Titratable Acidity of short set yoghurt
A= Yoghurt with No stabilizer (0 %), Sample B1 = Yoghurt with 0.5 % concentration of CMC,
Sample B2= Yoghurt with 1.0 % concentration of CMC, Sample C1= Yoghurt with 0.5 %
concentration of corn starch, Sample C2= Yoghurt with 1.0 % con
Sample D1= Yoghurt with 0.5 % concentration of Gum Acacia, Sample D2= Yoghurt with 1.0
% concentration of Gum Acacia.
: Changes in Total Titratable Acidity of short set yoghurt during fermentation.
A= Yoghurt with No stabilizer (0 %), Sample B1 = Yoghurt with 0.5 % concentration of CMC,
Sample B2= Yoghurt with 1.0 % concentration of CMC, Sample C1= Yoghurt with 0.5 %
concentration of corn starch, Sample C2= Yoghurt with 1.0 % concentration of corn starch,
Sample D1= Yoghurt with 0.5 % concentration of Gum Acacia, Sample D2= Yoghurt with 1.0
% concentration of Gum Acacia.
74
during fermentation.
A= Yoghurt with No stabilizer (0 %), Sample B1 = Yoghurt with 0.5 % concentration of CMC,
Sample B2= Yoghurt with 1.0 % concentration of CMC, Sample C1= Yoghurt with 0.5 %
centration of corn starch,
Sample D1= Yoghurt with 0.5 % concentration of Gum Acacia, Sample D2= Yoghurt with 1.0

75
Fig. 17: Changes in Titratable acidity of long set yoghurt during fermentation.
A= Yoghurt with No stabilizer (0 %), Sample B1 = Yoghurt with 0.5 % concentration of CMC,
Sample B2= Yoghurt with 1.0 % concentration of CMC, Sample C1= Yoghurt with 0.5 %
concentration of corn starch, Sample C2= Yoghurt with 1.0 % concentration of corn starch,
Sample D1= Yoghurt with 0.5 % concentration of Gum Acacia, Sample D2= Yoghurt with 1.0
% concentration of Gum Acacia.
0.2
0.4
0.6
0.8
1
1.2
0 4 8 12 16 20 24
Tit
rata
ble
Aci
dit
y (
%)
Fermentation time (hours)
A
B1
B2
C1
C2
D1
D2

76
Therefore, the result shows that the use of corn starch in concentrations beyond 0.5 %
and 1.0 % could be wastage, unless when used in combination with other stabilizers with lower
viscous properties. It is possible that whereas the lactic acid bacteria were not fermenting CMC,
they were able to ferment corn starch and gum acacia to some extent, hence the higher
concentration of corn starch and gum acacia resulted to higher rate change.
Fermentation time had significant effect (p < 0.05) on the TTA of short set and long set
yoghurt as shown in Figs. 16 and 17. It was observed that TTA increased with increase in
fermentation time. The TTA values for short set yoghurt ranged from 0.29 ± 0.01 % to 0.89 ±
0.02 % and long set yoghurt ranged from 0.29 ± 0.01 % to 1.09 ± 0.03 %. These results are in
agreement with those previously reported for other Labnehs (a strained yoghurt used for
sandwiches in Arab country) (Benkerrom and Tamime, 2004). It also agrees with the findings of
Ahmad (1994) who reported total titratable acidity range from 0.87 % to 1.13 %.
Although, the final titratable acidity values produced in the long set at 24 h were higher
than the final titratable acidity produced in the short set at 5 h, it could be seen that the titratable
acidity of the short set yoghurts at 5th hour of fermentation was higher than the titratable acidity
of the corresponding 5th hour of fermentation in the long set yoghurt. This is attributable to
higher reaction rates in the short set yoghurt than in the long set yoghurts. As shown in Table 10,
CMC at 0.5 % concentration in the short set yoghurt was producing acid at the rate of 0.09 % per
hour compared to long set yoghurt of 0.5 % concentration which was producing acid at the rate
of 0.03 % per hour. Similar trends were observed for other samples.
The interaction effect of stabilizers and concentrations was found to be significant (p <
0.05) suggesting that the effects caused by different stabilizers used were different at different
concentrations.

77
4.1.8 pH of Short Set and Long Set Yoghurt
The results of pH on the effect of short set (Fig. 16) and long set (Fig. 17) yoghurts
stabilized with 0 %, 0.5 % and 1.0 % concentrations of CMC, corn starch and gum acacia
indicated that the differences between effects of stabilizers were not significant (p > 0.05)
between CMC and corn starch, but differed significantly (p < 0.05) from gum acacia. Although
titratable acidity production in yoghurt containing corn starch was higher than yoghurt
containing CMC (Figs. 18 and 19), the pH of both yoghurts containing CMC and corn starch
were similar suggesting that pH of yoghurt containing corn starch had higher buffering capacity.
This is unlike the yoghurt containing gum acacia which appeared to be less buffered. However,
CMC gave highest pH value when compared to the other stabilizers. This could be attributed to
the fact that CMC is a stabilizer that is more soluble in alkali conditions and insoluble in acidic
conditions and has optimum pH range of 6.0 – 8.5 (1 in 100 solutions) (Dragnet, 2000). It is also
probable that due to low level fermentation of CMC, it gave higher pH value in comparison to
corn starch and gum acacia which was somehow more fermented.
The differences caused by concentration of the stabilizers on the pH value of short set and long
set yoghurts were found to be significant (p < 0.05). This means that the pH generally decreased
with increase in concentration of the stabilizers but the nature of the decrease was significantly
(p < 0.05) different for different stabilizers. The pH of the yoghurt with no stabilizer 0 %
(control) differed significantly from those of 0.5 and 1.0 % concentration.

78
Fig. 18: Changes in the pH values of short set yoghurt during fermentation.
A= Yoghurt with No stabilizer (0 %), Sample B1 = Yoghurt with 0.5 % concentration of CMC,
Sample B2= Yoghurt with 1.0 % concentration of CMC, Sample C1= Yoghurt with 0.5 %
concentration of corn starch, Sample C2= Yoghurt with 1.0 % concentration of corn starch,
Sample D1= Yoghurt with 0.5 % concentration of Gum Acacia, Sample D2= Yoghurt with 1.0
% concentration of Gum Acacia.
3.5
4
4.5
5
5.5
6
6.5
0 1 2 3 4 5
pH
Fermentation time (hours)
A
B1
B2
C1
C2
D1
D2
pH

79
Fig. 19: Changes in pH of long set yoghurt during fermentation. A= Yoghurt with No stabilizer (0 %), Sample B1 = Yoghurt with 0.5 % concentration of CMC,
Sample B2= Yoghurt with 1.0 % concentration of CMC, Sample C1= Yoghurt with 0.5 %
concentration of corn starch, Sample C2= Yoghurt with 1.0 % concentration of corn starch,
Sample D1= Yoghurt with 0.5 % concentration of Gum Acacia, Sample D2= Yoghurt with 1.0
% concentration of Gum Acacia.
3.5
4
4.5
5
5.5
6
6.5
0 4 8 12 16 20 24
pH
Fermentation time (hours)
A
B1
B2
C1
C2
D1
D2

80
The highest pH was produced at 0.5 % concentration by CMC, cornstarch and gum acacia for
short set and long set yoghurts, respectively. The lowest pH was produced at 0.5 % concentration
by gum acacia for short set yoghurt. This low pH value of gum acacia could be as a result that
gum acacia as a stabilizer has optimum pH range of 4.5 (William et al., 2000) which lowered the
pH of the yoghurt prepared with this stabilizer. It could also be attributed to the stability of gum
acacia in acid conditions and high solubility (Eqbal and Abdullah, 2013) or that gum acacia was
also fermented along with lactose and that it possesses lower buffering capacity. Alakali et al.
(2007) showed that whereas relationship between titratable acidity and storage time for
thermized yoghurt was linear, that of pH with storage time was found to be non-linear,
suggesting some buffering effect. Therefore, gum acacia with lower buffering effect may exhibit
lower pH on production of acid compared to CMC.
Fermentation time had significant (p < 0.05) effect on the pH value obtained for short set
and long set yoghurts as shown in Figs. 18 and 19. The pH values decreased as fermentation time
increased in short set and long set yoghurts (6.27 ± 0.01 to 4.10 ± 0.03 and 6.27 ± 0.02 to 4.06 ±
0.07 respectively). This decrease in pH as fermentation progressed could be attributed to
increased and sustained metabolic activity of acid producing microorganisms (Gassem and Abu-
Tarboush, 2000), resulting to continued production of lactic acid with consequent depression of
pH.
The interaction effects between stabilizers and concentrations for short set and long set
yoghurts were found to be significant (p < 0.05). The interaction effect between stabilizers and
concentration for short set yoghurt at 0.5 and 1.0 % concentrations did not magnify much
difference between the stabilizers when compared to the high magnification effect caused by the
stabilizers in long set yoghurt.

81
Due to higher reaction rates of yoghurt produced with short set method, the final pH produced in
5 hours was below 4.5 whereas it was above 5 in the long set yoghurt at comparable 5 hours of
fermentation. The final pH of less than 4.5 in the long set yoghurt was achieved after 24 hours of
fermentation. These differences were caused by differences in temperature of fermentation.
4.2 Vitamin B3 (Niacin) (mg/ml) Content of Short Set and Long Set Yoghurt
The niacin content of short set (Fig. 20) and long set (Fig. 21) yoghurts prepared with
three different stabilizers CMC, Corn starch and Gum acacia shows that the addition of the
different stabilizers lead to significant (p < 0.05) differences among the stabilizers. It could be
seen that the presence of CMC inhibited the elaboration of vitamin B3 and thus contained the
least of vitamin B3 compared to gum acacia which was the highest in the short set yoghurt. The
low level production of vitamin B3 in CMC could be attributed to increased viscosity which
reduced mobility of reactants.
Niacin content decreased significantly (p < 0.05) with increase in concentration of stabilizer for
short set yoghurt when compared to the long set yoghurt. It was observed that at 0.0 %
concentration niacin content was 0.32 mg/ml. At 0.5 % concentration niacin content was 0.26
mg/ml while at 1.0 % concentration, it decreased to 0.22 mg/ml niacin in the short set yoghurt.
The niacin content values obtained for short set yoghurt are higher than those reported by
Tamime and Robinson (1999) for vitamin B3 content. However, enhanced synthesis of vitamins
in yoghurt can be achieved by using different combinations of starter cultures (Eitenmiller et al.,
2008).

82
Fig. 20: Changes in Vitamin B3 (mg/ml) content of short set yoghurt during fermentation.
A= Yoghurt with No stabilizer (0 %), Sample B1 = Yoghurt with 0.5 % concentration of CMC,
Sample B2= Yoghurt with 1.0 % concentration of CMC, Sample C1= Yoghurt with 0.5 %
concentration of corn starch, Sample C2= Yoghurt with 1.0 % concentration of corn starch,
Sample D1= Yoghurt with 0.5 % concentration of Gum Acacia, Sample D2= Yoghurt with 1.0
% concentration of Gum Acacia.
0.1
0.2
0.3
0.4
0.5
0.6
0 1 2 3 4 5
Vit
B3
(m
g/m
l)
Fermentation time (hours)
A
B1
B2
C1
C2
D1
D2

83
Fig. 21: Changes in Niacin Vitamin B3 (mg/ml) content of long set yoghurt during
fermentation.
A= Yoghurt with No stabilizer (0 %), Sample B1 = Yoghurt with 0.5 % concentration of CMC,
Sample B2= Yoghurt with 1.0 % concentration of CMC, Sample C1= Yoghurt with 0.5 %
concentration of corn starch, Sample C2= Yoghurt with 1.0 % concentration of corn starch,
Sample D1= Yoghurt with 0.5 % concentration of Gum Acacia, Sample D2= Yoghurt with 1.0
% concentration of Gum Acacia.
0.1
0.2
0.3
0.4
0 4 8 12 16 20 24
Vit
B3
(m
g/m
l)
Fermentation time (hours)
A
B1
B2
C1
C2
D1
D2

84
The effect of concentration of stabilizers was slightly different for long set yoghurt,
where 1.0 % concentration of the different stabilizers gave the highest niacin content of 0.25
mg/ml when compared to 0.24 mg/ml of 0 % and 0.22 mg/ml of 0.5 % concentrations. This
result is in line with reported works of Friend et al. (1983) who reported that quantities of
vitamins are dependent among other things on the conditions of fermentation.
Increase in niacin content was observed as fermentation time increased in short set and
long set yoghurt as shown in Figs. 18 and 19. It was observed that fermentation time as well as
temperature of incubation played a great role in the synthesis of the vitamin B3 content.
Fermentation time also lead to a significant (p < 0.05) increase in the niacin content of long set
yoghurt. The niacin value obtained ranged from 0.17 ± 0.01 mg/ml to 0.37 ± 0.00 mg/ml, but the
values obtained are lower than the required value in USDA (2004) nutrient data base. Friend et
al. (1983) reported that a long incubation of yoghurt (incubation at 30 oC for 14-16 hours)
decreased the synthesis of vitamins but increased the content of nicotinic acid in the final
product.
The significant interaction between stabilizers and concentrations of the different
stabilizers suggests that the different concentrations of the stabilizers magnified the differences
in the niacin content between the stabilizers. At 0 % concentration in the short set yoghurt, the
stabilizers had similar niacin content of 0.3213 mg/ml. At 0.5 % concentration the niacin not
only reduced for each stabilizer but corn starch had the least concentration of 0.2091 mg/ml
while yoghurt containing CMC had 0.2423 mg/ml niacin and gum acacia had 0.3245 mg/ml. At
1.0 % concentration, the elaboration of niacin reduced further and maintained the differences
observed at 0.5 % concentration. In the long set yoghurt, the stabilizers at 0 % concentration

85
were similar but at 0.5 % corn starch exhibited higher concentration and at 1 % CMC supported
production of higher quantity of niacin.
4.3 Microbial Count (cfu/ml) of Short Set and Long set Yoghurt
The total viable count (Figs. 21 and 22) and lactic acid bacteria (LAB) count (Figs. 23
and 24) of short set and long set yoghurt stabilized with CMC, corn starch and gum acacia show
significant (p < 0.05) differences among the stabilizers. CMC and gum acacia gave highest
values of TVC and lactic acid bacteria counts when compared to corn starch for short set
yoghurt. This is in contrast to long set yoghurt where CMC and corn starch gave highest values
for TVC and lactic acid bacteria.
Total viable count and lactic acid bacteria count significantly (p < 0.05) decreased with
increase in concentration. TVC values for short set yoghurt were 8.98x10⁵ cful/ml at 0 %
concentration, 4.65x10⁵ cfu/ml at 0.5 % and 3.39x10
5 cfu/ml at 1.0 % concentrations
respectively. The rate of multiplication of total viable count (Table 10) for short set yoghurt
indicates that at 0.5 % concentration of CMC, the rate of TVC was higher. This suggests that this
concentration of stabilizer provided the optimum conditions for the growth of the
microorganisms when compared to 1.0 % concentration of the same stabilizer. For corn starch
and gum acacia, the rate of total viable count production decreased with increase in
concentration of the stabilizers, apparently because they did not provide optimum conditions for
growth of the micro organisms.
On the other hand, the rate of multiplication of total viable count for long set yoghurt
shows that the rate of change was slow at 0.5 % concentration when compared to 0 % and 1.0 %
concentration of the stabilizer. This could be as a result of the lower temperature of incubation

86
in the long set yoghurt. However, as shown in Figs. 21 and 22 as well as 23 and 24, similar levels
of microbial growth achieved in the short set in 5 hours of fermentation were also achieved in 24
hours of fermentation in the long set yoghurt.
LAB values for short set yoghurt at 0 % concentration were 7.8 x 10⁵cful, 3.72x10
5
cfu/ml at 0.5 % concentration and 2.96x10⁵ cfu/ml at 1.0 % concentrations. This is in contrast to
long set yoghurt where increases in concentration significantly (p < 0.05) lead to an increase in
the total viable count and lactic acid bacteria count. The values obtained at 0 % concentration
ranged from 4.23x10⁵ cful/ml, 3.37x10
5 cfu/ml at 0.5 % concentration and 4.07x10
5 cful/ml at
1.0% concentration for total viable count and LAB respectively. However, decrease in the
activity of the lactic acid bacteria caused an increase in the pH of the yoghurt samples. The rate
of LAB multiplication for short set yoghurt (Table 10) indicates that at 0.5 % concentration of
CMC, multiplication of LAB was faster when compared to 1.0 % concentration. The rate of
multiplication of LAB for corn starch and gum acacia shows a decrease with increase in
concentration of the stabilizer. This could be as a result that the optimum conditions for LAB
proliferation were provided at 0.5 % concentration of CMC when compared to other
concentrations.
From the Table 10, it was observed that LAB proliferation for the different stabilizers at 0.5 %
concentration was slow when compared to the rate of proliferation of LAB at 1.0 %
concentration; this could be attributed to the conditions of fermentation which did not favour the
rapid LAB growth.
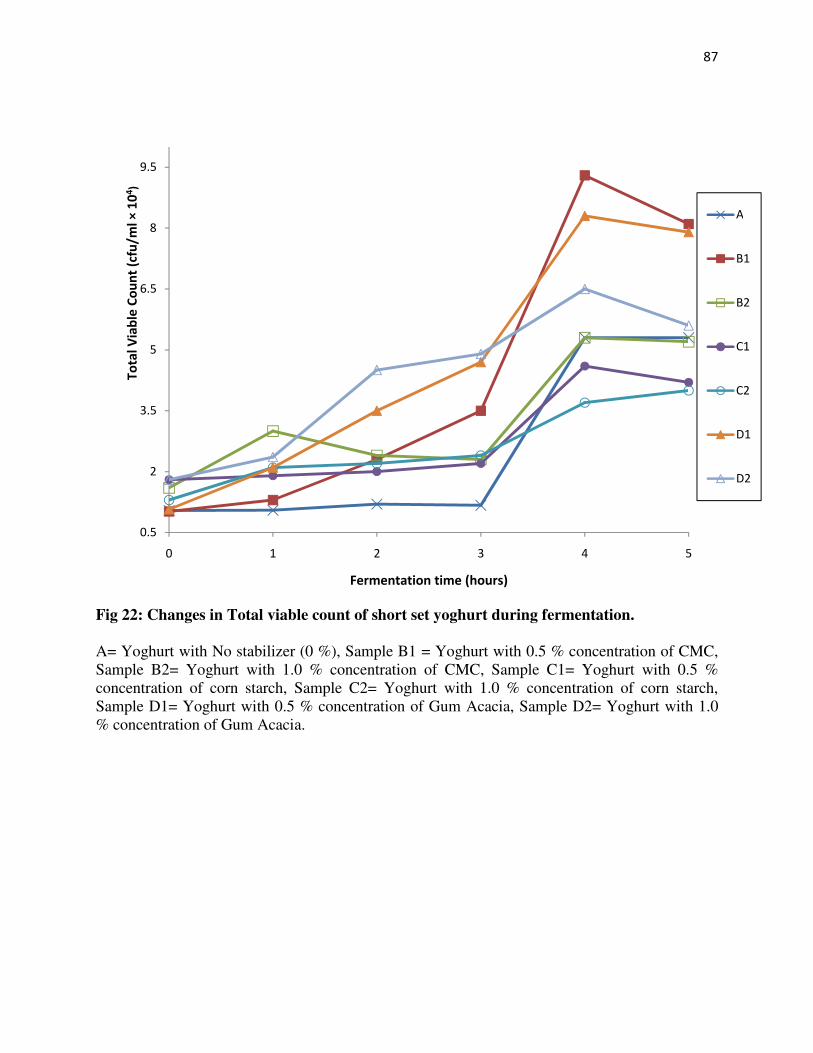
87
Fig 22: Changes in Total viable count of short set yoghurt during fermentation.
A= Yoghurt with No stabilizer (0 %), Sample B1 = Yoghurt with 0.5 % concentration of CMC,
Sample B2= Yoghurt with 1.0 % concentration of CMC, Sample C1= Yoghurt with 0.5 %
concentration of corn starch, Sample C2= Yoghurt with 1.0 % concentration of corn starch,
Sample D1= Yoghurt with 0.5 % concentration of Gum Acacia, Sample D2= Yoghurt with 1.0
% concentration of Gum Acacia.
0.5
2
3.5
5
6.5
8
9.5
0 1 2 3 4 5
To
tal
Via
ble
Co
un
t (c
fu/m
l ×
10
4)
Fermentation time (hours)
A
B1
B2
C1
C2
D1
D2

88
Fig. 23: Changes in Total Viable count of long set yoghurt during fermentation.
A= Yoghurt with No stabilizer (0 %), Sample B1 = Yoghurt with 0.5 % concentration of CMC,
Sample B2= Yoghurt with 1.0 % concentration of CMC, Sample C1= Yoghurt with 0.5 %
concentration of corn starch, Sample C2= Yoghurt with 1.0 % concentration of corn starch,
Sample D1= Yoghurt with 0.5 % concentration of Gum Acacia, Sample D2= Yoghurt with 1.0
% concentration of Gum Acacia.
0.5
2
3.5
5
6.5
8
9.5
0 4 8 12 16 20 24
Tota
l V
iab
le C
ou
nt
(cfu
/ml
x 1
04)
Fermentation time (hours)
A
B1
B2
C1
C2
D1
D2

89
Fig 24: Changes in LAB count of short set yoghurt during fermentation.
A= Yoghurt with No stabilizer (0 %), Sample B1 = Yoghurt with 0.5 % concentration of CMC,
Sample B2= Yoghurt with 1.0 % concentration of CMC, Sample C1= Yoghurt with 0.5 %
concentration of corn starch, Sample C2= Yoghurt with 1.0 % concentration of corn starch,
Sample D1= Yoghurt with 0.5 % concentration of Gum Acacia, Sample D2= Yoghurt with 1.0
% concentration of Gum Acacia.
0.5
1.5
2.5
3.5
4.5
5.5
6.5
7.5
8.5
0 1 2 3 4 5
La
ctic
Aci
d B
act
eria
co
un
t (
cfu
/ml
×1
04)
Ferrmentation time (hours)
A
B1
B2
C1
C2
D1
D2

90
Fig 25: Changes in LAB count of long set yoghurt during fermentation.
A= Yoghurt with No stabilizer (0 %), Sample B1 = Yoghurt with 0.5 % concentration of CMC,
Sample B2= Yoghurt with 1.0 % concentration of CMC, Sample C1= Yoghurt with 0.5 %
concentration of corn starch, Sample C2= Yoghurt with 1.0 % concentration of corn starch,
Sample D1= Yoghurt with 0.5 % concentration of Gum Acacia, Sample D2= Yoghurt with 1.0
% concentration of Gum Acacia.
0.5
1.5
2.5
3.5
4.5
0 4 8 12 16 20 24
LA
B C
ou
nt
(cfu
/ml ×
10
4)
Fermentation time (hours)
A
B1
B2
C1
C2
D1
D2
91
Fermentation time lead to a significant (p < 0.05) increase in the total viable count of short set
and long set yoghurt as shown in Figure 21 and 22.This is in line with other reported works of
Gassem et al. (2000) who reported LAB evolution in yoghurt to show an increase in number
versus fermentation time. Total viable count for short set yoghurt ranged from 1.30x10⁵ cfu/ml to
1.05x10⁴ cfu/ml, that of long set yoghurt ranged from 1.30x10
5 cfu/ml to 7.40 x10
5 cfu/ml. This
count could be responsible by the organisms that make up the starter culture used for the
fermentation of the milk (streptococcus spp and Lactobacillus spp). This could be compared
with the report of Taylor et al. (1997) that the bacteria making up the starter culture used for the
fermentation could give a count up to 108 per gram of yoghurt. Lactic acid bacteria count ranged
from 1.60x10⁵ cfu/ml to 8.40x10
5 cfu/ml for short set, that of long set yoghurt ranged from
1.50x10⁵ cfu/ml to 4.07 x 10
5 cfu/ml. No mould growth and coliform was observed in the short
set and long set yoghurt.
The significant interaction effect between stabilizers and concentrations of the different
stabilizers suggests that the behaviour of the different stabilizers were different at different
concentrations. That means that higher concentrations magnified the differences between
stabilizers in both total viable count and lactic acid bacteria count in the short set and long set
yoghurts, respectively.

92
4.4 Sensory Evaluation of short set and long set yoghurt
Sensory evaluation results of yoghurt samples stabilized with CMC, corn starch and gum
acacia at 0 %, 0.5 % and 1.0 % concentrations for short set (Tables 11-15) and long set (Tables
16-20) yoghurts show that the addition of the three stabilizers lead to significant (p < 0.05)
differences in the sensory parameters of the yoghurt samples.
Generally, the desirability of all the sensory parameter for short set yoghurt reached its
maximum at 1.0 % concentration, while that of long set yoghurt was at 0.5 % concentration of
the stabilizers. The flavor and taste of short set yoghurt produced with corn starch was most
preferred, though it did differed significantly (p < 0.05) from the that produced by the addition of
0.5 and 1.0 % concentration of CMC for long set yoghurt. This could be as a result of starch
hydrolysis which leads to the release of sweetening properties of the starch (Erickson, 2006).
Though long set yoghurt rated high in yoghurt taste as a result of the gradual build-up of lactic
acid which resulted in yoghurt with distinctive and characteristic sharp and acidic taste as
reported by (Muhammad et al., 2009).It was observed in short set yoghurt that all the sensory
parameters improved with increase in concentration of the stabilizers and as fermentation time
progressed (3-5 hours). This was not the same for long set yoghurt because the sensory
parameters reached its maximum peak at 16 hours of fermentation before decline commenced.
Therefore, the differences between the stabilizers could be attributed to the acidity level
developed during fermentation (Alakali et al., 2007).
The results shows that 0.5 % and 1.0 % concentrations of gum acacia gave the least mouthfeel
which differed significantly(p < 0.0) from that of CMC and corn starch in the short set and long
set yoghurt. The addition of 0.5 % and 1.0 % concentrations of CMC gave the best mouthfeel for
short set yoghurt; the same effect was observed in long set yoghurt but differed slightly after the

93
peak hour of 16 hour of fermentation. The colour of yoghurt samples produced with CMC rated
high, this is because one of the most important properties of CMC utilized in their wide range of
practical application is the ability to impart viscosity to the aqueous solution (Edali et al., 2001).
It is this property of CMC on the yoghurt samples that appealed to the consumers.
The interaction effect between stabilizers and concentrations on the sensory parameters shows
that the differences between the stabilizers were different at different concentrations or that the
differences between stabilizers on the colour, taste, flavor, mouthfeel and overall acceptability of
short set and long set yoghurt were magnified at higher concentrations. Therefore, sensory scores
shown in Tables 14 and 19 shows that yoghurt stabilized with 0.5 % and 1.0 % concentrations
were most preferred for mouthfeel but yoghurt stabilized with 0.5 % and 1.0 % concentrations of
corn starch had the overall sensory characteristics in short set and long set yoghurt (Tables 15
and 20).
Table 11: Sensory Analysis for colour of short set yoghurt
Stabilizer
Concentration
Fermentation Time (hours)
3
4
5
CMC 0 6.75±0.44ab
7.00±0.00a
7.35±0.59a
0.5 6.45±0.51c
6.80±0.41a
7.30±0.47a
1.0 6.20±0.41b
6.60±0.59b
6.55±0.61a
Corn starch 0 6.75±0.44ab
7.00±0.00a
7.35±0.59a
0.5 5.60±0.59c
6.00±0.34b
6.65±0.49a
1.0 6.10±0.31c
6.75±0.44b
7.30±0.47a
Gum acacia 0 6.75±0.44ab
7.00±0.00a
7.35±0.59a
0.5 6.10±0.31b
6.35±0.49ab
6.60±0.50a
1.0 6.25±0.44c
6.60±0.68b
7.45±0.51a
Mean ± SD of triplicate readings
Values with different superscript in the same row are significantly different
Sample A = No Stabilizer B1 = 0.5 % conc. of CMC B2 = 1.0% conc. of CMC C1 = 0.5 % conc. of Corn Starch C2 =
1.0 % conc. of corn starch D1 = 0.5 conc. of gum
acacia D2 = 1.0 % conc. of gum acacia.

94
Table 12: Sensory Analysis for flavour of short set yoghurt
Stabilizer
Concentration
Fermentation Time (hours)
3
4
5
CMC 0 6.00±0.00c
6.40±0.50b
6.80±0.41a
0.5 6.20±0.41c
6.45±0.51b
6.80±0.41a
1.0 5.60±0.50a
5.65±0.49a
5.25±0.72b
Corn Starch 0 6.00±0.00c
6.40±0.50b
6.80±0.41a
0.5 5.25±0.55b
5.80±0.62ab
6.20±0.41a
1.0 5.85±0.49c
6.55±0.69b
7.10±0.31a
Gum acacia 0 6.00±0.00c
6.40±0.50b
6.80±0.41a
0.5 5.30±0.92b
6.20±0.69a
6.40±0.50a
1.0 6.15±0.37c
7.00±0.46ab
7.15±0.49a
Mean ± SD of triplicate readings
Values with different superscript in the same row are significantly different
Sample A = No Stabilizer B1 = 0.5 % conc. of CMC B2 = 1.0% conc. of CMC C1 = 0.5 % conc. of Corn
Starch C2 = 1.0 % conc. of corn starch D1 = 0.5 conc. of gum
acacia D2 = 1.0 % conc. of gum acacia.
Table 13: Sensory Analysis for taste of short set yoghurt
Stabilizer
Concentration
Fermentation Time (hours)
3
4
5
CMC 0 6.15±0.37c
6.30±0.47b
6.95±0.22a
0.5 5.80±0.41c
6.20±0.41b
6.70±0.47a
1.0 5.35±0.49a
5.05±0.61b
5.35±0.81a
Corn Starch 0 6.15±0.37c
6.30±0.47b
6.95±0.22a
0.5 5.15±0.49a
6.10±0.64b
6.85±0.59a
1.0 5.80±0.41c
6.55±0.51b
7.05±0.51a
Gum acacia 0 6.15±0.37c
6.30±0.47b
6.95±0.22a
0.5 4.60±1.47c
6.00±0.97b
6.45±0.61a
1.0 5.95±0.39b
6.90±0.72a
7.10±0.55a
Mean ± SD of triplicate readings
Values with different superscript in the same row are significantly different
Sample A = No Stabilizer B1 = 0.5 % conc. of CMC B2 = 1.0% conc. of CMC C1 = 0.5 % conc. of Corn
Starch C2 = 1.0 % conc. of corn starch D1 = 0.5 conc. of gum
acacia D2 = 1.0 % conc. of gum acacia.

95
Table 14: Sensory Analysis for mouthfeel of short set yoghurt
Stabilizer
Concentration
Fermentation Time (hours)
3
4
5
CMC 0 6.25±0.44b
6.55±0.51b
6.90±0.31a
0.5 6.30±0.57c
6.55±0.51b
6.85±0.37a
1.0 5.40±0.50b
5.40±0.68b
5.65±0.49a
Corn Starch 0 6.25±0.44b
6.55±0.51b
6.90±0.31a
0.5 5.35±0.59b
6.00±0.32a
6.30±0.47a
1.0 6.00±0.46b
6.80±0.41ab
7.00±0.46a
Gum acacia 0 6.25±0.44b
6.55±0.51b
6.90±0.31a
0.5 4.80±1.39c
6.10±0.85b
6.20±0.69a
1.0 6.10±0.64b
7.00±0.00a
7.40±0.50a
Mean ± SD of triplicate readings
Values with different superscript in the same row are significantly different
Sample A = No Stabilizer B1 = 0.5 % conc. of CMC B2 = 1.0% conc. of CMC C1 = 0.5 % conc. of Corn
Starch C2 = 1.0 % conc. of corn starch D1 = 0.5 conc. of gum
acacia D2 = 1.0 % conc. of gum acacia.
Table 15: Sensory Analysis for overall acceptability of short set yoghurt
Stabilizer
Concentration
Fermentation Time (hours)
3
4
5
CMC 0 6.05±0.22c
6.80±0.52b
7.35±0.49a
0.5 6.00±0.31b
6.60±0.50b
7.05±0.39a
1.0 5.90±0.31b
5.55±0.83c
6.05±0.69a
Corn Starch 0 6.05±0.22c
6.80±0.52b
7.35±0.49a
0.5 5.20±0.41c
6.35±0.61b
6.95±0.22a
1.0 6.10±0.55c
7.30±0.47b
7.90±0.31a
Gum acacia 0 6.05±0.22c
6.80±0.52b
7.35±0.49a
0.5 5.40±1.09c
6.75±0.44b
6.90±0.31a
1.0 6.50±0.51b
7.25±0.44a
7.65±0.49a
Mean ± SD of triplicate readings
Values with different superscript in the same row are significantly different
Sample A = No Stabilizer B1 = 0.5 % conc. of CMC B2 = 1.0% conc. of CMC C1 = 0.5 % conc. of Corn
Starch C2 = 1.0 % conc. of corn starch D1 = 0.5 conc. of gum
acacia D2 = 1.0 % conc. of gum acacia.

96
Table 16: Sensory Analysis for colour of long set yoghurt
Stabilizer
Concentration
Fermentation Time (hours)
8
16
24
CMC 0 7.10±0.64b
7.50±0.51a 7.35±0.49
ab
0.5 7.10±0.55b 8.30±0.73
a 7.10±0.31
b
1.0 6.75±0.55c 7.95±0.51
a 7.05±0.69
b
Corn Starch 0 7.10±0.64b
7.50±0.51a 7.35±0.49
ab
0.5 7.10±0.31c 8.20±0.69
a 7.35±0.49
b
1.0 6.90±0.31c 7.80±0.41
a 7.30±0.57
b
Gum acacia 0 7.10±0.64b
7.50±0.51a 7.35±0.49
ab
0.5 6.90±0.45c 7.40±0.75
a 7.10±0.64
ab
1.0 6.80±0.41b 7.10±0.31
a 6.90±0.91
b
Mean ± SD of triplicate readings
Values with different superscript in the same row are significantly different
Sample A = No Stabilizer B1 = 0.5 % conc. of CMC, B2 = 1.0 % conc. of CMC, C1 = 0.5 % conc. of Corn
Starch, C2 = 1.0 % conc. of Corn starch, D1 = 0.5 % conc. of Gum Acacia, D2 = 1.0 % conc. of Gum Acacia.
Table 17: Sensory Analysis for flavour of long set yoghurt
Stabilizer
Concentration
Fermentation Time (hours)
3
4
5
CMC 0 6.10±0.31c 7.30±0.44
a 6.90±0.31
b
0.5 6.05±0.39c 8.10±0.55
a 6.80±0.41
b
1.0 4.55±0.89c 5.40±0.99
a 4.90±0.33
b
Corn Starch 0 6.10±0.31c 7.30±0.44
a 6.90±0.31
b
0.5 5.10±0.55c 7.35±0.59
a 6.55±0.51
b
1.0 5.45±0.60b 6.95±0.51
a 6.90±0.64
a
Gum acacia 0 6.10±0.31c 7.30±0.44
a 6.90±0.31
b
0.5 5.05±0.39c 6.60±0.50
a 6.55±0.76
b
1.0 5.05±0.77c 7.20±0.62
a 6.40±0.82
b
Mean ± SD of triplicate readings
Values with different superscript in the same row are significantly different
Sample A = No Stabilizer B1 = 0.5 % conc. of CMC, B2 = 1.0 % conc. of CMC, C1 = 0.5 % conc. of Corn
Starch, C2 = 1.0 % conc. of Corn starch, D1 = 0.5 % conc. of Gum Acacia, D2 = 1.0 % conc. of Gum Acacia.
Table 18: Sensory Analysis for taste of long set yoghurt
Stabilizer
Concentration
Fermentation Time (hours)
3
4
5
CMC 0 6.00±0.46c 7.30±0.80
a 6.85±0.37
b
0.5 5.80±0.41c 7.95±0.69
a 6.40±0.59
b
1.0 4.85±0.67b 5.55±0.83
a 5.45±0.94
a
Corn Starch 0 6.00±0.46c 7.30±0.80
a 6.85±0.37
b
0.5 4.80±0.62c 7.60±0.50
a 6.55±0.51
a
1.0 5.05±0.51b 6.75±0.72
a 6.65±0.67
a
Gum acacia 0 6.00±0.46c 7.30±0.80
a 6.85±0.37
b
0.5 4.90±0.64c 6.50±0.61
a 5.80±0.95
b
1.0 5.10±0.64b 6.45±0.76
a 6.20±0.62
a
Mean ± SD of triplicate readings
Values with different superscript in the same row are significantly different
Sample A = No Stabilizer B1 = 0.5 % conc. of CMC, B2 = 1.0 % conc. of CMC, C1 = 0.5 % conc. of Corn
Starch, C2 = 1.0 % conc. of Corn starch, D1 = 0.5 % conc. of Gum Acacia, D2 = 1.0 % conc. of Gum Acacia.

97
Table 19: Sensory Analysis for mouthfeel of long set yoghurt
Stabilizer
Concentration
Fermentation Time (hours)
8
16
24
CMC 0 7.00±0.56ab
7.30±0.47a 6.90±0.64
b
0.5 6.75±0.56b 8.05±0.61
a 6.85±0.49
b
1.0 5.70±0.80a 7.00±0.56
a 6.55±0.60
b
Corn Starch 0 7.00±0.56ab
7.30±0.47a 6.90±0.64
b
0.5 6.40±0.75c 7.80±0.52
a 7.10±0.45
b
1.0 5.95±0.51b 7.10±0.79
a 7.45±0.60
a
Gum acacia 0 7.00±0.56ab
7.30±0.47a 6.90±0.64
b
0.5 5.85±0.67b 6.65±0.59
a 6.65±0.75
a
1.0 5.80±0.52c 5.70±0.92
a 5.50±0.83
a
Mean ± SD of triplicate readings
Values with different superscript in the same row are significantly different
Sample A = No Stabilizer B1 = 0.5 % conc. of CMC, B2 = 1.0 % conc. of CMC, C1 = 0.5 % conc. of Corn
Starch, C2 = 1.0 % conc. of Corn starch, D1 = 0.5 % conc. of Gum Acacia, D2 = 1.0 % conc. of Gum Acacia.
Table 20: Sensory Analysis for overall acceptability of long set yoghurt
Stabilizer
Concentration
Fermentation Time (hours)
8
16
24
CMC 0 7.25±0.72b 7.70±0.57
a 7.20±0.41
b
0.5 6.50±0.51c 8.05±0.69
a 7.10±0.45
b
1.0 5.75±0.72b 7.30±0.57
a 6.80±0.69
b
Corn Starch 0 7.25±0.72b 7.70±0.57
a 7.20±0.41
b
0.5 5.90±0.64c 7.80±0.52
a 7.15±0.49
b
1.0 5.85±0.49b 7.30±0.47
a 7.55±0.51
a
Gum acacia 0 7.25±0.72b 7.70±0.57
a 7.20±0.41
b
0.5 5.45±0.49b 7.05±0.39
a 6.55±0.94
b
1.0 5.55±0.51c 6.15±0.04
ab 6.40±0.59
a
Mean ± SD of triplicate readings
Values with different superscript in the same row are significantly different
Sample A = No Stabilizer B1 = 0.5 % conc. of CMC, B2 = 1.0 % conc. of CMC, C1 = 0.5 % conc. of Corn
Starch, C2 = 1.0 % conc. of Corn starch, D1 = 0.5 % conc. of Gum Acacia, D2 = 1.0 % conc. of Gum Acacia.

98
CHAPTER FIVE
CONCLUSION AND RECOMMENDATION
5.1 CONCLUSION
The results obtained in this work indicate that the addition of stabilizers improved the
proximate, physicochemical and sensory properties of short set and long set yoghurt. It was also
observed that 0.5 % concentration of CMC and corn starch was optimal for short set and long set
yoghurts and use of these stabilizers beyond this concentration is wastage when compared to
gum acacia which appeared to require higher concentration of more than 1 % in order to equate
with 0.5 % - 1.0 % CMC. Therefore, the use of CMC and corn starch is more suitable for the
production of set yoghurt than gum acacia. However, gum acacia could not impart good textural
properties to the yoghurt samples but produced yoghurt with good tart and acidic taste. The
sensory characteristics of long set yoghurt gave the desired taste even after 24 hours of
fermentation when compared to short set yoghurt and produced distinctive and characteristic
sharp acidic taste due to the gradual build-up of lactic acid. Therefore, long set yoghurt was
preferred to short set yoghurt by the panelists, since elevated temperature of incubation for short
set gave a rough texture when compared to the long set yoghurt texture.
RECOMMENDATION
Further works are needed to investigate the keeping quality of long set yoghurt by
thermization and storage by freezing or refrigeration. The behaviour of these stabilizers in
thermized yoghurt and their stabilities during storage should be further investigated. However,
there is need to find out ways to improve the acidity of short set yoghurt. Also, there is need to
improve the use of gum acacia by combining with other stabilizers in order to improve its
rheological properties since it produces fine textural properties in dairy products.
99
CONTRIBUTION TO KNOWLEDGE
The Consumer – Good quality yoghurt which is spoonable (thicker) and higher quantities of
vitamin B3 will be made available to consumers through incorporation of CMC, starch and gum
acacia stabilizers.
The food processor/industry – Short set yoghurt may give a quicker turn over to products and
the use of CMC may give a higher quantity of yoghurt. Alternatively, where electricity may be a
challenge, long set yoghurt would give an equivalent effect. Use of CMC and corn starch may be
more economical at 0.5 % level of inclusion.
The policy makers – All or any of the stabilizers can be approved for use. The choice should be
left to producers to make.
The academic community – Due to the paucity of information, the data generated from this
research will be used for baseline studies on the effect of stabilizers after fermentation.

100
REFERENCES
Achi, O. K. (2005). The potential for upgrading traditional fermented foods through
biotechnology. African Journal of Biotechnology, 4(5): 375 - 380.
Adam, M. R. and Moss, M. O (1995). Fermented and Microbial Foods. In: Food Microbiology.
The Royal society of chemistry, Cambridge. pp. 252 – 502.
Adam, M. R.(1990). Tropical Aspects of Fermented Foods. Trends in Food science and
Technology In: Fermentation as a Method of Food Processing. Peter Sahlin. pp.15 - 16
Adolfsson, O., Meydani, S. N. and Russel, R. M. (2004). Yoghurt and gut function. American
Journal of Clinical Nutrition, 80(2): 245 - 256.
Ajayi, F. (2006).The technology of traditional milk products in developing countries.
online@http://www.technology of main products/traditionalmilkproducts. Accessed
June, 2011.
Alais, C., and Linden, G. (1999). Food Biochemistry. Chapman and Hall Food science Book.
Aspen publishers, Inc. Gaithersburg, Maryland. pp. 46 – 50.
Alakali, J. S., Okonkwo, T. M., and Iordye, E. M. (2007). Effect of stabilizers on the physio-
chemical and sensory attributes of thermized yoghurt. African Journal of
Biotechnology, 2: 158 – 163.
Alm, L. (1982). Effect of Fermentation on B-Vitamin content of milk in sweden. Journal of Dairy
Science, 65: 353 - 359.
Annon. (2011a ).Tigernut.http://en.wikipedia.org/tigernut. Accessed July, 2011.
Annon. (2011b ).Dairy product. http://en.wikipedia.org/wiki/dairy-manufacture. Accessed, July,
2011.
Annon. (2011c ).Yoghurt.online@ http://en.wikipedia.org/makeyourownyoghurt.com/make-
yoghurt/wait-seven-hours. Accessed July, 2011.
AOAC. (2010). Official Methods of Analysis. Association of Official Analytical Chemists. (18th
Edition). Gaithersburg, USA.
Articlebase (2011). Tigernutmilk.online@http://www.articlesbase.com/drinks-articles/tigernut-
drinkmilk-3200256.html. Accessed July, 2011.
Aswal, P. Shukla, A. and Priyadarshi, S. (2012). Yoghurt: Preparation, characteristics and Recent
Advancements. International Journal of Bio-Protocols. 1(2): 32-44.
Atlas, R. M. (1995). Principles of Microbiology.2nd
Edition. MOSBY London. pp. 128 – 954.

101
Awan, J. A. (1995). Chemical additives as non-preservatives. Elements of Food Science and
Technology. (2nd
Edition).Washington DC, pp. 190.
Ayenor, G. S. and Ocloo, F. C. (2007). Physicochemical changes and diastatic activity associated
with germinating paddy rice (PSB.RC 34). African Journal of Food Science, 1: 37 –
41.
Bandler, D. K., and Singh, R. P. (2009) Dairy productonline@http://www.food.gov.uk/multimedia
/pdfs/publication/understandfoodlabellingterm.pdf. Accessed July, 2011.
Baray, S. (2009). Fiber Ingredients; Food Applications and health Benefits. CRC Press. pp. 31 –
56.
Benkerroum, N. and Tamime, A. Y. (2004).Technology transfer of Moroccan traditional dairy
product (Leben,jben andsmen) to small industrial scale. Food Microbiology, 21: 399 -
413.
Beshkova, D. M., Simova, E. O., Frengova, G. T., Simov, Z. I. and Adilor, E. F. (1998).
Production of amino acids by yoghurt bacteria. Biotechnology Progress, 14: 963 – 965.
Bianchi-Salvadori, B.,Cannaschella, P. and Cislaghi, S. (1995). Rapid enzymatic method of
biotyping and control of Lactic acid bacteria used in the production of yoghurt and
some Cheeses. International Journal of food Microbiology, 27: 253 – 261.
Bodyfelt, F., Tobias, W. J. and Trout, G. M. (1988). Sensory Evaluation of Dairy products. Van
Reinhold. New York. pp. 140 – 145.
Boulevard, D. (2008). Food fermentation, yoghurt. online@http://fermentationtechnology.blogspot
.com/2008/04/yoghurt fermentation.html. Accessed June,2011.
Bouzar, F., Cerning, J. and Desmazeaund, M. (1997). Exopolysaccharide production and texture-
promoting abilities of mixed strain starter cultures in yoghurt production. Journal of
Diary Science, 80: 2310 – 2317.
Burton, J. W. (1985). Breeding soybean for improved protein quality and quantity. In: Proceeding
of the 3rd
World Soybean Research conference, (Shibles Revised eds.) West View
Press, Bowlder, Colorado pp. 136 – 165.
Buttriss, J. (1997). Nutritional properties of fermented milk products. International Journal of
Dairy Technology, 50: 21 – 27.
Bylund, G. (1995). Dairy Processing Handbook, Tetra pak Processing System A/B., Lund Sweden.
pp. 243 – 246.
Canadian Dairy Commission (2007). “Fermented milk products”.
www.microbiologyprocedure.com/microbiology-in-dairy/fermented-dairy-
products.htm. Accessed, July, 2011.
102
Chandan, R. C., and Shahani, K. M. (1993). Dairy Science and Technology Handbook. VCH
publishers, Inc. New York. pp. 241 – 261.
Chandrkanth, K., chandramouli, V. K., Srinivisan, R. A. and Natarajan, A. M. (1983). Starter
culture metabolism in some fermented dairy Products in India. Indian Journal of dairy
and Biosciences, 4: 12 – 18.
Chang, I. C., Shang, H. F., Lin, T., Wang, T. H., Lin, S. H. (2005). Effect of fermented Soymilk in
the intestinal bacteria ecosystem. World Journal of Gastroenterology, 11: 1225 – 1227.
Clark, J. (2002). The effect of Temperature on reaction Rates; [email protected]
experiment-yoghurt.html.Accessed July, 2011.
Connolly, E. J., White, C. H., Custer, E. W., and Vedamuthu, E. R. (1984). Cultures Dairy food
improvement manual. Cultured Dairy product Ins., Washington D. C. pp. 40 – 51.
Dannon, I. (2002). The History of Yoghurt. The Dannon Institute, Tarrytown. New York. pp. 9 –
27.
Davidson, R. L. (1980). Handbook of water soluble gums and resins. Mc Graw. Hill, New York.
pp. 36 - 48.
Dragnet, K. (2000). Alginates, In: Handbook of Hydrocolloids.CRC Press. pp. 379 – 395.
Early, R. (1998). The Technology of Diary Products. Second edition.Blackie and Sons Limited,
London. pp. 126 – 132.
Early, R. E. (1992). Technology of Dairy products, 1st Edition. London: Blackie Academic and
Professional. pp. 67 – 85.
Edali, M., Esmail, M. N. and Vatista, G. H (2001). Rheological properties of high concentrations
of carboxymethylcellulose solutions. Journal of Applied Polymer Science, 79:1787 -
1801.
Edward, R. F. (2003). Handbook of fermented functional foods. CRC Press, London. pp. 2 – 23.
Ehirim, F. N., Anorue, S. N and Osueke, J. C. (2004). Quality Evaluation of some Brands of
yoghurt sold in Owerri, imo State. Proceeding of the 28th Annual General Meeting/
Conference of the Nigerian Institute of Food Science and Technology held at
University of Ibadan, Ibadan, 12th
– 14th
October, 2004. pp. 84 – 85.
Ehirim, F.N., Anorue, S. N. and Osueke, J. C. (2004). Quality evaluation of some brands of
yoghurt sold in Owerri, Imo State. Proceeding of the 28th
Annual General
meeting/conference of the Nigerian Institute of Food science and technology held at
university of Ibadan, Ibadan, 12th
– 14th
Oct, 2004 Pp 84-85.
Elson, M. H., and Hass, M. D. (2005). Dairy [email protected]/sci/article.asp?
Accessed June, 2011.

103
Eqbal, D. and Abdullah, A. (2013). Utilization of Gum Arabic for industries and Human health.
American Journal of Applied Science, 10 (10): 1270 - 1279.
Erickson, A. (2006). Corn Refiners Association. (11th
Edition). Washington D.C. pp.1-40
Eteshola, E. and Oraedu, A. C. I., (1996). Fatty acid composition of Tigernut tubers (cyperus
esculentus), Baobab seeds (Adansonia digitata L.) and their mixtures. Journal of
American oil chemists society, 73: 255 – 257.
Euston, S. R., and Hirst, H. L.(2000). The emulsifying properties of commercial milk protein
products in simple oil-in-water emulsions and in a model food system. Journal of Food
Science, 65(6): 934 - 940
Fellow, P. J. (2009). Food Processing Technology. Principles and practice. (2nd
. Edition).
Woodhead Publishing Limited. Cambirdge England. pp. 170 – 195.
Foissy, H. (1983). Nutritional and Physiologial aspects of yoghurt. Journal of Food Science and
Technology Abstract, 16 (3): 2404 – 24089.
Friend, B., Fiedeler, J. Kneifel, W., and Shahani, K. (1983). Influence of culture selection on the
flavour, anti-microbial activity, beta-galactosidase and B-vitamin of yoghurt.
Milchwissen schaft, 38: 133 - 136.
Gadaga ,T. H., Nyanga, L. K. and Mutukumira, A. N. (2004). The occurrence ,growth and control
of pathogens on African fermented foods. African Journal of Food Agriculture
Nutrition and Development, 4(1): 20 – 23.
Gassem, M. A. and Abu-Tarboush, H. M. (2000). Lactic acid production by Lactobacillus
delbrueckii ssp. Bulgaricus in Camel’s and Cow’s whey. Journal of Diary Science, 55:
374 - 378
Goff, H. D. (1999). Yoghurt and other fermented milk products.online@http://foodsci.aps.uaguelp.
ca/dairyedu/yoghrut.html. Accessed July, 2011.
Granessha, C. (2005). Yoghurt – dietary benefits. [email protected]/food/health and
nutrition. Accessed July, 2011.
Guler-Akin, M. B, and Akin, M. S. (2007). Effect of cysteine and different incubation temperature
on the microflora, chemical composition and sensory characteristics of bio-yoghurt
made from goat’s milk. Food Chemistry, (2): 788 – 793.
Guowei Shu., Chuanna Li., He Chen and Changfeng Wang. (2014). Effect of Inoculum and
Temperature on the fermentation of Goat Yoghurt. Advance Journal of Food Science
and Technology, 6(1): 68 - 71
Holland, B, Welch, A. A., Unwin, I. D., Buss, D. H., Paul, A. A. and Southgate D. A. T. (1999).
The composition of Foods. The Royal society of chemistry. pp. 94 – 97.

104
Hussan, F. A. M., Flemy, A. and Enab, A. K. (1999). Utilization of some local polysaccharides in
the manufacturing of yoghurt. Egyptian Journal of Dairy Science, 27: 281 – 289.
Hutkins, R. W. (2006). Microbiology and Technology of fermented foods. Blackwell publishing.
pp. 1 -3.
Ihekoronye, A. I. and Ngoddy, P. O. (1985). Integrated Food Science and Technology for the
Tropics. Macmillan Publishers Ltd., London. pp. 106 – 112.
International Diary Federation. (1991). Yoghurt-determination of titratable acidity-potentiometric
method. IDF standard No. 150 Brussels.
Isam, A. M., Eissa, A. D., Yogoub, A. E. A. and Babiker, E. E. (2011). Pysicochemical,
microbiological and sensory characteristics of yoghurt produced from camel milk
during storage. Electronic Journal of Environmental, Agricultural and Food Chemistry,
10(6): 2305 - 2313.
ITC, (2008). Gum Arabic/Gum Acacia. Market News service (MNS), Quarterly Edition. pp.1 - 56
Iwe, M. O.(2002).Handbook of Sensory methods and Analysis. Rojoint Communication Services,
Enugu. pp. 2 - 20.
Jimoh, K. O., and Kolapo, A. L. (2007). Effect of different stabilizers on acceptability and shelf –
stability of soy-yoghurt. African Journal of Biotechnology, 6 (8): 1000 – 1003.
Joshi, V. K. and Pandey, A. (1999). Biotechnology. Educational publishers and Distributors,
London. pp. 1 – 24.
Junaid, A., Mohammed, S. M., Saeed, A. K. and Abdul, Q. K. (2008). HPLC analysis of water-
soluble vitamins (B1, B2, B3, B5, B6) in in-vitro and ex-vitro germinated chickpea
(Cicer arietinum L.). African Journal of Biotechnology, 7(14): 2310 - 2314.
Keating, K. R., and White, C. H. (1990). Effect of alternative sweeteners in plain and furit
flavoured yoghurts. Journal of Dairy Science, 73: 54 – 62.
Khan, M. T., Hussain, M., Wajid, A. and Rasool, S. A. (2008) Microbial population load and
enzyme production of indigenously isolated yeast drinks. Pakistan Journal of Biology,
40(50): 2225 – 2230.
Kneifel, W . and Mayer, H. K. (1991). Vitamin profiles of kefirs made from milks of different
species. International Journal of Food Science and Technology, 26: 423 - 428.
Kneifel, W., Jaros, D. and Erhard, F. (1993). Microflora and acidification proportion of yoghurt
and yoghurt related products fermented with commercial available starter culture.
International Journal of Food Microbiology, 18: 179 – 187.
Kossori, R. L. E., Sanchez, C., Bouston, E. S. E., Maucourt, M. N., Sauvaire, L. M., Megean,
L. andVillaume, C. (2000). Comparison of effects of prickley pear fruit, gum Arabic, ca

105
rageenan, alginic, locust bean gum and citrus pectin on viscosity and in-vitro multi-
enzyme digestibility of casein. Journal of Food Science and Food Agriculture, 80: 359 -
364.
Lee, W. J. and Lucey, J. A. (2003). Rheological properties, whey separation and microstructures in
set-style yoghurts: Effects of heating temperature and incubation temperature. Journal
of Texture studies, 34: 515 – 536.
Lee, W. J. and Lucey, J. A. (2004).Structure and physical properties of yoghurt gels: Effect of
inoculation rate and incubation temperature. Journal of Diary Science, 87: 3153 – 3164.
Lee, W. J. and Lucey, J. A. 92010). Formation and Physical properties of Yoghurt Asia-Australia.
Journal of Animal Science. 9: 1127-1136.
Lenter, C. (1986). Biochemistry, metabolism, pharmacogenetics and ecogenetics. In: Geigy
Scientific Tables. Vol. 4, (8th
Edition). Ciba- Geigy, basle. pp. 376 - 452.
Marero, L. M., Payumo, E. M., Librado, E. C., Lainez, W., Gopez, M. D. and Homma S. (1989).
Technology of weaning food formulations prepared from germinated cereals and
legumes. Journal of Food Science, 53: 1391 - 1395.
Martinez, V. (2003). Scientific analysis of effect of Tigernut on heart diseases and related aspects.
Tigernut and Health. pp. 1 – 26.
Masud, T., Sultan, K. and Shah, M. A (1991). Incidence of lactic acid bacteria isolated from
indigenous dahi. Austrlian Journal of Animal science, 4: 329 – 331.
Mbaeyi, I. E. and Awaziem, N. E. (2007). Effect of fermentation and Physico-chemical, sensory
qualities and storage stability of locally produced yoghyrt in Enugu metropolis.
Proceedings of 21 st annual conference/general meeting. 22 - 25 th
Oct. Abuja. pp. 228 -
229.
Mc Carthy, O. J. (2002). Principles and significant in Assessing Rheological and Texture
properties; Liquid products and semi-solid products. In: Rheology of milk and Dairy
products. Massey University, Palmerston North New Zealand. Pp 2445.
Mepba, H. D., Simeon, C., Achinewhu., Pillay, M. (2006). Stabilised cocosoy beverage:
physicochemical and sensory properties. Journal Science of Food and Agriculture, 86
(12): 1839 - 1846.
Montville, T. D. (1990). The evolving impact of Biotechnology of food microbiology. Journal of
Food safety, 18: 87 – 97.
Moon, S., Eun, K. A. S. and Hwa, S. (1993). Physiochemical properties of commercial Yoghurt in
Korean Journal of Food Science and Technology, 48: 89 – 92.

106
Muhammad, B. F., Abubakar, M. N. and Adegbola, T. A. (2009). Effect of Period and Condition
of storage on properties of yoghurt produced from cow milk and soymilk materials.
Research Journal of Dairy Sciences. 3(2): 18-24.
Naijrules (2011). Tigernuts. Online @ http://www.naijarules.com/ub/food-drink-nutrition-
recipes/38147-importance tigernut.Accessed July, 2011.
Nigerian Industrial Standard (NIS) (2004). Standards for yoghurt. Essential composition and
Quality Factor of yoghurt. pp. 1 - 8.
Noh, H., Han, K. I., Won, T. H. and Choi, Y. J. (1994). Effect of antibiotics, enzymes yeast culture
and probiotics on the growth performance of Isreali carp. Korean Journal of Animal
Science, 36: 480 - 486.
Nonaka, H. H. (1997). Plant carbohydrate derived products as fat replacers and calorie reducers.
Cereal Foods World, 42(5): 377 - 78.
Oberman, H. and Libudzisz, Z. (1982). Fermented milk. In: Microbiology of fermented foods.
(Brain, J. B. ed.) Blackie Academic and professional. Chapman and hall publishers,
London. pp. 308 - 345.
Ochanda,S. O., Onyang,O. C. A., Mwasaru, A. M., Ocheng, J. K. and Mathooko, F. M. (2010).
Effect of malting and fermentation treatments on group B-vitamins of red Sorghum,
white Sorghum and pearl millet in Kenya. Journal of Applied Biosciences, 34: 2128 -
2134.
Odibo,F. J. C., Nwabunia, F. and Osuigwe, D. I. (1990). Biochemical changes during fermentation
of Telfairia occidentalis seeds for ‘Ogiri’ production. World Journal of Microbial
Biotechnology, 6: 425 – 427.
Oladele, A. K. and Aina, Y. A. (2007). Tiger nut processing online@http://www.scialert.net/fulltex
t. Accessed July, 2011.
Oshadi, A. A., Ogungbenle, H. N. and Oladimeji, M. O. (1999). Chemical composition,
nutritionally valuable minerals and functional properties of beniseed, pearl millet and
quinoa flour. International Journal of Food Science and Nutrition, 50: 325 - 331.
Peng, Y., Horne, D. S. and Lucey, J. A. (2010). Physical properties of acid milk gels prepared at
37oC up to gelation but different incubation temperature for the remainder of
fermentation.
Petersen, K. (1989). Food Ingredients. Europe, Expoconsult Publishers, Maarssen. pp. 22 – 28.
Pinthong, R., Macrae, R. and Rothwell, J. (1980). The development of a soy-based yoghurt part II:
Sensory evaluation and analysis of volatiles. Journal of Food Science and Telchnology,
32: 313 – 324.

107
Pomeranz, Y. and Meloan, C. E. (1994). Determination of moisture. In: Food Analysis: Theory
and Practice,” 3rd
edition. Chapman and Hall. pp. 575 - 83.
Potter, N. N. and Hotchkiss, J. H. (1995). Food Science, (5th
. Edition). CBS publishers, Chapman
and Hall, inc., New York, pp. 264 – 277.
Prescott, L. M., Harley, J. P. and Klein, O. A. (2005) Microbial Nutrition, types, media.
Microbiology (6th
Edition). McGraw Hill publishers, New York. pp. 93 – 105.
Radkle-Mitchel, H. C. and Sandine, W. E. (1986). Influence of temperature on associative growth
of S. thermophilus and L. bulgaricus. Journal of Diary Science, 73: 894 – 899.
Rahman, M. S. and Farooqi, W. (1999). Selection of starter culture for yoghurt preparation and its
antibacterial activity. Pakistan Journal of Biological Sciences, 2: 131 – 133.
Ramaswamy, H. S. and Basak, S. (1992). Pectin and raspberry concentrate effects on the rheology
of stirred commercial yoghurt. International Journal of Food Science and Technology,
57 (2): 35 - 360.
Reedy, D. C., Rao, M. R. and Reedy, C. R. (1976). Synthesis of vitamins in yoghurt production
and other related products. Indian Journal of Dairy Science, 40: 393.
Reoper, J. A. (2014). Gum Acacia. In Hydrocolloid Application. Blackie Academic and
Professional, London. Pp 68-80.
Ripudaman, S. and Beniwal, A. (2003). A Randomized trial of yoghurt for prevention of anti-
associated diarrhea. Digestive diseases and sciences, 48 (10): 2077 – 2082.
Rubin, K.W. (1996). Everything we need to know about yoghurt and immunity. International
Journal of Food Science and Technology, 9: 72 – 97.
Sahid, Y., Tanq, M. and Tanq .A (2002). Quality Evaluation of Market Yoghurt (Dahi) Dairy
Technology Laboratory, National Agricultural Centre. Pakistan. pp.67 – 98
Saidi, B. and Warthesen, J. J. (1993). Influence of pH and light on the kinetics of Vitamin B6
Degradation. Journal of Agriculture and Food Chemistry.31: 876-880.
Sanful, R. E. (2009). Promotion of coconut in the production of yoghurt. African Journal of Food
Science, 3(5): 147 - 149
Shahani, K. M., Vakil, J.R., and Kilard, R. (1974). Natural antibiotic activity of lactobacillus
acidophilus and lactobacillus bulgaricus. Journal of culture and Dairy production 11(4):
14-17.
Shaker, R. R., Jumah, R. Y. and Abu-Jdayil, B. (2000). Rheological properties of plain yoghurt
during coagulation process: Impact of fat content and preheat treatment of milk. Journal
of Food Engineering, 44: 175 - 180.

108
Shanthan, N. L., Ram, L. N., O’Leary, J., Hicks, C. L. and Decker, E. A. (1995).Conjugated
Linoleic acid concentrations of dairy products as affected by processing and storage.
Journal of Food Science, 60: 695 – 698.
Sharma, R., Singh, H. and Taylor, M.W. (1996). Background to manufacturing practice of yoghurt.
Australian Journal of Diary Technology, 51: 12.
Shurtleff, W., and Aoyagi, A. (2004). History of fermented soymilks and its product. A report
from soy food centre. Lafayette, California. pp. 10 – 34.
Skriver, A., Ryemer, H. and Qvist, K. B. (1993). Rheological characteristics of stirred yoghurt.
Viscometery. Journal of Texture studies, 24: 185 – 198.
Steel, R. G. D. and Torrie, J. H. (1980). Principle and Procedure of Statistics. McGraw Hill,
Singapore. Pp. 107-110.
Tamime, A. Y., and Robinson., R. K. (1999). Yoghurt Science and Technology, (2nd
. Edition).
Cambridge: Woodhead publishing. pp.1 – 572.
Taylor, M.W., Singh, H. and Sharma, R. (1997). Manufacturing practice of yoghurt. Journal of
Diary Technology, 61: 21.
Ukwuoma, B., and Mauanya, C. (2003). Coconut oil boots immune response induces weight loss
in natural health. The Guardian Newspaper, Nigeria, 17th
July, 2003. pp. 45 – 46.
United Kingdom Food Standards Agency (UKFSA) (2009). Dairy Products. “foodstuffs made
from mammalian milk”. Online @ http://www.food.gov.uk/multimedia/pdfs/publicatio
n/undertandfoodlabellingterms.pdf. Accessed June, 2011.
USDA. (2004). National Nutrient Database for standard Reference, Release 161.
Uwagbute, A. C., Iroegbu, C. U. and Eke, O. (2000). Chemical and Sensory evaluation of
germinated cowpea (vigna unguiculata) and their products. Food chemistry, 68: 141-
146.
White, C. H. (1995). Manufacture of high quality yoghurt. Journal of Cultured Dairy Products, 30:
18 – 24.
Williams, P. A., Phillips, G. O. and Randall, R. C. (1990). Structure –function relationships of
gum Arabic. In: Gums and Stabilizers for the food industry. (Phillips, G. O. Williams,
P. A. and Wedlock, P. A. eds.) Oxford :IRL.Press. pp. 25 - 26.
Wollowski, I., Ji., S., Bakalinsky, A. T., Neudecker, C., Pool-Zobel, B. L. (1999). Bacteria used
for the production of yoghurt inactivate carcinogens and prevent DNA damage in the
colon of rats. Journal of Nutrition, 129: 77 – 82.
Yong, F. M. and Wood, B. J. B (1976). Microbial Succession in experimental soy sauce
fermentation. Journal of Food Technology, 11: 526 – 536.

109
Younus, S., Masud, T. and Aziz, T. (2002). Quality Evaluation of Market yoghurt/dahi. Pakistan
Journal of Nutrition, 1(5): 226 – 230.
Zahoor, T. M., Rafique, N., Huma and Bajawa, B. E. (2002). Stability and acceptability studies on the
banana fruit set yoghurt. Pakistan Journal of Food Science, 12: 41 – 45.

110
APPENDIX I
Fig.25: standard calibration curvecurve for niacin (Vit B3)
y = 61.13x - 118.5
R² = 0.999
0
1000
2000
3000
4000
5000
6000
7000
0 20 40 60 80 100 120
Pe
ak
Are
a (
mA
U)
Concentration (ug/ml)
Calibration Curve
peak area average
Linear (peak area average)

111
APPENDIX II
Physicochemical properties of short set and long set yoghurt
Table 21: Effect of Stabilizers on the Moisture Content of Short Set Yoghurt
Fermentation Time (Hours)
Parameter Sample 0 1 2 3 4 5
Moisture A 88.54±0.02a
87.59±0.33b
86.81±0.53b
84.33±1.13c
82.63±0.02d
82.46±0.03d
B1 84.77±0.02a
84.65±0.02b
84.29±0.02c
84.12±0.03d
83.78±0.02e
83.40±0.03f
B2 84.41±0.02a
84.29±0.02b
84.09±0.02c
83.85±0.02d
83.26±0.03e
82.78±0.03f
C1 85.63±0.02a
85.20±0.02b
85.10±0.03c
84.85±0.02d
84.59±0.02e
83.62±0.03f
C2 85.43±0.02a
84.75±0.02b
84.21±0.02c
84.15±0.03d
82.79±0.02e
82.26±0.03f
D1 86.97±0.02a
86.44±0.02b
85.76±0.03c
85.51±0.03d
84.73±0.03e
84.27±0.03f
D2 86.43±0.02a
86.41±0.03a
86.33±0.03b
85.24±0.03 84.59±0.09d
84.23±0.03e
Mean ± SD of triplicate readings
Values with different superscript the same row are significantly different Sample A = No Stabilizer B1 = 0.5 % conc. of CMC B2 = 1.0% conc. of CMC C1 = 0.5 % conc. of Corn
Starch C2 = 1.0 % conc. of corn starch D1 = 0.5 % conc. of Gum acacia D2 = 1.0 % conc. of Gum acacia.
Table 22: Effect of Stabilizers on the Fat Content of Short Set Yoghurt
Fermentation Time (Hours)
Parameter Sample 0 1 2 3 4 5
Fat A 3.12±0.04c 3.130.02
c 3.15±0.02
c 3.25±0.01
b 3.28±0.02
ab 3.33±0.05
a
B1 2.93±0.01c
2.92±0.04c
2.94±0.03c
3.07±0.05b
3.11±0.02b
3.23±0.02a
B2 2.98±0.02de
2.97±0.02de
3.04±0.06d
3.16±0.04c
3.26±0.02b
3.35±0.05a
C1 3.11±0.02b
3.12±0.02b
3.15±0.02b
3.21±0.04a
3.25±0.02a
3.25± 0.01a
C2 3.18±0.02d
3.20±0.01cd
3.24±0.04cd
3.25±0.05c
3.34±0.02b
3.42±0.05a
D1 2.67±0.02cd
2.65±0.01e
2.65±0.02d
2.70±0.01bc
2.73±0.02b
2.85±0.06a
D2 2.70±0.06c
2.71±0.02c
2.70±0.01c
2.85±0.02b
2.92±0.11b
3.13±0.01a
Mean ± SD of triplicate readings
Values with different superscript the same row are significantly different Sample A = No Stabilizer B1 = 0.5 % conc. of CMC B2 = 1.0% conc. of CMC C1 = 0.5 % conc. of Corn
Starch C2 = 1.0 % conc. of corn starch D1 = 0.5 % conc. of Gum acacia D2 = 1.0 % conc. of Gum acacia.

112
Table 23: Effect of Stabilizers on the Protein Content of Short Set Yoghurt
Fermentation Time (Hours)
Parameter Sample 0 1 2 3 4 5
Protein A 3.37±0.03d
3.36±0.04d
3.38±0.02cd
3.43±0.02c
3.59±0.02b
3.67±0.06a
B1 3.25±0.10c
3.32±0.02bc
3.33±0.03b
3.64±0.03a
3.68±0.01b
3.71±0.02a
B2 3.31±0.02c
3.28±0.04c
3.34±0.04c
3.43±0.02b
3.46±0.01a
3.53±0.05a
C1 3.13±0.03c
3.18±0.02c
3.26±0.05b
3.31±0.02b
3.43±0.04a
3.47±0.03a
C2 3.06±0.02d
3.12±0.04c
3.12±0.03c
3.28±0.02b
3.34±0.04a
3.34±0.03a
D1 3.33±0.04d
3.32±0.03d
3.33±0.04d
3.43±0.02b
3.56±0.03b
3.62±0.04a
D2 3.29±0.02 3.28±0.05c
3.29±0.02c
3.34±0.05bc
3.39±0.03ab
3.44±0 .03a
Mean ± SD of triplicate readings
Values with different superscript the same row are significantly different Sample A = No Stabilizer B1 = 0.5 % conc. of CMC B2 = 1.0% conc. of CMC C1 = 0.5 % conc. of Corn
Starch C2 = 1.0 % conc. of corn starch D1 = 0.5 conc. of Gum acacia D2 = 1.0 % conc. of Gum acacia.
Table 24: Effect of Stabilizers on the Ash Content of Short Set Yoghurt
Fermentation Time (Hours)
Parameter Sample 0 1 2 3 4 5
Ash A 0.34±0.02e
0.54±0.02d
0.56±0.02d
0.61±0.01c
0.65±0.02b
0.69±0.02a
B1 0.65±0.05bc
0.58±0.03c
0.63±0.04bc
0.70±0.01ab
0.75±0.05a
0.76±0.03a
B2 0.61±0.02b
0.62±0.03b
0.65±0.04b
0.76±0.04a
0.78±0.02a
0.79±0.01a
C1 0.56±0.04b
0.57±0.05b
0.57±0.02a
0.66±0.03a
0.69±0.01a
0.71±0.04a
C2 0.56±0.03a
0.59±0.08a 0.59±0.02
a 0.68±0.01
a 0.66±0.01
a 0.69±0.02
a
D1 0.47±0.05c
0.53±0.03bc
0.54±0.03b 0.63±0.01
a 0.68±0.01
a 0.66±0.04
a
D2 0.50±0.02b
0.52±0.04b
0.52±0.04b
0.64±0.05a
17.37±0.01a
0.69±0.00a
Mean ± SD of triplicate readings
Values with different superscript the same row are significantly different Sample A = No Stabilizer B1 = 0.5 % conc. of CMC B2 = 1.0% conc. of CMC C1 = 0.5 % conc. of Corn
Starch C2 = 1.0 % conc. of corn starch D1 = 0.5 conc. of Gum acacia D2 = 1.0 % conc. of Gum acacia.

113
Table 25: Effect of Stabilizers on the Total solid Content of Short Set Yoghurt
Fermentation Time (Hours)
Parameter Sample 0 1 2 3 4 5
Total Solid A 11.64±0.02d
12.41±0.35c
13.91±0.53c
15.67±1.13b
17.37±0.02a
17.54±0.03a
B1 15.23±0.02f
15.35±0.02e
15.70±0.02d
15.88±0.03c
16.22±0.02a
16.60±0.03a
B2 15.59±0.02f
15.71±0.02e
15.90±0.02d
16.36±0.03c 16.
74±0.03b
17.22±0.03a
C1 14.37±0.02d
14.80±0.02c
14.89±0.03c
15.15±0.02bc
15.41±0.02b
16.05±0.58a
C2 14.57±0.02f
15.25±0.02e
15.79±0.02d
15.85±0.03c
17.44±0.04b
17.74±0.03a
D1 13.03±0.02f
13.56±0.02e
14.24±0.03d
14.49±0.03c
15.27±0.03b
15.74±0.03a
D2 13.57±0.02d
13.59±0.03d
13.67±0.03d
14.76±0.03c
15.40±0.09b
15.70±0.13a
Mean ± SD of triplicate readings
Values with different superscript the same row are significantly different Sample A = No Stabilizer B1 = 0.5 % conc. of CMC B2 = 1.0% conc. of CMC C1 = 0.5 % conc. of Corn
Starch C2 = 1.0 % conc. of corn starch D1 = 0.5 % conc. of Gum acacia D2 = 1.0 % conc. of Gum acacia.
Table 26: Effect of Stabilizers on the Viscosity (Cp) of Short Set Yoghurt
Fermentation Time (Hours)
Parameter Sample 0 1 2 3 4 5
Viscosity A 1.48±0.03e
8.17±0.05d
8.87±0.32d
103.92±1.52c
197.89±1.06b
119.62±0.70a
B1 58.31±1.79e
96.66±1.36e
98.74±1.43d
154.30±3.21c
166.27±2.97b
264.00±2.39a
B2 97.74±0.49e
105.06±0.84d
106.41±0.90d
161.76±1.04c
169.88±1.58b
275.57±4.08a
C1 2.45±0.04e
784±0.01d
8.45±0.05d
120.62±0.48c
128.45±0.78b
239.51±1.81a
C2 3.02±0.04d
8.10±0.03c
8.55±0.03c
130.60±0.77b
130.65±0.82b
248.47±1.26a
D1 1.49±0.03e
4.85±0.25d
5.99±0.13d
90.82±1.42c
106.26±1.54b
120.68±429a
D2 2.5±0.03e
5.19±0.02d
6.18±0.03d
101.36±1.28c
111.00±1.20b
126.49±2.93a
Mean ± SD of triplicate readings
Values with different superscript the same row are significantly different Sample A = No Stabilizer B1 = 0.5 % conc. of CMC B2 = 1.0% conc. of CMC C1 = 0.5 % conc. of Corn
Starch C2 = 1.0 % conc. of corn starch D1 = 0.5 conc. of Gum acacia D2 = 1.0 % conc. of Gum acacia.
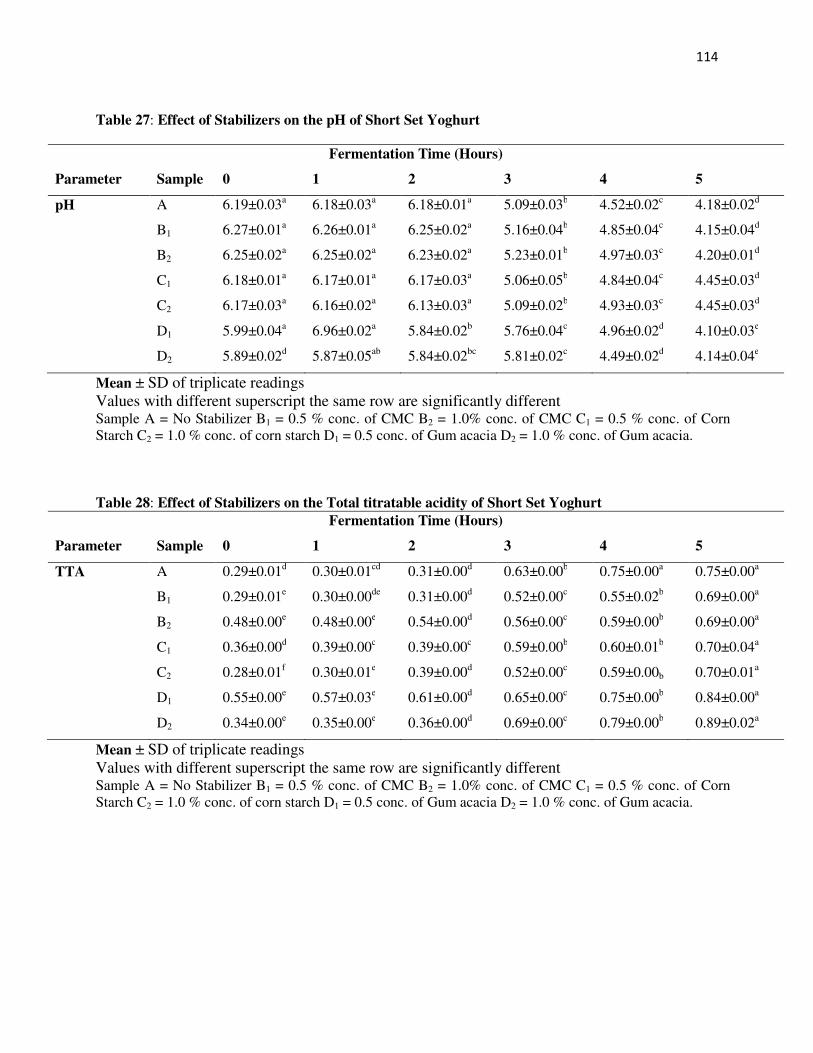
114
Table 27: Effect of Stabilizers on the pH of Short Set Yoghurt
Fermentation Time (Hours)
Parameter Sample 0 1 2 3 4 5
pH A 6.19±0.03a
6.18±0.03a
6.18±0.01a
5.09±0.03b
4.52±0.02c
4.18±0.02d
B1 6.27±0.01a
6.26±0.01a
6.25±0.02a
5.16±0.04b
4.85±0.04c
4.15±0.04d
B2 6.25±0.02a
6.25±0.02a
6.23±0.02a
5.23±0.01b
4.97±0.03c
4.20±0.01d
C1 6.18±0.01a
6.17±0.01a
6.17±0.03a
5.06±0.05b
4.84±0.04c
4.45±0.03d
C2 6.17±0.03a
6.16±0.02a
6.13±0.03a
5.09±0.02b
4.93±0.03c
4.45±0.03d
D1 5.99±0.04a
6.96±0.02a
5.84±0.02b
5.76±0.04c
4.96±0.02d
4.10±0.03e
D2 5.89±0.02d
5.87±0.05ab
5.84±0.02bc
5.81±0.02c
4.49±0.02d
4.14±0.04e
Mean ± SD of triplicate readings
Values with different superscript the same row are significantly different Sample A = No Stabilizer B1 = 0.5 % conc. of CMC B2 = 1.0% conc. of CMC C1 = 0.5 % conc. of Corn
Starch C2 = 1.0 % conc. of corn starch D1 = 0.5 conc. of Gum acacia D2 = 1.0 % conc. of Gum acacia.
Table 28: Effect of Stabilizers on the Total titratable acidity of Short Set Yoghurt
Fermentation Time (Hours)
Parameter Sample 0 1 2 3 4 5
TTA A 0.29±0.01d
0.30±0.01cd
0.31±0.00d
0.63±0.00b
0.75±0.00a
0.75±0.00a
B1 0.29±0.01e
0.30±0.00de
0.31±0.00d
0.52±0.00c
0.55±0.02b
0.69±0.00a
B2 0.48±0.00e
0.48±0.00e
0.54±0.00d
0.56±0.00c
0.59±0.00b
0.69±0.00a
C1 0.36±0.00d
0.39±0.00c
0.39±0.00c
0.59±0.00b
0.60±0.01b
0.70±0.04a
C2 0.28±0.01f
0.30±0.01e
0.39±0.00d
0.52±0.00c
0.59±0.00b 0.70±0.01a
D1 0.55±0.00e
0.57±0.03e
0.61±0.00d
0.65±0.00c
0.75±0.00b
0.84±0.00a
D2 0.34±0.00e
0.35±0.00e
0.36±0.00d
0.69±0.00c
0.79±0.00b
0.89±0.02a
Mean ± SD of triplicate readings
Values with different superscript the same row are significantly different Sample A = No Stabilizer B1 = 0.5 % conc. of CMC B2 = 1.0% conc. of CMC C1 = 0.5 % conc. of Corn
Starch C2 = 1.0 % conc. of corn starch D1 = 0.5 conc. of Gum acacia D2 = 1.0 % conc. of Gum acacia.

115
Table 29: Effect of Stabilizers on the total viable count of Short Set Yoghurt
Fermentation Time (Hours)
Parameter Sample 0 1 2 3 4 5
TVC A 1.04x10⁵±2.65
b 1.05 x10
5±2.65
b 1.20 x10
5±2.56
1.17x10
5±2.56
a 5.3x10
4±2.00
c 2.0x10
4±2.65
d
B1 1.02 x10⁵±3.00
a 1.30x10
4±2.00
f 1.30x10
4±2.00
f 3.50x10
4±2.65
d 9.30 x10
4±3.46
b 8.10 x10
4±2.65
c
B2 1.60x10⁴±3.00
d 3.00x10
4±3.00
b 2.40x10
4±3.00
c 2.30 x10
4±3.00
c 5.30 x10
4±3.00
a 5.20 x10
4±3.00
a
C1 1.80x10⁴±3.00
b 1.90x10
4±3.00
b 2.00x10
4±3.00
b 2.20 x10
4±3.00
b 4.60 x10
4±2.00
a 4.20 x10
4±2.00
a
C2 1.30x10⁴±3.46
c 2.10x10
4±3.00
b 2.20x10
4±3.00
b 2.40 x10
4±3.00
c 3.70 x10
4±3.00
a 4.00 x10
4±3.00
a
D1 1.07 x10⁵±2.12
a 2.10x10
4±1.73
e 3.50x10
4±3.00
d 4.70x10
5±3.46
c 8.30 x10
5±3.00
a 7.90 x10
5±3.46
b
D2 1.80x10⁴±1.73
e 2.36x10
4±3.05
d 4.50x10
4±3.46
c 4.90 x10
4±3.00
c 6.50 x10
5±3.46
a 5.60 x10
5±3.00
b
Mean ± SD of triplicate readings
Values with the same superscript in the same row are not significantly different (p> 0.05).
Sample A = No Stabilizer B1 = 0.5 % conc. of CMC B2 = 1.0% conc. of CMC C1 = 0.5 % conc. of Corn Starch C2 = 1.0 %
conc. of corn starch D1 = 0.5 conc. of Gum acacia D2 = 1.0 % conc. of Gum acacia.
Table 30: Effect of Stabilizers on the LAB Count of Short Set Yoghurt Fermentation Time (Hours)
Parameter Sample 0 1 2 3 4 5
LAB A 1.12 x10⁴±3.00b 1.21 x10⁵±2.65a 2.60 x10⁴±2.65f 3.70 x10⁵±4.36e 9.60 x10⁵±2.56c 7.60 x10⁵±2.65d
B1 2.0 x10⁴±3.00d 3.40 x10⁴±3.00c 4.00 x10⁴±3.00b 4.30 x10⁴±3.00b 5.30 x10⁵±2.00a 5.3 x10⁴±3.00a
B2 2.30 x10⁴±3.00d 3.40 x10⁴±3.00c 3.57 x10⁴±3.51bc 3.80 x10⁴±2.00bc 4.50 x10⁵±3.00a 4.00 x10⁵±2.00ab
C1 1.80 x10⁴±3.00b 2.00 x10⁴±3.00b 2.00 x10⁴±3.00b 2.20 x10⁴±3.00b 3.40 x10⁵±2.00a 3.40 x10⁵±1.00a
C2 1.60 x10⁴±3.00d 1.90 x10⁴±3.00cd 2.30 x10⁴±3.00b 2.30 x10⁴±3.00b 3.70 x10⁴±3.00a 3.70 x10⁴±3.00a
D1 2.10 x10⁴±3.00e 2.50 x10⁴±3.00e 3.50 x10⁴±3.46d 5.50 x10⁵±3.46c 6.30 x10⁵±3.00b 8.40 x10⁵±4.24a
D2 1.80 x10⁴±3.00b 2.30 x10⁴±3.00b 2.90 x10⁴±3.46a 3.00 x10⁴±3.46a 3.30 x10⁴±3.00a 3.30 x10⁴±3.00a
Mean ± SD of triplicate readings
Values with the same superscript in the same row are not significantly different (p> 0.05).
Sample A = No Stabilizer B1 = 0.5 % conc. of CMC B2 = 1.0% conc. of CMC C1 = 0.5 % conc. of Corn Starch C2 = 1.0 %
conc. of corn starch D1 = 0.5 conc. Of Gum acacia D2 = 1.0 % conc. of Gum acacia.
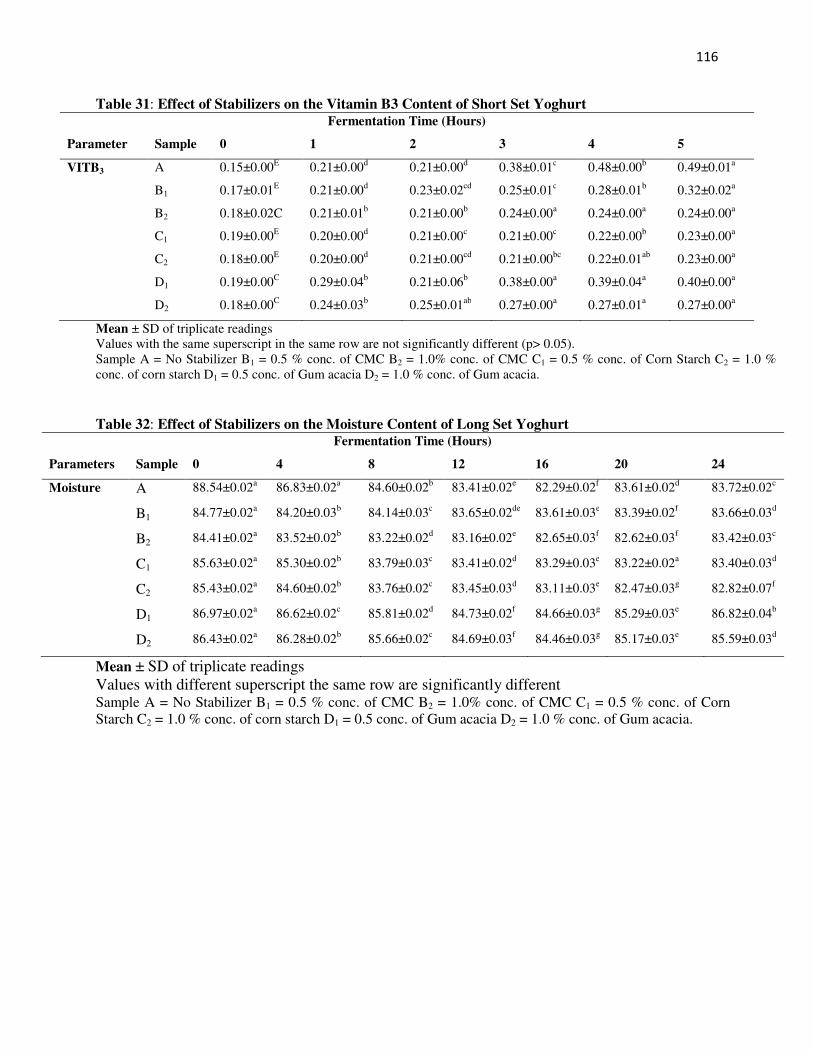
116
Table 31: Effect of Stabilizers on the Vitamin B3 Content of Short Set Yoghurt Fermentation Time (Hours)
Parameter Sample 0 1 2 3 4 5
VITB3 A 0.15±0.00E
0.21±0.00d
0.21±0.00d
0.38±0.01c
0.48±0.00b
0.49±0.01a
B1 0.17±0.01E
0.21±0.00d
0.23±0.02cd
0.25±0.01c
0.28±0.01b
0.32±0.02a
B2 0.18±0.02C 0.21±0.01b
0.21±0.00b
0.24±0.00a
0.24±0.00a
0.24±0.00a
C1 0.19±0.00E
0.20±0.00d
0.21±0.00c
0.21±0.00c
0.22±0.00b
0.23±0.00a
C2 0.18±0.00E
0.20±0.00d
0.21±0.00cd
0.21±0.00bc
0.22±0.01ab
0.23±0.00a
D1 0.19±0.00C
0.29±0.04b
0.21±0.06b
0.38±0.00a
0.39±0.04a
0.40±0.00a
D2 0.18±0.00C
0.24±0.03b
0.25±0.01ab
0.27±0.00a
0.27±0.01a
0.27±0.00a
Mean ± SD of triplicate readings
Values with the same superscript in the same row are not significantly different (p> 0.05).
Sample A = No Stabilizer B1 = 0.5 % conc. of CMC B2 = 1.0% conc. of CMC C1 = 0.5 % conc. of Corn Starch C2 = 1.0 %
conc. of corn starch D1 = 0.5 conc. of Gum acacia D2 = 1.0 % conc. of Gum acacia.
Table 32: Effect of Stabilizers on the Moisture Content of Long Set Yoghurt Fermentation Time (Hours)
Parameters Sample 0 4 8 12 16 20 24
Moisture A 88.54±0.02a
86.83±0.02a 84.60±0.02
b 83.41±0.02
e 82.29±0.02
f 83.61±0.02
d 83.72±0.02
c
B1 84.77±0.02a
84.20±0.03b 84.14±0.03
c 83.65±0.02
de 83.61±0.03
e 83.39±0.02
f 83.66±0.03
d
B2 84.41±0.02a
83.52±0.02b 83.22±0.02
d 83.16±0.02
e 82.65±0.03
f 82.62±0.03
f 83.42±0.03
c
C1 85.63±0.02a 85.30±0.02
b 83.79±0.03
c 83.41±0.02
d 83.29±0.03
e 83.22±0.02
a 83.40±0.03
d
C2 85.43±0.02a 84.60±0.02
b 83.76±0.02
c 83.45±0.03
d 83.11±0.03
e 82.47±0.03
g 82.82±0.07
f
D1 86.97±0.02a 86.62±0.02
c 85.81±0.02
d 84.73±0.02
f 84.66±0.03
g 85.29±0.03
e 86.82±0.04
b
D2 86.43±0.02a 86.28±0.02
b 85.66±0.02
c 84.69±0.03
f 84.46±0.03
g 85.17±0.03
e 85.59±0.03
d
Mean ± SD of triplicate readings
Values with different superscript the same row are significantly different Sample A = No Stabilizer B1 = 0.5 % conc. of CMC B2 = 1.0% conc. of CMC C1 = 0.5 % conc. of Corn
Starch C2 = 1.0 % conc. of corn starch D1 = 0.5 conc. of Gum acacia D2 = 1.0 % conc. of Gum acacia.

117
Table 33: Effect of Stabilizers on the Fat Content of Long Set Yoghurt Fermentation Time (Hours)
Parameters Sample 0 4 8 12 16 20 24
FAT A 3.12±0.04d 3.13±0.02
d 3.14±0.06
d 3.17±0.03
cd 3.20±0.01
bc 3.25±0.02
ab 3.31±0.02
a
B1 2.93±0.01e 3.13±0.03
d 3.19±0.01
c 3.23±0.05
b 3.27±0.03
bc 3.27±0.02
b 3.35±0.04
a
B2 2.98±0.02f 3.17±0.02
e 3.21±0.02
d 3.29±0.01
c 3.35±0.02
b 3.43±0.02
a 3.43±0.02
a
C1 3.11±0.02e 3.16±0.02
d 3.16±0.02
d 3.23±0.02
c 3.29±0.02
b 3.31±0.02
b 3.41±0.02
a
C2 3.18±0.02e 3.17±0.02
e 3.18±0.02
e 3.24±0.02
d 3.28±0.01
c 3.37±0.01
b 3.44±0.03
a
D1 2.67±0.02f 2.92±0.02
e 2.97±0.02
d 2.99±0.02
d 3.05±0.02
c 3.16±0.02
b 3.19±0.01
a
D2 2.70±0.01e 2.94±0.02
d 2.97±0.02
d 3.04±0.04
c 3.74±0.03
b 3.17±0.02
b 3.29±0.03
a
Mean ± SD of triplicate readings
Values with different superscript the same row are significantly different Sample A = No Stabilizer B1 = 0.5 % conc. of CMC B2 = 1.0% conc. of CMC C1 = 0.5 % conc. of Corn
Starch C2 = 1.0 % conc. of corn starch D1 = 0.5 conc. of Gum acacia D2 = 1.0 % conc. of gum acacia.
Table 34: Effect of Stabilizers on the Protein Content of Long Set Yoghurt
Fermentation Time (Hours)
Parameters Sample 0 4 8 12 16 20 24
Protein A 3.37±0.03f 3.47±0.03
e 3.58±0.03
d 3.63±0.04
c 3.74±0.03
b 3.78±0.02
ab 3.79±0.02
a
B1 3.31±0.02e 3.37±0.02
d 3.61±0.02
c 3.64±0.01
c 3.71±0.02
b 3.76±0.03
a 3.79±0.03
a
B2 3.31±0.02e 3.31±0.02
e 3.34±0.01
d 3.41±0.02
c 3.61±0.02
b 3.71±0.02
a 3.74±0.02
a
C1 3.13±0.03d 3.22±0.02
c 3.27±0.02
c 3.44±0.01
b 3.69±0.02
a 3.55±0.06
a 3.55±0.05
a
C2 3.06±0.02d 3.16±0.02
c 3.19±0.02
c 3.36±0.01
b 3.43±0.05
a 3.43±0.05
a 3.46±0.04
a
D1 3.30±0.04f 3.39±0.01
e 3.46±0.01
d 3.58±0.03
c 3.58±0.03
c 3.66±0.05
b 0.72±0.02
a
D2 3.29±0.02e 3.34±0.02
d 3.40±0.02
c 3.54±0.03
b 3.66±0.04
a 3.67±0.02
a 3.68±0.02
a
Mean ± SD of triplicate readings
Values with different superscript the same row are significantly different Sample A = No Stabilizer B1 = 0.5 % conc. of CMC B2 = 1.0% conc. of CMC C1 = 0.5 % conc. of Corn
Starch C2 = 1.0 % conc. of corn starch D1 = 0.5 conc. of Gum acacia D2 = 1.0 % conc. of Gum acacia.

118
Table 35: Effect of Stabilizers on the Ash Content of Long Set Yoghurt Fermentation Time (Hours)
Parameters Sample 0 4 8 12 16 20 24
ASH A 0.34±0.02d 0.66±0.04
c 0.71±0.10
b 0.74±0.01
a 0.76±0.01
a 0.76±0.01
a 0.76±0.01
a
B1 0.55±0.05b 0.76±0.03
a 0.78±0.03
a 0.77±0.04
a 0.79±0.01
a 0.79±0.01
a 0.80±0.02
a
B2 0.57±0.02d 0.74±0.04
bc 0.76±0.01
abc 0.77±0.02
c 0.79±0.12
ab 0.76±0.02
1b 0.79±0.01
ab
C1 0.56±0.04e 0.64±0.03
d 0.66±0.05
d 0.71±0.03
c 0.73±0.03
bc 0.78±0.03
ab 0.79±0.01
a
C2 0.66±0.04d 0.71±0.03
c 0.71±0.01
c 0.71±0.01
a 0.74±0.03
bc 0.69±0.01
a 0.79±0.01
a
D1 0.52±0.02b 0.65±0.02
a 0.67±0.04
a 0.68±0.04
a 0.68±0.04
a 0.69±0.02
c 0.69±0.04
a
D2 0.58±0.01c 0.63±0.06
b 0.66±0.02
ab 0.69±0.01
a 0.69±0.03
a 16.39±0.02
c 0.69±0.04
a
Mean ± SD of triplicate readings
Values with different superscript the same row are significantly different Sample A = No Stabilizer B1 = 0.5 % conc. of CMC B2 = 1.0% conc. of CMC C1 = 0.5 % conc. of Corn
Starch C2 = 1.0 % conc. of corn starch D1 = 0.5 conc. of Gum acacia D2 = 1.0 % conc. of Gum acacia.
Table 36: Effect of Stabilizers on the Total solids Content of Long Set Yoghurt Fermentation Time (Hours)
Parameters Sample 0 4 8 12 16 20 24
Total Solids A 11.46±0.02g 15.17±0.02
f 15.40±0.02
e 16.59±0.02
b 17.70±0.02
a 16.39±0.02
c 16.27±0.02
d
B1 15.23±0.02f 15.79±0.03
e 15.86±0.03
d 16.35±0.02
c 16.39±0.03
b 16.60±0.02
a 16.31±0.02
c
B2 15.59±0.02f 16.48±0.02
e 16.78±0.02
c 16.84±0.02
b 17.35±0.03
a 17.38±0.03
a 16.59±0.02
d
C1 14.37±0.02f 14.70±0.02
e 16.21±0.03
d 16.59±0.02
c 16.17±0.03
b 16.17±0.03
a 16.59±0.03
c
C2 14.57±0.02g 15.40±0.02
f 16.24±0.02
e 16.55±0.03
d 16.89±0.03
b 17.53±0.03
a 17.17±0.07
b
D1 13.03±0.02g 13.38±0.02
e 14.19±0.02
d 15.27±0.02
b 15.34±0.03
a 14.71±0.03
c 13.18±0.04
f
D2 13.57±0.02g 13.72±0.02
f 14.34±0.02
e 15.31±0.03
b 15.53±0.02
a 14.83±0.03
c 14.41±0.03
d
Mean ± SD of triplicate readings
Values with different superscript the same row are significantly different Sample A = No Stabilizer B1 = 0.5 % conc. of CMC B2 = 1.0% conc. of CMC C1 = 0.5 % conc. of Corn
Starch C2 = 1.0 % conc. of corn starch D1 = 0.5 conc. of Gum acacia D2 = 1.0 % conc. of Gum acacia.

119
Table 37: Effect of Stabilizers on the viscosity (Cp) of Long Set Yoghurt
Fermentation Time (Hours)
Parameters Sample 0 4 8 12 16 20 24
VISCOSITY A 1.48±0.03g 105.280.23
f 125.89±0.48
e 131.45±0.07
d 234.59±1.53
b 238.82±0.91
a 232.63±1.69
c
B1 58.32±1.79f 169.19±1.53
e 181.57±0.75
d 220.62±0.48
c 264.09±2.93
a 260.48±4.27
a 251.80±1.43
b
B2 97.74±0.49f 191.50±1.40
e 217.20±2.74
d 241.38±1.23
c 255.38±3.23
b 266.36±3.77
a 262.42±4.82
a
C1 2.45±0.04f 122.06±0.03
e 133.01±0.22
d 229.01±1.69
c 237.20±2.74
b 243.62±2.59
a 236.22±1.06
b
C2 2.96±0.03f 129.66±0.43
e 137.41±0.64
d 233.47±4.29
c 239.96±0.79
b 257.80±0.40
a 238.15±0.49
b
D1 1.48±0.01g 97.14±1.02
f 105.63±0.29
e 141.09±1.99
d 156.77±2.60
c 235.89±3.53
a 229.57±0.48
b
D2 2.35±0.03g 102.79±0.28
f 122.07±1.31
e 133.91±1.02
d 166.14±1.02
c 236.15±2.98
a 231.21±1.93
b
Mean ± SD of triplicate readings
Values with different superscript the same row are significantly different Sample A = No Stabilizer B1 = 0.5 % conc. of CMC B2 = 1.0% conc. of CMC C1 = 0.5 % conc. of Corn
Starch C2 = 1.0 % conc. of corn starch D1 = 0.5 conc. of Gum acacia D2 = 1.0 % conc. of Gum acacia.
Table 38: Effect of Stabilizers on the pH of Long Set Yoghurt Fermentation Time (Hours)
Parameter Sample 0 4 8 12 16 20 24
pH A 6.19±0.03a
5.18±0.03b 5.06±0.02
c 4.53±0.02
d 4.49±0.02
d 4.35±0.03
e 4.17±0.05
f
B1 6.25±0.02a 5.22±0.02
b 5.19±0.02
c 4.97±0.01
d 4.92±0.02
e 4.42±0.06
f 4.06±0.07
g
B2 6.27±0.03a 5.18±0.03
b 4.95±0.03
b 4.67±0.02
c 4.51±0.01
c 4.26±0.03
d 4.13±0.01
e
C1 6.17±0.03a 5.12±0.02
b 4.92±0.03
c 4.87±0.01
c 4.50±0.02
d 4.34±0.04
e 4.08±0.09
f
C2 6.18±0.01a 5.10±0.02
b 5.09±0.02
b 4.63±0.05
c 4.43±0.04
d 4.24±0.03
e 4.18±0.02
f
D1 5.99±0.04a 5.97±0.03
a 5.40±0.26
b 4.92±0.02
c 4.83±0.03
c 4.53±0.04
d 4.09±0.01
e
D2 5.89±0.02a 5.45±0.04
b 5.08±0.02
c 4.92±0.03
d 4.88±0.00
c 4.37±0.01
e 4.06±0.07
f
Mean ± SD of triplicate readings
Values with different superscript the same row are significantly different Sample A = No Stabilizer B1 = 0.5 % conc. of CMC B2 = 1.0% conc. of CMC C1 = 0.5 % conc. of Corn
Starch C2 = 1.0 % conc. of corn starch D1 = 0.5 conc. of Gum acacia D2 = 1.0 % conc. of Gum acacia.

120
Table 39: Effect of Stabilizers on the Total titratable acidity of Long Set Yoghurt
Fermentation Time (Hours)
Parameter Sample 0 4 8 12 16 20 24
TTA A 0.29±0.01g 0.54±0.02
f 0.74±0.00
e 0.81±0.00
d 0.88±0.00
c 0.91±0.03
b 0.99±0.00
a
B1 0.48±0.00g 0.59±0.02
f 0.62±0.00
e 0.73±0.03
d 0.78±0.01
c 0.81±0.00
b 1.08±0.00
a
B2 0.29±0.01g 0.53±0.00
f 0.71±0.00
e 0.77±0.00
d 0.79±0.00
c 0.89±0.01
b 0.96±0.02
a
C1 0.36±0.00f 0.55±0.00
e 0.69±0.01
d 0.89±0.01
c 0.91±0.00
c 0.95±0.03
b 1.06±0.02
a
C2 0.28±0.01f 0.56±0.00
e 0.76±0.01
d 0.82±0.02
c 0.93±0.03
b 0.95±0.04
b 1.09±0.03
a
D1 0.55±0.00e 0.65±0.00
d 0.65±0.00
d 0.71±0.01
c 0.73±0.03
c 0.94±0.00
b 1.06±0.03
a
D2 0.34±0.00g 0.69±0.00
f 0.82±0.00
e 0.96±0.00
d 1.11±0.02
c 1.15±0.01
b 1.18±0.00
a
Mean ± SD of triplicate readings
Values with different superscript the same row are significantly different Sample A = No Stabilizer B1 = 0.5 % conc. of CMC B2 = 1.0% conc. of CMC C1 = 0.5 % conc. of Corn
Starch C2 = 1.0 % conc. of corn starch D1 = 0.5 conc. of Gum acacia D2 = 1.0 % conc. of Gum acacia.
Table 40: Effect of Stabilizers on the Total Viablecount of Long Set Yoghurt
Fermentation Time (Hours)
Parameter Sample 0 4 8 12 16 20 24
TVC A 1.30x10⁴±3.00f 2.50 x10⁴±3.00e 3.60x10⁴±3.46d 4.20 x10⁴±3.00c 7.43x10⁴±3.05a 6.00x10⁴±3.00b 4.60x10⁴±3.00c
B1 1.20 x10⁴±2.00e 1.90 x10⁴±2.00d 2.10x10⁴±2.00d 3.20 x10⁴±2.00c 6.20x10⁴±3.00b 5.80x10⁴±2.00b 5.70x10⁴±2.00a
B2 1.30 x10⁴±1.73e 2.10 x10⁴±1.00d 3.50x10⁴±2.00c 6.80 x10⁴±2.00b 6.90x10⁴±1.73b 7.47x10⁴±3.05a 7.40 x10⁴±0.00a
C1 1.70 x10⁴±2.00d 1.80 x10⁴±1.00d 1.87x10⁴±2.08d 2.60 x10⁴±3.00c 6.40x10⁴±3.00a 5.60x10⁴±2.00b 5.40x10⁴±3.00b
C2 1.10 x10⁴±1.00e 2.00 x10⁴±1.00d 2.07x10⁴±2.08d 4.20 x10⁴±2.00c 6.60x10⁴±3.00a 6.60x10⁴±3.00a 5.70x10⁴±2.00b
D1 1.80 x10⁴±1.00e 2.00x10⁴±1.00de 2.20x10⁴±2.00d 2.52 x10⁴±1.16c 3.33x10⁴±3.05b 3.87x10⁴±1.16a 3.60x10⁴±2.00ab
D2 1.40 x10⁴±1.88e 1.70 x10⁴±0.00cd 2.00x10⁴±2.65c 2.10 x10⁴±2.65c 3.67 x10⁴±4.16b 5.60x10⁴±2.00a 5.30 x10⁴±2.00a
Mean ± SD of triplicate readings
Values with the same superscript in the same row are not significantly different (p> 0.05).
Sample A = No Stabilizer B1 = 0.5 % conc. of CMC B2 = 1.0% conc. of CMC C1 = 0.5 % conc. of Corn Starch C2 = 1.0 %
conc. of corn starch D1 = 0.5 conc. of Gum acacia D2 = 1.0 % conc. of Gum acacia.

121
Table 41: Effect of Stabilizers on the Lactic acid of bacteria count Long Set Yoghurt
Fermentation Time (Hours)
Parameter Sample 0 4 8 12 16 20 24
LAB A 1.70 x10⁴±3.00e 2.10 x10⁴±3.46cd 2.30x10⁴±3.00cd 2.50 x10⁴±3.00c 4.50x10⁴±3.46a 4.50x10⁴±3.46a 3.70 x10⁴±3.46b
B1 1.83 x10⁴±2.31d 1.87 x10⁴±1.53d 2.00 x10⁴±2.00d 2.40 x10⁴±3.00b 3.07x10⁴±2.08b 3.70x10⁴±2.00a 3.30 x10⁴±2.00b
B2 1.80 x10⁴±2.00c 2.03 x10⁴±2.31c 2.20 x10⁴±2.00c 3.40 x10⁴±3.00b 4.20x10⁴±2.00a 4.60x10⁴±3.00a 4.40 x10⁴±3.00a
C1 1.83 x10⁴±1.16d 1.90 x10⁴±2.00d 2.00 x10⁴±2.00d 2.60 x10⁴±2.00c 3.40x10⁴±2.00b 3.60x10⁴±2.00b 4.07 x10⁴±2.08a
C2 1.50 x10⁴±2.00d 1.90 x10⁴±1.00c 2.00 x10⁴±1.73c 2.70 x10⁴±2.65b 3.70x10⁴±2.00a 3.80x10⁴±2.00b 3.97 x10⁴±2.08a
D1 1.50 x10⁴±2.00d 1.80 x10⁴±1.73cd 2.07x10⁴±2.31bc 2.07x10⁴±1.53bc 2.13x10⁴±2.08bc 2.53x10⁴±1.16a 2.40 x10⁴±2.00ab
D2 1.70 x10⁴±2.00d 1.70 x10⁴±1.00d 1.80x10⁴±1.73cd 2.07x10⁴±1.53c 3.03x10⁴±1.53b 3.37x10⁴±2.08a 3.10 x10⁴±2.00ab
Mean ± SD of triplicate readings
Values with the same superscript in the same row are not significantly different (p> 0.05).
Sample A = No Stabilizer B1 = 0.5 % conc. of CMC B2 = 1.0% conc. of CMC C1 = 0.5 % conc. of Corn Starch C2 = 1.0 %
conc. of corn starch D1 = 0.5 conc. of Gum acacia D2 = 1.0 % conc. of Gum acacia.
Table 42: Effect of Stabilizers on the Niacin content (Vit B3) of Long Set Yoghurt
Fermentation Time (Hours)
Parameter Sample 0 4 8 12 16 20 24
VIT B3 A 0.21±0.00c 0.21±0.00
c 0.24±0.02
b 0.25±0.00
a 0.25±0.00
a 0.25±0.01
a 0.26±0.00
a
B1 0.17±0.01d 0.19±0.02
c 0.20±0.00
bc 0.22±0.01
b 0.23±0.01
b 0.23±0.00
b 0.26±0.02
a
B2 0.18±0.02e 0.19±0.02
de 0.22±0.00
d 0.30±0.02
c 0.33±0.01
b 0.35±0.01
ab 0.37±0.00
a
C1 0.19±0.00e 0.19±0.00
e 0.20±0.00
d 0.28±0.00
c 0.29±0.00
b 0.31±0.01
a 0.31±0.00
a
C2 0.18±0.00d 0.19±0.01
d 0.21±0.00
c 0.28±0.00
b 0.29±0.00
a 0.29±0.00
a 0.30±0.00
a
D1 0.19±0.00c 0.19±0.00
c 0.19±0.04
e 0.21±0.00
b 0.21±0.00
b 0.22±0.00
a 0.23±0.01
a
D2 0.18±0.00f 0.18±0.00
f 0.19±0.00
e 0.20±0.00
d 0.23±0.00
c 0.24±0.00
b 0.25±0.00
a
Mean ± SD of triplicate readings
Values with the same superscript in the same row are not significantly different (p> 0.05).
Sample A = No Stabilizer B1 = 0.5 % conc. of CMC B2 = 1.0% conc. of CMC C1 = 0.5 % conc. of Corn Starch C2 = 1.0 %
conc. of corn starch D1 = 0.5 conc. of Gum acacia D2 = 1.0 % conc. of Gum acacia.

122
APPENDIX III
ANOVA for Short Set Yoghurt
Variate: Ash Source of variation d.f. s.s. m.s. v.r. F pr. Stablizer 2 0.1434827 0.0717414 82.66 <.001 Conc 2 0.1991198 0.0995599 114.71 <.001 Duration 5 0.9954475 0.1990895 229.39 <.001 Stablizer.Conc 4 0.0719988 0.0179997 20.74 <.001 Stablizer.Duration 10 0.0053099 0.0005310 0.61 0.801 Conc.Duration 10 0.1602951 0.0160295 18.47 <.001 Stablizer.Conc.Duration 20 0.0124309 0.0006215 0.72 0.802 Residual 108 0.0937333 0.0008679 Total 161 1.6818179
Variate: Fat Source of variation d.f. s.s. m.s. v.r. F pr. Stablizer 2 2.527483 1.263741 1042.92 <.001 Conc 2 1.466964 0.733482 605.32 <.001 Duration 5 1.509507 0.301901 249.15 <.001 Stablizer.Conc 4 1.267921 0.316980 261.59 <.001 Stablizer.Duration 10 0.077162 0.007716 6.37 <.001 Conc.Duration 10 0.083258 0.008326 6.87 <.001 Stablizer.Conc.Duration 20 0.061835 0.003092 2.55 0.001 Residual 108 0.130867 0.001212 Total 161 7.124996
Variate: LAB Source of variation d.f. s.s. m.s. v.r. F pr. Stablizer 2 2584.642 1292.321 145.89 <.001 Conc 2 73224.086 36612.043 4133.21 <.001 Duration 5 53111.216 10622.243 1199.17 <.001 Stablizer.Conc 4 3443.951 860.988 97.20 <.001 Stablizer.Duration 10 1010.543 101.054 11.41 <.001 Conc.Duration 10 27162.432 2716.243 306.64 <.001 Stablizer.Conc.Duration 20 2491.086 124.554 14.06 <.001 Residual 108 956.667 8.858 Total 161 163984.623

123
Variate: Moisture Source of variation d.f. s.s. m.s. v.r. F pr. Stablizer 2 33.83030 16.91515 182.23 <.001 Conc 2 26.36287 13.18143 142.01 <.001 Duration 5 268.48089 53.69618 578.48 <.001 Stablizer.Conc 4 20.02269 5.00567 53.93 <.001 Stablizer.Duration 10 2.44657 0.24466 2.64 0.007 Conc.Duration 10 101.19491 10.11949 109.02 <.001 Stablizer.Conc.Duration 20 3.69200 0.18460 1.99 0.013 Residual 108 10.02480 0.09282 Total 161 466.05503
Variate: Protein Source of variation d.f. s.s. m.s. v.r. F pr. Stablizer 2 0.436005 0.218002 187.65 <.001 Conc 2 0.648016 0.324008 278.90 <.001 Duration 5 2.095744 0.419149 360.80 <.001 Stablizer.Conc 4 0.218543 0.054636 47.03 <.001 Stablizer.Duration 10 0.055099 0.005510 4.74 <.001 Conc.Duration 10 0.143443 0.014344 12.35 <.001 Stablizer.Conc.Duration 20 0.093575 0.004679 4.03 <.001 Residual 108 0.125467 0.001162 Total 161 3.815892
Variate: Total Solid Source of variation d.f. s.s. m.s. v.r. F pr. Stablizer 2 33.97863 16.98932 171.08 <.001 Conc 2 26.83120 13.41560 135.10 <.001 Duration 5 266.18956 53.23791 536.11 <.001 Stablizer.Conc 4 20.97547 5.24387 52.81 <.001 Stablizer.Duration 10 2.21735 0.22173 2.23 0.021 Conc.Duration 10 102.08991 10.20899 102.81 <.001 Stablizer.Conc.Duration 20 4.39189 0.21959 2.21 0.005 Residual 108 10.72480 0.09930 Total 161 467.39880
Variate: TTA Source of variation d.f. s.s. m.s. v.r. F pr. Stablizer 2 0.24786293 0.12393146 2328.03 <.001 Conc 2 0.02853826 0.01426913 268.04 <.001 Duration 5 4.18252302 0.83650460 15713.56 <.001 Stablizer.Conc 4 0.33763115 0.08440779 1585.58 <.001 Stablizer.Duration 10 0.04296944 0.00429694 80.72 <.001 Conc.Duration 10 0.27434011 0.02743401 515.34 <.001 Stablizer.Conc.Duration 20 0.26020470 0.01301024 244.39 <.001 Residual 108 0.00574933 0.00005323 Total 161 5.37981894

124
Variate: TVC Source of variation d.f. s.s. m.s. v.r. F pr. Stablizer 2 7681.383 3840.691 487.61 <.001 Conc 2 93243.198 46621.599 5919.04 <.001 Duration 5 80383.383 16076.677 2041.08 <.001 Stablizer.Conc 4 5500.765 1375.191 174.59 <.001 Stablizer.Duration 10 3979.802 397.980 50.53 <.001 Conc.Duration 10 24218.654 2421.865 307.48 <.001 Stablizer.Conc.Duration 20 3858.272 192.914 24.49 <.001 Residual 108 850.667 7.877 Total 161 219716.123
Variate: Viscosity Source of variation d.f. s.s. m.s. v.r. F pr. Stablizer 2 99450.329 49725.165 27370.09 <.001 Conc 2 53717.263 26858.631 14783.73 <.001 Duration 5 618815.812 123763.162 68122.64 <.001 Stablizer.Conc 4 50245.288 12561.322 6914.10 <.001 Stablizer.Duration 10 27485.559 2748.556 1512.88 <.001 Conc.Duration 10 22180.526 2218.053 1220.88 <.001 Stablizer.Conc.Duration 20 14881.512 744.076 409.56 <.001 Residual 108 196.211 1.817 Total 161 886972.500
Variate: Vit_B3 Source of variation d.f. s.s. m.s. v.r. F pr. Stablizer 2 0.0757856 0.0378928 231.64 <.001 Conc 2 0.2623017 0.1311509 801.72 <.001 Duration 5 0.7189549 0.1437910 878.99 <.001 Stablizer.Conc 4 0.0658130 0.0164532 100.58 <.001 Stablizer.Duration 10 0.0211204 0.0021120 12.91 <.001 Conc.Duration 10 0.4525178 0.0452518 276.62 <.001 Stablizer.Conc.Duration 20 0.0236893 0.0011845 7.24 <.001 Residual 108 0.0176673 0.0001636 Total 161 1.6378500
Variate: pH Source of variation d.f. s.s. m.s. v.r. F pr. Stablizer 2 0.1943593 0.0971796 150.80 <.001 Conc 2 0.1842815 0.0921407 142.98 <.001 Duration 5 92.0821481 18.4164296 28577.22 <.001 Stablizer.Conc 4 0.1890926 0.0472731 73.35 <.001 Stablizer.Duration 10 2.1843593 0.2184359 338.95 <.001 Conc.Duration 10 1.0822370 0.1082237 167.93 <.001 Stablizer.Conc.Duration 20 1.3551667 0.0677583 105.14 <.001 Residual 108 0.0696000 0.0006444 Total 161 97.3412444

125
ANOVA Sensory Evaluation Studies for short set yoghurt
Variate: Overall Acceptability Source of variation d.f. s.s. m.s. v.r. F pr. Stabilizer 2 7.8815 3.9407 9.12 <.001 Conc 2 70.0259 35.0130 81.02 <.001 Duration 2 118.6259 59.3130 137.25 <.001 Stabilizer.Conc 4 38.4296 9.6074 22.23 <.001 Stabilizer.Duration 4 5.6963 1.4241 3.30 0.011 Conc.Duration 4 41.6185 10.4046 24.08 <.001 Stabilizer.Conc.Duration 8 7.0593 0.8824 2.04 0.040 Residual 513 221.7000 0.4322 Total 539 511.0370
Variate: Colour Source of variation d.f. s.s. m.s. v.r. F pr. Stabilizer 2 6.4037 3.2019 10.20 <.001 Conc 2 5.9593 2.9796 9.49 <.001 Duration 2 36.1037 18.0519 57.50 <.001 Stabilizer.Conc 4 3.2519 0.8130 2.59 0.036 Stabilizer.Duration 4 10.0741 2.5185 8.02 <.001 Conc.Duration 4 4.0185 1.0046 3.20 0.013 Stabilizer.Conc.Duration 8 14.1370 1.7671 5.63 <.001 Residual 513 161.0500 0.3139 Total 539 240.9981
Variate: Flavour Source of variation d.f. s.s. m.s. v.r. F pr. Stabilizer 2 7.2481 3.6241 10.03 <.001 Conc 2 77.2148 38.6074 106.83 <.001 Duration 2 210.7815 105.3907 291.62 <.001 Stabilizer.Conc 4 100.4407 25.1102 69.48 <.001 Stabilizer.Duration 4 4.4741 1.1185 3.09 0.016 Conc.Duration 4 13.8741 3.4685 9.60 <.001 Stabilizer.Conc.Duration 8 22.8704 2.8588 7.91 <.001 Residual 513 185.4000 0.3614 Total 539 622.3037

126
Variate: Mouthfeel Source of variation d.f. s.s. m.s. v.r. F pr. Stabilizer 2 17.1370 8.5685 23.21 <.001 Conc 2 66.3815 33.1907 89.90 <.001 Duration 2 49.8926 24.9463 67.57 <.001 Stabilizer.Conc 4 56.9185 14.2296 38.54 <.001 Stabilizer.Duration 4 7.3407 1.8352 4.97 <.001 Conc.Duration 4 16.0296 4.0074 10.85 <.001 Stabilizer.Conc.Duration 8 15.6037 1.9505 5.28 <.001 Residual 513 189.4000 0.3692 Total 539 418.7037
Variate: TASTE Source of variation d.f. s.s. m.s. v.r. F pr. Stabilizer 2 7.0037 3.5019 8.26 <.001 Conc 2 86.4148 43.2074 101.91 <.001 Duration 2 234.5815 117.2907 276.64 <.001 Stabilizer.Conc 4 47.9519 11.9880 28.28 <.001 Stabilizer.Duration 4 8.4185 2.1046 4.96 <.001 Conc.Duration 4 17.6741 4.4185 10.42 <.001 Stabilizer.Conc.Duration 8 10.1593 1.2699 3.00 0.003 Residual 513 217.5000 0.4240 Total 539 629.7037
Analysis of Variance of Long Set
Variate: Ash Source of variation d.f. s.s. m.s. v.r. F pr. Stabilizer 2 0.1107987 0.0553993 110.59 <.001 Sample 2 0.0437558 0.0218779 43.67 <.001 Duration 6 1.4062198 0.2343700 467.87 <.001 Stabilizer.Sample 4 0.0645148 0.0161287 32.20 <.001 Stabilizer.Duration 12 0.0329587 0.0027466 5.48 <.001 Sample.Duration 12 0.3101127 0.0258427 51.59 <.001 Stabilizer.Sample.Duration 24 0.0256111 0.0010671 2.13 0.004 Residual 126 0.0631167 0.0005009 Total 188 2.0570884

127
Variate: Fat Source of variation d.f. s.s. m.s. v.r. F pr. Stabilizer 2 0.9654804 0.4827402 796.84 <.001 Sample 2 0.0893217 0.0446608 73.72 <.001 Duration 6 2.1579037 0.3596506 593.66 <.001 Stabilizer.Sample 4 0.4928942 0.1232235 203.40 <.001 Stabilizer.Duration 12 0.1461566 0.0121797 20.10 <.001 Sample.Duration 12 0.2582042 0.0215170 35.52 <.001 Stabilizer.Sample.Duration 24 0.0968688 0.0040362 6.66 <.001 Residual 126 0.0763333 0.0006058 Total 188 4.2831630
Variate: LAB (lactic acid bacteria) Source of variation d.f. s.s. m.s. v.r. F pr. Stabilizer 2 731.122 365.561 58.21 <.001 Sample 2 1009.407 504.704 80.36 <.001 Duration 6 13761.608 2293.601 365.20 <.001 Stabilizer.Sample 4 563.704 140.926 22.44 <.001 Stabilizer.Duration 12 384.804 32.067 5.11 <.001 Sample.Duration 12 1170.963 97.580 15.54 <.001 Stabilizer.Sample.Duration 24 340.815 14.201 2.26 0.002 Residual 126 791.333 6.280 Total 188 18753.757
Variate: Moisture Source of variation d.f. s.s. m.s. v.r. F pr. Stabilizer 2 7.081E+01 3.540E+01 53360.08 <.001 Sample 2 1.156E+01 5.780E+00 8712.21 <.001 Duration 6 2.412E+02 4.020E+01 60585.23 <.001 Stabilizer.Sample 4 3.595E+01 8.987E+00 13544.39 <.001 Stabilizer.Duration 12 8.737E+00 7.281E-01 1097.41 <.001 Sample.Duration 12 7.947E+01 6.622E+00 9980.68 <.001 Stabilizer.Sample.Duration 24 6.772E+00 2.822E-01 425.29 <.001 Residual 126 8.360E-02 6.635E-04 Total 188 4.546E+02

128
Variate: Moisture Source of variation d.f. s.s. m.s. v.r. F pr. Stabilizer 2 7.081E+01 3.540E+01 53360.08 <.001 Sample 2 1.156E+01 5.780E+00 8712.21 <.001 Duration 6 2.412E+02 4.020E+01 60585.23 <.001 Stabilizer.Sample 4 3.595E+01 8.987E+00 13544.39 <.001 Stabilizer.Duration 12 8.737E+00 7.281E-01 1097.41 <.001 Sample.Duration 12 7.947E+01 6.622E+00 9980.68 <.001 Stabilizer.Sample.Duration 24 6.772E+00 2.822E-01 425.29 <.001 Residual 126 8.360E-02 6.635E-04 Total 188 4.546E+02 Variate: Protein Source of variation d.f. s.s. m.s. v.r. F pr. Stabilizer 2 0.6561725 0.3280862 437.60 <.001 Sample 2 1.1404233 0.5702116 760.55 <.001 Duration 6 4.4125090 0.7354182 980.90 <.001 Stabilizer.Sample 4 0.3773259 0.0943315 125.82 <.001 Stabilizer.Duration 12 0.0506942 0.0042245 5.63 <.001 Sample.Duration 12 0.0593101 0.0049425 6.59 <.001 Stabilizer.Sample.Duration 24 0.1107630 0.0046151 6.16 <.001 Residual 126 0.0944667 0.0007497 Total 188 6.9016646 Variate: Total Solid Source of variation d.f. s.s. m.s. v.r. F pr. Stabilizer 2 7.283E+01 3.641E+01 65232.51 <.001 Sample 2 5.580E+00 2.790E+00 4997.87 <.001 Duration 6 2.126E+02 3.544E+01 63490.20 <.001 Stabilizer.Sample 4 3.739E+01 9.347E+00 16745.25 <.001 Stabilizer.Duration 12 1.032E+01 8.603E-01 1541.22 <.001 Sample.Duration 12 6.654E+01 5.545E+00 9934.18 <.001 Stabilizer.Sample.Duration 24 7.368E+00 3.070E-01 549.98 <.001 Residual 126 7.033E-02 5.582E-04 Total 188 4.127E+02

129
Variate: TTA Source of variation d.f. s.s. m.s. v.r. F pr. Stabilizer 2 0.1636502 0.0818251 417.63 <.001 Sample 2 0.0902892 0.0451446 230.42 <.001 Duration 6 8.8414861 1.4735810 7521.11 <.001 Stabilizer.Sample 4 0.2441633 0.0610408 311.55 <.001 Stabilizer.Duration 12 0.0855690 0.0071308 36.40 <.001 Sample.Duration 12 0.3563564 0.0296964 151.57 <.001 Stabilizer.Sample.Duration 24 0.2118633 0.0088276 45.06 <.001 Residual 126 0.0246867 0.0001959 Total 188 10.0180642
Variate: TVC Source of variation d.f. s.s. m.s. v.r. F pr. Stabilizer 2 3042.413 1521.206 246.15 <.001 Sample 2 2644.095 1322.048 213.93 <.001 Duration 6 58553.810 9758.968 1579.15 <.001 Stabilizer.Sample 4 2164.825 541.206 87.58 <.001 Stabilizer.Duration 12 2696.698 224.725 36.36 <.001 Sample.Duration 12 4567.016 380.585 61.58 <.001 Stabilizer.Sample.Duration 24 2462.286 102.595 16.60 <.001 Residual 126 778.667 6.180 Total 188 76909.810
Variate: Viscosity Source of variation d.f. s.s. m.s. v.r. F pr. Stabilizer 2 6.803E+04 3.401E+04 10417.82 <.001 Sample 2 2.280E+04 1.140E+04 3491.66 <.001 Duration 6 1.058E+06 1.763E+05 54000.49 <.001 Stabilizer.Sample 4 3.530E+04 8.824E+03 2702.68 <.001 Stabilizer.Duration 12 2.441E+04 2.034E+03 623.07 <.001 Sample.Duration 12 2.424E+04 2.020E+03 618.69 <.001 Stabilizer.Sample.Duration 24 1.448E+04 6.035E+02 184.83 <.001 Residual 126 4.114E+02 3.265E+00 Total 188 1.248E+06

130
Variate: VitB3 Source of variation d.f. s.s. m.s. v.r. F pr. Stabilizer 2 0.03236268 0.01618134 288.05 <.001 Sample 2 0.01596877 0.00798439 142.14 <.001 Duration 6 0.19682198 0.03280366 583.96 <.001 Stabilizer.Sample 4 0.04118250 0.01029562 183.28 <.001 Stabilizer.Duration 12 0.01965866 0.00163822 29.16 <.001 Sample.Duration 12 0.04258701 0.00354892 63.18 <.001 Stabilizer.Sample.Duration 24 0.02164950 0.00090206 16.06 <.001 Residual 126 0.00707800 0.00005617 Total 188 0.37730909 Variate: pH Source of variation d.f. s.s. m.s. v.r. F pr. Stabilizer 2 0.451957 0.225979 109.69 <.001 Sample 2 0.650616 0.325308 157.90 <.001 Duration 6 74.150945 12.358491 5998.73 <.001 Stabilizer.Sample 4 0.351986 0.087997 42.71 <.001 Stabilizer.Duration 12 1.137511 0.094793 46.01 <.001 Sample.Duration 12 0.928263 0.077355 37.55 <.001 Stabilizer.Sample.Duration 24 1.176706 0.049029 23.80 <.001 Residual 126 0.259583 0.002060 Total 188 79.107569
Sensory Evaluation Studies for Long set Yoghurt
Variate: Overall Acceptability Source of variation d.f. s.s. m.s. v.r. F pr. Stabilizer 2 13.5815 6.7907 26.45 <.001 Conc 2 15.3481 7.6741 29.89 <.001 Duration 2 144.3815 72.1907 281.20 <.001 Stabilizer.Conc 4 56.7407 14.1852 55.25 <.001 Stabilizer.Duration 4 12.5741 3.1435 12.24 <.001 Conc.Duration 4 4.4074 1.1019 4.29 0.002 Stabilizer.Conc.Duration 8 9.6370 1.2046 4.69 <.001 Residual 513 131.7000 0.2567 Total 539 388.3704

131
Variate: Colour Source of variation d.f. s.s. m.s. v.r. F pr. Stabilizer 2 2.5593 1.2796 5.86 0.003 Conc 2 33.8926 16.9463 77.65 <.001 Duration 2 53.8259 26.9130 123.33 <.001 Stabilizer.Conc 4 19.0963 4.7741 21.88 <.001 Stabilizer.Duration 4 2.1963 0.5491 2.52 0.041 Conc.Duration 4 1.6630 0.4157 1.91 0.108 Stabilizer.Conc.Duration 8 5.8148 0.7269 3.33 <.001 Residual 513 111.9500 0.2182 Total 539 230.9981
Variate: Flavour Source of variation d.f. s.s. m.s. v.r. F pr. Stabilizer 2 5.7815 2.8907 11.66 <.001 Conc 2 10.0593 5.0296 20.28 <.001 Duration 2 55.2259 27.6130 111.36 <.001 Stabilizer.Conc 4 64.7630 16.1907 65.30 <.001 Stabilizer.Duration 4 8.8963 2.2241 8.97 <.001 Conc.Duration 4 1.9185 0.4796 1.93 0.103 Stabilizer.Conc.Duration 8 8.8593 1.1074 4.47 <.001 Residual 513 127.2000 0.2480 Total 539 282.7037
Variate: Mouthfeel Source of variation d.f. s.s. m.s. v.r. F pr. Stabilizer 2 2.8259 1.4130 4.53 0.011 Conc 2 24.0259 12.0130 38.49 <.001 Duration 2 62.6370 31.3185 100.35 <.001 Stabilizer.Conc 4 84.6852 21.1713 67.84 <.001 Stabilizer.Duration 4 8.3741 2.0935 6.71 <.001 Conc.Duration 4 3.0741 0.7685 2.46 0.044 Stabilizer.Conc.Duration 8 5.2481 0.6560 2.10 0.034 Residual 513 160.1000 0.3121 Total 539 350.9704
Variate: Taste Source of variation d.f. s.s. m.s. v.r. F pr. Stabilizer 2 11.8926 5.9463 17.53 <.001 Conc 2 22.2926 11.1463 32.85 <.001 Duration 2 95.0704 47.5352 140.11 <.001 Stabilizer.Conc 4 66.8852 16.7213 49.28 <.001 Stabilizer.Duration 4 12.7741 3.1935 9.41 <.001 Conc.Duration 4 13.2407 3.3102 9.76 <.001 Stabilizer.Conc.Duration 8 7.1481 0.8935 2.63 0.008 Residual 513 174.0500 0.3393 Total 539 403.3537