Solid-State Fermentation - WUR eDepot
85
Solid-State Fermentation Modelling Fungal Growth and Activity J.P. Smits
-
Upload
khangminh22 -
Category
Documents
-
view
1 -
download
0
Transcript of Solid-State Fermentation - WUR eDepot

Solid-State Fermentation
Modelling Fungal Growth and Activity
J.P. Smits

Promotor: dr. ir. J. Tramper hoogleraar in de bioprocestechnologie
Copromotoren: dr. ir. A. Rinzema universitair docent bij de sectie Proceskunde dr. ir. H.M. van Sonsbeek onderzoeker bij TNO Voeding

,d*JoS*o\ Z33H
J.P. Smits
Solid-State Fermentation, Modelling Fungal Growth and Activity
Proefschrift ter verkrijging van de graad van doctor op gezag van de rector magnificus van de Landbouwuniversiteit Wageningen, dr. C M . Karssen, in het openbaar te verdedigen op maandag 26 januari 1998 des namiddags te 16.00 uur in de Aula.
\Qno^[o$L

ISBN 90-5485-805-2
BIBLIOTHEEK LANDBOUWUNIVERSITEIT
WAGENINGEN

^AJ0p£0l f23P</ .
1 Het door Staron beschreven detoxificerende effect tijdens de fermentatie van raapzaadschroot wordt door hem ten onrechte toegeschreven aan de toegevoegde entcultures. Staron, T. (1974) La detoxification des tourteaux de colza par voie biologique. I'Alim et la Vie 62 165 -179 Llanos Palop, M., Smits, J.P., Ten Brink, B. (1995) Degradation of sinigrin by Lactobacillus agllls strain R16 Int. J. Food Microbiol. 26 219 - 229
2 De door de regering voorgestelde flexibilisering van de arbeid leidt tot sociale onrust op individueel niveau en zal op korte en lange termijn zwaar drukken op de financiele uitgaven van de ministeries van, respectievelijk, Verkeer en Waterstaat en van Volksgezondheid, Welzijn en Sport.
3 Complementair zijn is een goede basis voor succesvol samenwerken.
4 In het artikel van Soccol et al. wordt getracht een wetenschappelijk onjuiste benadering te staven door het aanwenden van statistiek. Soccol, C, Leon, J.R., Marin, B., Roussos, S., Raimbault, M. (1993) Biotech. Tech. 8 563 - 568
5 Waar het gaat om het bestrijden van files verdient een tijdgebonden snelheidsbeperking de voorkeur boven een plaatsgebonden snelheidsbeperking.
6 Vaste-stof fermentatie biedt het perspectief de kinetiek van schimmelgroei en de correlatie hiervan met respiratieactiviteit op te helderen. Dit proefschrift
7 Tijdens vaste-stof fermentatie in een niet-isotherme schotelbed kan een hogere biomassa opbrengst worden verkregen door de aanvangstemperatuur in het bed lager te kiezen dan de temperatuur waarbij de hoogste waarde voor de maximale specifieke-groeisnelheid wordt waargenomen.
Dit proefschrift
8 Evenals een kunstenaar heeft een creatieve wetenschapper een 'piano van Vestdijk'.
9 Geweld verbroedert. Leeuwarden, 19 September 1997, 23:00 uur
10 Een voordeel van een niet gemengde vaste-stof fermentatie is dat infectie onder deze omstandigheden geen Booleaanse variabele is.
11 Voor het uitvoeren van vaste-stof fermentaties op grote schaal biedt de intensieve varkenshouderij mogelijkheden voor wat betreft outillage en technologie.
12 Wie hard fietst krijgt de wind tegen.
Stellingen behorend bij het proefschrift Solid-State Fermentation, Modelling Fungal Growth and Activity
J.P. Smits Wageningen, 26 januari 1998

Contents
Chapter 1 General Introduction 7
Chapter 2 Description of Solid-State Fermentation System 29
Chapter 3 Solid-State Fermentation of Wheat Bran by Trichoderma reesei QM9414 43
Chapter 4 Influence of Temperature on Solid-State Fermentation 59
Chapter 5 Modelling of Solid-state Fermentation . 75
Chapter 6 General Discussion: Modelling Biomass Growth and Activity in Fungal Solid-State Fermentation 101
Summary 119
Samenvatting 121
Curriculum Vitae 123
Nawoord 125
Bibliography 127

Chapter
General Introduction
Submitted for publication as Smite, J.P., Van Sonsbeek, H.M., Rinzema, A., Tramper, J., Knol, W. Solid-state fermentation - a mini review Agra Food Industry Hi-tech

Chapter 1: General Introduction
Summary The increasing interests in biotechnology for the application of fungi on the one hand, and for cheap agricultural products on the other, can be combined in so-called solid-state fermentation (SSF). SSF resembles a close to natural habitat for filamentous microorganisms and can be applied to insoluble substrates. Many applications are described in the literature, ranking from animal feed to production of fine chemicals. The substrates used are, with the exception of synthetic media, cheap agricultural end- and by-products. The fermentation itselves can be executed very simply. Several static and dynamic fermenters are described in the literature. Despite the wide applicability and apparent simplicity, fungal SSFs contain complex intrinsic difficulties. Therefore, biological and physical processes in SSF are difficult to control. This chapter gives an overview of the applications and intrinsic difficulties of SSF.
Fungi in biotechnology Mushrooms, truffles, moulds, puffballs, smut, morels, rusts and yeasts belong to the group of fungi, of which more than 70,000 are known (1). The world's largest fungus originating from one single fertilized spore registered is the underground fungus Armillaria ostoyae covering some 600 ha in the forests of Washington state, USA. The heaviest fungus reported is Armillaria bulbosa, covering about 15 ha and calculated to weigh 100 tonnes, which is of the order of magnitude of a blue whale (2). Other species, such as some yeast-type ascomycetes, are small enough to have their natural habitat in the gut of cigar beetles where they detoxify plant material consumed by the host.
Most people associate fungi with deterioration of food, with wood or with black spots on bathroom tiles and moist walls. On the other hand, connoisseurs associate fungi with production of delicacies, not only edible mushrooms and blue cheeses but also truffles, beers, breads and wines.
Although fungi belong to a large diverse group of organisms, the mechanism behind the deterioration and the production of comestibles is in fact the same. All fungi metabolize substrates, most of them consume oxygen and produce and secrete enzymes and organic and inorganic compounds simultaneously. A target in biotechnology is to explore these features and use them for food production, environmental applications and health care. To do so, fermentation processes are being developed in which fungi are brought in contact with substrates and, if necessary, oxygen under defined conditions. While the fungus consumes substrates, it grows in size and number of organisms and produces the desired products. It depends on what product is wanted whether the mixture of fungus, substrate and products is further treated to obtain purified enzymes (as for bread making, jeans bleaching and addition to washing powders) and organic compounds (antibiotics, ethanol, lactic acid, citric acid), or sold as such (blue cheeses, tempeh, beer, koji).
Types of fermentations In most commercial fermentation processes for production of enzymes and organic compounds, all substrate components are dissolved in excess of water. Such a fermentation is

Chapter 1: General Introduction
called liquid-state fermentation (LSF) and is usually conducted in a stirred-tank reactor or bubble column. Stirred-tank reactors, however, are less practical, or may even be useless, when the fermentation concerns a large quantity of water-insoluble substrates. If this fermentation contains excess of water, it manifests itselfs as a mixture of insoluble particles in water or a slurry. These will be referred to below as submerged fermentation (SmF). A fermentation in which water availability is restricted, as evidenced by the absence of free-flowing water, is called solid-state fermentation (SSF). In most SSFs, the water content varies between 30 and 75% (3), dependent on the water-absorbing capacity of the substrate and the minimum water activity required for microbial growth (4). The classification of fermentations into LSF, SmF and SSF relies on visual observations. No measurable parameter makes objective classification possible (5). Figure 1 gives a schematic presentation of the two extremes, LSF and SSF, and the twilight zone of SmF, in relation to the visual presence of water and solids.
100 09 2 80 o
o 60 O
§40
a 2 0
100
80 1
60 "5 0) u
4 0 * k .
Q.
20
u u SSF SmF LSF
Figure 1: Schematic presentation of solid-state (SSF, white area on the left), submerged (SmF, grey area) and liquid-state fermentation (LSF, white area on the right) as classified according to the visual presence of solids and liquid (solid lines) in arbitrary units.
The role of water In LSFs, water is the continuous phase, making it easy to mix and to obtain a homogeneous system. Added water-soluble substrates, nutrients and oxygen are directly and homogeneously mixed with the substrates already present. In this way, water functions as a mass-transfer medium. Besides mass, the water phase also transfers heat. Heat is produced during growth and maintenance activity of microorganisms. This is most clearly shown during SSFs, such as composting, storage of wet hay and ensilage, where microbial activity can result in

Chapter 1: General Introduction
temperatures above 50 °C (5). In an LSF, the water phase is the transfer medium of heat within the fermenter. Heat is exchanged between the fermentation broth and the environment of the fermenter. By controlling the temperature of the environment and by creating sufficient exchange surface, the temperature in the broth can be kept largely constant. In SSF, heat transfer to the environment is more difficult due to the absence of a continuous phase with a large heat capacity. Here, the most effective contribution of water to heat removal seems to be evaporation (6). The presence of large amounts of water (90-99 % of total mass) in LSF may be a disadvantage when the desired fermentation product needs further purification. Then, water needs to be separated from the product by energy-consuming techniques such as centrifugation, evaporation or filtration. From this point of view, SSF might have an economic advantage over LSF (5).
A certain amount of water will always remain necessary in SSF for the fungus to remain alive. Water is needed for intracellular transport of mass, as a substrate, for physical protection against turgor forces, and as a solvent for nutrients. There is a pronounced distinction among species with respect to the minimum amount of free water necessary for growth. Therefore, restricted water availability can prevent the outgrowth of undesired microorganisms in nonsterile fermentations, especially in combination with extreme pH, thus reducing the need for sterilization (7). This has been mentioned as an advantage of SSF over LSF (4). On the other hand, the number of species that can be applied in low-water-content SSF is restricted (8). Thus, because of the low water content, SSF can have advantages over LSF, which are enumerated by Lonsane et al. (3): superior productivity, simple technique, low capital investment, reduced energy requirement, low waste water output, improved product recovery, and elimination of foam problems.
Applications of SSF Many articles have been published on SSF. Table 1 gives an overview of those published in the scientific literature. It presents examples of the wide application potential of SSF regarding substrates, (fungal) species and product formation but does not pretend to be complete. Noticeably, agricultural raw products and by-products (cereal grains, wheat bran, wheat straw) are frequently applied as substrates for SSF. The use of these cheap substrates is an advantage of SSF over LSF.
Most agricultural products are rich carbon and nitrogen sources and contain a variety of other nutrients encapsulated in biopolymer structures such as cellulose and protein, which are largely water-insoluble. Often no additions have to be made. Usually, pretreatment of the agricultural product can be restricted to chopping, cutting or grinding, sterilization or pasteurization. However, chemical pretreatment or addition of extra nutrients may increase product yields significantly (9, 10,11) or increase accessibility towards enzymatic digestibility (12).
Complex agricultural products may have the additional advantage of high buffer capacity, which may allow omission of pH control. On the other hand, when, for instance, ammonium salts are used as extra nutrients, pH may drop significantly (7), requiring pH control.
10

Chapter 1: General Introduction
Tabic 1: Examples of applications of SSF.
target
increase digestibility
increase nutritional value
enzyme production
product
animal feed
animal feed
single-cell protein
tempeh
protein
protein + ethanol
amylase
amylase
substrate
cassava peel
orange peel
wheat straw
coffee pulp
rape-seed meal
sago starch
sugar beet pulp
sugar beet pulp
manure
soy beans
sawdust
lignocellulosic substrates
cassava starch
banana wastes
citrus peel
fodder beets
maize
bagasse
wheat bran rice bran
synthetic medium
microorganism
Manihot esculenta
Pleurotus ostreatus Agrocybe aegerita Armillariella mellea
Chaetomium cellulolyticum Trichoderma reesei Candida lipolytica
Aspergillus niger
Aspergillus clavatus Fusarium oxysporum
Rhizopus oligosporus
Trichoderma reesei Talaromyces emersonii
Trichoderma viride
Chaetomium cellulolyticum
Rhizopus oligosporus
Chaetomium cellulolyticum
Chaetomium cellulolyticum
Rhizopus oligosporus
Aspergillus niger
Aspergillus niger
Saccharomyces cerevisiae
Aspergillus niger Saccharomyces sake
Schwanniomyces castelli
Aspegillus niger
Aspergillus oryzae
system
bags
mixed system
packed bed
packed bed Petri dishes
packed bed
box kiln pilot scale
jar
tray rotating drum
tray rotating drum
flasks
inert carrier
stirred tank pilot scale
packed bed
mixed system pilot scale continuous system
flasks
column
flasks
flasks
ref.
(49)
(50)
(51)
(52)
(53)
(54)
(55)
(56)
(57)
(17)
(58)
(59)
(60)
(61)
(62)
(20)
(63)
(64)
(65)
(66)
11

Chapter 1: General Introduction
target product
enzyme amylase + production protease (cont.)
arabino-furanosidase
galactosidase
cellulase
cellulase + amylase + xylanase + protease
cellulase + glucosidase + xylanase + arabinase + pectinase + galacturonidase
P-glucosidase
B-glucosidase + endoglucanase + exoglucanase
hydrolase
pectinesterase polygalacturonase
lipase
substrate
rice
sugar beet pulp
wheat bran
barley straw
leached beet pulp
wheat straw
wheat bran
wheat bran
lignocellulosic substrates
sorghum
wheat bran
beet pulp wheat bran apple pomace potato pulp
sugar beet pulp
sugar cane bagasse wheat bran wheat straw rice bran groundnut shells
orange peel
apple pomace
wheat bran
microorganism
Aspergillus oryzae
Trichoderma reesei
Aspergillus oryzae
Trichoderma sp.
Trichoderma aeroviride
mixture of thermophilic methanogenic microorganisms
Trichoderma reesei Sporotrichum cellulophilum
Talaromyces sp.
Trichoderma sp.
Pestalotiopsis versicolor
Trichoderma reesei Aspergillus niger
Trichoderma reesei
Penicillium sp. Aspergillus sp. Talaromyces sp.
Aspergillus phoenicis
Aspergillus ellipticus Aspergillus fumigatus
Aspergillus niger
Aspergillus niger
Penicillium sp. Aspergillus niger Rhizopus sp. Mucor miehei
system
koji fermentation
flasks
Petri dishes
packed bed
mixed reactor anaerobic
tray
flasks
flask
jar
Petri-dishes
tray rotating drum
column
flasks
rotating drum
rotating drum
flasks
ref.
(67)
(68)
(69)
(70)
(71)
(72)
(35)
(73
0)
(74)
(75)
(45)
(76)
(77)
(78)
(79)
(80)
(81)
12

Chapter 1: General Introduction
target
enzyme production (com.)
production of organic compounds
product
lipase (cont.)
nuclease P1
protease
L-glutaminase
tannase
phytase
alkaloids
citric acid
ethanol
gibberellic acid
glutamic acid
lactic acid
chitosan
ochratoxin A
pigment food colour
substrate
rice
synthetic medium
wheat bran
wheat bran
wheat bran
rice bran
synthetic medium
synthetic medium
wheat bran
canola meal
bagasse
coffee husk
beet pulp cane pulp
maize
cassava flour sugar cane bagasse pith synthetic medium
bagasse
sugar cane pressmud
bagasse
wheat straw
wheat
cassava
microorganism
Candida rugosa
Penicillium citrinum
Aspergillus flavus
Aspergillus oryzae
Pseudomonas sp.
Rhizopus oligosporus
Aspergillus oryzae
Vibrio costicola
Rhizopus oryzae
Aspergillus carbonarius
Claviceps purpurea
Aspergillus niger
Aspergillus niger
Saccharomyces sake
Gibberella fujikuroi
Brevibacterium sp.
Lactobacillus casei L. helveticus Streptococcus thermophilus
Rhizopus oryzae
Lentinus edodes
Aspergillus ochraceus
Monascus sp.
system
Petri dishes
inert carrier
tray
flasks
flasks
flasks
inert carrier repeated batch
inert carrier
Petri dishes
flasks
packed bed
flasks
tray non sterile
packed bed pilot scale
column
flasks
packed bed
rotating drum
flasks
ref.
(82)
(83)
(84)
(85)
(86)
(87)
(88)
(89)
(90)
(11)
(91)
(92)
(93)
(94)
(95)
(96)
(97)
(98)
(99)
(100)
(101)
13

Chapter 1: General Introduction
target
production of antibiotics
production of fungal biomass
biocontrol
product
iturin
oxytetracycline
penicillin
spores
mushrooms
bioinsecticide
biofungicide
bioherbicide
substrate
okara
wheat bran
potato residues
bagasse
rice
buckwheat seed
compost
enriched clay
wheat bran
vermiculite rice hulls
microorganism
Bacillus subtilis
Bacillus subtilis
Streptomyces rimosus
Penicillium chrysogenum
Aspergillus flavus Aspergillus oryzae
Penicillium roqueforti
Agaricus bisporus
Beauveria bassiana
Stilbella aciculosa
Colletotrichum truncatum
system
flasks lab and pilot scale
flasks
packed bed
packed bed
plastic bags
pile
flasks packed bed
flasks
flasks dishes
ref.
(46)
(102)
(103)
(104)
(105)
(106)
(107)
(109)
(110)
(111)
Fermenter types The applications of SSF described in the literature can be classified as commercial or as research. Examples of commercial applications are composting, and enzyme, koji and tempeh production. The target of research applications is often the acquisition of knowledge, the search for new applications, optimization and scale-up. Therefore, different fermenter types are used in research and commercial applications. Several fermenter types, mentioned in Table 1, will be briefly discussed here. Flasks and Petri dishes. Some research applications are done in flasks and Petri dishes. The use of flasks originates from LSF and is usually satisfactory for preliminary experiments. Since a flask can be considered as a semi-closed system, environmental conditions are hard to control. Flasks are only applicable for fermentation of small amounts of solids. For scale-up and control studies, other systems have to be chosen. Petri dishes may allow exchange of air with the (conditioned) environment when the lid does not cover the dish airtight. In case of high surface volume ratios of the substrate, a good heat and mass exchange between substrate and environment is possible. Flasks and Petri dishes may be considered as down-scaled tray fermenters. Tray fermenter. The simplest static SSF system for commercial production is the tray fermenter. It consists of a (perforated) tray into which the moistened and inoculated substrate is poured. The tray is incubated in an environment of a certain temperature and (high) relative humidity for a couple of days. Scale-up of a tray fermentation can be done by increasing the number of trays, but results in a production process which is more labour-intensive (3). Examples of commercially applied tray fermenters can be found for production of tempeh, cheeses and enzymes (cellulases and proteases).
14

Chapter 1: General Introduction
The advantage of a tray system is in its simplicity. During fermentation, no handling is needed other than controlling the ambient temperature, relative humidity and gas composition. The disadvantage of a tray is the inefficiency of substrate use. Due to elevated temperature, lack of oxygen or high carbon-dioxide concentrations, inhibition of microbial growth and activity can occur. Temperature increase, low oxygen and high carbon dioxide concentration occur faster in the core of the fermenter bed than in the outer layers, and thus inhibition effects differ among locations in the bed (13). This results in inhomogeneity of the substrate layer. Experiments have shown that enzyme production takes place only in the outer layer of about 5 cm (14).
Aerated systems. To improve heat removal and oxygen supply in a static bed, aeration of the fermenter bed with (moistened) air is applied. These so-called packed-bed systems are used in production and on a laboratory scale for research purposes. An example of the latter is the frequently used column system of Raimbault and Alazard (7). Advantages are the possibilities for obtaining a nearly constant temperature and sufficient oxygen supply throughout the fermentation bed. By increasing the air flow through the bed, however, not only heat may be removed but also water vapour. Besides channelling in the bed, a disadvantage of a large-scale packed bed is the enlarged risk of desiccation of the substrate (15). Mixed systems. The difficulty of obtaining a homogeneous system, and thus to avoid heat build-up, can partly be overcome by mixing the substrate bed. This can be done continuously or intermittently in a drum-type fermenter (16,17) or by using augers. The latter is done during the commercial production of koji (4). Similar devices are known in the malting industry.
cr
• a ' •' J -J <" r r | l ~M.--
off f Tf u ^
c^5 t
AAA
O
1
- J *
c
Figure 2: Schematic presentation of koji production equipment (adapted from Fujiwara Engineering Co., Ltd, Japan). Shown are a mixing device with 6 augers (A), the fermenter bed (B), the air conditioner (C) with humidifier and heater and the inlet (I) and outlet (O) of air.
15

Chapter 1: General Introduction
The disadvantages are damage of fungal biomass during mixing in case of filamentous microorganisms (18), aggregation of substrate particles into balls in large-scale fermenters (3), the large void volume and the energy input needed in large-scale systems. Combined aerated and mixed systems. Probably most effective are fermentation systems in which aeration and mixing can be done simultaneously. The already mentioned fermenter for koji production is an example in which mixing and aeration are combined in a large-scale system (see Figure 2). Fluidized beds. In fluidized beds, mixing is attained by forced aeration with a large air flow. A fluidized bed forms a homogeneous mixed substrate bed (19), but puts high demands regarding uniformity of substrate particles and fermenter devices. Continuous systems. A continuous SSF system is described by Gibbons et al. (20). It consists of a tube in which the substrate, a solid slurry of beets, is slowly conveyed and mixed by an auger. The retention time of the substrate in the tube is equal to the fermentation time.
The intrinsic difficulties of the SSF process In an SSF bed, three phases can be distinguished: solid, liquid and gas phase. In an ideal system, these three phases are homogeneously distributed in the fermenter on a macroscopic scale. The fungus uses the solid as a support, metabolizes the nutrients from the solid or those dissolved in the liquid phase, and consumes oxygen from the gas phase. Meanwhile, it may produce metabolites, carbon dioxide, enzymes, newly formed biomass, water and heat, which are excreted into the system. In any SSF process, biomass increase, biomass activity, heat production and transfer, water production and evaporation, water vapour transfer, oxygen diffusion and consumption and substrate consumption play more or less important roles. In a static system, the rates of these processes vary in time, but also in place. This is caused by the differences in conditions existing between the fermentation bed and its surroundings, which result in transport of mass (e.g. oxygen, carbon dioxide, water vapour) and heat. Besides, transport rates between the surface of the bed and its surroundings are different from those within the bed, which results in increased inhomogeneity of the fermentation bed.
A target in research on modelling SSF is to predict the course of the inhomogeneity in time by describing the changes of variables involved in time and place.
Interaction of parameters Besides the variation of variables in time and place, a mutual interaction exists between them. For instance, the increase in temperature results in a change in biomass growth rate and (respiration) activity, and thus in a change in heat production, oxygen and substrate consumption, carbon dioxide and water production. The temperature changes differ locally and therefore have locally different effects on biomass growth and activity. Only if heat transfer is sufficient, local differences in temperature can be avoided. In a small system, for example, heat exchange might be sufficient to allow the fungus to grow unrestrictedly. This will continue until another parameter becomes restrictive. Oxygen exhaustion has been measured in a small fermenter chamber (13). This was also predicted to occur in an isothermal system (21).
16

Chapter 1: General Introduction
An example of a mutual relation exists in the relation between oxygen consumption and heat production. The correlation between both can be described as a constant relationship (22), but there is an opposite effect between both in SSF: high oxygen consumption rates result in high temperatures, and high temperatures inhibit oxygen consumption. If a decrease in oxygen concentration occurs, approximately a similar increase in carbon dioxide concentration will take place (13). Heat production can therefore also be coupled to carbon dioxide production (15). Similar mutual relations can be found between water and nutrient availability on the one hand, and biomass growth and (respiration) rate on the other (23). The interactions determine the complexity of an SSF process and make it difficult to predict the course of the inhomogeneity in time without the help of mathematical models. Therefore, large-scale SSFs are difficult to control. The inhomogeneity complicates drawing of representative samples for analysis and the use of results for process control. On-line measurements, such as those of oxygen and carbon dioxide concentration in the air, provide overall information on the fermentation process but do not give insight into extreme values.
Complexity of fungal growth Many fungi can use biopolymers from agricultural products as substrates. Besides, the capacity to grow at lower water activity and the capacity to migrate over the substrate surface by forming mycelium make filamentous fungi ideal species for SSF. In fact, growth under SSF conditions is most natural for fungi (7).
Figure 3: Schematic presentation of a filamentous fungus showing one branch with two tips elongating in the direction of the arrows.
Filamentous fungi grow by elongating and branching of the hyphae (see Figure 3). Early reports by Trinci (24, 25) on fungi growing on agar plates describe the combined exponential
17

Chapter 1: General Introduction
increase of number of tips and linear elongation of the hyphae during the first hours of growth, resulting in an exponential increase of total hyphal length. These observations form the basis of later studies on modelling of fungal growth (26, 27). The elongation rate and branching frequency, i.e. the morphology, depend on environmental circumstances, such as substrate availability, temperature, pH, oxygen tension and water activity (28,108). The inhomogeneity in an SSF system may thus strongly influence fungal growth. All physical changes in a fungal SSF described above start with the growth of the fungus. By describing the growth of the fungus as a function of physical parameters it should be possible to predict the evolution of inhomogeneity in SSF. A major problem, however, is to quantify the fungal biomass dry weight in the system (29). The fungus is attached to the substrate, which makes quantitative separation impossible. Alternatives, such as the amount of fungal protein (30), DNA (31), ATP (32), ergosterol (33, 34) and glucosamine (15, 35), are available and give an indication of the amount of biomass. One of the most promising parameter is the glucosamine content of fermented substrates. Glucosamine is the monomer of cell-wall chitin. Its increase during fermentation is correlated with the increase in total amount of fungal biomass present, but it cannot be used to distinguish between living and dead, active and inactive fungal biomass. Moreover, there might be no constant relationship between glucosamine and biomass dry weight (29, 33). The use of glucosamine as the biomass indicator has, as far as we know, not yet been used directly in modelling of SSF, except in our group.
Modelling SSF A mathematical model can be a powerful tool to predict the result of a fermentation and may be very useful in, for instance, process design and control.
Figure 4: Schematic presentation of modelling steps. Arrows a to f refer to the interactions described in the text.
18

Chapter 1: General Introduction
Model construction. To construct such a model, several variables and their interactions have to be described. First there is a certain amount of biomass growing with a specific-growth rate, which has a corresponding amount of activity (arrow a in Figure 4). In SSF literature, the logistic equation and the linear-growth model of Pirt (36) are often used to describe the correlation between biomass, its growth rate and activity (16, 35, 37, 38,39,40, 44). Figure 5 gives the equations which are used to calculate the specific activity of fungal biomass. A second relation (arrow b in Figure 4) describes the effect of any activity on physical variables. The correlation between measured carbon dioxide production rate and increase in water content, as given by Narahara et al. (15), and the correlation between oxygen consumption rate (22) or carbon dioxide production rate (37) and heat production are three examples.
Because biomass occupies a certain volume in the system, it can influence physical variables not only through activity, but also directly (arrow c). A change of void volume, for example, may alter diffusion, convection, heat conduction and, in a packed-bed system, pressure drop (41). The fourth correlation concerns mutual effects of physical variables and processes (arrow d in Figure 4). Examples of these are the effects of temperature on water evaporation, water evaporation on water concentration, water concentration on enthalpy, and heat production on temperature. Each physical variable may have a more or less significant effect on biomass growth. The effect of temperature is often described (39, 42,43). Temperature also affects the correlation between biomass and activity (44). These correlations are represented by arrows e and f, respectively.
specific-growth rate
linear-growth model
q = — H + m0
H = 1
"X dX dt
logistic equation
dX
^ max .
1 1-5T-"
^max .
+ m0
Figure 5: Logistic equation, specific-growth rate and linear-growth model used to calculate the specific activity q. \i is the specific-growth rate, fjmax is the maximum specific-growth rate, X is the amount of biomass present, Xmax is the maximum attainable amount of biomass, Y is the yield factor and m0 is the maintenance coefficient.
19
Chapter 1: General Introduction
Bioeng. 35 802-808 40 Gutierrez-Rojas, M., Auria, R., Benet, J.C., Revah, S. (1995) A mathematical model for
solid-state fermentation of mycelial fungi on inert support. Chem. Engin. J. 60 189-198 41 Auria, R., Morales, M., Villegas, E., Revah, S. (1993) Influence of mold growth on
pressure drop in aerated solid-state fermentors. Biotechnol. Bioeng. 47 1007-1013 42 Sangsurasak, P., Mitchell, D.A. (1995) The investigation of transient multidimensional
heat transfer in solid-state fermentation. Chem. Engin. J. 60 199-204 43 Rajagopalan, S., Modak, J.M. (1994) Heat and mass transfer simulation studies for solid-
state fermentation processes. Chem. Engin. Sci. 49 2187-2193 44 Szewczyk, K.W., Myszka, L. (1994) The effect of temperature on the growth of A. Niger in
solid-state fermentation. Bioprocess Engin. 10 123-126 45 Smits, J.P., Rinzema, A. Tramper, J., Sonsbeek, H.M. van, Knol, W. (1996) Solid-state
fermentation of wheat bran by Trichoderma reesei QM9414: substrate composition changes, C-balance, enzyme production, growth and kinetics. Appl. Microbiol. Biotechnol. 46 489-496
46 Ohno, A., Ano, T., Shoda, M. (1993) Production of the antifungal peptide antibiotic, iturin by Bacillus subtilis NB22 in solid-state fermentation. J. Ferment. Bioengin. 75 23-27
47 Rajagopalan, S., Modak, J.M. (1995) Modelling of heat and mass transfer for solid-state fermentation process in tray bioreactor. Bioprocess Engin. 13 161-169
48 Lonsane, B.K., Saucedo-Castaneda.G., Raimbault, M., Roussos, S., Viniegra-Gonzalez, G., Ghildyal, N.P., Ramakrishna, M., Krishnaiah, M.M. (1992) Scale-up strategies for solid-state fermentation systems. Process Biochem. 27 259-273
49 Ofuya, CO., Obilor, S.N. (1994) The effects of solid-state fermentation on the toxic components of cassava peel. Process Biochem. 29 25-28
50 Nicolini L, Volpe, C , Pezzotti, A., Carilli, A. (1993) Changesin in-vitro digestibility of orange peels and distillery grape stalks after solid-state fermentation by higher fungi. Bioresources Technol. 45 17-20
51 Viesturs, U.E., Apsite, A.F., Laukevics, J.J., Ose, V.P., Bekers, M.J., Tengerdy, R.P. (1981) Solid-state fermentation of wheat straw with Chaetomium cellulolyticum and Trichoderma lignorum. Biotechnol. Bioeng. Symp. 11 359-369
52 Pefialoza, W., Molina, M.R., Brenes, R.G., Bressani, R. (1985) Solid-state fermentation: an alternative to improve the nutritive value of coffee pulp. Appl. Environ. Microbiol. 49 388-393
53 Smits, J.P., Knol, W., Bol, J. (1992) Glucosinolate degradation by Aspergillus clavatus and Fusarium oxysporum in liquid and solid state fermentation. Appl. Microbiol. Biotechnol. 38 696-701
54 Gumbira-Sa'id, E., Mitchell, D.A., Greenfield, P.F., Doelle, H.W. (1992) A packed bed solid-state cultivation system for the production of animal feed: cultivation, drying and product quality. Biotechnol. Letters 14 623-628
55 Considine, P.J., Mehra, R.K., Hackett, T.J., O'Rorke, A., Comerford, F.R., Coughlan, M.P. (1986) Upgrading the value of agricultural residues. Ann. New York Acad. Sci. 469 304-311
56 Durand, A., Chereau, D. (1988) A new pilot reactor for solid-state fermentation: application to the protein enrichment of sugar beet pulp. Biotechnol. Bioeng. 31 476-486
57 Ulmer, D.C., Tengerdy, R.P., Murphy, V.G., Linden, J.C. (1980) Solid-state fermentation of manure fibres for SCP production. In: Developments in industrial microbiology, vol. 21, 425-434, Underkofler, L.A. and Wulf, M.L. (ed.), Soc. Indus. Microbiol., Arlington USA.
58 Pamment, N., Robinson, C.W., Hilton, J., Moo-Young, M. (1978) Solid-state cultivation of Chaetomium cellulolyticum on alkali-pretreated sawdust. Biotechnol. Bioeng. 20 1735-1744
59 Chahal, D.S., Vlach, D., Moo-Young, M. (1980) Upgrading the protein feed value of lignocellulosic materials using Chaetomium cellulolyticum in solid-state fermentation. In: Advances in biotechnology. Vol. 2 pp 327-332 Ed: Moo-Young, M., Robinson, C.W., Pergamon press, Toronto
60 Mitchell, D.A., Greenfield, P.F., Doelle, H.W. (1986) A model substrate for solid-state
24

Chapter 1: General Introduction
fermentation. Biotechnol. Letters 8 827-832 61 Baldensperger, J., Le Mer, J., Hannibal, L , Quinto, P.J. (1985) Solid-state fermentation
of banana wastes. Biotechnol. Letters 7 743-748 62 Rodriguez, J.A., Echevarria, J., Rodriguez, F.J., Sierra, N., Daniel, A., Martinez, O. (1985)
Solid-state fermentation of dried citrus peel by Aspergillus niger. Biotechnol. Letters 7 577-580
63 Han, I.Y., Steinberg, M.P. (1986) Solid-state yeast fermentation of raw corn with simultaneous koji hydrolysis. Biotechnol. Bioeng. Symp. 17 449-462
64 Saucedo-Castaneda, G., Lonsane, B.K., Navarro, J.M., Roussos, S., Raimbault, M (1992) Potential of using a single fermenter for biomass build-up, starch hydrolysis and ethanol production. Appl. Biochem. Biotechnol. 36 47-61
65 Pandey, A., Radhakrishnan, S. (1993) The production of glucoamylase by Aspergillus niger NCIM 1245. Process Biochem. 28 305-309
66 Murado, M.A., Gonzalez, M.P. Torrado, A., Pastrana, L.M. (1997) Amylase production by solid-state culture of Aspergillus oryzae on polyurethane foams: some mechanistic approaches from an empirical model. Process biochem. 32 35-42
67 Fukushima, D. (1982) Koji as an important source of enzymes in the orient and its unique composite systems of proteinases and peptidases. In: Use of enzymes in food technology, Dupuy, D. (ed.), 381-388, Technique et Documentation, Lavoisier, Paris.
68 Roche, N., Berna, P., Desgranges, C , Durand, A. (1995) Substrate use and production of alpha-L-arabinofuranosidase during solid-state culture of Trichoderma reesei on sugar beet pulp. Enzyme Microb. Technol. 17 935-941
69 Annunziato, M.E., Mahoney, R.R., Mudgett, R.E. (1986) Production of a-galactosidase from Aspergillus oryzae grown in solid-state culture. J. Food Sci. 51 1370-1371
70 Mukhopadhyay, A. K., Sikyta, B. (1981) Solid fermentation of barley straw. Zbl. Bakt. II. Abt. 136 644-647
71 lllanes, A., Aroca, G., Cabello, L, Acevedo, F. (1992) Solid substrate fermentation of leached beet pulp with Trichoderma aureoviride. World J. Microbiol. Biotechnol. 8 488-493
72 Vandevoorde, L., Verstraete, W. (1987) Anaerobic solid-state fermentation of cellulosic substrates with possible application to cellulase production. Appl. Microbiol. Biotechnol. 26 479-484
73 Nishio, N., Kurisu.H., Nagai, S. (1981) Thermophilic cellulase production by Talaromyces sp. in solid-state cultivation. J. Ferment. Technol. 59 407-410
74 Rao, M.N.A., Mithal, B.M., Thakkur, R.N., Sastry, K.S.M. (1983) Solid-state fermentation for cellulase production by Pestalotiopsis versicolor. Bioetchnol. Bioeng. 25 869-872
75 Castillo, M.R., Gutierrez-Correa, M., Linden, J.C., Tengerdy, R.P. (1994) Mixed culture solid-substrate fermentation for cellulolytic enzyme production. Biotechnol. Lett. 16 967-972
76 Considine, P.J., Coughlan, M.P. (1989) Production of carbohydrate-hydrolyzing enzyme blends by solid-state fermentation, in: Enzyme systems for lignocellulose degradation. Coughlan, M.P. (ed.) Elsevier Appl. Sci., London
77 Deschamps, F., Huet, M.C. (1984) B-Glucosidase production by Aspergillus phoenicis in solid-state fermentation. Biotechnol. Letters 6 55-60
78 Gupte, A., Madamwar, D. (1997) Solid-state fermentation of lignocellulosic wste for cellulase and B-glucosidase production by cocultivation of Aspergillus ellipticus and Aspergillus fumigatus. Biotechnol. Prog. 13 166-169
79 Nishio, N., Tai, K., Nagai, S. (1979) Hydrolase production by Aspergillus niger in solid-state cultivation. European J. Appl. Microbiol. Bioetchnol. 8 263-270
80 Berovic, M., Ostrover§nik, H. (1997) Production of Aspergillus niger pectolytic enzymes by solid-state bioprocessing of apple pomace. J. Biotechnol. 53 47-53
81 Rivera-Mufioz, G., Tinoco-Valencia, J.R., Sanchez, S., Farres, A. (1991) Production of microbial lipases in a solid-state fermentation system. Biotechnol. Letters 13 277-280
82 Rao, P.V., Jayaraman, K., Lakshmanan, CM. (1993) Production of lipase by Candida rugosa in solid state fermentation: Determination of significant process variables.
25

Chapter 2: Description of Solid-state Fermentation System
concentration and increases in C02 concentration were measured as volume percentages (% v/v) and recorded simultaneously for at least 20 min. OCR and CPR were calculated from the change in 02 and C02 concentration per second (A%/AJ ), respectively. The gas volume in the system (1/m3), atmospheric pressure (p N-nv2, as registered by the Koninklijk Nederlands Meteorologisch Instituut, De Bilt, Netherlands), the gas constant (f l= 8.314 J-mor'-K"1), temperature ( T= 299 K) and the amount of fermented wheat bran per measurement (Wkg) were taken into account:
A% A f
1 100
V_p R- T W
mols"1kg'1 (1)
The gas volume was corrected for the volume occupied by the Petri-dishes and wheat bran. The density of inoculated wheat bran was 0.92 g per ml, estimated by measuring the volume of hand-pressed wheat bran. During the time of a single measurement p was assumed to be constant.
co2 analyzer |
yzer
recorder
climatic incubator
flow meter
pump
26 "C 97 % RH
Petri dish
•d „ . . . . . , _ -
magnetic stiring rod measurement chamber
Figure 1: Set-up for measurement of carbon-diosxide production rate (CPR) and oxygen consumption rate (OCR).
ATP. From the fermented bran, 0.4 g was extracted by adding 4.0 ml 200 g per I trichloroacetic acid (TCA) in 4 mM EDTA and mixing for 30 s on a Vortex. The extract was diluted to at least 1:5000 with filter-sterilized HEPES buffer (2.5 mM EDTA in 25 mM HEPES, pH 7.75). The ATP level was measured with the Lumac Biocounter M 2500 (Lumac, Landgraaf, Netherlands), which method is based on the light generating with luciferin and firefly luciferase. Solutions of 100, 500 and 5000 nM ATP (Boehringer Mannheim, Germany) in HEPES buffer were used for calibration. Glucosamine. For hydrolysis of the samples for glucosamine analyses, the method described by Lin and Cousin (12) was modified. Approximately 0.1 g fermented bran was hydrolysed with
32
Chapter 2: Description of Solid-state Fermentation System
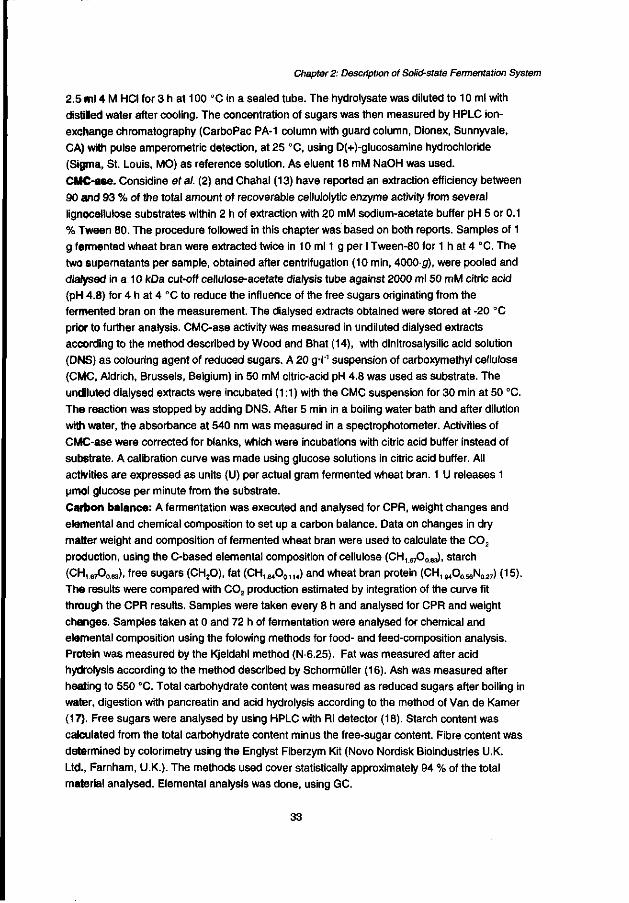
2.5 ml 4 M HCI for 3 h at 100 °C in a sealed tube. The hydrolysate was diluted to 10 ml with distilled water after cooling. The concentration of sugars was then measured by HPLC ion-exchange chromatography (CarboPac PA-1 column with guard column, Dionex, Sunnyvale, CA) with pulse amperometric detection, at 25 °C, using D(+)-glucosamine hydrochloride (Sigma, St. Louis, MO) as reference solution. As eluent 18 mM NaOH was used. CMC-ase. Considine era/. (2) and Chahal (13) have reported an extraction efficiency between 90 and 93 % of the total amount of recoverable cellulolytic enzyme activity from several lignocellulose substrates within 2 h of extraction with 20 mM sodium-acetate buffer pH 5 or 0.1 % Tween 80. The procedure followed in this chapter was based on both reports. Samples of 1 g fermented wheat bran were extracted twice in 10 ml 1 g per I Tween-80 for 1 h at 4 °C. The two supernatants per sample, obtained after centrifugation (10 min, 4000-g), were pooled and dialysed in a 10 kDa cut-off cellulose-acetate dialysis tube against 2000 ml 50 mM citric acid (pH 4.8) for 4 h at 4 °C to reduce the influence of the free sugars originating from the fermented bran on the measurement. The dialysed extracts obtained were stored at -20 °C prior to further analysis. CMC-ase activity was measured in undiluted dialysed extracts according to the method described by Wood and Bhat (14), with dinitrosalysilic acid solution (DNS) as colouring agent of reduced sugars. A 20 g-l'1 suspension of carboxymethyl cellulose (CMC, Aldrich, Brussels, Belgium) in 50 mM citric-acid pH 4.8 was used as substrate. The undiluted dialysed extracts were incubated (1:1) with the CMC suspension for 30 min at 50 °C. The reaction was stopped by adding DNS. After 5 min in a boiling water bath and after dilution with water, the absorbance at 540 nm was measured in a spectrophotometer. Activities of CMC-ase were corrected for blanks, which were incubations with citric acid buffer instead of sub6trate. A calibration curve was made using glucose solutions in citric acid buffer. All activities are expressed as units (U) per actual gram fermented wheat bran. 1 U releases 1 umol glucose per minute from the substrate.
Carbon balance: A fermentation was executed and analysed for CPR, weight changes and elemental and chemical composition to set up a carbon balance. Data on changes in dry matter weight and composition of fermented wheat bran were used to calculate the C02
production, using the C-based elemental composition of cellulose (CH, 67O083), starch (CH,67O083), free sugars (CH20), fat (CH184O0„4) and wheat bran protein (CH, 94O066N027) (15). The results were compared with C02 production estimated by integration of the curve fit through the CPR results. Samples were taken every 8 h and analysed for CPR and weight changes. Samples taken at 0 and 72 h of fermentation were analysed for chemical and elemental composition using the folowing methods for food- and feed-composition analysis. Protein was measured by the Kjeldahl method (N-6.25). Fat was measured after acid hydrolysis according to the method described by Schormuller (16). Ash was measured after heating to 550 °C. Total carbohydrate content was measured as reduced sugars after boiling in water, digestion with pancreatin and acid hydrolysis according to the method of Van de Kamer (17). Free sugars were analysed by using HPLC with Rl detector (18). Starch content was calculated from the total carbohydrate content minus the free-sugar content. Fibre content was determined by colorimetry using the Englyst Fiberzym Kit (Novo Nordisk Bioindustries U.K. Ltd., Farnham, U.K.). The methods used cover statistically approximately 94 % of the total material analysed. Elemental analysis was done, using GC.
33

Chapter 2: Description of Solid-state Fermentation System
Statistics and curve fit. For calculating the standard deviation s, a set of data independent of time is obligatory. These were only obtained for wet and dry matter weight, ATP and CMC-ase activity. Due to the method of sampling and measurement, results of OCR, CPR and glucosamine were not obtained at the same time since the measurements of OCR and CPR took at least 20 minutes. To exclude a time-dependent change, the next procedure was followed. The results measured were plotted against time, and a curve was fitted through these results, using the method of least squares. The standard error of fit, s* was calculated using the method described in the appendix. To calculate the standard deviation within a time fragment raround f, in which samples were taken, formula (2) was used.
±^i ^ L with/er (2)
The denominator in (2) represents the degree of freedom, with nr being the number of samples, and m being the number of coefficients of the curve fit in fragment r. The results obtained at around t25, t^ and t70 were not obtained completely independent of each other since, although in random order, the same 10 sets of Petri-dishes were used at each measurement time. Curve fits and statistical calculations were done with the computer software SlideWrite for Windows V3.00 (Advanced Graphics Software, Carlsbad, CA).
Results and Discussion Wet and dry-matter weight. An incubation, consisting of 60 Petri-dishes, each containing approximately 5 g wheat bran, divided over the three racks in the incubator, was done to measure the standard deviation (s) in wet and dry-matter weight after 72 h of fermentation. In Figure 2 wet and dry-matter weight are shown, expressed per g initial weight of inoculated wheat bran to facilitate statistical calculations and comparisons. Mean value (x) and s are given in Table 1. Of both wet and dry-matter weight, s was less than 5.0 % of the mean values. There was an influence of the location of the Petri-dish in the incubator on the weight. Wet
Table 1 : Mean value x and s of wet and dry-matter weight after 72 h of fermentation, expressed per g initial weight.
wet weight dry matter weight x ± s x ± s (g) (g)
rack 1 0.828 ± 0.041 0.408 ± 0.020
rack 2 0.895 ± 0.028 0.400 ± 0.009
rack 3 0.806 ± 0.040 0.409 ± 0.012
34

Chapter 2: Description of Solid-state Fermentation System
1.20
1.00
,<*• o°° - 0° °~~~ "oo '
D) 0.60 CD 5
0.00
Plate 1
o ° o°° °0o°°o <*H
0.40 !»•»••• '•••••••••̂ •••••••••••»..»»».«,
0.20
Plate 2
J 1 I 1 L -
Plate 3
° °oo o0° o o o o o o °
I , * . • • • • • • • • • • • • • • • • • ,
_l ' ' l_
1 5 9 13 17 21 25 29 33 37 41 45 49 53 57
Petri-dish
Figure 2: Wet (O) and dry-matter (•) weight after 72 h of fermentation, expressed per g initial weight of inoculated wheat bran. The horizontal lines represent the initial values.
weights of Petri dishes located on Rack 2 were higher than those on Racks 1 and 3. In contrast, results of dry matter weight measurements did not differ significantly. The differences in wet weight found on Rack 2 could be explained by differences in accumulation of water droplets, which were seen at the inside of the cover of the Petri-dishes. This formation of condensate droplets might be caused by small differences in air currents, and therefore by small differences in temperature and diffusion. The influence of these condensate droplets seems to be negligible. To check the influence of the amount of inoculated wheat bran per Petri-dish on the dry matter weight changes, 56 Petri-dishes, initially containing between 1.5 and 11.5 g wheat bran, were incubated for 72 h. The results are shown in Figure 3. The horizontal line represents initial dry matter weight per g wheat bran, calculated from the dry matter content of the wheat bran and the amount of water added to it during substrate preparation and inoculation. The results showed that below approximately 4 g initial weight scatter increased slightly. The s in dry matter weight appeared to be less than 3.5 % of the mean value in Petri-dishes initially containing more than 4 g of wheat bran. Thus, high initial weights up to 11.5 g have no significant effect on the change of dry matter weight during fermentation. Throughout the rest of the experiments between 4 and 8 g of wheat bran per Petri-dish was used.
OCR and CPR. The respiration activities, OCR and CPR, were measured in 10 sets of 3 Petri-dishes after about 25, 45 and 70 h of fermentation. One single measurement with three Petri-dishes was done shortly after f = 0. The order of Petri-dishes in the measurement chamber did not influence the results of the measurement (data not shown). The change in concentration of oxygen and carbon dioxide, A%/At, was nearly linear throughout the measurement time of 20 min. Results of OCR measurements, presented as dots, and a fitted curve through the sets of measured OCR values are presented in Figure 4. Based on the arbitrary choice of the logistic
35

Chapter 2: Description of Solid-state Fermentation System
s £0.5
5 Jj0.4 (0
E
•00.3
•
• 1
1 1
•
• • • •
0.0 2.0 4.0 6.0 8.0
initial total weight (g) 10.0 12.0
Figure 3: Influence of the initial amount of wheat bran per Petri-dish on dry matter weight after 72 h of fermentation, expressed per g initial weight of inoculated wheat bran. The horizontal line represents the initial value.
20 30 40 50 60
fermentation time (h)
Figure 4: OCR measured after r = 0, 25, 45 and 70 h of fermentation (O), and the curve fit (solid line).
curve to describe the growth of fungi in SSF (9), the differential of the logistic curve was used as curve-fit equation. The s„ of the OCR measurement showed to be 1.05-10'6mol 02persper kg, equal to 6.8 % of the predicted OCR value at 70 h of fermentation. The s„of the CPR showed to be 0.77-10"6 mol C02 per s per kg, which is 5.6 % of the predicted CPR value at 70
36

Chapter 2: Description of Solid-state Fermentation System
h of fermentation. Table 2 gives, besides the s^ the standard deviation srof the sets of data around t = 25, 45 and 70 h of fermentation. The values of srare presented as a percentage of the OCR and CPR values predicted by the curve fit at f = 25, 45 and 70 h of fermentation,
Tabic 2: Estimated standard error of curve fit, s^, presented as a percentage of values of OCR and CPR predicted by curve-fits at tT0, and standard deviation, s,, presented as a percentage of values of OCR and CPR predicted by curve-fits at t25, f45and tm
OCR CPR
se (% of predicted rate)
fermentation time f (h)
sT (% of predicted rate)
25
9.8
6.8
45
12.5
70
7.6
25
4.8
5.6
45
6.1
70
9.4
respectively. The fact that the sr 's appear to be larger than the overall s0 is caused by the difference in degrees of freedom and the fact that values are presented as relative values. s„ gave the standard error of curve fit, over a period of a little more than 70 h of fermentation. The values of s„ might give the wrong idea that the scatter in OCR and CPR was constant over time. In fact, it fluctuated in time as can be seen by the values of the sr's. Time dependence of sT was improbable, but it could not be concluded whether or not the scatter in OCR and CPR depended on the magnitude of OCR and CPR. The increase in scatter, visible during the increase of biological activity, might be caused by the influence of the cultivation method used, or by the natural variation in growth of fungi (19) due to the complexity of the substrate, or due to genetic determination.
Glucosamine. Samples used for OCR and CPR measurements at around f = 70 h were used for determination of the accuracy in glucosamine measurements. Results of the glucosamine measurement depend therefore also on time of sampling. Figure 5 shows the results of the glucosamine measurement in which the time dependence is visible. The time dependence has, like in OCR and CPR measurements, to be excluded before accuracy could be determined. However, in this case an overall curve could not be fit to calculate s„ since data were available only around t70. The course of glucosamine in time was expected to be a sigmoidal curve (6). Fragments of this curve could be described by the second-order polynomial equation (3), which replaced the sigmoidal fit within each fragment. Figure 5 shows the second-order polynomial fit trough the measured glucosamine values.
y = a0 * a,-x + a2-x2 @)
The sts70 calculated using equation (3) is 0.194 mg-g' (n = 10, m = 3), which was 4.5 % of the glucosamine content at t70, predicted by equation (3). ATP. Measurement of ATP was done in 8 samples taken from one Petri-dish and in 10 samples of wheat bran taken from 10 Petri dishes after 70 h fermentation. The correlation coefficient of the calibration curve was 0.999. The s in the ATP content of the 8 samples
37

Chapter 2: Description of Solid-state Fermentation System
Figure 5: Results of glucosamine measurement at t70 (•) and the second-order polynomial fit (solid line).
appeared to be 5.2 %, and of the 10 independent samples 9.9 %, of the mean ATP level. This last figure was significantly higher than the s for weight measurement, the s„for OCR and CPR, and the s,,70 for glucosamine measurements. Contrary to glucosamine, ATP is a measure of biological activity. It, therefore, seems to have a high potential for use in SSF control. The amount of ATP is described as a useful parameter for kinetic modelling (20) and production control (21), but the amount present in microbial cells depends strongly on the physiological status of the cells, and hence on the available substrate and sample treatment. In a complex substrate, like wheat bran, large variation in ATP is therefore not unlikely. The measurement of ATP is fast but demands practical skilfullness. In our research, we observed extremely high inaccuracies in the ATP measurement in samples of fermented wheat bran taken during the course of the fermentation, which forced us to reject the ATP measurement as a tool in our SSF research. CMC-ase. Measurement of activity of cellulolytic-enzymes activity with DNS as colouring agent is widely used in a broad range of research disciplines (22, 23,24, 25). The DNS method has, however, a large spread (24). The spread in the measurement of CMC-ase activity was, in our experience, caused by the interaction between substrate and product since the presence of CMC largely increased the spread of standard glucose solutions (results not shown). The spread in CMC-ase activity measurement in dialysed extracts was 14 % (n=10) of the measured activity level of 7 U per gram wheat bran. C-balance: The amount of C02 produced during 72 h of fermentation could be predicted using the elemental composition of the dry matter, and the change in dry matter weight, calculated as C-mol substrate. C02 production could also be predicted based on the changes in chemical composition of the bran, that is, changes in amount of starch, free sugars, fibre and fat, and their elemental
38

Chapter 2: Description of Solid-state Fermentation System
composition. Components originating from biomass (cellular substances and enzymes) are present in the fermented bran and are therefore included in these components unless they belong to the missing 6 % of the total weight which could not be determined. Both predictions can be compared with the C02 production as calculated from the integral of the curve fit through the CPR values. The predicted and the calculated C02 productions are given in Table 3. The elemental and chemical composition of wheat bran at 0 and 72 h are also given in Table 3.
Table 3: Chemical and elemental composition of fermented wheat bran after 0 and 72 h of fermentation, and predicted and calculated C02 productions. Values are expressed per g initial dry matter.
chemical composition
starch + fibres + free sugars protein fat ash rest
total
predicted C02 production
elemental composition
elemental formula
dry matter
predicted C02 production
CPR
calculated C02 production
(9) (9) (g) (g) (g)
(g) (C-mol)
(mol)
(g)
(mol)
(mol)
composition
t = 0 h
0.58 0.18 0.05 0.07 0.12
1.00 31.4-103
^''l.747^'0.6eoNo.OS3
1.00
t = 72h
0.43 0.18 0.04 0.07 0.15
0.86 24.7-103
^-'''1.750^0.643^*0.063
0.86
C02
production
6.7-10'3
4.9-10"3
5.2-103
Conclusion The presented system, in which Petri-dishes containing inoculated wheat bran were incubated in a incubator at constant temperature and humidity, showed to be accurate. By taking ten samples, an overall s could be obtained which was less than 7 % of the mean measured value of wet weight, dry matter weight, OCR, CPR and glucosamine. Thus, within the same experimental circumstances, there was a certainty of more than 95 % that the real value of a measured parameter A is A ± 15 %. For the purpose of modelling in our SSF research this is an acceptable range.
Measurement of the ATP level is less accurate. Besides, the application of ATP measurement has another drawback: the level of ATP depends largely on the physiological state of the microorganism and is thus related to the complexity of the substrate and handling of the
39

Chapter 2: Description of Solid-state Fermentation System
samples. Wheat bran might be too complex a substrate for accurate measurement of ATP.
CMC-ase measurements are even more inaccurate. The high s is mainly caused by the
combination of CMC and glucose within the DNS method.
Measurements of standard deviations of OCR, CPR and glucosamine were obstructed by time-
dependent changes. These changes could be excluded by a curve fit through the sets of
measured values. The calculated s„ can be used as an estimation of the actual time-indepen
dent standard deviation.
The results of CPR measurement showed to be in good agreement with those of elemental
and chemical composition of fermented wheat bran, indicating a good reliability of the results
of measurements.
Acknowledgement This research was financially supported by TNO Nutrition and Food Research Institute,
Bavaria BV, Gist brocades, Unilever Research Laboratorium and Quest International. The
authors wish to thank Eric Schoen and Henk van Sonsbeek for their comments on this chapter,
Cees Verbeek for glucosamine analysis, members of the Organic Chemistry Department of
the Agricultural University Wageningen, Netherlands, for executing elemental analyses, and
members of the Division of Analytical Sciences of TNO Nutrition and Food Research Institute
for composition analysis. Elemental analysis for oxygen was executed by Ets Gordinne & Co
N.V., Rotterdam, Netherlands.
References 1 Pandey, A. (1992) Recent process developments in solid-state fermentation. Process
Biochem. 27 109-117 2 Considine, P.J., Mehra, R.K., Hackett, T.J., O'Rorke, A., Comerford, F.R., Coughlan, M.P.
(1986) Upgrading the value of agricultural residues. Ann. New York Acad. Sci. 469 304-311
3 Paredes-L6pez, O., Alpuche-Solis, A. (1992) Solid substrate fermentation - A biotechnological approach to bioconversion of wastes. In: Bioconversion of waste materials to industrial products, A.M.Martin (Ed.). Elsevier Scientific Publishers, London 117-145
4 Trejo Hernandez, M.R., Lonsane, B.K., Raimbault, M., Roussos, S. (1993) Spectra of ergot alkaloids produced by Claviceps purpurea 1029c in solid-state fermentation system: influence of the composition of liquid medium used for impregnating sugar-cane pith bagasse. Process Biochem. 28 23-27
5 Fukushima, D. (1982) Koji as an important source of enzymes in the orient and its unique composite systems of proteinases and peptidases. In: Use of enzymes in food technology. P. Dupuy (Ed.), Technique et documentation Lavoisier, Paris 281 -388
6 Kim, J.H., Hosobuchi, M., Kishimoto, M., Yoshida, T., Taguchi, H., Ryu, D.D.Y. (1985) Cellulase production by a solid-state culture systems. Biotechnol. Bioeng. 27 1445-1450
7 Raimbault, M., Alazard, D. (1980) Culture method to study fungal growth in solid fermentation. European. J. Appl. Microbiol. Biotechnol. 9 199-209
8 Silman, R. (1980) Enzyme formation during solid-substrate fermentation in rotating vessels. Biotechnol. Bioeng. 22 411-420
9 Mitchell, D.A., Do, D.D., Greenfield, P.F., Doelle, H.W. (1991) A semimechanistic mathematical model for growth of Rhizopus oligosporus in a model solid-state fer-mentatiomn system. Biotechnol. Bioeng. 38 353-362
40

Chapter 2: Description of Solid-state Fermentation System
10 Smits, J.P., Janssens, R.J.J., Knol, W., Bol, J. (1994) Modelling of the glucosinolate content in solid-state fermentation of rapeseed meal with fuzzy logic. J. Ferment. Bioeng. 77 579-581
11 Young, J.F., (1967) Humidity control in the laboratory using salt solutions - a review., J. Appl. Chem. 17 241-245
12 Lin, H.H., Cousin, M A (1985) Detection of mold in processed foods by high performance liquid chromatography., J. Food Protection 48 671-678
13 Chahal, D.S. (1991) Production of Trichoderma reesei cellulase system with high hydrolytic potential by solid-state fermentation. In: ACS Symposium Series, J. Comstock (Ed.), American Chemical Society, Washington DC 111-122
14 Wood, T.M., Bhat, K. M. (1988) Methods for measuring cellulase activities. In Methods in Enzymology. ed. W.A. Wood, ST. Kellogg, ST., Academic Press Inc., San Diego 100-102
15 Pomeranz, Y„ Shellenberger, J.A. (1971) In Bread science and technology. Y. Pomeranz (Ed.), and J.A. Shellenberger, AVI Publishing Company Inc., Westport 224-245.
16 Schormiiller.J. (1969) In: Handbuch der Lebensmittelchemie band IV, Springer Verlag 423-425
17 Kamer, J.H. van de (1941) Chemisch Weekblad 38 286-288 18 Richter.K and Woelk.H.U. (1977) Die Starke 29 273-277 19 Lonsane, B.K., Saucedo-Castaneda, G., Raimbault, M., Roussos, S., Viniegra-Gonzalez,
G., Ghildyal, N.P., Ramakrishna, M., Krishnaiah, M.M. (1992) Scale-up strategies for solid-state fermentation systems. Process Biochem. 27 259-273.
20 Wang, H-H., Wu, T-Z., Hsu, J-P., Tsai, Y-S. (1991) A kinetic analysis of sorghum brewing - A typical solid-state fermentation. Nippon Shokuhin Kogyo Gakkaishi 38 716-721
21 Cochet, N„ Tyagi, R.D., Ghose, T.K., Lebeault, J.M. (1984) ATP measurement for cellulase production control. Biotechnol. Lett. 6 155-160
22 Sinha, S.N., Ghosh, B.L., Ghose, S.N. (1981) Detection of cellulase inhibitor in the wheat bran culture of Aspergillus terreus. Can. J. Microbiol. 27 1334-1340
23 Sim, T.S., Oh, J.C.S. (1990) Spent brewery grains as substrate for the production of cel-lulases by Trichoderma reese/QM9414. J. Industrial Microbiol. 5 153-158
24 Bailey, M.J., Biely, P., Poutanen, K. (1992) Interlaboratory testing of methods for assay of xylanase activity., J. Biotechnol. 23 257-270
25 Olama, Z.A., Hamza, M.A., El-Sayed, M.M., Abdel-Fattah, M. (1993) Purification, properties and factors affecting the activity of Trichoderma viride cellulase., Food Chem. 47 221-226
-Appendix-The value of a measured dependent variable y is determined by the relationship between y
and the independent variable x in combination with a random error e. A curve fit describes this
relationship by approach. If, for instance, the real relationship is
y = B0 + B,x + e , (a1)
in which li0 and B1 are the coefficients describing the relation between xand y, and in which e
is the random error, then the curve fit approaches this relationship by the linear equation
9 = a0 + a i * (a2)
Hers y can be seen as the approximated mean value of /dependent on x. The coefficients a0
and a, are the estimated values of B0, and 0 , . These coefficients are calculated such that
41

Chapter 2: Description of Solid-state Fermentation System
SSE - £ (y, - y,)2 (a3)
is as small as possible (method of least squares). In fact equation (a3) is the sum of squares of the devia curve fit.
the deviation of y from y . The corresponding standard deviation, s0, is the standard error of the
E(y,-tf)2 (a4)
se is an estimation of e, the random error. Here, the number of degrees of freedom (n-m) is determined by the number of samples (n) and the number of coefficients in the curve fit (m). In case of a linear fit, the number of coefficients m = 2. The curve fit describes the variation in ydue to variations in x, while s„ describes the variation of y occurring independent of variations in x. By calculating s0, the standard deviation of a set of data, which cannot be sampled independent of variable x, is obtained.
42
Chapter 3
Solid-State Fermentation of Wheat Bran by Trichoderma /-eese/QM9414
Published as Smite, J.P., Rinzema, A. Tramper, J., Van Sonsbeek, H.M., Knol, W. Solid-state fermentation of wheat bran by Trichoderma reese/QM9414: substrate composition changes, C-balance, enzyme production, growth and kinetics. Appl. Microbiol. Biotechnol. 46 489-496 (1996)

Chapter 3: Solid-state fermentation of wheat bran by Trichoderma reesei QM9414
Summary A description is given of the solid-state fermentation (SSF) of wheat bran by Trichoderma reese/QM9414 at constant temperature and relative humidity. Glucosamine, oxygen consumption rate (OCR), carbon dioxide production rate (CPR), changes in wheat bran composition and production of four enzymes were measured during 125 h of fermentation. A C-balance was set up between C02 production based on CPR measurements, C02 production as expected on the basis of substrate composition changes and substrate elemental composition in combination with dry matter weight loss.
Glucosamine was used as the measure of biomass. The results indicate that the glucosamine content of fungi in liquid culture cannot be used to estimate the biomass content in SSF. Using glucosamine, correlations between fungal growth and respiration kinetics could only partly be described with the linear-growth model of Pirt. A decline in OCR and CPR started at the moment the glucosamine level was 50 % of its maximum value (Gmox). After the glucosamine level had reached Gma„ OCR and CPR continued to decline. The activities of xylanase and protease are linearly related to the glucosamine level. No clear correlations between glucosamine and carboxymethyl-cellulose-hydrolyzing enzyme (CMC-ase) activity and amylase activity were found.
Introduction As a result of their inhomogeneity, scale-up and optimization of solid-state fermentation (SSF) processes, necessary for commercial production, demand intensive research. Temperature evolution is generally seen as causing the main problems in scale-up of the fermentation process. Modelling is an indispensable tool to predict growth and activity of biomass, and thus to predict temperature evolution. In our research on modelling of SSF, we use the production of carboxymethyl-cellulose-hydrolyzing enzyme (CMC-ase) activity by Trichoderma reese/QM9414 as a model fermentation. Commercial production of cellulases by Trichoderma sp. is carried out in both liquid and solid-state fermentation (1, 2). Wheat bran is one of the substrates yielding highest activities in SSF (3). Reports on production of cellulase by Trichoderma sp. in SSF (4, 5, 6, 7, 8) cannot be compared because different strains or mutants, substrates and culture conditions have been used.
We started our research with determining the accuracy of measurements of variables involved (9). The second step in our approach is to characterize the fermentation process under constant environmental conditions. The third step will be to determine the influence of environmental conditions on growth, respiration kinetics and product formation. The last step is to combine physical and kinetic parameters into a mathematical model, which has then to be validated.
The aim of the work reported in this chapter concerns the second step: description of growth, respiration kinetics, product formation and stoichiometry under constant environmental conditions. Glucosamine is used here as the fungal-biomass parameter. Correlations between glucosamine, oxygen consumption rate (OCR), carbon dioxide production rate (CPR) and enzyme production by the fungi are given. The results of the CPR measurements are also
44

Chapter 3: Solid-state fermentation of wheat bran by Trichoderma reesei QM9414
used to set up a C-balance. The correlation between glucosamine, OCR and CPR has been described before (4,10,11) using the linear-growth model, first described for growing bacteria by Pirt (12). Our results show that the correlation between specific-growth rate and specific activity deviates from the relation described by the linear-growth model.
Material and Methods Microorganism. Trichoderma reese/QM9414 (ATCC 26921) was used throughout the experiments. A spore suspension was obtained by growing the fungus in Roux bottles on malt extract agar (50 g per I, pH 5.4, Oxoid CM 59, Unipath, Basingstoke, UK) for 1 week at 28 °C, and harvesting the spores with 1 g per I Tween-80 in water. The spore suspension thus obtained was frozen (-80 °C) after adding 100 pi glycerol per ml spore suspension as cryo-protectant. The final suspension contained (3.1 ±1,2)-107 viable spores per ml after thawing, counted as colony-forming units on plate-count agar, potato dextrose agar and glucose-yeast agar(n=12).
Substrate, inoculation and incubation. From a single batch of well-mixed wheat bran, containing 9 % w/w moisture, 90 g was taken and added to 62 ml water in a 1 I bottle with screw cap (Duran, Scott, Germany). After sterilization for 20 min at 121 °C and cooling to 26 °C, 4.5 ml spore suspension, suspended in 18.0 ml sterile 9 g per I NaCI, was aseptically sprayed over the bran and mixed thoroughly. The inoculated wheat bran thus obtained contained 8.0-105 spores per gram wet weight. This procedure was executed in fourfold to obtain a sufficient amount of inoculated bran. The dry matter content of the inoculated wheat bran amounted to 466 mg per g, which corresponds with a water activity of 0.97 (results of measurements not shown). In total, 80 pre-weighed Petri dishes were filled with 5 - 7 g inoculated wheat bran, weighed again and placed in an incubator (VEA-lnstruments, Houten, Netherlands) in which the temperature was kept at 26.0 ± 0.3 °C and the relative humidity at 97 ± 1 % throughout the fermentation.
Sampling. Sampling was done at regular intervals by taking Petri dishes out of the incubator. Remaining weight of the bran was determined and substrate loss was calculated by combining the results with the dry matter content measurements. Dry matter content was assayed by measuring the weight change of ca. 0.4 g fermented bran after 16 h drying at 106 °C. OCR and CPR were determined in three Petri dishes immediately after sampling. The remaining sample material of these three Petri dishes was combined and frozen at -80 °C for CMC-ase, xylanase, amylase, glucosamine and composition analysis.
OCR and CPR. OCR and CPR were calculated from the changes in volume fraction of 02 and C02 in time, respectively, using the set up described before (9). This set up contained a cell in which three Petri dishes were placed and in which 02 and C02 concentrations were measured by pumping the air in the cell through a paramagnetic 02 analyser (Servomex Series 1100, Servomex, Zoetermeer, Netherlands) and an infrared C02 analyser (Servomex Series 1400). The changes in 02 and C02 concentrations were followed in time, and OCR and CPR were calculated as described before (9). OCR and CPR were plotted against fermentation time, and curves through them were described by equation (1). This equation was chosen from a set of equations based on the results of the method of least squares.
45

Chapter 3: Solid-state fermentation of wheat bran by Trichoderma reesei OM9414
-0.5l-2.j2 (1)
r{f) = a0+a,-e *3
Here, r(t) is either OCR(t) or CPR(t) in nmol per s per g bran and f is the fermentation time in h. The coefficients st0 to a3 are unspecified fit parameters. Glucosamine. The glucosamine content of fermented wheat bran was assayed as described previously (9), using HPLC ion-exchange chromatography (CarboPac PA-1 column with guard column, Dionex, Sunnyvale, CA) with pulse amperometric detection, at 25 °C. As eluent 18 mM NaOH was used. Enzyme activities CMC-ase. The activity of CMC-ase in extracts of fermented wheat bran was assayed in dialysed and non-dialysed extracts as described before (9). Activity is expressed in Units (U), 1 U releasing 1 umol glucose per minute. Amylase. To determine the contribution of amylase activity to the glucose measured in the CMC-ase activity assay, the following analysis was done. About 1 g of fermented bran was extracted for 1 h at 4 °C with 20 ml 0.1 % w/v Tween-80 in water. After centrifugation (5 min, 4000xg, Labofuge GL, Heraeus-Christ, Osterode) the supernatant was frozen (-20 °C) until the activity measurement was carried out. The measurement was done by incubating 0.5 ml 0.2 g per liter soluble starch in 50 mM citric acid buffer pH 4.5 for 20 min with 0.5 ml extract at 50 °C. The reaction was stopped by adding dinitrosalysilic acid solution (DNS) and further treated according to the method described by Wood and Bhat (13). Activities were calculated against glucose standard and corrected for activities found in blanks without substrate and blanks without enzyme. Activity is expressed in Units (U), 1 U releasing 1 umol glucose per minute. Xylanase. Extracts used for the amylase assay were also used in a five-fold dilution to determine xylan-hydrolyzing enzyme activity according to the method of Bailey et al. (14). A 0.1 g per liter xylan suspension was made by suspending 1 g xylan from birchwood (Sigma, St. Louis, MO) in 80 ml 50 mM citric acid buffer pH 5.3 of 60 °C and heating until boiling. The suspension was mixed overnight, brought to a volume of 100 ml and stored in small portions at -20 °C until use. From the suspension 1.8 ml was taken which was pre-heated at 50 °C and incubated for exactly 10 min with 0.2 ml of the diluted extract. The reaction was stopped by adding DNS, and xylanase activity was calculated according to the method described by Wood and Bhat (13). Xylose was used as standard . Activity is expressed in Units (U). 1 U releasing 1 umol xylose per minute. Protease. Extraction for protease activity measurement was done by adding 10 ml 100 mM phosphate buffer pH 7.0 to 1 g fermented bran and stirring the mixture for 30 min at 4 °C. After centrifugation the supernatant was frozen at -20 °C until further analyses. Protease activity was measured in duplicate with dimethyl casein (5 mg per ml in 20 mM phosphate buffer pH 7.0) as substrate using an autoanalyser. The release of alanine was measured and used as a basis for the expression of protease activity (1 U = 1 umol alanine per min per g). Composition. Samples taken at 0, 24, 48, 72, 96, and 125 h of fermentation were analysed for composition, using standard methods for food and feed analysis as mentioned before (9).
46

Chapter 3: Solid-state fermentation of wheat bran by Trichoderma reesei QM9414
Nitrogen was measured by the Kjeldahl method, and protein was calculated by multiplying the amount of organic nitrogen by 6.25. Ammonia content was measured by distillation. Fat was measured after acid hydrolysis. Ash was measured after heating at 550 °C. Total carbohydrate content was measured after digestion with pancreatin. The free sugars were analysed by ion-exchange chromatography (CarboPac PA-1 column with guard column, Dionex, Sunnyvale, CA) with pulse amperometric detection at 20 °C, using a three eluent system: deionized water, 100 mM sodium hydroxide and 100 mM sodium hydroxide in 500 mM sodium acetate. Starch content was calculated from the total carbohydrate content minus the free-sugar content. Fibre content was determined using the Englyst fiberzym kit (Novo Nordisk Bioindustries U.K., Surrey, UK). The results of these analyses are expressed per gram dry matter. Since dry matter content and weight loss are known, the results could also be calculated per gram initial weight. pH was measured in a suspension of 1 g fermented bran in 15 ml water. Elemental composition. Elemental analyses of fermented wheat bran were done by GC. Curve fit and mathematical calculations: Curves were fitted using SlideWrite V6.0 (Advanced Graphics Software, Carlsbad, CA). Mathematical calculations (differentiations and numerical integrations) were done with Mathcad V6.0 Plus (Mathsoft, Cambridge, MA).
Results Fermented-bran composition. During 125 hours of fermentation a total decrease of 0.22 g par gram initial total weight of inoculated wheat bran was observed (Figure 1). This decrease is the result of both substrate utilization and changes in water content. The weight loss due to substrate utilization was 0.10 g per gram initial dry matter weight as calculated from the results of composition analyses. Decrease in fibre content started after 24 h of fermentation. At this time starch content also
1.00
24 48 72 fermentation time (h)
96 125
M ash Y-tt-A crude protein
fibres crude fat
starch ^ M free sugars moisture I I rest
Figure 1: Changes in weight of wheat bran components during SSF with Trichoderma reesei QM9414.
47

Chapter 3: Solid-state fermentation of wheat bran by Trichoderma reesei QM9414
decreased causing a temporary increase of total free sugar content in the next 24 h (Figure 1).
The total amount of nitrogen (Kjeldahl) remained constant. The water content decreased
during the whole fermentation probably as a result of a change of water-binding capacity of the
fermented bran, since water activity was controlled during the whole fermentation period by
keeping the relative humidity of the environment at 97 ± 1 %. The amounts of fat and ash
hardly change during fermentation.
The sum of the analysed components accounted for more than 94 % of dry matter weight. This
recovery is in good agreement with the general recovery of agricultural products analysed with
these methods.
Glucosamine. Based on the arbitrary choice of a logistic curve fit to describe the growth of
fungi (15) the increase in biomass glucosamine {G(t)), that is, the measured glucosamine
content minus the background level of the wheat bran, is described with equation (2). Here,
Gmax is the maximum amount of biomass glucosamine, G0 is the initial amount of biomass
glucosamine, and /vmax is the maximum specific-growth rate.
G(r) = - Gmax
1 + t^ISSL - 1) • e""™"' ' <2>
Go
The wheat bran itself contained 0.43 mg glucosamine per gram initial dry matter. The
glucosamine content increased to a mean level of 4.6 mg per gram actual fermented bran as a
result of fungal growth during the first 80 h of fermentation. Fit results, using equation^;,
reveal that Gmax was 8.1 mg per gram initial dry matter, G0 was 0.02 mg per g and M™, was
0.123 h1. Figure 2 shows the biomass glucosamine content of the fermented bran and the
logistic curve.
OCR and CPR. The courses of OCR and CPR are presented in Figure 3a. Highest activities
were found shortly after 53 h of fermentation. The curves fitted through OCR and CPR, using
equation (1), were integrated to obtain the course of the cumulative oxygen consumption and
carbon dioxide production (Figure 3b). During 125 h fermentation 8.8 mmol 0 2 per gram initial
dry matter was consumed and 9.2 mmol C0 2 per gram initial dry matter was produced.
Enzyme production. Activities of four enzymes were determined (Figure 4). CMC-ase
activities in dialysed and non-dialysed extracts of fermented wheat bran were measured.
Activities in dialysed extracts appeared to be ca. 25 % of the activities in non-dialysed extracts
(results not shown), again demonstrating the significant influence of the dialysis-step on the
final enzyme activity, as observed before (9). The contribution of glucose resulting from
48

Chapter 3: Solid-state fermentation of wheat bran by Trichoderma reesei QM9414
25 50 75 100 fermentation time (h)
125
Figure 2: The experimentally determined biomass glucosamine G(t) (•), expressed as mg glucosamine per g initial dry matter, and the logistic curve (solid line).
0.50
25 50 75 100
fermentation time (h)
125 25 50 75 100 125
fermentation time (h)
Figure 3: OCR (o) and CPR (•) with fitted curves ( —and , respectively) (A) and the accordingly consumed oxygen (--•) and produced carbon dioxide ( ) (B) based on the integration of the empirical curves of A All results are expressed per g initial dry matter.
49

Chapter 3: Solid-state fermentation of wheat bran by Trichoderma reesei QM9414
Q) (/> CO I
O
O
25
20
15
10
5
0
-5
• •
M • » «
25
20
b> 15
(0
>> 5 E w 0
75 100 125
0 25 50 75 100 125
fermentation time (h)
B
o o • l o " 8 ° e I
Bo J_o_
i I I I I I I I 1.,1-L J t I I I t 1 I I I I
25 50 75 100 125
30
b>
CD
cn CD
o Q .
25
20
15
10
5
0
•
«
D
i a '* &
& ft
i |
*
-L_
A A
i_i-
1
A
" A 4 A
A
& * A '
1 ' ' ' 0 25 50 75 100 125
fermentation time (h)
Figure 4: Enzyme production during SSF of wheat bran by Trichoderma reesei QM9414. Activities of CMC-ase (A), amylase (S), xylanase (C) and protease (D) in non-dialysed extracts are shown. All activities are expressed as Units per g initial dry matter.
amylase activity to the CMC-ase activity measured in non-dialysed extracts was low (Figure
4b). Xylanase activity was present in large amounts, even without additional supply of
nutrients, although addition is reported to increase activity significantly (8). The course of the
protease activity is shown in Figure 4d. Protease activity yielded only a small amount of
ammonia: the amount measured in the bran remained below 7 umol NH4 per gram fermented
bran during the 125 h of fermentation (results not shown). The pH remained between 6.45 and
6.86 throughout the whole fermentation.
Discussion Correlation between glucosamine and biomass. Due to the fact that biomass cannot be
separated quantitatively from the substrate in SSF, glucosamine content of biomass growing in
50

Chapter 3: Solid-state fermentation of wheat bran by Trichoderma reesei QM9414
liquid culture is often used to estimate the amount of biomass dry matter (4,10,11). An advantage of glucosamine is that it can be measured easily and accurately (9). However, the glucosamine content of biomass needs not to be constant and it might depend on the age and physiological state of the biomass. Kim et al. (4) used the amount of glucosamine per g Trichoderma reesei dry matter in liquid culture to calculate the amount of dry matter in SSF. According to Kim et al. (4) and Xiugong and Kechang (16), the amount in liquid culture is 21 mg per g biomass dry matter. With the maximum biomass glucosamine content of 8.1 mg glucosamine per g initial dry matter measured in our experiments, which is equal to 9.7 mg glucosamine per g actual dry matter, this would account for 0.46 g biomass dry matter per g fermented bran dry matter. This means that, based on the elemental composition of Trichoderma reese/QM9414 in submerged fermentation on a nutrient medium with cellulose, which is CH,.8o00710N0143 for D>0.025 h'' (17), 2.4 mmol biomass-nitrogen per g fermented bran dry matter would be present. Kjeldahl analyses revealed 2.4 mmol N per g fermented bran dry matter, being nitrogen originating from biomass, wheat-bran protein and extra-cellular enzymes. Thus, the amount of biomass calculated with the figure of Kim et al. (4), appears to e>ioeed the amount of biomass plus proteins based on Kjeldahl analyses. These calculations indicate that the value of the glucosamine content of biomass from liquid culture is not applicable to biomass in SSF. In our research we therefore used the amount of glucosamine as the biomass parameter, without converting it into biomass dry matter. C-balance. To determine the reliability of weight, composition and CPR measurements, C02
production was calculated by integration of the curve through the CPR, and compared with the changes in weight, chemical composition and elemental composition. The correlation between dity matter weight loss and C02 production was investigated. This correlation showed to be close to linear (r2 = 0.892, see Figure 5). With this linear correlation the C02 production based
0.25 weight loss (g g" )
Figure 5: Correlation between dry matter weight loss, expressed as g per g initial dry matter, and C02 production, calculated by integration of the CPR results, expressed in mmol per g initial dry matter.
51

Chapter 4: Influence of Temperature on Solid-State Fermentation
Table 1 : Equations describing the correlations between process variables and temperature, with their parameter values and dimensions, n is the number of data used to determine the parameters.
correlation variables and
parameters
value ± standard deviation
uJJ) - (M7--7-mmH1-exP(a2 • (7--Tmax))))2
equation (1) (See Figure 1)
T lUT)
a, a2
Tml„
n
0.013 ±0.002 0.646 ± 0.071
263 ±5 313.7 ±0.1
75
(K) (mm-h"') (mm0S-K- ,h05)
(K) (K)
Gmax(7) =(b,-(7--b2H1-exp(b3-(T-rm,
equation (8) (See Figure 3)
G™,(T) b, b2 b3
(mg-g-1) 0.0128 ±0.0023 (mg05K'g06)
75 ± 40 (K) 0.694 ± 0.027 (K1)
n
Mmax(T) = «y(7--rmln)(1-exp(c2 • {T-TmJ))f um„(T) (h')
c, (9.14 ± 0.37)10"3 (h0SK'') c2 0.544 ±0.099 (K1)
(See Figure 3)
YaM1) = d,*d2-exp(-0.5il^-]2)
(See Figure 4A)
YG02(T) d, d2
d3 d,
n
m„(T) n\o Knd E, R
1.187 ±110'4
1.97±1-10'4
301 ± 2 1 0 " 3.67±5-10"
4
0.224 ±0.068 0.017 ±0.014
3.27-105± 0.47-10s
8.314
(gmol') (gmol') (gmol'') (K) (K)
(mmol h"2g') (mmolh"zg"') (mmolh^g1) (Jmol1) (Jmo|-1.K'')
mJJ) = m,0+fcm<J-exp[--^-(l--l-)]
equation (5) (See Figure 6)
experimentally due to insufficient sensitivity of the glucosamine analysis method used here. Since there is no growth at temperatures higher than Tmax, fjmm is assumed to approach zero and GmKt is assumed approach G0 when T approaches 7"max. These assumptions are used to describe the correlation between ̂ max, Gmax and T: the values ji/max(314)=0 and Gmax (314)= G0
are used as additional data points.
There is a linear relationship between urad and /vma* according to the work published by Trinci (14). This means that the Ratkowsky model should be able to describe the influence of temperature on fjmm, using the same values of Tmln and Tmax, and that a constant ratio exists between the two parameters of the Ratkowsky model applied to urad (a, and a,) and the two parameters applied to w™, (C, and c? see equation (6)).
64

Chapter 4: Influence of Temperature on Solid-State Fermentation
0.40
0.00 290 295 300 305 310 315
temperature (K)
Figure 1 : Ratkowsky fit (solid line) through the results of the urad
measurements (O).
10 9 8 7 6 5 4 3 2 1
3 °0
E
« C
b> 6> E. CD C
E (0 to o u 3
'-_
_ ;
i j t t /*^u 0
*D 4 s
n n * 1 Q •
•
e
ySO
D r
o
25 50 75 100 125
fermentation time (h)
Figure 2: Glucosamine as function of time at 4 different
temperatures: 293 (O), 299 ( • ) , 305 ( • ) and 311 K (•) . The solid
lines represent the logistic curves (equation (2)) at each temperature.
(6)
65

Chapter 4: Influence of Temperature on Solid-State Fermentation
For the purpose of describing the correlation between temperature and ijmax the model of
Ratkowsky (equation (1)) appears to be applicable. The ratios between the Ratkowsky model
parameters applied to urad and applied to /vmax (see Table 1) do not differ significantly, which
supports the approach of Trinci (see equation (7)). The curve of the Ratkowsky model applied
on the /vmax data is shown in Figure 3. Highest value of /vmax appears to be 0.154 h'1 at
approximately 307 K.
1.42 ± 0.27
1.19 ± 0.35
(7)
The course of Gmax against Tis more horizontal than the course of fjmax against 7". For
describing this correlation, the Ratkowsky model had to be modified by making Tmln variable
(equation (8)).
Gmax (T) = (b, • (T-b2) • (1-exp(to3 • (r-Tmax))))2 (8)
0.30
0.20
0.10
0.00
E
•D
C
b) 6) E C3
290 295 300 305 310 315 320
temperature (K)
Figure 3: Correlation between the growth parameters £/max ( •) and Gmax ( • ) . a n d temperature. The Ratkowsky fit, equation (1) (-—), and the modified Ratkowsky fit, equation (8) ( ), are shown. Error bars indicate the 95 % reliability limits of the individual data as were calculated by fitting the logistic equations through the glucosamine results presented in Figure 2.
66

Chapter 4: Influence of Temperature on Solid-State Fermentation
With equation (8) it is possible to give a better description of the correlation between Gmaxand
7" (Figure 3)- The values of the coefficients resulting from the fit of equation (8) are given in
Table 1. The statistical significance of coefficient b2 appeared to be low. Omitance of it in
equation (8) simplifies the relationship without affecting the correlation coefficient (r2) which
remains 0.999. Highest value of Gmax was found at approximately 307 K and appeared to be
8.7 mg per g initial dry matter.
Mukhopadhyay and Malik (15) describe an almost horizontal course of the maximum amount
of biomass of Trichoderma reese/QM9414 against temperature. Although the temperature of
their experiments, done in liquid cultures, did not exceed 307 K, our results are not in
contradiction with these results.
o E 6>
>° o d
>-
290 295 300 305 310 315
A 20
15
10
5
0
-5
m
: _ _ _ _ ! _ ! i
, i , , . , i • . , ,
B
i
'.
•
290 295 300 305 310 315
temperature (K) temperature (K)
Figure 4: Correlation between the yield factors YG 02 (O, thin error bars) and VQ C02 ( • , thick error bars) in g glucosamine per pmol"1 0 2 and C02, respectively (-4), and the maintenance coefficients m0 (6) with temperature. The solid line in (A) represents the Gaussian curve. The dashed line in (B) represents the mean value for m0 of 7.848 mmol per h per g glucosamine. Error bars indicate 95 % reliability limits of the individual data.
Specific activity. The influence of temperature on the glucosamine-based yield factors (YG02
and VG.co2) and maintenance coefficient are shown in Figure 4. The reliability of these
parameters depends largely on the number of measurements within each determination. The
values at 299 K are therefore more reliable than those at 293, 305 or 311 K.
Trie courses of VG02 and VQco2 can be described with a Gaussian curve (see Table 1 for
description of VG02). Highest values are found around 300 K. The spread in the determination
of the maintenance coefficient, m0, statistically allows it to be approached as a constant. The
value of rrig is determined to be 7.85 umol per h per g glucosamine for 0 2 consumption as well
as for C02 production. Equal values were expected since the utilization of carbohydrates, with
an elemental composition of approximately C6H1206, under non-growth circumstances is
67

Chapter 4: Influence of Temperature on Solid-State Fermentation
expected to result in a respiration quotient (RQ = CPR/OCR) of approximately 1.
The temperature dependence of the yield factor and the maintenance coefficient of Aspergillus
niger growing on beet pulp has been described by Szewczyk and Myszka (2). Contrary to our
findings, they report a constant value for the yield factor and a non-linear relation between
maintenance coefficient and temperature. They base their findings solely on measurements of
C02 production and on the theoretical description of microbial growth with a logistic curve, and
did not measure any other biomass-related parameter.
o E E o Of (J o cr
o E E e> of o o
cr
0 1 2 3 4 5 6
incubation time (h)
0 1 2 3 4 5 6 7
incubation time (h)
Figure 5: Decrease of <7OCR.G a t f ° u r different temperatures: 313 (A), 318 (6), 323 (C) and 328 K (D). The solid lines represent equation (4) at each temperature.
Decline of specific activity. The decline of QOCR.G as a function of time, determined at four
temperatures below Tmax, using data points at which ^C0</vmax/100 is described with equation
(4). The four obtained values of mA lie within the 95 % reliability range of (0.256 ± 0.204) mol
per kg glucosamine per h2.
The decline rate in ffcc G measured during incubations at temperatures above rmax increases
with increasing T. The course of <70CR,G a s a function of incubation time at four temperatures
above 7"max is shown in Figure 5.
For convenience sake, the results of md found below and above 7"max are combined and
described by the Arrhenius-type equation (5), although one should be aware that different
mechanisms, such as substrate limitation and inactivation due to denaturation of proteins,
might be responsible for the decline in specific activity above and below Tmar The course of mA
68

Chapter 4: Influence of Temperature on Solid-State Fermentation
as a function of Tis shown in Figure 6, and the values of the parameters are given in Table 1. Coefficient k„a significantly determines the course of the curve above Tmax. The value of /cmd
depends strongly on the value of other coefficients. The large spread in fcmd is therefore a cumulative result of the spread in the other coefficients. This is demonstrated by fitting equation (5) with the values of md0 and £„ fixed at 0.224 mmol per h2 per g and 3.27-105 J per mol, respectively. The so obtained standard deviation of kmA amounts only 0.0006 mmol per h2
perg. The results indicate the high sensitivity of the fungus to high temperatures. About 10 K above Tmaxthe decline in specific activity will result in inactivation of the microorganism within a couple of hours, emphasizing the importance of temperature control during large-scale solid-state fermentation.
o E E
310 320
temperature (K) 340
Figure 6: Correlation between temperature and specific-activity decline rate (m^for oxygen consumption, expressed in mmol 02 per h2 per g initial dry matter weight. The calculated data (•) and equation (6) (solid line) are shown. Error bars indicate the 95% reliability limits of the individual data.
Correlation between C02 production and dry matter weight loss. The correlation between C02 production and dry matter weight loss at 299, 305 and 311 K is shown in Figure 7. The yield of C02 at 299 K has been previously shown to balance the loss of dry matter substrate (4). Theoretically, a weight loss of 1 kg dry matter can yield a maximum amount of ca. 40 mol C02 (the molecular weight on C-mol base of wheat bran is ca. 25 g per C-mol wheat bran (4)). C02 production at the three temperatures, being 31.1 (at 299 K), 35.2 (at 305 K) and 26.3 (at 311 K) mol C02 per kg dry matter weight loss respectively, is less than the theoretical maximum. During fermentation approximately 20 % of the initial dry matter weight is consumed (4), making these fluctuations represent less than 4.5 % of the total amount (C-mol) of substrate available. If the relationship between C02 production and dry matter weight loss is used in calculations that are based on amount of initial dry matter weight, these fluctuations
69

Chapter 4: Influence of Temperature on Solid-State Fermentation
can be neglected and the correlation between dry matter weight loss and C02 production can be approached as being independent of temperature. The mean relationship can so be described by equation (9):
ACQ, -30.66 • ADM (9)
in which ACOz is the amount of C02 produced (mmol per g initial dry matter), and 4DM is the amount of weight loss (g per g initial dry matter). The standard deviation of the coefficient in equation (9) amounted 0.81 mmol C02 per g dry matter weight loss, and the correlation coefficient (i2) is 0.888.
0.05 0.10 0.15 0.20
dry-matter-weight loss (gg1)
0.25
Figure 7: Correlation between C02 production (in mmol C02 per g initial dry matter) and dry matter weight loss (in g dry matter per g initial dry matter) at 299 (•), 305 (O) and 311 K (A). The dashed line represents the correlation, given by equation (9).
Effect of temperature on enzyme production. As has been demonstrated before (4), the correlation of CMC-ase activity with glucosamine production during SSF at 299 K is not linear throughout the whole period of fermentation. These findings are confirmed by the results of the fermentations done at 305 and 311 K (Figure 8). The time at which a maximum specific-activity level is reached depends on the temperature of fermentation. Also the level of the maximum specific-activity depends on temperature. The negative values of specific CMC-ase activity, as shown in Figure 8, are caused by corrections with blanks during the period of the fermentation at which CMC-ase activity is low (2). These negative values are fortified by the division of it with low glucosamine values of the same period of fermentation. A significantly lower specific activity is found at 311 K. Suh era/. (16) and Merivuori era/. (17) have demonstrated that Trichoderma reesei QM6A and QM9414 produce less cellulases at elevated temperatures in liquid cultures. Our results also confirm earlier findings that a clear constant relation between glucosamine and CMC-ase activity is absent (4), but also support
70

Chapter 4: Influence of Temperature on Solid-State Fermentation
the notion that the physiology of the fungus changes with temperature.
25 50 75 100
fermentation time (h) 125
Figure 8: Specific activity of CMC-ase, expressed as U per mg glucosamine, at 299 (•), 305 (•) and 311 K (O). Solid lines, obtained by curve fitting using the method of least squares, indicate the differences in the course of enzyme activity in time at different temperatures. 1 U releases 1 umol glucose per minute from CMC.
Conclusions Temperature influences the kinetic paremeters of Trichoderma reese/QM9414 in solid-state fermentation of wheat bran. The influence on growth of the fungus comes to expression in the temperature dependence of maximum specific-growth rate, /Jma„ and maximum glucosamine level, Gmax. Maximum temperature for growth can be determined by measuring the radial growth rates at different temperatures and can be described using Ratkowsky's equation. Maximum temperature for growth, Tmax, was 314 K.
Temperature also influences fungal respiration activity. Yield of glucosamine on 02 and C02, VG02 and VG0O2, respectively, change by a factor of 2 when the temperature increases from 293 K to Tmax. No significant temperature dependence of the maintenance coefficient m0 is determined. The specific activity declines during growth of the microorganism at temperatures below fmax. This decline becomes exponential when temperature increases above Tmax. The physiology of Trichoderma reesei also changes with temperature. This is indicated by the change in specific CMCase activity with temperature.
The equations describing the correlation between temperature and the process variables will be used in the next step of our research, the development of a model describing the temperature evolution in a solid-state fermentation bed.
71

Chapter 5
Modelling of Solid-State Fermentation
To be published as Smite, J.P., Geelhoed, W.S., Peeters, M.P.J., Van Sonsbeek, H.M., Rinzema, A., Tramper, J., Knol, W. Modelling fungal solid-state fermentation: the role of inactivation kinetics.

Chapter 5: Modelling of Solid-state Fermentation
Summary
The theoretical mathematical models described in this chapter are used to evaluate the effects of fungal biomass inactivation kinetics on a non-isothermal tray solid-state fermentation (SSF). The inactivation kinetics, derived from previously reported experiments done under isothermal conditions and using glucosamine content to represent the amount of biomass, are described in different ways leading to four models. The model predictions show only significant effects of inactivation kinetics on temperature and biomass patterns in the tray SSF after long fermentation periods. The models in which inactivation is triggered by low specific-growth rates can predict restricted biomass evolution in combination with a fast temperature increase followed by a slower temperature decrease. Such inactivation might occur when substrate is limiting or products are formed in toxic concentrations.
Temperature is predicted to be the key parameter. Oxygen concentration is predicted to become limiting only at high heat conduction and low oxygen diffusion rates. Desiccation of the substrate is predicted not to occur.
Introduction
Solid-state fermentations (SSF) are applied for the production of, for example, enzymes, biopesticides, food, feed and fine chemicals. In SSF, microorganisms grow on a moist solid substrate without free-flowing water. The chemical reactions necessary for growth are exothermic and thus temperature control is necessary. It depends strongly on the type of fermenter system used (tray, packed bed, rotating drum) what the effect of heat production is on temperature in the fermenter bed and thus on the results of the fermentation. A typical temperature course during fermentation in a tray system shows a steep increase to 40 - 45 °C after a short lag phase, followed by a decline at a rate of 0.1 (1) to 0.5 °C (2) per hour, depending on the microorganism and type and size of system used.
Simulation models can provide insight into the complex interaction between microbial growth, oxygen consumption and concomitant heat production, and oxygen and heat transport. Ideally, these models should take into account the effects of growth, maintenance and decay on respiration activity, each as functions of, for instance, time, temperature, nutrient and water availability.
Several examples of models for fungal SSF processes can be found in the literature, describing different fermentation systems (3, 4, 5, 6, 7, 8). These reports focus on the biomass production phase of the fermentation and do not properly consider the period after growth has virtually stopped. Especially for secondary metabolites, the latter period may be very important. Besides, in most SSF systems fungal biomass is present growing at different rates, depending on combined effects of several parameters, such as temperature, water activity, and oxygen and carbon dioxide concentration. Thus, all biomass is not necessarily in the same growth phase. This emphasizes the need for
76

Chapter 5: Modelling of Solid-state Fermentation
gradual decline in respiration activity is shown after the increase in glucosamine has stopped (9). Using results from isothermal incubation experiments, this inactivation was related to temperature by an Arrhenius-type equation and to time by zero-order kinetics (12). The decline in respiration activity reduces the heat production rate, which is expected to have a strong effect on temperature patterns in SSF. In this chapter, we describe the development of mathematical models for SSF in a tray system, using three different interpretations of the inactivation kinetics, previously reported for an isothermal SSF system with Trichoderma reeseion wheat bran (12). These interpretations represent likely responses of the fungus to the dynamic, non-isothermal conditions in larger-scale SSF, and are evaluated and discussed. A fourth model, which does not include inactivation, is used as a reference and to evaluate the importance of parameters that were not determined experimentally.
Since oxygen consumption and water production are incorporated in the models, the effects of biomass growth and activity on oxygen and water concentration could be predicted. These effects are also discussed.
Model development The tray system is chosen as the fermentation system because it is widely applied in SSF for production of enzymes, for example. The width of the tray is assumed to be infinite, allowing a one-dimensional mass and heat transfer approach in vertical direction (see Figure 1). Substrate, water and air are assumed to be homogeneously divided in the tray. Heat and mass
T(0) c^O) CodO)
/ - i
M J .
;-*«0
* i f
*
r(x)
i
* « \ *
r r(x+dx) I
i x + dx
^* •*-*« *•*'
Figure 1: Schematic presentation of the tray fermentor used in model development, r is an undefined mass transport rate. The arrows show the direction of mass transfer at which r>0. The other indices are explained in the text and in Table 1.
77

Chapter 5: Modelling of Solid-state Fermentation
transfer resistance in the top of the bed are assumed to be absent. The models predict
biomass glucosamine concentration, temperature, and oxygen, water and dry matter
concentration in the tray.
The models described in this chapter start with calculating biomass glucosamine levels based
on the logistic equation (see Appendix). The respiration activity is taken proportional to the
amount of biomass glucosamine. The production rates of heat and water, and the consumption
rate of dry matter are calculated from the respiration rates. Temperature is calculated from the
water and enthalpy balances.
Respiration activity. Respiration activity is correlated to the amount of biomass glucosamine
present, using the linear-growth model (see Appendix). An important issue in calculating
respiration activity is the description of the decline in activity after the increase of glucosamine
has stopped. This decline is described as a decline in specific activity by the zero-order
equation (a7) given in the Appendix. The coefficients in this equation are obtained by
respiration activity measurements of biomass at the end of the growth phase, i.e. for biomass
with //f0</jmax/100. The argument /jft)s/jmax/100 was an arbitrary choice (9,12). Combination
of equations (a1) and (a5) reveals that fj(t)^fjm„^00 when G(t)i0.99Gmar This condition can
occur at the end of the growth phase, but also when Gmax decreases as a result of increased
temperature (12).
Equation (a7) was obtained from experiments under isothermal conditions. During large-scale
SSF the temperature increases and decreases. For description of non-isothermal, dynamic
systems three different interpretations can be given of equation (a7), resulting in three models:
(/) the decline only occurs when ^Cf)s^max/I00 (temporary-decline model, Mtemp),
(/>) the decline occurs once ^i(t)i^maich00 (partial-decline model, M^J), and
(///) the decline is always present (continuous-decline model, M^J.
Simulations obtained with these three models are compared with simulations in which the
decline in specific activity is absent (model without decline, M ^ J to demonstrate the effect of
including inactivation kinetics in the models.
The four kinetic models are incorporated in the fermenter model as follows.
Temporary-decline model, M^p For Mlemp two moments in time have to be defined: fd, the
moment the decline starts, and t„ the moment the decline stops. In /Wtomp, a decline in specific
activity only occurs when ij(t)<.ymm 1100. This means that the decline starts at fd, when
WU=M™x /100. and stops at fr when fj(t,) becomes larger than jtymax /100 again. The specific
activity in Mtemp is described by equations (1) as the replacement of equations (a4) and (a7).
forO i t< td: q(t) = ± • u(f) + m0
for td± t< tr: q{f) = -1 • u(r) + m0 - md • (f - td) (1)
for tr< t: c/(f) = - i • u(f) + m0 - md • (t, - td)
If growth has ceased (i.e. /vs 0), m0 = 2.18x10³ mols'-kg-', and md =1.7x10"8 mol-s^-kg-1 (12),
78

Chapter 5: Modelling of Solid-state Fermentation
complete inactivation, i.e. m0=ma (t,-tj, is reached when (t,-tj is about 36 h.
Partial-decline model, Af^: In M^ the decline starts at fd when \t(t) becomes equal or
smaller than /;max/100. After tA, the decline remains present even if \i(X) might become larger
than ^ m / 1 0 0 again. In this approach, equation (2) is used instead of equations (a4) and (a7):
fort
for 0 i
s f :
t<t„
(M - _1_ Y
M =
• M ( 0
Y
+ m0
M(0 +
- md
m0
•(t
(2)
y
If /n , 32.18X10"3 m o l s ' k g ' , and mA =1.7x10"° mols"2kg1 (12), complete inactivation, i.e.
ny*ma Y'-U. is reached when (t-tj is about 36 h.
Continuous-decline model, McoM: Decline of the specific activity in Mcort is always present
and independent of \}. The course of specific activity over time is described by equation (3), as
the replacement of equations (a4) and (a7).
9 0 = -^ • M(r) + rn0 - md t (3)
In this model, the decline starts from the beginning of the fermentation. This means that the
value of m0 in Mcont has to be increased in relation to the value in M^p and Mm, and the value
of / lowered. The value of m0 in Mcat is obtained by extrapolation, as is visualized in Figure 2
for 299 K. The value of Vis obtained by fitting equation (3) through the measured specific
25 50 75 100
fermentation time (h)
Figure 2: Specific activity over time at 299 K ( • ) , showing the moment (, at which /;=/vma!/100. m0 of the /Wtomp and the M^A model ("Vtomp and m0 ̂ respectively) and m0 of the Mcont model (m0 cont) are shown. The declining solid line represents m0 cont-md-f. q(t) is given in mmol 0 2 per second per kg glucosamine.
79

Chapters: Modelling of Solid-state Fermentation
activity data and is ca. 70% of that in Mtemp and M^ (results not shown). With the value of m0= 7.19x10"3 mols'kg"1 and an mA at 299 K of about 1.7x1c8 mols"2kg"1 (12), maintenance activity, i.e. n\-ma t, is zero within ca. 118 h after f=0. At that time, complete inactivation is reached, regardless of the value of /J. Model without decline, M„„,: The fourth model does not include a decline in specific activity. In this case equation (a7) is omitted, making equation (a4) valid for the whole fermentation period. In fact, Mnxra is the linear-growth model as described in the Appendix. Consumption and production rates: The respiration rates, i.e. oxygen consumption rate (/02) and carbon dioxide production rate (rC02), are calculated by multiplying the specific activity q in mol 02 or C02 per kg glucosamine per second, with G, being the amount of glucosamine present, expressed as kg glucosamine per kg initial dry matter, and cdm(0) the initial amount of dry matter in kg per m3 fermenter:
r=q-G- cjfl) (4)
r is either r02 or rC02 in mol per second per m3 fermenter. Dry matter consumption rate, r^ in kg dry matter per second per m3 fermenter, results from the relationship between C02 production and dry matter weight loss (9):
rdm = ~rC02 - MC-mol (5)
wc-moiis the molecular weight of the substrate on a C-mol base (kg per C-mol substrate).
The amount of water produced from wheat bran is calculated as follows. The water production rate, r„ in kg water per second per m3 fermenter, is supposed to be related to C02 production rate. Oxidation of wheat bran, which composition on a C-mol basis is CH, 75O068N005 (10), is supposed to occur according to equation (6).
y02 + <5CH,75O068N0o5 -» aC02 + /?H20 + remains (6)
In this equation, the term remains stands for products, not per se being biomass. The number of moles of water produced per mole C02 varies during the course of fermentation. The ratio p/ct is therefore used as a variable, which value will be evaluated later. The water production rate, r„ in kg water per second per m3 fermenter, is accordingly described by equation (7).
.. (3 rw - rC02 ' MH20 ' ~ (7)
MH20 is the molecular weight of water, which is 0.018 kg per mol water.
The production rate of heat, rH in J per second per m3 fermenter, is assumed to be proportional to the oxygen consumption rate (13):
80

Chapter 5: Modelling of Solid-state Fermentation
rH = -460x103 • r02 (8)
Macs and enthalpy balances: The water balance describes liquid water in the solid phase and water vapour in the gas phase. Each phase occupies about half of the fermenter volume. In the solid phase, which consists of moistened substrate, transport of water is assumed to be negligible compared to the diffusion of water vapour in the gas phase. In the models it is assumed that there is no difference in temperature and water activity between the gas and the solid phase. Water balance: Under the circumstances outlined above, there are three processes of importance for the water balance. The first is the production of water by the microorganism. The second is evaporation of water, which is generally seen as most effective for cooling SSF (14). The third process is the diffusion of water vapour from high to low concentrations in the fermentation bed. The combination of these three processes leads to equation (9).
™ = r - T — - D • —1 (9) or dt dx2
dojdtIs the change in water concentration in kg water per m3 fermenter per second. Rate rw is alraady given in equation (7). The term cfcjdl represents the change in water vapour concentration due to changes in temperature and water and dry matter concentrations. The term dc^/dt is obtained by differentiation of equation (10).
cm = e • aw- csat (w)
In equation (10), cm is the concentration of water vapour (in kg water vapour per m3
fermenter), which depends on the temperature-dependent concentration of water vapour in water-saturated air (c,J, water activity (aw), and e, the fraction of air in the fermenter bed. The concentration of water vapour in saturated air depends on temperature Tand can be described by an Arrhenius-type equation (equation (11)).
csat = exp[10.653 - i H l ] (11)
Equation (11) was obtained by fitting the relationship between temperature and water concentration of saturated air, as obtained from a standard physics text book (15). As temperature is a function of time, equation (11) can be rewritten into:
££- = IHL • exp[10.653 - iH l ] • i l (12) dt T2 T dt ' '
The a^ was determined at 298 K by measuring the relative humidity of the gas phase in equilibrium with wet wheat bran at different moisture contents, using the Novasina EEJA-6
81

Chapter 5: Modelling of Solid-state Fermentation
(Novasina, Pfaffikon, Switzerland). Its correlation with the moisture content, expressed as c^/c^ in kg water per kg dry matter, is described by equation (13) and shown in Figure 3. It is assumed to be valid within the temperature range of the fermentation and not to be influenced by changes in dry matter composition during the fermentation.
aw = 0.7254 + 0.2670
!•[• 1
0.2395 C„, (13)
If it is assumed that the fermenter bed does not shrink, the fraction of air in the fermenter, e, can be defined as:
c = 1 - [f*L + fi] (14)
with /£)<,„, and p„ being the densities of dry matter and water in kg dry matter per m3 dry matter and kg water per m3 water, respectively.
1.00
0.95 "
0.90
0.85
cv» ' cdm (")
Figure 3: Relationship between water content of the solid phase ( c ^ V kg water per kg dry matter) and water activity (a j . The experimental results (•) and the fit of equation (13) (solid line) are shown.
Now that all terms in equation (10) are known, dcjdi can be calculated. The last term in equation (9), the second derivative of water-vapour concentration (o^c^/dx1), is obtained numerically as will be explained later. To simplify the calculations, the fermenter bed is approached as a homogeneous (non-porous) system. cm is given in kg water vapour per m3
fermenter bed, i.e. it is the product of the concentration in the gas phase of the fermenter bed and e (see equation (10)). The effective water vapour diffusion coefficient, D'm, is given in m2
82

Chapter 5: Modelling of Solid-state Fermentation
fermenter bed per second. For the present the effective diffusion coefficient is assumed not to
change when changes in dry matter and water content in the fermenter bed occur.
Enthalpy balance: With the models described here we intend to evaluate the effects of
different descriptions of inactivation of microbial activity on biomass and temperature patterns
in a tray SSF. Temperature plays a key role in this evaluation and thus the transport of heat in
the fermenter bed is crucial. Three processes of heat transport are important in a tray
fermenter: conduction of heat, convection and diffusion of water vapour. In this theoretical
evaluation heat transport is simulated as conduction of heat and diffusion of water vapour.
Variation in heat transport is accomplished by varying the heat-transfer coefficient, A, and the
water vapour diffusion coefficient, D'm. The effects of variation in A and D'm on temperature
and biomass patterns are thus assumed to cover the effects of free convection.
The system described in the enthalpy balance consists of the components dry matter, water
present in the solid phase and water vapour. The dry air in the gas phase is assumed not to
contribute significantly to the enthalpy in this system, and is neglected.
The enthalpy of the system, H, is the sum of the enthalpies of all components/
H = 5>/-»,) (15)
In equation (15), c is the concentration and h is the molar enthalpy of component;'. The latter is
defined as
hi (7- " W + AH, (W)
In equation (16), cp is the specific heat of component;at constant pressure in J per kg per K,
and Tre, is the temperature for which cp and AH, the enthalpy of phase transition (J per kg), are
given.
Considering the components dry matter, water in the solid phase and water vapour, the
change of enthalpy, dH/dl in J per second per m3 fermenter, can be described by equation
(17).
dH =
dt
c -c • £ ! + c 4T-T V ^ * 2
^p.dm^dm -,f ^p,dm^' 'ret,dm' -,f
+ c .c -<E + C -IT-T , ) - ^ + AH - ^
p,wv wv -,. vp,wv\' ref,wv' -,. w ^ , 01 01 01
In equation (17), cp dm, cp „ and cp m are the specific heat of dry matter, water and water
vapour, respectively, in J per kg per K. Values of cdm, cm and cw are expressed in kg per m3
fermenter.
83
(17)

Chapters: Modelling of Solid-state Fermentation
accumulation rate values multiplied with the time step, dt, to the original value. Simulations started with wetted wheat bran of 53% w/w moisture content at 298 K. In the fermenter bed initially 48% of the volume is occupied by the wet substrate. The tray is supposed to be placed in an environment with a constant relative humidity corresponding to an initial a„ of 0.98 of the substrate. The initial water-vapour concentration resulted from equation (10) and amounts to 42.3 g per m3 air. The bed height was 2L = 0.20 m, of which L was divided into 20 steps. To evaluate biomass growth patterns under different situations regarding heat dissipation, A was varied between the values that represent the situation in which water is absent and the situation in which dry matter is absent. Thus, glucosamine contents at different depths in the fermentation bed were calculated using arbitrary values of A between the approximated heat conduction coefficients of wood, as a comparable substance, and that of water (0.15 and 0.60 Jm's 'K" ' , respectively). The values of A were assumed to remain constant during the fermentations. Heat transfer by convection, as explained before, was not included in the models, but its effect on the fermentation is assumed to be evaluated by variation of A.
Results and discussion The simulation results obtained with the models are presented in three steps. First, the sensitivity of the models to variation in estimated values of parameters is evaluated. Then the results of the models without and with activity decline are described and discussed. Finally, the roles of oxygen, carbon dioxide and water concentration are discussed. Sensitivity analysis: In the evaluation of the effect of temperature on SSF, four parameter values are estimated. These are cp dm, D*m, 13/or and A. The influence of variation in values of the first three parameters is evaluated on the basis of the temperature predicted. For this evaluation model A ^ is used as a worst-case situation.
The importance of A turned out to be larger than the first three parameters. The value of A is measurable but may change significantly during fermentation as a result of changes in substrate composition and an increase in biomass. The influence of variation in A on the simulations is evaluated for each of the four models with the help of temperature and of biomass glucosamine evolution. Results are discussed in detail below. Values of all other parameters are given in Table 1. The value of the specific heat of wheat bran dry matter (cp dm) is varied between 1500 and 3500 Jkg 'K ' , based on values for wood found in literature (15). The temperatures predicted with either of these values differed 2.2 K at most. This deviation was predicted at 32 h fermentation time in the 0.10 m layer of the fermentation bed. The results of simulations of the layers at 0.025, 0.05 and 0.10 m depth with cp dm=1500 and cp dm=3500 J per kg per K are shown in Figure 5. It can be concluded that variation in the value of cp dm between 1500 and 3500 Jkg'1K1 is of negligible importance for the simulation results. The concentration of water vapour in the fermentation bed is adjusted to a value corresponding to the initial value of a^ of the substrate. Water vapour diffusion is therefore only expected to happen as a result of temperature changes. Water vapour diffusion affects temperature in two ways, by the contribution of water vapour in the overall enthalpy flux, and by the transition
86

Chapters: Modelling of Solid-state Fermentation
315
295 25 50 75 100
simulated fermentation time (h) 125
Figure 5: Effect of cp ^on temperature course predicted by the M ^ model. Values of cpidm used for evaluation were 3500 (- - -) and 1500 ( ) Jkg"1K"\ The temperature courses in the layers at 0.025, 0.05 and 0.10 m are shown.
enthalpy of water that evaporates. Both effects are expected to be small because the water vapour pressure remains low in the temperature range relevant for Trichoderma reesei QM9414. Simulations with model M^ confirm these expectations. Largest temperature differences between simulations with 0*^=5.2x10"6 and 0*^=5.2x10"8 m2 per second were found after 32 h fermentation time at 0.10 m depth in the fermentation bed, and amounted to only 0.3 K (results not shown). The influence of D*m on temperature can be neglected. Therefore, our assumption that the fermenter bed is homogeneous and non-porous is of minor importance.
As described by equation (7), the amount of water produced by the microorganism is related to the amount of carbon dioxide produced. The ratio between both, defined by B/a, is expected to vary during a fermentation. Therefore, values of B/a of 0.5 and 1.0 were evaluated. The effect of this variation is low. A maximum temperature difference was predicted at 0.10 m depth after 32 h of fermentation, and amounted to only 0.9 K (results not shown). In these simulations, the water content was predicted to increase from 0.53 to 0.67 and 0.68 kg water per kg wet substrate for B/a being 0.5 and 1.0, respectively. From this minor influence it can be concluded that the change in water content in the simulations is the result of a decrease in dry matter content rather than water production or evaporation.
Decline in specific activity: The four models, MnonB, Mtamp, M^ and McM, are used to predict biomass glucosamine evolution and temperature during a fermentation lasting 400 h. The results of these predictions will be discussed below for each model separately. Figure 6 shows the glucosamine and temperature evolution. Figure 7 shows the influence of A on glucosamine
87

Chapter 5: Modelling of Solid-state Fermentation
_ 0.008
b) S 0.006 .1 I 0.004
0002
0.000
A - 0.02-
/ ; 0.03
' 1
0.01
\ ' 0.0-
i
1/ I /
U05 _„-
/
"" ^ 0 . 1 0
"
320
315
2 2 310
f305
300
E
i
J
^ ^ - 0 . 1 0
:'"V - - - - - - . / v .
0.01
315
311
307
303
299
G
I'r
• f
,r^r-_^~ °-10
\V """"^N A
o.oi -" -^
100 200 300
simulated fermentation time (h)
100 200 300
simulated fermentation time (h)
Figure 6: Evolution of biomass glucosamine (A-D) and corresponding temperature (E-H) in different layers of the fermentation bed as simulated with the values of A, cpdm and D^being 0.45 Jmol's'K-1, 2720 Jkg-'K"1 and 1.5-10"6 m2s"\ respectively. Results of the models / ty^ (A and E), M^f (B and F), M ^ (C and G) and McM (D and H) are shown. The type of lines in graph A for the layers of 0.01 to 0.10 m are accordingly used in the graphs B to H. Glucosamine concentration is given in kg glucosamine per kg initial dry matter.
88

Chapter 5: Modelling of Solid-state Fermentation
320
315
^ a 310
1
f305 300
295
E
1 0.15
0 60
£ 310
1
300
F
; •r- - X ^ S S ^ =̂ -.~:
0.6o\
0.15
" - . . O30 .
0.45"-,
.
100 200 300
simiJated fermentation time (h)
100 200 300
simulated feimentatlon time (h)
Figure 7: Biomass glucosamine (A-D) and corresponding temperature (E-H) patterns during 400 h of simulated fermentation at 10 cm bed depth predicted by the models Mnam (A and E), H,mp (B and F), Mpart (C and G) and M^ (D and H). Values of the effective heat transfer coefficient, A, used are 0.60 ( ), 0.45 (- - -), 0.30 ( ) and 0.15 J-m"'-s'1-K'1 (• • •). Glucosamine concentration is given in kg glucosamine per kg initial dry matter.
89

Chapter 5: Modelling of Solid-state Fermentation
and temperature in the centre of the fermentation bed (at 0.10 m depth). Model without decline, Mnon.: The first results presented are those of the model without decline in maintenance activity, M^,. This model has been used by several groups (3, 5, 8) in modelling SSF. It predicts biomass glucosamine and temperature patterns as given in Figure 6A and 6E, respectively.
The temperature is predicted to increase during the first 50 h of the fermentation (Figure 6E), and remains elevated during the rest of the fermentation period. The typical temperature course of an SSF, i.e. an increase followed by a slow decrease, cannot be predicted by the A C model. Biomass glucosamine, predicted by M ^ , reaches the maximum attainable glucosamine level of ca. 8.6 g per kg initial dry matter (Figure 6A) only in the outer 4 cm of the bed. The increase in glucosamine in the inner 6 cm is suppressed by the elevated temperatures. The glucosamine patterns predicted by / ty^ resemble experimental observations since fungal growth is hindered in the inner layers of an SSF tray (17,18,19). This is probably the reason why such models were assumed to be valid.
The effect of increased heat transfer is visible in the Figures 7A and 7E. The maximum temperature during a fermentation is predicted to remain below the maximum temperature for growth of the fungus, Tmax, unless A is chosen to be lower than 0.05 Js"'m'1K'1 (results not shown). In that case a temperature of 320 K is reached. Increase of heat transfer resulted in locally lower temperatures only if the maximum attainable glucosamine level was reached (results not shown). If not, temperature remained close to maximal (see Figure 7E). Due to the increased heat transport, the number of layers in which the maximum attainable glucosamine level is reached increases. At sufficiently high heat transport, the maximum attainable glucosamine level is predicted to be found in all layers of the bed within a fermentation period less than 400 h (results not shown). This, however, could not be simulated with the values of A up to 0.60 Jm's 'K" ' .
Model with temporary decline, Mtmp: A temporary decline in specific activity, constant in time, might be expected when circumstances are temporarily unfavourable. For instance, a temporarily high temperature or low oxygen concentration might result in irreversible inactivation as long as these circumstances occur. Once favourable circumstances are reestablished, the inactivation process stops in this model. The Mtemp model predicts a slow decline in temperature in the period after the maximum temperature is reached (Figure 6F). This decline accelerates when the number of layers that reach the maximum attainable glucosamine level increases and proceeds until activity is zero (Figure 6B). The temperature decline rates are initially much smaller than rates reported in the literature (1, 2), but finally are of the same order of magnitude. All layers in the fermenter bed are predicted to finally reach the maximum attainable glucosamine level. The deepest layer reaches this level some 300 h after the start of fermentation (Figure 6B).
The effect of increased heat removal on biomass glucosamine and temperature (See Figure 7B and 7F) is similar to that in the Mnons model. As long as the glucosamine level is below the maximum attainable level, the temperature remains close to maximal. The maximum attainable
90

Chapter 5: Modelling of Solid-state Fermentation
glucosamine level is reached earlier (and in more layers) when heat transfer is increased. Model with partial decline, M^. If a substrate component becomes exhausted or when a product concentration becomes toxic, inactivation of the non-growing biomass is expected to occur according to the Mm model. Once the inactivation starts it continues constant in time, until biomass is completely inactivated. The difference between the predictions in the Mtemp model and those in the M^ model are Shown in the temperature patterns (Figure 6F and 6G). In the M^ model, biomass is inactivated in the deepest layers within 80 h of simulated fermentation time (see Figure 6C) and does not contribute any more to heat production. Therefore, the temperature decrease occurs earlier than in the Mtomp model. The biomass glucosamine can reach its maximum attainable level only in the outer layers. The difference between these outer layers and the layers in which biomass is completely inactivated is a sharp border (results not shown). Increase of heat transfer is predicted to have a small effect on the temperature course (Figure 7G), but a large effect on the biomass (Figure 7C). The border of overgrown substrate moves towards the core of the fermentation bed. At a A of 0.6 Jnr 's 'K"1 the most inner layer of the fermentation bed is predicted to be overgrown in 225 h. Model with continuous decline, Afcont: The results obtained during experiments under isothermal conditions do not really allow us to define when inactivation starts. Therefore, the moment inactivation starts, i.e. at /v=0.01 ̂ max, was arbitrarily chosen. If, for instance, ageing of the biomass plays a role in inactivation, a decline of specific activity might occur during the whole fermentation independent of p. This is simulated by the Mcat model. The decline starts as soon as the fungus starts to grow. The total amount of measurable activity depends on the combined result of biomass growth, maintenance and inactivation. Within the temperature range predicted, the decline coefficient (ny is less temperature-sensitive than jumax (12). Therefore, a situation might occur in which n\-n\t becomes zero, and thus complete inactivation occurs, while temperature allows ̂ maxto be relatively high. This phenomenon results in an abrupt stop of biomass growth as is visible after a little more than 100 h in the layers halfway the middle of the fermentation bed (see Figure 6D). Temperature increases only during a restricted period (Figure 6H). The length of this period is almost independent of heat transfer (Figure 7H). An increase in heat transfer only affects the level of glucosamine reached within this period (Figure 7D). Figure 7H also shows that temperatures rise above Tmax when A is 0.15 Jnv's'K"' or lower. T„mil is predicted to be exceeded by the other models, which have a lower value of m0, when A was smaller than 0.05 Jm's 'K ' 1 . An increase of temperature above Tmax must be assigned to maintenance activity, since growth stops above Tmax.
Inhibition of growth and activity of biomass in the inner layers of the substrate bed is a feature of a tray SSF generally recognized (17,18, 19, 20, 21). However, most practical observations are done between 50 and 100 h, i.e. 4 - 8 times shorter than used for predictions in this study. Restricted overgrowth of the substrate is predicted in this study by all four models during the first 100 h of fermentation. In this period, inclusion of inactivation kinetics does not contradict
91

Chapter 5: Modelling of Solid-state Fermentation
the results of measurements and simulations done by the other groups. The importance of inactivation kinetics lies in longer-lasting fermentation periods. The models M ^ and Maxt still predict incomplete overgrowth after 400 h. These two models have other features which are less realistic. The first model misses the description of decline in activity which is obviously present (12) and predicts everlasting heat production. The M^ model represents inactivation of the biomass dependent only on time. This would suggest that, under normal circumstances, biomass has only a restricted period of activity and growth after spore germination, independent of the availability of substrate.
Both the Mm and the H„,p model predict complete overgrowth of the substrate during a 400 h fermentation, but this holds for the Mm model only when heat transfer is sufficient. Incomplete overgrowth is predicted by the /W^ model in combination with a decline of temperature at the end of fermentation. In this respect it differs from the M^ model which does not predict the temperature decline.
It cannot be concluded whether M^ or Mtemp approaches in vivo inactivation in SSF best. In practice, other phenomena, such as sporulation and activity of hydrolysing enzymes, may start to play an important role in long fermentation periods, making it hard to correlate fermentation results to one of these two models. The description of decline of specific activity is the result of measurements under isothermal conditions without limitation (9). In practice, under the non-isothermal conditions that occur in up-scaled SSF processes, other biological and physical effects may play an important role in inactivation. For instance, delayed response of growth of biomass to a temperature increase would result in higher temperatures than predicted here. This might lead to temperatures above Tmax and thus result in cessation of growth and enhanced inactivation. Oxygen, carbon dioxide and water: One of the physical phenomena in SSF denoted earlier as responsible for growth of biomass to limited depths is the limitation of oxygen (17, 22). Since the model takes oxygen consumption into account, a decrease of oxygen concentration can be calculated with equation (21). It hardly needs noting that the effect of oxygen on biomass growth and activity is not included in the models.
Figure 8 shows the results of calculations of the course of p02 in time in the layer at 0.10 m depth at different values of A and effective-diffusion coefficient of oxygen (D*02). Model M^ is used to calculate the oxygen concentration c02 in mol per m3 fermenter as a worst-case situation. The simulations reveal that oxygen limitation is dependent on two processes: oxygen transport and heat transfer, respresented in the models by two parameters: D*02 and A. At high values of A, oxygen is more rapidly limiting (Figure 8A) than at low values of A (Figure 8C). This is explained by the fact that at high heat transfer rates, biomass grows at higher growth rates and thus consumes oxygen more rapidly. Figure 8A-C show that oxygen is limiting, at values of A between 0.15 and 0.60 Jm'1s'K"1, if the value of D*02 is 1/20 or less of the effective diffusion coefficient of oxygen in air.
These simulations are supported by the findings of Rathbun and Shuler (17) for fast-growing Rhizopus oligosporus on soya beans. They measured oxygen and temperature in layers of a small fermentation chamber placed in an isothermal environment. Oxygen first became limiting in those layers where temperature did not reach the maximum temperature for growth. These layers were on the bottom of the chamber where heat transfer to the surroundings was highest.
92

Chapter 5: Modelling of Solid-state Fermentation
O Q.
o Q.
25
20
15
10
5f
0
20
16
12f
8 \
0
20 16 12 8
0
: A
20 40 60 80
simulated fermentation time (h)
Figure 8: Influence of the value of the effective diffusion coefficient (D*02) on the course of partial oxygen pressure predicted by the M^-model with X being 0.60 (A), 0.45 (B) and 0.15 (C) J -m 's 'K" 1 .Values of D"02 used for calculation are 9.3-10'7 (—), 4.2-10"6 (—) and 1.0-10"5 m2-s-1 (- - -). pOz is given in volume percentage oxygen per volume air fraction.
GhlWyal et al. (23) measured oxygen concentration at different depths in a tray SSF of
Aspergillus niger on wheat bran. Although A. niger grows faster than Trichoderma reese/and
maximum respiration activities were measured at 12 h fermentation, complete depletion of
oxygen did not occur. The oxygen-concentration and enzyme-activity profiles Ghildyal et al.
measured at different depths of up to 0.24 m demonstrated that oxygen is not the growth-
limiting parameter in a wheat bran bed. In a separate report these authors concluded that
temperature is the key parameter (20).
Whether oxygen concentration plays a role in the formation of biomass in SSF in general does
not only depend on oxygen concentration, oxygen diffusion rate, rate of heat transfer and
oxygen consumption rate, but also on the sensitivity of the biomass to lower oxygen
93

Chapter 5: Modelling of Solid-state Fermentation
concentrations which is expected to be significant (24). The sensitivity of biomass to low oxygen concentrations has to be determined in independent experiments using glucosamine as the biomass parameter to include the influence of oxygen on biomass growth and activity in our models. This is an important topic for future research on SSF.
What holds for oxygen also holds for carbon dioxide since the amount of carbon dioxide produced in the SSF bed may expected to be of the same order of magnitude as the amount of oxygen consumed (17, 23). Carbon dioxide at low concentrations might have a positive effect on microbial growth, but is inhibiting at high concentrations (24, 25). Water activity is another important parameter. However, the water content inside the fermentation bed is predicted to remain above the initial water content of 53% w/w in the wetted substrate. This is expected since the water vapour diffusion rate, which reflects dissipation of water vapour and hence of water, is low as a result of small differences in water vapour concentrations between the fermentation bed and the environment. Maximum water content was predicted to be close to 70% w/w at those locations where most biomass glucosamine is predicted.
Based on these simulation results, it can be concluded that water evaporation is of minor importance in cooling SSF in a tray under these conditions. The situation is presumed to be different when the tray is placed in a environment with a lower relative humidity than simulated here. In that case, diffusion of water vapour towards the environment increases, allowing more water to evaporate inside the bed, with a consequent increase in the contribution of evaporation to cooling and, probably more important, an increased effect of water activity on biomass growth and activity.
Increased water vapour transport is also obtained by convection, which can result from differences in temperature in a tray and from forced aeration as in a packed bed. Inclusion of free convection in the models is also one of our future research topics. For the time being, the effect of free convection on biomass glucosamine evolution and temperature in the models described here is simulated by the relatively high values of A. Besides an effect on water vapour transport, free convection also has a significant effect on oxygen and carbon dioxide transport. Increased free convection will lead to increased heat dissipation, delayed oxygen exhaustion and less carbon dioxide accumulation with a concomitant effect on biomass and temperature patterns.
Conclusions The four models differ in their description of inactivation of biomass. Omission of inactivation results in irrealistic temperature courses, but can predict biomass patterns which may be observed in practice. Inclusion of inactivation kinetics can predict more realistic temperature patterns. Inclusion is done in three ways, the /Wcont model resulting in the least likely predictions. The most probable results are predicted by the /Wpart and Mt8mp models. The /Wlemp model predicts complete overgrowth of the substrate, although it takes quite some time to accomplish this. The M^ model predicts restricted growth of biomass in the inner layers of the tray. An explanation for this can be looked for in irreversibly unfavourable circumstances, like substrate limitation and product toxicity.
94

Chapter 5: Modelling of Solid-state Fermentation
The A^rt and Mtamp models predict overall increased biomass yields with longer-lasting
fermentation periods. These longer periods, however, do not necessarily result in increased
efficiencies of the fermentations since other phenomena (such as sporulation and hydrolysing
enzymes) may start to play a spoiling part.
Heat transfer in the fermentation bed is an important parameter and determines to a large
extent the biomass and temperature patterns of the fermentation. Oxygen concentration in
deeper layers of the fermentation bed only approaches zero at high heat-transfer rates.
Desiccation of the substrate was predicted not to occur. Temperature is therefore assigned to
be the key parameter in the fermentation process and oxygen concentration only to a lesser
extent.
Table 1: List of symbols and values of constants used in the models.
Variables in time, temperature and place
a„ water activity of substrate c d m dry matter concentration Q,2 oxygen concentration Cs., water concentration in water-saturated air c„ water concentration cm water vapour concentration c„ a, specific heat of dry matter di time step D*„ effective diffusion coefficient of water vapour in fermenter D*M effective diffusion coefficient of 02 in fermenter G glucosamine concentration Gm„ maximum attainable glucosamine level H enthalpy of fermenter system hj enthalpy of a component / ;' layer in fermentation bed j component of substrate md specific activity decline rate N number of layers q specific-respiration activity r5,ap water evaporation rate r02 oxygen consumption rate rcoa carbon dioxide production rate rH heat production rate rdm dry matter consumption rate
rw water production rate T temperature t t ime fd t ime at which a decline of specific activity starts t, t ime at which a decline of specific activity stops Y yield of glucosamine on 0 2 or C 0 2
x vertical position coordinate p/or H 2 0/C0 2 ratio e fraction of air A effective heat transfer coefficient in fermenter li specific-growth rate \jmm maximum specific-growth rate
kg per m3 fermenter mol per m3 fermenter kg per m3 fermenter kg per m3 fermenter kg water per m3 fermenter J per kg dry matter per K s m2 per s m2 per s kg per kg initial dry matter kg per kg initial dry matter J per s per m3 fermenter J per s per kg
mol per s per kg glucosamine
mol per s per kg glucosamine kg water per s per m3 fermenter mol 0 2 per s per m3 fermenter mol C 0 2 per s per m3 fermenter J per s per m3 fermenter kg dry matter per s1 per m3
fermenter kg H 2 0 per s per m3 fermenter K s s s kg glucosamine per mol m mol H20 per mol C02 m3 air per m3 fermenter J per m per s per K pers pers
95

Chapter 5: Modelling of Solid-state Fermentation
Table 1 (cont.)
Constants
cdm(0)
ejfi) C P . w
C P , wv
E. G(0)
AH„ Kmd L Hl-mol
H20 "Vo n\ P POAO) R 710)
'ruin
'max
Tr.,
Pdm A,
initial dry matter content initial water concentration specific heat of water (T,., = 373 K) specific heat of water vapour (7",., = 273 K) activation energy initial glucosamine concentration evaporation enthalpy of water (Trsf=373 K) specific death rate bed height molecular weight of substrate molecular weight of water basic specific activity decline rate maintenance coefficient air pressure partial oxygen pressure gas constant ambient temperature virtual minimum temperature for growth maximum temperature for growth reference temperature density of dry matter density of water
Coefficients a, a2
a3
t>, b2
d, d2
d3
dt
for description of Gmax(T) for description of Gm„(T) for description of Gm„(T) for description of iJm„(T) for description of IJ„„(T)
for description of Y(T) for description of Y(T) for description of Y(T) for description of Y(T)
206 232 4216 2000 327x103
0.029x10³
22.7x10s
1.312x10'9
0.10 32.6 18 17.28x10'9
2.18x10³
10.13-106
20.9 0.314 298 263 313.7
840 994
4.056x10" 75 0.694 1.524x10" 0.544 1.187x10'3
1.968x10'3
301 3.67
kg per m3 fermenter kg water per m3 fermenter J per kg per K J per kg per K J per mol kg per kg initial dry matter J per kg mol per s2 per kg glucosamine m g per C-mol g per mol mol per s2 per kg glucosamine mol per s per kg glucosamine N perm % v/v J per mol per K K K K K kg per m3 dry matter kg per m3 water
kg05 per K per kg05 initial dm K per K s 0 5 per K per K kg glucosamine per mol kg glucosamine per mol K K
(a) (c) (a) (a) (b) (c) (a) (*>) (a) (b) (a) (b)
m (a) W (a) (a) ib) (b) (a) (d) (a)
(b) (b) (b) (b) (b) (b) (b) (b) (b)
(a): this chapter, (b): reference (12), (c): reference (9), (d): reference (10), (e): reference (15)
References
1 Lai, M.N., Chang, F.W., Wang, H.H. (1991) Application of pseudo-steady heat conduction model for solid-state fermentation of sorghum mash. Nippon Shokuhin Kogyo Gakkaishi 38 226-234
2 Soccol, C.R., Stertz, S.C., Raimbault, M., Pinheiro, LI. (1995) Biotransformation of solid waste from cassava starch production by Rhizopus in solid state fermentation. Part 3: Scale-up studies in different bioreactors. Arq. Biol. Technol. 38 1319-1326
3 Saucedo-Castanedo, G., Gutierrez-Rojas, M., Bacquet, G., Raimbault, M., Viniegra-Gonzalez, G (1990) Heat transfer simulation in solid substrate fermentation. Biotechnol Bioeng. 35 802-808
4 Wang, H.H., Wu, T.Z., Hsu, J.P., Tsai, Y.S. (1991) A kinetic analysis of sorghum brewing - a typical solid-state fermentation. Nippon Shokuhin KogyoGakkaishi 38 716-721
5 Szewczyk, K.W., Myszka, L. (1994) The effect of temperature on the growth of A. niger in solid-state fermentation. Bioprocess Engin. 10 123-126
96

Chapter 5: Modelling of Solid-state Fermentation
6 Sangsurasak, P., Mitchell, D.A. (1995) Incorporation of death kinetics into a 2-dimensional dynamic heat transfer model for solid-state fermentation. Chem. Engin. J. 64 253-260
7 Rajagopalan, S., Modak, J.M. (1995) Modeling of heat and mass transfer for solid state fermentation process in tray bioreactor. Bioprocess Engin. 13 161-169
8 Gutierrez-Rojas, M., Auria, R., Benet, J.C., Revah, S. (1995) A mathematical model for solid-state fermentation of mycelial fungi on inert support. Chem. Engin. J. 60 189-198
9 Smits, J.P., Rinzema, A. Tramper, J., Sonsbeek, H.M. van, Knol, W. (1996a) Solid-state fermentation of wheat bran by Trichoderma reesei QM9414: substrate composition changes, C-balance, enzyme production, growth and kinetics. Appl. Microbiol. Biotechnol. 46 489-496
10 Smits, J.P., Rinzema, A., Tramper, J., Schlosser, E.E., Knol, W. (1996b) Accurate determination of process variables in solid state fermentation system. Process Biochem. 31 669-678.
11 Pirt, S.J. (1965) The maintenance energy of bacteria in growing cultures. Proc. Royal. Soc. of London 163 224-231
12 Smits, J.P., Rinzema, A., Tramper, J., Sonsbeek, H.M. van, Hage, J.C., Kaynak, A., Knol, W. (1997) The influence of temperature on kinetics in solid-state fermentation. In press Enzyme Microb. Technol.
13 Riet, van 1, K., Tramper, J. (1991) in: Basic bioreactor design. Marcel Dekker, inc. New York
14 Laukevics, J.J., Aspite, A.F., Viesturs, U.S., Tengerdy, R.P. (1984) Solid substrate fermentation of wheat straw to fungal protein. Biotechnol. Bioeng. 26 1465-1474
15 Weast, R.C., Astle, M.J. (ed.) In: CRC Handbook of Chemistry and Physics vol 61 (1980) CRC Press, Inc. Boca Raton
16 Press, W.H , Tenkolsky, S.A.. Vettering, W.T., Flannery, B.P. (1992) In: Numerical recipes, Cambridge University Press, Camebridge
17 Rathbun, B.L., Shuler, M.L. (1983) Heat and mass transfer effects in static solid-substrate fermentations: design of fermentation chambers. Biotechnol. Bioeng. 25 929-938
18 Doelle, H.W., Mitchell, D.A., Rolz, C.E. (1992) in: Solid substrate cultivation. Elsevier Appl. Sci., Essex.
19 Raghava Rao, K.S.M.S., Gowthaman, M.K., Ghildyal, N.P., Karanth, N.G. (1993) A mathematical model for solid-state fermentation in tray bioreactors. Bioprocess Engin. 8 255-262
20 Ghildyal, N.P., Ramakrishna. M., Lonsane, B.K., Karanth, N.G., Krishnaiah, M.M. (1993) Temperature variations and amyloglucosidase levels at different bed depths in a solid state fermentation system. Chem. Engin. J. 51 B17-B23
21 Rajagopalan, S., Modak, J.M. (1994) Heat and mass transfer simulation studies for solid-state fermentation processes. Chem. Engin. Sci. 49 2187-2193
22 Mudget, R.E. (1980) Controlled gas environments in industrial fermentations. Enzyme Microb. Technol. 2 273-280
23 Ghildyal, N.P., Ramakrishna, M., Lonsane, B.K., Karanth, N.G. (1992) Gaseous concentration gradients in tray type solid state fermentors - Effect on yields and productivities. Bioprocess Engin. 8 67-72
24 Bajracharya, R., Mudgett, R.E. (1980) Effects of controlled gas environments in solid-substrate fermentations of rice. Biotechnol. Bioeng. 22 2219-2235
25 Reu, J. de. (1995) Solid-substrate fermentation of soya beans to tempe. Thesis Agricultural University Wageningen
- Appendix -Glucosamine is the building block of chitin in the fungal-cell wall. Its content in an SSF system
is a measure for the amount of biomass present and replaces the biomass parameter in the
models used here.
97

Chapter 5: Modelling of Solid-state Fermentation
Glucosamine content and respiration activity during the fermentation of wheat bran by
Trichoderma reeseiQM 9414 at different temperatures were described by Smits er al. (9,12).
The mathematical descriptions of the influence of time and temperature on glucosamine and
respiration activity resulting from these studies are summarized here.
The increase in rate of glucosamine at constant temperature is described with the logistic
equation:
dG(f) ,, r l f . f 1 G(f),
in which dG/dt is given in kg glucosamine per kg initial dry matter per second.
Maximum glucosamine content, Gmax in kg glucosamine per kg initial dry matter, is described
as a function of temperature by:
Gmax(7) =[ar(T-a2H1-exp(a3-(r-rm a x))) ]2 (a2)
Maximum specific-growth rate, /vm„ in s ' \ is described as a function of temperature by:
MmaxW =[t>AT-TmJ-V-exp(b2iT-Tmm)))f (a3)
Tmln and Tm„ are the minimum and maximum temperature for growth in K, respectively, a, to
a3 and b, and bz are constants.
The highest maximum attainable glucosamine concentration is ca. 8.5 g glucosamine per kg
initial dry matter, which is reached after isothermal growth at ca. 305 K. The highest //max is
reached at approximately the same temperature and amounts to 0.4x10"6 s ' \
The specific respiration activity q, i.e. oxygen consumption or carbon dioxide production rate in
mol per second per kg glucosamine, is described by the linear-growth model:
<7(0 = -^ • M(0 + m0 (a4)
Here, \i(t) is the specific-growth rate in s ' \ as described by equation (a5).
M(0 = ^o-^2 (a5>
m0 is the maintenance coefficient in mol 0 2 or C02 per second per kg glucosamine, and Vis
the yield factor in kg glucosamine per mol 0 2 or C02, whose dependence on temperature can
be described by:
Y(T) = cf1+d2-exp(-0.5-[^-l]2) (a6)
98

Chapter 5: Modelling of Solid-state Fermentation
In equation (a6), d, to dt are constants. The specific activity declines after growth has ceased, i.e. after fd when v(tj = ymm/100. This decline is described over time by equation (a7), in which the contribution of growth is neglected.
qr(r) = mQ - md • (t - td) (a7)
for fef„
The course of the specific activity decline rate, md in mol per second per kg glucosamine, for biomass growing at a specific-growth rate of fj(t) < ̂ max /100, is described by the Arrhenius-type equation as a function of temperature:
n^T) = ̂ o + ^ - e x p I - ^ ^ - l - J - ) ] (a8) M I 'max
In equation (a8), md0 is the basic specific-activity decline rate (mols2 per kg glucosamine), kmd
is the specific death rate (mols2 per kg glucosamine), £a is the activation energy of inactivation (Jmol1), and R is the gas constant (Jmol'K'1). n% describes the linear decline of specific activity of non-growing biomass in time. The maintenance coefficient m0 is assumed to be constant in time and thus md, in fact, describes the change in the amount of active biomass contributing to the specific activity. This means that, finally, q(t) becomes zero because of the increase in the amount of inactivated biomass.
99

Chapter 6: General Discussion
Summary The logistic equation and the linear-growth model are often used in models for solid-state fermentation (SSF). The logistic equation is used to describe the evolution of total biomass and does not discriminate between growing active, non-growing active and inactive biomass. The linear-growth model, on the other hand, describes the activity necessary for growth and maintenance and does not deal with inactive biomass. Using the combination of both in a mathematical model for predicting temperature, oxygen and biomass patterns in SSF appears not to be sufficiently detailed. The inclusion of inactivation of biomass in the model is mandatory to predict simultaneously restricted biomass growth and temperature decline during fermentation. Inclusion of the dependence of biomass growth and activity on reversible variables, such as temperature and oxygen concentration, does result in inhibition but cannot terminate biomass growth and activity.
This chapter evaluates the implementation of logistic equation and the linear-growth model in modelling fungal SSF and discusses the need for research efforts focused on the post-growth stage. It is concluded that the combination of logistic equation and linear-growth model is only suitable to describe fungal SSF if, for instance, time- or substrate-dependent inactivation kinetics are incorporated as well.
Introduction Fermentation of substrates under conditions of limited water availability, so-called solid-state fermentation (SSF), has been applied for centuries for the production of food and feed. Examples are the production of tempeh and koji, which are important protein and enzyme products, respectively, in the food industry of the Far East. Many other applications of SSF are described in scientific literature, such as production of hydrolytic enzymes, pigments, antibiotics, ethanol and protein (1). Advantages of SSF over submerged fermentations lie in the absence of excess water: high productivity, simple technique, reduced energy requirement, low waste water output, and elimination of foam problems. A typical SSF contains between 40 and 80% w/w water (2). Generally, volumetric yields are high and substrates are usually cheap insoluble agricultural products. An SSF forms a typical environment close to the natural habitat of fungi (3). Fungi are therefore most successfully applied in SSF. The main feature of an SSF is the inhomogeneous distribution of biomass or related products in, especially, a tray fermenter bed (1, 4, 5, 6). Several studies have attempted to describe the development of this inhomogeneity. High temperature and low oxygen concentration are believed to be the most important factors (7). Nowadays, fast-calculating computers ease mathematical modelling of SSF for simulation, design and optimization studies. These models describe the biological and physical processes involved in SSF and predict the course of fermentation even when alterations of physical variables are involved. Several of such mathematical models described in the literature contribute to a better understanding of the intrinsic difficulties of SSF.
Steps in modelling SSF In modelling SSF, several steps can be distinguished. The first is the description of biomass
102

Chapter 6: General Discussion
evolution and the second is correlation of biomass amount with its activity. Then the description of the influence of environmental parameters, such as temperature and oxygen, carbon-dioxide and water content, on the first two steps follows. In addition to the description of thdse biological processes of growth and activity, physical processes such as mass and heat transfer, evaporation, condensation, convection and conduction, and the effect of biological processes on these physical processes, have to be included in the mathematical model. This chapter provides a closer look at modelling SSF by evaluating the first three steps mentioned above. How these steps are taken and what the consequences are for the model predictions of biomass, temperature and oxygen concentration is evaluated.
Description of fungal biomass The most widely used equation for describing the evolution of biomass or biomass-related parameters in an SSF system is the logistic equation, equation (1) (see Table 1 and refs. 8, 9, 10,11).
^ = M m a x - X - [ 1 - ^ ] (1)
Hire, X is the actual amount of biomass, ymax is the maximum specific-growth rate and Xmax is thp maximum attainable amount of biomass. If dormant spores are used as inoculum in a fermentation, a lag phase should be considered before biomass increases. During this lag phase, dXtlf is zero and Xis equal to X0, the initial amount of viable biomass. Since a large problem in SSF is the quantitative separation of biomass from its substrate, usually concentrations of biomass-related constituents are measured and used, such as the amounts of glucosamine (8,11, 12), protein (13,14,15), ATP (16, 17), C02(9) and 02(5, 18). Alternatively, the pressure drop over a packed bed has been correlated to biomass growing on an inert carrier (19) and used in modelling as well (20).
The applicability of the logistic equation for some biomass-replacing parameters is shown in several studies (9, 11,15). Sometimes only a few data are used, mainly on the exponential-growth phase of biomass (5, 21), or the applicability is not experimentally proven at all (14). In most studies mentioned, a constant relationship is assumed between the biomass-related parameter and biomass dry matter. However, this may not be the case. For instance, glucosamine content may vary with age of fungal biomass (22, 23). The quotient glucosamine per biomass dry matter can easily be measured in a culture grown in liquid, but may not be valid for a culture growing under SSF conditions (11). The same holds for protein and ATP: the amount per biomass may not be constant. The dilemma of correlating C02 produced or 02
consumed with the amount of fungal biomass is related with the applicability of the linear-gijowth model of Pirt (24) to fungal biomass. This subject is discussed in more detail below ur̂ der "Correlating fungal biomass to respiration activity".
The effect of temperature on f ungal-biomass growth The effect of temperature on growth of fungal biomass (or the related variable, which will also be called biomass hereinafter) received only moderate attention so far in scientific literature on
103

Chapter 6: General Discussion
Because of these transitions it can be concluded that the correlations with metabolic activity,
described by equation (5), (6) or (7), are at best approximations. If differentiation of fungal
biomass into growing active and non-growing active hyphal parts explains the deviation from
the linear-growth model, as described above, it would mean that not only the effect of
temperature on the amount of biomass and the coefficient Vand m0 need to be described, but
also the effect on this differentiation process. The effect of temperature on the inactivation
process is already described in a preliminary, non-mechanistic way by the effect of
temperature on md in equation (5) (39). An Arrhenius-type equation was used, showing the
exponential increase of the inactivating effect on fungal biomass at increasing temperatures.
Regarding the importance of the including inactivation kinetics, the models of Sargantanis et
si. (15) and Smits etal. (39) give insight into the consequences of the use of equation (6). The
models predict that temperature remains elevated during the fermentation period unless
inactivation of biomass occurs, allowing the temperature to decrease.
Implementation of the effect of temperature and oxygen Due to microbial activity, heat is produced. A constant ratio between oxygen consumption rate
(40) or substrate consumption rate (41) and heat production rate has been described. The
heat production might result in a temperature increase, depending on several physical
processes, such as heat transfer (by conduction or convection) and evaporation of water, and
the heat capacity of the substrate and other components.
Descriptions of temperature dependence of fungal growth and respiration activity mentioned
above are results of experiments done under isothermal conditions. In a fermentation bed,
however, temperature is not constant. It increases during the initial stage of fermentation, and
decreases when heat production ceases, as shown for a large-scale fermentation by Lai et al.
(42). Usually, heat transfer at a side of a fermenter bed adjacent to the environment differs
from heat transport in the centre. Therefore, temperature increase is dependent on the
location in the bed. Whether mathematical descriptions of the effect of temperature obtained
from isothermal experiments can be used as such for describing non-isothermal fermentations
remains a subject for further research. For the time being, we assume the impact to be small
as compared to the impact of choosing the linear-growth model.
The effect of increased temperature on biomass will, at a certain moment, result in a decline of
growth rate and activity and a corresponding change in heat production. Because of heat
removal to the environment, temperature decreases again and biomass growth rate may tend
to increase, with consequences for heat production. The overall process is a feedback
interaction between temperature and biomass growth and activity. Therefore, it is not likely that
high temperatures determine the final biomass concentration. This is most probably
determined by another irreversible limitation.
What is predicted to be the effect of temperature on maintenance activity depends on which
version of linear-growth model is chosen: equation (5), (6) or (7). In the first linear-growth
model, equation (5), maintenance activity is omitted, so heat production is zero after \J is zero
(17, 27, 28, 32). At the end of the process, temperature is predicted to be equal to the
temperature of the environment.
In the second linear-growth model, equation (6), temperature will remain above ambient
112

Chapter 6: General Discussion
temperature unless heat transfer rates are sufficiently high to remove the heat produced by
maintenance activity. The third model, equation (7), predicts a decrease in temperature until
ambient temperature is reached, but only after \i has become close to zero due to a growth-
inhibiting effect.
A similar effect as with temperature is seen with oxygen concentration. Oxygen is consumed
and thus its concentration decreases. Using the first linear-growth model, equation (5), to
describe oxygen consumption will result in a concentration increase at the moment biomass
growth ceases with the rate of diffusion (5). The second linear-growth model, equation (6), will
predict the oxygen concentration to remain low unless oxygen diffusion is extremely high. The
third linear-growth model, equation (7) predicts a slow increase in oxygen concentration after
growth has stopped.
High temperature and oxygen limitation are both said to be the primary cause of inhibited
growth of the fungus on the substrate (1, 4, 5). However, mathematical models predict that
temporarily unfavourable circumstances, like high temperature and low oxygen concentration,
do not prevent maximum attainable biomass levels throughout the fermentation bed to be
reached. These circumstances theoretically only delay complete overgrowth of the substrate
(39). This means that with longer fermentation periods, complete overgrowth can be
accomplished. A technical problem with long-lasting large-scale fermentations is in
maintenance of sterility over this period. Growth of unwanted microorganisms does not only
mean unwanted consumption of substrate and product formation, but also might raise the
temperature of the fermentation bed above the value of Tmax with subsequently disastrous
effects on the fungus. Despite the importance of aseptic operating in SSF, aseptic (pilot-scale)
fermenters are rarely described (43).
Another problem of long-lasting fermentation periods can be the stability of the fermentation
product, especially when biologically active compounds such as enzymes are produced. For
instance, one part of the fermentation bed might not have reached the maximum attainable
biomass level yet, while other parts did and biomass started to sporulate. In the meantime, the
fermentation product may deteriorate and certain enzymes may be inactivated due to
hydrolytic activity. In these situations, long fermentations neither contribute to efficiency nor
increase the quality of the fermentation product.
Future perspectives of SSF In SSF research described in the literature, most attention seems to be focused on the growth
phase of fungal biomass. Based on the discussion above, it can be concluded that more
attention should be paid to the post-growth phase of fermentation. This phase is important
especially for processes in which secondary metabolites are produced. The post-growth phase
is also important for processes on a large scale where inhomogeneity determines efficiency of
the fermentation.
In large-scale tray fermentations high growth rates of the fungus are found only in the outside
layers of the substrate bed. Inside the bed, growth occurs under sub-optimal conditions of
inhibiting high temperatures, oxygen depletion or elevated carbon dioxide concentrations. The
physiology of the fungus growing under these circumstances is unknown. Therefore, more
113

Chapter 6: General Discussion
attention should be paid to the behaviour of fungal biomass growing under sub-optimal
conditions. Not only growth and activity, but also product formation might be different. This
might explain why yields obtained in SSF may be significantly higher than those in liquid
fermentation (44).
The application of results of glucosamine analysis in modelling SSF showed to be a good
alternative to total biomass in modelling SSF. Growth, respiration activity and inactivation of
fungi can be described with glucosamine as the biomass parameter. To use glucosamine in
describing activities other than respiration seems also quite promising. For instance,
production of xylanase and protease during growth of Trichoderma reese/QM9414 on wheat
bran was shown to be constant in relation to glucosamine production (11). Modelling of
enzyme production in SSF might thus be eased by knowing the glucosamine content.
The potential of glucosamine in describing fungal growth may be extended if the results are
combined with those of other measurements, such as ATP, RNA and DNA. If each
measurement covers a different type of fungal biomass (active growing, active non-growing
and inactive), the combination will open a new world of possibilities regarding fungal kinetics
and modelling.
Unexplored are the application possibilities of SSF in fundamental physiological research.
Fungal growth, differentiation and sporulation depend on the processes on a micro scale, and
thus sensitive image analysis techniques, combined with powerful computer technology, are
needed to open new areas of research. Since the location of the biomass in the fermentation
layer does not change in static SSF, the combination of SSF with activity measurement and
image analysis techniques might be very fruitful.
Conclusions The combination of the logistic equation, for describing fungal biomass evolution, and the
linear-growth model, for correlating fungal biomass to activity, does not offer sufficiently
detailed possibilities to describe an SSF. Inactivation of biomass, which obviously occurs, must
also be described mathematically dependent on a irreversible physical parameter such as
substrate concentration or time. Several researchers attribute the observed restricted biomass
growth in a fermentation bed to the effect of mass and heat transfer limitations on biomass, but
these will predict either everlasting heat production or complete overgrowth of the substrate
with increased fermentation time.
The lack of details results from the fact that both the logistic equation and the linear-growth
model do not allow discrimination of biomass in the classes of active growing, active non-
growing and inactivated biomass. Much research has already been devoted to the description
of the mechanism underlying fungal growth and differentiation. Especially germination of
spores and the following growth phases are well described (45). For correlating fungal biomass
to activity, image analysis techniques in combination with computer technology are promising.
114

Chapter 6: General Discussion
List of symbols and abbreviations
CPR / ma m* Q t
k Y X X„
carbon dioxide production rate respiration activity maintenance coefficient decline coefficient specific respiration activity time period of decline in activity yield factor of biomass on activity amount of biomass initial amount of viable biomass maximum attainable amount of biomass
specific-growth rate maximum specific-growth rate
mol C0 2s ' ' per kg substrate mols1 per kg substrate mols'1 per kg biomass mols1 per kg biomass mol-s"1 per kg biomass s s kg biomass per mol kg biomass kg biomass kg biomass
s-1
s-1
References
1 Doelle, H.W., Mitchell, D.A., Rolz, C.E. (1992) in: Solid substrate cultivation. Elsevier Appl. Sci., Essex.
2 Cannel, E., Moo-Young, M. (1980) Solid-state fermentation systems. Process Biochem. 15 2-7
3 Raimbault, M., Alazard, D. (1980) Culture method to study fungal growth in solid-state fermentation. Eur. J. Appl. Microbiol. 9 199-209
4 Rathbun, B.L., Shuler, M.L. (1983) Heat and mass transfer effects in static solid-substrate fermentation: design of fermentation chambers. Biotechnol. Bioeng. 25 929-938
5 Raghava Rao, K.S.M.S., Gowthaman, M.K., Ghildyal, N.P., Karanth, N.G. (1993) A mathematical model for solid state fermentation in tray bioreactors. Bioprocess Engin. 8 255-262
6 Ghildyal, N.P., Ramakrishna, M., Lonsane, B.K., Karanth, N.G., Krisnaiah, M.M. (1993) Temperature variations and amyloglucosidase levels at different bed depths in a solid state fermentation system. The Chem. Engin, J. 51 B17-B23
7 Lonsane, B.K., Ghildyal, N.P., Budiatman, S., Ramakrishna, S.V. (1985) Engineering aspects of solid-state fermentation. Enzyme Microb. Technol. 7 258-265
8 Okazaki, N., Sugama, S., Tanaka, T. (1980) Mathematical model for surface culture of koji mold. J. Ferment. Technol. 58 471-476
9 Sato, K., Yoshizawa, K. (1988) Growth and growth estimation of Saccharomyces cerevisiae in solid-state ethanol fermentation. J. Ferment. Technol. 66 667-673
10 De Reu, J.C. (1995) Solid-substrate fermentation of soya beans to tempeh. Thesis Agricultural University Wageningen.
11 Smits, J.P., Rinzema, A. Tramper, J., Sonsbeek, H.M. van, Knol, W. (1996) Solid-state fermentation of wheat bran by Trichoderma reese/QM9414: substrate composition changes, C-balance, enzyme production, growth and kinetics. Appl. Microbiol. Biotechnol. 46 489-496
12 Kim.J.H., Hosobuchi.M., Kishimoto.M., Seki.T., Yoshida.T., Taguchi.H., Ryu.D.D.Y. (1985) Cellulase production by a solid state culture system. Biotechnol. Bioeng. 27 1445-1450
13 Rodriguez-Leon, J.A., Sastre, L., Echevarria, J „ Delgado, G., Bechstedt, W. (1988) A mathematical approach for the estimation of biomass production rate in solid-state fermentation. Acta Biotechnol. 8 307-310
115

Summary
The influence of temperature on specific growth rate, maximum attainable biomass
glucosamine level and yield of glucosamine on oxygen consumption or carbon-dioxide
production could be described with a (modified) Ratkowsky equation or a Gaussian curve. The
influence of temperature on the maintenance coefficient was negligible.
These mathematical equations were combined with conservation laws describing mass and
heat transfer in a simulation model. Inactivation, as described under isothermal conditions, was
implemented in three different ways, which resulted in the models Mm, Mtamp and M^. In the
Mpa,, model, inactivation starts when the specific growth rate becomes equal to or less than 1 %
of its maximum value. The inactivation continues until no activity is left. In the /Wt8mp model,
inactivation starts for the same reason, but stops when the specific growth rate is more than
1 % of its maximum value again. In the Mcont model, inactivation is continuously effective,
immediately from the start of fermentation.
The temperature and biomass evolution in a tray SSF predicted by these three models are
compared with a model in which inactivation is omitted. The results show the importance of
describing the inactivation in modelling SSF. Without this, irrealistic temperature and biomass
glucosamine patterns are predicted.
The Mp,,, model, representing inactivation due to substrate limitation or product toxicity,
predicts temperature and biomass patterns described in the literature: restricted biomass
growth and decrease in temperature at the end of fermentation. The mathematical models
reported thus far in the literature predict restricted growth or a decrease in temperature.
Although the combination of the logistic equation, for describing fungal biomass in time, and
the linear-growth model, for correlating the respiration activity to biomass, is most often used in
scientific literature on modelling SSF, it is insufficiently detailed. The logistic equation is shown
to be applicable to the glucosamine measurement results, but the glucosamine determination
cannot distinguish between active growing, active non-growing and inactive biomass. The total
amount of these three types of biomass is described by the logistic equation, while the
linear-growth model only describes the first two types. It is therefore suggested to focus
research efforts on the description of the evolution of these three different forms of fungal
biomass in time. Sensitive image analysis techniques, combined with computer technology,
applied to fungal biomass growing under SSF conditions have the potential of being powerful
tools to accomplish this target.
120

Samenvatting
Het is in vaste-stoffermentatie (SSF) onderzoek niet mogelijk schimmelbiomassa kwantitatief te scheiden van het substraat. Daarom is het moeilijk de biomassaontwikkeling in de tijd te meten. Alternatieven zijn voorhanden, waarvan het glucosaminegehalte veelbelovend is. Glucosamine is het monomeer van de celwandcomponent chitine en is daarom gerelateerd aan de hoeveelheid biomassa. De concentratie glucosamine in biomassa kan echter varieren in de tijd en is afhankelijk van de groeicondities. In plaats van het glucosaminegehalte te gebruiken om de hoeveelheid biomassa te berekenen, zijn groei en activiteit van biomassa in dit onderzoek steeds gerelateerd aan de hoeveelheid glucosamine. Met deze beschrijvingen zijn wiskundige simulatiemodellen opgesteld waarmee glucosamine- en temperatuurpatronen in een SSF-bed voorspeld kunnen worden.
Het onderzoek is verricht aan de fermentatie van tarwezemelen door de schimmel Trichoderma reese/QM9414. De fermentaties zijn uitgevoerd in Petrischalen, in porties van 5 g, welke in een klimaatkast met constante temperatuur en luchtvochtigheid geplaatst werden. Monsters voor analyse werden genomen door Petrischalen uit de klimaatkast te nemen. Op deze wijze bleek het mogelijk droge-stofafname, glucosamine en respiratie-activiteit te meten met een standaard deviatie van minder dan 7% van de gemiddelde gemeten waarde. ATP en celulase-activiteit bleken niet zo nauwkeurig te meten. Dit wordt toegeschreven aan de nodige voorbehandeling van het monstermateriaal voor ATP-analyse, en aan interacties tussen substraat en cellulase. Zuurstofconsumptiesnelheid en koolzuurproductiesnelheid werden tegelijkertijd gemeten. In een fermentatieperiode van 125 uur werd circa 9 mmol per gram initiele droge stof aan C02 en Oj respectievelijk geproduceerd en geconsumeerd. De toename aan glucosamine kon worden beechreven met een logistische curve. Het glucosaminegehalte verliep van 0,02 naar het maximum van 8,1 mg per gram initiele droge stof gedurende een 125-uurs fermentatie. De maocimale specifieke groeisnelheid bedroeg 0,123 per uur. De specifieke respiratie-activiteiten werden uitgerekend per hoeveelheid glucosamine. De correlate met de specifieke groeisnelheid bleek af te wijken van het lineaire groeimodel. Een vertdaring werd gezocht in de verschillende gedifferentieerde vormen waarin schimmelbiomassa aanwezig kan zijn. De afwijking werd geconstateerd tijdens de initiele groeifase van de schimmel. Deze afwijking zal echter van weinig invloed zijn op de resultaten van de simulatiemodellen waarin het lineaire groeimodel wordt gebruikt omdat de hoeveelheid biomassa in deze fase gering is en dus de voorspelde activiteiten gering zijn. De afname in respiratie-activiteit nadat de toename in biomassa is gestopt, bleek wel significant. Deze afname, inactivering genoemd, werd toegeschreven aan de afname in de hoeveelheid actieve, niet-groeiende biomassa. De snelheid waarmee deze inactivering plaatsvond onder isotherme omstandigheden bleek constant in de tijd, maar nam exponentieel toe met een toenemende temperatuur boven de maximale groeitemperatuur.
121

Samenvatting
De invloed van temperatuur op de maximale specifieke groeisnelheid, het maximaal haalbare glucosaminegehalte en de yield factor konden met een (gemodificeerde) Ratkowsky-vergelijking en een Gauss-kromme worden beschreven. De invloed van de temperatuur op de onderhoudscoefficient bleek nihil. De wiskundige vergelijkingen uit het onderzoek werden gecombineerd met vergelijkingen voor massa en warmtetransport tot de uiteindelijke simulatiemodellen. De beschrijving van de inactivering leverde drie modellen op: M^, Mt8mp en /Wcont. In het M^-model start de inactivering op het moment dat de specifieke groeisnelheid onder de 1 % van de maximale waarde komt. In tegenstelling tot het Mtemp-model blijft de inactivering in het Mm model effectief wanneer de specifieke groeisnelheid weer boven de 1 % van de maximale waarde komt. Het M^-model gaat ervan uit dat inactivering vanaf het begin van de fermentatie continu effectief is. De voorspellingen van de drie modellen zijn vergeleken met het model waarin de inactivering niet is opgenomen. De resultaten laten het belang van het beschrijven van de inactivering zien. Zonder dat worden onrealistische temperatuur- en biomassapatronen voorspeld. In vergelijking met de modellen die in de literatuur zijn beschreven, geeft vooral het Mp^-model, dat de situatie bij substraatlimitatie simuleert, patronen die in de literatuur beschreven zijn: beperkte biomassagroei en afname van temperatuur aan het eind van de fermentatie. De modellen uit de literatuur voorspellen 6f beperkte biomassagroei 6f een afname in temperatuur aan het eind van de fermentatie. Hoewel de combinatie van logistische vergelijking voor beschrijving van de ontwikkeling van schimmelbiomassa en het lineaire-groeimodel voor beschrijving van respiratie-activiteit in de wetenschappelijke literatuur veel voor het modelleren van SSF wordt gebruikt, blijkt uit dit onderzoek dat deze combinatie onvoldoende gedetailleerd is. De logistische vergelijking is van toepassing op het beschrijven van de toename aan glucosamine in de tijd, maar het glucosamine vertegenwoordigt actieve groeiende, actieve niet-groeiende en inactieve biomassa. Het lineaire-groeimodel is echter alleen van toepassing op actieve groeiende en actieve niet-groeiende biomassa. Meer onderzoek is nodig om een gedetailleerde beschrijving van de verschillende vormen van schimmelbiomassa onder SSF condities te verkrijgen. Beeldanalysetechnieken in combinatie met computertechnologie bieden potentiele mogelijkheden om dit doel te bereiken.
122
Curriculum Vitae
Johannes Petrus Smits werd op 26 november 1958 geboren te Bergh. Na de HAVO aan het St. Ludgercollege te Doetinchem met succes te hebben doorlopen volgde hij de HBO-A opteiding tot klinisch chemisch analist aan de OLAN te Arnhem, welke hij in 1979 met het halen van het diploma afrondde. Aansluitend volgde hij de HBO-B opleiding tot biochemisch analist aan de HMLS te Oss waarvan hij in 1982 het diploma behaalde. Na een jaar brak hij de daarop volgende MO-A Natuur- en Scheikunde studie aan de Katholieke Universiteit Nijmegen at om te gaan werken als onderzoekmedewerker binnen de groep Industriele Microbiologic van prof. dr. ir. JAM. de Bont aan de Landbouwuniversiteit Wageningen. Samen met de toanmalige promovendus W.J.J, van den Tweel onderzocht hij de mogelijkheden van hydroxylering van aromaten met behulp van micro-organismen. Shds 1987 is hij werkzaam als researchmedewerker binnen het biotechnologisch onderzoek bij TNO Voeding in Zeist. Na diverse microbieel fysiologische en procestechnologische onderzoeken raakte hij nauw betrokken bij nieuwe en reeds lopende vaste-stoffermentatie onderzoeksprojecten. De resultaten uit een van de projecten, het tussen 1992 en 1995 uitgevoerde multi-client project Kennisopbouw solid-state fermentatie, vormen de basis voor dit proefschrift.
123

Nawoord
Bij het overdenken en schrijven van het nawoord realiseer ik pas wat de betekenis is van de vaak oh-zo clichematige dankbetuigingen in andere proefschriften. Nu realiseer ik me ook hoeveel mensen bij dit onderzoek direct en indirect betrokken zijn geweest die ik allemaal wil bedanken voor hun positieve inzet. Zonder iemand te willen vergeten en zonder een strikte volgorde aan te willen houden wil ik de voigende personen hier speciaal noemen.
Pim, zonder jouw overtuiging, inzicht, inzet en vastberadenheid zou het onderzoek nooit hebben geresulteerd in dit proefschrift. Je hebt je van begin af aan volledig ingezet voor dit onderzoek. Tijdens het onderzoek en de jaren erna probeerde je me te beschermen tegen zaken die een succesvolle afronding van de promotie in de weg zouden kunnen staan, ook al ging het wel eens ten koste van je eigen welbehagen. Jouw inzet en overtuiging gaven mij motlvatie extra mijn best te doen op welslagen van deze promotie. Arjen, de bijdrage van jouw kennis op het gebied van de proceskunde is onmisbaar gebleken in ell onderzoek. Je Mathcad files hebben me meerdere malen tot denken aangezet en, eerlijk gezegd, dat heeft me nogal wat avondjes gekost. Mede daardoor heb ik mijn inzicht in wiskundige vergelijkingen vergroot. Hans, de wijze waarop je me motiveerde om mijn grenzen steeds verder te leggen dan ik oorspronkelijk van plan was heeft me geleerd ergens steeds het maximale eruit proberen te halen. Een enkele keer ging ik daarin te ver..., maar een hypothetisch model komt er nog wel. Henk, je benadering van "hou het maar eenvoudig, dat is al moeilijk genoeg" heeft ervoor gezorgd dat ik steeds door de bomen het bos in de gaten hield. Je was in staat steeds de zaken tot de juiste proporties terug te brengen. Elvire, Ko, Aylin, Wiarda en Marike, jullie bijdragen zijn onmisbaar gebleken voor het onderzoek en het programmeren van Tomasito, ook al zijn ze niet altijd direct terug te vinden in dH proefschrift. Het was erg plezierige met jullie samen te werken. De participanten binnen het multi-client project (Fons Peters, Hein Stam, Jan Hunik en Bart van Schie namens Unilever Research Laboratorium en Quest International BV; Tim Tersmette en Freddy Dekkers namens Bavaria BV; Ton Kerkenaar namens Denka International BV; Peter Dusseljee en Gert Groot namens Gist-brocades NV, en Rita Delrue en Wilma Taverne-Veldhuizen namens Cargill BV), jullie grate en kleine bijdragen in de loop van het project hebben ervoor gezorgd dat het project op het pad van de toegepaste wetenschap bleef, ofschoon jullie ons meerdere malen de gelegenheid gaven verder te kijken dan onze neus lang is. Het was bijzonder aangenaam met jullie samen te werken. Cees, Mario, Pieter en Han, de kwaliteit en betrouwbaarheid van het werk dat jullie en jullie collega's hebben geleverd met het analyseren van de gefermenteerde monsters is van doorslaggevend belang geweest voor de goede afloop van het onderzoek. Jullie vakkundigheid geeft vertrouwen in de resultaten van het onderzoek.
125

Nawoord
Dirk, je taalcorrecties en je voorstellen voor aanpassing van de tekst hebben ervoor gezorgd dat taaie stukken beter leesbaar werden. Wilhelm en je help-desk collega's, dit werk kon niet worden uitgevoerd zonder een computer met software, en die lijken vooralsnog niet zonder jullie service te kunnen. Collega's in het lab en op het secretariaat, jullie bereidheid om mee te denken en zo af en toe, waar nodig, mee te helpen heb ik zeer gewaardeerd. Jullie collegialiteit en humor zijn onmisbaar voor mijn werkplezier. Azkenik: M6nica, gure denbora librean Ian egiten uzteagatik eduki duzun pazientziagatik. Zuk jarraitzen lagundu zenidan, nik Ian hau sekula bukatuko ez nuelan pentsatzen nuenean. Asko eskertzen dizut eman didazun laguntza eta indar guztia, nahiz eta hemendik aurrera aspiradora etxean pasatzeko aitzakirik ez izan. (Last but not least: M6nica, jij had het geduld om mij dit werk in onze vrije tijd te laten afmaken. Je haalde me over door te gaan op momenten dat ik dacht dat er nooit een eind aan kwam. Ik ben je erg dankbaar voor je steun. Helaas weet ik dat ik nu geen excuses meer heb om me niet voor het huishouden in te zetten.)
126

Bibliography
Van den Tweel.W.J.J., Smits.J.P., De Bont.J.A.M. (1986) Microbial metabolism of D- and L-phenylglycine by Pseudomonas putida LW-4. Arch. Microbiol. 144 169 -174
Van den Tweel.W.J.J., Smits.J.P., De Bont.J.A.M. (1988) Catabolism of DL-phenylhydracrylic, phenylacetic and 3- and 4-hydroxyphenylacetic acid via homogentisic acid in a Flavobacterium sp. Arch. Microbiol. 149 207-213
Van den Tweel.W.J.J., Smits.J.P., Ogg.R.LH.P., De Bont.J.A.M. (1988) The involvement of an enantioselective transaminase in the metabolism of D-3- and D-4-hydroxyphenylglycine in Pseudomonas putida LW-4. Appl. Microbiol. Biotechnol. 29 224 - 230
Hartmans.S., Smits.J.P., Van der Werf.M.J., Volkering.F., De Bont.J.A.M. (1989) Metabolism of styrene oxide and 2-phenylethanol in the styrene-degrading Xanthobacterstrain 124X. Appl. Env. Microbiol. 55 2850 -2855
Smits.J.P., Knol.W., Bol.J. (1993) Glucosinolate degradation by Aspergillus clavatus and Fusarium oxysporumin liquid and solid-state fermentation. Appl. Microbiol. Biotechnol. 38 696 - 701
Smits.J.P., Janssens.R.J.J., Knol.W., Bol.J. (1994) Modelling of the glucosinolate content in solid-state fermentation of rapeseed meal with fuzzy logic. J. Ferment. Bioeng. 77 579 - 581
Zhu.Y., Smits.J.P., Knol.W., Bol.J. (1994) A novel solid-state fermentation system using polyurethane foam as inert carrier. Biotechnol.Lett. 16 (6) 643 - 648
Llanos Palop, M., Smits, J.P., Ten Brink, B. (1995) Degradation of sinigrin by Lactobacillus agilis strain R16 Int. J. Food Microbiol. 26 219 - 229
Zhu Y., Knol W., Smits, J.P., Bol J. (1996) Medium optimization for nuclease P1 production by Penicilium citrlnum in solid-state fermentation using polyurethane foam as inert carrier. Enzyme Microbial Technol. 18 108-112
Smite, J.P., Rinzema, A., Tramper, J., Schlosser, E.E, Knol, W. (1996) Accurate determination of process variables in solid-state fermentation system. Process Biochem 31 669-678
Smite, J.P., Rinzema, A., Tramper, J., Sonsbeek, H.M. van, Knol, W. (1996) Substrate composition changes, C-balance, enzyme production, growth and kinetics of Trichoderma reesei QM9414 in solid-state fermetation of wheat bran. Appl. Microbiol. Biotechnol. 46 489-496
Nout,M.J.R., Rinzema.A., Smits.J.P. Biomass and Productivity Estimates in Solid Substrate Fermentations. In: The Mycota IV, Wicklow and Soderstrom (Eds.), Springer Verlag Berlin Heidelberg 1997
Smits, J.P., Rinzema, A., Tramper, J., Sonsbeek, H.M., van, Hage, J.C., Kaynak, A., Knol, W., (1997) The influence of temperature on kinetics in solid-state fermentation. In press Enzyme Microb. Technol.
127