Nutritive Value of Samanea saman Seed and Whole Pod Meals as ...
89
Nutritive Value of Samanea saman Seed and Whole Pod Meals as Feed Ingredients for Broiler Chickens BY MARGARET ABA SAM HAGAN MAY, 2013
-
Upload
khangminh22 -
Category
Documents
-
view
1 -
download
0
Transcript of Nutritive Value of Samanea saman Seed and Whole Pod Meals as ...
Nutritive Value of Samanea saman Seed and Whole Pod Meals as Feed
Ingredients for Broiler Chickens
BY
MARGARET ABA SAM HAGAN
MAY, 2013

Nutritive Value of Samanea saman Seed and Whole Pod Meals as Feed Ingredients for
Broiler Chickens
By
Margaret Aba Sam Hagan (BSc. Agriculture)
A thesis submitted to the Department of Animal Science, Faculty of Agriculture, Kwame
Nkrumah University of Science and Technology, Kumasi, in partial fulfilment of the
requirements for the degree of
MASTER OF SCIENCE IN ANIMAL NUTRITION
Faculty of Agriculture
College of Agriculture and Natural Resources
MAY, 2013

ii
DECLARATION
Candidate’s declaration
I hereby declare that this thesis submitted for the Master of Science (Animal Nutrition)
degree is the result of my own original work and that no part of it has been presented for
another degree in this University or else where. However, work of other researchers and
authors, which serve as sources of information, are duly acknowledged.
MARGARET ABA SAM HAGAN ………………… …………………
Student (PG3156509) Signature Date
Certified by:
Professor Armstrong Donkoh ………………… …………………
Supervisor Signature Date
Certified by:
Doctor Victoria Attoh-Kotoku ………………… …………………
Head of Department Signature Date

iii
DEDICATION
This accomplishment is dedicated to my Husband Dr. Dadson Awunyo-Vitor and my
children Mawufemor and Mawuena for their prayers and support.

iv
ACKNOWLEDGEMENT
I wish to express my sincere gratitude to my supervisor, Professor Armstrong Donkoh of the
Department of Animal Science, Kwame Nkrumah University of Science and Technology,
Kumasi, who helped me in planning, guided and carefully read through the script and made
useful suggestions and valuable criticisms that has propelled the completion of this
dissertation.
I wish to express my appreciation to my husband, Dadson Awunyo-Vitor and children
Mawufemor and Mawuena for their unconditional love, unfailing patience, encouragement,
understanding and support throughout the years, for without them, the completion of this
study may not have become a reality.
I am also grateful to my father, Mr. Ebenezer Hagan, for his prayers, encouragement and
support which stirred me on.
My brother-in-law, Walter Konglo, also deserves special thanks for his support, time and
again his willingness to lend a hand when needed.
I also need to acknowledge the staff and workers of Department of Animal Science,
especially the late Mohammed Atiku and Francis Sakobeh for their support and time to help
ensure successful completion of the work.
Finally, my profound gratitude and thanks go to Mr. Isaac Affrim, a student of Animal
Science Department for his help, support, time and willingness to lend a helping hand when
needed.

v
ABSTRACT
Two studies, using broiler chickens, were conducted to determine the nutritive values of
Samanea saman seed meal (SSSM) (containing seed only) and Samanea saman whole pod
meal (SSPM) (containing pods and seeds) as feed ingredients. The studies also aimed at
determining the effect of Samanea saman seed and whole pod meals on the growth
performance, carcass quality, haematological and blood indices and economics of
production of the broiler chicken. Three hundred (300) unsexed day old Cobb commercial
strain of broilers each were used for the two studies (experiment 1 with Samanea saman seed
meal and experiment 2 with Samanea saman whole pod meal). At 28 days of age (before the
commencement of the feeding trial), two hundred and forty birds each were randomly
selected and divided into four groups, each group constituting a treatment with three
replicates per treatment in a completely randomised design.
Four experimental diets each for seed meal and whole pod meal were formulated: a control
diet with no Samanea saman seed or whole pod meals and three other diets containing
processed Samanea saman seed or whole pod meals each incorporated at levels of 20 g, 40 g
and 60 g kg-1
diet to replace fish meal and soyabean meal. These experimental diets and
water were provided to the broiler chickens ad-libitum throughout the experiments. Chemical
analyses of SSSM and SSPM indicated they are both fairly good sources of protein and
mineral elements to partly meet the requirements of poultry.
The results of experiment 1 (SSSM) revealed that the broiler chickens fed the control diet (T1)
and 20 g (T2) Samanea saman seed meal kg-1
diet were significantly (p < 0.05) better in all
the growth parameters evaluated than those on the 40 g SSSM kg-1
(T3) and 60 g SSSM kg-1
diets (T4).

vi
In study 2 using the whole pod meal, growth performance of all the parameters
measured were similar (p > 0.05). Percentage carcass yield was significant (p < 0.05)
among the various dietary treatments and had a decreasing trend as the dietary level of SSSM
increased. However, it was rather the opposite for the SSPM where there were no significant
(p > 0.05) differences among dietary treatments with an increasing pattern as the SSPM
inclusion level increased. There were no significant differences in organ weights for both
experiments. Also mortalities recorded in both feeding trials, were not ascribed to SSSM or
SSPM. Haematological and blood biochemical indices for the two studies suggest that the
physiological and health status of the birds were not affected by the various inclusion levels
of Samanea saman seed and whole pod meals.
It is recommended that both Samanea saman seed and pod meals could be valuable feed
ingredients to be included up to 20 g kg-1
and 60 g kg-1
, respectively of broiler chickens diets
without any deleterious effects on growth performance and even confer economic benefits.

vii
TABLE OF CONTENTS
CONTENT PAGES
DECLARATION...................................................................................................................... ii DEDICATION........................................................................................................................ iii ACKNOWLEDGEMENT ...................................................................................................... iv
ABSTRACT .............................................................................................................................. v TABLE OF CONTENTS ...................................................................................................... vii LIST OF TABLES ................................................................................................................... x LIST OF FIGURES ................................................................................................................ xi
LIST OF ABREVIATIONS .................................................................................................. xii
CHAPTER ONE ...................................................................................................................... 1 1.0 INTRODUCTION ................................................................................................... 1 1.1 OBJECTIVES OF THE STUDY: ............................................................................. 3
CHAPTER TWO ..................................................................................................................... 5
2.0 LITERATURE REVIEW ....................................................................................... 5 2.1 Nutrient Requirements of Broiler Chickens .............................................................. 5
2.1.1 Energy ....................................................................................................................... 5
2.1.2 Minerals ..................................................................................................................... 7
2.1.3 Vitamins .................................................................................................................... 9
2.1.4 Protein ..................................................................................................................... 10
2.2 Protein Feedstuffs for Feeding Poultry ................................................................... 13
2.2.1 Animal Protein Feedstuffs ....................................................................................... 13
2.2.1.1 Fish Meal ................................................................................................................. 14
2.2.1.2 Meat Meal................................................................................................................ 15
2.2.2 Plant Protein Feedstuffs........................................................................................... 16
2.2.2.1 Soyabean Meal ........................................................................................................ 17
2.2.2.2 Groundnut Cake or Peanut Meal (PNM) ................................................................. 19
2.2.2.3 Cottonseed Meal ...................................................................................................... 19
2.2.2.4 Legume Plants ......................................................................................................... 20
2.3 Samanea saman (Rain Tree) ................................................................................... 21
2.3.1 Composition and the General Nutritive Value of Samanea saman......................... 24
2.3.2 Storage of Samanea saman Seeds and Pods ........................................................... 26
2.3.3 Amount of Samanea saman Seeds and Pods Available for Processing .................. 27
2.3.4 Methods of Processing Samanea saman Seeds and Pods ....................................... 27
2.3.5 Anti – Nutritional Factors in Samanea saman Seeds and pods ............................... 27

viii
2.3.6 Uses of Samanea saman .......................................................................................... 28
2.3.7 Limitations of Samanea saman (Rain Tree)............................................................ 29
2.4 Haematological Data and their Relevance in Animal Studies ................................ 30
CHAPTER THREE ............................................................................................................... 32
3.0 MATERIALS AND METHODS .......................................................................... 32 3.1 Location and Duration of the Project ...................................................................... 32
3.2 Sources of Samanea saman Seeds, Whole Pods and Processing Method............... 32
3.3 Chemical Analysis ................................................................................................... 32
3.4 Experimental Diets .................................................................................................. 33
3.5 Experimental Animals, Experimental Design and Management ............................ 33
3.6 Data Collection ........................................................................................................ 35
3.6.1 Feed Intake .............................................................................................................. 35
3.6.2 Body Weight Gain ................................................................................................... 35
3.6.3 Feed Conversion Ratio ............................................................................................ 36
3.6.4 Mortality .................................................................................................................. 36
3.6.5 Carcass Yield and Organs Weight........................................................................... 36
3.6.6 Blood Cellular and Biochemical Indices ................................................................. 36
3.7 Economics of Production ........................................................................................ 37
3.8 Statistical Analysis .................................................................................................. 37
CHAPTER FOUR .................................................................................................................. 38 4.0 RESULTS AND DISCUSSION ............................................................................ 38 4.1 EXPERIMENT ONE : Samanea saman Seed Meal (SSSM) Feeding Trial ........... 38
4.1.1 Chemical Compositions of Samanea saman Seed and Whole Pod Meals ......... 38
4.1.2 Growth Performance of Broiler Chickens Fed Diets Containing Samanea saman
Seed Meal ................................................................................................................ 40
4.1.2.1 Feed Intake .............................................................................................................. 40
4.1.2.2 Weight Gain and Feed Conversion Ratio ................................................................ 42
4.1.2.3 Mortality .................................................................................................................. 44
4.1.2.4 Carcass Characteristics and Organ Weights of Broiler Chickens ........................... 44
4.1.2.5 Blood Cellular and Biochemical Indices of Broiler Chickens ......................... 45
4.1.2.6 Economics of Production ........................................................................................ 46
4.2 EXPERIMENT TWO : Samanea saman Whole Pod Meal (SSPM) Feeding Trial 48
4.2.1 Feed Intake .............................................................................................................. 48
4.2.2 Weight Gain and Feed Conversion Ratio ................................................................ 48
ix
4.2.3 Mortality .................................................................................................................. 48
4.2.4 Carcass Characteristics and Organ Weights of Broiler Chickens ........................... 49
4.2.5 Blood Cellular and Biochemical Indices of Broiler Chickens................................. 49
4.2.6 Economics of Production ........................................................................................ 51
CHAPTER FIVE ................................................................................................................... 52 5.0 CONCLUSION AND RECOMMENDATIONS ................................................ 52 5.1 CONCLUSION ....................................................................................................... 52
5.2 RECOMMENDATIONS ........................................................................................ 52
REFERENCES ....................................................................................................................... 54 APPENDICES ........................................................................................................................ 71 APPENDIX 1: ANALYSIS OF VARIANCE (ANOVA) TABLES ....................................... 71
APPENDIX 2: REGRESSION ANALYSIS TABLES ........................................................... 72

x
LIST OF TABLES
TABLE PAGES
Table 2.1: Mineral Requirements of Broilers as Percentages or Milligrams or Units Per
Kilogram of Diet. .................................................................................................. 9
Table 2.2: Vitamins Requirements of Broilers as Percentages or Milligrams or Units Per
Kilogram of Diet. ................................................................................................ 10
Table 2.3: Nutrient Composition of Animal Protein Sources .............................................. 16
Table 2.4: Nutrient levels in animal protein meals .............................................................. 16
Table 2. 5: Nutrient Composition of Vegetable Protein Sources ......................................... 19
Table 2. 6: Chemical composition and general nutritive value of Samanea saman seeds,
pods and empty pods. ......................................................................................... 26
Table 2.7: Chemical composition of parts of Samanea saman plant ................................... 26
Table 2.8: Normal blood values for the chicken (Gallus gallus domesticus) ...................... 31
Table 3.1: Composition of Experimental Broiler Diets (seed meal) ................................... 34
Table 3. 2: Composition of Experimental Broiler Diets (whole pod meal) .......................... 35
Table 4.1: Chemical Composition of Samanea saman Seed and Whole Pod Meal1 ........... 38
Table 4.2: Effect of Samanea saman seed meal on broiler chicken‟s growth performance
from 28 -56 days of age and organ weights at 56 days of age. ........................... 41
Table 4.3: Effect of dietary level of Samanea saman seed meal on the blood cellular and
biochemical indices of broiler chickens at 56 days of age. ................................ 46
Table 4.4: Effect of Samanea saman pod meal on broiler chickens performance from 28 -
56 days of age and organ weights at 56 days of age. .......................................... 48
Table 4.5: Effect of dietary level of Samanea samanpod meal on the haematological and
blood chemistry indices of broiler chicken at 56 days of age............................. 50

xi
LIST OF FIGURES
CONTENT PAGES
Figure 1.0: Samanea saman tree ............................................................................................. 3
Figure 2.0a: Samanea saman opened pod showing seeds ....................................................... 23
Figure 2.0b: Samanea saman riped pods ................................................................................ 23

xii
LIST OF ABREVIATIONS
ADL Acid detergent lignin
ADF Acid detergent fibre
ANF Anti-nutritional factors
ANOVA Analysis of variance
AOAC Association of Official Analytical Chemists
CF Crude fibre
CP Crude protein
CH Cholesterol
CRD Completely randomised design
DM Dry matter
EAA Essential amino acid
EE Ether extract
ESR Erythrocyte sedimentation rate
FCE Feed conversion efficiency
FI Feed intake
GE Gross energy
Gh¢ Ghana cedis
GIT Gastro intestinal tract
GM Gross margin
HB haemoglobin
HCT haematocrit
HDL High density lipoprotein
IGF Identified growth factor
KNUST Kwame Nkrumah University of Science and Technology
xiii
LDL Low density lipoprotein
MC Moisture content
MCH Mean cell haemoglobin
MCHC Mean cell haemoglobin concentration
MCV Mean cell volume
ME Metabolizable energy
NDF Neutral- detergent fibre
NFE Nitrogen free extract
NRC National research council
PCV Packed cell volume
PNM Peanut meal
RBC Red blood cell
SAS Statistical Analysis Systems
SBM Soyabean meal
SEM Standard error of means
SSPM Samanea saman pod meal
SSSM Samanea saman seed meal
TGS Triglycerides
TR Total return
TVC Total variable cost
UGF Unidentified growth factor
WBC White blood cell
WG Weight gain

1
CHAPTER ONE
1.0 INTRODUCTION
The increase in human and livestock populations has created a surge for food and feed in
the developing countries. Consequently, there is the need for alternative feed resources to
be identified and evaluated. Poultry production is regarded as a resource for sustainable
livelihood and a way of achieving a certain level of economic independence (Nworgu, 2006).
The poor state of economy in developing countries has made consumption of high protein
foods unattainable to more than 65 - 70% of the people (Nworgu, 2004). Eggs and poultry
meats are beginning to make a substantial contribution in relieving the protein
insufficiency in African countries (Daghir, 1995). Sadik (1991) and Weaver (1994) reported
that most developing tropical countries are facing an increasing demand for protein-rich
foods as a result of teeming population, consumption of cereal-based diets and scarcity of
fertile lands.
According to Atteh (2004), the protein from poultry meat and eggs is of such quality that, it
is now used as a standard against which other proteins are compared. Broiler chickens are
fast growing species and the capital invested in this poultry production business is quickly
realized. However, the rising cost of poultry feed has long been a serious problem to
farmers. This is due to the fact that the feed alone accounts for about 70% of the total
broiler production (Olorede and Longe, 1999). Other authors, according to Nworgu (2006),
also confirm this observation. Oluyemi (1984) and Kekeocha (1985) observed that feed cost
was over 70% for broiler production, while Nworgu and Egbunike (1999) reported that feed
accounted for 60 - 70% of the total cost of broiler production.

2
Fish meal is an important constituent of broiler chickens‟ diet in Ghana because of its high
protein content and good amino acid profile. However, its use is constrained by its high cost
with consequent high prices of meat. Also due to exorbitant prices of other protein source
ingredients (soyabean meal) for animals and the scarcity of locally produced protein
supplements for animal diets, there is, the need for continuous search for new and less
demanding dietary protein ingredients. According to Smith (2001), fish meal is a high quality
protein food rich in all the essential amino acids, choline and vitamin B12. Furthermore,
foods containing high levels of protein are expensive to purchase, and so a diet which is too
high in protein is unnecessarily expensive.
In the search for less expensive substitutes for animal protein, certain plant proteins,
particularly those belonging to the Leguminosae family, have been identified and evaluated
and emerged as the most promising. These new protein sources are especially important
because they are widely available in the tropics and are of good quality and rich in protein
and minerals. Also, legumes are known to contain certain bioactive compounds whose
beneficial effects need to be explored for exploitation. One of such legumes is the Samanea
saman (Jacquin) Merrill which is a large multipurpose tree. Samanea saman is the botanical
name for a wide range of common names such as rain tree, 5‟ O‟clock tree, monkey pod,
saman (English), gouannegoulsaman (French), marmar (New Guinea), ‘ohai (Hawai„i) and
guannegoulsamán (Spanish). The tree is classified under the family name Fabaceae or
Mimosaceae (legume family), sub-family Mimosoideae, genus Samanea and the species
Samanea saman. It is reported that Samanea saman whole pods and seeds contain a high
amount of protein and so could be used as a substitute for fish meal and soyabean meal by
farmers.
According to Craig et al. (2006), rain tree pods are very nutritious containing 12 - 18%
protein and are 40% digestible. The pods are edible and eagerly eaten by humans and

3
livestock (cattle, goat) both domesticated and wildlife. The seeds and leaves contain 26.70%
and 22 - 27% crude protein, respectively. The acacia pod (Samanea saman) is a good source
of protein and energy. It contains 15.18% moisture, 9.45% crude protein, 8.34% crude fiber,
8.82% crude fat, 5.12% ash and 53.09% nitrogen free extract (Barcelo and Barcelo, 2012).
However, the pods contain saponins and the seeds have some level of toxicity.
Figure 1.0: Samanea saman tree
Source : Craig et al., (2006)
1.1 OBJECTIVES OF THE STUDY:
The main objective of this study was to determine the level at which Samanea saman seed
and whole pod meals could be substituted for fish meal and soyabean meal, and also
determine the effect Samanea saman seed and whole pod meals would have on the growth
performance and carcass quality of broiler chickens fed diets containing the seeds and whole
pods.
The specific objectives of the two studies are to determine the:

4
• Chemical composition of Samanea saman seed and whole pod meals.
• Effect of Samanea saman seed and whole pod meals inclusion in broiler diets on
growth performance and carcass characteristics.
• Effect of Samanea saman seed and whole pod containing meals on blood biochemical
indices and organ weights of broiler chickens.
• Economics of production.

5
CHAPTER TWO
2.0 LITERATURE REVIEW
2.1 Nutrient Requirements of Broiler Chickens
Poultry must be supplied with food which contains the entire nutrients required for proper
growth and maximum production. It is therefore essential that poultry must be fed on a diet
that is a mixture of economically available ingredients so as to provide all the nutritional
needs in quantities necessary for their well-being. Formulation of broiler ration should be
done properly to supply the correct balance of energy, protein, amino acids, minerals,
vitamins and essential fatty acids for optimum growth and performance.
For broilers, the feed is normally formulated to promote early rapid growth and such feeds
contain relatively high energy (3000 kcal) and high protein (22 - 24%) for the first 5 - 6
weeks to obtain early rapid growth and then less protein of 19 - 20% and high energy of 3000
kcal per kg of feed for fattening (Banerjee, 1998). According to McDonald et al. (1988),
growing poultry are normally fed to appetite and feeding standards for them are expressed not
as amounts of nutrients but as the nutrient proportions of the diet. The nutrients worth of feed
ingredients for poultry depends on many factors such as variety, the source, processing and
storage conditions, species, season and the class of poultry being fed.
2.1.1 Energy
Energy is needed by chickens for growth of body tissues, production of eggs, carrying out of
vital physical activities and for maintenance of normal body temperature. It is normally
derived from carbohydrates and fats, but could also be derived from protein when it is fed in
excess of body needs. The energy requirements of poultry depend on the needs of the animal,
and this varies depending on the size, activity, health status, housing system, environmental
temperature and whether it is for growing, laying or simply maintaining itself.

6
In spite of the fact that nutrients should be supplied, the cost must be taken into consideration
so that major excesses do not occur but just enough is supplied. It is difficult and expensive
supplying all nutrients at the exact nutrient needs but have to over supply some nutrients so as
to meet the limiting nutrients. Some of the limiting nutrients are energy and some essential
amino acids, such as methionine and lysine. According to Gonzalez and Pesti (1993), when
diets are being formulated for poultry, the nutrient requirements of the birds are often
expressed per unit of dietary metabolisable energy.
Sainsbury (1984) indicated that diets may be classified as high energy (over 2860 kcal of
metabolizable energy per kg weight of feed), medium energy (2640 - 2860 kcal ME/kg) or
low energy (2530 - 2640 kcal ME/kg). It is known that high energy diets are more efficient
and more economical than low energy diets and that the broiler needs high energy diets as
they are usually marketed at a live weight of about 2 kg between 6 and 8 weeks of age with a
feed conversion efficiency of 2 (North and Bell, 1990). Plavnik et al. (1997) reported that
dietary energy levels affect broiler chicken feed intake. The effect of feeding high energy
diets to broilers is to increase performance both in terms of live weight and feed efficiency
(Jackson et al., 1982; Pesti and Smith, 1984). Chickens regulate feed intake purposely to
satisfy an inner metabolic need for energy, and as the caloric density of the diet increases,
feed intake correspondingly decreases (Cleaves et al., 1968; Lillie et al., 1975; Leeson, 2000;
Nahashon et al., 2005; Veldkamp et al., 2005).
However, studies indicate that a specific calorie: protein ratio exists for optimal growth and
feed efficiency of chickens, irrespective of dietary protein level. Vendell and Ringresse
(1958) using broiler diets containing 16.5, 18.5 and 22.5% protein reported that the growth of
chicks was maximised when all the diets had a calorie:protein ratio of 64, but feed efficiency
was best when the calorie:protein ratio was 70. Sibbald et al. (1961) also observed that the

7
weight gain of broiler chicks decreased as the calorie:protein ratio of a 24% protein diet
supplemented with fat exceeded 64.
Olumu and Offiong (1980) reported 23% crude protein with either 2800 or 3000 kcal/kg
metabolizable energy for starter broiler birds whiles Fetuga (1984) recommended 23 - 24%
crude protein and 2800 - 3000 kcal/kg metabolizable energy for starter broiler diets and 19 -
21% crude protein and 2800 - 3000 kcal/kg metabolizable energy for finisher phase. Maiorka
et al. (2004) also reported that broiler chickens fed diets that contain 3200 kcal ME/kg had
higher weight gain, better feed conversion efficiency and higher abdominal fat deposition
than diets containing 2900 kcal ME/kg.
Poultry are usually fed to appetite with the hope that they will achieve maximum rates of
meat and egg production. Hence the energy concentration of foods and diets is an important
characteristic for poultry because birds, like other monogastric animals tend to adjust their
intake to provide a constant energy intake.
2.1.2 Minerals
Minerals are chemical elements which are essential for the maintenance of good health and
well-being of animals. Chickens require minerals for bone development, muscle function,
metabolism, formation of blood cells, enzyme structure and functions, egg production and
appetite. The essential elements, when lacking in the diet, will show some deficiency
symptoms and this problem can be solved or prevented by inclusion of that particular element
in the diet.
Minerals are classified as 'macro-minerals' (required in larger amounts) and 'micro-minerals'
or 'trace-minerals' (required in minute amounts). The macro-minerals are Calcium,
phosphorus, potassium, sodium, sulphur, chlorine and magnesium. Copper, iron, manganese,
iodine, zinc, selenium, cobalt, fluorine and molybdenum are also minerals but are needed in
8
trace amounts as the absence of these may affect many metabolic processes like poor growth
and appetite, reproductive failures, impaired immune responses, and general ill-health. For
chickens, the major ones are calcium and phosphorus for the formation of strong bones and
healthy egg production (NRC, 1984).
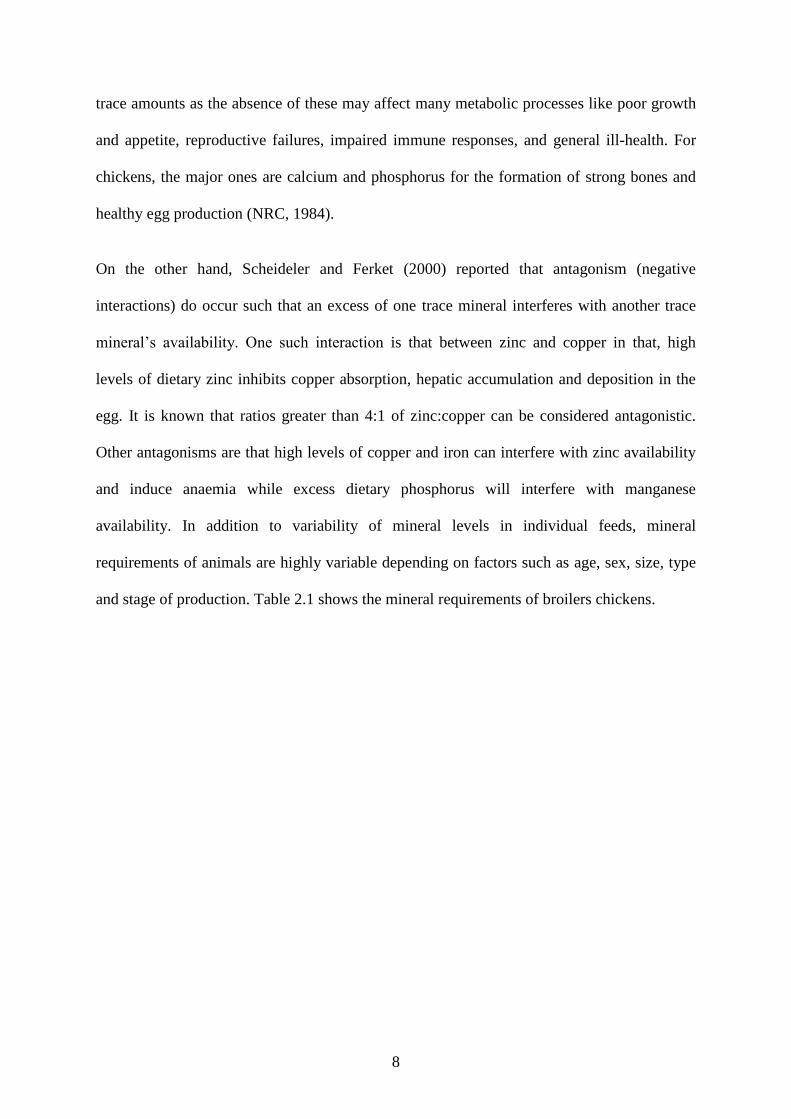
On the other hand, Scheideler and Ferket (2000) reported that antagonism (negative
interactions) do occur such that an excess of one trace mineral interferes with another trace
mineral‟s availability. One such interaction is that between zinc and copper in that, high
levels of dietary zinc inhibits copper absorption, hepatic accumulation and deposition in the
egg. It is known that ratios greater than 4:1 of zinc:copper can be considered antagonistic.
Other antagonisms are that high levels of copper and iron can interfere with zinc availability
and induce anaemia while excess dietary phosphorus will interfere with manganese
availability. In addition to variability of mineral levels in individual feeds, mineral
requirements of animals are highly variable depending on factors such as age, sex, size, type
and stage of production. Table 2.1 shows the mineral requirements of broilers chickens.

9
Table 2.1: Mineral Requirements of Broilers as Percentages or Milligrams or Units Per
Kilogram of Diet.
Weeks Weeks Weeks
Energy Base 0 - 3 3 - 6 6 - 8
Kcal ME/kg Dieta
3,200 3,200 3,200
Protein (%) 23.00 20.00 18.00
Calcium (%) 1.00 0.90 0.80
Phosphorus (%) 0.45 0.40 0.35
Potassium (%) 0.40 0.35 0.30
Sodium (%) 0.15 0.15 0.15
Chlorine (%) 0.15 0.15 0.15
Magnesium (mg) 600 600 600
Manganese (mg) 60.00 60.00 60.00
Zinc (mg) 40.00 40.00 40.00
Iron (mg) 80.00 80.00 80.00
Copper (mg) 8.00 8.00 8.00
Iodine(mg) 0.35 0.35 0.35
Selenium (mg) 0.15 0.15 0.15 aThese are typical dietary energy concertrations.
Source: NRC (1984)
2.1.3 Vitamins
Vitamins help regulate the biological processes in the body. Vitamins are also classified as fat
soluble (vitamins which can be stored in the body for long periods of time) namely vitamins
A, D2, D3, E and K whiles the water-soluble (vitamins are excreted in the urine) namely B
complexes (B1, B2, B6, B12) and vitamin C (McDonald et al., 1988). Most of the vitamins
and minerals are provided mainly from ingredients but are generally supplemented through
premix added to the diet.
According to Parkhurst and Mountney (1988), some vitamins are for dietary essential (body
regulation) and some for metabolic essential (development of structural components) and
poultry have the former. Vitamin concentration of feedstuff varies and it is affected by plant

10
species and parts (leaf, stalk, and seed), harvesting, storage and processing. They are easily
destroyed by oxidation (speeded by heat, light and certain metals like iron) and mould
growth. This fact is vital because the condition under which food is prepared and stored
affects the vitamins potency (McDonald et al., 1988). Table 2.2 shows the vitamins
requirements of broilers chickens.
Table 2.2: Vitamins Requirements of Broilers as Percentages or Milligrams or Units Per
Kilogram of Diet.
Weeks Weeks Weeks
Energy Base 0 - 3 3 - 6 6 - 8
Kcal ME/kg Dieta
3,200 3,200 3,200
Vitamin A (IU) 1,500 1,500 1,500
Vitamin D (ICU) 200 200 200
Vitamin E (IU) 10 10 10
Vitamin K (mg) 0.50 0.50 0.50
Riboflavin (mg) 3.60 3.60 3.60
Pantothenic acid (mg) 10.00 10.00 10.00
Niacin(mg) 27.00 27.00 11.00
Vitamin B12(mg) 0.009 0.009 0.003
Choline (mg) 1,300 850 500
Biotin (mg) 0.15 0.15 0.10
Folacin (mg) 0.55 0.55 0.25
Thiamine (mg) 1.80 1.80 1.80
Pyridoxine (mg) 3.00 3.00 2.50 aThese are typical dietary energy concertrations.
Source: NRC (1984)
2.1.4 Protein
Protein is essential to the structure of red blood cells, for the proper functioning of antibodies
resisting infection, for the regulation of enzymes and hormones, growth, and for the repair of
body tissues. Meat, milk, cheese, and eggs are complete proteins that have all the essential
amino acids. Other sources of protein include whole grains, rice, corn, beans, legumes,
11
oatmeal, peas, and peanut butter. For those who do not eat meat, eggs, or dairy products, it is
important to eat a variety of these other foods in order to obtain enough protein.
According to McDonald et al. (1988), proteins are complex organic compounds of high
molecular weight which are associated with all living cells and are intimately linked in all
phases of activities that constitute life of the cell. Schaible (1970) reported that proteins make
up vital parts of the skin, muscle tissue, feathers, cartilage, beak and internal organs as well as
other tissues of the bird‟s body. Proteins are primarily made of amino acids. North (1984)
stated that proteins are essential for life and the actual need by the bird is the result of its
demand for the amino acids. The provision of proteins and amino acids in the diet influences
the production of nearly all of the body‟s nitrogenous compounds (Chestworth, 1992).
Sainsbury (1984) observed that for birds to realize their genetic potential and achieve the best
levels of growth performance through maximum rates of protein synthesis, amino acids must
be provided in the right quantities by avoiding excesses and deficiencies.
Amino acid requirements of broiler chickens may be classified as those for maintenance,
carcass growth, egg production and feather growth according to their respective amino acid
profiles (Hurwitz et al., 1978). Crude protein requirements of growing animals vary
according to the physiological state of the bird (rate of growth or egg production),
environmental temperature, age, body size, sex and breed of poultry, composition and rate of
gain, the quality of protein fed with respect to age, as well as non-protein compounds such as
antibiotics. Chicks require 19 - 23% of a good quality protein in their diet for the first 6
weeks, but thereafter the level can be reduced to 16 - 18% (Sainsbury, 1984). Olumu and
Offiong (1980) indicated that a protein level of 23% and energy content of 2800 to 3000 kcal
ME/kg diet may be recommended for starting broilers. These values agree with those
reported by Onwudike (1983) who observed that increasing protein level from 20 to 22%
improved weight gain and feed efficiency. However, there were no extra benefits from
12
increasing the protein to 26%. Other authors including Okoli and Mgbeogba (1983), Ladeji et
al. (1995), Akwaowo et al. (2000) and Nworgu et al. (2006) have recommended that broiler
diets should have crude protein values of 21.80%, 30.50%, 22.40% and 21.31%, respectively.
Similar values have also been reported by many other authors under tropical conditions (Virk
et al., 1978; Saxena and Pradhan, 1979; Tiemoko and Tawfik, 1989). Onwudike (1983)
explained that at a high protein level, there is a metabolic strain in dealing with extra protein
level and this therefore brings about the decrease in efficiency. In order for the bird to realize
its genetic potential and achieve the best levels of performance through maximum rates of
protein synthesis, amino acids must be provided in the necessary quantities, avoiding both
excesses and deficiencies (Sainsbury, 1984).
According to Mess (1992), the quality or biological value of a protein is determined by how
closely its amino acid composition meets the requirements and that in quantitative terms, the
amino acids required in greatest quantities for growth are arginine, lysine, phenylalanine,
leucine and tyrosine. Gillespie (1990) reported that thirteen amino acids are considered to be
essential for poultry and these are arginine, histidine, isoleucine, leucine, lysine, methionine
or cystine, phenylalanine, threonine, tryptophan, valine, alanine, aspartic acid, glycine and
serine. Phenylalanine can be replaced by tyrosine but are synthesized in the body from other
amino acids and therefore do not have to be provided in the ration of animals. Other authors
have reported that six essential amino acids are critical for growth in animals namely
isoleucine, leucine, lysine, the sulphur-amino acids cystine or methionine, phenylalanine and
valine but the impact on growth of the animals is not as great as the others (arginine,
histidine, threonine and tryptophan).
Balancing the ration of birds in terms of amino acids rather than crude protein content
ensures that the nutritional needs of the chicks are met (Gillespie, 1990). Fisher (1968)
reported that a diet with unbalanced lysine, tryptophan and methionine levels reduces appetite
13
of the chicks and hence decreases feed intake and weight gain. Results from animal studies
show that chicken eggs and poultry meat have the richest quality and best source of food
protein. Infact, egg protein is now being used as a standard against which other food proteins
are compared (Atteh, 2004).
2.2 Protein Feedstuffs for Feeding Poultry
Protein feedstuffs are divided into two main classes namely: Plant protein supplements and
Animal protein supplements. Parkhurst and Mountney (1988), reported that animal proteins
are generally of higher quality than vegetable proteins since they contain minerals and
vitamins and are richer in the sulphur-containing amino acids. Titus and Fritz (1971) also
stated that proteins in feedstuffs of plant origin are inferior to those of animal origin. Plant
feedstuffs have at least 20% of crude protein and provide amino acids which are usually not
available in the cereal portion of the diet. The amount and availability of the essential amino
acids required by poultry determine the value and usefulness of the protein sources. It is
therefore necessary to choose more than one source of dietary protein (animal and vegetable
source) to meet the amino acid requirements of chickens (Banerjee, 1998).
2.2.1 Animal Protein Feedstuffs
Animal protein sources have high quality proteins, since they usually contain a good balance
of the essential amino acids (Gillespie, 1990). They are rich in essential amino acids (EAA's),
especially lysine and methionine that are limiting in most plant proteins. Animal proteins
have excellent trace minerals content, good sources of energy, vitamins and identified growth
factor (IGF) and unidentified growth factor (UGF). Animal proteins, for these reasons, are
almost always included in chick and broiler diets though it is not essential for laying birds on
medium or low energy diets (Sainsbury, 1984). However, there are significant disparities in
availability (absorption and retention) of amino acids because of variation in inputs and
processing conditions (temperature, moisture, pressure and time). Some of the animal protein

14
feedstuffs used in poultry ration include fish meal, meat meal or meat and bone meal,
hydrolyzed poultry feathers, meals from waste poultry parts and organs, milk products such
as dried butter milk, skimmed milk and whey.
2.2.1.1 Fish Meal
Fish meal is an important constituent of poultry diets because of its high protein content and
good amino acid profile. It also has a rich lysine and methionine content and minerals. The
composition of fish meal varies and this depends upon what substrate and method used to
prepare the meal. According to North and Bell (1990), most fish meals vary in their content
of crude protein from 55 - 75%. However, they are not equal in the composition of amino
acids or in their digestibility. According to International Fish meal and Fish Oil Organisation
(IFFO, 2006), fish meal contains about 60% to 72% protein, 10% to 20% ash and 5% to 12%
fat. Fish meal has high mineral content, about 210 g/kg which is of value nutritionally since it
contains high proportions of calcium (80 g/kg), phosphorus (35 g/kg) and desirable number
of trace minerals (magnesium, iron, iodine), vitamins (B complexes, choline, riboflavin) and
enhanced nutritional value because it contains a growth factor (McDonald et al., 1988).
Cullison and Lowrey (1987) reported that fish meal is normally high in minerals especially
calcium and phosphorus and also contains substantial amounts of the B group of vitamins
especially vitamin B12 and some unidentified growth factors. Fish meal can be classified into
two types namely, fishery waste associated with the processing of fish for human
consumption and fish that are only used for the production of fish meal. White fish meal is
considered to be the best quality for poultry and may be included in the diet of young
chickens at levels of up to 10 percent, this amount being reduced as birds get older
(Sainsbury, 1984).

15
Miles and Jacqueline (2009) reported that good quality fish meal is a brown powder which
averages between 60% and 70% protein and has 2% to greater than 14% fat, 6 to 12%
moisture content and ash content of 18% (for an industrial fish meal) to 25% (for a white fish
meal). In addition, Miles and Jacqueline (2009) indicated that good quality fish meal should
also contain no more than 2 percent salt added as a preservative before processing or if kept
for long periods before use and should contain an anti-oxidant. The quality of fish meal is
also very much affected by the processing method especially drying. Most often, the drying
process is not complete which results in the product becoming infested with Salmonella
bacteria. This contaminant often poses problems to users of sun-dried fish meal. Urea is also
another contaminant of fish meal, sometimes added by unscrupulous merchants to give
inferior product deceptively high crude protein content.
The presence of fish meal, even in small quantity can greatly improve the nutritional value of
the entire diet. Fish meal in diets boost feed efficiency and growth through better food
palatability and enhances nutrient uptake, digestion and absorption. Also, the balanced amino
acid composition of fish meal complements and provides synergistic effects with other
animal and vegetable proteins in the diet to promote fast growth and reduce feeding costs.
However, some researchers reported that fish meal could be successfully replaced by
soyabean meal and yeast after proper supplementation with methionine because of its high
cost and availability.
2.2.1.2 Meat Meal
Meat meal is also an animal protein source and its quality as a protein supplement depends on
its production process as well as raw material used. Good quality meat meal is low in fat and
mineral content. Meat meal is often used as an animal protein source in compound fish feed
manufacture although its feed value is generally considered inferior to that of soyabean meal
and fish meal (Fowler and Banks, 1976). Ravindran et al. (2005) indicated that variation in

16
meat meal quality (amino acid availability) within processing plants was greater than
variations between plants. Table 2.3 shows the nutrient composition of some animal protein
sources.
Table 2.3: Nutrient Composition of Animal Protein Sources
Ingredient
Crude
protein
(%)
Metabolisable
energy
(kcal/kg)
Calcium
(%)
Available
phosphorous
(%)
Lysine
(%)
Meat meal 50.0 2500 8.00 4.00 3.6
Fish meal 60.0 2720 6.50 3.50 5.3
Poultry by-
product meal 60.0 2950 3.50 2.10 3.4
Blood meal 80.0 2690 0.28 0.28 6.9
Feather meal 85.0 3016 0.20 0.75 1.7
Source: The poultry consultancy (2009)
Table 2.4 also indicates the averages of samples used in developing nutrient levels published
by the National Research Council (NRC, 1994) for meat and bone, blood, feather and poultry
meals.
Table 2.4: Nutrient levels in animal protein meals
Nutrient Meat & Bone Blood Feather Poultry
Metabolisable Energy
(MJ/kg) 11.2 15.2 13.7 13.1
Crude Protein (%) 50.4 88.9 81.0 60.0
Fat (%) 10.0 1.0 7.0 13.0
Calcium (%) 10.3 0.4 0.3 3.0
Phosphorus (%) 5.1 0.3 0.5 1.7
Lysine (%) 2.6 7.1 2.3 3.1
Methionine (%) 0.7 0.6 0.6 1.0
Cystine (%) 0.7 0.5 4.3 1.0
Source: NRC (1994)
2.2.2 Plant Protein Feedstuffs
Plants generally provide about 80% of protein feeds used in livestock diet. Plant protein
feedstuffs are mostly processed oil seeds while the rest may be milling by-products. The
unprocessed seeds are quite useful sources of both energy and protein, especially the oil-
bearing seeds. These plant proteins are usually associated with tissues that are metabolically
17
active. Plant feedstuff‟s protein content and nutritive value can be quite variable and are
affected by the location where the plant is grown, the type of seed, the amount of seed coat or
hull added to the material and the extraction method used to extract the oil from it.
Plant protein feedstuffs mostly used in poultry ration are rich in protein (20 - 50%) and are of
tropical origin. These include soyabean meal (SBM), peanut (groundnut) meal, cottonseed
meal, coconut (copra) meal or cake, palm kernel cake, brewer‟s dried yeast and single cell
proteins. A number of other oil seed meals and cakes are used in poultry rations but their use
in Ghana is generally restricted because of limited supply. These include sunflower meal,
rapeseed meal, linseed meal, sesame meal, mustard seed meal and safflower seed meal. Also
the use of other legumes namely beans, pigeon peas and cowpeas is restricted and this is due
to a number of factors including
- lack of processing facilities
- high cost of transport from areas of production to the location of feedmills
- their importance as sources of cheap plant protein for human consumption
- the unattractive price that farmers receive from the sale of these products to the
animal feed industry.
2.2.2.1 Soyabean Meal
Soyabean meal is the material remaining after solvent extraction of oil from soyabean flakes,
with fifty percent soy protein content. Soyabean meal is one of the oil seed crops which are
used extensively in poultry feeds in many tropical and semi-tropical regions. Soyabean meal
has the highest nutritive value, is low in fat and relatively very low oil content. The crude
protein content ranges from 41 - 50%. It has a good source of essential amino acid balance,
especially rich in lysine but is deficient in methionine which can be corrected by addition of
synthetic form of the amino acid in the feed.

18
According to Gohl (1981), properly heated soyabean meal is an excellent feedstuff for all
farm animals with no restraints on its use. Heating of the raw beans during the oil extraction
process destroys the anti-nutritive factors mainly urease and trypsin inhibitor present.
Soyabean meal has presently been used most extensively as a substitute for fish meal in
compound fish feeds because the fish meal is costly. However, other works carried out on the
extent to which processed soyabean products can substitute fish meal as a protein source
proved otherwise. Viola et al. (1981) observed that substituting the fish meal with the
soyabean meal had no effect on growth of carp while similar replacement in diets for trout
resulted in slower growth and poorer feed conversion (Koops et al., 1976). Say (1987)
indicated that the preponderance of soyabean cake is explained by its richness in
indispensable amino acids, particularly lysine, its freedom from toxic factors and moderate
price, so commercial specification of soyabean cake (44, 48 or 50) corresponds to the
addition of fat and proteins to the raw material with a mean moisture content of 12%.
Full-fat soyabean processed under high pressure has lately been effectively used as a
complete substitute for fish meal in the diets of both warm-water (catfish) as well as cold-
water (trout) species (Reinitz, et al., 1978; Brandt, 1979). Soyabean meal is an essential
element of the American production method of growing farm animals such as poultry and
swine on an industrial scale. SBM with the hulls contain 44 - 45% protein and this could be
used in broiler chickens diet, however, growth performance such as feed efficiency would be
enhanced for broiler chickens fed dehulled soyabean meal (Penz and Brugalli, 2000). It was
also reported that 100% SBM in the broiler chickens diet could be replaced with full-fat
soyabean. Table 2.5 shows some of the nutrient composition of vegetable protein sources.

19
Table 2. 5: Nutrient Composition of Vegetable Protein Sources
Ingredient
Crude
protein
(%)
Metabolisable
energy
(kcal/kg)
Calcium
(%)
Available
phosphorous
(%)
Lysine
(%)
Soybean meal 48.0 2557 0.20 0.37 3.2
Canola meal 37.5 2000 0.66 0.47 2.2
Cottonseed meal 41.0 2350 0.15 0.48 1.7
Sunflower meal 46.8 2205 0.30 0.50 1.6
Peas 23.5 2550 0.10 0.20 1.6
Lupins 34.5 3000 0.20 0.20 1.7
Source: The poultry consultancy (2009)
2.2.2.2 Groundnut Cake or Peanut Meal (PNM)
Groundnut cake or peanut meal (PNM) is palatable and has a very acceptable smell and taste
(flavour). The nuts are sometimes decorticated before crushing to improve the PNM quality.
Groundnut cake or peanut meal (PNM) is normally used as a feedstuff for poultry and peanut
as a food for humans (Rosen, 1958).
The drawback of PNM is that it contains aflatoxins, produced by the fungus, Aspergillus
flavus (Scott et al., 1982) and also low in the essential amino acids, lysine and methionine
(Anderson and Warnick, 1965; Mezoui and Bird, 1984). Groundnut cake or peanut meal
tends to become rancid with long storage (more than six weeks) especially under hot, humid
conditions, but is free from the bitterness of rancid products. Scott et al. (1982) indicated that
tremendous results are obtained when decorticated, extracted groundnut cake provide good
protein for growing chicks. Daghir (1995) has suggested that PNM should not be used as a
major source of protein in rations, unless the diet is supplemented with the essential amino
acids, lysine and methionine.
2.2.2.3 Cottonseed Meal
Cottonseed meal, although has a high protein content, is low in lysine and methionine. It also
contains a toxic substance called gossypol which is usually 0.4 to 1.7 percent. The content of
free gossypol in diets up to 100 ppm, are generally considered to be acceptable for broilers as

20
far as growth and feed intake are concerned (Waldroup, 1981). On the other hand, gossypol is
inactivated by iron in a 1:1 molar ratio (Waldroup, 1981; Scott et al., 1982). Studies with
trout have shown that the toxin persisted in body tissues 12 months after it has been fed to the
fish. According to Lovell (1981), much of the retained gossypol was found in the liver,
kidneys and spleen. On the other hand, glandless (gossypol-free) cottonseed meal has been
used at up to 40 percent in diets of salmon without deleterious effect (Fowler and Banks,
1976).
The use of cottonseed meal in poultry feed is limited because the protein supplement
particularly lysine is low and the presence of gossypol results in reduced performance and
increased mortality in chickens (Smith, 1970). However, Fernandez et al. (1995) managed to
improve weight gain and feed efficiency of chickens fed diets with 20% cottonseed meal by
formulating the diet based on the total digestible amino acids. Also, Watkins et al. (1994)
indicated that 30% cottonseed meal used as a protein source in starter diets do not have
adverse effects on the body weights of chickens until they are 21 days of age. Cottonseed
meal can be made non-toxic by treating with water and cooking with steam or the gossypol
effect may be counteracted by the addition of ferrous sulphate, at a range which varies for
animal species from 1 part ferrous sulphate to 1 part free gossypol for pigs to 4 parts to 1 part
for poultry layers.
2.2.2.4 Legume Plants
Certain plant proteins, particularly those belonging to the Leguminosae family, through
research have been identified and evaluated and emerged as the most promising for use as
feeding material in livestock and other reared animals. These new protein sources (legumes)
are especially important because they are widely distributed throughout the tropics. Legumes
are good quality and inexpensive rich source of proteins with desirable characteristics such
as the ability to lower the serum cholesterol, high fibre, abundance of carbohydrates, low fat

21
(except oil seeds), high concentration of polyunsaturated fatty acids and a long shelf life. In
addition to legumes having B complex vitamins, minerals and high fibre, they are also major
sources of proteins and calories (Rockland and Nishi, 1979). Legumes in having all these
properties could be a potential feed resource and their protein levels are almost comparable to
fish meal. Leguminous seeds are relatively rich in lysine, the amino acid that is most often the
first to be limiting in compound feed. One of such legumes is the Samanea saman tree also
called the “Rain tree” which is a large multipurpose tree.
Despite the many varieties of legumes that have been identified for use as fodder for
livestock, only a few have been utilized commercially for feed manufacture as they contain
anti-nutritive factors. Seeds of many legumes and other plants contain anti-nutritive factors
and wide variety of toxic and potentially toxic substances. However, processing of the
legume seeds overcomes this problem (Liener, 1978).
2.3 Samanea saman (Rain Tree)
Samanea saman plant is native to Northern South America (Colombia, the Caribbean slope
and the Orinoco drainage of Venezuela), but currently naturalized and distributed throughout
the tropics. The tree is recognised by its characteristic umbrella-shaped canopy or domed
broad crown with a diameter of 30m. Its size reaches 15 – 25m (50 – 80ft) in height but in
rare cases 50m and the tree has a short stout trunk of about 1 – 2m. Rain tree has two
flowering seasons, February to May and September to November which depends on the
geographical area. Rain tree shows little local variability and it is mostly uniform in
appearance throughout its distribution. Rain tree has tiny pinkish “powder puff” flower heads
and bears fruits with black-brownish pods filled with seeds (Figure 2.0a and 2.0b). The
compound leaves are evergreen, alternate, pinnate with diamond shaped leaflets that fold up
22
at night or when cloudy or raining. Each pod contains 15 - 20 seeds and an average of 200 -
250 kg of pods can be found on a mature tree per season (Staples and Elevitch, 2006).
Propagation of Samanea saman is done by several methods and these are by the seeds, stem
cuttings, root cuttings and stump cuttings. Samanea saman is propagated from seeds and
cuttings but transplants from young seedlings could also be done (Allen and Allen, 1981).
Dispersal of seeds is by domestic livestock (cattle) and wild animals and these seeds are
dispersed through their eating habit and digestive capacity. Outplanting is done when the
seedlings are 3 – 5 months old and 20 – 30cm tall. Transplanted seedlings grow rapidly and
attain 15 cm diameter in 5 years. Seedlings can be transplanted from a nursery or taken from
near a mature tree and seeds are nursed or sowed directly on the field if a large number of
trees are needed. Seeds collected and removed from the pods will sprout immediately taken 3
- 5 days if the hard, waterproof, outer coat is nicked before sowing. According to Craig et al.
(2006), rain tree grows better in low lands from sea level to 300m with rainfall of 600 – 3000
mm. It naturally occurs on savannahs (grasslands) and in deciduous forests but it naturalizes
freely anywhere it has been introduced. Rain tree has a fast growth rate of 0.75 – 1.5 m per
year and is tolerant to drought, full sun, shade, frost, waterlogging, weeds, poor soil, salt
spray and wind.

23
Source : Craig et al. (2006)
Craig et al. (2006) stated that rain tree can survive a dry period of 2 – 4 months or longer
depending on age of tree, size of tree, soil, temperature and relative humidity. Samanea
saman has many uses and products such as livestock feed (green forage and pods) for
consumption, timber, wood for carvings, medicine, beverage, animal fodder, seeds for
making crafts, ornamental, bee forage, wild life habitat, crop shade, silvopasture and home
garden. It is also planted along roadsides, in parks and pastures, vacant lots, churches and
schoolyards, and in similar spacious and open places (Ayensu, 1981; Staples and Elevitch,
2006).
It has other abilities such as, fixing nitrogen in the soil, regenerating rapidly, self prune,
coppice and pollard. A tropical forage grass (Axonopus compressus), grown under rain tree
demonstrated enhanced growth, nutritive quality, protein content and yield and this benefit is
attributed to the nitrogen made available in the soil by excretion or decomposition of the
leguminous nodules (Allen and Allen, 1981). The sugar content of the pods could be used to
produce alcohol by fermentation whiles the seeds are chewed in tropical Africa and used for
treating inflammation of gums in mouth and throat. Samanea saman has an average life span
of 80 - 100 years (Craig et al., 2006).
Figure 2.0b: Samanea saman riped pods Figure 2.0a: Samanea saman opened pod showing seeds

24
2.3.1 Composition and the General Nutritive Value of Samanea saman
Acacia pod (Samanea saman L.) is a good source of protein and energy. It contains 13.57%
protein, 89.25% dry matter, 2.98% ether extract, 2.19% crude fibre, and 0.23% ash and
6.44% nitrogen extract. Apart from its nutrient content, which is almost comparable to corn,
acacia pod is easily available making it a cheap source of feed for chickens (De la Cruz.,
2003). De la Cruz (2003) again indicated that during the dry season, roughages and fodder
used in feeding farm animals are dry and lack enough nutrients making the industry rely
solely on corn. Corn thus constitutes a big fraction in preparing chicken feeds. Due to its high
demand in the livestock and poultry industry, corn supply becomes scarce particularly during
the dry season making it an expensive component in compounding chicken feeds.
Barcelo (1999) determined the effect of substituting corn with acacia pod meal on weight
gain and general performance of broiler chickens. Four important parameters were used to
determine the suitability of acacia pod meal as substitute for corn and as supplement. These
are gain in weight, feed consumption, feed conversion efficiency and profit. The results
agreed with the researcher's earlier hypothesis on the effectiveness of acacia pod as substitute
and supplement. It was concluded that acacia pod meal is significantly comparable to corn
feeds as it could substitute corn up to 35% in formulated ration (De la Cruz., 2003).
The whole pod reportedly contains 15.3% moisture, 3.2% ash, 2.1% fat, 12.7% protein,
11.4% CF and 55.3% carbohydrates. The kernels contain 16.1% moisture, 3.0% ash, 1.3%
fat, 10.6% protein, 10.8 CF, and 42.0% carbohydrates (Duke, 1983). Preliminary studies
done in Venezuela showed that the ground pods fed at moderate levels have no adverse effect
on the cachama (a native fish species belonging to the characidae family) (Gohl, 1981).
Craig et al. (2006) also reported that rain tree pods are nutritious with 12 – 18% protein, 40%
digestibility and because of the sweet pulp, are readily eaten by cattle, hogs, horses and goats.
Rain tree is grown as a green fodder supplement for goats, sheep, and cattle in Asia (Craig et

25
al., 2006). Samanea saman pod reportedly are potential supplement for ruminants as they
have beneficial effect of increasing metabolizable energy, nitrogen intake and feed efficiency,
and improve animal performance (Osuji et al., 1995; Umunna et al., 1995).
In Ghana, a study conducted on Samanea saman pods showed that it could be used as protein
and energy supplement for ruminants livestock during the dry season (Tagoe, 2011). Napier
grass supplemented with Samanea saman pods fed to Djallonke sheep during the dry season
showed an increase in dry matter digestibility and nitrogen intake (Addey, 2011). In a similar
study, dried Samanea saman pods supplemented in the diet of sheep showed increase in feed
intake and growth performance (Offoh, 2011).
Samanea saman pod is green when raw and has 16.70% protein content but turns black when
fully ripe which is also eaten by other farm animals like pigs, sheep, goats, and cattle as it is
rich in starch and sugar. Also, the sticky pulp around the seed is sweet, making it more
palatable for animal feeding (Craig et al., 2006). Flores (2002) also reported that rain tree
pods contain 13 – 18% protein, are edible, nutritious for livestock and make very good feed
supplement. Rain tree seeds are also used in concentrates of livestock while the pods are used
in substituting grain feed of livestock feed and improving livestock productivity in the dry
season (Durr et al., 2001). The leaves are fairly rich in protein containing about 22 – 27%
crude protein but are high in tannins (Staples and Elevitch, 2006). Tables 2.6 and 2.7 show
the general nutritive value of the Samanea saman tree.

26
Table 2. 6: Chemical composition and general nutritive value of Samanea saman seeds,
pods and empty pods.
Parameters (%) Seeds Whole pods
Empty pods SEM
DM 86.25a
78.00b
71.75c
0.799
CP 23.25a
16.97b
12.19c
0.1453
CF 8.06c 8.65
b
9.10a
0.0651
NDF 25.95c
27.05b
28.32a
0.0433
ADF 17.45c
18.98b
19.45a
0.0433
ADL 8.85b
8.95b
10.07a
0.0433
ASH 2.00a
1.75a
2.00a
0.221 a,b,c means with different superscripts are significantly different at (p < 0.05), SEM, standard error of mean,
DM-dry matter, CP- crude protein, CF-crude fibre, NDF-neutral detergent fibre, ADF- acid detergent fibre,
ADL- acid detergent lignin
Source: Sackey (2010)
Table 2.7: Chemical composition of parts of Samanea saman plant
As % of dry matter
DM CP CF Ash EE NFF Ca
Fresh twigs, late vegetative,
Malaysia 38.9 24.7 22.1 4.4 2.8 46.0 0.55
Fresh leaves, Thailand 39.1 22.1 29.4 6.0 7.0 35.5 1.42
Fresh leaves, Trinidad 34.4 30.0 29.0 3.5 3.5 34.0
Pods, Jamaica 79.5 12.8 14.5 2.4 0.7 69.6 0.29
Pods, fallen, Trinidad 85.0 18.0 10.9 4.6 1.4 65.1
Seeds, Jamaica 86.5 31.6 14.0 4.3 6.0 44.1 0.16
Source: Gohl (1981)
2.3.2 Storage of Samanea saman Seeds and Pods
Pods of Samanea saman collected can be dried and kept or dried and processed into meal
during dry season when the tree bears fruits. On the other hand, seeds collected and removed
from the pods must be carefully cleaned before storage as the sweet, sticky fruit pulp
endocarp promotes insect attack. Viability of the seeds is retained when they are dried and
stored. However, they can also be stored in the refrigerator for many months without losing
viability. Seeds can be stored at 4o C with 6 - 8% moisture content for long duration and those
stored at 5oC or older retain viability over a year. Seeds which are not stored properly are
damaged by beetles called Stator limbatus (Craig et al., 2006).

27
2.3.3 Amount of Samanea saman Seeds and Pods Available for Processing
Samanea saman seeds are 8 – 11mm long and 5 - 7.5mm wide. The pods are plumpy, oblong,
slightly flattened from side to side and dark brown in colour with slender u-shaped yellowish
markings on the flattened sides. Each pod contains 15 - 20 seeds but has 5 - 10 seeds in the
native range due to insect predation of seeds and a kilogramme of seed averages 4000 - 6000
seeds. An average of 200 - 250 kg of pods is found on a mature tree per season (Staples and
Elevitch, 2006).
2.3.4 Methods of Processing Samanea saman Seeds and Pods
According to Craig et al. (2006), pods are collected from the ground beneath trees after they
drop as picking pods off the tree is inadvisable because, although the pods take 5.5 - 8
months to mature, the seeds only fill out and become viable shortly before the pods fall. In
some cases, the pods are restrained on the tree for up to 4 months post maturity. Ripened
pods are handpicked from beneath the tree and sun dried to reduce the moisture content and
also the sticky pulp for easy milling. The seeds can be extracted from the pods by various
processing methods which include:
1. Manual extraction of seeds.
2. Collection of seeds from dung of livestock that has eaten the pods. This method is
less labour intensive and germination is enhanced because the seed passes through the
digestive system of the animal.
3. Keeping of pods in a dark place to allow termites to feed on it so as to remove the
pulp leaving the seeds.
2.3.5 Anti – Nutritional Factors in Samanea saman Seeds and pods
Leguminous plants contain natural substances which have to be removed or deactivated
because they are either toxic to the consuming animal or interfere with the normal digestive

28
processes. These anti-nutritional factors present in plants serve to limit their use as
feedstuff substitutes in poultry production as they reduce feed palatability, intake,
digestion, absorption, utilization and growth (Olorunsanya et al., 2010).
The raw seeds of many legumes contain anti-nutritive factors which can be over come by
processing (Liener, 1978). The seeds of legumes and other plants contain a wide variety of
toxic and potentially toxic substances (Liener, 1978). These include; trypsin inhibitors,
phytohaemagglutinins, goitrogens, cyanogenic glycosides, anti-vitamin factors, and toxic
amino acids. According to Cheeke (1971), saponins consist of a steroidal or triterpene
aglycone attached by ester- or ether-linked bonds to one or three variably sized saccharide
chains. This causes erythrocyte hemolysis, reduction of blood and liver cholesterol, growth
depression, bloat, inhibition of smooth muscle activity and reduction in nutrient uptake.
Johnson et al. (1986) also confirmed that saponins, like lectins, bind to the cells of the small
intestine and affect nutrient absorption across the intestinal wall. Oakenfull et al. (1984)
reported of saponins causing cholesterol-lowering effects in humans and animals by the
formation of micelles and bile acids into micellar bile acid molecules.
Samanea saman is known to contain some anti-nutritive factors such as saponin-like alkaloid
and pithecolobin found in the bark and the seed. The bark, stems, leaves, and seeds contain
alkaloids. Also, the leaves and stems contain saponins and tannins. Samanea saman pods
have a fair proportion of albuminoid substances, whiles the trunk yields an inferior gum.
According to Bate-Smith (1973) and Liener (1989), the presence of tannins and saponins in
the seeds and pods adversely affect feed intake and digestion of the broiler chicken.
2.3.6 Uses of Samanea saman
Improved growth, nutritive quality, protein content, and good yield have been demonstrated
by Axonopus compressus, a tropical forage grass, grown under rain tree. The benefit by
29
association was presumptively attributed to nitrogen made available in the soil by
decomposition of the leguminous nodules (Allen and Allen, 1981). National Academy of
Sciences (NAS) (1980) reported that grass grows right up to the trunk because rain tree
leaflets fold together at night and in wet weather, allowing the rain to fall through. Like
Acacia, Ceratonia, Prosopis, and Tamarindus, rain tree produces copious pods with a sweet
pulp, which is attractive to children and animals alike. Pods can be ground up and converted
to fodder or alcohol as an energy source. Also, a lemon-like beverage can be made from the
pulp (Duke, 1983).
Samanea saman can be used as folk medicine in curing some diseases. Rain tree is a folk
remedy for colds, diarrhea, headache, intestinal ailments, and stomach ache (Duke and Wain,
1981). Other authors have indicated that infusion of the leaves is good as a laxative and in the
West Indies, seeds are chewed to treat sore throat (Garcia-Barriga, 1975; Ayensu, 1981).
Rain tree has many other uses and products such as for livestock feed (green forage and pods)
for consumption, timber, wood for carvings, medicine, beverage, animal fodder, seeds for
making crafts, ornamental, bee forage, wild life habitat, crop shade, silvopasture and home
garden. The tree is popular in all parts of the tropics, being planted for avenues or as a major
shade tree in large parks and gardens, along road sides, vacant lots, churches and school
yards, and in similar spacious and open places. It also has other abilities like, fixing nitrogen
in the soil, regenerating rapidly, self prune, coppice and pollard.
2.3.7 Limitations of Samanea saman (Rain Tree)
Samanea saman has a definite seasonality. In Ghana, it has two flowering seasons which are
February to May and September to November but in areas having year round rainfall, trees
may flower in any month of the year. The sticky pods and leaf litter mess up the surroundings
when tree enters the deciduous phase. Rain tree becomes vulnerable when it is windy because
of its shallow root system and this is dangerous to livestock under pasture systems. Also, the

30
roots of the tree causes damage to where it is planted especially when it is grown along roads,
pavements and parking lots. Another problem with the rain tree is that its large size and
massive branching causes inconvenience to human and agricultural activities. Finally, rain
tree can become a pest and nuisance as it sometimes grows at places where it is not wanted
(Staples and Elevitch, 2006).
2.4 Haematological Data and their Relevance in Animal Studies
An analysis of haematological parameters of chickens is vital for the diagnosis of various
pathological and metabolic disorders. Blood analysis is performed as a diagnostic tool to
assess the health status of humans or animals. Any haematological changes observed through
the analysis are used to determine the body status or health condition, metabolic profile,
production patterns and to assess the impact of environmental, nutritional and pathological
stresses on the animal. Haematological parameters provide valuable information on the
immune status of animals (Kral and Suchy, 2000) as well as serve as indicators of
physiological state of birds (Castagliulo et al., 1996; Sarker et al., 1996; Chowdhury et al.,
2005). Such information, apart from being useful for diagnostic and management purposes,
could equally be incorporated into breeding programmes. Conducting haematological studies
helps to determine the normal physiological values (Table 2.8) under local conditions for
proper management, feeding, breeding, prevention and treatment of diseases.
Studies of haematological parameters in birds show that they are influenced by some factors
such as age, sex, season and nutrition. Oyewale and Ajibade (1990) and Pavlak et al. (2005)
observed that the PCV and Hb values tend to be higher in males than in females in turkeys
and pigeons. Packed cell volume (PCV), haemoglobin concentration (Hb) and red blood cell
count (RBC) have been reported to increase with age in chickens (Islam et al., 2004). Table

31
2.8 shows normal values of haematological parameters of chickens as provided by Jain
(1993).
Table 2.8: Normal blood values for the chicken (Gallus gallus domesticus)
ERYTHROCYTIC SERIES LEUKOCYTIC SERIES
Parameters Range Mean Parameters Range Mean
Erythrocytes (x106/l) 2.5-3.5 3.0 Leukocytes /l 12,000-30,000 12,000
Haemoglobin (g/dl) 7.0-13.0 9.0 Heterophil (band) Rare -
PCV (%) 22.0-35.0 30.0 Heterophil (mature) 3,000-6,000 4,500
MCV (fl) 90.0-140.0 115.0 Lymphocyte 7,000-17,500 14,000
MCH (pg) 33.0-47.0 41.0 Monocyte 150 - 2,000 1,300
MCHC (%) 26.0-35.0 29.0 Eosinophil 0-1,000 400
Reticulocytes (%) 0-0.6 0.0 Basophil Rare -
ESR (mm)* 3.0-12.0 7.0
RBC size (m) 7.0x12.0 % distribution
Other data Parameters Range Mean
Thrombocytes (x103/l) 20.0-40.0 30.0 Heterophil 150-400 28.0
Icterus index (units) 2-5 2 Lymphocyte 45.0-70.0 60.0
Plasma proteins (g/dl) 4.0-5.5 4.5 Monocyte 5.0-10.0 8.0
Fibrinogen (g/dl) 0.1-0.4 0.2 Eosinophil 1.5-6.0 4.0
Erythrocytes life span
(days)
20-35 days Basophil rare -
ESR determined after 1 hour at 45* angle
Source: Jain (1993)
Jain (1993) reported that many factors influence the composition of blood drawn from
animals, namely, time of day, genetic factors (breed or strain), age, sex, nutrition,
environmental conditions, physiological status, capillary or heart blood, anaesthesia
and type of anaesthetics and the animal‟s state of excitement. Similar reports have been
provided by Sanni et al. (2000) and Piccione et al. (2001, 2005) that haematological
parameters are also influenced by diurnal fluctuations or changes in daily physical and
metabolic activities. The mean haematological values of RBC, Hb and erythrocyte
sedimentation rate (ESR) of birds vary among the various species and that other factors
including breed, sex and the nutrition of the bird also affects the RBC counts (Sturkie, 1965).

32
CHAPTER THREE
3.0 MATERIALS AND METHODS
3.1 Location and Duration of the Project
Two studies were conducted at the Poultry Section of the Department of Animal Science of
the Faculty of Agriculture, Kwame Nkrumah University of Science and Technology
(KNUST), Kumasi for a total period of 8 weeks each to determine the nutritive value of
Samanea saman seed meal and Samanea saman whole pod meal, respectively. The first
experiment using the Samanea saman seed meal (seeds only) was carried out from
March to May, 2010. Mean annual rainfall of 1100 mm and mean monthly temperature of
34.0o
C were recorded during this period. The second experiment using Samanea saman
whole pod meal (containing pods and seeds) was also carried out from February to
April, 2011 with mean annual rainfall of 1600 mm and mean monthly temperature of 33.33o
C (Ghana Agro-Meteorological Station, 2011).
3.2 Sources of Samanea saman Seeds, Whole Pods and Processing Method
Whole pods of Samanea saman were obtained from trees growing on the KNUST campus.
The seeds were removed from some of the dried whole pods by beating the whole pods with
a stick and manually extracting the seeds. Whole pods and seeds were further sun dried
separately to facilitate easy milling and also prevent samples from getting mouldy. The whole
pods and seeds were then milled separately with a hammer mill to produce the meals,
respectively.
3.3 Chemical Analysis
The chemical compositions of the ground seeds, whole pods and diets (dry matter, crude
protein, ether extract, ash and crude fibre) were carried out using the standard procedures of
the Association of Official Analytical Chemists (AOAC, 1990). Dry matter of the seeds and

33
whole pods were determined by oven drying at 110o
C for 24 hours until constant weight was
attained. The crude protein contents of triplicate (100 mg) samples of Samanea saman seed
and whole pod meals were determined using the Kjeldahl method. Ether extract (fat) and
Weende crude fibre were determined according to AOAC (1990) standard methods. The ash
contents of both samples were obtained after heating triplicate 10g samples in a furnace at
500o
C for 24 hours. NDF, ADF contents of the seed and whole pod meals were determined
using the Van Soest et al. (1991) method. The mineral contents were determined by the
procedures outlined by AOAC (1990). Nitrogen Free Extract (NFE) was determined using the
equation, Nitrogen Free Extract (NFE) = 100 – (% ether extract + % crude protein + % crude
fiber + % ash + % moisture). The metabolisable energy (ME) contents of the Samanea saman
seed and whole pod meals were estimated using the formula indicated by Pauzenga (1985):
ME (kcal/kg) = (37 x % protein) + (81.8 x % fat) + (35.5 x % Nitrogen Free Extract).
3.4 Experimental Diets
Four experimental diets each for seed meal and whole pod meal (Table 3.1 and Table 3.2)
were formulated: a control diet with no Samanea saman seed or whole pod meals and three
other diets containing processed Samanea saman seed or whole pod meals each incorporated
at levels of 20 g, 40 g and 60 g kg-1
diet to replace fish meal and soyabean meal.
3.5 Experimental Animals, Experimental Design and Management
Three hundred (300) unsexed day old Cobb commercial strains of broiler chickens were used
for each study. The chicks were obtained from a commercial hatchery and reared in a
common brooder house for the first 28 days (0 - 4 weeks). One hundred (100) watt electric
bulbs were used to provide continuous light and heat during the brooding stage. A broiler
starter diet with 226.1 g crude protein kg-1
diet and metabolisable energy (ME) of 2954 kcal
kg-1
were fed to the bird‟s ad-libitum. Birds had free access to water. At 28 days of age
(before the commencement of the feeding trial), two hundred and forty birds (240) each were

34
randomly selected and divided into four groups, each group constituting a treatment with
three replicates per treatment in a completely randomised design (CRD). Each replicate group
of twenty birds (10 males and 10 females) each were maintained in a deep litter pen. The two
feeding trials lasted for 28 days each and each of the four groups of birds received one of the
dietary treatments for 4 weeks. Feed and water were provided ad-libitum. The compositions
of the two experimental broiler diets and their chemical compositions are presented in Tables
3.1 and 3.2.
Routine and periodic management practices such as vaccination, drug administration and
maintenance of cleanliness within and outside the poultry pens were carried out. Birds were
vaccinated against Gumboro, Newcastle disease and medicated for Coccidiosis at 3 days of
age and again at third week using Sulfadimidine Sodium 33% (Bremer Pharma GMBH,
Germany) via the drinking water.
Table 3.1: Composition of Experimental Broiler Diets (seed meal)
TREATMENTS: Samanea saman seed meal (SSSM)
Ingredients (g kg-1
) Control (T1) 20g (T2) 40g (T3) 60g (T4)
Maize 600.00 600.00 600.00 600.00
Soyabean meal 130.00 120.00 110.00 100.00
Fish meal 160.00 150.00 140.00 130.00
Samaneasaman seed meal 0 20.00 40.00 60.00
Wheat bran 80.00 80.00 80.00 80.00
Oyster shell 10.00 10.00 10.00 10.00
Dicalcium phosphate 10.00 10.00 10.00 10.00
Vit/mineral premix*
5.00 5.00 5.00 5.00
Salt 5.00 5.00 5.00 5.00
TOTAL 1000 1000 1000 1000
Chemical Composition (g kg-1
DM)
Crude protein 226.10 220.60 215.20 209.70
Crude fibre 39.50 44.70 49.70 56.80
Ether extract 20.00 10.00 10.00 15.00
Phosphorus 7.38 7.44 7.48 7.52
Calcium 8.80 9.08 9.36 9.63
Lysine 13.06 13.15 13.19 13.24
Methionine 5.02 5.05 5.11 5.16
Cystine 3.36 3.44 3.48 3.52
ME (kcal/kg) calculated 3039.29 3009.21 2955.15 2952.27 *Premix supplied (kg
-1diet); 10,000 IU Vit A; 2000 IU Vit D3; 10 IU Vit E; 3mg Vit K; 2.5mg Riboflvin;
0.05mg Cobalamin; 5mg Panthothenic acid; 12.5mg Niacin; 175mg Choline; 0.5mg Folic acid; 2.8mg
Manganese; 0.5mg Iron; 2.5mg Zinc; 625mg Cobalt.
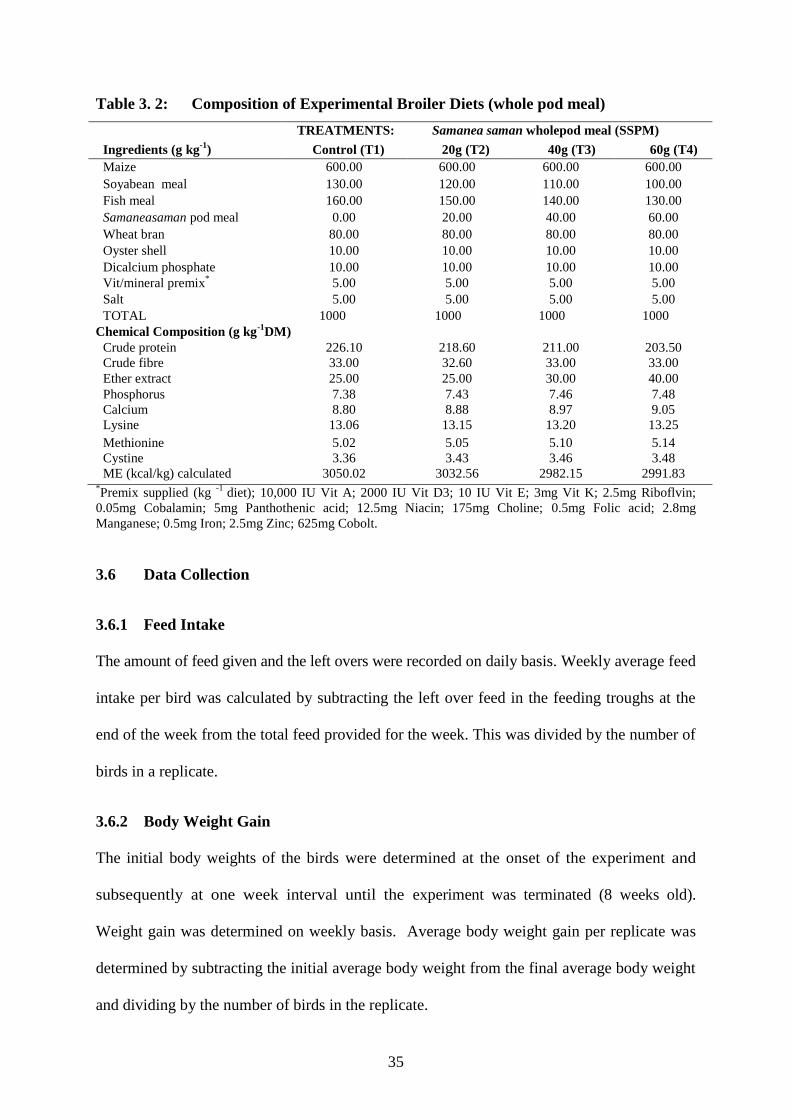
35
Table 3. 2: Composition of Experimental Broiler Diets (whole pod meal)
TREATMENTS: Samanea saman wholepod meal (SSPM)
Ingredients (g kg-1
) Control (T1) 20g (T2) 40g (T3) 60g (T4)
Maize 600.00 600.00 600.00 600.00
Soyabean meal 130.00 120.00 110.00 100.00
Fish meal 160.00 150.00 140.00 130.00
Samaneasaman pod meal 0.00 20.00 40.00 60.00
Wheat bran 80.00 80.00 80.00 80.00
Oyster shell 10.00 10.00 10.00 10.00
Dicalcium phosphate 10.00 10.00 10.00 10.00
Vit/mineral premix*
5.00 5.00 5.00 5.00
Salt 5.00 5.00 5.00 5.00
TOTAL 1000 1000 1000 1000
Chemical Composition (g kg-1
DM)
Crude protein 226.10 218.60 211.00 203.50
Crude fibre 33.00 32.60 33.00 33.00
Ether extract 25.00 25.00 30.00 40.00
Phosphorus 7.38 7.43 7.46 7.48
Calcium 8.80 8.88 8.97 9.05
Lysine 13.06 13.15 13.20 13.25
Methionine 5.02 5.05 5.10 5.14
Cystine 3.36 3.43 3.46 3.48
ME (kcal/kg) calculated 3050.02 3032.56 2982.15 2991.83 *Premix supplied (kg
-1 diet); 10,000 IU Vit A; 2000 IU Vit D3; 10 IU Vit E; 3mg Vit K; 2.5mg Riboflvin;
0.05mg Cobalamin; 5mg Panthothenic acid; 12.5mg Niacin; 175mg Choline; 0.5mg Folic acid; 2.8mg
Manganese; 0.5mg Iron; 2.5mg Zinc; 625mg Cobolt.
3.6 Data Collection
3.6.1 Feed Intake
The amount of feed given and the left overs were recorded on daily basis. Weekly average feed
intake per bird was calculated by subtracting the left over feed in the feeding troughs at the
end of the week from the total feed provided for the week. This was divided by the number of
birds in a replicate.
3.6.2 Body Weight Gain
The initial body weights of the birds were determined at the onset of the experiment and
subsequently at one week interval until the experiment was terminated (8 weeks old).
Weight gain was determined on weekly basis. Average body weight gain per replicate was
determined by subtracting the initial average body weight from the final average body weight
and dividing by the number of birds in the replicate.

36
3.6.3 Feed Conversion Ratio
Feed conversion efficiency was estimated weekly as the weight of feed consumed per unit
body weight gain for individual replicates of each dietary treatment.
3.6.4 Mortality
Daily records of mortality were taken and expressed as percentage at the termination of the
experiment. All dead chickens were sent to the Veterinary Laboratory at Amakom in Kumasi
for post-mortem examination.
3.6.5 Carcass Yield and Organs Weight
At the end of each study, four birds (two males and two females) from each replicate were
randomly selected for carcass evaluation and organs weight. Birds were starved of feed for
about 14 hours to empty their crops, weighed individually, slaughtered, defeathered and
eviscerated. Carcass dressing percentage was calculated from the eviscerated weight and live
weight. Also, individual weights of the organs namely, the gizzard, heart, liver and intestine
were measured.
3.6.6 Blood Cellular and Biochemical Indices
Blood collection from the birds was carried out at the 6th
and 8th
weeks of age of each
study. Four birds each were randomly selected and bled via their wing veins using sterile gauge
48 needles and syringes. About 5 ml of blood was collected into forty eight sterilized glass
tubes/bottles each and analysed to determine the haemoglobin (Hb) concentration,
packed cell volume (PCV) or haematocrit (HCT), red blood cell (RBC), white blood cell
(WBC), mean cell volume (MCV), mean cell haemoglobin (MCH), mean cell haemoglobin
concentration (MCHC) and Total Protein (T.protein), Total Cholesterol (T.Chol),
Triglycerides (TGS), High Density Lipoprotein (HDL), Low Density Lipoprotein (LDL)

37
using auto analyzer called Sysmex KX-21N (Japan) and Flexor Junior (Netherlands),
respectively in the estimation.
3.7 Economics of Production
Economics of production was based on the feed cost per kilogram diet and feed cost to
produce a kilogram (kg) body weight. Feed cost per kilogram for each of the experimental
diets was estimated based on the prevailing prices of the ingredients at the time of the trial.
Feed cost to produce a kg body weight was calculated as the product of the feed cost per kg
and feed conversion efficiency for individual dietary treatments. The cost of Samanea saman
pods collected was estimated as GH¢ 3 per 100 kg of sack and then the Samanea saman
seeds removed from the pods manually was also GH¢ 8 per 100 kg of sack.
3.8 Statistical Analysis
The dietary treatment effects for all the variables measured were analysed using Analysis of
Variance (ANOVA) procedure. The data were subjected to regression and correlation analysis
to show the effect of including SSSM and SSPM on performance. Differences between means
were determined by the use of the Duncan‟s multiple range tests (Steel et al., 1997).

38
CHAPTER FOUR
4.0 RESULTS AND DISCUSSION
4.1 EXPERIMENT ONE : Samanea saman Seed Meal (SSSM) Feeding Trial
4.1.1 Chemical Compositions of Samanea saman Seed and Whole Pod Meals
The detailed analytical data for Samanea saman seed and pod meals, in comparison with
those of fish meal and soyabean meal are presented in Table 4.1.
Table 4.1: Chemical Composition of Samanea saman Seed and Whole Pod Meal1
Parameters (g kg-1
DM) SSSM SSPM FM3
SBM4
Dry matter (DM) 870.00 770.00 920.00 900.00
Crude protein (CP) 267.00 163.00 655.00 440.00
Ash 25.00 25.00 25.00 25.00
Ether extract (EE) 11.50 10.00 41.00 10.00
Crude fibre (CF) 126.30 93.00 10.00 73.00
Neutral detergent fibre (NDF) 53.00 24.00 - -
Acid detergent fibre (ADF) 37.00 23.00 - -
Hemicellulose 16.00 1.00 - -
Calcium 13.90 4.20 37.30 3.00
Phosphorus 2.00 1.40 24.30 6.50
Potassium 18.10 19.90 9.00 21.10
Magnesium 8.40 6.70 2.40 2.90
Sodium 2.30 2.70 11.00 0.40
Manganese 37.80 1.50 0.01 0.03
Copper 42.00 4.00 93.00 2.30
Iron 43.30 2.00 0.22 0.14
Zinc 27.00 1.00 0.10 0.05
Metabolizable energy (kcal/kg)2 3276.54 3345.20 3407.23 3457.90
1. The values are the averages of three samples
2. Estimated using the formula of Pauzenga (1985)
3. Fish meal (NRC, 1994)
4. Soyabean meal (NRC, 1994)
Samanea saman seed meal (SSSM), which comprised of seeds only, contained more
protein, ether extract, crude fibre, NDF, ADF, hemicellulose, calcium, phosphorus,
magnesium, manganese, copper, iron and zinc but had similar ash and less sodium and
potassium compared to values obtained for Samanea saman whole pod meal (SSPM),
which comprised of both pods and seeds.

39
In comparison with fish meal, SSSM contained less crude protein, Ca, P, Na, and Cu but
had more ether extract, crude fibre, K, Mg, Fe, Mn and Zn. SSSM in comparison with
soyabean meal (SBM), contained less crude protein, P, K, Cu but had more ether extract,
crude fibre, Na, Ca, Mg, Fe, Mn and Zn.
With regards to SSPM, it contained less crude protein, ether extract, P, Na, Ca and Cu
than fish meal but its contents of crude fibre, K, Mg, Fe, Mn and Zn were higher. Also,
SSPM when compared with soyabean meal, had less crude protein, ether extract, P, K and
Cu but recorded higher values for crude fibre, Na, Ca, Mg, Fe, Mn and Zn.
One of the most important variables considered in animal feed formulation programme is
a high crude protein value. The CP value for the Samanea saman seed meal (267.0 g kg-1
DM) is higher than the values of 230.0 g kg-1
DM and 224.0 g kg-1
DM reported by Olumu
and Offiong (1980) and Akwaowo et al. (2000), respectively but lower than the value of
305.0 g kg-1
DM reported by Ladeji et al. (1995). Gohl (1981) and Duke (1983) reported
crude protein values of 316.0 g kg-1
DM and 128.0 g kg-1
DM respectively, for SSSM and
whole pod meal.
Crude fibre represents the indigestible portion of plant materials and this is composed of a
combination of lignin, cellulose, hemicelluloses, pectin and gum. Fibre comprises a complex
variety of chemical compounds which are not digested by the endogenous secretions of the
digestive tract of non-ruminants. Dierrick et al. (1990) noted that besides the positive
contribution of fibre fermentation in the hind gut to energy supply in non-ruminants,
considerable and mainly negative effects of dietary fibre on the use of other components of
the diet, with subsequent effect on performance, cannot be ignored. Duke (1983) and
Akwaowo et al. (2000) reported CF value of 145 g kg-1
DM and 101.0 g kg-1
DM
respectively are in agreement with the values of 126..30 g kg-1
DM and 93.0 g kg-1
DM

40
for the seed meal and whole pod meal, respectively obtained in the present studies,
while Gohl (1981) also recorded a value of 140 g kg-1
DM for seed and 145 g kg-1
DM for whole pod meals. The crude fibre content of feed is negatively correlated to
digestibility in that as the CF content increases the digestibility decreases (Duke, 1983). The
ether extract content of the SSSM was high with a value of 11.5 g kg-1
DM and this also
contributed to the high energy content in the diet.
4.1.2 Growth Performance of Broiler Chickens Fed Diets Containing Samanea saman
Seed Meal
Data on the general performance of the broiler chickens fed diets containing Samanea saman
seed meal are summarized in the Table 4.2.
4.1.2.1 Feed Intake
The dietary level of Samanea saman seed meal had a significant (P < 0.01) influence on the
feed intake of birds. There was a trend towards a decrease in feed intake as the amount of
dietary Samanea saman seed meal increased. Birds on the control diet (T1) had the highest
feed intake which differed significantly from the others except those fed diets containing 20
g Samanea saman seed meal kg-1
DM (T2). The prediction equation of regressing feed
intake on Samanea saman seed meal in the diet :is given by: Y (feed intake) = 4.263 - 0.501 X
(r = -0.98; P < 0.01), where X is the level of Samanea saman seed meal in the diet.
Many factors affect feed consumption in animals including physical texture, presence
of anti-nutritive factors, dietary energy and protein contents. In the present study, the
low amounts of feed consumed by birds fed with the 40 g kg-1
DM and 60 g kg-1
DM Samanea
saman seed meal containing diets might be attributed to the presence of anti-nutritional factors,
such as tannins and saponins reported to be contained in Samanea saman seed meal thus
leading to reduced feed palatability and intake (Donkoh et al., 2012).

41
Table 4.2: Effect of Samanea saman seed meal on broiler chicken’s growth
performance from 28 -56 days of age and organ weights at 56 days of age.
Parameters Level of Samanea saman seed meal
Growth performance Control
(T1)
20g (T2) 40g (T3) 60g (T4) SEM r values and
level of
significance
Total feed intake (kg) 3.70a
3.30a
2.89b
2.70b
0.062 -0.98**
Initial body weight (kg) 1.20 1.20 1.23 1.23 0.015 -0.10, NS
Final body weight (kg) 3.02a
3.09a
2.43b
2.29c
0.070 -0.80 **
Total weight gain (kg) 1.82a
1.89a
1.20b
1.06c
0.066 -0.88 **
Feed:gain 2.03a
1.75b
2.41c
2.55d
0.083 0.80 **
Mortality (%) 2 0 2 3 - -
Carcass Characteristics
Carcass yield (% of LBW)
82.65a
81.92a
79.96b
76.95c
0.639
-0.89 **
Organ weights (kg)
Gizzard 0.04 0.04 0.05 0.04 0.003 0.08, NS
Heart 0.01 0.01 0.02 0.02 0.005 0.27, NS
Intestine 0.12 0.13 0.13 0.12 0.003 -0.31, NS
Liver 0.05 0.05 0.05 0.04 0.003 -0.45, NS
Economy of gain
Cost/kg feed, (GH¢) 0.95 0.94 0.93 0.92 1.695 NS
Cost of feed/kg weight gain,
(GH¢)
1.94a
1.65a
2.24b
2.35c
0.139 **
a, b, c, d Means within a row with different superscripts are significantly different ( P< 0.01)
SEM = standard error of means.
r = correlation coefficient.
LBW = live body weight.
GH¢ = Ghana cedis
** = P< 0.01
NS = non – significant ( P> 0.05)
According to Bate-Smith (1973) and Liener (1989), the presence of tannins and saponins do
affect feed intake and digestion. The present results are in agreement with the reports of
Cheeke (1971), Elkin et al. (1990), Douglas et al. (1993) and Knox and McNab (1995),
where tannin and saponins were reported to have adversely affected feed intake. Phenolic
compounds, including tannins, reportedly affect feed intake because of unpalatability.
Significant depression of feed intake by simple phenolics has been observed on rats (Jung and
Fahey, 1983; Donkoh et al., 2002). Also, saponins reportedly affects feed intake because of
unpalatability, effects of saponins on rate of digesta passage and irritation of membrane of the
mouth and digestive tract (Cheeke et al., 1978).

42
4.1.2.2 Weight Gain and Feed Conversion Ratio
Broiler chickens, prior to the start of the feeding trial, had similar (p > 0.05) body weights
(Table 4.2). However, increasing the level of Samanea saman seed meal in the diet decreased
the body weight gains during the four - week feeding period. Body weight gain of birds fed the
control diet (T1) and 20 g kg-1
DM (T2) experimental diet showed no significant (p > 0.05)
differences between them but differed significantly (p < 0.01) from those fed the 40 g kg-1
DM (T3) and 60 g kg-1
DM (T4) SSSM diets. Comparatively, broiler chickens fed the
Samanea saman seed meal diets, except those on the 20 g kg-1
DM Samanea saman seed meal
diet, weighed significantly (p < 0.01) less compared to the control diet devoid of Samanea
saman seed meal. The regression of body weight gain on the level of Samanea saman seed
meal in the diet yielded the equation:Y(weight gain) = 2.238 – 0.298 X (r = -0.88; p < 0.01).
Consequently, any slight increase in the level of Samanea saman seed meal in broiler
chicken diets above 20 gkg-1
DM may not support growth and thus reduce growth
performance.
A significant (p < 0.05) improvement in feed conversion ratio (feed : gain) was also
obtained as a result of inclusion of SSSM in diets of broiler chickens with birds on the 20 g
SSSM kg-1
diet recording the best efficiency of feed utilization. Regression of the
efficiency of feed utilization against the level of SSSM yielded the linear equation: Y (feed
: gain) = 1.886 + 0.0706 X (r = 0.80; p < 0.01).
The inferior growth rates and feed utilisation observed among birds fed diets containing
higher amounts of SSSM may be due to decreased feed intake and inability of the birds to
utilize the diets as a result of poor digestion and absorption of nutrients probably due to the
presence of the anti-nutritional factors, tannins and saponins. Similar trends of decreased
growth performance linked to contents of anti-nutritive factors have been reported by Ahmad
et al. (2000); Esonu et al. (2000) and Kumar et al. (2003). The results obtained in the present

43
study are in agreement with those of other tannin (Okai et al., 1984; Atuahene et al., 1989;
Douglas et al., 1993; Knox and McNab, 1995; Donkoh et al., 2002; Donkoh et al., 2012) and
saponin - related (Cheeke, 1971; Atuahene et al., 1998) studies with a number of animal
species. These studies indicate that excessive intake of tannins and saponins can reduce animal
performance and well – being. However, a study by Chung et al. (1998) indicates that tannins
do neither inhibit food consumption nor digestion but rather posses the potential to decrease
the efficiency of converting the absorbed nutrients to new body stores. Phenolic compounds,
including tannins, bind with enzymes and also form nutritionally unavailable polymers with
dietary protein (De Lange, 2000; Azam-Ali and Judge, 2001). In addition, tannins if ingested
in excessive amounts inhibit the absorption of minerals such as iron and calcium (Brune et al.,
1989). Tannins are metal ion chelators, and tannin – chelated metal ions are not bioavailable.
The reduced performance of birds fed diets containing high amounts of SSSM might also be
due to the presence of saponins. Saponins may inhibit a number of cellular enzymes (Cheeke,
1971), because saponins are not appreciably absorbed, their effects on enzymes would most
likely to be in the digestive tract. Saponins form bonds with protein (Livingston et al., 1977)
and therefore could conceivably bind digestive enzymes. These defects ultimately might have
affected growth and the efficiency of feed conversion into tissue. It may also be suggested that
the effects on feed intake may be one of the mechanisms by which tannins and saponins
depress growth. Modern broiler chickens must consume large quantities of food in order to
attain maximal growth. However, the reduction in feed intake induced by the anti-nutritional
factors (tannins and saponins) reported to be contained in Samanea saman seed meal might
have created deficiencies of most, if not all nutrients essential for optimum growth
performance, which is generally assumed to be a direct reason for the growth depression
(Donkoh et al., 2012).

44
The reduced performance of the broiler chicken might also be attributed to the high fiber
content of the Samanea saman seed meal containing diets particularly for dietary treatments
T3 and T4. High dietary fibre is reported to have negative effect on protein and energy
digestibility with a resultant effect on growth performance (Chabeauti et al., 1991; Noblet et
al., 1993). Therefore, the poor growth performance and feed utilisation among broiler
chickens fed highest level of Samanea saman seed meal might be due to the reduced amount
of protein and other essential nutrients necessary for optimum growth.
Finally, the results of the present study are in agreement with that of other recent studies
(Schiavone et al., 2008; Donkoh et al., 2012) which indicate that products containing tannins
included at low dosages in the diet, such as with the 20 g kg-1
SSSM diet used in the present
study, can improve performance.
4.1.2.3 Mortality
Mortality of the broiler chickens was not significantly affected by the dietary treatments. A
total of seven (7) mortalities were recorded during the experimental period (Table 4.2). Out of
this, two each occurred among birds fed the SSSM - free diet and 40 g kg-1
SSSM diet, while
three occurred among birds fed the 60 g SSSM kg-1
diet. No mortality was recorded among
birds fed the 20 g kg-1
SSSM diet. Post - mortem autopsies indicated no specific cause of death
attributable to inclusion of SSSM in the diets.
4.1.2.4 Carcass Characteristics and Organ Weights of Broiler Chickens
Correlation coefficients of -0.89, -0.08, -0.40, -0.27, -0.31 and -0.45 were obtained
between SSSM level and percentage carcass yield, percentage gizzard, percentage heart,
percentage intestine and percentage liver, respectively (Table 4.2). These values, with the
exception of the percentage carcass yield, are not significant indicating that there was
little association between SSSM levels and these parameters. The result is in contrast with

45
the report of Ewuola et al. (2003) linking the hypertrophy or hypotrophy of these organs to
the presence of anti-nutritive factors. The lower percentage carcass yield recorded for
broiler chickens fed on diets which contained various levels of SSSM were mainly a
reflection of the lower dressed weight and dressing percentage. The results of this present
study and that of Olorunsanya et al., 2010, indicates that the level of toasted Albizia
lebbeck seed meal is inversely proportional to dressed weight and dressing percentage.
4.1.2.5 Blood Cellular and Biochemical Indices of Broiler Chickens
The effects of variation in the dietary level of SSSM on blood cellular and biochemical
indices of the broiler chickens are also shown in Table 4.3.
In this trial, no significant effect of dietary SSSM levels was recorded in all the blood
components measured. These values, which were all within the reported ranges for
broiler chickens indicate that the inclusion of SSSM had little influence on these blood
parameters. Correlation coefficients of r = 0.46, 0.11, 0.40, 0.38, 0.19, 0.31 and -0.10
were obtained between SSSM levels and the blood parameters RBC, WBC, HB, PCV,
MCH, MCHC and MCV, respectively.

46
Table 4.3: Effect of dietary level of Samanea saman seed meal on the blood cellular and
biochemical indices of broiler chickens at 56 days of age.
Parameters Level of Samanea saman seed meal
Haematological
Indices
Control
(T1)
20 g (T2) 40 g (T3) 60 g (T4) SEM r values and level
of significance
RBC (3x10⁶/l) 2.467 2.300 2.283 2.308 0.076 0.46, NS
WBC (mm3x10
3) 271.33 264.73 264.42 265.00 3.527 0.11, NS
HB (g/dl) 9.617 9.408 9.225 9.258 0.202 0.40, NS
PCV (%) 31.325 31.117 30.275 30.617 0.786 0.38, NS
MCH (pg) 39.550 39.875 40.025 39.733 0.731 0.19, NS
MCHC (%) 30.442 30.075 30.267 30.133 0.190 0.31, NS
MCV (fl) 130.31 132.78 132.08 131.67 1.887 -0.10, NS
Blood chemistry
T.Protein g l-1
31.53 29.43 26.62 31.12 1.491 -0.16, NS
Albumen g l-1
16.36 16.23 14.18 15.77 0.549 -0.37, NS
Globulin g l-1
15.15 13.18 12.42 15.32 1.129 -0.01, NS
T.CHOL (mmoll-1) 2.99 2.83 2.52 2.77 0.173 0.10, NS
TGS (mmoll-1) 0.82 0.79 0.72 0.88 0.091 0.09, NS
HDL (mmoll-1) 1.24 1.30 1.21 1.16 0.073 -0.33, NS
LDL (mmoll-1) 1.14 1.09 0.95 0.97 0.102 -0.45, NS
HB =Haemoglobin, PCV = Packed Cell Volume or HCT= haematocrit, RBC = Red Blood Cell, WBC = white
blood cell, MCV = mean cell volume, MCH = mean cell haemoglobin, MCHC = mean cell haemoglobin
concentration, T.protein = Total Protein, T.Chol = Total Cholesterol, TGS = Triglycerides, HDL =High
Density Lipoprotein, LDL = Low Density Lipoprotein
SEM =standard error of means.
r = correlation coefficient.
NS = non – significant (P > 0.05).
Blood cellular and biochemical indices of chickens provide valuable information on the
immune status of animals (Kral and Suchy, 2000) as well as serve as indicators of
physiological state of birds. Consideration and investigation of the physiological
mechanisms involved in nutritional studies may indicate innovative approaches to
reduce the adverse effect of non-conventional feedstuffs, such as SSSM which contain
anti-nutritive factors.
4.1.2.6 Economics of Production
The cost of a kilogram of feed declined as more SSSM was added to replace fish meal and
soyabean meal (Table 4.2). Of considerable interest to poultry producers in areas of the world

47
where SSSM is available, is the observation that feed cost declined as more SSSM was added
to replace fish meal and soyabean meal with the highest amount of SSSM in the diet being
cheapest (Table 4.2). Feed cost was reduced by about GH¢ 30.00 per tonne when the highest
amount of SSSM was incorporated in the broiler diets. This was primarily due to the reduction
in fish meal and soyabean meal use; which prices were almost two to three times the price of
SSSM.
Feed cost per kilogram live weight gain was lowest for the broiler chickens on the 20 g SSSM
kg-1
diet and highest for the 60 g SSSM kg-1
diet. There was a significant (p > 0.05) difference
among the dietary treatments however, there was no difference between the control and 20 g
SSSM kg-1
diets. The highest cost of feed per kg weight gain registered by broiler chickens on
the 60 g SSSM kg-1
diet may be attributed to poorer efficiency of feed utilization. Feed
accounts for up to 80% of the costs in production of poultry in Ghana and other developing
countries (Adesehinwa, 2007). It is therefore essential that the dietary SSSM level that will
optimize profit be used in feed formulation.

48
4.2 EXPERIMENT TWO : Samanea saman Whole Pod Meal (SSPM) Feeding Trial
A summary of the growth performance and carcass characteristics of the bird population for
experiment two is shown in Table 4.4.
Table 4.4: Effect of Samanea saman pod meal on broiler chickens performance from 28
-56 days of age and organ weights at 56 days of age.
SEM =standard error of means.
r = correlation coefficient.
NS = non –significant (P > 0.05).
LBW=live body weight.
GH¢=Ghana cedis
4.2.1 Feed Intake
The results for the Samanea saman whole pod meal (SSPM) feeding trial indicated no
significant (P > 0.05) effects of dietary treatments on feed intake (Table 4.4). Average feed
consumption varied between diets, but were not statistically different. The non-significant
effect of SSPM inclusion in the diet on feed consumption suggests broiler chickens will
Parameters Level of Samanea saman pod meal
Growth performance Control
(T1)
20g (T2) 40g (T3) 60g (T4) SEM r values and
level of
significance
Total Feed intake (kg) 3.61 3.59 3.46 3.71 0.120 0.10, NS
Initial body weght (kg) 1.20 1.21 1.23 1.23 0.111 -0.12, NS
Final body weight (kg) 2.93 2.90 2.80 2.80 0.132 -0.17, NS
Total Weight gain (kg) 1.73 1.69 1.57 1.57 0.160 -0.19, NS
Feed:gain 2.09 2.12 2.20 2.36 0.181 0.31, NS
Mortality (%) 5 5 5 5 - -
Carcass characteristics
Carcass yield (% of LBW)
82.09
82.94
83.34
83.53
1.088
0.32, NS
Organ weights (kg)
Gizzard 0.045 0.046 0.045 0.049 0.002 0.04, NS
Heart 0.013 0.012 0.012 0.011 0.001 -0.50, NS
Intestine 0.122 0.117 0.104 0.106 0.003 -0.47, NS
Liver 0.052 0.045 0.046 0.044 0.002 -0.57, NS
Economy of gain
Cost/kg feed, GH¢ 1.26 1.23 1.21 1.18 3.91 0.373, NS
Cost of feed/kg weight gain,
GH¢
2.63 2.61 2.66 2.79 0.232 0.634, NS

48
consume diets containing up to 60 g SSPM kg-1
. Samanea saman pod contains saponins
which may limit feed intake but have no other adverse effect (Olorunsanya et al., 2010).
However, Samanea saman pod reportedly contains sweet sticky pulp (Morrison et al., 1996;
Craig et al., 2006) and this among other factors, might have contributed to the similar feed
consumption among birds on the other experimental dietary treatments SSPM contrary to the
decline in feed intake among birds fed the SSSM diets as observed in Experiment 1 and
which effects was attributed to the presence of bitter anti-nutritional factors contained in the
SSSM. Tannins are bitter plant polyphenols and its presence in diets makes it unpalatable
(Donkoh et al., 2012).
4.2.2 Weight Gain and Feed Conversion Ratio
The average chick weights, after selection at 4 weeks of age for birds reared under the
various dietary treatments, were similar (p > 0.05). Contrary to the results of the SSSM
feeding trial (Experiment 1), no significant (p > 0.05) differences in body weight gain and
feed conversion efficiency of birds were observed during the period of 4 to 8 weeks for the
SSPM feeding trial (Table 4.4). Even though there was a trend towards decreasing body
weight gain and efficiency of feed utilisation, there were no substantial differences in mean
body weight gain and feed conversion efficiency between birds fed the control diet and the
SSPM - containing diets. Comparing the performance of birds fed the three SSPM -
containing diets, the highest rate of gain, though not significant, was observed in birds fed the
20 g SSPM kg-1
diet.
4.2.3 Mortality
No health - related problems were observed during the experiment that could be attributed to
the various dietary treatments. In all a total of twelve (12) mortality cases were recorded
during the experimental period (Table 4.4). The mortality values showed no consistent trends
that could be attributed to SSPM. Out of the twelve (12) mortality cases, three (5%) each

49
occurred among birds fed on the control and the three SSPM – containing diets. Post-mortem
autopsies indicated no specific causes for the deaths.
4.2.4 Carcass Characteristics and Organ Weights of Broiler Chickens
Similar to the body weight gain and feed conversion efficiency, the carcass yields of broiler
chickens fed diets with or without SSPM were similar (p > 0.05). At the termination of the 4 -
week study, examination of some organs (gizzard, liver, heart and intestine) obtained from all
sacrificed birds revealed no macroscopic deviation from the normal in terms of gross tissue
changes and that there were no significant differences among them. The results from the
carcass evaluation relate well with those obtained in performance characteristics and it
was observed that superior values were obtained for all the parameters evaluated. Also, there
were no significant dietary effects on the gizzard (r = 0.04), liver (r = -0.57), heart (r = -0.50)
and intestinal (r = -0.47) weights of the broiler chickens. Since all correlations observed were
weak and related to relatively small birds populations, their interpretation may be limited.
4.2.5 Blood Cellular and Biochemical Indices of Broiler Chickens
Blood cellular and biochemical indices reveal the physiological responses of animals to their
internal and external environments, which include feeds and feeding (Esonu et al., 2001). Ross
et al. (1978), for example, had reported that the hematocrit, erythrocyte and haemoglobin levels
correlate positively with dietary protein quality and amount of protein. The total serum protein
is a reflection of the protein quality of the diet fed to birds (Eggum, 1970).

50
Table 4.5: Effect of dietary level of Samanea samanpod meal on the haematological
and blood chemistry indices of broiler chicken at 56 days of age.
Parameters Level of Samanea saman pod meal
Haematological
Indices
Control
(T1)
20 g
(T2)
40 g (T3) 60 g (T4) SEM rvalues and
levelof
significance
RBC (3x10⁶/l) 2.183 2.283 2.208 2.458 0.076 -0.42, NS
WBC (mm3x10
3) 229.17 231.75 225.25 242.25 8.476 -0.38, NS
HB (g/dl) 8.917 9.217 8.783 9.600 0.286 -0.43, NS
PCV (%) 29.367 29.825 29.208 32.033 1.043 -0.28, NS
MCH (pg) 40.800 40.433 41.083 39.242 0.828 0.08, NS
MCHC (%) 30.400 31.042 30.775 30.717 0.844 -0.27, NS
MCV (fl) 133.92 130.09 134.74 130.17 1.187 0.13, NS
Blood chemistry
T.Protein g l-1
37.33 37.42 37.67 35.00 1.930 -0.26, NS
Albumen g l-1
16.58 16.17 17.25 15.42 0.890 0.19, NS
Globulin g l-1
20.75 21.25 20.42 19058 1.272 -0.26, NS
T.CHOL (mmoll-1) 3.35 3.45 3.17 3.08 0.214 0.10, NS
TGS (mmoll-1) 1.41 1.27 1.29 1.25 0.110 -0.31, NS
HDL (mmoll-1) 1.39 1.44 1.20 1.19 0.169 -0.36, NS
LDL (mmoll-1) 0.66 0.70 0.75 0.72 0.073 0.23, NS
HB =Haemoglobin, PCV = Packed Cell Volume or HCT= haematocrit, RBC = Red Blood Cell, WBC = white
blood cell, MCV = mean cell volume, MCH = mean cell haemoglobin, MCHC = mean cell haemoglobin
concentration, T.protein = Total Protein, T.Chol = Total Cholesterol, TGS = Triglycerides, HDL =High
Density Lipoprotein, LDL = Low Density Lipoprotein
SEM =standard error of means.
r = correlation coefficient.
NS = non – significant (P > 0.05).
Brown and Clime (1972) and Adeyemi et al. (2000) observed that serum biochemical
constituents are positively correlated with the quality of the diet. Agrawal and Mahajan (1980)
also reported that a significant decrease in the white blood cells, for example, is an indication of
a decline in the production of the defensive mechanism to fight infections, making the animal
more susceptible to various physiological stress resulting in poor growth incidence of diseases
and higher mortality. However, in this study herein reported, no significant (p > 0.05) effects on
blood cellular and biochemical indices of broiler chickens were evident from feeding the
SSPM.

51
All the values obtained in the present study were within the normal range of values reported
by other researchers. The normal respective range of values reported for birds for RBC,
WBC, HB, PCV, MCH, MCHC and MCV are 2.5 – 3x10⁶/l, 29.0 – 38.0%, 6.0 – 13%, 22 –
40%, 33 – 47pg, 26 – 35% and 80 – 163fl (Merck Veterinary Manual, 1986; Jain, 1993;
Awoniyi et al., 2000; Iheukwumene and Herbert, 2003). Similarly, values obtained for the
blood biochemical indices indicated no significant (p > 0.05) impact on the serum protein
(total protein, albumen, globulin) and lipids (total cholesterol, triglycerides, high density
lipoprotein and low density lipoprotein) profiles of broiler chickens fed the control and the
SSPM – containing diets, which were all within the normal range values observed by other
researchers (Kim et al., 2002; Ji et al., 2007).
From the results obtained for the organ weights and blood cellular and biochemical indices, it
appears that the effect of dietary treatments were not severe enough to offset any metabolic or
physiological conditions of the birds that would have led to reduced growth performance.
4.2.6 Economics of Production
Feed cost per kg declined as more SSPM was added to replace fish meal and soyabean meal.
The diet which contained higher amounts of SSPM was cheaper that is, GH¢ 1.26, GH¢ 1.23,
GH¢1.21 and GH¢ 1.18 per kg for dietary treatments 60, 40, 20 and 0 g SSPM kg-1
,
respectively. This was solely due to the price disparities between SSPM and the two major
protein feed ingredients, fish meal and soyabean meal. At the time of the trial, SSPM was
estimated to cost an average of GH¢ 0.6 while fish meal and soyabean meal cost about GH¢
2.0 and GH¢ 1.0 per kg, respectively. The cost of feed to produce a kilogram (kg) live weight
gain, was, however, lowest for birds on the dietary treatment which contained 20 g SSPM kg-
1.

52
CHAPTER FIVE
5.0 CONCLUSION AND RECOMMENDATIONS
5.1 CONCLUSION
The study indicates that both SSSM and SSPM are fairly good sources of nutrients for
broiler chickens.
It is also clear that the addition of SSSM at high levels in diets negatively affects performance
of broiler chickens as shown by decreased growth performance. However, analysis of
productive parameters measured in both studies indicated that dietary SSSM and SSPM up to
20 g kg-1
had a positive economic benefits and that partial replacement of other protein
sources (fish meal and soyabean meal) with SSSM or SSPM was possible without any
adverse effects on performance.
Finally, it is worth noting that, the inclusion of either SSSM or SSPM in the diets of broiler
chickens even at relatively low, but safe concentrations would help reduce the dependence on
conventional feedstuffs, such as fish meal and soyabean meal (which man also consumes),
especially in areas of the world where these feedstuffs are scarce and expensive.
5.2 RECOMMENDATIONS
On the basis of the findings of the two studies, it is recommended that:
1. Follow – up experiments should be conducted to validate the findings.
2. Detailed chemical evaluations, for example, the amino acid profiles of SSSM and
SSPM should be carried out. In addition, protein and amino acid digestibility studies
on SSSM and SSPM should be determined. This is because information on the
relative ability of SSSM and SSPM to supply digestible rather than total amino acids
is necessary for accurate diet formulation.

53
3. Cheaper and appropriate methods of neutralising the anti-nutritive factors reported to
be contained in SSSM and SSPM should be identified.
4. Finally, higher inclusion levels of the processed SSSM and SSPM in broiler chickens‟
diet could be studied.

54
REFERENCES
Addey, E. (2011). Feed intake and nutrient digestibility of sheep fed Pennisetum purpureum
supplemented with Moringa oleifera leaves and Samanea saman pods. BSc.
Agriculture Dissertation, Department of Animal Science, K.N.U.S.T., Ghana.
Adesehinwa, A. O. K. (2007). Utilization of palm kernel cake as an energy source by
growing pigs: effects on growth, serum metabolities, nutrient digestibility and cost of
feed conversion. Bulgarian Journal of Agricultural Sceince, 13: 593 – 600.
Adeyemi, O. A., Fashina, O. E. and Balogun, M. O. (2000). Utilization of full fat Jatropha
seed in broiler diet: Effect on haematological parameters and blood chemistry. In:
Proc. 25th
Ann.Conf. Niger. Soc. Anim. Prod. (NSAP) 19th
- 23rd
March, 2000,
Umudike. Pp: 108 - 109.
Agrawal, N. K. and Mahajan, C. I. (1980). Hematological changes due to vitamin C
deficiency in Channa punctatus bloch. Journal of Nutrition, 110: 2172 - 2182.
Ahmad, S., Scopes, R. K., Rees, G. N. and Patel, B. K. (2000). Saccharococcus
caldoxylosilyticus sp. nov., an obligately thermophilic, xylose-utilizing, endospore-
forming bacterium. International Journal of System Evolution and Microbiology, 50:
517 - 523.
Akwaowo, E. U., Ndon, B. A. and Etuk, E. U. (2000). Minerals and anti-nutrients in
fluted pumpkin (Telfairia occidentalis Hook f.). Food Chem., 70: 235 - 240.
Allen, O. N. and Allen, E. K. (1981). The Leguminosae. University of Wisconsin Press. Pp.
812.
Anderson, J. O. and Warnick, R. E. (1965). Amino acid deficiencies in peanut meal and in
corn and peanut meal rations. Poultry Science, 44: 1066 - 1072.

55
Association of Official Analytical Chemists (AOAC) (1990). Official Methods of
Analysis, 15th Edn. Arlington, Virginia, USA.
Atteh, J. O. (2004). Theory and Practice of Poultry Production. 1st Ed., Adlek Printers, Ilorin,
Nigeria, Pp: 1 - 3.
Atuahene, C. C., Donkoh, A. and Asante, F. (1998). Value of sheanut cake as a dietary
ingredient for broiler chickens. Animal Feed Science Technology, 72: 133 - 142.
Atuahene, C. C., Donkoh, A. and Mensah-Afoakwa, K. (1989). Value of peanut skins as a
dietary ingredient for broiler chickens. British Poultry Science, 30: 289 - 293.
Awoniyi, T. A. M., Aletor, V. A., Adebayo, I. A. and Oyekunle, R. O. (2000). Observations
on some erythrocytes indices of broiler chickens raised on maggot meal based diets.
In: Ukachukwu, S. N., Ibeauchi, J. A., Ibe, S. N., Ezekwe, A. G. and Abasiekong, S.
F. (eds) Animal Production in the New Millennium Challenges and Options.
Proceedings of the 25th
Annual Conference of Nigerian Society of Animal Production,
Micheal Okapara University of Agriculture, Umudike, Nigeria 19 – 23 March. Pp:
132 – 134.
Ayensu, E. S. (1981). Medicinal Plant of the West Indies. Reference Publication, Inc.
Algonac, Michigan, USA. Pp. 224 - 282.
Azam- Ali, S. H. and Judge, E. C. (2001). Small–scale cashew nut processing, In:
Proceedings of the International Cashew Workshop, Colombes, Sri Lanka., 2001. Pp:
1 – 85.
Banerjee, G. C. (1998). A Textbook of Animal Husbandry. 8th
ed. Oxford and IBH
Publishing Co., Pvt. Ltd., New Delhi. Pp: 896 – 921.
Barcelo, P. M. (1999). Potenial of Acacia Pods as feeds for Broilers. Don Mariano Marcos
Memorial State University, Northern La Union Campus, Bacnotan, La Union.
Unpublished study.
56
Barcelo, P. M. and Barcelo, J. R. (2012). The potential of Samanea saman (Jack) Merr. Pods
as feed for goats. International Journal of Zoology Research, 2(1): 40 - 43.
Bate-Smith, E. C. (1973). Haematology analysis of tannins, the concept of relative
astringency. Phytochemistry, Agricultural Research Council Institute of Animal
Physiology, Babraham, Cambridge USA. Elsevier Ltd. 12 (4): 907 - 912.
Brandt, T. M. (1979). Use of heat treated full-fat soybeans in channel catfish and golden
shiner feeds. In: Proceedings of the 1979 Fish Farming Conference and Annual
Convention, Catfish Farmers of Texas, 17 - 19 January, 1979, Texas A & M
University, Pp: 52 - 61.
Brown, J. A. and Clime, T. R. (1972). Nutrition and haematological values. Journal of
Animal Science, 35: 211 - 218.
Brune, M., Rossander, L. and Hallberg, L. (1989). Iron absorption and phenolic compounds:
importance of different phenolic structures. European Journal of Clinical Nutrition, 43
(8): 547 – 557.
Castagliulo, I., Lacan, T., Nikulassan, S. T. and Pothoulakis, C. (1996). Saccharomyces
boulardii protease inhibits clostridium difficile toxin effect in the rat. lleum Infect
Immum, 64 (2) : 5225 - 5232.
Chabeauti, E., Noblet, J. and Carre/, B. (1991). Digestion of plant cell walls from four
different sources in growing pigs, Animal Feed Science and Technology, 32 (1-3) :
207 - 213.
Cheeke, P. R. (1971). Nutritional and physiological implications of saponins: a review.
Canadian Journal of Animal Science, 51: 621 – 623.
Cheeke, P. R., Pedersen, M. W. and England, D. C. (1978). Responses of rats and swine to
alfalfa saponins. Canadian Journal of Animal Science. 58: 783 – 789.
Chestworth, J. (1992). Ruminant Nutrition, 1st ed., Basingstoke, McMillan. Pp: 6 - 7.
57
Chowdhury, S. R., Sarker, D. K., Chowdhury, S. D., Smith, T. K., Roy, P. K. and Wahid, M.
A. (2005). Effects of dietary tamarind on cholesterol metabolism in laying hens.
Poultry Science, 84 (1): 56 – 60.
Chung, K. T., Wong, T. Y., Wei, C. I, Huang, Y. W., Lin, Y. (1998). Tannins and human
health : A review Crit. Rev. Food Science Nutrition, 38(6) : 421 - 64.
Cleaves, E. W., Tonkinson, L. V., Wolf, J. D., Harmon, C. K., Thayer, R. H. and Morrison,
R. D. (1968). The action and interaction of physiological food intake regulations in
the laying hen. 1. Effects of dietary factors upon feed consumption and production
responses. Poultry Science, 47: 38 - 67.
Craig, R., Elevitch, G. W. and Staples, A. (2006). Samanea saman (rain tree), ver 2.1. In C.
R. Elevitch (ed). Species Profile for Pacific Island Agroforestry. Permanent
Agriculture Resources (PAR). Holualoa, Hawaii.
Cullison, A. E. and Lowrey, R. S. (1987). Feeds and Feeding. 4th
ed. Prentice-Hall,
Inglewood Cliffs, USA.
Daghir, N. J. (1995). Broiler feeding and management in hot climates. In: Poultry Production
in Hot Climates. 1st ed. CAB International, Wallingford, UK. Pp: 1 -7.
De la Cruz, R. (2003). Acacia pods to feed chickens, BAR, Research and Development
Digest., Bureau of Agricultural Research, 5(2) : 19.
De Lange, C. F. M. (2000). Characterization of non-starch polysaccharides, In: Feed
Evaluation: Principles and Practice, P. J. Moughan, M. W. A. Verstegen, and M. I.
Visser-Reyneveld, eds, Wageningen Pers, Wageninigen, The Netherlands., Pp: 77 –
88.
Dierrick, P. M., Barker, H. and Oparka, K. J. (1990). Effect of virus on sympatric transport of
fluorescent traces in Nicotina clevelandii leaf epidermis Planta., 18 :555 – 569.

58
Donkoh, A., Atuahene, C. C., Anang, D. M., Badu-Botah, E. K. and Boakye, K. T. (2002).
Response of broiler chickens to the dietary inclusion of Chromolaena odorata leaf
meal, Journal of Animal and Feed Sciences, 11 (2): 309 - 319.
Donkoh, A., Attoh – Kotoku, V., Kwame, R. O. and Gascar, R.. (2012). Evaluation of
nutritional quality of dried cashew nut testa using laboratory rat as a model for pigs.
The Scientific World Journal, 12: 1 - 5.
Douglas, J. H., Sullivan, T. W., Gonzalez, N. J. and Beck, M. M. (1993). Differential age
response of turkeys to protein and sorghum tannin levels. Poultry Science, 72: 1944 –
1951.
Duke, J. A. (1983). Hand book of Energy Crops. Purdue University, Center for New Crops &
Plants Products. Unpublished. 10th
May, 2012.
http://www.hort.purdue.edu/newcrop/duke_ energy/Manihot_esculenta.
Duke, J. A. and Wain, K. K. (1981). Medicinal plants of the world. Computer index with
more than 85,000 entries. 3 vols. Plants Genetics and Germplasm Institute,
Agricultural Research Service, Beltsville, Maryland.
Durr, P. A. (2001). The biology, ecology and agroforestry potential of the rain tree, Samanea
saman (jacq.) Merr. Agroforestry System.
Eggum, O. (1970). The nutritional value of feedstuffs. British Jouanal of Nutrition, 24: 983 -
988.
Elkin, R. G., Roglar, J. C. and Sullivan, T. W. (1990). Comparative effects of dietary tannins
in ducks, chicks and rats. Poultry Science, 69: 1685 - 1695.
Esonu, B. O., Iwu, P. E., Opera, C. C. and Bamgbose, A. M. (2000). Evaluation of partial
replacement of maize with cooked wild variegated cocoyam corn meal (Caladium
hortulanum) in broiler starter diet. Tropical Journal of Animal Science, 3: 85 - 89.

59
Esonu, B. O., Emenalom, O. O., Udedibie, A. B. L., Herbert, U., Ekpor, C. F., Okoli, E. C.
and Iheukwumere, F. C. (2001). Performance and blood chemistry of weaner pigs fed
raw mucuna beans (Velvet beans) meal. Tropical Animal Production Investment, 4: 49
- 54.
Ewuola, E. O., Ogunlade, J. T., Gbore, F. A., Salako, A. O., Idahor, K. O. and Egbunike, G.
N. (2003). Performance evaluation and organ histology of rabbits fed Fusarium
Verticillioides culture material. Tropical Animal Production Investment, 6: 111 - 119.
Fernandez, S. R., Zhang, Y. and Parsons, C. M. (1995). Dietary formulation with cottonseed
meal on a total amino acid versus a digestible amino acid basis. Poultry Science, 74:
1168 - 1179.
Fetuga, B. L. (1984). Techniques in feed formulation. Paper presented at the Feed mill
Management Training Workshop. Dept. of Agricultural Economics, University of
Ibadan. April., 1984.
Fisher, H. (1968). The amino acid deficiencies of blood meal for the chick. Poultry Science,
47: 1478 - 1481.
Flores, E. M. (2002). Samanea saman (Jacq.) Merr. In: J.A. Vozzo (ed.). Tropical Tree Seed
Manual. Agriculture Hand book 721. USDA Forest Service, Washington, DC.
Fowler, L. G. and Banks, J. L. (1976). Animal and vegetable substitutes for fish meal in the
Abernathy diet. Progress Físh-Culture, 38 (3): 123 – 126.
Garcia-Barriga, H. (1975). Flora medicinal de Colombia. Botanica Medica. Talleres
Editoriales de la Imprenta Nacional. Bogota.
Ghana Agro-Meteorological Station (2011). Animal Science Department, KNUST, Kumasi.
Gillespie, J. R. (1990). Modern Livestock and Poultry Production, 4th
ed. Delmar Publishers
Inc., Canada. Pp: 92 - 93.
60
Gohl, B. (1981). Tropical Feeds. FAO Animal Production and Health Series. FAO, Rome, 12:
529.
Gonzalez-A, M. J. and Pesti, G. M. (1993). Evaluation of the protein to energy ratio
concept in broiler and turkey nutrition. Poultry Science, 72: 2115 - 2123.
Hurwitz, S., Sklan, D. and Bartov, I. (1978). New formal approaches to the determination
of energy and amino acid requirements of chicks. Poultry Science, 57: 197 - 205.
Iheukwumere, F. C. and Herbert, H. (2003). Physiological responses of broiler chicken to
quantitative water restrictions: Haematology and serum biochemistry. International
Journal of Poultry Science, 2: 117 - 119.
Islam, M. S., Lucky, N. S., Islam, M. R., Ahad, A., Das, B. R., Rahman, M. M. and Siddiui,
M. S. I. (2004). Haematology parameters of Fayumi, Assil and local chikens reared
in Sylhet Region in Bangladesh. International Journal of Poultry Science, 3: 144 -
147.
International Fish meal and Fish Oil Organisation (IFFO) (2006), The Marine Ingredients
Organisation, 10th
May, 2012. http://www.iffo.net/default.asp?contentID.
Jackson, S., Summers, J. D. and Leeson, S. (1982). Effect of dietary protein and energy on
carcass composition and efficiency of nutrient utilization. Poultry Science, 61: 2224 -
2231.
Jain, C. N. (1993). Essentials of Veterinary Haematology. Williams and Wilkins, USA. Pp.
231.
Ji, S. C., Jeong, G. S., Im, G. S., Lee, S. W., Yoo, J. H. and Takii, K. (2007). Dietary
medicinal herbs improve growth performance, fatty acid utilization, and stress
recovery of Japanese flounder. Fisheries Science, 73: 70 – 76.
61
Johnson, L. T., Gee, J. M., Price, K. R., Curl, C. L. and Fenwick, G. R. (1986). Influence of
saponins in gut permeability and active nutrient transport in vitro. Journal of
Nutrition, 116: 2270 – 2272.
Jung, H. G. and Fahey Jr., G. C. (1983). Nutritional implications of phenolic monomers and
lignin: A review Journal of Animal Science, 57: 206 – 219.
Kekeocha, C. C. (1985). Poultry Production Hand Book. Macmillan Publishers Ltd., London.
Kim, K. W., Bai, S. C., Koo, J. W., Wang, X. and Kim, S. K. (2002). Effects of dietary
Chlorella ellipsoidea supplementation on growth, blood characteristics, and whole
body composition in juvenile Japanese flounder Paralichthys olivaceus. Journal of the
World Aquaculture Society, 33: 425 – 431.
Koops, H., Tiews, H., Beck, H. and Gropp, J. (1976). Arch. Fischereiwiss Die Verwertung
von Sojaprotein durch die Regenbogen Forelle (Salmo gairdneri). 26: 181 – 191.
Kral, I. and Suchy, P. (2000). Haematological studies in adolescent breeding cocks. Acta
Veterinaria Brno., 69: 189 – 194.
Knox, A. I. and McNab, J. M. (1995). Selection between high and low-tannin diets by broiler
chickens. British Poultry Science, 36: 849.
Kumar, A., Miasnikov, A., Sands, J. S. and Simmins, P. H. (2003). In vitro activities of three
phytases under different pH and protease challenges. In: Manipulating Pig Production.
Australia Pig Science Association, Victoria, Australia. Pp. 164.
Ladeji, O., Okoye, Z. S. C. and Ojobe, T. (1995). Chemical evaluation of the nutritive value of
leaf of fluted pumpkin (Telfairia occidentalis). Food Chemistry, 53: 353 - 355.
Leeson, S. (2000). Is feed efficiency still a useful measure of broiler performance?
Department of Animal and Poultry Science, University of Guelph, Ministry of
Agriculture, Food and Rural Affairs, Canada.

62
Liener, I. E. (1978). Developing Australian acacia seeds for the Sahel regions. Tropical
Agriculture, 75: 434.
Liener, I. E. (1989). Anti-nutritional Factors in Legume Seeds: State of the Art. In:
Recent Advances of Research in Anti-nutritional Factors in Legume Seeds,
Huisman, J., T. F. B. Van Der Poel and I. E. Liener (Eds.). Pudoc, Wageningen, The
Netherlands, Pp: 6 - 13.
Lillie, R. J., Cecil, H. C., Bitman, J., Fries, F. and Verret, J. (1975). Toxicity
of certain polychlorinated and polybrominated biphenyls and reproductive
efficiency of caged chickens. Poultry Science, 54: 1550 - 1555.
Livingston, A. L., Knuckles, B. E., Edwards, R. H., Miller, R. E., de Fremery, D. and Kohler,
G. O. (1977). Distribution of saponins in alfalfa protein recovery systems.
Proceedings of Annual Meeting of Animal Society of Agricultural Engineers,
Chicago. Pp: 77 – 6502.
Lovell, T. (1981). Using heat-treated full-fat soybean meal in fish feeds. Aquaculture
Magazine, 6 (3): 39.
Maiorka, A., Dahlke, F., Santin, E., Kessler, A. M. and Penz, Jr. A. M. (2004). Effect of
energy levels of diets formulated on total or digestible amino acid basis on broiler
performance. Revista Brasileira de Ciencea Avicola, 6(2): 87 – 91.
McDonald, P., Edwards, R. A. and Greenhalgh, J. F. D. (1988). Animal Nutrition, 4th
ed.
John Wiley and Sons Inc., New York. Pp: 455 – 484.
Merck Veterinary Manual (MVM) (1986). A Hand book of Diagnosis, Therapy and Disease
Prevention and Control for the Veterinarian. 6th
ed. Merck and Co. Inc., Rahway, N.
J., USA. Pp: 1 - 903.
Mess, R. (1992). Livestock, Health and Welfare. Pp. 305.

63
Mezoui, C. M. and Bird, F. H. (1984). Peanut as a protein source for growing broilers. Revue
Sci. et.Technique, Series Sciences de la Sante, 1: 45 - 51.
Miles R. D. and Jacqueline P. J. (2009). Fish meal in poultry diets: understanding the
production of this valuable feed ingredient,
Publication PS12, Animal Science
Department, Florida Cooperative Extension Service, Institute of Food and
Agricultural Sciences (IFAS), University of Florida, Gainesville, 32611.
Morrison, B. J., Gold, M. A. and Latagne, D. O. (1996). Incorporating indigenous knowledge
of fodder trees into small scale silvo pastoral system in Jamaica. J. Agro Forestry
Systems, 34: 101 - 117.
Nahashon, S. N., Adefope, N., Amenyenu, A. and Wright, D. (2005). Effects of dietary
metabolizable energy and crude protein concentrations on growth performance and
carcass characteristics of French guinea broilers. Poultry Science, 84: 337 - 344.
National Academy of Sciences (N.A.S.) (1980). Firewood crops. Shrub and Tree Species for
Energy Production. National Academy of Sciences, Washington, DC.
National Research Council (NRC) (1984). Nutrient Requirements of Poultry. 8th
Rev. ed.
Washington DC., USA.
National Research Council (NRC) (1994). Nutrient Requirements of Poultry. 9th
Rev. ed.
Washington DC., USA.
Noblet, J. and Perez, J. M. (1993). Prediction of digestibility of nutrients and energy values of
pig diets from chemical analysis, Journal of Agricultural Science, 71 (12): 3389 -
3398.
North, M. O. (1984). Commercial Chicken Production Manual, 3rd
ed. AVI Publishing Co.
Inc., Westport, Connecticut, U.S.A. Pp: 460 - 465.
North, M. O. and Bell, D. B. (1990). Commercial Chicken Production Manual, 4th
ed. Van
Nortrand Reinhold, New York. Pp: 366.
64
Nworgu, F. C. and Egbunike, G. N. (1999). Performance characteristics of broilers fed diets
with soybean meal and groundnut cake as protein sources. Tropical Animal Production
Investment, 2: 51 - 59.
Nworgu, F. C. (2004). Utilization of forage meal supplements in broiler production
Ph.D. Thesis. Animal Science Dept. University of Ibadan, Ibadan Nigeria, Pp: 136 -
146, 214 - 222.
Nworgu, F. C. (2006). Prospect and Pitfalls of Agricultural Production in Nigeria. 1st
Edition. Blessed Publication Ibadan. Nigeria, Pp: 79 – 96.
Nworgu, F. C., Ogungbenro, S. A. and Solesi, K. S. (2006). Performance and some blood
chemistry indices of broiler chicken served fluted pumpkin (Telfaria occidentalis)
leaves extract supplement. American–Eurasian Journal of Agriculture Environmental
Science, 1(3): 234 – 241.
Oakenfull, D. G., Topping, D. L., Illuman, R. J.and Fenwick, D. E. (1984). Prevention of
dietary hypercholesterolemia in the rat by soya and quillaja sapnonis. Nutrition
Research International, 29: 1039 – 1041.
Offoh, I. A. (2011). The effect of supplementing Samanea saman pods and Moringa Oleifera
leaves in the diet of sheep under semi-intensive system of management. BSc.
Agriculture Dissertation, Department of Animal Science, K.N.U.S.T., Ghana.
Okai, D. B., Easter, R. A. and Frank, G. R. (1984). The nutritive value of some non-
conventional Ghanaian feed ingredients: nutrient composition and effects on the
performance of weanling rats. World Review of Animal Production, 20 (2): 11 - 16.
Okoli, B. E. and Mgbeogba, C. M. (1983). Fluted pumpkin (Telfairia occidentalis), West
African Vegetable Crop. Econ. Bot., 37: 145 - 149.

65
Olumu, J. M. and Offiong, S. A. (1980). The effect of different protein and energy levels and
time of change from starter to finisher ration on the performance of broiler chickens in
the tropics. Poultry Science, 59: 828 - 835.
Olorede, B. R. and Longe, O. G. (1999). Growth, nutrient retention, haematology and serum
chemistry of pullet chicks fed sheabutter cake in the humid tropics. Arch.
Zootech., 49: 441 - 444.
Olorunsanya, A. O., Egbewande, O. O., Ibrahim, H, and Adeyemo, M. M. (2010). Growth
Performance and Carcass Analysis of Broiler Chickens Fed Graded Levels of
Toasted Albizia lebbeck Seed Meal. Pakistan Journal of Nutrition, 9(9): 873 - 876.
Oluyemi, J. A. (1984). Techniques of feed formulation. Proceedings of the Feed mill
Management and Training Workshop, Department of Agricultural Economics, April
10-May 2, 1984, Ibadan, Nigeria, Pp: 138 – 144.
Onwudike, O. C. (1983). Energy and protein requirements of broiler chicks in humid tropics.
Tropical Animal Production, 8: 39 - 44.
Osuji, P. O., Fernandez-Rivera, S. and Odenyo, A. (1995). Improving fibre utilization and
protein supply in animals fed poor quality roughages: ILRI nutrition research and plans.
In: Wallace, R. J. and Lahlou-Kassi, A. (ed.). Rumen Ecology/Research Planning.
Proceedings of a Workshop Held at ILRI. Addis Ababa, Ethiopia. Pp. 1 – 22.
Oyewale, J. O. and Ajibade, H. A. (1990). The osmotic fragility of erythrocytes of turkeys of
two age groups Vet. Arhiv., 60: 91 - 100.
Parkhurst, C. R. and Mountney, G. J. (1988). Poultry Meat and Egg Production. An AVI
Book, Van Nostrand Reinhold, Company Inc.New York. Pp: 110 - 125.
Pauzenga, U. (1985). Feeding parent stock. Zootechnica International, December, 1985, Pp: 22
- 24.

66
Pavlak, M., Vlahovic, K., Jarcic, J., Dorc, A. and Zupancic, Z. (2005). Age, sexual and
seasonal differences of haematological values and antibody status to Chlamydophila
sp. in feral and racing pigeons (Columba liviaforma Domestica) from an urban
environment (Zagreb, Croatia). Eur. J. Wildlife Res., 51: 271 - 276.
Penz, Jr. A. M. and Brugalli, I. (2000). Soyabean products as protein sources in poultry diets.
Soy in Animal Nutrition, J. K. Drackley, Ed. Federation in Animal Science Societies:
Savoy, IL, Pp: 289 - 306.
Pesti, G. M. and Smith, C. F. (1984). The response of growing broiler chickens to dietary
contents of protein, energy and added fat. British Poultry Science, 25: 127 – 138.
Piccione, G., Assenza, A. and Fazio, F. (2001). Different periodicities of some
haematological parameters in exercise-loaded athletic horses and sedentary horses.
Journal of Equine Science, 12: 17 – 23.
Piccione, G., Fazio, F., Giudice, E., Grasso, F. and Morgante, M. (2005). Nycthemeral
change of some haematological parameters in horses. Journal of Applied Biomedicals,
3: 123 - 128.
Plavnik, I., Wax, E., Sklan, D., Bartov, I. and Hurwitz, S. (1997). The response of broiler
chickens and turkey poults to dietary energy supplied either by fat or carbohydrates.
Poultry Science, 76: 1000 – 1005.
Ravindran, V., Hew, L. I., Ravindran, G. and Bryden, W. L. (2005). Apparent ileal
digestibility of amino acids in dietary ingredients for broiler chickens. Animal Science
Journal, 81: 85 – 97.
Reinitz, G. L., Orme, L. E., Lemm, C. A. and Hitzel, F. N. (1978). Full-fat soybean meal in
rainbow trout diets. Feedstuff, 50 (3): 23 – 24.

67
Rockland, B. L. and Nishi, K. S. (1979). Tropical grain legumes. In: G. E. Inglett & G.
Charalambous (Eds.), Proceedings of an International Conference on Tropical Foods:
Chemistry and Nutrition, March 28 – 30 Hawaii, Honolulu. Pp: 547 – 574.
Rosen, G. D. (1958). Groundnut Meal in Processed Plant Protein Feedstuffs. Ch. 16 AM
Altschuled. Academic Press Inc., New York. Pp: 419 - 448.
Ross, J. G., Christie, G., Halliday, W. G. and Jones, R. M. (1978). Haematological and
chemistry comparison values for chemical pathology in poultry. Veterinary Research,
102: 29 - 31.
Sackey, J. P. (2010). Chemical and Mineral Composition of Samanea saman Pods. BSc.
Agriculture Dissertation, Department of Animal Science, K.N.U.S.T., Ghana.
Sadik, N. (1991). Population growth and the food crisis: food, nutrition and
agriculture/alimentation. Nutrition and Agriculture, 1: 3 – 6.
Sainsbury, D. (1984). Poultry Health and Management., 2nd
ed. Granada Publishing Ltd,
Great Britian. Pp: 23 – 53.
Sarkar, S., Yadav, P., Trivedi, R., Bansal, A. K. and Bhatnagar, D. (1995). Cadmium-
induced lipid peroxidation and status of the antioxidant system in rat tissues. Journal
of Trace Element and Medical Biology, 9: 144 - 149.
Sanni, A. A., Oyedokun, O. R.and Alaka, O. O. (2000). Preliminary observations on diurnal
rhythm inthe haematological parameters of male African giant rats (Cricetomys
gambianus, Waterhouse). African Journal of Biomedical Research, 3: 117 – 120.
Saxena, P. and Pradhan, K. (1979). Protein efficiency and nitrogen retention in broilers
maintained on maize and sorghum diets at various levels of energy and protein in
summer months. Indian Journal of Animal Science, 49: 414 - 418.

68
Say, R. R. (1987). Manual of Poultry Production in the Tropics. CAB International, The
Technical Centre for Agricultural and Rural Co-operation CTA. English ed. Antony
Rowe Ltd. Chippenhem, UK. Pp. 49.
Schaible, P. J. (1970). Poultry Feed and Nutrition. 1st ed. AVI Publication Co. Westport,
Connecticut. Pp. 636.
Scheideler, S. E. and Ferket, P. R. (2000). Phytase in broiler rations - effects on carcass yields
and incidence of tibial dyschondroplasia. Journal of Applied Poultry Research, 9: 468
- 475.
Schiavone, A., Guo, K. and Tassone, S. (2008). Effects of a natural extract of chestnut wood
on digestibility, performance traits, and nitrogen balance of broiler chicks. Poultry
Science, 87(3): 521 - 527.
Scott, M. L., Nesheim, M. C. and Young, R. J. (1982). Nutrition of the Chicken, 3rd
ed. M. L.
Scott and Associates, Ithaca, New York.
Sibbald, I. R., Slinger, S. J. and Ashton, G. C. (1961). Factors affecting the metabolizable
energy content of poultry feeds: The influences of calcium, phosphorus, antibiotics
and pantothenic acid. Poultry Science.
Smith, A. J. (2001). Journal of Poultry, The Tropical Agricultural Centre for Tropical
Veterinary Medicine, University of Edinburgh, UK. Macmillan Education Ltd. Pp: 1
– 7, 78 - 121.
Smith, J. K. (1970). Practical significance of gossypol in feed formulation. Journal of Animal
Oil Chemical Society, 47: 448 - 450.
Staples, W. G. and Elevitch, C. R. (2006). Samanea saman (rain tree) Fabaceae (legume
family). In: Traditional Trees of Pacific Islands: Their Culture, Environment, and Use
(Editor Elevitch C. R.). pp. 661 – 674.

69
Steel, R. G. D., Torrie, J. H. and Dickey, D. A. (1997). Principles and Procedure of Statistics.
A Biometrical Approach 3rd
Ed., McGraw Hill Book Co. Inc., New York. Pp: 352 -
358.
Sturkie, P. D. (1965). Avian Physiology, 2nd Edn., Comstock Publishing Associates, Cornell
University Press, New York, Pp. 766.
Tagoe, F. (2011). Evaluation of the chemical composition of Moringa leaves, Samanea
saman pods and Napier grass. BSc. Agriculture Dissertation, Department of Animal
Science, K.N.U.S.T., Ghana.
The Poultry Consultancy (TPC), (2009) Poultry Feed formulation. Article May 2009.
www.thepoultryconsultancy.com accessed 9 May 2012.
Tiemoko, Y. and Tawfik, E. (1989). Effect of starter protein level on the growth performance
of broiler chicks raised in the humid tropics. Animal Research and Development, 30:
77 - 83.
Titus, H. W. and Fritz, J. C. (1971). The Scientific Feeding of Chickens, 5th
ed. The Interstate
Printers and Publishers Inc., Danville, Illinois.
Umunna, N. N., Nsahlai, P. O. and Osuji, P. O. (1995). Degradability of forage protein
supplements and their effects on the kenetics of digestion and passage. Small
ruminants research, 17: 145 – 152.
Van Soest, P. J., Robertson, J. B. and Lewis, B. A. (1991). Methods of dietary fiber, neutral
detergent fiber and non-starch polysaccharides in relation to animal nutrition. Journal
of Diary Science, 74: 3583 - 3597.
Veldkamp, T., Kwakkel, R. P., Ferket, P. R. and Verstegen, M. W. A. (2005). Growth
response to dietary energy and lysine at high and low ambient temperature in male
turkeys. Poultry Science Journal, 84: 273 - 282.

70
Vendell, R. N. and Ringresse, R. C. (1958). The effect of protein and fat levels and
calorie:protein ratios upon performance of broilers. Poultry Science, 57: 147 - 151.
Viola, S., Arieli, J., Rappafort, U. and Mokady, S. (1981). Bulletin for fish culture in Israel
experiments in the nutrition of carp replacement of fish meal by soybean meal.
Bamidgeh, 33 (2): 35 – 49.
Virk, R. S., Lodhi, G. N. and Ichhponani, J. S. (1978). Influence of climatic conditions on
protein and energy requirements of poultry: energy requirements of broiler starter in
winter and summer. Indian Journal of Animal Science, 48: 36 - 41.
Waldroup, P. W. (1981). Cotton seed meal in poultry diets. Feedstuffs, 53(52): 21 - 24.
Watkins, S. E., Skinner, J. T., Adams, H. M. and Waldroup, P. W. (1994). An evaluation of low
-gossypol cottonseed meals in diets for broiler chickens.2. Influence of assigned
metabolizable energy values and supplementation with essential amino acids as
performance. Journal of Applied Poultry Research, 3: 7 – 16.
Weaver, L. T. (1994). Feeding the weanling in the developing world: problems and solutions.
International. Journal of Food Science and Nutrition, 45: 127 – 134.

71
APPENDICES
APPENDIX 1: ANALYSIS OF VARIANCE (ANOVA) TABLES
EXPERIMENT ONE
TABLE 1: ANALYSIS OF VARIANCE FOR FEED INTAKE
Source of variation d.f. s.s. m.s. v.r. F pr.
Treatment 3 3.85737 1.28579 112.21 <.001
Residual 8 0.09167 0.01146
TABLE 2: ANALYSIS OF VARIANCE FOR BODY WEIGHT GAIN
Source of variation d.f. s.s. m.s. v.r. F pr.
Treatment 3 9.51031 3.17010 34.62 <.001
Residual 8 0.73247 0.09156
TABLE 3: ANALYSIS OF VARIANCE FOR FEED CONVERSION EFFICEINCY
Source of variation d.f. s.s. m.s. v.r. F pr.
Treatment 3 0.202220 0.067407 8.90 0.006
Residual 8 0.060589 0.007574
EXPERIMENT TWO
TABLE 1: ANALYSIS OF VARIANCE FOR FEED INTAKE
Source of variation d.f. s.s. m.s. v.r. F pr.
Treatment 3 0.10270 0.03423 0.80 0.529
Residual 8 0.34317 0.04290
TABLE 2: ANALYSIS OF VARIANCE FOR BODY WEIGHT GAIN
Source of variation d.f. s.s. m.s. v.r. F pr.
Treatment 3 0.09204 0.03068 0.40 0.756
Residual 8 0.61099 0.07637
TABLE 3: ANALYSIS OF VARIANCE FOR FEED CONVERSION EFFICIENCY
Source of variation d.f. s.s. m.s. v.r. F pr.
Treatment 3 0.22271 0.07424 0.75 0.552
Residual 8 0.79139 0.09892

72
APPENDIX 2: REGRESSION ANALYSIS TABLES
EXPERIMENT ONE
TABLE 1: REGRESSION ANALYSIS FOR RBC
Source d.f. s.s. m.s. v.r. F pr.
Regression 1 3.23 3.227 2.74 0.129
Residual 10 11.77 1.177
TABLE 2: REGRESSION ANALYSIS FOR WBC
Source d.f. s.s. m.s. v.r. F pr.
Regression 1 0.19 0.186 0.13 0.730
Residual 10 14.81 1.481
TABLE 3: REGRESSION ANALYSIS FOR HB
Source d.f. s.s. m.s. v.r. F pr.
Regression 1 2.37 2.367 1.87 0.201
Residual 10 12.63 1.263
TABLE 4: REGRESSION ANALYSIS FOR MCV
Source d.f. s.s. m.s. v.r. F pr.
Regression 1 0.14 0.143 0.10 0.763
Residual 10 14.86 1.486
TABLE 5: REGRESSION ANALYSIS FOR ALBUMEN
Source d.f. s.s. m.s. v.r. F pr.
Regression 1 2.19 2.195 1.56 0.240
Residual 10 14.05 1.405

73
TABLE 6: REGRESSION ANALYSIS FOR GLOBULIN
Source d.f. s.s. m.s. v.r. F pr.
Regression 1 0.01 0.008 0.00 0.968
Residual 10 49.36 4.936
TABLE 7: REGRESSION ANALYSIS FOR TOTALCHOLESTROL
Source d.f. s.s. m.s. v.r. F pr.
Regression 1 0.010 0.0100 0.10 0.763
Residual 10 1.047 0.1047
TABLE 8: REGRESSION ANALYSIS FOR TOTALPROTEIN
Source d.f. s.s. m.s. v.r. F pr.
Regression 1 2.46 2.460 0.26 0.623
Residual 10 95.59 9.559
EXPERIMENT 2
TABLE 1: REGRESSION ANALYSIS FOR RBC
Source d.f. s.s. m.s. v.r. F pr.
Regression 1 0.0363 0.03626 2.17 0.171
Residual 10 0.1668 0.01668
TABLE 2: REGRESSION ANALYSIS FOR WBC
Source d.f. s.s. m.s. v.r. F pr.
Regression 1 55.9 55.92 1.64 0.230
Residual 10 341.7 34.17

74
TABLE 3: REGRESSION ANALYSIS FOR HB
Source d.f. s.s. m.s. v.r. F pr.
Regression 1 2.81 2.812 2.31 0.160
Residual 10 12.19 1.219
TABLE 4: REGRESSION ANALYSIS FOR MCV
Source d.f. s.s. m.s. v.r. F pr.
Regression 1 0.27 0.269 0.18 0.678
Residual 10 14.73 1.473
TABLE 5: REGRESSION ANALYSIS FOR ALBUMEN
Source d.f. s.s. m.s. v.r. F pr.
Regression 1 0.88 0.876 0.37 0.555
Residual 10 23.43 2.343
TABLE 6: REGRESSION ANALYSIS FOR GLOBULIN
Source d.f. s.s. m.s. v.r. F pr.
Regression 1 2.82 2.817 0.70 0.423
Residual 10 40.43 4.043
TABLE 7: REGRESSION ANALYSIS FOR TOTAL CHOLESTROL
Source d.f. s.s. m.s. v.r. F pr.
Regression 1 0.184 0.1843 1.57 0.239
Residual 10 1.176 0.1176
TABLE 8: REGRESSION ANALYSIS FOR TOTALPROTEIN
Source d.f. s.s. m.s. v.r. F pr.
Regression 1 6.83 6.834 0.71 0.420
Residual 10 96.47 9.647