Neonatal control of nutritive sucking pressure: evidence for an intrinsic τ-guide
Upload
khangminh22Category
view
1download
0
i
GROWTH PERFORMANCE AND NUTRITIVE QUALITY OF TREE LUCERNE
(Chamaecytisus palmensis) FODDER UNDER DIFFERENT MANAGEMENT
CONDITIONS IN THE HIGHLANDS OF ETHIOPIA
M.Sc. THESIS
FELEKE TADESSE FROCHE
HAWASSA UNIVERSITY
HAWASSA, ETHIOPIA
JUNE, 2016

GROWTH PERFORMANCE AND NUTRITIVE QUALITY OF TREE LUCERNE
(Chamaecytisus palmensis) FODDER UNDER DIFFERENT MANAGEMENT
CONDITIONS IN THE HIGHLANDS OF ETHIOPIA
FELEKE TADESSE FROCHE
MAJOR ADVISOR: AJEBU NURFETA (PhD, Assoc. Prof.)
CO-ADVISORS: MELKAMU BEZABIH (PhD) and KINDU MEKONNEN (PhD)
A THESIS SUBMITTED TO THE
SCHOOL OF ANIMAL AND RANGE SCIENCES,
COLLEGE OF AGRICULTURE, SCHOOL OF GRADUATE STUDIES
HAWASSA UNIVERSITY
HAWASSA, ETHIOPIA
IN PARTIAL FULFILLMENT OF THE REQUIREMENTS FOR THE
DEGREE OF MASTER OF SCIENCE IN ANIMAL AND RANGE SCIENCES
(SPECIALIZATION: ANIMAL PRODUCTION)
JUNE, 2016

i
APPROVAL SHEET-I
This is to certify that the thesis entitled “Growth Performance and Nutritive Quality of Tree Lucerne
(Chamaecytisus Palmensis) Fodder under Different Management Conditions in the Highlands of
Ethiopia”, submitted in partial fulfillment of the requirements for the degree of Master’s with
specialization in Animal production, the Graduate Program of the School of Animal and Range Sciences,
Hawassa University College of Agriculture, and has been carried out by Feleke Tadesse, under our
supervision. Therefore, we recommend that the student has fulfilled the requirements and hence hereby
can submit the thesis to the school.
Ajebu Nurfeta (PhD, Assoc. prof.) ________________ _______________
Name of major advisor Signature Date
Melkamu Bezabih (PhD, Asst. prof.) _______________ _____________
Name of co-advisor Signature Date
Dr. Kindu Mekonnen _______________ ____________
Name of co-advisor Signature Date

ii
APPROVAL SHEET- II
We, undersigned, members of the Board of Examiners of the final open defense by Feleke Tadesse have
read and evaluated his thesis entitled “Growth Performance and Nutritive Quality of Tree Lucerne
(Chamaecytisus Palmensis) Fodder under Different Management Conditions in the High Lands of
Ethiopia”, and examined the candidate. This is therefore to certify that the thesis has been accepted in
partial fulfillment of the requirements for the degree of Master of Science.
_______________________ _______________ ______________
The name of chairperson signature date
1.______________________ ___________________ ______________
The name of major advisor signature date
2_______________________ _____________________ ______________
The name of co advisor signature date
3_______________________ _________________ ____________
Name of internal examiner signature date
2_______________________ _______________ _____________
Name of external examiner signature date
4__________________________ _________________ ______________
SGS Approval signature date
Final approval and acceptance of the thesis is contingent upon the submission of the final copy
of the thesis to the School of Graduate Studies (SGS) through the School Graduate Committee
(SGC) of the candidate’s department.

iii
ACKNOWLEDGEMENT
Above all I would like to praise the Almighty God for his timely revealed Holly hands for
guidance, wonderful goodness, blessing and strength to bring out this humble piece of work into
light. I would like to express my deepest gratitude to Dr. Ajebu Nurfeta and Dr. Melkamu
Bezabih, for their guidance, technical advice, suggestions and constructive criticisms.
I would like to express my highest gratitude and appreciation to Dr. Kindu Mekonnen, Dr.
Melkamu Bezabih and Ato Abera Adie, whose assistances in the field work were crucial to the
success of this work.
I forward my thanks to my beloved Mother Alemayehu Dobamo and my friends Radiat Feleke
Digamo Abriham, Alemayrhu Abera and Lolam Kelbiso for their encouragement and moral
support; Workineh Dubale, Fekadu Tesema Addisu Asefa, Getachewu Bisirat, Mohammed
Ibrahim and Endashewu Tadesse who provided research materials and technical support during
my field trial at implementing sites.
This research was undertaken with support from Africa RISING, a program financed by the
United States Agency for International Development (USAID) as part of the United States
Government’s Feed the Future Initiative. The content is solely the responsibility of the authors
and does not necessarily represent the official views of USAID or the U.S. Government or that
of the Africa RISING program. Africa RISING is aligned with research programs of the
CGIAR.

iv
DEDICATION
I dedicate this thesis manuscript to my beloved mother Alemayehu Dobamo and all my families
for nursing me with affection, love and for their dedicated partnership in the success of my life.

v
STATEMENT OF THE AUTHOR
First, I declare that this thesis is my authentic work and that all sources of materials used for
this thesis have been duly acknowledged. This thesis has been submitted in partial fulfillment
of the requirement of MSc. degree at the Hawassa University College of Agriculture and is
deposited at the University library to be made available to borrowers under rules of the library.
I solemnly declare that this thesis is not submitted to any other institution anywhere for the
award of any other academic degree, diploma, or certificate.
Requests for permission for extended quotation from or reproduction of this manuscript in
whole or in part may be granted by the Head of the school of Animal and Range Sciences or the
Dean of the School of Graduate Studies when in his or her judgment the proposed use of the
material is in the interest of scholarship. In all other instances, however, permission must be
obtained from the author.
Name: Feleke Tadesse
Signature __________________________
Place: Hawassa University, Hawassa
Date of Submission ________________

vi
LIST OF ACRONYMS
ADF Acid Detergent Fiber
ADL Acid Detergent Lignin
ANOVA Analysis of Variance
AOAC Association of Official Analytical Chemists
CSA Central Statistical Agency
CP Crude Protein
DM Dry Matter
DMY Dry matter yield
FHH Female household head
GDP Gross Domestic Product
IVTOMD In vitro True Organic Matter Digestibility
ME Metabolizable Energy
MHH Male household headed
MJ Mega Jules
MPT Multi-purpose trees
N Nitrogen
NDF Neutral Detergent Fiber
NIRS Near Infrared Reflectance Spectroscopy
SPSS Statistical Package for Social Science
SE Standard Error
HH Household

vii
TABLE OF CONTENTS
Contents Pages
APPROVAL SHEET-I .......................................................................................................... i APPROVAL SHEET- II ...................................................................................................... ii ACKNOWLEDGEMENT................................................................................................... iii DEDICATION ..................................................................................................................... iv
STATEMENT OF THE AUTHOR ..................................................................................... v
LIST OF ACRONYMS ....................................................................................................... vi TABLE OF CONTENTS .................................................................................................. vii ABSTRACT ....................................................................................................................... xiii 1. INTRODUCTION ............................................................................................................ 1
2. LITERATURE REVIEW ................................................................................................ 4
2.1. Browse shrubs and Trees as Source of Fodder for Ruminants ...................................... 4
2.2 Origin, Taxonomy and Distribution of Tree Lucerne ..................................................... 5
2.3. Adaptability, Climate and Soil type for Tree Lucerne................................................... 6
2.4. Agronomy of Tree Lucerne .......................................................................................... 7
2.5. Roles of Tree lucerne ................................................................................................... 7
2.5.1. Multi-purpose role ................................................................................................ 8
2.5.2. Palatability/acceptability ....................................................................................... 9
2.6. Nutritive Value and Dry Matter yield Productions of Tree lucerne ............................... 9
2.7. Factors Influencing Yield and Quality of Tree Lucerne Fodder .................................. 12
2.7.1. Plant age at the first cutting ................................................................................. 12
2.7.2 Cutting Height ..................................................................................................... 12
2.7.3. Cutting interval ................................................................................................... 13
2.7.4. Season of the year ............................................................................................... 13
3. MATERIALS AND METHODS ................................................................................... 14
3.1. Area Description: ....................................................................................................... 14
3.2. Study Approach ......................................................................................................... 15
3.2.1. Measurements and sampling procedures.............................................................. 15
3.2.2. Chemical analysis ............................................................................................... 16
3.2.3. Data analysis ....................................................................................................... 17
4. RESULTS ....................................................................................................................... 18

viii
4.1. Household Survey Analysis ....................................................................................... 18
4.1.1. Family size, educational status, gender distribution and farm typology of area .... 18
4.1.2. Land use and trends of landholding in the research site ....................................... 20
4.1.3. Livestock species composition and its trend in the area ....................................... 22
4.1.4. Major feed resources ........................................................................................... 23
4.1.5. Reasons for establishing tree Lucerne in the area................................................. 24
4.1.6. Role of gender on overall seedlings performance ................................................ 24
4.1.7. Potential opportunities and challenges for seedlings establishment ...................... 25
4.2 Measurement and observations ................................................................................... 27
4.2.1 Grouping of participant farmers based on the performance of seedlings ............... 27
4.2.2. Survival of seedlings as affected by different planting niche................................ 27
4.2.3. Agronomic and Management practice affecting the survival rate of seedlings ..... 28
4.2.4. Dry matter yield of seedlings as affected by plant spacing and site ...................... 29
4.2.5. Growth and root collar diameter at different growing stages ................................ 30
4.2.6. Effect of cutting management on biomass yield of tree Lucerne .......................... 32
4.2.7. Botanical fractions of tree lucerne as affected by cutting height and interval ....... 33
4.2.8. Chemical composition and digestibility of tree lucerne leaf fractions................... 34
5. DISCUSSION ................................................................................................................. 36
5.1. Survey ....................................................................................................................... 36
5.1.1. Household characteristics, educational status and gender role.............................. 36
5.1.2. Land holding and its trend ................................................................................... 37
5.1.3. Livestock composition and its trend in the area ................................................... 37
5.1.4. Major feed resources and purpose of tree lucerne establishment in the area ......... 38
5.1.6. Potential opportunities and challenges faced by farmers ...................................... 39
5.2. Measurement and Observations ................................................................................. 40
5.2.1. Effect of planting niche and locations on survival rate ......................................... 40
5.2.2. Management factors affecting survival rate of fodder seedlings ........................... 42
5.2.3. Dry matter yield of tree lucerne as affected by plant spacing and site .................. 43
5.2.4. Growth and root collar diameter at different growing stages of fodder ................. 44
5.2.5. Effect of cutting height and interval on biomass yield of tree lucerne .................. 45
5.2.6. Effect of cutting height and interval on leaf, edible branch and stem fractions ..... 46
5.3 Chemical Composition and digestibility of tree lucerne .............................................. 46
6. SUMMARY AND CONCLUSION ................................................................................ 49
7. SCOPE FOR FUTURE WORK ..................................................................................... 51

ix
8. REFERENCE ................................................................................................................. 52
APPENDIX ......................................................................................................................... 65
Appendix Tables ............................................................................................................. 65
QUESTIONNAIRE ............................................................................................................ 71

x
LIST OF TABLES
Tables Pages
Table 1. edible dry matter (EDM) production (t/ha/yr.) of tree lucerne from five sites in southern
Australia. .............................................................................................................................. 11
Table 2. Climatic data of the study area ................................................................................ 14
Table 3. Family size by age category of respondent households in the study area (N=205) ... 18
Table 4. Average livestock holding and its trend based on survey respondents (n=205) ........ 22
Table 5. Ranking of the potential opportunities realized and challenges faced by farmers ..... 26
Table 6. Grouping of farmers participated in the tree lucerne adaptation trial performance ... 27
Table 7. Effect of growing niche on seedlings survival rate .................................................. 28
Table 8. Survival rate of seedlings as affected by different management and agronomic practices
in the study areas .................................................................................................................. 29
Table 9. Dry matter yield of a year old tree Lucerne plant (t/ha) according to planting space and
site of growth ....................................................................................................................... 30
Table 10. Mean height, of tree lucerne fodder seedlings at different stages of growth ........... 31
Table 11. Mean root collar diameter (RCD) of fodder seedlings at different stages of growth 32
Table 12. Annual dry matter biomass yield of tree lucerne as affected by cutting height and
interval in the study areas ..................................................................................................... 33
Table 13. Average dry matter proportion (%) of tree Lucerne biomass yield separated into leaf,
edible branch and stem at different harvesting intervals and harvesting height ...................... 34
Table 14. Chemical composition and digestibility of tree Lucerne............................................35

xi
LIST OF FIGURES
Figures Pages
Figure 1. Educational status of household heads ................................................................... 19
Figure 2. Gender of households participated in the present study .......................................... 19
Figure 3. Classification of farm households based on their resource endowment ................... 20
Figure 4. Allocation of land for different agricultural activities in the study areas ................. 21
Figure 5. Perception of farmers on the landholding per household over time......................... 21
Figure 6. Reasons for decreasing livestock population as perceived by farmers in (N=205) .. 23
Figure 7. The contribution of different feed resources in the study area ................................ 23
Figure 8 Purpose of establishing tree lucerne fodder by respondent farmers (n=205) ............ 24
Figure 9. The role of gender on seedlings performance in the study area ............................... 25

xii
LIST OF TABLE IN THE APPENDIX
Tables Pages
Appendix Table 1. Ranking opportunity realized and challenges faced by farmers ................ 65
Appendix Table 2. Analysis of variance (ANOVA) for seedlings survival rate (%) as affected
by locations and planting niche .............................................................................................. 66
Appendix Table 3. Analysis of variance (ANOVA) of locations and management practices on
survival rate ........................................................................................................................... 67
Appendix Table 4. Analysis of variance (ANOVA) of locations and plant spacing annual DMY
yield of tree lucerne fodder .................................................................................................... 67
Appendix Table 5. Analysis of variance (ANOVA) of Growth of tree lucerne at different stages
of growth ............................................................................................................................... 68
Appendix Table 6. Analysis of variance (ANOVA) of root collar diameter at different growth
stage ...................................................................................................................................... 68
Appendix Table 7. Analysis of variance (ANOVA) of biomass yield of tree lucerne as affected
by cutting intervals and height in the areas ............................................................................ 69
Appendix Table 8. Analysis of variance (ANOVA) of leaf fractions of tree lucerne as affected
by cutting intervals and height in the areas ............................................................................ 69
Appendix Table 9. Analysis of variance (ANOVA) of chemical compositions of tree lucerne as
affected by different cutting months in the areas .................................................................... 70

xiii
Growth Performance and Nutritive Quality of Tree Lucerne (Chamaecytisus Palmensis) Fodder under Different Management Conditions in the High Lands of Ethiopia
Advisor: Ajebu Nurfeta (PhD, Assoc. prof.) and Co-advisor: Melkamu Bezabih (PhD) and Dr. Kindu Mekonnin
ABSTRACT
Tagasaste (Chamaecytisus palmensis), also known as tree Lucerne, is an evergreen, hardy leguminous shrub that is adapted to high lands of Ethiopia. The objective of this study was to evaluate growth performance of tree lucerne in terms of survival, root collar diameter (RCD), plant height and biomass yield as influenced by different management. To conduct the present study three highlands districts (woredas) located in southern region (Lemo), in Oromia region (Sinana) and Tigrai region (Endamehoni) were selected. Within each woreda, two kebeles were purposely selected to be used as action sites, and from each kebele a minimum of 25 farmers were selected to participate in tree Lucerne adaptation trials. Each farmer received about 150 seedlings to plant and grow. Data were collected on feed resources, household characteristics and survival and performance of the seedlings. The tree lucerne fodder plots established and performed well were used to collect data on the effect of cutting height, and cutting frequency on the biomass yield of fodder. The fodder plants were subjected to two cutting heights (1m and 1.5m), and three cutting frequencies (2, 3, 4 times per year). The average household family size and livestock holdings were 8.08 heads and 10.35 heads, respectively. According to the result about 66% of the land was used for crop cultivation and the remaining 34% was apportioned into improved forage and other back yard trees in the study area. About 85.4% respondents perceived that the landholding size is decreasing, while about 13% of the farmers said that it remained stable over the years. Grazing (both private and communal) contributed the largest share of the feed resources, followed by crop residues. About 44% of the farmers mentioned that their main reason for engaging in tree lucerne cultivation is to produce livestock feed supplement. The maximum survival rate was observed for plants which grew around backyard on small plot followed by that grown on the contour lines, whereas the lowest survival rate was achieved from plants grown around water logged areas. Transplanting too small seedlings showed lower (p<0.05) survival rate as compared to the remaining agronomic and management practices. Planting space of 100cm between rows and 100cm between plants resulted in significantly (p<0.05) higher dry matter yield than 50x50cm spacing. Tree lucerne showed accelerated growth in terms of height and RCD after six months. Annual biomass production was substantially greater for six months cutting interval than for the more frequent harvests in a range of 4.17 to 8.22 t ha–1. Whereas, the two cutting height not showed significant (p<0.05) differences on biomass yield. Leaf proportion of the biomass yield consistently decreased from 63.55 to 54.52% and the stem increased from 2.38 to 16.54% as the cutting interval prolonged from three to six months, respectively. The crude protein contents for the month of June (28%) was significantly (p<0.05) higher than that of October (24.6%), whereas, the other months had intermediate value. There were no significant (p<0.05) differences in IVOMD and ME contents among the different cutting months. The current study revealed that with proper management practices, tree Lucerne can be a suitable protein supplement for ruminant livestock in the study areas. Key words: cutting height, cutting interval, botanical fractions, digestively, crude protein

1
1. INTRODUCTION
Livestock are key components of African farming systems and are increasingly viewed as
important pathways for rural households to escape poverty (FAO, 2010). The livestock of
Ethiopia is estimated to be 53.99 million heads of cattle, 25.5 million sheep, 24.06 million goats,
0.92 million camel, 50.38 million chickens, and 9.93million equine (CSA, 2013). The sector
plays a great role as source of food, income, transportation services, fuels and manures. In
Ethiopia, despite of having good number of farm animals, per unit productivity is quite low.
Among other factors, poor nutrition is a major constraints limiting livestock performance.
Consequently, this leads to high mortality amongst livestock, longer calving intervals, and
substantial weight loss, particularly during dry season usually extending from December to May
in most of Ethiopia (EARO, 2000).
Availability of feed resources is characterized by the highly seasonal fluctuations in both
quantity and quality. Moreover, most of the dry forages and roughages found in Ethiopia have
a crude protein (CP) content of less than 7%, which do not satisfy the requirements of rumen
microorganisms (Van Soest, 1994). When fed alone, such feeds are unable to provide even the
maintenance requirement of livestock (ILRI, 1999). Hay in highlands of Ethiopia is usually
harvested after the CP contents of the pasture passed peak production and the protein content
reduced to less than 5%, which is below the critical level of maintenance requirement for
ruminants (Solomon et al., 2008). Hence, the production of adequate quantities and good quality
dry season forages to supplement crop residues and pasture roughages is the only way to
economically overcome the dry season constraints affecting livestock production in Ethiopia
(Alemayehu, 2002).

2
Browse species have considerable potential in mixed crop livestock production systems, to
supplement low quality feeds. Moreover, they are highly tolerant to drought, fix nitrogen,
restore and regenerate the soil, preventing soil erosion, and are a source of quality food for
livestock when forage is scarce (Felker 1981and Lefroy 2002). This suggests that there is a need
for research to characterize these feed resources in order to sufficiently understand their
constraints for efficient utilization and to identify their relative potential.
Supplementing concentrates to low-quality tropical hay is known to improve intake and
digestibility of roughages (Nurfeta, 2010). However, the use of such a supplement was limited
under mixed livestock production systems; due to the seasonal scarcity of feed and high cost of
concentrates. In order to improve the productive and reproductive capacity of smallholder
ruminant animals, there is a need to look at ways of extending the availability and quality of
feedstuffs produced on smallholder farms. One potential way for increasing the quality and
availability of feeds for smallholder ruminant animals in the dry season could be through the
use of fodder trees and shrub legumes. Therefore, to alleviate the constraint associated with the
seasonal scarcity of feed resources in Lemo, Sinana and Endamehoni woredas, there is a need
to look for alternative protein sources that farmers can establish at their own farm.
Tree lucerne (Chamaecytisus palmensis) seems a promising species: It is a drought tolerant,
perennial, leguminous small tree presently being researched for its fodder potential. It is a
temperate, multipurpose browse legume of major importance to highland areas of Ethiopia and
plant is one of the few highly productive browse species for altitudes above 2000 m (Mengistu,
2002). Its primary uses are forage and fuel-wood but farmers also value it for shelter, bee forage,
nitrogen fixation, and soil conservation purposes (Getinet, 1998 and Mengistu, 2002). Tree
lucerne is highly productive (11 t DM/ha), stays green during the dry season, and has high CP

3
levels 160–220 g/kg DM (Getinet, 1998). As it is leguminous and temperate species, produces
good quality feed insubstantial amounts and there is no side effect in animals fed as sole diet
(Poppi, 1982; Borens, 1986 and Hawley, 1984). Observations in initial adaptation trials indicate
that, it grows up to two to three m height in the first year (Lazier, 1987 and Getnet, 1991).
Eighteen percent CP and 71% dry organic matter digestibility (DOMD) with perfect nutrient
release of mature tree lucerne leaves in the highlands of Ethiopia was reported (Seyoum, 1994).
Tree lucerne productivity, forage quality and proportions of botanical fractions are highly
affected by location, cutting interval and management practices like cutting frequency, cutting
height and fertilization (Borens and Poppi, Townsend and Radcliffe, 1990; McGowan et al,
1992; and Hadera et al, 1993).
Hence, in the present study, the potential of tree lucerne fodder for producing higher yield with
best quality was studied under different cutting height and cutting intervals in the three highland
representative woredas of Ethiopia with the following specific objectives:
• To evaluate growth performance in terms of tree lucerne survival, root collar diameter
stand height and annual yield;
• To assess the effect of growing niche, agronomic and management practices on survival
rate;
• To study the effect of cutting management on biomass yield of tree lucerne;
• To assess the nutritive value of tree lucerne at different cutting months in the area;

4
2. LITERATURE REVIEW
2.1. Browse shrubs and Trees as Source of Fodder for Ruminants
Improved forage and pasture species have diversified advantages. In the perspective of ruminant
livestock production, the main benefit is to produce high biomass with best quality. Leguminous
forages could also complement crop production by maintaining soil fertility through symbiotic
N fixation (Diriba, 2014, Getinet, 1998). Leguminous forage species are important sources of
N, fermentable organic matter and minerals. The most adaptive and productive fodder legume
species include: Tree lucerne (Chamaecytisus palmensis), Leucaena, Pigeon pea (Cajanus
cajan), Sesbania and Calliadra among others (Diriba, 2014).
Browse shrubs play an important role in animal feed in domestic as well as wild conditions.
Browse serves as a supplementary diet as well as sole diet for grazing animals especially in the
tropics during the dry season and in colder regions over the winter (NAS, 1979 and Radcliffe,
1983). Skerman (1977) listed more than 84 different species of browse shrubs and trees of
tropical regions and mentioned their chemical composition, which shows that browse is
generally high in crude protein. Ranawana (1987) reported that out of 200 different plants fed
to animals in Sri Lanka, analysis of 30 different species of tree (17) and shrubs (13) contains on
an average 180 gm crude protein per kilogram dry matter in tree species and 164 gm CP/kg DM
in shrub species. Digestibility was 56% and 57 % for tree and shrubs respectively.
Woody plants, usually low growing trees and shrubs, are useful fodder for livestock and wildlife.
They may be leguminous or non-leguminous, but leguminous plants are favored because of their
ability to fix nitrogen and their relatively high foliar nitrogen (protein) levels (Gutteridge and
Shelton, 1994). Browse species provide flexibility in the timing of their use, and in particular

5
provide green feed when grasses and other herbaceous materials are dry (Lefroy et al., 1992).
Compared to grasses, most leguminous fodder trees and shrubs have higher concentrations of
crude protein, minerals and neutral detergent fiber (Dicko and Sikena, 1992), and generally a
lower concentration of acid detergent fiber and dry matter digestibility (Le Houerou, 1980).
Nutrient levels and digestibility of fodder trees and shrubs also decline slightly over the growing
season and hence their potential value as drought fodder for livestock (Baumer, 1992). Recent
work in Northern Australia showed that the addition of Leucaena leucocephala into pastures
increased the quality and quantity of cattle diets resulting in increased animal production
(McGowan and Matthews, 1992). Many woody plants of the African savannas are browsed or
topped for dry season feed for livestock such as sheep, goats and cattle (Le Houerou, 1980).
2.2 Origin, Taxonomy and Distribution of Tree Lucerne
Tagasaste, formerly also called “tree lucerne” (Chamaecytisus palmensis), is an endemic fodder
tree-shrub from the Canary Islands which has achieved importance in agriculture around the
world, particularly in parts of Australia and New Zealand (Francisco-Ortega et al., 1991, 1993).
It is a member of the Fabaceae family and is native to the Canary Islands. It holds promise for
use in tropical highlands, Mediterranean climates and temperate regions. It grows to a height of
5-6 m, is thorn less and generally well branched. Flowers are white and seed production is
prolific. It is very susceptible to root rot fungus on poorly drained soils such as in southeast
Queensland on a grey podzolic duplex soil where 100% mortality of plants occurred within 2
years (Gutteridge, 1990). Tagasaste is the name given on the island of La Palma, in the Canary
Islands, to the indigenous plant known botanically as Chamaecytisus palmensis; this legume,
belonging to the family Fabaceae (Agfact, 1986).

6
2.3. Adaptability, Climate and Soil Type for Tree Lucerne
Tree lucerne grows well in a range of environments and once established handles climates
ranging well. It has been grown mainly in temperate regions with wet winters and dry summers,
with annual rainfall ranging from 350 to 1600 mm. It has been reported that tree lucerne is
moderate frost tolerant (Milhorpe and Dann, 1991). However, there has also been reported, that
in New South Wales in Australia due seedlings proliferate vigorously along roadside despite
annual frost to – 15 °C (Anonymous, 2000). Once tree lucerne established it is resilient to
drought (Milhorpe and Dann, 1991). Anonymous (2000) reported that ‘seedlings are remarkably
drought resistant and can survive six months of hot weather without rain or irrigation. Of more
importance, established shrubs have a remarkable capacity to recover from defoliation.
Regrowth occurs even in the prolonged absence of rain.
Tree lucerne is adapted to a range of soils, preferring the more freely drained ones, but it does
not do well on low-lying sites subject to water logging (Hawley, 1984). It may be able to cope
with at least moderately acid soils. It is suited to sandy well-drained soils of pH range 5-7
(Agfact, 1986). It is established easily on sandy soils, but tolerates a wide range of soil types
including gravels, loams, acid laterites and limestone (Orwa et. al., 2009). It can grow in a wide
variety of soils, except under waterlogged conditions; it can also tolerate acidic conditions pH
value from 5.1 to 7.5 which demonstrates its usefulness for plantations in areas that are relatively
dry and unfertile for other crops (Snook, 1962; Dann and Trimmer, 1986). Tree lucerne is
relatively free from disease and pests, and is resistant to leaf disease and stem nematodes, but it
is susceptible to root rot (Phytophthora citricola) especially in wet soil conditions (Dann and
Trimmer, 1986).

7
2.4. Agronomy of Tree Lucerne
Tree Lucerne is hard seeded and seeds require scarification in hot water prior to
planting. Seedbeds should be well prepared to a fine with no weeds. Weed control is essential
for successful establishment. Seeds can be directly sown at sowing depths of 1-2.5 cm, although
deeper sowing may be necessary in sandy soils in dry areas to ensure sufficient water for
germination. Tree lucerne is small tree or shrub that grows up to 6 meters tall with dark green
trifoliate leaves, white pea shaped flowers and hairy pods producing around 10 small black
seeds. Tree lucerne tolerates frost and has been found adapted to areas up to and over 3000 meter
above sea level (Moore et al., 2006). It requires an annual rainfall above 600 mm but will not
tolerate water-logging at all, it is drought tolerant once established and grow on wide range of
soils (Getinet, 2007). However, it does best on light, well drained soils (Moore et al., 2006).
2.5. Roles of Tree lucerne
Low quality roughages which form the basal feeds are deficient in nitrogen, energy, vitamins,
and minerals. These nutrient deficiencies affect microbial growth and fermentation in the rumen
resulting in an overall poor animal productivity. Economic constraints of smallholder farmers
in Ethiopia have not encouraged to use chemicals and industrial based concentrates as
supplements to improve the utilization of roughages. Thus, leguminous trees can improve the
utilization of low quality roughages. They are being used more extensively throughout the world
in various production systems. These trees are capable of enhancing both crop production
through soil fertility maintenance and livestock production through increased availability of
high quality feed. Fodder trees can be grown on conventional arable lands or in integration with
soil conservation and different practices such as, backyards, around live/dead fences, as
scattered tree on the contour lines, in alley cropping, and in hedge rows along paths in the

8
farming system. They produce forage for livestock during the dry season when feed shortage is
critical. Like other supplements they provide critical nutrients lacking in the basal diet (Bonsi et
al., 1995). Well-managed plantations remain fully productive without irrigation for many years
(Snook, 1952; 1982). Tree lucerne is mainly used as forage, firewood, improving soil fertility
through nitrogen fixation, against wind and water erosion and as a source of nectar for bees
(Mengistu, 1997). Crop–livestock mixed farming in the highlands of Ethiopian utilize tree
lucerne in tree fallows, on soil bunds, in backyards, and along fence lines (Getinet, 1998).
Tree lucerne is good fodder for ruminant livestock and pigs because the leaf and edible branch
is palatable, nutritious and highly digestible. The digestibility of tree lucerne has been studied
in several sheep feeding trials (Ulyatt et al., 1980). Ulyatt et al. (1980) also reported a DM
digestibility value of 77 %, which is similar to the digestibility values (80 %) for ryegrass and
white clover. The crude protein (CP) content of tree lucerne hay is 200 g CP/kg of DM (Ulyatt
et al., 1980). This exceeds the 70 g CP/kg of DM required by a ruminant animal for maintenance
(Poppi, 1982). Unlike Leucaena which may be toxic due to the presence of mimosine, there are
no reported cases of toxicity in animals grazing tree lucerne (Moor et. al., 2006). According to
Borens and Popi (1986) and Poppi (1982) consuming a sole diet of the tree lucerne leaves for 4
and 9 weeks respectively, showed no signs of ill health.
2.5.1. Multi-purpose role
Elevitch and Wilkinson (2000) pointed out that fodder trees and shrubs have several applications
and uses and hence they serve as good sources of shade, wind shelter, living fence, improved
fallow, improved pasture, mulch, bee forage, human food, fuel wood, timber, fiber, resins, dyes,
tannins, medicine, food, fertility enhancement, soil stabilization, beauty, oxygen, wildlife
habitat, bird habitat, increased self-sufficiency, nutrient cycling, farm diversity. dann and

9
Trimmer (1986) suggested tree lucerne deserved attention as a multipurpose agro-forestry
species on the basis that it fixes atmospheric nitrogen, re-cycles nutrients from depth and
provides shelter for crops, pastures and animals in addition to providing fodder. McGowan
(1991) allude to its multipurpose use on farms in Western Australia and Victoria in the first half
of the century in the form of double-fenced hedgerows that served as paddock boundaries,
windbreaks and fodder reserves. In the early 1990's, landholders in Western Australia and the
lower south east of South Australia began experimenting with alley cropping systems (Lefroy
and Scott 1994). This involved cultivating crops between wide spaced rows of trees in the
expectation that this would reduce wind erosion, have a beneficial effect on crop yields through
microclimatic effects, increase water use, and consequently reduce the rate of dry land salinity.
2.5.2. Palatability/acceptability
The leaves of tree lucerne have been reported as highly palatable. However, livestock take a
little time to get used to it as a feed, and crossbred dairy cows in Ethiopia would not consume
large quantities of wilted forage, resulting in reduced dry matter intake. Tree lucerne is highly
relished by goats and sheep, its relative preference value was found higher than broom and
pampas by both goats and sheep (Lambert et al., 1989).It has a high feeding value, since the
content of secondary plant compounds is generally low. Most elements have been found to be
adequate in leaves, except from P that can be marginal and Na, which is low. It has therefore
been suggested to offer a complete mineral mix to animals grazing tree lucerne (Borens and
Poppi, 1990).
2.6. Nutritive Value and Dry Matter yield Productions of Tree lucerne
Forage quality is a function of many factors including the species, growth stage, plant parts,
agro ecology, agronomy and post-harvest processing practices (Buxton, 1996). Therefore, a

10
given species varies in quality accordingly. Hence, the nutritive value of tree lucerne could be
varied depending on management and season. Tagasaste grown on sites with no fertilizer history
and with poor grazing management is of marginal quality for stock maintenance. Well-managed
plants however provide excellent feed during winter and spring. The most nutritious parts of the
plants are the fresh leafy tips on the ends of stems under 6 mm in diameter. Testing on plants
throughout the Upper South-East has found that new leaf on well-fertilized plants in spring is
about 25% crude protein and up to 75% digestible matter compared to 9% crude protein and
46% digestible matter for edible stems. Feed quality will degenerate if the plants are allowed to
flower (in late winter) and set seed (Stokes, 2008). Tree lucerne has a potential to replace the
conventional protein sources which are becoming expensive and unavailable for small holder
farmers (Mesfin et al. 2011). Tree lucerne has a high palatability and is normally readily
consumed. In vitro dry matter digestibility of the leaves has been found to be high: 0.77 – 0.82
(Borens and Poppi, 1986) and 0.72 (McGowan and Mathews 1992).
Tree lucerne forage has an average CP content of 185g Kg-1 DM within a range of 164-207,
neutral detergent fiber (NDF) of 375 g kg-1DM acid detergent fiber (ADF) of 249 g kg-1DM
and acid detergent lignin (ADL) of 72 g kg-1 DM (Borens and Poppi, 1990; Bonsi et al., 1995;
Adugna et al., 1997). The high level of crude protein makes tree lucerne forage a supplement
feed for poor quality roughage. Among the most common browse trees used in the mid and high
altitude areas, Sesbania sesban has the highest CP and lower fiber content followed by tree
lucerne and Leucanea leucocephala (Getinet, 2007).
Tree lucerne is a high-producing, nutritious legume that is well adapted to a range of climates
throughout the world. Tree lucerne can produce a DM yields of 11,200kg/ha/year have been
reported in Western Australia by (Snook 1986) and of 12,000 kg/ha/year in New Zealand by

11
(Poppi 1982). In the South Island of New Zealand, DM production reported by (Mcleod, 1982)
is 7,000 kg/ha/year out of this leaf DM were 2600kg/ha and stem DM yields of 4,390 kg/ha.
The accumulation of DM by tree lucerne is influenced by the weather. Lambert et al. (1989)
obtained higher DM yield in summer than in winter. In winter and spring, tree lucerne is of high
quality, with crude protein of 20 to 28 percent and dry matter digestibility of 70 to 80 percent.
Tree lucerne at this time of year supports cattle growth rates of 1.0 to 1.5 kg per head per day,
i.e. similar to good quality annual pasture. In summer and autumn, production is reduced to
maintenance and in some seasons live weight (LW) loss occurs, even though the chemical
analysis suggests that tree lucerne should be able to support growth, with crude protein of 15 to
20 percent and dry matter digestibility of 60 to -70 percent - equivalent to good quality hay. Dry
matter production of tree lucerne is also seasonal with rapid growth in winter and spring while
reduced growth in summer and autumn.
Table 1 Edible dry matter (EDM) production (t/ha/yr.) of tree lucerne from five sites in southern Australia.
Rain (mm/yrs.) Soil type EDM Source and location
350 Deep sand 3.2a Eastham et al. (1993), Wongan Hills WA
420 Red-brown 1.1 Milthorpe and Dann (1991), Condobolin NSW
450 Deep sand 3.0 Oldham et al. (1991), New Norcia WA
640 Podsol 2.0 Milthorpe and Dann (1991), Yass NSW
1100 Red gradational 7.9 McGowan and Matthews (1992), Ellin bank Vic

12
2.7. Factors Influencing Yield and Quality of Tree Lucerne Fodder
2.7.1. Plant age at the first cutting
To get a vigorous re-growth of foliage of trees and shrubs after the first cutting a complete
development of the root system is required. Doing the first cutting very early (immature state)
or very late (senescence state) can significantly reduce the re-growth. It is a general practice to
leave legume forage trees uncut until they reach a height of at least 1.0 to 1.5 m. This
establishment period can be greater than one year in many cases (Stür et al., 1994). The benefit
of a long establishment period before the first cutting was demonstrated by (Ella et al. 1991)
showing that the age of the legume forage trees at the first cut was positively related to yield at
subsequent cut.
2.7.2 Cutting Height
Defoliation can be described in terms of intensity. Intensity refers to the amount of leaf and stem
remaining after defoliation. This can range from removal of all plant material above a certain
cutting height (as is often used in experiments) to very lenient defoliation, such as lopping of
only some branches of the trees (Stür et al., 1994). Some researchers have found that higher
cutting heights produced higher DM yield (Blair et al., 1990; Costa and Oliveira, 1992; Hairiah
et al., 1992; Ncamihigo and Brandelard, 1993). However, Blair et al. (1990) reported that in
some cases the cutting height did not affect DM yields. Stür et al. (1994) considered that the
effect of cutting height on the growth Pattern of trees and shrubs is still not clear and requires
more studies concerning the relation between cutting height and number of shoots per plant.

13
2.7.3. Cutting interval
Frequency is how often the tree-lucerne fodder plants are cut or grazed. In general, cutting
interval seems to have a more dominant influence on total DM yield than cutting height
(Sánchez, 2006). Many studies have reported that the highest total biomass yield was obtained
in the longer harvest intervals, although with a lower leaf-stem ratio (Horne et al., 1986; Blair
et al., 1990; Stür et al., 1994), while Lazier (1981) reported that the maximum edible yield of
the shrubs occurred at short cutting intervals.
2.7.4. Season of the year
Cutting forage trees at different seasons of the year (dry season vs. wet season) and at different
stages of development (flowering vs. vegetative) may influence subsequent re-growth.
However, little has been published on these topics (Sánchez, 2006). It may be speculated that
cutting at the beginning of the dry season could result in the exhaustion of reserves and
replenishment of reserves may be restricted by limited moisture availability. On the other hand,
trees and shrubs forage are usually deep-rooted and therefore have access to moisture in the
deeper soil layers. They may also be expected to have a large amount of reserves in stems and
root system, which may not easily be exhausted (Stür et al., 1994).

14
3. MATERIALS AND METHODS
3.1. Area Description:
The study was conducted in the highlands of three districts (woredas) located in southern region
(Lemo), in Oromia region (Sinana) and Tigrai region (Endamehoni). The farming system in the
three woredas is predominantly mixed crop livestock system. In the highland parts of these sites
wheat and barley are the main crops cultivated. Faba bean, field pea, maize and lentil are also
widely grown in these woredas. Cattle are the dominant livestock reared followed by sheep, goat
and equines. Two kebeles were purposely selected from each woreda to be used as observation
sites, making the total study kebeles to be six. These kebeles were selected as they are action
sites for the project called Africa RISING, which has been working on sustainable intensification
of the mixed farming system in the highlands of Ethiopia. One of the research activities
implemented by this project include integration of tree Lucerne as a multipurpose tree in the
highland mixed farming systems.
Table 2 Climatic variability of the study area
Districts Kebele Temp. 0c Annual RF. (mm) Dominant soil type Reference
Lemo Upper-Gana 18 22 900 1300 Nitisol Cambisols
ILRI
Jawe 18 23 900 1400
Sinana Illu-sanbitu 8 22 750 1000 Vertisols
dominant
Salka 6 20 750 1000
Endamehoni Embahasti 6 15 825 1000 Vertisols and
Cambisols Tsibet 2 12 750 1000
Temp. = temperature; mm=millimeter; Min. =minimum; Max. = maximum; LL =low land or ‘Kolla’; Temperate =‘woiena dega’; HL =highland or ‘Dega’

15
3.2. Study Approach
The six kebeles used for the study were Jawe and Upper Ganna from Lemo woreda; Ilu-senbitu
and Selka from Sinana Woreda; and Tsibet and Embahasti from Endamehoni woreda. From
each kebele more than 25 farmers, who showed interest in the tree lucerne research, had planted
seedlings (about 150 seedlings per farmer) during the 2014 main rainy season and these farmers
were used as study respondents. A baseline survey data (which includes among others land size,
family size, education, livestock holding, crops grown and experiences of improved fodder
cultivation grown) have been generated by Africa RISING project at the beginning of the
implementation of the on-farm research. These baseline data were used to characterize and
describe the participant farm households.
The tree Lucerne plots of the farmers were used to generate research data for this study. The
participant farmers were grouped into three based on the growth performance of their fodder
seedlings: Group I: farmers whose tree lucerne seedling did not survive; Group II: farmers whose
fodder seedling established but performed poorly and Group III: farmers whose fodder seedlings
established and performed very well. Analysis of farm typology, management practices of the
tree lucerne seedling, including: planting niche, planting distance, fertilization, watering,
weeding and fencing, applied by each of the three groups of farmers were conducted through
farm visits/observations and conducting interviews using a checklist of questions.
3.2.1. Measurements and sampling procedures
Measuring tape were used to determine planting distances between plants, rows and plant
heights at different stage of growth (three months, six months, nine months and twelve month).
The tree lucerne fodder plots which belongs to Group III (farmers whose fodder plots established
and performed well) were used to collect data on the effect of cutting height, and cutting
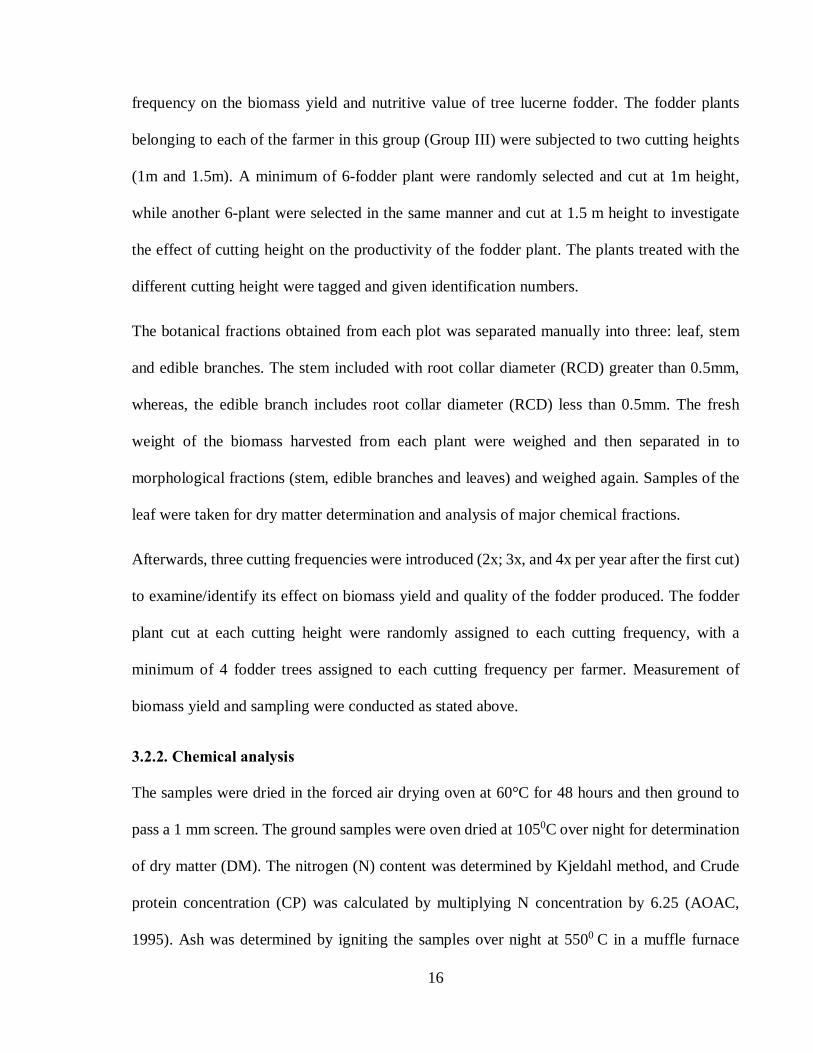
16
frequency on the biomass yield and nutritive value of tree lucerne fodder. The fodder plants
belonging to each of the farmer in this group (Group III) were subjected to two cutting heights
(1m and 1.5m). A minimum of 6-fodder plant were randomly selected and cut at 1m height,
while another 6-plant were selected in the same manner and cut at 1.5 m height to investigate
the effect of cutting height on the productivity of the fodder plant. The plants treated with the
different cutting height were tagged and given identification numbers.
The botanical fractions obtained from each plot was separated manually into three: leaf, stem
and edible branches. The stem included with root collar diameter (RCD) greater than 0.5mm,
whereas, the edible branch includes root collar diameter (RCD) less than 0.5mm. The fresh
weight of the biomass harvested from each plant were weighed and then separated in to
morphological fractions (stem, edible branches and leaves) and weighed again. Samples of the
leaf were taken for dry matter determination and analysis of major chemical fractions.
Afterwards, three cutting frequencies were introduced (2x; 3x, and 4x per year after the first cut)
to examine/identify its effect on biomass yield and quality of the fodder produced. The fodder
plant cut at each cutting height were randomly assigned to each cutting frequency, with a
minimum of 4 fodder trees assigned to each cutting frequency per farmer. Measurement of
biomass yield and sampling were conducted as stated above.
3.2.2. Chemical analysis
The samples were dried in the forced air drying oven at 60°C for 48 hours and then ground to
pass a 1 mm screen. The ground samples were oven dried at 1050C over night for determination
of dry matter (DM). The nitrogen (N) content was determined by Kjeldahl method, and Crude
protein concentration (CP) was calculated by multiplying N concentration by 6.25 (AOAC,
1995). Ash was determined by igniting the samples over night at 5500 C in a muffle furnace

17
(AOAC, 1995). The neutral detergent fiber (NDF), acid detergent fiber (ADF) and acid detergent
lignin (ADL) composition and IVTOMD contents were determined using the Near Infrared
Reflectance Spectroscopy (NIRS) facilities available at International Livestock Research
Institute (ILRI). The metabolizable energy (ME) content was estimated from IVTOMD value
using the equation: ME (MJ/kg DM) =0.15*IVOMD (g/kg) (Beever and Mould, 2000). The
moisture content of plant samples were determined by drying the sample in an oven at 105oC to
a constant mass. The loss after drying is regarded as the moisture that is converted to percentage.
3.2.3. Data analysis
The household survey, data was analyzed by using descriptive statistics. The collected data from
farmers field were entered in to SPSS statistical program (PASW statistics version 16) and
analyzed with the procedure of general linear model, univariate analysis of variance and means
compared using Duncan Significant Difference (DSD) test at (p<0.05) levels. Analysis of
variance (ANOVA) was carried out to test the effect of cutting height and interval on the biomass
yield and botanical fractions. The effect of location and plant spacing on annual DMY, the effect
of growing niche, agronomic and management practices were analyzed by using the univarate
analysis. The data for prioritized challenges and opportunities were ranked by using Index
method (Kosgey, 2004). The leaf: stem ratio was calculated by dividing the dry weight of leaf
(grams) by (dry weight of stem + dry weight of leaf in grams).
Survival percentage of seedlings was calculated as the number of trees surviving during the
experiment period divided by initial tree number times 100%.

18
4. RESULTS
4.1. Household Survey
4.1.1. Socio-economic characteristic of the study area households
The average family size of respondent households is presented in Table 3. The age group
between 16 and 60 years accounted the largest portion of family (33.4%), followed by the
age group between 10 and 15 years (22%), and between 6 and 9 years (21%). On the other
hand family members above 60 years of age constituted the lowest proportion (5.3%). The
mean family size ranged from 0.43 to 2.7 for age group above 60 and age group (16- 60)
respectively in the study area.
Table 3 Family size by age category of respondent households in the study area (N=205)
Family size Mean ± SE % of HHs
Age group under 6 years 1.47±0.04 18.3
Age group 6 - 9 years 1.70±0.06 21
Age group 10 - 15 years 1.78±0.06 22
Age group 16 - 60 years 2.7±0.09 33.4
Age above 60 years 0.43±0.03 5.3
Total family size 8.08±0.29 100
N-number of respondent; the values are expressed as mean ± standard Error
Figure 2 shows the educational status of the respondents in the present study. The data
revealed that about 24% of the farmers had not attended any formal education and were
categorized as illiterates, whereas, the other 43%, 23% and 8% of the farmers had attended
elementary level education (grade 1-6), junior and secondary school education (grade 7-

19
10), and high school education, respectively. In addition few farmers (1.5%) were also
found to have completed college education (Figure 2)
Figure 1. Educational status of household heads
Figure 3.Shows the gender distribution of the study population in the research sites. The
result revealed that male headed households dominated the study population accounting for
85% of the total, whereas the remaining 15% were female headed households.
Figure 2 Gender of households participated in the present study
0
5
10
15
20
25
30
35
40
45
50
Illiterate grade 1-6 grade 7-10 grade 11-12 Some Diploma
Perc
ent o
f res
pond
ets
85.9
14.1
Male Headed Female headed

20
Figure 4 presents farm typology of responds based on their resource endowment. The
majority of the respondents (about 69%) were categorized as middle-income farmers,
whereas, low income and better-off groups constituted 16%, and 15% of the study
population, respectively.
Figure 3. Classification of farm households based on their resource endowment
4.1.2. Land use and trends of landholding in the research site
Figure 5 shows the mean percentage of land allocated for major livelihood activities
including crop cultivation, grazing, fodder trees and backyard gardening. According to the
result, about 66% of the land is used for crop cultivation and the remaining 34% is
apportioned into grazing fodder and other trees and backyard gardening.
0
10
20
30
40
50
60
70
80
Low income Mid-income Better-off
perc
ents
of r
espo
nden
ts

21
Figure 4. Allocation of land for different agricultural activities in the study areas Respondents were requested to indicate their perceptions about the landholding per
household over the years in the areas, and Figure 6 shows the results of the farmers’ response.
Most of them (85.4%) perceived that the landholding size is decreasing, while about 13% of
the farmers said that it remained stable over the years. However, a small proportion of the
farmers (1.5%) indicated an increase in the land holding over time (Figure 6).
Figure 5. Perception of farmers on the landholding per household over time
0
10
20
30
40
50
60
70
crop cultivation Grazing Fodder trees Backyard garden
Perc
ent o
f tot
al la
nd
0
10
20
30
40
50
60
70
80
90
Increasing Decreasing Stable
Perc
ent o
f far
mer
s

22
4.1.3. Livestock species composition and its trend in the area
The average number of livestock species and its trend per household is presented in Table 4.
Cattle, sheep, goat, chicken and equine (horse, donkey and mule) were reared in the study
areas. Cattle were the dominant livestock species in the study area. Respondents were asked
about their observation on the trend of the different livestock species holding over the years,
and the majority (59-82%) replied that the livestock holding is decreasing from time to time,
and the trend appears the same across the livestock species.
Table 4 Average livestock holding and its trend based on survey respondents (n=205)
Livestock species Mean ± SD Trend of livestock species
Increasing (%) Decreasing (%) Stable (%)
Cattle 5.4 ± 3.8 12.1 75.8 12.1
Sheep 1.4±1.7 11.80 58.8 29.4
Goat 0.6±1.1 21.4 64.3 14.3
Chicken 2.2±2.6 13.8 58.6 27.6
Horse 0.1±0.6 11.1 77.8 11.0
Mule
Donkey
0.3±0.5
0.35±0.6
0.0
0.0
76.5
81.8
23.5
18.2
Figure 7 shows farmers’ perceived reasons for decreasing livestock population in the study
areas. About 51% of the farmers believed that feed shortage was the main reason responsible
for the decreasing livestock population, while about 18%, and 31% of the farmers mentioned
disease and population pressure, respectively, as the main cause for the decreasing trend
(Figure 7).

23
Figure 6. Reasons for decreasing livestock population as perceived by farmers in (N=205)
4.1.4. Major feed resources
The major feed resources and their contributions are shown in Figure 8. Grazing (both
private and communal) contributed the largest share of the feed resources, followed by crop
residues, oat-vetch forage and desho grass, and hay. Concentrate supplements also
contributed to about 7.5% of the feed resources, and tree Lucerne foliage about 5%,
according to the respondents (Figure 8).
Figure 7. The contribution of different feed resources in the study area
0
10
20
30
40
50
60
Feed shortage Disease Population pressure
Perc
ent o
f far
mer
s
0
5
10
15
20
25
30
Crop residues Privategrazing land
Hay Communalgrazing
concentrates Tree Lucerneforage
Oat-vetch &desho grass
Perc
ent c
ontri
butio
n

24
4.1.5. Reasons for establishing tree Lucerne in the area
Figure 9. Shows the response of respondent farmers as to their main purpose of growing tree
Lucerne in their farmland. About 44% of the farmers mentioned that their main reason for
engaging in tree lucerne cultivation is to produce livestock feed supplement, while about
13% and 8% mentioned soil fertility function and seed production. Fencing, firewood and
ornamental functions were rated low (Figure 9).
Figure 8 Purpose of establishing tree lucerne fodder by respondent farmers (n=205)
4.1.6. Role of gender on overall seedlings performance
The role of gender on overall seedlings performance is presented in (Figure 10).
Comparatively more than half of the tree lucerne seedlings research protocol were conducted
on male household head (MHH) farm field, whereas, less fodder seedlings plots were chosen
from female household headed (FHH). However, the field evaluation result showed that
about 34.9% of the fodder seedlings from MHH plot were not survived, whereas, only about
0
5
10
15
20
25
30
35
40
45
50
Livestock feed Soil fertility Seed collection Fencing FirewoodOrnamental purposeUnknown
Per
cent
of f
arm
ers

25
16.7% from FHH were not survived. Even if less participation of female in the research
protocol, more well performed seedlings have been observed from FHH (Figure 10).
Figure 9. The role of gender on seedlings performance in the study area
4.1.7. Potential opportunities and challenges for seedlings establishment
Several opportunity and challenge could be the factor for the establishment and survival of
the fodder seedlings; however the factors may not have equal contributions. In the present
study five major opportunities and eight challenges were ranked. Potential niches were one
of the main ranked opportunities for Lemo and Endamehoni woreda respondents, whereas,
land for the future expansion of the fodder seedlings was the main ranked opportunity for
the Sinana site respondents. In contrast to this, the availability of land was main challenge
for fodder seedlings establishment in Endamehoni and Lemo site. Poor survival of the
seedlings due to animal browsing and inadequate technical support were ranked as the major
challenges in Sinana site. Availability of water for dry season irrigation was observed as one
of the good opportunity by Sinana and Endamehoni sites farmers. Planting the fodder
seedling around water logged area was ranked as the main challenge in Lemo site.
0
10
20
30
40
50
60
Didn'tsurvive
Poorlysurvived
Perform verywell
See
dlin
gs s
tatu
s
MHH FHH

26
Table 5 Ranking of the potential opportunities realized and challenges faced by farmers during tree Lucerne fodder seedlings establishment period in the research sites
Opportunity realize
Lemo Sinana Endamehoni
Index Rank Index Rank Index Rank
Availability of enough labor 0.264 2 0.174 4 0.179 4
Availability of land for expansion 0.135 5 0.255 1 0.110 5
Potential niche 0.271 1 0.210 2 0.266 1
Availability of water for irrigation 0.149 4 0.197 3 0.209 3
Farmers motivation for the technology 0.181 3 0.164 5 0.236 2
Challenges faced by farmers:
Less preference of farmers 0.072 6 0.146 4 0.081 6
Less knowledge on how to establish 0.036 8 0.105 5 0.107 5
Lack of water for irrigation 0.216 2 0.090 6 0.069 7
Inadequate technical support 0.125 4 0.175 2 0.135 4
Limited HHs land holding 0.164 3 0.028 8 0.230 1
Poor tolerance due to water logged 0.226 1 0.048 7 0.019 8
Low survival due to animal browsing 0.106 5 0.241 1 0.174 3
Less survival due to prolonged dry season 0.055 7 0.167 3 0.185 2
NB= Index = sum of (3×number of HHs ranked 1st) + (2 × number of HHs ranked 2nd) + (1×number of HHs ranked 3rd) for each reason divided by sum of (number of HHs ranked 1st) + (number of HHs ranked 2nd) + (number of HHs ranked 3rd) for all reasons.

27
4.2 Measurement and observations
4.2.1 Grouping of participant farmers based on the performance of seedlings
The farmers who have been participating in tree lucerne adaptation trial in Sinana, Lemo and
Endamehoni sites were grouped into three categories based on the level of survival and
growth of the seedlings. The first group included those farmers whose seedlings did not
survive. The proportion of the farmers who fell into this group was 14% in Lemo and 8.2%
each in Sinana and Endamehoni sites (Table 6). The second group included those farmers
whose seedlings performed poorly and the proportion of the farmers who fell under this
category ranged from 26 to 33% across the three sites. The last group included those farmers
whose seedlings survived and performed well, and the majority of the farmers (57-59%) fell
into this category (Table 6).
Table 6 Grouping of farmers participated in the tree lucerne adaptation trial based on survival and growth performance
Farmer
groups
Seedling performance
Woreda
Average
(%)
Lemo
(n=93)
Sinana
(n=51)
Endamehoni
(n=61)
% % %
I Seedling did not survive 14.0 8.2 8.2 10.14
II Seedling perform poorly 26.9 34.9 32.8 31.53
III Seedling perform well 59.1 56.9 59.0 58.33
4.2.2. Survival of seedlings as affected by different planting niche
The major planting niche for the study area is presented in Table 7. The maximum survival
rate was observed for plants which grew around backyard on small plot followed by that
grown on the counter lines, where the lowest survival rate was achieved from plants grown

28
around water logged areas. Planting fodder seedling around backyard and as scattered trees
on the counter line showed significantly (p<0.05) higher survival rate among remaining
growing niches. However, planting seedlings around water logged areas showed
significantly (p<0.05) lower survival rate. The fodder seedlings survival rate was similar
among the different locations.
Table 7 Effect of growing niche on seedlings survival rate
Values followed by the same letters in column are not significantly different at (p<0.05); Survival percentage of seedlings was calculated as the number of trees surviving during the experiment period divided by initial tree number times 100%.
4.2.3. Agronomic and management practice affecting the survival rate of seedlings
The effect of agronomic and management practices on seedlings survival rate is presented in
Table 8. The result showed that weeding, mulching and fencing/protection significantly
(p<0.05) improved the survival rate of seedlings in comparison to other agronomic and
management practices. Transplanting too small seedlings showed lower (p<0.05) survival
Growing niche
Seedling survival (%) Overall
(%) Lemo Sinana Endamehoni
Home gardens around live/dead fence 41.77±4.73 39.20±8.73 42.56±3.90 41.18ab
Backyard on small plot 56.89±4.07 52.82±4.60 54.18±4.26 54.63a
On the contour line 51.94±5.04 48.65±5.63 49.50±9.76 50.03 a
As hedges along pathways 45.58±6.17 41.36±5.80 41.13±5.27 42.69ab
Open land around free grazing 25.81±6.17 21.62±5.41 23.64±5.27 23.69c
Around water logging area 3.96±1.76 5.5±1.51 4.25±1.56 4.57d
Wood land around boundary 29.65±5.22 - 34.43±4.75 32.04bc
Significance (P-value)
Woredas NS
Growing niche ***
Woredas * Niche NS

29
rate as compared to the remaining agronomic and management practices. Generally survival
rate was significantly higher for farmers who applied weeding, mulching, watering, fencing
and fertilization. High mortality rate of seedlings was recorded with those farmers who did
not have awareness on the mentioned agronomic practices.
Table 8 Survival rate of seedlings as affected by different management and agronomic
practices in the study areas
*others = Protections/fencing, mulching, watering/irrigations, proper hardening up, use of optimum seedlings size for transplanting; Values followed by the same letters with in the column are not significantly different
4.2.4. Dry matter yield of seedlings as affected by plant spacing and site
Table 9 shows the biomass yield data according to plant spacing and site. The different sites
in the area resulted in similar dry matter yield, whereas plant spacing showed significant
(p<0.05) differences for annual dry matter yield. The 100 × 100cm plant spacing showed
significantly (p<0.05) higher dry matter yield than the remaining plant spacing. The 50 ×
100 and 50 ×50cm plant spacing were not significantly (p<0.05) different.
Agronomic and management
practices
Locations/sites
Overall
(%)
Lemo Sinana Endamehoni
Survival (%) Survival (%) Survival (%)
Protections and fencing only 45.22±3.75 43.27±6.70 44.50±5.59 44.33 b
Watering/irrigations only 42.26±3.35 45.21±4.99 42.39±5.66 43.29b
Weeding, and others* 66.84±2.94 62.75±4.01 64.43±3.35 64.67a
Transplanting too small seedlings 18.70±3.87 21.82±3.87 20.61±3.27 20.38d
Inadequate hardening up 28.88±3.76 31.62±5.30 30.02±4.52 30.17c
Significance (P-value)
Woredas NS Management practices *** Woredas * management NS

30
Table 9. Dry matter yield of a year old tree Lucerne plant (t/ha) according to planting space
and site of growth
Planting
spacing (cm)*
Dry matter yield (t/ha) Overall
Mean SEM P- value
Lemo Sinana Endamehoni
50×50 3.28 3.01 3.21 3.2b 0.17
0.001 50×100 3.83 3.6 3.56 3.65b 0.17
100×100 4.88 4.22 4.65 4.75a 0.18
Overall mean 4.39 3.6 3.61 3.87
SEM 0.15 0.20 0.17
P-value 0.627
*50×50 refers to 50cm between plants and 50cm between rows; 50×100 refers to 50 cm between plants and 100cm between rows; 100×100 refers to 100cm between plants and 100cm between rows; Values followed by the same letters are not significantly different at (p<0.05); the DMY is expressed as tone per hectar per year (t/ha/year)
4.2.5. Growth and root collar diameter at different growing stages
The mean height of seedlings recorded at 3, 6, 9 and 12 month of growth are presented in
Table 10. The mean height reached about 51cm after 3 months of growth, 94cm after six
months, 221cm after 9 months and 280cm after 12 months. The result shows that the growth
rate of the seedlings accelerated after six months of establishment. There was no significant
(p<0.05) effect of site on the growth performance of the seedlings.

31
Table 10 Mean height, of tree lucerne fodder seedlings at different stages of growth
Woredas/sites Stages of growth (cm) Overall
mean SEM
3 month 6 month 9 month 12 month
Lemo 50.61d 106.82c 218.24b 281.80a 164.37 6.83
Sinana 48.88d 89.79c 218.07b 277.25a 158.50 6.94
Endamehoni 52.30d 84.41c 228.92b 280.46a 161.52 6.98
Overall mean 50.60 93.67 221.74 279.84
SEM 8.01 8.03 7.96 7.95
P-value
Stages of growth ***
Sites/woredas NS
G. stage*Sites NS
Values followed by the same letters within the same rows are not significantly different at (p<0.05) G. stages =growth stages of tree lucerne
The average increase in root collar diameter under the different growth stage of tree lucerne
is presented in Table 11. The mean root collar diameter of seedlings reached about 0.44mm,
0.78mm, 1.40mm, and 1.7mm at 3 months, 6 months, 9 months and 12 months respectively
after transplanting. The rapid growth in RCD also observed after 6months of seedlings
planting out.

32
Table 11 Mean root collar diameter (RCD) of fodder seedlings at different stages of growth
Woredas/sites Root collar diameter (mm) Overall
mean SEM
3 month 6 month 9 month 12 month
Lemo 0.46d 0.78c 1.45b 1.82a 1.13 0.035
Sinana 0.42d 0.74 1.27b 1.69a 1.03 0.035
Endamehoni 0.45d 0.81c 1.49b 1.70a 1.11 0.036
Overall mean 0.44 0.78 1.40 1.70
SEM 0.04 0.041 0.041 0.041
P-value
RCD 0.000
Sites/woredas 0.117
RCD * Sites 0.693
Values followed by the same letters within the same rows are not significantly different at (p<0.05)
4.2.6. Effect of cutting management on biomass yield of tree lucerne
Table 12 shows the dry matter biomass yield of tree Lucerne fodder when cut at different
heights (1m and 1.5m) and frequencies (two to four times per year). The biomass yield under
a combination of these two treatments varied widely, ranging from 3.16 to 8.87ton
DM/ha/year. The two cutting heights showed no statistically significant (p<0.05) difference
on dry matter biomass yield production, although there was a trend for the fodder cut at 1.5m
height to have numerically higher biomass yield. However, cutting intervals significantly
(p<0.05) affected the productivity of tree lucerne in the area. The highest biomass yield was
recorded from the prolonged cutting interval (6month), whereas the lowest biomass yield
was obtained from the frequent cut fodder.

33
Table 12 Annual dry matter biomass yield of tree lucerne as affected by cutting height and
interval in the study areas
Cutting height (m) Cutting interval (month) Overall
mean
SEM 3 4 6
1meter 3.16c 6.37b 7.53a 5.69 1.01
1.5meter 5.16c 7.64b 8.87 a 7.22 0.991
Overall mean 4.17 c 7.01b 8.22 a
SEM 0.65 1.22 0.82
P- value
Cutting height NS
Cutting interval ***
Height * interval NS
Different superscripts within rows denote significant difference (P < 0.05)
4.2.7. Botanical fractions of tree lucerne as affected by cutting height and interval
The effects of cutting interval on the proportion of botanical fractions (leaf, edible branches
and stem) of tree lucerne are shown in Table 13. The dry leaf proportions consistently
decreased from 63.55% to 54.52% while the stem increased from 2.38% to 16.54% as the
cutting interval increased from 3months to 6 months. The Edible branch contents vary from
28.88% (three months) to 34.08% (six months) as cutting interval increased. All the leaf,
edible branch and stem proportions showed significant (P < 0.05) differences among the
different cutting intervals. The leaf to stem proportion decreased from 96.39% to 76.72% as
the cutting interval increased from three month to six months.

34
Table 13 Average dry matter proportion (%) of tree Lucerne biomass yield separated into leaf, edible branch and stem at different harvesting intervals and harvesting height
Cutting height (m)
Botanical
fractions
Cutting interval/frequencies (Months) Overall
mean 3 4 6
1meter
Leaf 62.49a 58.6b 53.44c 58.18
Edible branch 35.63a 30.40b 29.27c 31.77
Stem 1.88a 10.99b 17.2c 10.05
1.5meter
Leaf 64.61 a 58.20b 55.6c 59.47
Edible branch 32.53 a 30.33b 28.49c 30.45
Stem 2.87 a 11.47b 15.87c 10.07
Overall mean
Leaf 63.55a 58.41b 54.52c
Edible branch 34.08a 30.37b 28.88c
Stem 2.38c 11.23b 16.54a
Leaf: stem ratios 96.39 83.87 76.72
Different superscripts within rows denote significant difference (P < 0.05)
4.2.8. Chemical composition and digestibility of tree lucerne leaf fractions
The chemical compositions and digestibility for tree lucerne harvested at the different
months are presented in Table 14. The ash content for the months of July and October were
significantly higher than the remaining months. The crude protein contents for the month of
June was significantly (p<0.05) higher than that of October, whereas, the other months had
intermediate value.
The highest NDF and ADF contents were observed in July. The ADL contents for the months
of July, October and April were higher than that of May. There were no significant (p<0.05)
differences in IVOMD and ME contents among the different cutting months. The
hemicellulose (HC) and cellulose content for tree lucerne harvested under the different
months showed significant (p<0.05) differences.

35
Table 14 Analysis of variance for chemical composition and digestibility of tree Lucerne leave fractions harvested at different months of the years
Cutting
month
Chemical compositions of tree lucerne (%,ME(MJ/Kg) Ash CP NDF ADF ADL IVOMD ME HC Cellulose
April 5.14±0.1b 25.22±0.6ab 50.09±0.7 b 26.44±1.1bc 11.71±0.7 ab 59.53±0.6 8.35±0.1 23.65±0.6ab 14.67±0.5b
May 4.97±0.2b 25.82±1.8ab 47.83±1.3 b 21.68±1.2bc 8.05±0.6c 61.5±0.8 8.55±0.1 26.06±0.8a 13.63±0.7b
June 5.10±0.3b 28.10±2.3a 48.22±0.9b 22.63±1.2bc 8.98±0.8bc 61.58±0.9 8.53±0.1 25.6±1.1a 13.65±0.5b
July 6.42±0.2a 27.79±0.4ab 57.40±1.8 a 35.40±1.2 a 14.23±0.8a 59.47±0.6 8.31±0.1 22.0±0.6bc 21.17±1.3a
October 6.32±0.1a 24.61±0.8 b 49.28±0.9 b 28.75±0.8 b 13.61±0.5a 59.59±0.6 8.36±0.1 20.54±0.3b 15.14±0.4b
overall 5.59±0.2 26.31±1.2 50.56±0.9 26.98±1.1 11.32±0.7 59.94±0.3 8.42±0.1 23.57±0.7 15.65±0.7
P-value months
0.000 0.037 0.000 0.000 0.000 0.118 0.177 0.000 0.000
Values followed by the same letters within each column are not significantly different at (p<0.05) level according to Duncan Significant Difference (DSD) test. Values are expressed as mean ± standard error, CP= crude protein; NDF= neutral detergent fiber; ADF= acid detergent fiber; ADL= acid detergent lignin; NS= non-significant; SD= standard deviation; IVOMD= True Invitro Organic Matter digestibility percent; Hemicellulose = NDF - ADF; cellulose= ADF-ADL

36
5. DISCUSSION
5.1. Survey
5.1.1. Household characteristics, educational status and gender role
The average family size in the current study is similar with average family size of (8.2 and 7.2)
in Bahir Dar zuria and Mecha districts, respectively (Asaminew et. al., 2009). The average
family size noted in the current study was nearly lower than the average report of 9.92 ± 0.52
heads by Dawit et al. (2013). However, the family size reported in this study is greater than the
value reported by CSA (2003) which noted the average family size of (6) person per households
in Wolayita Zone. In the current study most of the study area households are in working age
level (16 to 60 years). This could be considered as opportunity of the study area and this might
enhances the productivity of agricultural sector. The current finding noted that more than half
of the participants of the study area had junior level education (grade 1-6). Education is one of
the major tools to disseminate new technology in the agricultural sector, and the fact that the
majority of the households can read and write could make it easier to introduce improved
agricultural technologies. Hence, the high level of education in the study area could increases
value on agricultural technology scaling up. This observations has consistence with Mulugeta,
(2005) who reported that low level of education of the households could have an influence on
the use of agricultural technologies and their contribution in development.
In the current study less participation of female was observed. The reason for minimal female
involvement in tree lucerne establishment could be mainly due to cultural factors such as their
pre-occupation with a lot of primary household activities such as child care, food preparation
and collection of firewood which traditionally are not associated with males. This observations

37
has an agreement with the findings of Zeleke and John (2010) in the highlands of Ethiopia
whereby female-headed households were less likely to establish trees than male headed.
5.1.2. Land holding and its trend
The current result showed that the higher proportion of land owned by the households was used
for crop production. Hence the current observations agreed with the work of Solomon et al.
(2014) who reported that 76.12% and 18.8% land is allocated for crop productions and grazing,
respectively. This might be explained as one of the case for the shortage of feed resources in the
area. The current study noted that the trend of land holding in the area is decreasing from time
to time. The reason for decrease in land holding could be population growth, urbanization, need
of land for social services and land degradation in order of their influences. To reduce the current
land degradations and hunger there is a need for building up organic matter in the soil and
increase food supply on sustainable basis through adoptions of suitable trees/shrubs
(Nduwayezu et al., 2005).
Almost all farmers reported a decrease in grazing area in the past ten years because of the
practice of converting grazing lands to crop fields which is driven by the ever increasing human
population. A study by Firew and Getenet (2010) also indicated that in Amhara National
Regional State of Ethiopia the feed supply of the natural pasture is decreasing for the same
reasons. Therefore, the current result indicated that the encroachment of crop land over the
grazing land, which leading to the weak integration of crop- livestock farming in the study area.
5.1.3. Livestock composition and its trend in the area
The average number of cattle is significantly higher than other livestock species. The reason
might be in mixed farming system of Ethiopia where crop production is important; cattle are the
most important livestock species for cultivation, threshing, manure and milk production

38
(Getachew et al., 1993). The present study agreed with the work reported by Daodu et al. (2009)
who study in Oyo area of Southwest Nigeria and reported that; of the ruminant, cattle are more
with (48%) of the population compared to sheep (28%) and goats (24%). Moreover, Girma et
al. (2014) reported closer findings to current results who accounted cattle and sheep, poultry and
donkey in importance of rank order.
The current study screened out main constraints for livestock production in the area. Feed
shortage, population pressure and animal disease are the leading one. The interaction of these
constraints could affect the performance and the genetic potential of animals leading to
subsistence level of livestock production and each of these constraints might be caused by
different natural and man-made factors interrelated with each other (Agajie, et. al., 2001). Also
Mohammed et al. (2004) revealed that the combined factors responsible to low benefit obtained
were low emphasis withdrawn to the sector and poor husbandry (poor feeding, diseases
management, housing and technology) accessed and supplied.
5.1.4. Major feed resources and purpose of tree lucerne establishment in the area
The major sources of feed resources for livestock in the current study is both grazing and
browsing followed by crop residues. This finding is in line with the work of Seyoum et al. (2001)
in the high lands of Ethiopia. It has also consistence with the work of Mesfin (1992) who
reported that grazing and browsing account for nearly 88 % of the total feed supply in Ethiopia.
It was observed that around homesteads of some households, there was improved fodder tree as
live fence, but some farmers did not feed to their animals because of lack of awareness.
According to the study, some respondents are not growing forage crops which might be
explained as scarcity of land and lack of awareness for the study area farmers. Hence, similar
result is observed from Dandi District, Oromia Regional State, by (Duguma et. al., 2012).

39
According to the participant farmers opinions , tree lucerne is adopted and established in the
area for multi- purpose uses like livestock feed, soil fertility, seed productions and others. This
observation agrees with the work of Takele (2014) in Wolayita zone Soddo Zuria Woreda.
According to the same author multi-purpose trees (MPFTs) are miracle tree used as meeting
under the tree shade, providing service like boundary demarcation or barrier, soil erosion
protections and as livestock feed resources in the area. Multipurpose fodder tree resources can
increase feed resource base for the season of feed gap to supplement poor quality roughages, as
the MPFTs are rich in CP, minerals and energy and can maintain their feeding value for extended
period of time due to their deep root system (El Hassan, 2000; and Zomer 2009).
5.1.5. Potential opportunities and challenges faced by farmers
During on farm establishment of fodder seedlings several factors have been assessed. At all sites
farmers have their own constraints and opportunities during tree lucerne establishment periods.
Lemo woreda has enough labor for implementing the different agronomic practices as compared
to the remaining woredas. Sinana woreda has no fear in case of land availability for tree lucerne
establishment. The potential of planting niche is relatively good in all sites.
Farmers’ participations/motivations at all stages of management practices for tree lucerne
establishment in Endamehoni and Lemo woredas is well as compared to Sinana woreda.
According to the informations revealed from Sinana site, more than half of the woreda
respondents who participated in tree lucerne research protocol are relatively categorized in to
better income class. Hence, the farmers gave more attention for their crops, livestock, and other
non-farm more profiting activities. Due to this reason no one could care for the fodder seedlings
and this could be one of the case for the poor surviving of the seedlings in this site. The
motivation for establishment of fodder in Endamehoni woreda farmers is comparably higher

40
than the remaining woredas participant farmers. In generally successful improved forage
production program programs must be adapted to the economic, social and environmental
conditions in each region where they are to be implemented (Mengistu, 2002).
One of the prioritized challenges in the Lemo & Endamehoni woredas is less land holding. But
this is unfortunately accounted as the main opportunity in Sinana woreda. So the woreda has a
better access for the tree lucerne fodder expansion in the future as compared to the Endamehoni
and Lemo woredas.
5.2. Measurement and Observations
5.2.1. Effect of planting niche and locations on survival rate
Successful establishment of tree legume species will only be achieved if the characteristics of
the proposed planting niche are matched against the climatic and edaphic requirements of the
species. If the establishment requirements are not fully met, growth of seedlings will be poor
unless the soil is amended or an alternative site is found (Shelton, 1992). Fodder tree and shrubs
growing niche identified in the area ensure that the trees serve other purposes like boundary
demarcation, soil conservation and fuel wood production to make the technology more attractive
to farmers (Getinet, 1998; Kindu et. al., 2013).
As noted in the current study back yards are the most intensively used niches and often consisted
of a mixture of plants. Different tree and shrub species, including indigenous medicinal plants
and fodder trees were planted in mixtures around the backyard. More than half of the seedlings
planted around backyard survived and performed well. The reason might be that this niche is
found near to residential home, hence, it gets more chances for manure applications, mulching
and other agronomic and management practices by women without expending more labor. The
current observations is conformity with the work of Kindu et al. (2013) who indicated backyard

41
were preferred because they were more accessible and easy to involve women and the youth,
the gender groups that often manage the established vegetation.
The present observation in Lemo site showed that growing tree lucerne with integration of others
crops and livestock forage (desho grasses, elephant grasses) in the crop land especially on the
contour lines. But, most farmers could not easily accept planting of tree lucerne on their crop
land because of fear of tree competition for moisture and nutrients. This observation is in line
with the work resulted by Kindu et al. (2013) who reported that tree and shrub species could be
integrated in crop land with different arrangements; however, farmers could not easily embrace
planting of new trees because of fear of tree competition for moisture and nutrients; in addition
to the difficulty in use of oxen ploughing. In fact, because of shelter, soil conservation and
nitrogen benefits, well-designed contour forage strips frequently increase the productivity of the
area between contours in addition to the products from the contours itself (Alemayehu, 2002).
The same author pointed out that Pioneer species such as Pigeon Pea, Phalaris, and Greenleaf
Desmodium are particularly reliable understory species when planted with Leucaena or tree
lucerne on the contour lines.
Establishing tree lucerne around open land in free livestock grazing area is observed as the main
planting niche for the selected woreda specially Sinana site. However, livestock browsing might
be a major challenge to this tree growing niches. Closer results by Kindu (2001) depicts
uncontrolled browsing has effect on tree and shrub species integration success.
In the current study planting fodder seedlings around water logged area has been noted as the
main factor for the poor survival and performances of tree lucerne over the study area. This
finding agreed with the work of Hawley (1984) and Getinet (1998) who reported that tree
lucerne is susceptible to water logging & saline conditions. The reasons for choosing of this

42
planting niche might be due to land shortage and less awareness creations from the stockholders
especially in Lemo and Endamehoni sites.
5.2.2. Management factors affecting survival rate of fodder seedlings
Protections and fencing is one of the non-agronomic management practices which enhances
survival and growth performance of fodder seedlings by saving seedlings from browsing of wild
and domestic animals. Stealing or intentional damaging of seedlings by human beings could be
also minimized by fencing and security. In the present investigation, growing of tree lucerne
around open land/free grazing area in Sinana site has been observed as the main reason for
higher mortality of seedlings as compared to remaining sites. This result is consistent with the
work of Kindu et al. (2013) who reported that free grazing had been identified as one of the
constraints limiting tree/shrub integration activity. In fact, livestock browsing problem is
relatively low for those grown around backyard on small plots over the study sites, since
household members could watch the livestock for better protection and management of newly
planted fodder seedlings.
In the current study weeding is noted as the main agronomic practices for the seedlings
performances. Competitive interference imposed by weeds on the growth of establishing tree
lucerne can markedly limit the biological 'space' which a seedling can occupy. Supplies of
moisture, light and nutrients can become extremely limiting because of the competition for these
resources by either existing or newly emerging weeds. Hence, the current observations agreed
with the work reported by Cook and RatcIiff (1985) who examined that the relative competitive
effect of weeds on establishment and performance of legume trees. The numerically lower
seedlings survival and slow growth of fodder seedling in Sinana site might explain the
inadequate weeding practices of some farmers in the areas. This result is similar with the work

43
of Shelton (1992) who reported that the reason for poor seedlings survival and slow growth of
many tree legumes is competition of fast growing weeds which may slow or completely
dominate their growth. Therefore, young seedlings should be protected from weed competition
until they are well established.
In the present observations transplanting too small fodder seedlings is the major prioritized
problem for the poor surviving of the seedlings in the study area. Most legumes seedlings are
grown in nursery, until they reach a height of 30-50 cm (Shelton, 1992). No single characteristic
determines seedlings quality. Seedling quality is a combination of height, diameter, plant
nutrition, health, root size and shape. Together, these characteristics determine how well the
plant will establish itself in the field, and they affect the rate of survival. Height alone is often
not a good predictor of how a plant will grow in the field (www.worldagroforestry.org).
Hardening up has been observed as the second major case for the poor fodder seedlings survival
rate in the study areas. Hardening is gradual preparation of seedlings for field conditions which
expose the seedlings to harsh conditions to make them strong so that they will be able to survive
under harsh climate in the field after planting out. In order to establish health seedlings,
hardening could be applied before exposing the seedlings to the field (Shelton, 1992).
5.2.3. Dry matter yield of tree lucerne as affected by plant spacing and site
The impact of locations and plant spacing on annual dry matter yield is observed in the current
study. Tree lucerne annual yield is higher in 100 × 100cm plant spacing as compared to the two
relatively closer plant spacing. In the present study the closer plant spacing resulted the lower
dry matter biomass yield over the study sites. Therefore, the present study is closer similarity
with the work presented by Sanchez (2006) who reported that the wider plant spacing generally
produce plants with bigger stem diameter with higher dry matter yield because of reduced

44
competition for growth factors and hence promote nutrient reserve accumulation especially
carbohydrates in the root collar and closer plant spacing promotes taller plants with lower yield
due to competition for growth factors such as soil moisture, light and nutrients. The observations
from moringa oleifera by Turgut et al. (2005) showed closer plant spacing generally resulted in
taller plants because there was competition for growth factors especially light and space while
in wider plant spacing, there was minimum competition for light and space, hence had reduced
plant height due to minimum etiolated.
The overall dry matter yield value noted in the current finding is within the range contents of
Lefroyet al. (1994), who reported the DMY of 3-9 t/ha/year for a year old tree lucerne. But the
current work strongly disagrees the work of Eastham et al. (1993), Milthorpe and Dann (1991),
Oldham et al. (1991) who reported (3.2, 1.1 and 3.0 ton/ha/yrs.) dry matter yield respectively,
whereas, 7.9 t/ha/year DMY of tree lucerne is reported by (McGowan and Matthews, 1992).
5.2.4. Growth and root collar diameter at different growing stages of fodder
The long dry season, which extended from seven to nine months over the study area, clearly
explains the slow growth and survival of the tree lucerne fodder seedlings during the trial
periods. As compared to Lemo and Endamehoni, the numerical slow height growth and survival
has been observed in Sinana site might be explained as a response to the site condition and the
long dry season with severe moisture stress especially during the initial seedlings growth in the
area (Kahsay et al., 1997).
During the first three month after planting out, tree lucerne suffered shock resulting in slow root
collar diameter and height growth. Hence, closer work is reported by Chamshama et al. (1984)
who noted after planting out in the field the plant of Senna Singueana suffered shock resulting
in slow height growth and loss of leaves, which are essential for photosynthesis. The wilting of

45
leaves after planting out could, however, be mechanism by which young plant minimize water
loss by transpiration processes; which was very crucial for root growth and development
(Chamshama et al. 1984). The accelerated increase in the rate of RCD and height growth after
recovering from the transplanting shock, which explaining the high efficiency of root system.
Hence, the present study is in line with the work reported by Nduwayezu et al. (2005) for Senna
singuean species. The relatively fast growth of tree lucerne seedlings in Lemo and Endamehoni
site might be indicator of the higher yield production from the area. Similarly Baris and Ertenkin,
(2010) reported that fast growth of seedlings is an important indicator in terms of determining
the situation of growth response especially in the first growing period and it is commonly
assumed that the early fast growth rates of trees reflect productivity status of the plant.
5.2.5. Effect of cutting height and interval on biomass yield of tree lucerne
The current finding showed statistically similar annual dry matter yield for the two (1m and
1.5m) cutting heights. Therefore, cutting heights could not affect the biomass yield of tree
lucerne. This observation in accordance with the report by Buakeeree (2006) who indicated that
the biomass yield of hedge lucerne shrub is not affected by cutting height. However, Battad
(1993) reported significant effect of cutting height on biomass yield of hedge lucerne. The
biomass yield increases as cutting interval increased from three months to six months. The
current observations is in agreement with the findings of McGowan and Mathews (1992) where
long harvest interval per year gave significantly higher yields than more frequent harvests per
year. Getinet (1998) also reported that two harvests per year gave significantly higher yield than
six harvests per years. Re-growth of tree lucerne occurred primarily from new axillary buds.
Development of axillary buds was very slow in the first few weeks after cutting but increased at
fastest rate with time, hence this slow initial growth explains why the cumulative growth of

46
plants harvested at three months interval was much less than that of plants harvested at six
months interval (Getinet, 1998).
5.2.6. Effect of cutting height and interval on leaf, edible branch and stem fractions
The present observation for the two cutting height showed similar botanical fractions whereas,
cutting intervals on botanical fractions showed significant differences. This observation is in
line with finding noted by Getinet (1998) who reported that the leaf fraction decreased as cutting
interval increased from two month to six month interval. Of all the fractions, leaf is the most
vital component with the highest quality for livestock feed. Hence, the main requirement in
growing tree lucerne is to increase the proportion and amount of leaf produced. The current
study reported a significant difference for the edible branch fraction among the different cutting
intervals. This observation is not agreed with the work resulted by Getinet (1998) who reported
statistically similar result for edible proportions. According to the similar author the stem
proportion of tree lucerne showed significant differences among the different cutting intervals.
Hence, the current observation on stem proportions is in accordance with this report.
5.3 Chemical Composition and digestibility of tree lucerne
The ash contents of tree lucerne leaf fractions in the current study is nearly similar with the
reported value of (5.5%) for tree Lucerne by (Borens, 1986) whereas, the current finding
reported slightly higher contents as compared to the work revealed by Pande (1990) who
reported the ash content for tree lucerne (5.18%).
In the current study higher crude protein content was observed compared with the values
reported by Getinet, (1998), Lefroy et al. (1992), Seyoum, (1994), Kashay et.al (1997) and
Dereje (2014); but Hawley (1984) reported higher CP% of up to 31% from young tree lucerne

47
leaf fractions. The CP content is highest in June followed by July. Thus the quality of this fodder
reaches its optimum point in June and July. As noted by Kazemi et al. (2012) legumes, grasses
and grass-legume mixtures containing greater than 19% CP are rated as having prime standard
and those with CP values lower than 8% are considered to be of inferior quality. The CP
concentration of the browse fodder plant in the present study is higher than 19%, suggesting the
possibility of considering their use as an alternative plant protein sources to improve the nutritive
values of poor quality ruminants feeds in the study area. Except for CP contents, the NDF, ADF,
ADL noted in the current study is lower than the work of Getu et al. (2012).
In the present study the mean NDF content of tree lucerne leaf fractions is higher than the value
reported by Bonsi et al., (1995), Borens and Poppi, (1990), Lambert et al.,(1989), Ventura et al.,
(2002), Tariku (2014) and Kashay et.al., (1997). However, the NDF content from the current
observation was nearly in agreement with the finding of Dereje (2014). According to Van Soest
(1965) feeds with NDF values above 55% limit appetite and digestibility. The NDF contents in
current study ranged from (47.83% to 57.40%) and can be categorized as a high quality feeds.
According to Kazemi et al. (2012) forage legumes with a respective NDF and ADF values
falling within a range of 40 – 46% and 31 – 40% are rated as having a first grade quality standard.
The NDF and ADF contents of the tree lucerne evaluated in this work fall within these ranges
indicating their potential to be used as source of supplement for improving the feeding value of
poor quality roughages. Kellems and Church (1998) also indicated that roughages with less than
40% ADF are categorized as high quality and those with greater than 40% as poor quality. In
general the relative higher value of CP and lower value of ADF and NDF in this study could be
indicative of its better quality and digestibility of tree lucerne leaf.

48
The mean ADL contents noted in the current study is comparatively higher than the work
reported by Lambert et al. (1989), Solomon et al. (2004), Pande (1990), Dereje (2014) whereas,
the ADL contents reported at the current study is nearly in line with the contents reported by
Bornens and Poppi, (1990); Bonsi et al., (1995) and Adugna et al., (1997) who reported that the
ADL content for tree lucerne ranges between (6.4% - 7.7%).
IVOMD content in the current study is comparatively lower than the value reported by Douglas
et al. (1996). The IVOMD reported for the current study is similar with work reported by Tariku
(2014). In the present study the mean IVOMD contents was higher than the threshold value of
50% required for feeds to be considered as having acceptable digestibility (Owen and
Jayasuriya, 1989), and was also higher than values reported earlier for other herbaceous (65%)
and browses (55%) legume species by (Seyoum et al. 1996).

49
6. SUMMARY AND CONCLUSION
The study was conducted in the highlands of three woredas located in southern region (Lemo),
in Oromia region (Sinana) and Tigrai region (Endamehoni). These kebeles are Africa RISING
project implementation sites, where on-farm researches on tree lucerne fodder were conducted.
The size of land allocated for grazing was lower by quarter as compared to crop cultivation. The
trend of land holding in the area is decreasing from time to time. The major livestock feed
resources available in the area are crop residues and natural pasture, and cattle are the dominant
livestock species raised. Hence, livestock feeding is mainly based on crop residues and natural
pasture.
The niches identified besides providing a quality feed source for livestock, it could provide other
purposes to make the technology more attractive to farmers. The current work indicated that
growing of seedlings around backyard on small plots results significantly higher survival rate
compared with other growing niche. Agronomic practices like weeding, mulching and use of
appropriate size of seedlings could increase the survival rate and performance of tree lucerne.
Management practices like fencing, protection and security could also minimize the damage of
seedling by browsing of livestock. The rapid increase in height and root collar diameter (RCD)
for tree lucerne observed after six months stages of growth.
The two cutting heights under the present investigation did not significantly differ in biomass
yield. However, Cutting interval significantly affect the biomass yield of tree lucerne. The
highest biomass yield was recorded from the prolonged cutting interval, whereas, the lowest
biomass yield was obtained from the frequent harvested fodder. The leaf fractions consistently
decreased as the cutting interval increased from three months to six months. While the stem

50
fractions increased as the cutting interval increased from three months to six months. Cutting
interval longer than six months might cause reduced leaf fractions by dropping, flowering and
pod formation which usually affects the feeding value. Hence, in order to maximize the biomass
yield as well as nutritive value; it should be recommended to harvest tree lucerne at four month
to six months cutting intervals at any convenient cutting height between 1meter and 1.5meter
above the ground levels.
The nutritive value of tree lucerne leaf in terms of IVOMD and ME did not vary under the
different months. The present study showed that tree lucerne has reasonable amount of CP, high
IVOMD and ME this suggested that tree lucerne is a good alternative fodder for livestock.
Whereas, cellulose and hemicellulose components in leaf fraction were lower. Moreover, the
higher CP and lower fibre value in the leaf fraction are indicative of a good protein source for
poultry or other mono-gastric animals. Therefore, the present results on the yield and nutrient
contents in tree lucerne leaf suggesting that it could be a suitable protein supplement for
ruminant livestock in the study areas. Generally, if tree lucerne is grown in abundance, in Lemo,
Sinana and Endamehoni woredas it could help small and medium-scale farmers to overcome the
shortages of quality feeds leading to a reduction in the livestock production cost.

51
7. SCOPE FOR FUTURE WORK
• Further studies could be conducted at longer base to evaluate the effect of different
cutting heights and cutting intervals on biomass production and chemical compositions
of tree lucerne.
• There is a need to conduct animal experiments to assess the effects of tree Lucerne
supplementation on feed intake and animal productivity in terms of milk yield and body
weight gain.
• It is important to conduct similar studies on different locations with varying climatic
conditions and soil types, different feed resource types and grazing management
practices in the crop-livestock farming system which have higher livestock population
but a declining land size per household.
• Farmers’ motivation to plant and maintain fodder tree species need governmental and
non-governmental support.

52
8. REFERENCE
Adugna Tolera, K. Khazaal, and E.R. Orskor, 1997. Nutritive evolution of some browse species.
Animal Feed Science and Technology, 67(2-3), pp. 181-195.
Agajie Tesfaye., Chilot Yirga, Mengistu Alemayehu, Elias Zerfu and Aster Yohannes
Smallholder livestock production and constraints in the Highlands of Shewa zones.
Livestock in Food Security. Roles and Contributions Proceedings of the 9th annual
conference of the Ethiopian Society of Animal Production (ESAP) held in Addis Ababa,
Ethiopia, P 63.
Ajebu Nurfeta, A. 2010. Digestibility and nitrogen utilization in sheep fed enset (Ensete
ventricosum) pseudo-stem or corm and graded levels of Desmodium intortum hay to
wheat straw based diets. Journal of Animal Physiology and Nutrition. (94), 773-779.
Ahmed, M.M., S. Ehui and A. Yemesrach, 2004. Dairy development in Ethiopia. EPTD
discussion Paper No.123, (International Food Policy Research Institute), Washington
DC, USA.
Alemayehu Mengistu, 1997. Conservation based forage development for Ethiopia. Self-help
development. International institute for sustainable development publishers, Addis
Ababa. Berhanena Selam Printing Press, Addis Ababa, Ethiopia. 197p.
Alemayehu Mengistu, 2002 forage production in Ethiopia: a case study with implications for
livestock production Published by: Ethiopian Society of Animal Production PO Box
80019, Addis Ababa, Ethiopia; Pp: 58-59.
Agfact P2.1.7, first edition 1986 Paul Dann; 2003, Brendan George: Research Agronomist
Division of Plant Industries, Canberra Barry Trimmer Livestock officer (sheep and
wool) Division of animal productions, Orange (reviewed May 2003, Brendam George).

53
Anonymous, 2000: Tagasaste: difficult to pronounce easy to grow. Farm Trees News 1990: 2
http://www.winrock.org/forestry/factpub/factsh/chamacyt.htm
AOAC, 1995 Official Methods of Analysis. Association of Official Analytical Chemists
(A.O.A.C), 15th ed. Washington, DC, pp. 69-88.
Asaminew, T. and S. Eyassu, 2009. Smallholder dairy production system and emergence of
dairy cooperatives in Bahir Dar Zuria and Mecha Woredas, North western Ethiopia.
World Journal of Dairy and Food Sciences, 4(2): Pp: 185-192.
Baris H and Ertenkin M, 2010. Growth models in investigating oriental beech (Fagus orientalis
Lipsky). Romanian Biotechnological Letters 16: 5850-5857.
Battad, Z. M. 1993. Desmanthus: A potential substitute to leucaena as ruminant feed. Asian
Livestock. (18) : 68-70.
Baumer, A. 1992. Trees as browse and to support animal production. In: Andrew Speedy; Pierre
-Luc Pugliese eds. Legume trees and other fodder trees as protein sources for livestock
14- 18 October 1991. Mardi, Kuala Lumpur, Malaysia. F.A.O-UN, Rome. F.A.O Animal
Production and Health paper: 102: 1-9.
Bergstrom, R. (1992). Browse characteristics and impact of browsing on trees and shrubs in
Africa. Journal of Vegetation Science (3): 315-324.
Blair, G., Catchpoole, D. and Horne, P. 1990. Forage tree legumes: Their management and
contribution to the nitrogen economy of wet and humid tropical environments.
Advanced. Agronomy. (44): 27-54.
Bonsi, M.L.K., P.O. Osuji and A.K. Tuha, 1995. Effects of supplementing teff straw with
different levels of leucaena or sesbania leaves on the degradability of teff straw,
sesbania, leucaena, tagasaste, and vernonia and on certain rumen and blood metabolites
in Ethiopia Menz sheep. Animal Feed Science and Technology, (52): 101-129.

54
Borens and Poppi 1986 feeding value of tagasaste N.Z. Agricultural Science, 20 (3): 149-151.
Borens and Poppi, (1990, 1982); the nutritive value for ruminants of foliage of tagasaste a
leguminous tree. Animal Feed Science and Technology 28: 275–292.
Buakeeree, W. Suksombat 2006. Effect of Cutting Interval and Cutting Height on Yield and
Chemical Composition of Hedge Lucerne (Desmanthus virgatus) School of Animal
Production Technology, Institute of Agricultural Technology Suranaree University of
Technology, Nakhon Ratchasima, 30000, Thailand. p31- 34.
Buxton, D.R., 1996. Quality-related characteristics of forages as influenced by plant
environment and agronomic factors. Animal Feed Science and Technology, 59: 37–49.
Chamshama, S.A.O 1984 establishment technique for eucalyptus species; effect of nursery
treatments, site preparation and fertilizations on survival and growth PhD Thesis P: 171.
Cook, S.J., and Ratcliff, D. 1985. Effect of fertilizer, root and shoot competition on the growth
of siratro (Macroprilium atropurpureum) and green panic (Panicum-maximum var
tricho glume) seedlings in a native spear grass (Heteropogon cantortus) sward.
Australian journals of agriculture research 36,233-245.
Costa, N. de L. and Oliveira, J.R. da C. 1992. Cutting height affects Cajanus cajan yield and
protein content. Nitrogen fixing tree research reports (10): 119-120.
CSA (Central Statistic Authority), 2003. Ethiopian Agricultural Sample Enumeration. Result at
country level. Central Statistics Authority, Addis Ababa, Ethiopia, pp. 250-350.
CSA (Central Statistical Agency), 2013. Livestock and Livestock Characteristics, Agricultural
Sample Survey. Volume II, Statistical Bulletin, 570.
CSA (Central Statistical Agency), 2007 Population and Housing Census Report Country Central
Statistical Agency, 2010-07.

55
Dann and Trimmer (1986); Tagasaste: a tree legume for fodder and other uses. New Zealand
Agricultural Science: 142- 145.
Daodu MO, Babayemi OJ, Iyayi EA (2009).Herd composition and management practices of
cattle production by pastoralists in Oyo area of Southwest Nigeria. Livestock Research
for Rural Development. Volume 21. (66) http://www.lrrd.org/lrrd21/5/daod21066.htm.
Dawit A., Ajebu N. and Sandip B., 2013. Assessment of feed resource availability and livestock
production constraints in selected Kebeles of Adami Tullu Jiddo Kombolcha District,
Ethiopia. African Journal of Agricultural Research, 8(29): 4067-4073.
Dereje kebede 2014. Evaluation of tagasaste (chamaecytisus palmensis) forage as a substitute
for concentrate in diets of sheep fed natural pasture hay: MSc Thesis School of Animal
and Range Sciences, Graduate Studies Haramaya University, Ethiopia. Pp: 22
Dicko, M. S. and Sikena, L. K. (1992). Feeding behavior, quantitative and qualitative intake of
browse by domestic ruminants. Andrew Speedy and Pierre-Luc Pug lies eds. Legume
trees and other fodder trees as protein sources for livestock: 14-18.
Diriba Geleti 2014: Agronomic and Nutritional Evaluation of Selected Forage Legumes and
Locally Available Feedstuff, and Characterization of Forage and Dairy Innovation
Systems in Bako and Nekemte Peri-Urban Areas, Oromia, Ethiopia: Pp: 87-103.
Douglas, B. T. Bulloch & A. G. Foote (1996) Cutting management of willows (Salix spp.) and
leguminous shrubs for forage during summer. New Zealand Journal of Agricultural, 39:
175–184. Duguma, B., Azage, T., Hegde, B.P. (2012). Smallholder livestock production system in Dandi
district, Oromia Regional State, central Ethiopia. Global Veterinarian, 8 (5): 472-479.
EARO (Ethiopian Agricultural Research Organization). (2000). National Small Ruminants
Research Strategy Document. EARO, Addis Ababa, Ethiopia.

56
Eastham J, Scott PR, Steckis RA, Barton AFM, Hunter LJ, Sudmeyer RJ 1993. Survival, growth
and productivity of tree species under evaluation for agroforestry to control salinity in
the Western Australian wheat belt. Agroforestry Systems 21: 223-237.
EEA (2002). Land tenure and agricultural development in Ethiopia. Ethiopia Economic
Association (EEA), Ethiopia Economic Policy Research Institute, Addis Ababa.
El hassan, S.M, A. Lahlou Kassi, C.J.Newbold, A.J. Wallace, 2000. Chemical composition and
degradation characteristics of foliage of some African Multipurpose trees. Animal Feed
Science. (86): 27-37.
Elevitch, C.R. and K.M. Wilkinson. (2000). Agroforestry Guides for Pacific Islands. Permanent
Agriculture Resources, P.O. Box 428, Holualoa, HI 96725.
Ella, A., Blair, G.J. and Stür, W.W. 1991. Effect of age of forage tree legumes at the first cutting
on subsequent production. Tropical grass land. (25): 275-280.
FAO (Food and Agriculture Organization), 2010. Crop and food security assessment mission to
Ethiopia.
Felker P 1981. Uses of tree legumes in semi-arid regions. Economic Botany (35): 74-186.
Firew, Tegegne., Getnet, Assefa. (2010). Feed resource assessment in Amhara regional state.
Ethiopian Sanitary and Phyto sanitary Standards and Livestock Meat Marketing Program
(SPS-LMM), Texas A&M University System.
Francisco-Ortega, J, Fernandez-Galvan, M and Santos-Guerra, A 1991, ‘A literature survey
(1696-1991) on the fodder shrubs tagasaste and escobon (Chamaecytisus proliferus
(L.fil) Link sensu lato) (Fabaceae: Genisteae)’, New Zealand Journal of Agricultural.
Franzel S. and Scherr S. (2002). Trees on the Farm: Assessing the Adoption Potential of Agro
forestry Practices in Africa. CABI Publishing, Oxford, UK. P: 208.

57
Getachew Asamenew and Abate Tedla. 1993. Crop-livestock Interaction and Implications for
Animal Traction Research in the Ethiopian Highlands. In: Proceedings of the 4th
National Livestock Improvement Conference (NLIC) Held in Addis Ababa, Ethiopia.
Getinet Assefa 1991: Tree lucerne a promising forage tree for the highlands. IAR, Newsletter
6(3): 2. Institute of Agricultural Research (IAR), Addis Ababa, Ethiopia.
Getinet Assefa 1998: Biomass yield, botanical fractions and quality of tagasaste,
(Chamaecytisus palmensis) as affected by harvesting interval in the highlands of
Ethiopia; Agroforestry Systems 42: 13–23 (42): 13–23.
Getinet Assefa, K. Sonder, M. Wink, C. Kijora N. Steinmueller, K.J. Peters 2007. Effect of
variety and harvesting management on the concentration of tannins and alkaloids in
tagasaste 41 (Chamaecytisus palmensis). Ethiopian Institute of Agricultural Research,
Holetta Research Centre, P.O. Box 2003, Addis Ababa, Ethiopia.
Getu Kitawu, Mesfin D, Aemiro K and Getnet Assefa 2012: Comparative evaluation of Tree
Lucerne over conventional protein supplements in supporting growth of yearling Horro
lambs. Livestock Research for Rural Development.Volume 24, (8). Retrieved May 18,
2016, from http://www.lrrd.org/lrrd24/1/getu24008.htm.
Girma C, Yoseph M, Mengistu U, 2014. Feed resources quality and feeding practices in urban
and peri-urban dairy production of southern Ethiopia. Tropical and Subtropical Agro-
ecosystems, 17 (2014): Pp 539 – 546.
Gutteridge, R.C. 1990, Agronomic evaluation of tree and shrub species in southeast
Queensland. Tropical Grasslands 24: 29-36.
Hadera G and Lucas RJ, 1993 Effect of September, December and March cuttings on tagasaste
(Chamaecytisus palmensis) dry matter and nitrogen accumulation. Proceedings of the
Fourth National Livestock Improvement Conference (NLIC) (4) P 180–187.

58
Hairiah, K., Noordwijk, M. van. Santoso, B. and Syekhfani, M.S, 1992. Biomass production and
root distribution of eight trees and their potential for hedgerow intercropping on an
ultisol in southern Sumatra. Agrivita (15), p: 54-68.
Harrington, G.N., 1981. Grazing arid and Semi-Arid pastures, In: Morley, F.H.W. (Eds.)
Grazing Animals Chapter 10: 181-202.
Hawley K, 1984 Tree lucerne and establishment. Western Australian Department of
Agricultural Bulletin No. MA 25/84. Man Jimup Regional Office.
Horne, P. M., Catchpole, D. W. and Ella, A. 1986. Cutting management of tree and shrub
legumes. In: Blair, G. J., Ivory, D. A. and Evans, T. R. ed. Forages in south Asian South
Pacific Agriculture, Australian Centre for International Agricultural Research
Proceedings series, number 12 Canberra.: p51-54.
International Livestock Research Institute (ILRI), 1999. Farmers, their animals and the
environment. Feed and Nutrition.
International Livestock Research Institute (ILRI) 2012/2013: Africa RISING Ethiopia project
in High lands of Ethiopia (Oromia, Tigray and Southern Nations, Nationalities and
Peoples region Http://africa-rising.net
Kahsay Berhe, Tothill JC 1997. Dry matter yield, P response and nutritive value of selected
accessions of tagasaste (Chamaecytisus palmensis) and Teline monspessulana
(Montpellier broom) in the Ethiopian highlands. Tropical Grasslands 31: 49-57.
Kaitho R.J., Tegegne A., Umunna N.N., Nsahlai I.V., Tamminga S., Van Bruchem J. and Arts
J.M. 1998. Effect of Leucaena and Sesbania supplementation on body growth and
scrotal circumference of Ethiopian highland sheep and goats fed teff straw basal diet.
Lives stock production science, (54): 173-181.

59
Kazemi, M., A.M. Tahmasbi, A.A. Naserian, R. Valizadeh and M.M. Moheghi, 2012. Potential
nutritive value of some forage species used as ruminants feed in Iran. African Journal of
Biotechnology, (11): 12110-12117.
Kellems, R.O. and D.C. Church, 1998. Livestock Feeds & Feeding. (4th edition.). Prentice-Hall,
Inc., New Jersey, USA, p573.
Kindu Mekonnen and Mulugeta Sisay, 2013 Tree and shrub species integration in the crop-
livestock Farming system School of Natural Resource and Earth Science, Ethiopia
International Livestock Research Institute (ILRI): pp. 647 – 656.
Kindu Mekonnen. 2001. Practices, constraints and agroforestry interventions in Yeku
watershed, northeastern Ethiopia. Ethiopian Journal of Natural Resources 1:Pp.161-178.
Kosgey I.S., 2004. Breeding objectives and breeding strategies for small ruminants in the
Tropics. Ph.D. Thesis, Wageningen University, the Netherlands. (ISBW: 90-5808-990-
8) Germany, p271.
Lambert, M. G, Jung, G. A., Fletcher, R. H., Budding, P. J., Cost all, D. A., 1989. Forage shrubs
in North Island Hill Country II. Sheep and goat Preferences. New Zealand Journal of
Agricultural Research, 32(4): Pp.485-490.
Lazier J, 1987 Tree lucerne, Forage Network in Ethiopia (FNE) Newsletter 18: 21–23.
International Livestock Center for Africa (ILCA). Addis Ababa, Ethiopia Pp: 21–23
Lazier J R.1981 Dry matter productivity of eighteen native Belizean legumes and Codariocalyx
gyroides with para grass Brachiaria mutica under clipping: 58: 221-233.
Le Houerou, H. N. 1980. Chemical composition and nutritive value of browse in West Africa.
The current state of Knowledge. ILCA, Addis Ababa, pp: 261-290.
Lefroy , P. R. Dann , J. H. Wildin , R.N. Wesley-Smith And A. A. McGowan (1992) Western
Australian Department of Agriculture, Perth; CSIRO, Canberra; Department of Primary

60
Industries, Rockhampton, Queensland; Department of Primary Industries and Fisheries,
Berrimah, Northern Territory, Victorian Department of Agriculture, Ellin bank.
Lefroy and Scott 1994, Stirzaker and Lefroy 1997; the influence of tagasaste trees on the water
balance of an alley cropping system on deep sand in south western Australia.
Leng R.A. (1990). Factors affecting the utilization of poor quality forages by ruminants
particularly under tropical conditions. Nutr. Res. Rev., 3: p. 277-303.
McGowan AA (1991) the role of trees and shrubs as sources of fodder in Victoria. In: The Role
of Trees in Sustainable Agriculture. Bureau of Rural Resources, Canberra
McGowan and Mathews, 1992; Forage production from hedges of tagasaste in a high rainfall
temperate environment, and the effects of plant spacing and frequency of harvesting.
Australian Journal of Experimental Agriculture 32, Pp: 633-640.
Mcleod, 1982; Forage tree evaluation in south Canterbury. In Tree lucerne in New Zealand (ed.,
L.A. Logan), Proceedings of a workshop held by Crop Research Division: 24-26.
Mesfine, A., 1992. Overview of livestock in Ethiopia. Christian Relief and Development
Association (CRDA). CRDA workshop on livestock and forage production, Addis
Ababa, Ethiopia, Pp: 9-16.
Mesfin, R. and Kebede, G., 2011. On-farm experience of feeding urea molasses treated barley
straw to crossbreed dairy cows in Jeldu District, highlands of Ethiopia. LS. Research for
Rural Development. Livestock Research for Rural Development. Volume 23, (4).
Milhorpe and Dann, 1991: productions from tagasaste at four contrasting sites in New South
Wales. Australian journal of agriculture 31(5): 639-644.
McDonald, P, Edwards, RA, Greenhalgh, JFD, and Morgan, CA, 1995. Animal Nutrition (5th
edition) Longman Scientific and technical, John Wiley and Sons. Inc., New York.

61
Moore, G, Sanford, P & Wiley, T, 2006 Perennial pastures for Western Australia, Department
of Agriculture and Food Western Australia, Bulletin 4690, Perth.
Mulugeta A., 2005. Characterization of Dairy Production Systems of Yerer watershed in Ada
Liben Wereda, Oromia Region, Ethiopia. An MSc Thesis Presented to the School of
Graduate Studies of Alemaya University, Alemaya University. Pp: 140.
NAS, 1979, Tropical legumes: resources for the future, National Academy of Science,
Washington
Ncamihigo, O. and Brandelard, P., 1993. Effects of cutting heights and cutting frequencies on
the annual yield of Leucaena and Calliandra hedges. In: Proceedings of the XVII
international grassland congress, New Zealand. And Queensland, Australia. Volume 1:
2131-2132.
Nduwayezu, L.L.L. Lulandala, S.A.O Chamashama and A.G Mugasha, 2005: The effect of
cutting height of senna Singueana (Del.) Lock. In mixed intercropping system on foliage
biomass productions and maize yield in Morogoro Tanzania. Journal of Agronomy 4(4)
p323-328.
Oldham, Allen, G., Moore, P. M. & Mattinson, B. A. 1991, 1993; Tagasaste (Chamaecytisus
palmensis) - a fodder shrub and alternative pasture legume. Second Alternative Pasture
Legumes Workshop, Coonawarra, South Australia, p: 26-28.
Oosting S.J., 1993. Wheat straw as ruminant feed. Effect of supplementation and ammonia
treatment on voluntary intake and nutrient availability. PhD Thesis, Wageningen
Agricultural University, Wageningen, the Netherlands. edepot.wur.nl/201733.
Orwa C, Mutua A, Kindt R, Jamnadass R, Simons A. 2009. Agroforestry tree Data base: a tree
reference and selection guide version 4.0 (http://www.worldagroforestry.org/af/treedb/)

62
Owen, E. and Jayasuriya, M.C.N. (1989). Use of crop residues as animal feeds in developing
countries: a review. Research and Development in Agriculture 6(3): 129-138.
Pande, 1990 Feed value of tagasaste (Chamaecytisus palmensis) for goats and preferential
browsing activities by goats and sheep in multi-species shrub /pasture conditions. MSc
Thesis Massey University Agronomy Department Palmerston New Zealand Pp: 1-53
Poppi, 1982; Borens, 1986; Feed value of tagasaste (Chamaecytisus palmensis) for goats and
preferential browsing activities by goats and sheep in multi-species shrub /pasture
conditions; Pp: 9-38.
Radcliffe, J.E., 1983. Fodder trees- an option for dry hill country. Proceedings of the 1983 Hill
and High country seminar, Centre for Resource management, Lincoln College, p: 49-57.
Ranawana, S.S.E., 1987. An Assessment of the Nutritive value of some traditional trees and
shrub fodder of Sri Lanka, the 4th AAAP Animal Science Congress 1987. Pp: 302.
Sanchez, R. N., 2006. Moringa olifera and Cratylia argentea: Potential fodder species for
Ruminant in Nicaragua. Doctoral thesis. ISSN 1652 - 6880, ISNB 91- 576 - 7050 – 1.
Schomburgk quoted in Anon, 1891; Tagasaste (C. proliferus), Linn. Kew Bulletin, p: 239-244
Seyoum Bediye, 1994 Evaluation of nutritive values of herbaceous legumes, browse legumes
and oil seed cakes using chemical analysis, in vitro digestibility and nylon bag technique.
MSc thesis. Alemaya University of Agriculture. Dire-dawa, Ethiopia.
Seyoum Bediye, Getinet Asefa, Abate, Tedla and Dereje, Fikadu, 2001. Present status and future
direction in feed resources and nutrition research targeted for wheat based crop livestock
production system in Ethiopia. pp. 207-226.
Seyoum, Bediye, Ummana, V.I., Nsahlia, I.V., Zinash, S. and Alemu, Y., 1996.
Interrelationships of chemical properties, in vitro digestibility and rumen degradability
characteristics of protein sources.p129-138.

63
Seyoum, Bediye, Zinash, S. and Dereje, F., 1999. Chemical composition and nutritive values of
Ethiopian feeds. Ethiopian Institute of Agricultural Research. Research Report 73, Addis
Ababa, Ethiopia.
Shelton, 1992; Establishment of Leucaena leucocephala and Gliricidia sepium from the stem
cuttings. Leucaena Research Reports 12, Pp; 3-6.
Skerman, P.J., (1977). Tropical forage legumes. F.A.O. Plant production and protection Series
No.2.Rome.
Snook, L.C., 1952. Tree Lucerne: a fodder crop which has been overlooked. Journal of the
Department of Agriculture of Western Australia. (3) Pp: 587-93.
Snook L. C., 1982. Tagasaste (tree lucerne): a shrub with high potential as a productive fodder
crop. Journal of the Australian Institute of Agricultural Science (48), 209-214.
Snook, L. C., 1986. Tagasaste-Tree Lucerne, high production fodder crop. Night Owl,
Shepparton, Victoria, Australia. p102.
Solomon Bogale, 2004. Assessment of Livestock Production System and Feed Resource Base
in Sinana Dinsho District of Bale Highlands, Southeast Oromia. MSc. Thesis. Alemaya
University, Alemaya. Pp: 135.
Solomon Bogale, Solomon Melaku and Alemu Yami, 2008. Potential use of Crop residue as
Livestock feed resource under smallholder farmers’ condition in Bale highlands of
Ethiopia. Tropical and Subtropical Agro ecosystems, 8 (2008): 107 – 114.
Solomon Zewdu Altaye, Binyam Kassa, Bilatu Agza, Ferede Alemu and Gadisa Muleta 2014:
Smallholder cattle production systems in Metekel zone, northwest Ethiopia; Research
Agriculture and Environmental Management. Vol. 3(2), 151-157.

64
Stur, W. W., Shelton, H. M. and Gutteridge, R. C. (1994). Defoliation management of forage
tree legumes. In: Gutteridge, R. C. and Shelton, H. M. eds. Forage tree legumes in
tropical agriculture. CAB International, U.K: 158-167.
Takele G., N. Lisanework, A. Getachew, 2014. Evaluation of potential yield and chemical
composition of selected indigenous multi-purpose fodder trees in three districts of
Wolayta Zone, Ethiopia. IDOSI Publications, Science journals, 31 (3): 399-405.
Tariku Teka 2014 Evaluation of tagasaste (chamaecytisus palmensis) forage as a protein
supplement to lactating crossbred dairy cows fed on barley straw. MSc Thesis; Animal
and Range Sciences, School of Graduate Studies Haramaya University, Ethiopia. Pp: 20.
Tilley, J.M.A. and R.A. Terry, 1963. A two-stage technique for in vitro digestion of forage
crops. Journal of the British Grassland Society 18:104.
Townsend RJ and Radcliffe JE (1990) Tagasaste forage production systems. New Zealand
Journalof Agricultural Research (33) 627– 634
Turgut, I., Duman, A., Bilgili, U. and Acikgoz, E. (2005). Alternate row spacing and plant
density effects on forage and dry matter yield of corn hybrids (Zea mays L.). J. Agron.
Crop Science 191: pp. 146-151. http://dx.doi.org/10.1111/j.1439-037X.2004.00146.x
Warren JM, Meinzer FC, Brooks JR, Domec JC (2005). Vertical stratification of soil water
storage and release dynamics in Pacific Northwest coniferous forests. Agriculture for.
Meteorol. 130: 39-58
WWW.worldagroforestry.org/NurseryManuals/Community/Seed Quality seedlings quality.
Ulyatt, M.J., Fennessy, P.F., Rattray, P.V.; Jagusch, K.T. 1980. The nutritive value of
supplements, Chapter 5, In Supplementary Feeding. New Zealand Society of Animal
Production Occasional Publication 7: Ed K.R. Drew and P.F. Fennessy 157-184.

65
Van Soest, P.J., 1965. Symposium of factors influencing the voluntary intake in relation to
chemical composition and digestibility. Journal of Animal Science. (24) Pp: 834.
Van Soest, P.J., 1994. Nutritional Ecology of Ruminants. 2nd edition. Cornell University press.
London. Pp: 476.
Ventura M.R., Castanon J.I.R. Rey L. and Flores M.P. (2002) Chemical composition and
digestibility of Tagasaste (Chamaecytisus proliferous) subspecies for goats. Small
Ruminant Research, (46): 207- 210.
Zelalem, Y., 1999. Smallholder Milk Production Systems and Processing Techniques in the
Central Highlands of Ethiopia. M.Sc. Thesis. Swedish University of Agricultural
Sciences, Uppsala.
Zeleke Ewnetu and John, C. B., 2010. Tree growing by small holder farmers in the Ethiopian
Highlands. Small scale forestry in changing world: Opportunities and challenges and the
role of extension and technology transfer IUFRO conference: 3.08 small scale forestry,
6.06.02 Extension, 6.06.01 Technology transfer Bled, 06 12 June 2010.
Zita Stokes, 2008) Tagasaste a fodder shrub; (www.pir.sa.gov.au/factsheet)
Zomer, R., A.Trabucco, R. Coe, and F.Place, 2009. Trees on Farm: ‘Analysis of Global Extent
and Geographical patterns of Agroforestry’ ICRAF Working Paper. No.89. Nairobi:
World Agroforestry Center.
APPENDIX
Appendix Tables
Appendix Table 1 Ranking of the potential opportunity realized and challenges faced by farmers during establishment periods

66
Opportunity realize
Lemo Sinana Endamehoni
Index Rank Index Rank Index Rank
Availability of enough labor 0.264 2 0.174 4 0.179 4
Availability of land for expansion 0.135 5 0.255 1 0.110 5
Potential niche 0.271 1 0.210 2 0.266 1
Availability of water for irrigation 0.149 4 0.197 3 0.209 3
Farmers motivation for the technology 0.181 3 0.164 5 0.236 2
Challenges faced by farmers:
Less preference of farmers 0.072 6 0.146 4 0.081 6
Less knowledge on how to establish 0.036 8 0.105 5 0.107 5
Lack of water for irrigation 0.216 2 0.090 6 0.069 7
Inadequate technical support 0.125 4 0.175 2 0.135 4
Limited HHs land holding 0.164 3 0.028 8 0.230 1
Poor tolerance due to water logged 0.226 1 0.048 7 0.019 8
Low survival due to animal browsing 0.106 5 0.241 1 0.174 3
Less survival due to prolonged dry season 0.055 7 0.167 3 0.185 2
NB= Index = sum of (3×number of HHs ranked 1st) + (2 × number of HHs ranked 2nd) + (1×number of HHs ranked 3rd) for each reason divided by sum of (number of HHs ranked 1st) + (number of HHs ranked 2nd) + (number of HHs ranked 3rd) for all reasons.
Appendix Table 2 Analysis of variance (ANOVA) for seedlings survival rate (%) as affected by locations and planting niche Sources Type III Sum
of Squares
DF Mean squares F value P-value
Corrected model 37304.345 19 1963.385 5.157 0.000

67
Intercept 10670.730 1 10670.730 272.325 0.000
Woredas 377.005 2 183.503 0.48 0.280
Niche 11776.127 6 1962.688 9.534 0.000
Woreda * niche 3501.601 11 318.327 0.336 0.850
Error 7042.169 185 380.687
Total 107731.513 205
DF = degree of freedom;
Appendix Table 3 Analysis of variance (ANOVA) of locations and management practices on survival rate
Sources Type III Sum of
Squares
DF Mean
squares
F value P-value
Corrected model 6519.625 14 464.923 20.717 0.000
Intercept 2250.842 1 2250.842 10.03 0.000
Woredas 91.163 2 45.582 0.203 0.816
Management 5672.985 4 1418.246 62.464 0.000
Woreda* management 3194.780 8 399.348 1.779 0.083
Error 4239.887 190 224.420
DF = degree of freedom
Appendix Table 4 Analysis of variance (ANOVA) of locations and plant spacing annual DMY yield of tree lucerne fodder

68
Appendix Table 5 Analysis of variance (ANOVA) of Growth of fodder at different stages of growing
Sources Type III sum of square D.F Mean square F value p- value
Corrected total 153.080 11 13.916 56.953 00.00
Intercept 700.594 1 700.594 2.867E 0.000
Woredas/sites 0.317 2 0.158 0.424 0.655
Stages of growth 507.038 3 169.013 452.950 0.000
Woreda* stages 1.456 6 0.243 0.650 0.690
Error 214.181 574 0.373
Appendix Table 6 Analysis of variance (ANOVA) of RCD at different growth stage
Sources Type III Sum of Squares DF Mean
squares
F value P-value
Corrected model 2.540E7 8 3.175E7 3.311 0.000
Intercept 5.329E8 1 5.329E8 555.65 0.000
Woredas 8.972E5 2 4.486E5 0.468 0.627
Plant spacing 1.341E7 2 6.707E6 6.994 0.001
Woreda* Spacing 3.408E5 4 8.5189E4 0.89 0.986
Error 1.880E8 196 9.590E6
Sources Type III sum of square D.F Mean square F value p- value)
Corrected model 508.633 11 46.239 123.920 0.000
Intercept 1527.911 1 1527.911 4.095E 0.000
Woredas/sites 1.054 2 0.52 2.156 0.117
RCD 1151.272 3 50.424 206.361 0.000
Woreda*RCD 0.948 6 0.158 0.647 0.963
Error 141.233 578 0.244

69
Appendix Table 7 Analysis of variance (ANOVA) of biomass yield of tree lucerne as affected by cutting intervals and height in the areas
Sources Type III Sum
of Squares
DF Mean
squares
F value significance
Corrected model 17840 5 3568 3.871 0.000
Cutting height 1209 1 1209 1.312 0.253
Cutting intervals 1634 2 817 8.861 0.000
Cutting height * intervals 329400 2 638.755 0.069 0.933
Error 2332.32 253 9.219
Appendix Table 8 Analysis of variance (ANOVA) of leaf fractions of tree lucerne as affected by cutting intervals and height in the areas
Sources Type III Sum of
Squares
DF Mean
squares
F value P-value
Corrected model 8889000 5 1777810.910 15.704 0.000
Cutting height 33076.10 1 33076.10 0.292 0.589
Cutting intervals 8268627.086 2 4134313.543 36.519 0.000
Cutting height * intervals 468380.525 2 234190.262 2.068 0.128
Error 468380.526 2 2864183.745
N.B. The botanical fractions (leaf, edible branch and stem) were measured, and analyzed in gram by using univarate analysis. After analysis the values are presented in proportions (%) to evaluate effect of height and interval on botanical fractions. The conversions were done as follows: For example, average proportions leaf DM = �� ���������������� �
����������������������������������∗
100%. Similar trends were followed to present the edible and stem fractions in this result sections. Hence, I did appendix table for only leaf fractions.

70
Appendix Table 9 Analysis of variance (ANOVA) of chemical compositions of tree lucerne as affected by different cutting months in the areas
Type III Sum of
Squares
DF Mean
squares
F value Sig.
Ash Between group 27.520 4 6.880 11.850 0.000
Within group 35.415 61 0.581
Total 62.935 65
CP Between group 115.582 4 28.895 2.740 0.037
Within group 643.283 61 10.546
Total 758.865 65
NDF Between group 1020.273 4 255.068 7.871 0.000
Within group 1976.672 61 32.404
Total 2996.945 65
ADF Between group 1729.165 4 432.291 10.537 0.000
Within group 2502.636 61 41.027
Total 4231.801 65
ADL Between group 328.550 4 82.138 9.194 0.000
Within group 544.975 61 8.934
Total 873.525 65
IVOM
D
Between group 44.502 4 11.125 1.920 0.118
Within group 353.418 61 5.794
Total 397.920 65
ME Between group 0.498 4 0.125 3.934 0.117
Within group 1.932 61 0.032
Total 2.430 65

71
QUESTIONNAIRE
GENERAL INFORMATIONS
Location _____________________________________________________________ Date ________________________________________________________________ 1. Name _____________________________________________________________
2. Region ____________________________________________________________
3. Woreda __________________________________________________________
4. Kebele and sub-kebele ______________________________________________
5. Sex ______________
6. Age______________
7. Table 1. Household size under different age and sex category in the woreda: Age category Male Female Total
Household (HH) ...................... ...................... ......................
Age group <6 years ...................... ...................... ......................
Age group 10-15 years ...................... ...................... ......................
Age group 16-60 years ...................... ...................... ......................
Age group above 60 years ...................... ...................... ......................
Total family size ...................... ...................... ......................
8. Do you think that your animals have adequate feed throughout the year? Yes / No
If no, on which months of the year shortage of feed become more severe? -----------------
8.1 When there is feed scarcity, what measures have you took to alleviate feed shortage?
(a) Storing the feed during available in surplus in the area ___ (b) Using improved browse
species___ (c) _____ (d) Hay making ___ e. purchasing feed supplement____________
(f) Traveling long distance for searching feed __________________________________
(g)Others (specify) _______________________________________________________

72
9. Table 3. Educational status of the study area
NO Education status No_ HHs
1 illiterate ......................................
2 Grade 1-6 ......................................
3 Grade 7-10 ......................................
4 Grade 11-12 ......................................
5 Some diploma/higher educations ......................................
10. Who is the house hold head (HHH)?
(a). Male Female (b) Female
Others specify __________________________________________________
11. Family size _________________________________________________
12. Farm size in hectares__________________________________________
13. What proportion of your farm land is allocated to livestock grazing?
14. What proportion of your farm land is allocated to crop cultivations?
15. What proportion of your farm land is allocated for improved forage crops?
16. Number of livestock kept (insert the number in the blank space)
(a) Cattle…. (b) Sheep…. (c) Goat……. (d) Chickens …….. (f) Equines …….
17. Livestock population trends and the reasons (tick one of the blank spaces)
Increasing decreasing stable Reason
• Cattle ...…………. …………. ………. ……….. • Sheep ……………. …………. ………. ……….. • Goat ………….... ………… ………. ……….. • Equine ………….. …………. ………. ……….
18. Who has been managing the trial plot?
a. Myself and My son (b) my husband and my daughter
c. My wife and my grandfather (d) All of the family
Others (specify) ………….............................................................................................

73
19. Can you mention the main planting niche for tree lucerne? (a) ________________ (b) __________(c) _________ (d) ____________ (e) _________________ (f) __________ (g) _________ (i) ___________
20. is there any challenge during tree lucerne establishment periods; If yes, please tick in
the below lists and rank the main challenges in the order of its impact to the establishment
v Challenges faced by farmers 1st 2nd 3rd I. Less preference of farmers ....... ...... ......
II. Less knowledge on how to establish ....... ...... ...... III. Lack of water for irrigation ....... ...... ...... IV. Inadequate technical support ....... ...... ...... V. Limited HHs land holding ....... ...... ......
VI. Poor tolerance due to water logged ....... ...... ...... VII. Low survival due to animal browsing ....... ...... ......
VIII. Less survival due to prolonged dry season ....... ...... ...... Where 1st, 2nd and 3rd = the first answer/response of farmers/shows the order of challenges faced by farmers
21. is there any opportunity during tree lucerne establishment periods; If yes please tick in
the below lists and rank the opportunities in the order of its positive impact on the
establishment
v Opportunity realized 1st 2nd 3rd I. Availability of enough labor .......... .......... ..........
II. Availability of land for expansion .......... .......... .......... III. Potential niche .......... .......... .......... IV. Availability of water for irrigation .......... .......... .......... V. Farmers demand for the technology .......... .......... ..........
Where, 1st 2nd and 3rd shows the order of opportunists realized by farmers
22. Can you tell us the main reasons why you grow Tree lucerne? [WRITE KEY
WORDS ONLY]
I. ___________________________________________________________ II. ___________________________________________________________
III. ___________________________________________________________ Is there anything you want to tell us in relation to the discussion we have today? 1) Yes 2)
No [Go to thank you]. ..................................................................................................
..................................................................................................
..................................................
I thank you so much for your time and shared experience.

74
Figure 2. Tree lucerne field observations/visits with the Key informants of Endamehoni sites

75

76
Copyright © 2022 FDOKUMEN