growth performance and nutritive quality of tree lucerne - CORE
Upload
khangminh22Category
view
0download
0
NUTRITIVE VALUE AND FARMERS PREFERENCE OF CHICKPEA
(Cicer arietinum L.) VARIETIES FOR FOOD FEED TRAITS
MSc. Thesis
By
Etagegnehu Bzuneh
June, 2021
Debre Berhan, Ethiopia

i
NUTRITIVE VALUE AND FARMERS PREFERENCE OF CHICKPEA
(Cicer arietinum L.) VARIETIES FOR FOOD-FEED TRAITS
A Thesis Submitted to the Department of Animal Science
College of Agriculture and Natural Resource Sciences, School of Graduate
Studies
DEBRE BERHAN UNIVERSITY
In Partial Fulfilment of the Requirement for the Degree of Master of Science
in Animal Production
By
Etagegnehu Bzuneh
Major Advisor: Mekete Bekele (PhD)
Co-advisor: Dereje Tadesse (PhD)
Co-advisor: Jane Wamatu (PhD)
Co-advisor: Ashraf Alkhtib (PhD)
June, 2021
Debre Berhan, Ethiopia

ii
SCHOOL OF GRADUATE STUDIES
COLLEGE OF AGRICULTURE AND NATURAL RESOURCE SCIENCES
DEBRE BERHAN UNIVERSITY
APPROVAL SHEET – I
This is to certify that the thesis entitled: Nutritive value and farmers preference of chickpea
(Cicer arietinum L.) varieties for food-feed traits submitted in partial fulfilment of the
requirements for the degree of Masters of Science with specialization in Animal production of
the Graduate Program of the Department of Animal Science, College of Agriculture and Natural
Resource Sciences, Debre Berhan University and is a record of original research carried out by
Etagegnehu Bzuneh, PGR/040/11, under my supervision and no part of the thesis has been
submitted for any other degree or diploma.
The assistance and help received during this investigation have been duly acknowledged.
Therefore, I recommend that it can be accepted as fulfilling the thesis requirements.
_____________ _____________ _____________
Name of Major Advisor Signature Date
OR
_____________ _____________ _____________
Name of Co-Advisor Signature Date

iii
SCHOOL OF GRADUATE STUDIES
COLLEGE OF AGRICULTURE AND NATURAL RESOURCE SCIENCES
DEBRE BERHAN UNIVERSITY
APPROVAL SHEET – II
We, the undersigned, members of the Board of Examiners of the final open defense by
Etagegnehu Bzuneh have read and evaluated his/her thesis entitled : Nutritive value and
farmers preference of chickpea (Cicer arietinum L.) varieties for food-feed trait and
examined the candidate. This is therefore to certify that the thesis has been accepted in partial
fulfillment of the requirements for the degree Masters of Science in Animal Science with
Specialization in Animal Production.
May 25, 2021
Name of Major Advisor Signature Date
May 25, 2021
Name of Internal Examiner Signature Date
May 25, 2021
Name of External Examiner Signature Date
May 25, 2021
Associate Dean, College Res/CS & Post
Graduate
Signature Date
May 25, 2021
Dean, College of Graduate Studies (CGS) Signature Date
Final approval and acceptance of the thesis is contingent upon the submission of the
final copy of the thesis to the College of Graduate Studies (CGS) through the
Department Graduate Committee (DGS) of the candidate‟s.
Stamp of CGS Date

iv
SCHOOL OF GRADUATE STUDIES
COLLEGE OF AGRICULTURE AND NATURAL RESOURCE SCIENCES
DEBRE BERHAN UNIVERSITY
APPROVAL SHEET – III
As members of the Board of Examiners of the final Masters open defense, we certify that we
have read and evaluated the thesis prepared by Etagegnehu Bzuneh under the title: Nutritive
value and farmers preference of chickpea (Cicer arietinum L.) varieties for food-feed trait,
and recommend that it be accepted as fulfilling the thesis requirement for the degree of Master of
Science in Animal Sciences with Specialization in Animal Production.
May 25, 2021
Name of External Examiner Signature Date
May 25, 2021
Name of Internal Examiner Signature Date
Final approval and acceptance of the thesis is contingent upon the submission of the final copy of
the thesis to the CGS through the DGC of the candidate‟s Department.
Thesis approved by
___________________ __________________
DGC Signature Date
Certification of the final Thesis
I hereby certify that all the corrections and recommendation suggested by the Board of
Examiners are incorporated in to the final thesis
“ ” by
Name of the Major Advisor Signature Date
Stamp of CGS Date ______________

v
ACKNOWLEDGEMENTS
First and foremost, I praise and glorify the Almighty God and his mother Saint Virgin Mary for
their immeasurable help and blessing and for giving me the stamina required to complete this
piece of work. My appreciation and heartfelt gratitude go to my advisors Dr. Mekete Bekele, Dr.
Dereje Tadesse, Dr. Jane Wamatu and Dr. Ashraf Alkhtib for their keen interest, valuable
comments, suggestions, and encouragement from the initial stage of thesis research proposal
development to the completion of the thesis.
I would like to pay my sincere gratitude to the International Center for Agricultural Research in
the Dry Areas (ICARDA) for providing me the financial support required to do this research
work. I would like to express my sincere thanks to Mr. Nahom Ephrem for his valuable
guidance, collaboration and encouragement on various stages of my work.
I would like to express my sincere thanks to Mr. Abiro Tigabie for preparing chickpea
questionnaires and Mr Yonas Asmare for his cooperation and support during chemical
composition analysis. I would like to acknowledge Holleta Agricultural Research Center
especially Mr. Gebiremariyam Terefe for his cooperation to conduct the in situ analysis of the
chickpea samples. I would like to express my special thanks to all Development Agents
especially those who work on Adadi Goli, Lemlem Chefe and Grimi kebele for their support,
cooperation, and guidance during my fieldwork as well as survey data collection. I extend my
acknowledgment to the owners of the land for the experiment for their kind approach,
cooperation and valuable suggestions. I would like to express my special thanks to all
respondents of chickpea producer in the study area for their time and supply basic information
during survey work.
I would like to extend my appreciation to my classmates for their encouragement, supportive
attitude and technical guidance during proposal writing and this research paper. My special
thanks go to Debre Berhan University College of Agriculture and Natural Resource Sciences for
allowing me the chance and study leave for my MSc study. I would like express my deepest
appreciation to all staff members of the Animal Science department for their encouragement,
support and valuable suggestion. Last but not least, I would like to thank my family and friends
for all of their encouragement, love and support.

vi
DEDICATION
This thesis is dedicated to my father Bzuneh Belayneh.

vii
STATEMENT OF THE AUTHOR
First, I declare that this thesis is my genuine work and all sources of materials used for this thesis
have been profoundly acknowledged. This thesis has been submitted in partial fulfilments of the
requirements for MSc degree at Debre Berhan University and is deposited at the University
Library to be made available to borrowers under the rules of the Library. I solemnly declare that
this thesis is not submitted to any other institution anywhere for the award of any academic
degree, diploma or certificate.
Brief quotations from this thesis are allowable without special permission, provided that accurate
acknowledgement of the source is made. Requests for permission for extended quotation from or
reproduction of this manuscript in whole or in part may be granted by the head of the major
department or the Dean of the School of Graduate Studies when in his judgment the proposed
use of the material is in the interest of scholarship. In all other instances, however, permission
must be obtained from the author and advisors of this thesis
Name: Etagegnehu Bzuneh Signature. ……….………
Place: College of Agriculture, Debre Berhan University, Debre Berhan
Date of Submission: June, 2021

viii
BIOGRAPHICAL SKETCH
The author was born in June 28, 1997, in Tarmaber Kebele, Mojana Wedera district, North
Shewa Zone, Amhara National Regional State from her father Ato Bzuneh Belayneh and her
mother Aynalem Mekasha. She attended her primary education at Tarmaber Primary School and
her secondary and preparatory education at Debre Sina General Secondary and Preparatory
School. Then she joined Debre Berhan University, College of Agriculture and Natural Resources
Sciences in the Department of Animal Science in 2016 and obtained her B.Sc. degree in Animal
Science in June 2018. In the same year, she was hired at Debre Berhan University as a graduate
assistant and she was joined the school of graduate studies at Debre Berhan University to attend
her MSc degree in animal production in October 2019.

ix
ABBREVIATIONS AND ACRONYMS
ADF Acid Detergent Fiber
ADL Acid Detergent Lignin
ANOVA Analysis of Variance
BP Biomass Production
BW Body Weight
CSA Central Statistical Agency
CP Crude Protein
CPI
DA
Crude Protein Intake
Developmental Agents
DF Days to 50% Flowering
DM Dry Matter
DTM Days to 90% Maturity
DMD Dry Matter Digestibility
DMI
DZARC
Dry Matter Intake
Debre Zeit Agricultural Research Center
EE Ether Extract
ED
EIAR
Effective Degradability
Ethiopian Institute of Agricultural Research
FAOSTAT Food and Agricultural Organization Statics
FGD Focus Group Discussion
GY Grain Yield
HI Harvest Index
HSW Hundred Seed Weight
HY Haulm Yield
ICARDA International Center for Agricultural Research in Dry Areas
ILRI International Livestock Research Institute
IVDMD In vitro Dry Matter Digestibility
IVOMD In vitro Organic Matter Digestibility

x
ABBREVIATIONS AND ACRONYMS (Continued)
ME Metabolizable Energy
MEI Metabolizable Energy Intake
MOA Ministry of Agriculture
NFE Nitrogen Free Extract
NIRS Near-Infrared Reflectance Spectroscopy
NPB Number of Primary Branches
NSB Number of Secondary Branches
OM Organic Matter
PH Plant Height
PUI Potential Utility Index
PVS Participatory Variety Selection
RCBD Randomized Complete Block Design
RFV Relative Feed Value
SAS Statistical Analysis System
SPSS Statistical Package for Social Sciences
TDN Total Digestible Nutrient

xi
TABLE OF CONTENTS
ACKNOWLEDGEMENTS v
DEDICATION vi
STATEMENT OF THE AUTHOR vii
BIOGRAPHICAL SKETCH viii
ABBREVIATIONS AND ACRONYMS ix
TABLE OF CONTENTS xi
LIST OF FIGURES xv
LIST OF TABLES IN THE APPENDIX xvi
LIST OF FIGURES IN THE APPENDIX xvii
ABSTRACT xviii
1. INTRODUCTION 1
2. LITERATUR REVIEW 4
2.1. Overview of Livestock Feed Resources in Ethiopia 4
2.2. Crop Residues 4
2.3. Food Legume Crops and their Roles 9
2.4. Chickpea and its Roles 9
2.4.1. Chickpea production in Ethiopia 10
2.4.2. Yield and yield components of chickpea 11
2.5. Chickpea Haulm as Livestock Feed Resource and its Nutritive Value 12
2.5.1. Chemical composition 12
2.5.1. Dry matter degradation kinetics 13
2.6. Relationship between Food- Feed Traits of Chickpea 15
2.7. Participatory Variety Selection 16
3. MATERIALS AND METHODS 17
3.1. Cultivation of Different Varieties of Chickpea 17

xii
TABLE OF CONTENTS (Continued)
3.1.1. Description of the study area 17
3.1.2. Experimental design 17
3.1.3.Agronomic parameter evaluation and sample collection 18
3.2. Laboratory Evaluation 19
3.2.1. Chemical composition 19
3.2.2. In situ ruminal incubation 20
3.3. Haulms Dry Matter Yield and Potential Utility Index 21
3.4. Evaluation of Farmer Preferences and Knowledge 21
3.4.1. Selection of survey kebeles and household data collection 21
3.4.2. Farmer field day 22
3.5. Statistical Analysis 22
4. RESULTS AND DISCUSSION 24
4.1. Food -Feed Traits of Selected Chickpea Varieties 24
4.1.1. Grain and haulm yield 24
4.1.2. Haulm dry matter yield, harvest index and potential utility index 25
4.1.3.1. Dry matter and ash contents 26
4.1.3.3. Cell wall contents 27
4.1.3.4. Crude protein 29
4.1.3.5. Metabolizable energy 29
4.1.3.6.In vitro organic matter digestibility 30
4.1.3.7.Relative feed value 30
4.1.4. Dry matter degradability and degradability characteristics 31
4.1.5. Correlation among food-feed traits of chickpea 35
4.1.6. Correlation between yield and yield-related traits 38
4.2. Farmer Preferences and Knowledge Related to Food-Feed Traits 39
4.2.1. Demographic and socioeconomic characteristics of the respondents 39
4.2.2. Livestock and landholding of the respondents 41
4.2.3. Crop production and land use pattern 43

xiii
TABLE OF CONTENTS (Continued)
4.2.4. Chickpea production 45
4.2.6. Major Feed Resources 47
4.3. Participatory Varieties Selection 51
5. SUMMARY, CONCLUSION AND RECOMMENDATIONS 53
5.1. Summary and Conclusion 53
5.2. Recommendations 53
6. REFERENCES 55
7. APPENDIX 70

xiv
LIST OF TABLES
Tables Page
1. Chemical composition and nutritional value of some legume residues………………………………. 7
2. Chemical composition and nutritional value of some cereal residues ....................................... 8
3. Chemical composition and nutritional value of chickpea haulms ............................................ 13
4. Ruminal DM degradation characteristics of chickpea haulms ................................................ 14
5. Ruminal NDF, OM and CP degradation characteristics of chickpea haulms ........................... 15
6. Description of the chickpea varieties used in the experiments ................................................ 18
7. Average grain yield, straw yield, haulm dry matter yield, harvest index and potential utility
index of eight chickpea varieties ......................................................................................... 25
8. Dry matter, ash and cell wall contents of chickpea varieties on experimental sites ................. 28
9. Crude protein, metabolizable energy, in vitro organic matter digestibility and relative feed
value of chickpea varieties on experimental sites ............................................................... 31
10. In situ dry matter degradability of chickpea varieties haulms (%DMD) ................................ 33
11. In situ dry matter degradability characteristics of chickpea haulm ....................................... 35
12. Pearson correlation between food feed traits of chickpea ..................................................... 37
13. Correlation among yield and yield components in chickpea varieties in the study area ....... 39
14. Demographic and socioeconomic characteristics of the respondents in three kebeles of
Gimbichu district ................................................................................................................. 40
15. Means and SE of years of schooling and number of persons currently living in the HH in
three kebeles of Gimbichu District ...................................................................................... 41
16. Landholding (ha HH-1
) of the respondents in the study area of Gimbichu District ............... 43
17. Average land allocated and yield of crops in three kebeles of Gimbichu District ................ 44
18. Selection criteria of chickpea varieties in Gimbichu district ................................................. 46
19. Rank of feed resources in the study district ............................................................................ 48
20. The rank of legume haulms used for livestock feed .............................................................. 49
21.The proportion of chickpea haulm usage, cultivar haulm preferences as a livestock feed and
storage months ..................................................................................................................... 50
22. Pair-wise ranking of selection criteria for chickpea variety by farmers ................................ 52
23. Participatory variety selection of chickpea varieties in the experimental site ........................ 52

xv
LIST OF FIGURES
Figures Page
1. Total DM production shares of different feed resources in selected kebeles of Bedele district,
Oromia, Ethiopia ............................................................................................................... 5
2. Major chickpea growing region in Ethiopia ............................................................................. 11
3. Ruminal organic matter and crude protein degradation of chickpea haulm at different
incubation times . ................................................................................................................ 14
4. A graphical pattern of ruminal DMD of chickpea haulm at different incubation time ............ 33
5. The proportion of improved chickpea production in three kebeles of Gimbichu district ........ 45
6. Season of feeding crop residues ............................................................................................... 48
7. Feeding system of chickpea haulms ........................................................................................ 50
8. Time of feeding chickpea haulms ............................................................................................ 51

xvi
LIST OF TABLES IN THE APPENDIX
Appendix Tables Page
1. Conversion factors used to calculate Tropical Livestock Units (TLU) .................................... 76
2. Livestock holding and species composition per HH per TLU ................................................. 76
3. Analysis of variance for the yield and yield related traits of chickpea varieties ..................... 77
4. Analysis of variance for the chemical composition of chickpea varieties haulms ................. 79
5. Summary on analysis of variance for in sacco dry matter degradability of chickpea varieties
haulms ................................................................................................................................. 77
6. Summary on analysis of variance for in sacco dry matter degradability characteristics of
chickpea varieties haulm ..................................................................................................... 84
7. Name of varieties and assigned entry number .......................................................................... 84

xvii
LIST OF FIGURES IN THE APPENDIX
Appendix Figures Page
Appendix Figure 1. Row planting of the experimental material ................................................. 85
Appendix Figure 2. Pictures of some experiment material plot .................................................. 86
Appendix Figure 3. Farmer‟s participation during varieties selection ......................................... 86

xviii
NUTRITIVE VALUE AND FARMERS PREFERENCE OF CHICKPEA
(Cicer arietinum L) VARIETIES FOR FOOD-FEED TRAITS
ABSTRACT
The study was conducted to evaluate the nutritive value of chickpea haulms from different
varieties, to determine the relationship between the feed-food traits of chickpea and to assess
farmers’ knowledge and preference of chickpea varieties. The study involved field experiment,
household survey and farmers’ field day. For the field experiment, eight selected varieties of
chickpea were used and planted on four farmers’ fields. Agronomic parameters were recorded
and subsequently, representative haulm samples were taken for nutritional analysis. Survey and
farmers’ field were used to assess farmers' knowledge and preferred traits as related to food-
feed traits. Experimental data were analyzed by using analysis of variance (ANOVA) using
Statistical Analysis System software (SAS, 2004) and survey data was analyzed using SPSS
statistics tools. The result revealed that higher grain yield (GY) (1.47t/ha) (P<0.001) and haulm
yield (HY) (2.49) (P<0.05) were obtained from Teketay variety. Relatively higher crude protein
(CP) (5.12%) and in vitro organic matter digestibility (IVOMD) (50.63%) and metabolizable
energy (ME) (7.44MJ/Kg (p<0.01) were obtained from Dz0058 variety. Higher dry matter
degradability (DMD) (p<0.001) was recorded in Dz0058 except for 0, 6 and 24 hours of
incubation in the rumen. Higher potential degradable fraction (PD) (61.99%) and effective dry
matter degradability (EDMD) (46.79%) (p<0.001) were obtained from Dz0058.The GY was
significantly (p<0.001) and positively associated with plant height (PH) (r=0.76), biomass
production (BP), harvest index (HI) and HY. The survey showed that chickpea was the dominant
legume grain produced in the study area as a result the haulm was used as livestock feed. The
participatory variety selection (PVS) showed Teketay, Dalota and local were found to be the
most preferred varieties based on selected criteria. These varieties were found to be good in
terms of grain and straw yield hence could be recommended as suitable candidates for crop
rotation with cereals in the study area in enhancing livestock production in addition to grain
yield for human consumption.
Keywords: Chickpea haulm, dry matter degradability, grain yield, participatory variety
selection

1
1. INTRODUCTION
Ethiopia is gifted with various agro-ecological zones suitable for the production of diversified
crop and livestock species (Tolera Adugna et al., 2012). It is believed to have the largest
livestock population in Africa and the livestock sector has been contributing a considerable
portion to the economy and still promising to rally round the economic development (Central
Statistical Agency of Ethiopia (CSA, 2020). Livestock production ensures the availability of
food (meat and milk and milk by-products, honey and egg), serves as the source of cash income,
agricultural inputs for crop production and used as live banks in the rural community (Dereje
Duressa et al., 2014; Belay Beyene, 2017; CSA, 2020). Furthermore, livestock plays an
important role in providing export commodities (live animals, hides and skins) to earn foreign
exchanges to the country. On the other hand, draught animals provide power for the cultivation
and crop long-distances, to convey their agricultural products to the market places and bring
back threshing virtually all over the country and are also essential modes of transport to take
holders and their families their domestic necessities. Livestock as well confers a certain degree
of security in times of crop failure as they are a “near-cash” capital stock (CSA, 2020).
Though the country has large number of livestock and favourable environment, the contribution
of livestock to the producers in particular and the national economy in general is below expected
(Tolera Adugna, 2008). This is due to some interrelated factors such as feed scarcity in terms of
both quality and quantity, the prevalence of diseases and parasites and poor genetic potential of
the indigenous animals (Kassahun Gurmessa et al., 2015; Hassanuur Hassan et al., 2020).
Among the constraints, shortage of feed in terms of quantity and quality is the major one
hindering livestock production and productivity (Tolera Adugna et al., 2012; Lelisa Diriba and
Mengistu Urge, 2020; Bezabih Melkamu et al., 2020).
In the highlands of Ethiopia, mixed farming system is dominated hence, the community depends
on subsistence crop-livestock farming where livestock are integrally linked to the cultivation and
complement each other (Belay Duguma et al., 2012; Wuletaw Mekuria et al., 2018a). As a result
of population pressure, communal grazing lands are in a decreasing trend (Hiwet Gebremedhin et
al., 2017). As a result, the provision of crop residues as livestock feed becoming more practical

2
due to the shortage of alternative feed resources (Solomon Gizaw et al., 2017). In this regard,
crop residues provide a considerable quantity of dry season feed in the mixed farming system of
Ethiopia (Ashenafi Miresa et al., 2019); Lelisa Diriba and Mengistu Urge, 2020). As a result, its
contribution exceeded 50% of the livestock feeds in cereal growing regions of the country
(Solomon Gizaw et al., 2017). Ashenafi Miresa et al. (2019) also indicated that crop residues
including cereals and pulses are the main feed resource during the dry season which supplied
about 77.41% of the annual dry matter (DM). However, studies showed that cereal straws and
stovers are poor feed sources with low crude protein (CP), digestibility and higher fiber fractions
(Mekuanint Gashaw and Girma Defar, 2017; Lelisa Diriba and Mengistu Urge, 2020). However,
legume haulms have relatively better nutritional values (CP, metabolizable energy (ME)
contents) and digestibility) compared to cereal straws (Lopeze et al., 2005; Eyob Haile, 2017;
Haule, 2017).
Grain legumes play an important role as a source of food and feed in smallholder mixed systems
and they also contribute to soil fertility improvement through biological nitrogen fixation (Sisay
Belete et al., 2019). Among different legume grains, chickpea is a cool-season food-feed legume
and grown as a winter crop in the tropics and as a summer or spring crop in temperate
environments (FAOSTAT, 2012). It is a good source of protein, carbohydrates, minerals, and
vitamins for human nutrition especially in developing countries (Sheleme Beyene et al., 2015). It
is relatively high in the content of CP and carbohydrate compared to some other legume grains
(Sharma et al., 2013). In addition to human nutrition, the chickpea by product and the haulm of
chickpea used as animal feed because of their nutritional value (Bampidisa and Christodoulou,
2011). According to the report of Eyob Haile (2017), the residue of chickpea contains higher CP
(10.67%) and ME (7.94 MJ/kg) than cereal straws. Ashiraf (2017) also indicated that the CP, in
vitro organic matter digestibility (IVOMD) and ME of chickpea haulm ranged from 7.12-11.1%,
48.4-52.6% and 7.1-7.72 MJ/kg, respectively. Moreover, Tena Alemu (2016) indicated that the
CP, IVOMD and ME of Desi type chickpea variety haulms ranged from 3.31-5.21%, 49.51-
53.07% and 7.27-7.78 MJ/kg, respectively. The variation of the chemical composition of
chickpea haulms is due to genetic as well as environmental factor (Jane et al., 2017a).Even
though crop residues make a substantial contribution as a source of livestock feed in mixed crop-
livestock production systems, different crop improvement programs like fertilizer applications,

3
variety selection, etc. were focused on grain production with no consideration of yield and
nutritive value of crop residues and evaluation and selection of „‟improved variety without
farmer participation. Improvement of crop residues through the collaboration of crop and
livestock scientists in multidimensional crop and feed improvement initiatives are necessary. In
this attempt, International Center for Agricultural Research in Dry Areas (ICARDA) has initiated
multidisciplinary research together with its Ethiopian national partners to produce grain legume
cultivars. By increasing crop coverage and production, increasing crop residues production and
thus maximization of crop residues utilization is very essential. Moreover, promoting the
improved cultivars and associated crop production technologies to farmers through participatory
evaluation and selection approaches are very imperative.
Participatory varietal selection (PVS) is the selection made by farmers on their fields of finished
or near-finished products from plant breeding programs including released cultivars and varieties
in advanced stages of testing (Astawus Esatu et al., 2018). In PVS the users are allowed to
participate in selecting appropriate technologies by employing their indigenous knowledge, as a
result, it is an effective tool in facilitating the adoption and extension of the improved
technologies (Obsa Chimdesa et al., 2018). According to Molla Fantie and Tsedalu Jemberu
(2012), PVS has a significant role in technology adaptation and dissemination in a short time
than the conventional approach. In smallholder crop-livestock production systems, the
improvement of crop straw yield implies an increase in livestock production and productivity. By
involving farmers in variety selection, it can be possible to develop and popularize varieties of
chickpea crops having high yield (both grain and straw) and better in nutritional content and
other agronomic traits.
Thus, the objectives of the present study were
To evaluate the nutritive value of chickpea haulms from different varieties
To evaluate the relationship between the feed-food traits of chickpea
To assess farmer preferences and knowledge related to food-feed traits of chickpea
4
2. LITERATUR REVIEW
2.1. Overview of Livestock Feed Resources in Ethiopia
Crop-livestock mixed farming systems are the mainstay of smallholders by integrating crops and
livestock. Rising populations, together with increasing livestock density and grain production
pressure exerts considerable pressure on land resources tend to increase these systems (Wuletaw
Mekuria et al., 2018b). Livestock act as a live bank and insurance in times of crop failure, as
they are a “near-cash” capital stock as well as a vital source of dietary protein (CSA, 2020). The
major livestock feed supply in the highlands is based on crop residues, natural pasture and crop
aftermath (Derbie Alemu et al., 2019; Habte Abebaye et al., 2019; Lelisa Diriba and Mengistu
Urge, 2020). Crop residues (including stems, leaves and chaff) refer to the portion of the
harvested crop, which remains after the grain portion of the crop is removed. However, the area
of grazing land has declining due to the expansion of cropping to meet the food demand of the
ever-increasing human population. As a result, ruminants depend largely on crop residues
(Fekede Feyissa, 2011; Mekete Bekele et al., 2018).
Straws (from teff, wheat and barley), stovers (from maize and sorghum) and haulms (from
pulses) are the major crop residue having an important role in livestock feed provision
(Andualem Tonamo et al., 2015; Kassahun Gurmessa et al., 2016; Mekuanint Gashaw and
Girma Defar, 2017). Food feed crops produce large quantities of crop residues (straws, stovers,
and haulms) in addition to grain thus which are considered as dual-purpose crops (Fekede
Feyissa, 2011). They are important for smallholder farmers in the mixed crop-livestock systems
to mitigate feed shortage and provide human food with a balanced diet (Sisay Belete et al.,
2019). Grain and crop residues of various cereal and pulse crops are contributing substantial
roles equally to the livelihoods of smallholder farmers (Blummel et al., 2010).
2.2. Crop Residues
The crops grown are mainly used as food for humans as well as a means of income whereas
residues from cereal and pulse crops are the major source of livestock feed (Dawit Assefa et al.,
2013). Crop-residues result from the expansion of crop production which provides a considerable
quantity of dry season feed in most farming areas of Ethiopia especially in the highland and mid-

5
altitude agro-ecologies (Derbie Alemu et al., 2019; Ararsa Derara and Amanuel Bekuma, 2020).
They have an important role in fulfilling feed gaps during periods of acute feed shortage
(Kassahun Gurmessa et al., 2015). Although the dominant use of crop residues is as livestock
feed, they have also other alternative uses such as for construction, fuel and as sources of cash
income under the Ethiopian context (Fekede Feyissa, 2011). Furthermore, they are an important
source of soil mulch in the mixed cropping-livestock systems (Ashiraf, 2017).
Studies showed that crop residues had higher total DM production shares relative to other feed
resources and the contribution is greater than 50% of the livestock feeds in the mixed crop-
livestock production system (Solomon Gizaw et al., 2017; Ashenafi Marisa et al., 2019; Getahun
Belay and Tegene Negesse, 2019). The availability of crop residues is closely related to the
farming system, the type of crops produced and the intensity of cultivation (Solomon Gizaw et
al., 2017). The utilization of crop residues is soon after the main crop harvest and threshed and
by conservation for next dry and wet seasons mostly stalked in the open air (Kassahun Gurmessa
et al., 2016; Kasa Biratu and Saba Haile, 2017).
Figure 1. Total DM production shares of different feed resources in selected kebeles of Bedele
district, Oromia, Ethiopia Source. (Ashenafi Miresa et al., 2019)

6
2.2.1. Nutritional value of crop residues
Crop residues are the sources of energy feed; hence up to 80% of their DM is made up of
polysaccharides. They vary greatly in chemical composition and digestibility depending on
species, varietal differences and agronomic practices. They are fibrous feed characterized by
high cell wall content and lower digestibility and CP content specifically cereal straw and stover
(Deribe Gemiyo et al., 2013; Lelisa Diriba and Mengistu Urge, 2020). According to Blümmel et
al. (2010), low CP had a major limitation to the feeding value of cereal residues, particularly
when it fed without supplementation. Derbie Alemu et al. (2019) also indicated that cereals
straws had less CP required for optimum microbial rumen function. Consequently, feeding of
straw and stovers without supplementation resulted in low intake, digestibility and utilization.
The variation in the nutritional value of crop residues is due to the differences in the proportion
of botanical fractions within and between the crop residues (Eyob Haile, 2017), genotype, agro
ecology (Derbie Alemu et al., 2019), species (Mekuanint Gashaw and Girma Defar, 2017),
maturity (Rambau et al., 2016). Legume residues have relatively higher nutritional value (higher
ME, CP, digestibility) than cereals straws and stovers (Lopeze et al., 2005; Ashiraf, 2017; Eyob
Haile, 2017). Under limited resources in the households, better utilization of crop residue could
be achieved by maximizing the use of legume residue as feed and optimizing the use of cereal
residue as soil mulch (Ashiraf, 2017). Furthermore, Eyob Haile et al. (2017) indicated that the
effective degradability of dry matter (ED) and organic matter digestibility (OMD) values were
higher for legume residue than for cereal crop residues.
According to Lelisa Diriba and Mengistu Urge (2020), even though, legumes residues had high
cell wall contents, they had significantly higher CP than cereal crop residues. Lopeze et al.
(2005) also indicated legume haulms had better feeding value and they were degraded in the
rumen at a faster rate, resulting in a higher extent of degradation. Furthermore, according to
Mekuanint Gashaw and Girma Defar (2017), pulses straws contain higher CP and in vitro dry
matter digestibility (IVDMD). Derbie Gemiyo et al. (2013) also indicated that the CP and
IVDMD content of crop residues were lower than browses and grasses.

7
The nutritive value of the crop residues is enhanced through physical and/or chemical treatment
and/or supplementation with agro-industrial byproducts or forage legume. According to Fitsum
Abera et al. (2018), treatment with urea and urea-molasses with concentrate mix is a
considerable option for improving the utilization of maize stover. Ashiraf (2017) also indicated
that urea treatment results in a considerable enhancement of the nutritive value of chickpea, faba
bean and lentil straw by increasing CP, IVOMD, ME, dry matter intake (DMI), crude protein
intake (CPI) and metabolizable energy intake (MEI) and decreasing fiber constituents. Moreover,
Teklu Wegifeyisa (2016) reported that supplementation of faba bean straw with concentrate
resulted in higher potential value as animal feed.
Table 1. Chemical composition and nutritional value of some legume residues
Sources Residues CP
(%)
ME(MJ
/kg)
IVDMD
(%)
NDF
(%)
ADF
(%)
ADL
(%)
Kassahun
Gurmessa et al.
2016
Haule (2017)
Field pea haulm 5.33 8.48 49.86 67.51 47.94 13.56
Faba bean haulm 4.71 9.12 54.68 66.89 48.13 15.64
Common bean haulm 8.79 8.9 55.9 61.8 48.3 -
Cow pea haulm 13.9 10.4 65.3 60.1 44.2 -
Pigeon pea haulm 10.1 8.98 53.8 57.6 33.6 -
Eyob Haile
(2017)
lentil haulm 9.4 8.39 - 52.0 32.5
Asemahegn
Mersha and
Debissa Lemessa
(2020)
Lentil haulms 7.20 8.09 - 50.51 36.77 -
CP= crude protein, ME= metabolizable energy, IVDMD= in vitro dry matter digestibility, NDF=
neutral detergent fiber, ADF= acid detergent fiber, ADL= acid detergent lignin
8
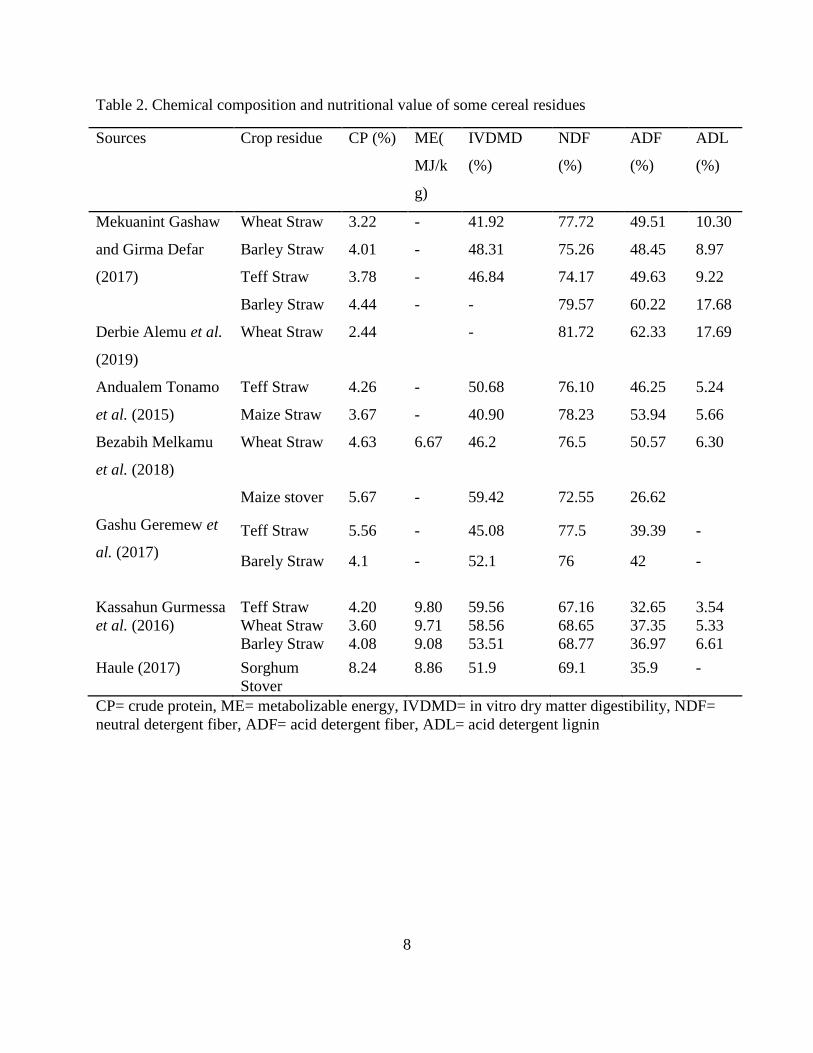
Table 2. Chemical composition and nutritional value of some cereal residues
Sources Crop residue CP (%) ME(
MJ/k
g)
IVDMD
(%)
NDF
(%)
ADF
(%)
ADL
(%)
Mekuanint Gashaw
and Girma Defar
(2017)
Wheat Straw 3.22 - 41.92 77.72 49.51 10.30
Barley Straw 4.01 - 48.31 75.26 48.45 8.97
Teff Straw 3.78 - 46.84 74.17 49.63 9.22
Derbie Alemu et al.
(2019)
Barley Straw 4.44 - - 79.57 60.22 17.68
Wheat Straw 2.44 - 81.72 62.33 17.69
Andualem Tonamo
et al. (2015)
Teff Straw 4.26 - 50.68 76.10 46.25 5.24
Maize Straw 3.67 - 40.90 78.23 53.94 5.66
Bezabih Melkamu
et al. (2018)
Wheat Straw 4.63 6.67 46.2 76.5 50.57 6.30
Gashu Geremew et
al. (2017)
Maize stover 5.67 - 59.42 72.55 26.62
Teff Straw 5.56 - 45.08 77.5 39.39 -
Barely Straw 4.1 - 52.1 76 42 -
Kassahun Gurmessa
et al. (2016)
Teff Straw 4.20 9.80 59.56 67.16 32.65 3.54
Wheat Straw 3.60 9.71 58.56 68.65 37.35 5.33
Barley Straw 4.08 9.08 53.51 68.77 36.97 6.61
Haule (2017) Sorghum
Stover
8.24 8.86 51.9 69.1 35.9 -
CP= crude protein, ME= metabolizable energy, IVDMD= in vitro dry matter digestibility, NDF=
neutral detergent fiber, ADF= acid detergent fiber, ADL= acid detergent lignin

9
2.3. Food Legume Crops and their Roles
Food legumes are species of the plant family Leguminosae whose seeds are consumed directly
by humans. They have an important role in global food and nutrition especially in the dietary
pattern of low-income groups of people in developing countries. They are also the source of
nitrogen in organic cropping systems as it fixes atmospheric nitrogen and effectively bringing
new nitrogen into the soil system (Sharon et al., 2020). They are the second most-produced crop
in Ethiopia next to cereals and cultivated on more than 1.5 million hectares of land annually,
mainly by smallholder farmers in the mixed crop-livestock farming system for food, feed and
soil fertility improvement through symbiotic biological nitrogen fixation (CSA, 2015; Sisay
Belete et al., 2019). In addition to contributing directly to food security, food legumes also play
an important role as a source of feed for livestock thus indirectly contributing to food security.
Besides, grain by products of legumes play an important role as sources of dry fodder for
livestock (Sharasia et al., 2017).
In Ethiopia, the production of food legumes covered 12.73% (1,620,497.30 ha) of the grain crop
area next to cereal crops and 9.54% (about 30,113,480.57 quintals) of the grain production was
drawn from the same crops. Faba beans, haricot beans (white), haricot beans (red) and chickpeas
(white) were planted to 3.87% (about 492,271.60 ha), 0.69% (about 88,302.71 ha), 1.57% (about
200,334.52 ha) and 1.28% (about 163,067.24 ha) of the grain crop area, respectively. The
production obtained from faba beans, haricot beans (white), haricot beans (red) and chickpeas
(white) was 3.30%, 0.48%, 1.07% and 1.05% of the grain production, respectively (CSA, 2019).
2.4. Chickpea and its Roles
Chickpea (Cicer arietinum L.) is one of the self-pollinating legume crops with a diploid set of
chromosomes (2n=16) (Varshney et al., 2013) cultivated for its edible seeds in almost all part of
the world. It has a highly digestible protein content (23%) and also rich in carbohydrates (64%),
starch (47%), fiber (6%), and minerals (phosphorus, calcium, magnesium, iron and zinc). Its
Lipid fraction is also high in unsaturated fatty acids (Jukanti et al., 2012). According to Mamta et
al. (2021), chickpea seed contain 22.1 -24.42% protein, 0.15-1.25 sulphur-containing amino acid
and 0.63-1.38% Tryptophan. In addition, it fixes atmospheric nitrogen through bacteria

10
(rhizobium) present in their roots, which in turn improves soil fertility hence the crops sown
succeeding the chickpea are also benefited. Due to the tap root system, they open up the soil and
the extensive leaf drop increases the organic matter in the soil (Lijalem Korbu et al., 2016).
Chickpea is quick-growing, branched and reaches a height between 20 and 60 cm, even up to 1
m. It has a deep taproot and many lateral secondary roots exploring the upper layers of the soil,
as a result, it can use residual moisture and it allows farmers to harvest two crops in a growing
season (cereal followed by chickpea) thereby improving their food supply and income (Yasin
Goa et al., 2017). Based on distinct botanical or morphological features and molecular diversity
analysis, chickpea is primarily classified into Desi and Kabuli type. Desi-type chickpea is
characterized by small seeds size, pods, leaflets, plantlets and darker colored and smooth or
wrinkled seed coat. On the other hand, the Kabuli type is characterized by large seeds, pods,
leaflets, plantlets and white to cream-colored seed coat color (Sheleme Beyene et al., 2015).
2.4.1. Chickpea production in Ethiopia
Chickpea is one of the major pulses grown in Ethiopia, mainly by subsistence farmers usually
under rain-fed conditions (Getachew Tilahun et al., 2015) and largely produced next to faba
bean, haricot bean and field pea (CSA, 2020). Ethiopia is the sixth largest producer of chickpea
in the world and the leading producer in Africa (FAOSTAT, 2016). In Ethiopia chickpea is
usually grown on black vertisols with minimum tillage and such soils are known for its excess
water and drainage problem during the main rainy period (June–August). Thus, to overcome this
problem, farmers plant chickpea late in the season (September–October) commonly on residual
moisture (Legesse Dadi et al., 2005) which gives farmers opportunities to engage in double
cropping. This allows more intensive and productive use of land, particularly in areas where land
is scarce (Sheleme Beyene et al., 2015). Amhara and Oromia regions are the larger producer of
chickpea in Ethiopia (Sheleme Beyene et al., 2015) (Figure 3). In Ethiopia, chickpea production
contributes significantly to household consumption and cash income generation (Tewodros
Tefera, 2014). Apart from this, because of its ability to fix atmospheric nitrogen, it can reduce
the risk of pests and diseases associated with mono-cropping hence used in crop rotation with
cereal crops like wheat, teff and barley (MoANR, 2016).

11
Figure 2. Major chickpea growing region in Ethiopia (Sheleme Beyene et al., 2015)
2.4.2. Yield and yield components of chickpea
Yield is a complex trait controlled by several simply inherited traits. The correlation coefficients
highlight the pattern of association among such yield components and determine how a complex
trait such as yield can be improved, so it is essential in determining selection criteria
(Shanmugam and Kalaimagal, 2019). Hundred seed weight (HSW), pods per plant, plant height
(PH) and harvest index (HI) are important indicators in grain yield (GY). Mostly, pods and the
number of seeds in pods influence GY in legume crops. According to Tena Alemu (2016),
biomass production (BP) is positively and significantly (p<0.001) correlated to days to 50%
(DF), days to maturity (DTM), HSW, PH, GY, HI and haulm yield (HY).
Rahimi et al. (2013) also reported GY exhibited a significant positive correlation with the
number of pods. Fasil Hailu (2019) indicated that HI and BP had a significant and positive
association with grain yield. Tibebu Belete et al. (2017) also reported that grain yield showed a
highly significant association with biomass yield and similarly biomass yield showed a
significant positive association with the number of primary branches per plant, biomass
production rate, seed growth rate and grain yield. These indicate that correlated traits had an
association with grain yield and they have an important role in determining these complex traits.

12
Therefore, consideration should be given while practicing selection aimed at the improvement of
grain yield.
The yield and yield components of chickpea are affected by genotype (Bazvand et al., 2015)
inter and intra-row spacing (Melak Agajie, 2018), sowing date (Regassa Ayana et al., 2014;
Bazvand et al., 2015; Husnain et al., 2015; Ray et al., 2017; Amrinder et al., 2019) and genotype
by location interaction (Fasil Hailu, 2019). Jane et al. (2017) and Tena Alemu (2016) also
indicated that genotype had a significant effect on grain and haulm yield of chickpea.
2.5. Chickpea Haulm as Livestock Feed Resource and its Nutritive Value
Chickpea is one of the leguminous plants which is a less labor-intensive crop compared to
cereals crop. It is an important crop in mixed crop-livestock systems in Ethiopia. It is cultivated
as a food-feed crop, where the grain provides food for humans and the haulm for the livestock
(Besufekad Belayneh et al., 2018).
2.5.1. Chemical composition
Chickpea haulm is the by-product produced after chickpea grain threshing which can be used as
a ruminant feed. Previous research showed that it has relatively higher CP and ME (Bampidis
and Christodoulou, 2011; Kafilzadeh and Maleki, 2011; Golshani et al., 2012; Eyob Haile,
2017). Lardy and Anderson (2009) also indicated that chickpea haulm had higher nutritive value
than cereal straws (about 44-46% total digestible nutrient (TDN) and 4.5-6.5% CP).
Furthermore, Ashraf (2017) reported that the CP and ME contents of the chickpea haulm ranged
from 7.12-11.1% and 7.1- 7.72 MJ/kg DM which indicates, it have better feeding value. Fikadu
Dereje et al. (2010) also showed chickpea haulm has a chemical composition of DM (91.5-92),
Ash (8.67-9), CP (6.19-6.36), NDF (55.1-57.5), ADF (40.5-41.4) and ADL (8.04-8.52). On the
other hand, Abdel-Magid et al. (2008) indicated that chickpea haulm had lower nutritive value
compared to pea haulm and berseem hay when fed to growing male sheep.
Moreover, chickpea haulm is also a good source of minerals, such as calcium, phosphorus,
magnesium, iron and potassium (Carla et al., 2013). According to Jane et al. (2017a), chickpeas
haulms are a good source of calcium. The nutritional value of chickpea haulm is variable

13
depending on the crop variety, the content of anti-nutritional factors (e.g. tannins), stage of
harvest, length of storage, leaf to stem ratio, storage conditions, location, soil fertility and
fertilizer application (Kafilzadeh and Maleki, 2011).
Table 3. Chemical composition and nutritional value of chickpea haulms
Parameters
(%)
Kafilzadeh and
Maleki (2012)
Golshani et al.
(2012)
Numan et
al. (2017)
Ashraf
(2017)
Jane et al.
(2017a)
DM - 92.18 89.4-90.3 - -
OM 92.08-92.93 92.00 81.2-81.8 - -
CP 2.81-3.58 6.05 6.40-7.42 7.12-11.1 4.82- 5.99
NDF 59.86-64.54 - 63.7-67.0 64.4- 73.2 71.6- 75.0
ADF 45.92- 47.34 - 51.3-56.0 42.9- 48.9 -
ADL - - - 11.3- 13.0 -
IVOMD - - - 48.4- 52.6 47.7- 49.9
ME(MJ/kg) 5.59- 6.21 - 5.96- 7.37 7.1- 7.72 -
DM= dry matter, OM= organic matter, CP= crude protein, NDF=neutral detergent fiber, ADF=
acid detergent fiber, ADL= acid detergent lignin, IVOMD=in vitro organic matter digestibility,
ME= metabolizable energy
2.5.1. Dry matter degradation kinetics
Dry matter degradability (DMD) of chickpea haulm is lower than that of other legume straw due
to its higher cell wall content (Golshani et al., 2012). Kafilzadeh and Christodoulou (2011)
reported that DM digestibility and rumen degradability of chickpea haulm was about 10 and 42%
which was higher than cereal straw, respectively. Golshani et al.(2012) reported that organic
matter (OM) and CP degradation of chickpea haulm at initial incubation times (0- 12 hours)
increased considerably, while degradation rate increments after 12 hours of incubation were
slow and the 72 hours incubation degradation percentage for OM and CP of chickpea haulm
were 60.0% and 73.3%, respectively. Naser et al. (2011) also showed that the dry matter
degradation of chickpea haulm at initial (washing loss. 0 h) and final (72 hours) incubation times
were 18.14 and 60.09%, respectively. Eyob (2017) indicated that the OM and CP degradation
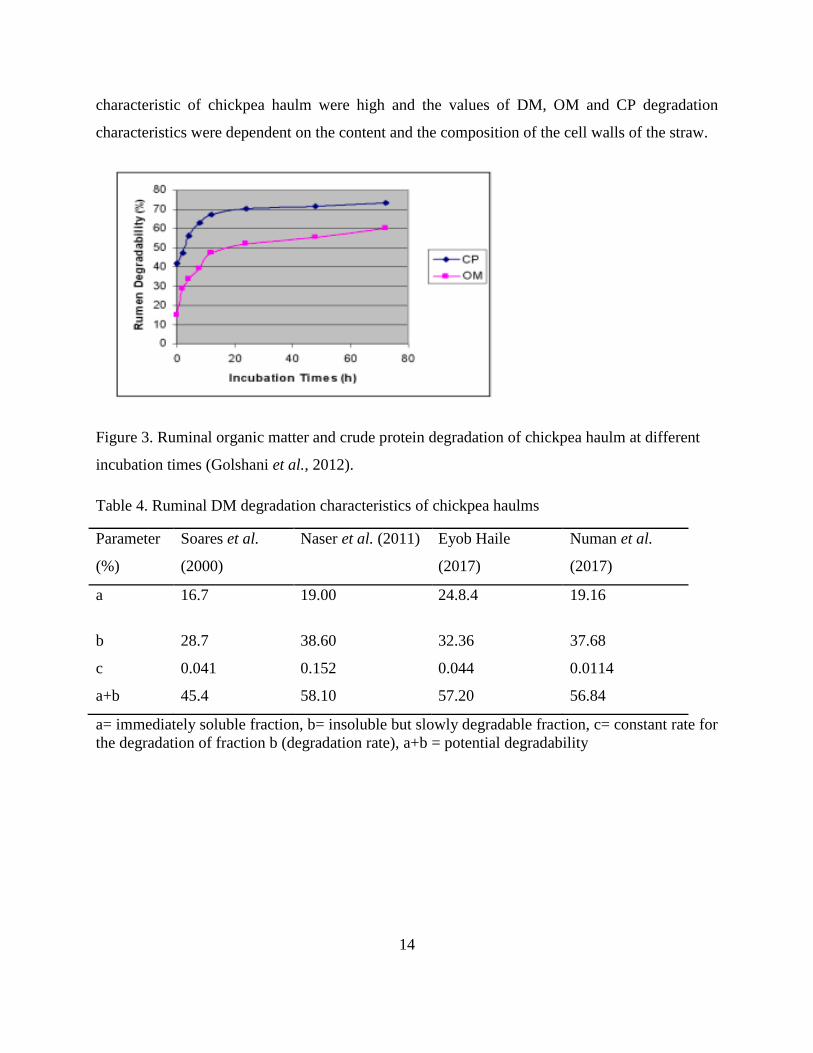
14
characteristic of chickpea haulm were high and the values of DM, OM and CP degradation
characteristics were dependent on the content and the composition of the cell walls of the straw.
Figure 3. Ruminal organic matter and crude protein degradation of chickpea haulm at different
incubation times (Golshani et al., 2012).
Table 4. Ruminal DM degradation characteristics of chickpea haulms
Parameter
(%)
Soares et al.
(2000)
Naser et al. (2011) Eyob Haile
(2017)
Numan et al.
(2017)
a 16.7 19.00 24.8.4 19.16
b 28.7 38.60 32.36 37.68
c 0.041 0.152 0.044 0.0114
a+b 45.4 58.10 57.20 56.84
a= immediately soluble fraction, b= insoluble but slowly degradable fraction, c= constant rate for
the degradation of fraction b (degradation rate), a+b = potential degradability
15
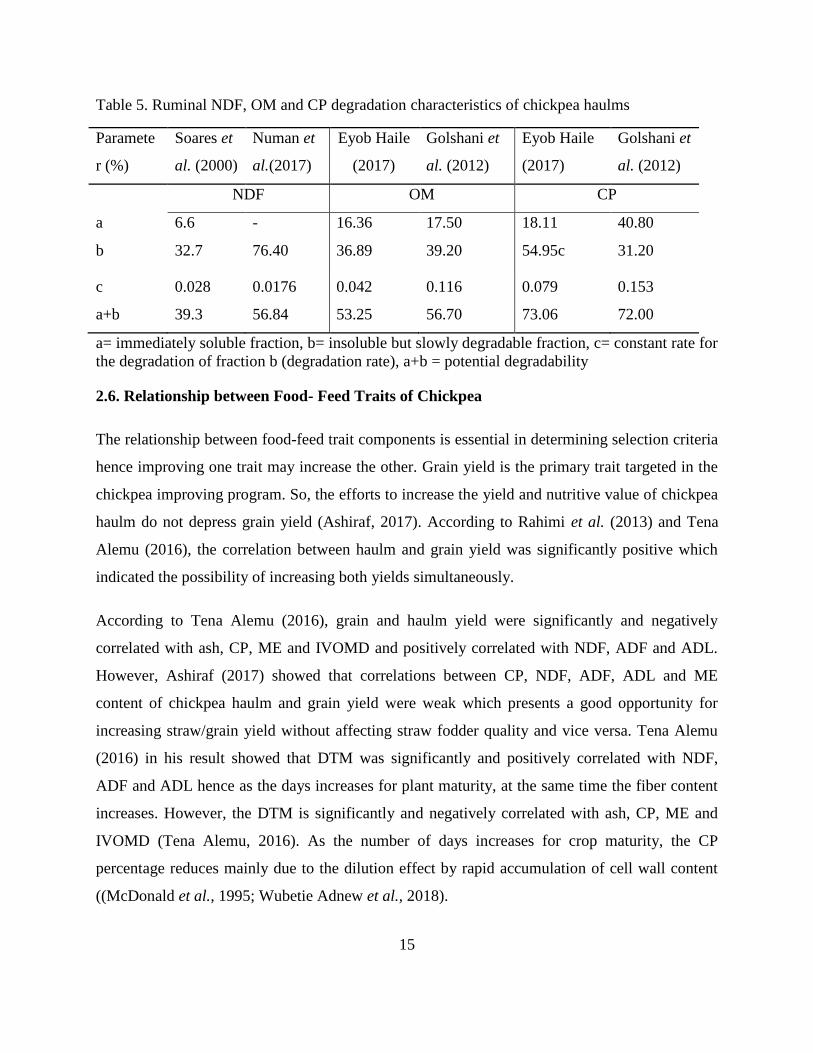
Table 5. Ruminal NDF, OM and CP degradation characteristics of chickpea haulms
Paramete
r (%)
Soares et
al. (2000)
Numan et
al.(2017)
Eyob Haile
(2017)
Golshani et
al. (2012)
Eyob Haile
(2017)
Golshani et
al. (2012)
NDF OM CP
a 6.6 - 16.36 17.50 18.11 40.80
b 32.7 76.40 36.89 39.20 54.95c 31.20
c 0.028 0.0176 0.042 0.116 0.079 0.153
a+b 39.3 56.84 53.25 56.70 73.06 72.00
a= immediately soluble fraction, b= insoluble but slowly degradable fraction, c= constant rate for
the degradation of fraction b (degradation rate), a+b = potential degradability
2.6. Relationship between Food- Feed Traits of Chickpea
The relationship between food-feed trait components is essential in determining selection criteria
hence improving one trait may increase the other. Grain yield is the primary trait targeted in the
chickpea improving program. So, the efforts to increase the yield and nutritive value of chickpea
haulm do not depress grain yield (Ashiraf, 2017). According to Rahimi et al. (2013) and Tena
Alemu (2016), the correlation between haulm and grain yield was significantly positive which
indicated the possibility of increasing both yields simultaneously.
According to Tena Alemu (2016), grain and haulm yield were significantly and negatively
correlated with ash, CP, ME and IVOMD and positively correlated with NDF, ADF and ADL.
However, Ashiraf (2017) showed that correlations between CP, NDF, ADF, ADL and ME
content of chickpea haulm and grain yield were weak which presents a good opportunity for
increasing straw/grain yield without affecting straw fodder quality and vice versa. Tena Alemu
(2016) in his result showed that DTM was significantly and positively correlated with NDF,
ADF and ADL hence as the days increases for plant maturity, at the same time the fiber content
increases. However, the DTM is significantly and negatively correlated with ash, CP, ME and
IVOMD (Tena Alemu, 2016). As the number of days increases for crop maturity, the CP
percentage reduces mainly due to the dilution effect by rapid accumulation of cell wall content
((McDonald et al., 1995; Wubetie Adnew et al., 2018).
16
2.7. Participatory Variety Selection
Participatory variety selection (PVS) has evolved as one of the innovative approaches to
complement the conventional variety development and dissemination process (Keshab, 2012;
Daniel Tadesse et al., 2014; Tokuma Legesse et al., 2019). It is a selection among varieties that
do not segregate in the next generation by farmers under the target environment. It is a simple
way for breeders and agronomists to learn which varieties perform well on-farm and preferred by
farmers (Ceccarelli, 2012). Hence, farmers can select well-adapted and preferred varieties under
their circumstances using their criteria (Berhanu Fentie and Mesfin Fenta, 2021). Participating
farmers in the process of crop improvement and variety evaluation fasten variety identification
and adoption, increase variety diversity, yield and farmers‟ income, facilitate farmers learning
and empowering and strengthen collaboration between breeders and farmers (Almekinders and
Elings, 2001).
Teame Gerezeir et al. (2018) showed that PVS has been projected as an alternative to the
problem of fitting the crop to the target environments and users‟ preferences. The inclusion of
farmers in the variety selection and perception enabled them to select the best variety/cultivar
and/or hybrid of the new crop according to their experiences, which performed well in their local
environments. It has three phases to identify preferred cultivars. Identifying farmers‟ needs;
searching for suitable material to test with farmers; and experimentation on farmers‟ fields
(Witcombe et al., 2003). Participatory variety selection has many advantages and some of them
include strengthening farmers‟ autonomy and increasing their freedom to select varieties,
increasing adoption of new improved varieties by the farmer, to know more precisely farmers‟
varietal selection preferences and criteria to include them in breeding objectives and to increase
the dissemination of new varieties in farmer field condition (Sié et al., 2010).

17
3. MATERIALS AND METHODS
3.1. Cultivation of Different Varieties of Chickpea
3.1.1. Description of the study area
The experiment was conducted on four farmers‟ fields at Adadi Gole kebele, Gimbichu District
East Shewa Zone of central Oromia region from the beginning of October 2019 to the end of
March 2020. The locations were purposively selected for their potential for chickpea production
in the central highlands of Ethiopia. Adadi Gole kebele is one of the urban kebele of Gimbichu
district. It is geographically located at 08 ° 59‟ 950‟‟ N, 39° 07‟ 652‟‟ E at an elevation of 2430
m.a.s.l. The area is characterized by one cropping season. Heavy clay soil textural class and
Eutric Vertisol soil types dominate the area. The area receives a mean annual rainfall of 843mm.
Rainfall distribution is bimodal, usually the long rains (Meher) and the period of the short rains
(Belg). The annual minimum and maximum temperature are 7 oc and 26
oc respectively. The
dominant crops grown on the area include wheat and teff (from cereal crops) and chickpea, grass
pea and lentil (from legume grains).
3.1.2. Experimental design
Eight chickpea varieties were used as the planting material (Table 6). A randomized complete
block design (RCBD) was used to layout the experiment. Four farmers from a specific location
were selected based on the representativeness of the farm and the willingness of farmers to
allocate land for the trial. The farmers were allowed to grow all the eight chickpea varieties. The
individual plot size was 25m2 (5m x 5m) for each genotype. Row planting was implemented with
0.3 and 0.1m spacing between rows and plants, respectively as per research recommendation and
the space between the plots were 1m. The row length was 5 m and the numbers of rows per plot
were 17. The seeding and fertilizer rates were 120 and 100 kg ha-1
as per research
recommendation. Crop husbandry practices were done by farmers under the close supervision of
the researchers and development workers until the crops reached maturity for grain harvesting.
18
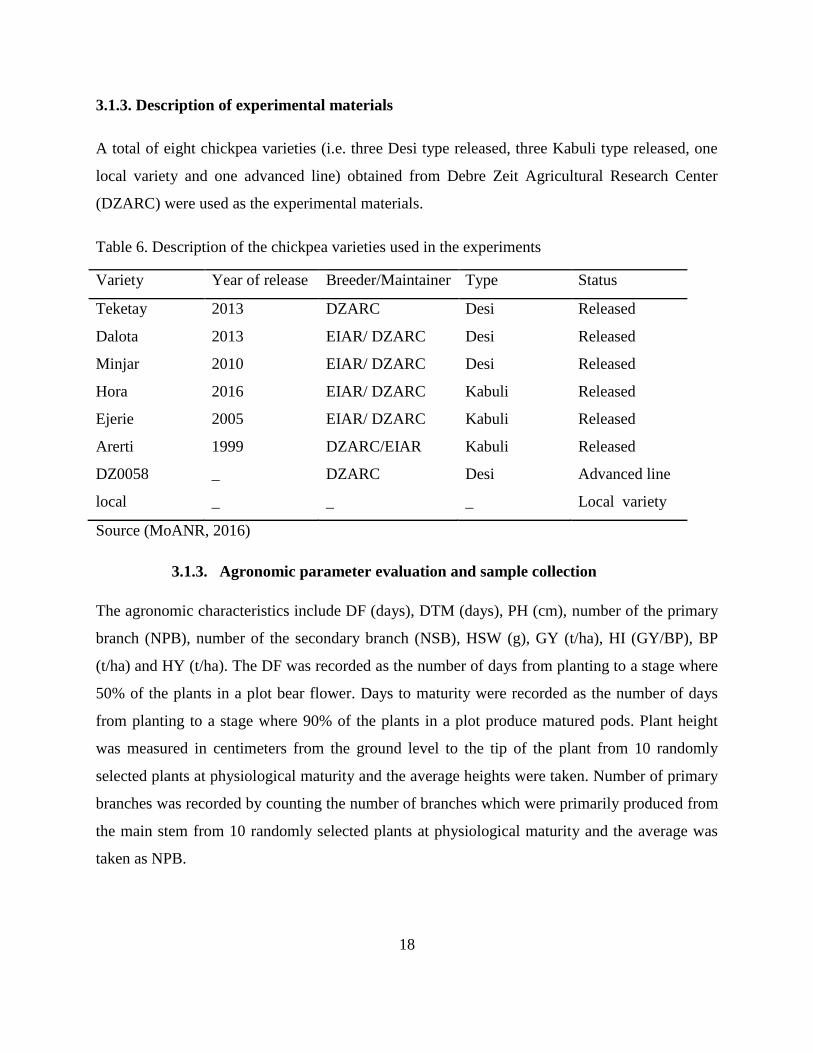
3.1.3. Description of experimental materials
A total of eight chickpea varieties (i.e. three Desi type released, three Kabuli type released, one
local variety and one advanced line) obtained from Debre Zeit Agricultural Research Center
(DZARC) were used as the experimental materials.
Table 6. Description of the chickpea varieties used in the experiments
Variety Year of release Breeder/Maintainer Type Status
Teketay 2013 DZARC Desi Released
Dalota 2013 EIAR/ DZARC Desi Released
Minjar 2010 EIAR/ DZARC Desi Released
Hora 2016 EIAR/ DZARC Kabuli Released
Ejerie 2005 EIAR/ DZARC Kabuli Released
Arerti 1999 DZARC/EIAR Kabuli Released
DZ0058 _ DZARC Desi Advanced line
local _ _ _ Local variety
Source (MoANR, 2016)
3.1.3. Agronomic parameter evaluation and sample collection
The agronomic characteristics include DF (days), DTM (days), PH (cm), number of the primary
branch (NPB), number of the secondary branch (NSB), HSW (g), GY (t/ha), HI (GY/BP), BP
(t/ha) and HY (t/ha). The DF was recorded as the number of days from planting to a stage where
50% of the plants in a plot bear flower. Days to maturity were recorded as the number of days
from planting to a stage where 90% of the plants in a plot produce matured pods. Plant height
was measured in centimeters from the ground level to the tip of the plant from 10 randomly
selected plants at physiological maturity and the average heights were taken. Number of primary
branches was recorded by counting the number of branches which were primarily produced from
the main stem from 10 randomly selected plants at physiological maturity and the average was
taken as NPB.

19
Number of secondary branches (NSB) was recorded by counting the number of secondarily
produced branches from the primary branch from 10 randomly selected plants in a plot and the
averages were taken as NSB. Hundred seed weight was determined by weighing hundred
randomly taken seeds from each plot after threshing by using a sensitive balance after adjusting
the moisture content to 10- 12%.
Grain yield was determined from the middle rows of the plant after threshing and yield per plot
was converted to per hectare basis. Harvesting index was determined as the ratio of GY to BP.
The BP was recorded by weighing the total above-ground biomass harvested from each
experimental plot at the time of harvesting and then yield per plot converted to yield per hectare
basis. Haulm yield was determined by calculating the difference between BP and GY and finally
yield per plot converted to per hectare basis. Finally, representative samples of whole plant
haulm composed of stems, leaves and pod husks (500-800 g) were collected into sample bags for
each plot separately and labeled with necessary information.
3.2. Laboratory Evaluation
3.2.1. Chemical composition
The representative haulm samples were transported to ILRI Animal Nutrition Laboratory, Addis
Ababa for laboratory analysis. The samples were given laboratory numbers and ground to 1mm
mesh size using Wiley mill and packed into paper bags. Near-Infrared Reflectance Spectroscopy
(NIRS) prediction was employed for the analysis of the nutritional value of haulm samples. The
NIRS instrument, Foss Forage Analyzer 5000 with the software package WinISI II in the 1100-
2498nm spectral ranges were used to scan chickpea haulm samples for the prediction of DM,
Ash, N, ME, IVOMD and fiber fractions (NDF, ADF and ADL), by using predictive equations
developed based on previously conducted conventional analyses. For scanning purposes, the
already ground sample was dried overnight at 60oC in an oven to standardize the moisture
conditions and then the partially dried sample was filled into NIRS cup and scanned. The Crude
CP was calculated as N × 6.25.

20
Hemicellulose and cellulose content was determined using the following equations.
( ) , ( )
The value of NDF and ADF also were used to calculate dry matter intake (DMI), dry mater
digestibility (DMD) and relative feed value (RFV) according to the formula developed by
Rohweder et al. (1978);
( , then
RFV=
3.2.2. In situ ruminal incubation
Rumen degradability of samples straw of chickpea varieties was determined by incubating
samples in nylon bags in three rumen fistulated Boran- Holstein Frisian steers just before the
morning meal. Chickpea haulm samples were grounded to pass 2mm screen and 3g of each
sample on air-dry basis were transferred into each nylon bag and then incubated for 0, 6, 12, 24,
48, 72 and 96 hours. After each incubation period, the bags were removed from the rumen of the
animals and immediately put in water to stop the microbial activity and then hand-washed under
running tap water until the water becomes clear. Afterward, the bags with residues were oven-
dried at 65 o C for 72 hours and again weighed to determine the dry matter content of residues.
Washing loss (“0-hour” degradability of soluble nutrients) was determined by washing haulm
samples in the water tank for 30 minutes and then the bags were dried in the same way to
determine DM contents of the haulm samples.
The ruminal in situ degradability of DM (DMD) was determined for each incubation time using
the following formula (Ørskov and McDonald, 1979).
( )
Digestion kinetics of DM was found by fitted the DMD data into the exponential equation
(
Where, P = degradation of DM (%),

21
a= Washing loss or soluble fraction (%),
b= the rumen-insoluble, but slowly degradable fraction (%)
a + b = potential degradability (%)
c = fractional degradation rate (hr-1
) and t = time (hr)
e = (2.7182) base for natural logarithm
Potential degradation (PD) was estimated as ( ) and effective degradability (ED) of DM
was estimated using the formula. ED = ( ( )) where a, b and c are described
above and k is rumen outflow rate, which is assumed to be 0.03/hr for roughage feeds (Ørskov
and McDonald, 1979).
3.3. Haulms Dry Matter Yield and Potential Utility Index
The haulm dry matter yield (kg/ha) (HDMY) was calculated according to the formula developed
by Tarawali et al. (1995);
( ) ( ) ( )
Potential utility index (PUI) integrates grain yield within in-vitro organic matter digestible haulm
of the different chickpea varieties and was calculated according to the formula developed by
(Fleischer et al., 1989).
( ) ( ) ( )
( )
3.4. Evaluation of Farmer Preferences and Knowledge
3.4.1. Selection of survey kebeles and household data collection
A survey was conducted in three kebeles of Gimbichu district, East Shewa Zone of central
Oromia region. A multi-stage sampling procedure was followed to select the sites for the study.
The first stage was a purposive selection of three kebeles from the district based on the potential
for chickpea production. The second stage was a random selection of two villages from each
kebeles and the last stage was a random sampling of 25 mixed crop-livestock farmers from each
of the selected villages. Eventually, a total of 150 household farmers were considered for the

22
collection of household data. During the survey, information was mainly gathered on
demographic and socioeconomic characteristics on crop production, livestock and land holding,
chickpea production, feed resources and feeding strategies.
3.4.2. Farmer field day
A field day was organized in the experimental site to identify farmer's preferred varieties for
food feed traits. The varieties were separately evaluated at the flowering stage by developmental
agents (DAs) and a group of 36 farmers at each experimental site. The farmers were selected
based on their experience in chickpea production. A pair-wise ranking of the farmer‟s selection
criteria was made to rank the selection criteria to determine the most important preferred trait.
Before the evaluation, farmers were made to familiarize with the selection criteria and process.
Then, farmers gave a 1-5 scale rank (Very good (5), good (4), average (3), poor (2) and very
poor (1)) based on some selected criteria.
3.5. Statistical Analysis
Data obtained from the predicted value of NIRS, agronomic and DM disappearances were
analyzed by analysis of variance (ANOVA) using SAS, 2004, version 9.0.Correlation analysis
was also done between different agronomic parameters and chemical compositions. The
statistical significance of the differences between means was tested using Duncan‟s multiple
range tests (DMRT).The following mathematical linear model for randomized complete block
design was used to analyze the data
Yij= μ +Ri+Gi+Eij
Where: Yij= the observed value of the trait Y for the ith
genotype in jth
replication/ block
μ = the general mean of trait Y;
Rj, the effect of jth
replication/ block
Gi= the effect of ith
genotypes and
Eij = the experimental error associated with the trait y for the ith
genotype in jth
replication

23
The DM disappearances and the degradation characteristics such as a, b, c, PD and ED were
estimated using nonlinear regression procedures of SAS. The means and percentages of the
survey data were analyzed using SPSS version 16.

24
4. RESULTS AND DISCUSSION
4.1. Food -Feed Traits of Selected Chickpea Varieties
4.1.1. Grain and haulm yield
Grain yield, haulm yield, haulm dry matter yield, harvest index and potential utility index are
indicated in (Table 7). In the current study, grain yield differed significantly (p < 0.001) among
the evaluated varieties.This is comparable with the previous study by Getachew Tilahun et al.
(2015), Jane et al. (2017a), Fasil Hailu et al. (2020) and Amare Tsehaye et al. (2020) who
reported significant variation for GY in different chickpea varieties. The variation among
varieties could be due to genetic effects. Significantly higher GY was obtained from Teketay
(1.47t/ha) followed by local (1.26t/ha) and Dalota (1.24t/ha), respectively while the least value of
GY (0.45t/ha) recorded from DZ-0058. The yield advantage of Teketay over that of local variety
was 16.7%. The least grain yield recorded for DZ-0058 might be due to low field emergence and
sparse plant density.The overall GY (1.03 t/ha) in the present study is lower than the value of
2.063, 1.197 and 1.67t/ha reported by Getachew Tilahun et al. (2015) and Yasin Goa, Mathewos
Ashamo (2016) and Tena Alemu(2016) respectively.
Haulm yield was significantly (p<0.05) differed among the tested varieties. This is comparable
with the previous works by Tamiru Meleta and Girma Abera (2019), Tesfahun Mekuanint et al.
(2018) and Jane et al. (2017a) who reported the presence of significant variation of HY among
different chickpea varieties. In this regard, significantly higher but statistically similar HY values
2.57, 2.49, 2.28 and 2.11 t/ha were recorded for Minijar, Teketay, Local, and Ejerie varieties,
respectively, whereas the least value (1.75t/ha) was recorded for Dz0058. The presence of
variability among genotypes could be essential for the improvement in crop straw yield which in
turn brings an increase in livestock production and productivity (Jane et al., 2017b). The overall
mean HY (2.15) in the present study is lower than the value of 2.94 t/ha reported by Tena Alemu
(2016).
Relatively low yields (grain and haulm) observed in the present study might be attributed to the
late time of sowing, wet seedbed and disease prevalence. At the time of sowing, there was heavy

25
rain thus the experimental site was affected. Previous studies indicated that grain and haulm
yield of chickpea reduced gradually due to the effects of delayed sowing (Regassa Ayana, 2014;
Sikdar et al., 2015; Ray et al., 2017; Bezabih Woldekiros and Lake Mekonnen, 2018; Amrinder
et al., 2019). Generally, late planting was observed to expose the plants for drought stress
conditions which resulted in lower vegetative growth that in turn resulted in low yield.
Table 7. Average grain yield, haulm yield, haulm dry matter yield, harvest index and potential
utility index of eight chickpea varieties
Varieties GY (t /ha) HY (t /ha) HDMY (t/ha) PUI (%) HI (%)
Ararti 1.01c
2.04bcd
1.86
51.72 34.15abc
Dalota 1.24b
2.10bcd
1.90
51.52 37.23a
Dz0058 0.45e
1.75d 1.58
45.17 21.07
d
Ejerie 0.80d
2.11abcd
1.91 44.55 28.63bc
Hora 0.98cd
1.86cd
1.69 52.35 34.65ab
Local 1.26b
2.28abc
2.06 47.50 35.75a
Minijar 1.00c
2.57a 2.33 42.00 28.25
c
Teketay 1.47a 2.49
ab 2.25 49.68 37.43
a
Mean 1.03 2.15 1.93 48.06 32.01
SEM (±) 0.058 0.07 0.07 0.01 0.01
CV (%) 12.19 13.49 17.30 13.79 12.17
Sig *** ** ns ns ***
a-e means within columns followed by the same letter (s) are not significantly different (P <0.05),
ns = not significant, ** = significant at P ≤ 0.01, *** = significant at P ≤ 0.001, GY=grain yield,
HY=haulm yield, HDMY= haulm dry matter yield, HI=harvest index, PUI= potential utility
index, SEM=standard error of the mean, CV=coefficient of variation, Sig.= significant level
4.1.2. Haulm dry matter yield, harvest index and potential utility index
There was no significant (p>0.05) difference between the varieties for HDMY and PUI in the
present study (Table 7). Contrary to this, Tena Alemu (2016) reported significant variation for
HDMY and PUI of chickpea haulms.

26
The highest HDMY and PUI were recorded from Teketay (2.25 t/ha) and Ararti (52.35%) while
the least value was recorded from Dz0058 (1.58 t/ha) and Minijar (42.00%), respectively.
Potential utility index integrates grain and digestible dry matter. So, it is a good parameter in
measuring food-feed crops (Fleischer et al., 1989). However, in the present study varieties with
higher IVOMD were not found to be higher in PUI due to the lower grain yield of such varieties.
Harvest index differed significantly (p<0.001) among the tested varieties (Table 6). The yield of
a crop is the function of biomass production and harvest index therefore, HI is an important
selection criterion in plant breeding. Significantly higher HI was recorded from Teketay (37.43),
Dalota (37.23), local (35.75) and Ararti (34.15), whereas, the least (21.07) was obtained from
Dz0058. The lower HI in the present study might be might be due to the late time of sowing,
disease prevalence and presence of wet seedbed. Generally, previous studies indicated lower HI
of chickpea crop at late sowing compared to the optimum time of sowing (Regassa Ayana,
2014; Husnain et al., 2015).
4.1.3. Chemical composition of chickpea varieties haulms
4.1.3.1. Dry matter and ash contents
Significant difference (p>0.05) was not observed among the tested varieties in the content of DM
of chickpea haulms (Table 8). The DM content of chickpea varieties haulms were ranged from
90.26 in Ejerie to 90.60 % in Minijar. The overall mean value of DM (90.46%) in this study is
lower than the previous findings reported by Golshani et al. (2012) (92.18) and Eyob Haile
(2017) (91.64%) in chickpea haulms while higher than the result of 90.0% reported by Numan et
al. (2017) in chickpea haulm. This variation possibly might arise from variation in variety and
samples drying methods.
A significant (p<0.05) varietal difference was observed in the ash content of chickpea varieties
haulms (Table 8).Higher ash content was obtained from Dz0058 (9.08%) and lower from Minijar
(7.43%). The average mean of ash (8.18%) obtained in the present study is lower than the
previous values of 8.50% in chickpea lines haulms and 8.65% in Desi type chickpea varieties
haulms, respectively by Numan et al.(2017) and Tena Alemu(2016). This variation might be due
to the variation in variety and location. The ash content is the concentration of minerals in the

27
forages which play an important role in the body function of the overall animal production and
productivity activity (Rasby et al., 2011). The higher ash content indicates a high concentration
of minerals (Fantahun Dereje, 2016).
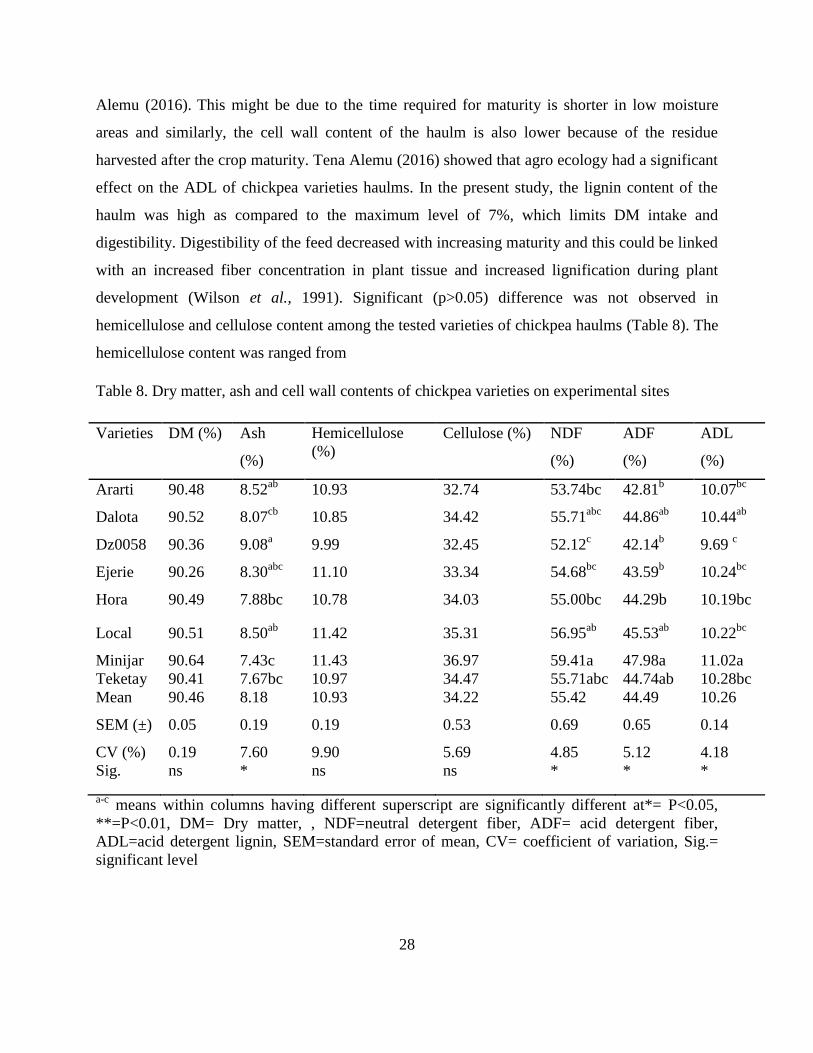
4.1.3.3. Cell wall contents
A significant (p<0.05) varietal difference was observed in the NDF content of chickpea varieties
haulms (Table 8). Higher NDF was obtained from Minijar (59.41%) and lower from Dz0058
(52.12%).The overall mean NDF content (55.42%) in this study is lower than the result of 58.32-
65.55% in different chickpea varieties haulms (Kafilzadeh and Maleki, 2012; Tena Alemu, 2016;
Numan et al., 2017).On the other hand, it is higher than 52.11% in chickpea haulm varieties
grown in low moisture areas reported by Tena Alemu (2016). The NDF contents of all tested
varieties were relatively lower than the upper limit of 60% of which voluntary feed intake and
feed conversion efficiency are decreased due to longer rumination time. The relatively low
content of fiber among varieties may facilitate the colonization of the feed by the microbial
rumen population, which in turn might increase fermentation rate and thus improving
digestibility and feed intake (Van Soest, 1994).
A significant (p<0.05) varietal difference was observed in the ADF content of chickpea varieties
haulms (Table 8). The overall mean of ADF content (44.49%) is higher than the value of 38.93%
in chickpea varieties haulms in low moisture area and 42.67% in Desi type chickpea varieties in
potential environment reported by Tena Alemu (2016). On the other hand, it is lower than
46.70% and 53.0% in chickpea haulm and different chickpea varieties and lines haulm reported
by Kafilzadeh and Maleki (2012) and Numan et al. (2017), respectively. This variation might be
coming from variation in location, genotype, soil fertility and maturity. The ADF is the
percentage of indigestible and slowly digestible material in a feed (McDonald et al., 2002).
A significant (p<0.05) varietal difference was observed in ADL content among the tested
varieties haulms (Table 8). The overall mean ADL (10.26%) content of chickpea varieties
haulms is relatively comparable with the result of 9.89 and 9.82% in Desi and Kabuli type
chickpea varieties haulms, respectively in the potential environment. On the other hand, it is
higher than 8.81% in Kabuli type chickpea varieties in low moisture stress area reported by Tena
28
Alemu (2016). This might be due to the time required for maturity is shorter in low moisture
areas and similarly, the cell wall content of the haulm is also lower because of the residue
harvested after the crop maturity. Tena Alemu (2016) showed that agro ecology had a significant
effect on the ADL of chickpea varieties haulms. In the present study, the lignin content of the
haulm was high as compared to the maximum level of 7%, which limits DM intake and
digestibility. Digestibility of the feed decreased with increasing maturity and this could be linked
with an increased fiber concentration in plant tissue and increased lignification during plant
development (Wilson et al., 1991). Significant (p>0.05) difference was not observed in
hemicellulose and cellulose content among the tested varieties of chickpea haulms (Table 8). The
hemicellulose content was ranged from
Table 8. Dry matter, ash and cell wall contents of chickpea varieties on experimental sites
Varieties DM (%) Ash
(%)
Hemicellulose
(%)
Cellulose (%) NDF
(%)
ADF
(%)
ADL
(%)
Ararti 90.48 8.52ab
10.93 32.74 53.74bc 42.81b 10.07
bc
Dalota 90.52 8.07cb
10.85 34.42 55.71abc
44.86ab
10.44ab
Dz0058 90.36 9.08a 9.99 32.45 52.12
c 42.14
b 9.69
c
Ejerie 90.26 8.30abc
11.10 33.34 54.68bc
43.59b 10.24
bc
Hora 90.49 7.88bc 10.78 34.03 55.00bc 44.29b 10.19bc
Local 90.51 8.50ab
11.42 35.31 56.95ab
45.53ab
10.22bc
Minijar 90.64 7.43c 11.43 36.97 59.41a 47.98a 11.02a
Teketay 90.41 7.67bc 10.97 34.47 55.71abc 44.74ab 10.28bc
Mean 90.46 8.18 10.93 34.22 55.42 44.49 10.26
SEM (±) 0.05 0.19 0.19 0.53 0.69 0.65 0.14
CV (%) 0.19 7.60 9.90 5.69 4.85 5.12 4.18
Sig. ns * ns ns * * *
a-c means within columns having different superscript are significantly different at*= P<0.05,
**=P<0.01, DM= Dry matter, , NDF=neutral detergent fiber, ADF= acid detergent fiber,
ADL=acid detergent lignin, SEM=standard error of mean, CV= coefficient of variation, Sig.=
significant level
29
4.1.3.4. Crude protein
Significant (p>0.05) difference was not observed in the CP contents of chickpea varieties haulms
in the present result (Table 9). The overall mean CP content (4.07%) in this study is relatively
consistent with the value of 4.15% in Desi-type chickpea varieties reported by Tena Alemu
(2016) while it is higher than the value of 3.23% reported by Kafilzadeh and Maleki (2012) in
chickpea haulm. On the other hand, it is lower than the result of 6.05 to 6.45% reported for
different varieties of chickpea haulms (Golshani et al., 2012; Tena Alemu, 2016; Numan et al.,
2017). This variation might be coming from variation in location, maturity, variety and
management conditions among the different studies.
The CP content is one of the most important criteria to determine the nutritional quality of
livestock feeds since as the level of CP increases, the dry matter intake by livestock and rumen
microbial growth would also increase (Chanthakhoun et al., 2012). However, the mean CP
content of chickpea varieties haulms in this study is lower than the critical value of 7% for
normal rumen microbial action and feed intake (Van Soest, 1982). Therefore, the sole feeding of
residue from these varieties will not supply adequate ammonia levels required for rumen
microbial activity (Sultan et al., 2007). The lower CP content in this study might be related to the
longer time required for the maturity of the plant that induces dilution of CP and increasing
lignification. Reddy et al. (2003) indicated that water-stressed plants had higher nitrogen content
and digestibility.
4.1.3.5. Metabolizable energy
A significant (p<0.01) difference was observed in ME content among the tested varieties haulms
(Table 9). Higher ME content was obtained from Dz0058 (7.44) and lower from Minijar (6.71
MJ/kg). The overall mean ME content (7.16 MJ/kg) is relatively consistent with the value of 6.84
MJ/kg for different chickpea lines haulms reported by Numan et al. (2017). On the other hand, it
is slightly lower than 7.54 - 7.94 MJ/kg for different chickpea varieties haulms reported by Tena
Alemu (2016). On the other hand, it is higher than 6.02 to 6.84 MJ/kg for different varieties and
line haulms (Kafilzadeh and Malek, 2011; Numan et al., 2017). The range of ME in the present
study is lower than 7.10 -7.72MJ/kg reported by Ashraf (2017). This variation might be due to
genetic, environmental and management factors. The values of ME in each genotype of chickpea

30
varieties haulms in the present study were above the lower limit of tropical forage legumes 6.50
MJ/kg DM (Evitayani et al., 2004).
4.1.3.6. In vitro organic matter digestibility
A significant (p<0.01) difference was observed in IVOMD among the tested varieties with the
range of 45.99 (Minijar) to 50.63% (Dz0058) (Table 9). This is relatively consistent with the
range of 47.7- 49.9% reported by Jane et al. (2017a) while lower than the range of 51.45 to 54.3
(Tena Alemu, 2016) for different chickpea varieties haulms. This variation might be related to
genetic and environmental variation. All the tested varieties haulms had less than 50% IVOMD
except Dz0058.
4.1.3.7. Relative feed value
No significant (p>0.05) difference was observed in the RFV among the tested varieties (Table 9).
The RFV of chickpea varieties ranged from 87.41 in Minijar to 101.22 in Dz0058. Higher RFV
was recorded from Dz0058 might be due to its lower contents of ADF and NDF. A relative feed
value index is proposed to reflect how well an animal will eat and digest a particular forage
species when it is feed as the only source of energy (Kazemi et al., 2012). Its value is a relative
indicator of the digestible dry matter intake potential of forage as it is estimated from the product
of potential intake based on NDF content and dry matter digestibility based on ADF.

31
Table 9. Crude protein, metabolizable energy, in vitro organic matter digestibility and relative
feed value of chickpea varieties on experimental sites
Varieties CP (%) ME (MJ/Kg) IVOMD (%) RFV
Ararti 4.00 7.40ab
50.29ab
93.62
Dalota 3.94 7.01bc
47.97bc
90.48
Dz0058 5.12 7.44a 50.63
a 101.22
Ejerie 4.26 7.26ab
49.51ab
94.57
Hora 3.83 7.30ab
49.55ab
92.38
Local 3.57 7.05abc
48.09bc
87.59
Minijar 3.70 6.71c 45.99
c 87.41
Teketay 4.17 7.10ab
48.46ab
92.52
Mean 4.07 7.16 48.81 92.47
SEM (±) 0.22 0.07 0.42 2.21
CV (%) 15.96 3.33 2.94 8.16
Sig ns ** ** ns
a-c means within column having different superscript are significantly different at*= P<0.05,
**=P<0.01, CP= crude protein, ME=metabolizable energy, IVOMD= in vitro organic matter
digestibility, RFV=relative feed value, SEM=standard error of mean, CV= coefficient of
variation, Sig= significant level
4.1.4. Dry matter degradability and degradability characteristics
The ruminal DMD of chickpea varieties haulms at different incubation times for different
varieties under investigation is illustrated in (Table 10) and (Figure 5). The ruminal dry matter
degradation was significantly (p<0.001) different among the chickpea varieties haulms in all
incubation times. This might be associated with the difference in the chemical composition of
chickpea varieties.
The degradability of chickpea varieties haulm was increased with increasing time of incubation.
At 24 hours of incubation over 40% of the DM in most of the chickpea varieties haulms had been
degraded and more than 50% degraded at 96 hours of incubation. At 0 hours of incubation higher
dry matter disappearance (p<0.001) was recorded in Hora (22.30%) while lower from Dalota

32
(17.03%). The high initial disappearance in Hora variety haulm might indicate the relatively
higher content of dusty and small particles during sample grinding even in the same equipment
and screen size, which could easily pass from the bags, rather than a greater solubility. At 6 and
12 hours of incubations Ararti, Dz0058 and local were more (p<0.001) degradable than other
varieties haulms. The overall mean dry matter degradability of 12 hours of post-incubation is lower
than the value of 50.82% in chickpea haulm reported by Naser et al. (2011).
The overall mean 24 hours DMD in the present study is lower than 55.28 and 47.05% in
chickpea haulm reported by Naser et al.(2011) and Eyob Haile (2017), respectively. At 48 hours
post-incubation, higher rumen DMD was recorded in Ararti (56.03%) and Dz0058 (55.59%) and
lower from Dalota (32.51%). The overall mean of 48 hours degradability is relatively consistent
with the previous result by Eyob Haile (2017) (52.83%) while lower than 58.47% by Naser et al.
(2011) in chickpea straw. At 72 and 96 hours of incubation higher rumen DMD were recorded
from Dz0058 (59.88 and 65.56%) while lower from Dalota (46.52 and 46.92%), respectively.
The overall means of 72 and 96 hours of incubation degradability are higher than 56.11 and
56.85%, respectively in chickpea haulm reported by Eyob Haile (2017).

33
Table 10. In situ dry matter degradability of chickpea varieties haulms (%DMD)
Time of incubation in the rumen (hours)
Varieties 0 6 12 24 48 72 96
Ararti 18.15ef
36.34a 40.01
a 46.05
b 56.03
a 59.83
a 62.46
b
Dalota 17.03g 19.59
d 29.62
c 32.51
d 43.82
d 46.52
f 46.92
g
Dz0058 19.15d 34.67
ab 41.98
a 47.72
a 55.59
a 59.88
ab 65.56
a
Ejerie 20.43c 28.65
c 36.14
b 41.25
c 51.05
b 55.25
dc 56.26
b
Hora 22.30a 28.02
c 29.93
c 45.66
b 51.51
b 53.28
d 55.28
b
Local 18.76de
31.55abc
38.52ab
49.17a 55.40
a 56.84
bc 58.74
c
Minijar 21.18b 31.10
bc 34.88
b 45.59
b 48.58
c 50.75
e 52.73
e
Teketay 17.77f 23.23
d 26.73
c 42.55
c 47.56
c 48.06
f 49.80
f
Mean 19.35 29.15 34.73 43.81 51.19 53.70 55.97
SEM 0.36 1.18 1.12 1.03 0.88 0.99 1.24
CV 1.83 9.17 5.82 1.94 2.54 2.43 2.35
Sig *** *** *** *** *** *** ***
a-g means within column having different superscript are significantly different at*** = P<0.001;
SEM= standard error of mean, CV= coefficient of variation, Sig= significant level
Figure 4. A graphical pattern of ruminal DMD of chickpea haulm at different incubation time
0
10
20
30
40
50
60
70
0 6 12 24 48 72 96
Rum
en D
MD
%
Time of incubation (hrs)
Ararti
Dalota
Dz0058
Ejerie
Hora
Local
Minijar
Teketay

34
The results for the rapidly soluble fraction (a), insoluble but fermentable fraction (b), potentially
degradable fraction (PD), rate of degradation of b fraction (c) and effective degradability (ED)
were significantly (p<0.001) different among the tested varieties haulms (Table 11). The soluble
DM fraction (a) ranged from 16.06 in Dalota to 21.45% in Dz0058. The overall mean soluble
DM fraction (a) is consistent with the previous result of 19.00% for chickpea haulm reported by
Naser et al. (2011). On the other hand, it is higher than 16.7% reported by Soares et al. (2000)
while lower than 24.84% reported by Eyob Haile (2017) for chickpea haulm.
The insoluble but fermentable fraction (b) was ranged from 30.45 in Minijar to 40.54 in
Dz0058%. The overall mean fermentable fraction in the present study is higher than the previous
result of 28.70 and 32.36% reported by Soares et al. (2000) and Eyob Haile (2017), respectively
while lower than 38.10% reported by Naser et al.(2011) in chickpea straw. In the present study,
the higher insoluble but fermentable fraction (b) of Dz0058 may be explained by the lower
content of cell wall fraction in this variety. The overall mean rate of degradation (c) was 0.05 per
hour which is higher than the previous result of 0.041 and 0.044 per hour reported by Soares et
al. (2000) and Eyob Haile (2017), respectively in chickpea haulm. On the other hand, it is lower
than 0.152 per hour reported by Naser et al. (2011). Higher PD was recorded from Dz0058
(61.99) while lower from Dalota (49.02%) with an overall mean of 55.72%. The mean of PD is
lower than 58.10, 56.84 and 57.20 % reported by Naser et al. (2011), Numan et al. (2017) and
Eyob Haile (2017), respectively. In the present study, the potentially degradable fraction of most
of the chickpea haulms was above 50% except Dalota. The average ED was 41.47% ranged from
Dalota (33.54) to Dz0058 (46.79%). Relatively higher ED in Dz0058 may be related to its lower
contents of cell wall fraction.
Generally, the difference in DMD and ruminal degradability characteristics of the present study
from previous studies might be due to differences in varieties, chemical composition, leaves to
stems proportion, stage of maturity and impurity and technical variation such as bag pore size,
washing procedures, grinding size, the diet of experimental animal, species of animal and
washing method (Golshani et al., 2012; Anjum et al., 2014).

35
Table 11. In situ dry matter degradability characteristics of chickpea haulm
Varieties Parameters
a b c /hour PD ED
Ararti 21.06a 39.88
ab 0.05
abc 60.94
ab 46.11
a
Dalota 16.06b 32.96
c 0.03
d
0.05bcd
49.02d 33.54
d
Teketay 16.08b 34.49
bc 50.57
d 36.80
c
Dz0058 21.45a 40.54
a 0.05
abc 61.99
a 46.79
a
Ejerie 21.01a 36.11
abc 0.04
cd 57.11
bc 41.30
b
Hora 20.83a 35.47
abc 0.04
cd 56.30
c 40.88
b
Local 19.02ab
38.99ab
0.06a 58.02
abc 45.04
a
Minijar 21.37a 30.45
c 0.06
ab 51.82
d 41.30
b
Mean 19.61 36.11 0.05 55.72 41.47b
SEM(±) 0.52 1.02 0.00 0.70 0.39
Sig *** *** *** *** ***
a–d means within the same column with different superscripts are significantly different at ***P=
< 0.001; a = soluble fraction, b = slowly degradable fraction, c = rate of degradation, PD =
potential degradability, ED = effective degradability, SEM= standard error of mean, Sig=
significant level
4.1.5. Correlation among food-feed traits of chickpea
Pearson correlation coefficients of chickpea haulm nutritional values and agronomic traits are
presented in Table 12. Plant height was significantly (p<0.05) and negatively correlated with the
ash content. Similarly, such a significant and negative association of PH and ash was observed
by Tena Alemu (2016). The days to flowering was significantly and negatively associated with
ash (P<0.001), CP, ME, RFV (p<0.05) and IVOMD (p<0.01). On the other hand, DF was
significantly and positively correlated with NDF, ADF (p<0.05) and ADL (p<0.01). This is
comparable with Tena Alemu (2016) who indicated that days to 50% flowering was negatively
and significantly correlated with ash, CP, ME and IVOMD while positively and significantly
associated with cell wall fractions.
The days to maturity also negatively and significantly associated with ash (p<0.05), CP (p<0.01),
ME, IVOMD and RFV (P<0.001) while significantly and positively associated with NDF, ADF

36
(p<0.01) and ADL (P<0.001). The positive and significant association between days to maturity
and cell wall fractions might be possibly an indication of a high level of cell wall resulted from
the accumulation of insoluble carbohydrates due to later stages of maturity.
The CP content was negatively and significantly correlated with HY and BP (p<0.01). On the
other hand, it was non significantly correlated with grain yield and harvest index which indicated
that no decline in CP is expected as a result of any increase in grain yield. This may offer an
opportunity to select chickpea varieties having better CP without compromising GY and HI.
Similarly, no such significant association between GY and CP was reported by Ashraf (2017) in
chickpea. In contrast to this, Tena Alemu (2016) observed a significant and negative association
between CP and GY.
Grain yield was associated with all feed quality traits (ash, cell wall fraction, ME, IVOMD and
RFV) insignificantly (p>0.05). Consistently, absence of significant association between grain
yield and NDF, ADF, ADL, IVOMD and ME was observed by Ashraf (2017) in chickpea.
Haulm yield was significantly and negatively correlated with ash (P<0.001), CP, ME, IVOMD
and RFV (p<0.01) while positively associated with NDF, ADF (p<0.01) and ADL (P<0.001).
Similarly, such a significant association was observed by Tena Alemu (2016) in chickpea.
The CP was positively and significantly correlated (P<0.001) with ash, ME, IVOMD and RFV.
This indicates haulm with higher CP could supply adequate protein for microbial growth and
thus improves digestibility of the feed. The IVOMD was negatively and significantly correlated
with NDF, ADF and ADL (P<0.001). Similarly, a significant and negative association of
IVOMD and cell wall fraction was observed by Tena Alemu (2016) in chickpea. This negative
correlation might be due to the fact that cell wall fraction causes depression in digestibility by
inhibiting the activity of rumen microbial activity (Dereje Andualem et al., 2016). The ME had
significantly and positively associated with IVOMD (P<0.001). This might indicate that high
organic matter digestibility supplies high metabolizable energy. Absence of a significant
correlation of GY and PH with chemical composition results in a good opportunity for increasing
these traits simultaneously.

37
Table 12. Pearson correlation between food feed traits of chickpea
Ash CP NDF ADF ADL ME IVOMD RFV
PH -0.43* -0.22 0.13 0.16 0.21 -0.27 -0.28 -0.17
DF -0.60*** -0.39* 0.37* 0.41* 0.48** -0.44* -0.46** -0.40*
DTM -0.40* -0.51** 0.74*** 0.74*** 0.67*** -0.71*** -0.71*** -0.76***
GY -0.04 -0.26 0.22 0.13 0.18 -0.20 -0.20 -0.23
HY -0.60*** -0.55** 0.53** 0.52** 0.57*** -0.52** -0.53** -0.55**
HI 0.02 0.05 -0.07 -0.17 -0.13 0.08 0.10 0.10
HSW 0.15 0.27 -0.24 -0.28 -0.22 0.34 0.36* 0.26
BP -0.58*** -0.49** 0.46** 0.42* 0.48** -0.44* -0.46** -0.48**
CP 0.62*** - -0.86*** -0.84*** -0.87*** 0.63*** 0.70*** 0.92***
NDF -0.56** - - 0.96*** 0.90*** -0.84*** -0.87*** -0.90***
ADF -0.56** - - - 0.91*** -0.90*** -0.90*** -0.91***
ADL -0.68*** - - - - -0.80*** -0.84*** -0.88***
ME 0.58** - - - - - 0.99*** 0.74***
IVOMD 0.60*** - - - - - - 0.80***
RFV 0.52** - - - - - - -
* P<0.05,** P<0.01 levels of probability, DM= dry matter, Ash, CP=crude protein, NDF=neutral detergent fiber, ADF= acid detergent
fiber, ADL=acid detergent lignin, ME=metabolizable energy, IVOMD= in vitro organic matter digestibility, PH= plant height (cm),
NPB= number of primary branch, NSB= number of secondary branch, DF=days to 50% flowering, DTM= days to 90% maturity,
HSW=hundred seed weight(gm), BP=Biomass production ( t/ha), GY= Grain yield(t/ha), HI= harvest index, HY= haulm yield (t/ha)
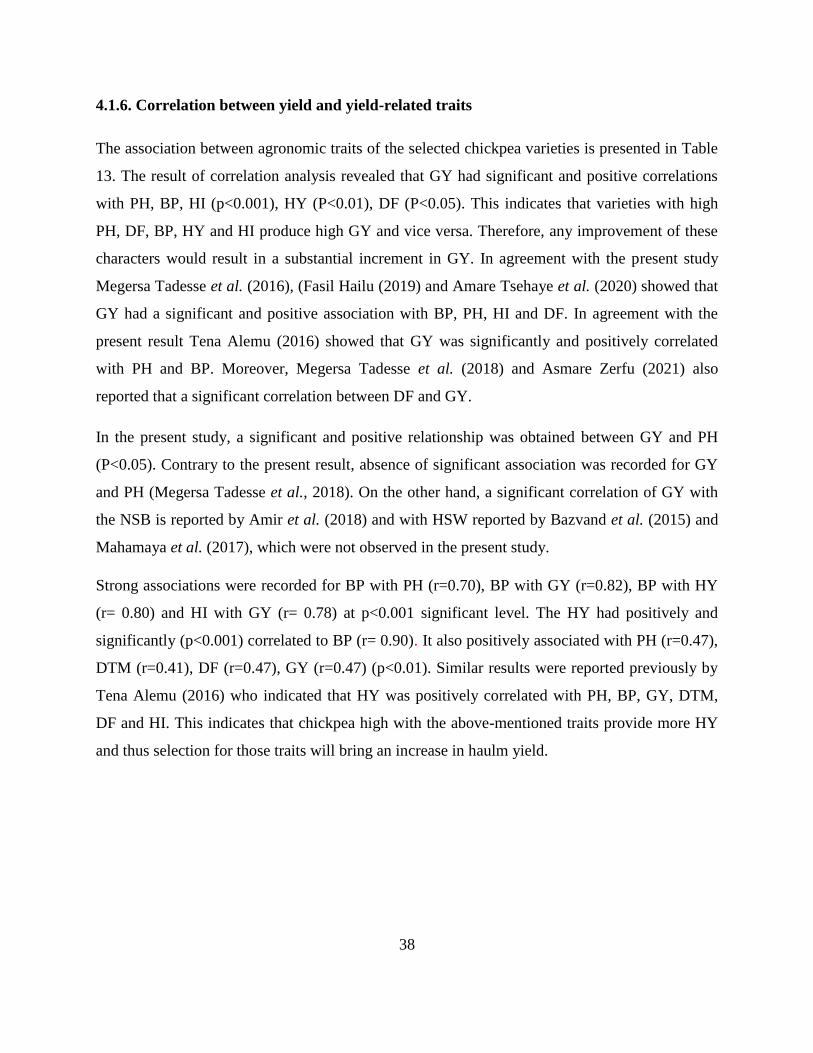
38
4.1.6. Correlation between yield and yield-related traits
The association between agronomic traits of the selected chickpea varieties is presented in Table
13. The result of correlation analysis revealed that GY had significant and positive correlations
with PH, BP, HI (p<0.001), HY (P<0.01), DF (P<0.05). This indicates that varieties with high
PH, DF, BP, HY and HI produce high GY and vice versa. Therefore, any improvement of these
characters would result in a substantial increment in GY. In agreement with the present study
Megersa Tadesse et al. (2016), (Fasil Hailu (2019) and Amare Tsehaye et al. (2020) showed that
GY had a significant and positive association with BP, PH, HI and DF. In agreement with the
present result Tena Alemu (2016) showed that GY was significantly and positively correlated
with PH and BP. Moreover, Megersa Tadesse et al. (2018) and Asmare Zerfu (2021) also
reported that a significant correlation between DF and GY.
In the present study, a significant and positive relationship was obtained between GY and PH
(P<0.05). Contrary to the present result, absence of significant association was recorded for GY
and PH (Megersa Tadesse et al., 2018). On the other hand, a significant correlation of GY with
the NSB is reported by Amir et al. (2018) and with HSW reported by Bazvand et al. (2015) and
Mahamaya et al. (2017), which were not observed in the present study.
Strong associations were recorded for BP with PH (r=0.70), BP with GY (r=0.82), BP with HY
(r= 0.80) and HI with GY (r= 0.78) at p<0.001 significant level. The HY had positively and
significantly (p<0.001) correlated to BP (r= 0.90). It also positively associated with PH (r=0.47),
DTM (r=0.41), DF (r=0.47), GY (r=0.47) (p<0.01). Similar results were reported previously by
Tena Alemu (2016) who indicated that HY was positively correlated with PH, BP, GY, DTM,
DF and HI. This indicates that chickpea high with the above-mentioned traits provide more HY
and thus selection for those traits will bring an increase in haulm yield.

39
Table 13. Correlation among yield and yield components in chickpea varieties in the study area
PH NPB NSB DF DTM GY HY BP HI HSW
PH 1.00
NPB 0.07 1.00
NSB 0.05 0.21 1.00
DF 0.46** 0.24 0.25 1.00
DTM 0.21 0.24 0.39* 0.38* 1.00
GY 0.76*** 0.11 0.13 0.38* 0.26 1.00
HY 0.47** 0.19 0.19 0.47** 0.41* 0.47** 1.00
BP 0.70*** 0.20 0.34 0.50** 0.40* 0.80*** 0.90*** 1.00
HI 0.49** -0.03 -0.02 0.21 -0.05 0.78*** -0.14 0.29 1.00
HSW -0.12 -0.02 -0.02 -0.03 -0.28 -0.21 -0.3 -0.30 -0.07 1.00
*p< 0.05, **P<0.01, *** p<0.001 PH=plant height (cm), NPB= number of primary branch,
NSB= number of secondary branch, DF= day to 50% flowering, DTM=day to 90% maturity,
GY= total grain yield, HY= haulm yield, BP=biomass production, HI= harvest index,
HSW=hundred seed weight
4.2. Farmer Preferences and Knowledge Related to Food-Feed Traits
4.2.1. Demographic and socioeconomic characteristics of the respondents
Descriptions of respondents‟ socioeconomic characteristics are summarized in Table 14. The
majority of the households in the study area were headed by males. This is similar with the
observations of several previous studies (Ararsa Derara et al., 2018; Dirsha Demam et al., 2018;
Habte Abaya et al., 2019) which means most of the responses were given by men on behalf of
their households.
The average household age in the current study was 42.64±1.10, which indicates that the
household heads of the respondents fall in the economically active age group. This is in
agreement with other studies (Sisay Belete, 2018; Ararsa Derara et al., 2018). Age can determine
how active and productive of the head of the household. The educational levels of the
respondents ranged from totally illiterate to those who attend formal education. From the
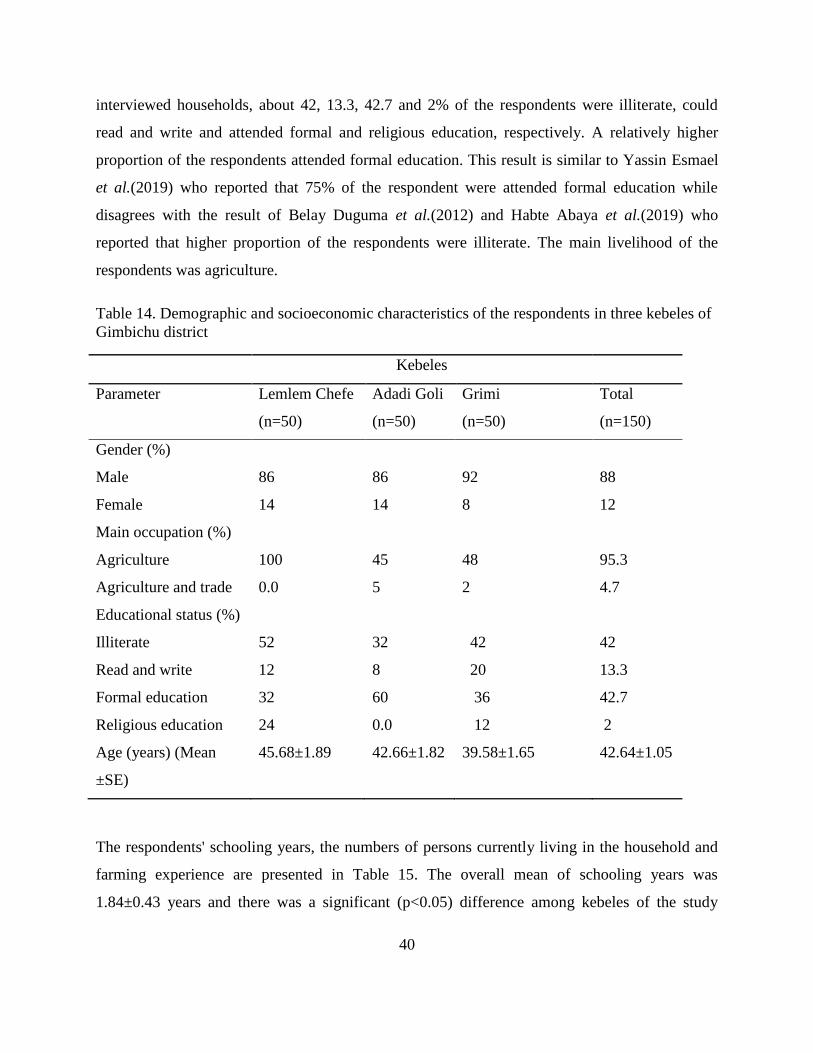
40
interviewed households, about 42, 13.3, 42.7 and 2% of the respondents were illiterate, could
read and write and attended formal and religious education, respectively. A relatively higher
proportion of the respondents attended formal education. This result is similar to Yassin Esmael
et al.(2019) who reported that 75% of the respondent were attended formal education while
disagrees with the result of Belay Duguma et al.(2012) and Habte Abaya et al.(2019) who
reported that higher proportion of the respondents were illiterate. The main livelihood of the
respondents was agriculture.
Table 14. Demographic and socioeconomic characteristics of the respondents in three kebeles of
Gimbichu district
Kebeles
Parameter Lemlem Chefe
(n=50)
Adadi Goli
(n=50)
Grimi
(n=50)
Total
(n=150)
Gender (%)
Male 86 86 92 88
Female 14 14 8 12
Main occupation (%)
Agriculture 100 45 48 95.3
Agriculture and trade 0.0 5 2 4.7
Educational status (%)
Illiterate 52 32 42 42
Read and write 12 8 20 13.3
Formal education 32 60 36 42.7
Religious education 24 0.0 12 2
Age (years) (Mean
±SE)
45.68±1.89 42.66±1.82 39.58±1.65 42.64±1.05
The respondents' schooling years, the numbers of persons currently living in the household and
farming experience are presented in Table 15. The overall mean of schooling years was
1.84±0.43 years and there was a significant (p<0.05) difference among kebeles of the study

41
district. The overall mean number of persons currently living in the household was 5.02±0.15
with no significant (p>0.05) difference among kebeles of the study district. The overall mean
person currently living in the household is lower than the findings of Endale Yadessa (2015)
(6.08±2.85) in Meta Robi District and Habte Abaya et al. (2019) (6.53 ±2.12) in selected districts
of West Shewa Zone. The average farming experience of the household was 21.47 years.
Table 15. Means and SE of years of schooling and number of persons currently living in the HH
in three kebeles of Gimbichu District
Kebeles
Parameter
(Mean±SE)
Lemlem
Chefe
(n=50)
Girimi
(n=50)
Adadi Goli
(n=50)
Total
(n=150)
Sig
Years of schooling 1.84±0.43a 1.94±0.39
a 3.34±0.49
b 2.37±0.26 *
Number of persons currently
living in the HH
5.2±0.25 4.82±0.26 5.04±0.28 5.02±0.15 ns
Years of farming experience 24.18±1.84 21.44±1.83 18.80±1.53 21.47±1.01 ns
n= number of respondents, a, b
means in a row with different superscripts differ significantly at
*P< 0.05 significant levels, ns= not significant, HH= household, SE= standard error of mean, Sig
= significant level
4.2.2. Livestock and landholding of the respondents
Livestock holding per household in TLU in the study areas is summarized in the appendix
(Appendix 3). Farmers keep different livestock species including cattle, goats, sheep, equines
(donkeys and horses) and chicken. Cattle were the dominant livestock species reared in the study
area. This is in agreement with the previous reports (Belay Duguma et al., 2012; Ararsa Derara
et al., 2018). The average oxen owned per household was higher than the rest cattle herd
structure. This is because oxen are very important for crop farming activities in the study area.
This is comparable to Derbie Alemu et al. (2019) result in Raya Kobo District, North Wollo
Zone, Ethiopia.

42
The overall average milking cows and calves owned per household was higher as compared to
heifers owning. This is comparable with the result of Derbie Alemu et al. (2019) and the reason
could be farmers aimed to produce more milk for their family consumption and income. The
overall average number of bulls owned per household was higher as compared to heifers owning.
The reason could be farmers used bulls for the replacement of oxen.
On the other hand, small ruminants were the least reared livestock species due to shortage of
feed, the occurrence of diseases and lack of improved sheep breed according to the respondent's
response. The mean of trained oxen and mature chicken were significantly (p<0.001) different
between kebeles of the study districts. Similarly, the mean bull TLU was significantly (p<0.05)
different between kebeles of the study area. Furthermore, the overall average livestock holding
per household was 6.44 TLU and significantly different between kebeles of the study district
(p<0.001). the overall average livestock holding is higher than the 5.86 reported earlier in Ada‟a
Sinana Damot-Gale district (Sisay, 2018) while lower than 9.43 and 7.14 reported by Dawit
Assefa et al. (2013) and Ararsa Derara et al.(2018) in selected kebeles of Kombolcha district and
Weliso district, respectively.
The mean land size per hectare of sample respondents is described in Table 16. The overall
cultivated landholding per household was significantly higher than landholding for uncultivated
land. Own cultivated land for crop production and own uncultivated land was significantly
(p<0.05) different among kebeles of the district. The overall mean own cultivated landholding of
the respondents was 1.5 ha per household which is relatively comparable with 1.58 ha reported
by Ararsa et al. (2018) in Weliso district south west Shoa.
On the other hand, it is lower than 1.82 ha reported by Habte Abaya et al. (2019) and higher than
0.95 reported by Derbie Alemu et al. (2019). The overall own landholding of the respondents
was 1.78 ha per household which is comparable to Getahun Belay and Tegene Negesse (2018) in
Burie Zuria district, north-western Ethiopia. Furthermore, the overall average total landholding
per household (2.47±0.18ha) observed in this study is higher than 2.10±0.13ha reported by Sisay
Belete (2018) in Sinana, Damot-Gale and Ada‟a districts. On the other hand, it is lower than 3.8
and 2.85±0.83ha reported by Endale Yadessa (2015) in Meta Robi district and Habte Abaya et

43
al. (2019) in Selected Districts of west Shewa zone, respectively. The difference might be due to
the population density difference in different rural areas of the country.
Table 16. Landholding (ha HH-1
) of the respondents in the study area of Gimbichu District
Kebeles
Parameter
(Mean±SE)
Lemlem
Chefe
(n=50)
Girimi
(n=50)
Adadi Goli
(n=50)
Total
(n=150)
Sig
Own cultivated land(ha) 1.64±0.14b
0.99±0.13a
1.86±0.22b
1.5±0.10 *
Own uncultivated land (ha) 0.33±0.04b
0.02±0.01a 0.32±0.04
b 0.28±0.02 *
Rented/shared in land
cultivated(ha)
0.45±0.10 0.46±0.12 0.8595±0.18 0.59±0.08 ns
Rented/shared out land
uncultivated (ha)
0.04±0.02 0.19±0.02 0.02±0.02 0.02±0.01 ns
Rented/shared in land/ used
for forage production (ha)
0.003±0.003 0.99±0.13 0.01±0.01 0.003±0.002 ns
Total 2.47±0.18 1.69±0.16 3.20±0.31 2.50±0.14
a, b Mean values with different superscripts in a row indicate statistically significant differences
among kebeles at * (p<0.05) significant level, Sig= significant level
4.2.3. Crop production and land use pattern
The dominant cereal crops produced in the study area were wheat and teff in as indicated in
Table 17. A comparable result was reported by Tibabu Kochare (2018) in Wolayta zone, southern
Ethiopia. Chickpea, grass pea and lentil were the major legume crops found in the study area.
This result is comparable with Yitbarek Tegegne (2017) in Bale Zone of Sinana and Ginir
district.
The average land (ha) allocated for wheat and faba bean were significantly different (p<0.001)
among kebeles of the study area, while the average land allocated for barely, chickpea, teff, grass

44
pea, lentil, garlic and field pea were non significantly different among kebeles of the study area.
The average yield of faba bean is significantly different (p<0.001) among kebeles of the district (
Table 17. Average land allocated and yield of crops in three kebeles of Gimbichu District
Land allocated and
yield of crop
Lemlem Chefe
(n=50)
Girimi
(n=50)
Adadi Goli
(n=50)
Total
(n=150)
Sig
Land allocated (ha)
(mean )
Barley 0.01 0.01
0.02 .011
0.06 0.03
0.03 0.001 ns
Wheat 0.88 0.10a
0.62 0.10a
1.35 0.16b
0.95 0.07 ***
Fababean 0.014 0.01a
0.03 0.01a
0.16 0.03b
0.07 0.01 ***
Chickpea 0.51 0.04
0.40 0.04
0.40 0.05
0.43 0.03 ns
Teff 0.45 0.04ab
0.37 .05a
0.55 0.06b
3.10 1.30 *
Grass pea 0.11 0.02
0.09 0.02
0.16 0.03
0.12 0.01 ns
Lentil 0.06 0.02
0.02 0.01
2.13 1.98
0.74 0.66 ns
Garlic 0.04 0.01 0.03 0.01 0.01 0.00 0.02 0.01 ns
Field bean 0.00 0.00
0.00 0.00
0.01 0.01
0.003 .00 ns
Yield (q/ha) (mean ±SE)
Barley 0.14±0.74 0.41±0.74 0.57±0.20 0.37±0.89 ns
Wheat 25.13±2.76 25.13±2.76 28.13±3.24 24.29±1.60 ns
Faba bean 0.25±0.11a
0.55±0.23a
2.36±0.44b
1.05±0.19 ***
Field bean 0.00 ±0.00 0.00±0.00 0.1 ±0.11 0.3±0.33 ns
Chickpea 4.63±0.60 4.79±0.83 6.10±0.75 5.16±0.42 ns
Teff 8.35±1.99 5.70±0.58 8.46±0.89 7.50±0.75 ns
Grass pea 1.46±0.39 1.83±0.38 2.81±0.64 2.03±0.28 ns
Lentil 0.55±0.23 0.32±0.17 1.20±0.50 0.68±0.20 ns
Garlic 1.84±0.77 1.22±0.51 0.3±0.30 1.12±0.32 ns
a, b Mean values with different superscripts in a row indicate statistically significant differences
among kebeles at * (p<0,05) and *** (p<0.001) significant level, SE= standard error, ns= not
significant, Sig= significant level

45
4.2.4. Chickpea production
The dominant legume grain produced in the study area was chickpea. The production of
improved chickpea varieties in the study area is illustrated in Figure 6. About 98 and 90% of the
respondent farmers planted improved Kabuli type chickpea varieties in Girimi and Lemlem
Chefe, respectively, which is the highest proportion while a relatively lower proportion of the
respondents (about 72%) planted in Adadi Goli kebele. A higher proportion of the respondents
(about 72%) in Adadi Goli kebeles were planted improved Desi type chickpea varieties, while a
lower proportion of the respondents were planted improved Desi type chickpea varieties in
Lemlem Chefe and Girimi kebeles. In general higher proportion of the respondents in the study
area planted Kabuli-type chickpea than improved Desi chickpea varieties. Similarly, higher
proportion of the respondent's farmer had been growing improved Kabuli type chickpea
continuously since they first planted it.
Figure 5. The proportion of improved chickpea production in three kebeles of Gimbichu district
90
10
52 48
98
2
56
44
72
28
76
24
0
20
40
60
80
100
120
yes no yes no
planted Kabuli type planted Desi type
Per
cen
tages
Lelmlem Chefe Girimi Adadi Goli

46
4.2.5. Chickpea varietal selection criteria
The varietal selection criteria for chickpea based on the ranking are illustrated in Table 18.
Accordingly, the first thing that draws the attention of respondents to plant chickpea varieties
was good price and acceptance in the market. This includes chickpea varieties having large seed
sizes especially the Kabuli type. Good productivity and high grain and haulm yield were other
selection criteria of the respondent in the study area respectively.
Table 18. Selection criteria of chickpea varieties in Gimbichu district
Ranks
Criteria (n=150) 1 2 3 4 5 6 7 Total
weight
Index Rank
Early maturing 22 1 1 1 0 0 0 169 0.06 5
Good price and acceptance in the
market
92 33 5 3 0 0 0 876 0.30 1
Resistance to disease 11 12 14 5 1 1 0 239 0.08 5
Accepted by the land conditions and
suitable for local environment
5 58 14 5 0 0 0 473 0.164 3
Good productivity 20 36 30 15 1 0 1 570 0.197 2
Multipliable 0 2 2 0 0 0 0 22 0.007 9
Large seed size 0 1 6 14 6 0 0 110 0.038 7
Resistant to drought 0 2 5 5 1 0 0 60 0.02 8
Good straws for livestock 0 0 30 15 8 5 0 244 0.084 4
Other** 0 1 4 18 5 7 1 128 0.044 6
**List of other (Easy to work, consumption), Index mean = (7× number of responses for 1st
rank + 6× number of responses for 2nd
rank + 5× number of responses for 3rd
rank + 4 × number
of responses for 4th
+ 3 x number of responses for 5th
+2×number of responses for 6th
+
1×number of responses for 7th
) divided by (7 × total responses for 1st
rank + 6 × total responses
for 2nd
rank + 5× total responses for 3rd
rank + 4× total responses for 4th
rank +3x number of
responses for 5th
+ 3 ×total responses for 6th
rank +1 × number of responses for 7th
rank

47
4.2.6. Major Feed Resources
There were different feed resources available in the study areas with different levels of
contribution as shown in Table 19. Accordingly, crop residue was the main feed resource used in
the study district, which is consistent with previous reports (Tolera Adugna et al., 2012;
Solomon Gizaw et al., 2017; Getahun Belay and Tegene Negesse, 2019). This high contribution
of crop residues to livestock feeding reflects the level of integration between crop and livestock
farming (Solomon Gizaw et al., 2017). Wheat and teff residues were by far the most dominant
source from cereal crops, this is comparable with previous reports of Yayneshet Tesfay et al.
(2016) in central and eastern Tigray, Northern Ethiopia and Solomon Gizaw et al.(2017) in
Tigray region and Lume district in Oromia region. The largest pulse residue was obtained from
chickpea and this also comparable with previous reports by Solomon Gizaw et al.(2017) in Lume
district. On the other hand, it contradicts with Kassahun Gurmessa et al.(2016) that report faba
beans and field pea is the dominant residue source from pulse crop. This variation might be due
to the type of legume grain grown across the area is varied.
About 92% of the respondents of the sample farmers had a year-round supply of crop residues
and about 89.3% of the respondent‟s farmers stored surplus crop residues for later use. From
those respondents, who stored surplus crop residues 94.8% stacked outside in the form of a heap
around the homestead and it was commonly fenced with locally available materials especially
with thorny branches of trees and shrubs for protection from free-roaming animals, while 5.2%
stacked under-shed. About 68.7, 29.3 and 2.0% of sample respondents started feeding crop
residues at the beginning of the dry season, at the middle of the dry season and the beginning of
the rainy season, respectively (Figure 7). This indicated that crop residues are the major dry
season feed resource in the area.
Next to crop residue, the main feed resource in the study district was industrial by-products
(Furishika and Fagulo). These results contradict with Solomon Gizaw et al. (2017) and Tolera
Adugna et al.(2012) report. This might be due to the shortage of grazing land in the area in turn
farmers use this agricultural by-product as an important supplement to the poor-quality crop
residues during the dry season.

48
Table 19. Rank of feed resources in the study district
Ranks
Feed resource 1 2 3 4 Total
weight
Index Rank
Crop residue 145 5 0 0 595 0.43 1
Natural pasture
and stubble
grazing
5 40 30 14 214 0.15 3
Industrial by-
product
0 55 54 8 281 0.20 2
Local brewery by-
product
0 13 28 25 120 0.09 5
Hay 0 31 15 17 140 0.10 4
Other feeds** 0 5 8 5 36 0.03 6
** Lists of other feeds include vetch and salt, weeds # weighted values for each variable for
major feed resource based on rank, Index mean= sum of (4 × number of responses for 1st rank +
3× number of responses for 2nd rank + 2 × number of responses for 3rd rank + 1× number of
responses for 4th) divided by (4 × total responses for 1st rank + 3 × total responses for 2nd rank
+ 2× total responses for 3rd rank + 1 × total responses for 4th rank )
Figure 6. Season of feeding crop residues
4.2.7. Uses of chickpea and other legumes haulms as livestock feed
2%
29%
69%
At the begning of the rainy
season
At the middle of dry season
At the begning of the dry season

49
Crop residues were the main feed source for livestock and given the predominance of teff and
wheat straw in the study area. Next to cereal straw grain legume haulm also a source of feed
resource in the study area. The main grain legume haulm prioritized and ranked is illustrated in
Table 20. Accordingly, the major legume haulm used by the sample respondent farmers was
chickpea, grass pea, faba bean and lentil, respectively.
Table 20. The rank of legume haulms used for livestock feed
variables 1 2 3 Total
weight
Index Rank
Grass pea 18 32 7 125 0.2 2
Chickpea 121 23 4 413 0.65 1
Faba bean 4 16 5 49 0.1 3
Lentil 6 9 10 46 0.07 4
Index mean= sum of (3× number of responses for 1st rank + 2× number of responses for 2nd rank
+ 1× number of responses for 3rd rank) divided by (3× total responses for 1st rank + 2× total
responses for 2nd rank + 1× total responses for 3rd rank)
4.2.8. Chickpea cultivar residue preference and feeding system
Utilization of chickpea haulm as feed resources, cultivar haulm preferences as a livestock feed
and storage months are summarized in Table 21. Chickpea haulm was the major feed resource
from legume haulms in the study district. This result contradicts with previous result Yayneshet
Tasfay et al. (2016) who showed that Faba bean was the most dominant crop across the study
districts. About 99.3% of the sample respondents have used chickpea haulm as livestock feed
(Table 21). About 76% of the respondents of farmers were fed just as soon as threshing directly
on the threshing field rather than after storage (Figure 9).
This may be due to the small quantity of chickpea production as compared to cereal crops (wheat
and teff) and the straw from these crops is sensitive to moisture to develop moulds. This is
comparable to Mekuanint Gashaw and Girma Defar (2017)., report while 24.2 % of the
respondents were feed after store some time as they mixed with cereal straw. The majority of the
respondents preferred both Desi and Kabuli-type chickpea haulm as a source of livestock feed
(Table 19). Higher proportion of the respondents fed their animals chickpea haulm mixed with

50
other cereal straws mainly with wheat and teff straw (Figure 8). The average mean months of
storing chickpea haulm were 3.7 ±0.26.
Table 21.The proportion of chickpea haulm usage, cultivar haulm preferences as a livestock feed
and storage months
Parameters Percentage (%)
Uses of chickpea haulm as livestock feed 99.3
Feeding Kabuli type chickpea haulm 30
Feeding Desi type chickpea haulm 6
Feeding Desi and Kabuli type chickpea haulms 64
Months of storing chickpea haulm (Mean ±SE) 3.40±0.24
Figure 7. Feeding system of chickpea haulms
31.54%
55.70%
12.75% Solely
Mixed with cereal straw
Mixed with other
supplements

51
Figure 8. Time of feeding chickpea haulms
4.3. Participatory Varieties Selection
Farmer‟s field day was held on the experimental plot to evaluate and select chickpea varieties for
food feed traits. The selection criteria were plant height, branching, plant density, palatability of
straw, straw yield, grain yield and disease resistance. The participant farmers were explained
how the selected criteria determine grain and haulm yield - a variety with many branches and
good plant density will have better grain and straw yield which is associated with more side
branches, seed pod and haulm. A variety of low disease resistance will have less plant density
resulted in poor yield (grain and straw). Then the participant farmers had compared the criteria
and rank them in order of importance. According to the ranking matrix, grain yield followed by
disease resistance, haulm yield, branching, plant height and palatability of haulm were ranked
first, second, third, fourth, fifth and sixth, respectively. Grain yield, disease resistance and haulm
yield were the most prioritized and preferred traits by the farmers for selecting the better chickpea variety
(Table 20).
The result from participatory variety selection showed that Teketay, Dalota, local, Minijar, Ararti
and Ejerie were the most preferred varieties by farmers, respectively (Table 21). This result is
comparable with Yasin Goa and Genene Gezahegn (2018) who showed that the participant
farmers were selected and accepted Teketay and Dalota as the best varieties based on the number
of branches, diseases and pest resistance, straw and yield grain yield. On the other hand, the elite
76%
24%
Just soon as threshing
After store some time

52
line DZ-0058 was the last preferred varieties by farmers due to low plant density as a result of
poor emergence (seed dormancy, long storage).
Table 22. Pair-wise ranking of selection criteria for chickpea variety by farmers
Criteria PH Bra PD Pala GY HY DR Total Rank
Plant height (PH) * Bra PH PH GY HY DR 2 5
Branching (Bra) * Bra Bra GY HY DR 3 4
Plant density (PD) * PD GY HY DR 1 6
Grain yield (GY) * GY DR 6 1
Haulm yield (HY) * GY 4 3
Disease resistance
(DR)
* 5 2
Table 23. Participatory variety selection of chickpea varieties in the experimental site
Varieties Selection criteria (Rank 1-5)
PH Branchi
ng
Plant
density
Grain
yield
Straw
yield
Disease
resistance
Mean Rank
Local 3 3 4 4 4 5 3.9 3
Ararti 3 4 2 3 2 3 3 5
Hora 4 3 2 2 2 3 2.6 7
Ejjerie 4 3 2 2 3 2 2.9 6
Teketay 5 5 5 5 5 4 4.7 1
Minjar 3 5 4 2 4 2 3.4 4
Dalota 3 5 4 4 4 4 4 2
DZ-0058 3 4 1 1 1 3 2.4 8

53
5. SUMMARY, CONCLUSION AND RECOMMENDATIONS
5.1. Summary and Conclusion
Although the present study was based on a single year and a single location, cultivar dependent
variation in some yield and nutritional value parameters had been observed among the present
tested varieties. Teketay, local and Dalota varieties were found to be the most promising ones in
terms of grain and straw yield and similarly, those varieties were preferred and selected by the
farmers during PVS.
While higher CP, ME, IVOMD and lower contents of cell wall contents are considered as
important nutritional quality traits, the range of CP in the present study was below the critical
value for normal rumen microbial action. On the other hand, the range of ME was above the
lower limit. The grain yield was significantly and positively associated with plant height,
biomass production, harvest index and haulm yield, which indicates that there is a possibility of
selecting varieties of chickpea that combining both food-feed traits. On the other hand, even
though Dz0058 had lower grain and haulm yield, it was the best variety to be selected compared
to the other varieties in terms of higher ash, IVOMD, ME, potentially degradable fraction, the
insoluble but fermentable fraction (b) and EDMD and lower cell wall contents. In general, the
present study revealed that the presence of variation in food feed traits of chickpea varieties is
essential for the improvement of the whole crop.
According to the survey result, chickpea was the dominant legume grain produced and its haulm
was the main feed resource from legume residue. The main chickpea varietal selection criteria of
the respondents were a good price and acceptance in the market, good productivity and accepted
by the land conditions and suitable for the local environment, respectively.
5.2. Recommendations
Based on the above conclusion the following recommendations are forwarded
Grain legumes can function as a key integrating factor in intensifying crop-livestock
farming systems through the provision of food in the human diet and feed for livestock.
Therefore, the selection and evaluation of varieties by involving farmers by the PVS

54
approach can be used to enhance productivity and popularize varieties of these grain
legumes in smallholder farmers.
Teketay, local and Dalota varieties found to be good in terms of grain and straw yield and
those varieties were preferred and selected by the farmers during PVS hence they could
be recommended as suitable candidates for crop rotation with cereals in the study area
because of their potential for providing better grain and straws that can help in enhancing
livestock production in addition to grain yield for human consumption.
The elite chickpea i.e. Dz0058 should be further evaluated for its grain yield and other
agronomic parameters since in the present study it had lower grain and haulm yield this
might be due to the long storage of the seed.
Further researches should be conducted on the evaluation and selection of varieties of
chickpea in different environments since, in addition to the genetic make-up of the crop,
the grain yield, quality and quantity of crop residues are affected by the environment and
interaction of genetic and the environment.
.

55
6. REFERENCES
Abdel-Magid S., El-Rahman H., Mohamed M. and Awadalla I. (2008). Utilization of chickpea
straw and pea straw in feeding growing Rahmani lambs. American-Eurasian Journal of
Agricultural and Environmental Sciences, 4: 214-217.
Abera Yifru and Kebede Mesfin (2013). Assessment on the Status of Some Micronutrients in
Vertisols of the Central Highlands of Ethiopia. International Research Journal of
Agricultural Science and Soil Science, 3(5): 169-173.
Admasu Altaye (2019). Effects of Mesorhizobium Inoculation, Phosphorus and Sulfur
Application on Nodulation, Growth and Yield of Chickpea (Cicer arietinum L.) at
Mortena Jiru District, Central Highland of Ethiopia. MSc Thesis Submitted to School of
Graduate Studies, Debre Berhan University, Debre Berhan, Ethiopia.
Almekinders C.J.M and Elings A. (2001). Collaboration of Farmers and Breeders: Participatory
Crop Improvement in Perspective. Euphytica, 122:425–438.
Amare Tsehaye, Asnake Fikre and Muluken Bantayhu (2020). Genetic Variability and
Association Analysis of Desi-type Chickpea (Cicer arietinum L.) Advanced Lines under
Potential Environment in North Gondar, Ethiopia. Cogent Food and Agriculture, 6:1.
Amir S., Shahzad A., Hidayatur R., Tanvir B., Syed M.A.S., Shahzad A. and Quaid H. (2018).
Genetic Variability, Heritability, Genetic Advance and Correlation Studies Among F7
Populations of Chickpea (Cicer arietinum L.). Pure and Applied Biology, 7(1): 57-65.
Amrinder S., Balwinder S.D. and Ajmer S.S. (2019). Productivity of Chickpea (Cicer arietinum
L.) under Different Sowing Date and Seed Rate in South West Punjab. International
Journal of Current Microbiology and Applied Sciences, 8(5): 1419-1425.
Andualem Tonamo, Berhan Tamir and Gebeyehu Goshu (2015).Assessment of Cattle Feed
Resources; Chemical Composition and Digestibility of Major Feeds in Essera District,
Southern Ethiopia. Technology and Arts Research Journal, 4(2): 89-98.
Anjum M.I., Ghazanfar S. and Begum I. (2014). Nutritional Composition of Wheat Grains and
Straw Influenced by Differences in Varieties Grown under Uniform Agronomic
Practices. International Journal of Veterinary Science, 3:100-104.

56
Ararsa Derara, Kassahun Desalegn and Meseret Molla (2018). Assessment of Livestock Feed
Resources in Weliso District South West Shoa Zone Central Ethiopia. American-
Eurasian Journal of Agriculture and Environment Science, 18 (3): 145-167.
Ararsa Derara and Amanuel Bekuma (2020). Study on Livestock Feed Resources, Biomass
Production, Feeding System and Constraints of Livestock Production in Relation to
Feeds in Weliso District, South West Shoa Zone, Ethiopia. Journal of Biogeneric
Science and Research, 5(1).
Asemahegn Mersha and Debissa Lemessa (2020). Haulm Forage Value of Lentil Varieties in
Central Ethiopia. International Annals of Science, 9(1) :08-15.
Ashenafi Miresa, Solomon Demeke and Gebremeskel Gebretsadik (2019). Assessment and
Evaluation of the Major Ruminant Feed Resources in Bedele Wereda, Oromia, Ethiopia.
Journal of Fisheries and Livestock Production, 7: 292.
Ashraf S.A. (2017). Influence of Varietal Selection and Treatments on the Nutritive Value of
Selected Pulse Crop Residue. A Dissertation Submitted to the Department of Animal
Science, College of Agriculture and Veterinary Medicine, Jimma University, Ethiopia.
Asmare Zerfu, Faris Hailu and Musa Adal (2021). Phenotypic Variability and Association
(among yield components) and Yield Related Trait in desi Type Chickpea (cicer
arietinum l.) in Raya Kobo District, Northern Ethiopia. Agrotechnology, 10: 203.
Astawus Esatu, Firew Mekibib and Tadesse Dessalegn (2018). Performance and Farmers
Selection Criteria Evaluation of Improved Bread Wheat Varieties. Journal of
Agricultural Research, 13(44): 2477-2498.
Bampidis V.A. and Christodoulou V. (2011). Chickpeas (Cicer arietinum L.) in Animal
Nutrition: A Review, Animal Feed Science and Technology, 168(1–2): 1–20.
Bazvand F., Pezeshkpour P. and Mirzaie A. (2015). Chickpea (Cicer arietinume L.) Yield and
Yield Components as Affected by Sowing Date and Genotype under Rainfed Conditions.
Bulletin of Environment, Pharmacology and Life Science, 4 (11): 59-65.
Belay Duguma, Azage Tegegne and Hegde B.P.(2012). Smallholder Livestock Production
System in Dandi District, Oromia Regional State, Central Ethiopia. Global Veterinarian,
8(5): 472-479.

57
Berhanu Fentie and Mesfin Fenta (2021). Participatory on farm evaluation of improved sorghum
varieties in North Gondar areas of Ethiopia. Cogent Food and Agriculture, 7: 1.
Besufekad Belayneh, Tewoderos Tefera and Thomas Lemma (2018). Chickpea (Cicer Arietinum
L.) Production Among Smallholder Farmers in Damot Gale and Humbo Woredas of
Southern Ethiopia. doi:10.20944/preprints201806.0085.
Beyene Belay (2017). Cattle Fattening Practices and its Challenges in Selected Districts of
Horoguduru Wollega Zone, Oromia, Ethiopia. Global Sciences Research journals, 5:
291–299.
Bezabih Melkamu, Adiea A., Ravib D., Prasad K.V.S.V., Jonesa C., Abeyoc B, Tadessed Z.,
Zegeyed H., Solomond T. and Blümmela M. (2018). Variations in Food-Fodder Traits of
Bread Wheat Cultivars Released for the Ethiopian Highlands. Field Crops Research,
229: 1–7.
Bezabih Melkamu, Delelegn Abera, Aberra Adie, Nicole L. and Chris J. (2020). Analysis of
Stakeholders Roles and Relationships in the Feed Value Chain in Ethiopia. ILRI
Discussion Paper 39. Nairobi, Kenya: ILRI.
Bezabih Woldekiros and Lake Mekonnen (2018). Determination of the Optimum Sowing Date
of Chickpea ( Cicer arientinum L .) Under Rain Fed Condition. Journal of Natural Sciences
Research, 8 (11):69–73.
Bilal R., Muhammad S., Javed I., Jamil M. and Nafees M. (2007). Impact of Maturity and
Variety on Digestion Kinetics of Maize (Zea mays). African Crop Science Conference
Proceedings, 8: 589-591.
Blümmel M., Vishala A., Ravi D., Prasad K.V.S.V., Reddy C.H.R and Seetharam N. (2010).
Multi-environmental Investigations of Food-Feed Trait Relationships in Kharif and Rabi
Sorghum (Sorghum bicolor (L) Moench) Over Several Years of Cultivars Testing in
India. Animal Nutrition and Feed Technology, 10: 11-21.
Carla G., Marioli N., Julia C., Rubén G., Marcela I., Mercedes S., Roxana A., María J.A., Raúl
B. and María J.M. (2013). Proximate Composition and Seed Lipid Components of
“Kabuli” Type Chickpea (Cicer arietinum L.) from Argentina. Agricultural Sciences,
4(12):729-737.

58
Ceccarelli S. (2012). Plant Breeding with Farmers – A Technical manual. International Center
for Agricultural Research in the Dry Areas. http://www.growseed.org/Salvatore.pdf.
Chanthakhoun V., Wanapat M. and Berg J. (2012). Level of Crude Protein in Concentrate
Supplements Influenced Rumen Characteristics, Microbial Protein Synthesis and
Digestibility in Swamp Buffaloes (Bubalus bubalis). Livestock Science, 144:197–204.
CSA (Central Statistical Agency of Federal Democratic Republic of Ethiopia (2015). Report on
Area and Production of Major Crops (Private Peasant Holdings, Meher Season). Volume
I, Addis Ababa, Ethiopia.
CSA (Central Statistical Agency of Federal Democratic Republic of Ethiopia) (2019). Report on
Area and Production of Major Crops (Private Peasant Federal Democratic Republic of
Ethiopia Holdings, Meher Season). Volume I, Addis Ababa, Ethiopia.
CSA (Central Statistical Agency of Federal Democratic Republic of Ethiopia) (2020). Report on
Area and Production of Major Crops (Private Peasant Federal Democratic Republic of
Ethiopia Holdings, Meher Season). Volume I, Addis Ababa, Ethiopia.
CSA (Central Statistical Agency of Federal Democratic Republic of Ethiopia) (2020). Report on
Livestock and Livestock Characteristics (private peasant holdings). Volume II, Addis
Ababa, Ethiopia
Dawit Assefa, Ajebu Nurfeta and Sandip Banerjee (2013). Assessment of Feed Resource
Availability and Livestock Production Constraints in Selected Kebeles of Adami Tullu
Jiddo Kombolcha District, Ethiopia. African Journal of Agricultural Research,
8(29):4067-4073.
Daniel Tadesse, Zenebe G/Medhin and Asrat Ayalew (2014). Participatory on Farm Evaluation
of Improved Maize Varieties in Chilga District of North Western Ethiopia. International
Journal of Agriculture and Forestry, 4(5): 402-407.
Derbie Alemu, Ermias Tekletsadik, Mekonnen Yirga and Melaku Tareke (2019). Feed Resources
Potential and Nutritional Quality of Major Feed Stuffs in Raya Kobo District, North
Wollo Zone, Ethiopia. International Journal of Animal Science and Technology, 3(1):
20-29.
59
Deribe Gemiyo, Abubeker Hassen and Tsedeke Kocho (2013). Chemical Composition and
Digestibility of Major Feed Resources in Mixed Farming System of Southern Ethiopia.
World Applied Sciences Journal, 26(2):267-275.
Dereje Duressa, Debela Kenea, Wakgari Keba, Zelalem Desta, Gutema Berki, Gerba Leta,
Adugna Tolera (2014). Assessment of Livestock Production System and Feed Resources
Availability in Three Villages of Diga District Ethiopia. LIVES Working Paper. Nairobi,
Kenya: International Livestock Research Institute (ILRI).
Dereje Andualem, Tegene Negesse and Adugna Tolera (2015). Chemical Composition, In vitro
Organic Matter Digestibility and Kinetics of Rumen Dry Matter Degradability of
Morphological Fractions of Stinging Nettle (Urtica simensis). Advances in Biological
Research, 10 (3): 183-190.
Dirsha Demam , Ashenafi Mengistu and Gebeyehu Goshu (2018). Feed Resources Assessment,
Laboratory Evaluation of Chemical Composition of Feeds and Livestock Feed Balance
in Enset (Ensete Ventricosum)-Based Mixed Production Systems of Gurage Zone,
Southern Ethiopia. International Journal of Livestock Production, 9(6): 112-130.
Endale Yadessa 2015). Assessment of Feed Resources and Determination of Mineral Status of
Livestock Feed in Meta Robi District, West Shewa Zone, Oromia Regional State,
Ethiopia. M.Sc. Thesis Submitted to School of Graduate Studies of Ambo University,
Ethiopia.
Evitayani1 L., Warly A., Fariani T.I. and Fujihara T. (2004). Study on Nutritive Value of
Tropical Forages in North Sumatra, Indonesia. Asian-Australian Journal of Animal
Science, 17(11): 1518-1523.
Eyob Haile (2017). Determining Production and Nutritive Value of Crop Residues and Agro-
Industrial by-Products and Improving their Utilization in Ruminant Nutrition in Eritrea.
PhD Dissertation Submitted to Jomo Kenyatta University of Agriculture and
Technology, Kenya.
FAO (2002). Animal Production Based on Crop Residues – Chinese Experiences Animal
Production and Health Paper 149. In. Tingshuang. Guo (ed). Former Vice-Director
FAOSTAT (Food and Agricultural Organization Statistical Database) (2012). Crop Production
Index. Rome, Italy: FAO.

60
FAOSTAT(Food and Agricultural Organization Statics), (2016).
http://faostat.fao.org/site/291/default.aspx
Fasil Hailu (2019). Genetic Variability and Character Association of Kabuli Chickpea (Cicer
arietinum) Genotypes for Grain Yield and Related Traits at Debre Zeit and Akaka,
Central Ethiopia. MSc Thesis Submitted to the School of Graduate Studies Jimma
University, Jimma, Ethiopia.
Fantahun Dereje (2016). The Effect of Variety and Seed Proportions on Yield, Nutritional
Quality and Compatibility of Oats and Vetch Mixtures. A Thesis submitted to college of
veterinary medicine and agriculture, Addis Ababa University, Bishoftu, Ethiopia.
Fekede Feyissa, Agajie Tesfaye and Angaw Tsigie (2011). Producing and Using Alternative
Feeds to Crop Residues. http://www.eiar.gov.et.
Fikadu Dereje, Seyoum Bediye and Zinash Sileshi (2010). Characterizing and Predicting
Chemical Composition and in vitro Digestibility of crop residue using Near Infrared
Reflectance Spectroscopy(NIRS). Livestock Research for Rural Development, 22(2).
Fitsum Abera , Mengitu Urge and Getachewu Animut (2018). Feeding Value of Maize Stover
Treated with Urea Molasses for Hararghe Highland Sheep. The open Agriculture
Journal, 12:84-94.
Fleischer J.E., Barnes A.R., Awumbila B., Amaning-Kwarteng K. and Tieku, C.K. (1989). Grain
Yield and Nutritive Value of Crop Residues from Three Varieties of Maize (Zea Mays
L). In: Said, A.N. and Dzowela, B.H. (eds). African Research Network for Agricultural
By-products. Overcoming Constraints to the Efficient Utilization of Agricultural by
Products as Animal Feed. Proceedings of the Fourth Annual Workshop Held at the
Institute of Animal Research, Mankon Station, Bamenda, Cameroun.
Gashu Geremew, Tegene Negesse and Aster Abebe (2017). Assessment of Availability and
Nutritive Values of Feed Resources and their Contribution to Livestock Nutrient
Requirements in Chire District, Southern Ethiopia. Agricultural Research and
Technology, 7(4):1-5.
Getachew Tilahun, Firew Mekbib, Asnake Fikre and Million Eshete (2015). Genetic Divergence
and Character Association of Kabulitype Chickpea (Cicer arietium) Genotype under

61
Rain Fed Conditions in Ethiopia. Current Research in Agricultural Sciences, 2(4): 123-
131.
Getahun Belay and Tegene Negesse (2019). Livestock Feed Dry Matter Availability and
Utilization in Burie Zuria District, North-Western Ethiopia. Journal of Tropical and
Subtropical Agro ecosystems, 22: 55–70.
Golshani A.A., Maheri-Sis N., Baradaran H.A., Asadi D.A., Mirzaei A.A. and Dolgari S.J
(2012). Determining Nutrients Degradation Kinetics of Chickpea (Cicer arietinum)
Straw Using Nylon Bag Technique in Sheep. Open Veterinary Journal, 2: 54-57.
Habte Abaya, Ashenafi Mengistu, Berhan Tamir, Getnet Assefa and Fekede Feyissa (2019).
Feed Resources Availability and Feeding Practices of Smallholder Farmers in Selected
Districts of West Shewa Zone, Ethiopia. World Journal of Agricultural Sciences, 15(1):
21-30.
Hassanuur Hassan, Netsanet Beyero and Merga Bayssa (2020). Estimation of Major Livestock
Feed Resources and Feed Balance in Moyale district of Boran Zone, Southern Ethiopia.
International Journal of Livestock Production, 11(1): 43-51.
Haule I.A. (2017). Assessment of the Extent of Utilizing Crop Residues as Ruminant Feed in
Crop-Livestock Farming Systems in Babati District, Tanzania. A Dissertation
Submitted in Partial Fulfillment of the Requirements for the Degree of Master of Science
in Tropical Animal Production of Sokoine University of Agriculture, Morogoro,
Tanzania.
Hiwet Gebremedhin, Girmay Gebresamual, Nigussie Abadi, Mengsteab Hailemariam, Kassa
Teka and Shimbahri Mesfin (2017). Conversion of communal grazing land into arable
land and its impacts on soil properties and vegetation cover. Arid Land Research And
Management, Doi: 10.1080/15324982.2017.1406412.
Husnain M.S., Mahabub T.S, Mazed H.E.M.K, Habib Z.F.B. and Pulok A.I. (2015). Effect of
sowing time on growth, yield and seed quality of chickpea (BARI chhola-6).
International Journal of Multidisciplinary Research and Development, 2(7):136-141.
Jane W., Tena A., Adugna T., Mohammed B., Ashraf A., Million E., Seid A. and Barbara
R.(2017a). Selecting for Food-Feed Traits in Desi and Kabuli Genotypes of Chickpea
(Cicer arietinum). Journal of Experimental Biology and Agricultural Sciences, 5(6).

62
Jane W., Mersha A., Tolera A., Beyan M., Alkhtib A., Eshete M., Ahmed S and Rischkowsky
B. (2017b). Selecting for Food-Feed Traits in Early and Late Maturity Lentil genotypes
(Lens cultinaris). Journal of Experimental Biology and Agricultural Sciences, 5: 697–
705.
Jukanti A.K., Gaur P.M., Gowda C.L.L. and Chibbar R.N. (2012). Nutritional Quality and
Health Benefits of Chickpea (Cicer arietinum L.). A review. British Journal of Nutrition,
108: 12-26.
Kafilzadeh F. and Maleki E. (2011). Chemical Composition, In Vitro Digestibility and Gas
Production of Straws from Different Varieties and Accessions of Chickpea. Journal of
animal physiology and animal nutrition. 96:111–118.
Keshab B.K. (2012). Use of Participatory Variety Selection Approach for the Identification of
Farmers' Preferred Quality Protein Maize Varieties. Proceedings of the 4th
SAS-N
Convention. National Maize Research Program, Nepal Agricultural Research Council
(NARC), Rampur, Chitwan, Nepal.
Kasa Biratu and Saba Haile (2017). Assessment of Livestock Feed Availability, Conservation
Mechanism and Utilization Practices in South Western Ethiopia. Journal of Agricultural
Science and Research, 5(7).
Kassahun Gurmessa, Taye Tolemariam, Adugna Tolera, Fekadu Beyene and Solomon Demeke
(2015). Feed Resources and Livestock Production Situation in the Highland and Mid
Altitude Areas of Horro and G uduru Districts of Oromia Regional State, Western
Ethiopia. Technology and Arts Research Journal, 4(3): 111-116.
Kassahun Gurmessa, Taye Tolemariam, Adugna Tolera and Fekadu Beyene (2016). Production
and Utilization of Crop Residues in Horro and Guduru Districts, Western Ethiopia.
Journal of Food Science and Quality Management, 48.
Kazemi M., Tahmasbi A.M., Naserian A.A., Valizadeh R., Moheghi M.M. (2012). Potential
Nutritive Value of Some Forage Species Used as Ruminants Feed in Iran. African
Journal of Biotechnology, 11:12110- 12117.
Landau S., Glasser T.and Dvash L. (2006). Monitoring Nutrition in Small Ruminants with the
Aid of Near-Infrared Reflectance Spectroscopy (NIRS) Technology: A Review, Small
Ruminant Research, 61: 1-11.

63
Lardy G. and Anderson (2009). Alternative Feeds for Ruminants. NDSU Extension Service
North Dakota State University Fargo, North Dakota, 58108. AS-1182(Revised).
Legesse Dadi, Senait Regassa, Asnake Fikre and Demissie Mitiku (2005). Adoption of Improved
Chickpea Varieties in the Central Highlands of Ethiopia. Ethiopian Agricultural
Research Organization (EARO) Addis Abeba, Ethiopia.
Lelisa Diriba and Mengistu Urge (2020).Status and Challenges of Available Feed Resources and
it‟s Quality under the Changing Climate in Adami Tulu Districts of East Shoa Zone,
Ethiopia. Journal of Basic and Applied Sciences, 3:15.
Lijalem Korbu, Tebkew Damte and Asnake Fikre (eds) (2016). Harnessing Chickpea Value
Chain for Nutrition Security and Commercialization of Smallholder Agriculture in
Africa. 30th
January – 1st
February 2014, Debre Zeit, Ethiopia.
Lopez S., David R.D., Javier F.G., Dhanoa M.S., Dijkstra J. and James, F. (2005). Assessment of
Nutritive Value of Cereal and Legume Straws Based on Chemical Composition and In
Vitro Digestibility. Journal of the Science of Food and Agriculture, 85: 1550–1557.
Mamta R., Prakash H.G., Shashi B. (2021). Evaluation of the Nutritional Quality and Health
Benefits of Chickpea by Using New Technology in Agriculture (NIRS). Asian Journal
of Dairy and Food Research, 40:123-126.
Mahamaya B, Deore G.N., Ajit K.M., Pankaj S. (2017). Selection of Yield Contributing Traits in
Chickpea Genotypes by Correlation and Path Analysis Studies. The Pharma Innovation
Journal, 6(11):402-405.
McDonald P, Edwards R A, Greenhalgh J F D and Morgan C A. (1995). Animal Nutrition. 5th
Edition. Addison Wesley Longman Ltd., Edinburgh, UK. pp. 606.
McDonald P, Edward R A, Greenhalgh J F D and Morgan G A. (2002). Animal Nutrition (6th
ed.), Pearson Educational Limited, Edinburgh, Great Britain, pp. 544.
Megersa Tadesse, Asnake Fikre, Million Eshete, Nigusie Girma, Lijalem Korbu, Ridwan
Mohamed, Dagnachew Bekele, Assefa Funga and Chris O.O. (2016). Correlation and
Path Coefficient Analysis for Various Quantitative Traits in Desi Chickpea Genotypes
under Rainfed Conditions in Ethiopia. Journal of Agricultural Science, 8(12).
Megersa Tadesse, Assefa Funga, Asnake Fikre, Tulu Degefu, Million Eshete, Lijalem Korbu,
Nigussie Girma, Dagnachew Bekele , Ridwan Mohamed , Chris O.O & Pooran G.2018).

64
Breeding Progress for Grain Yield and Yield Related Characters of Kabuli Chickpea
(Cicer arietinum L.) in Ethiopia Using Regression Analysis. Journal of Agricultural
Science, 10(2).
Mekete Bekele, Ashenafi Mengistu and Berhan Tamir (2018). Evaluation of Livestock Feed
Balance under Mixed Crop–Livestock Production System in the Central Highlands of
Ethiopia. Agriculture and Food Security, 7:19.
Mekuanint Gashaw and Girma Defar (2017). Livestock Feed Resources, Nutritional Value and
their Implication on Animal Productivity in Mixed Farming System in Gasera and Ginnir
Districts, Bale Zone, Ethiopia. International Journal of Livestock Production, 8(2):12-
23.
Melak Agajie (2018). Effect of Spacing on Yield Components and Yield of Chickpea (Cicer
Arietinum L.) at Assosa, Western Ethiopia. Agriculture, Forestry and Fisheries. 7(2):
39.
MoANR (Ministry of Agriculture and Natural Resources) (2016). Plant Variety Release,
Protection and Seed Quality Control Directorate. Crop Varieties Register Issue No. 19,
Addis Ababa, Ethiopia.
Molla Fantie and Tsedalu Jemberu (2012). Participatory on Farm Evaluation and Selection of
Improved Bread Wheat Varieties in Vertisol Areas of North-Western Ethiopia.
American-Eurasian Journal of Agronomy, 5 (1): 06-09.
Mustafa A. F., McKinnon J. J. and Christensen D. A. (2000): The Nutritive Value of Thins
Tillage and Wet Distillers' Grains for Ruminants. Asian Australian Journal of Animal
Science, 13.
Naser M.S., Abolfazl A.G. and Hosein C. (2011).Dry Matter Degradation Kinetics and
Metabolisable Energy of Chickpea Straw in Ruminants. Research journal of biological
sciences 6(12):635-638.
Numan K., Hatice H. and Dürdane M. (2017). Chemical Composition and Rumen Degradation
Characteristics of Different Chickpea (Cicer Arietinum L.) Lines Straw. Turkish Journal
of Agriculture - Food Science and Technology, 5(5): 459-463.

65
Obsa Chimdesa, Kabna Aseffa and Seyum Alemu (2018). Participatory Variety Selection of
Improved Bread Wheat Varieties for Moisture Stress Areas of Guji Zone, Southern
Oromia. International Journal of Research in Agriculture and Forestry, 5(4): 1-6.
Regassa Ayana (2014). Response of Chickpea (Cicer Arietinum L) to Land Preparation Methods
and Sowing Dates on Vertisols of Southern and Southeastern Ethiopia. International
Journal of Agricultural Science and Research, 4(5):17-26.
Rahimi Azar M., Orskov, E.R. and McDonald I. (1979). The Estimation of Protein Degradability
in the Rumen from Incubation in Measurements Weighted According to Rate of Passage.
Journal of Animal Science, 88: 645-650.
Rambau M.D., Fushai F. and Baloyi J.J.(2016). Productivity, Chemical Composition and
Ruminal Degradability of Irrigated Napier Grass Leaves Harvested at Three Stages of
Maturity. South African Journal of Animal Science, 46 (4).
Rasby R.J., Berger A.L., Bauer D.E. and Brink D.R. (2011). Minerals and Vitamins for Beef
Cows. Know How, Extension Materials, University of Nebraska, pp7.
Ray K., Singh D. and Lal J. B. (2017). Effect of sowing time and seed rate on growth and yield
of chickpea cultivars. advance research journal of crop improvement, 8 (1) : 1-16.
Shanmugam M. and Kalaimagal T. (2019). Genetic Variability, Correlation and Path Coefficient
Analysis in Chickpea (Cicer arietinum L.) for Yield and its Component Traits.
International Journal of Current Microbiology and Applied Sciences, 8(5).
Sharasia P.L., Garg M.R. and Bhanderi B.M. (2017). Pulses and their Byproducts as Animal
Feed, Calles T, Makkar HPS (eds). Food and Agriculture Organization of the United
Nations, Rome.
Savadogo M., Zemmelink G., Nianogo A.J. and Van Keulen H. (2002). Cowpea (Vigna
unguiculata L. Walp) and Groundnut (Arachis hypogeal L.) Haulms as Supplements to
Sorghum Sorghum bicolor L. Moenchstover: Intake, Digestibility and Optimum Feeding
Levels. Animal Feed Science Technology, 87:57-69.
Sharma S., Yadav N., Singh A. and Kumar R. (2013). Nutritional and Anti nutritional Profile of
Newly Developed Chickpea Varieties. International Food Research Journal, 20(2):805-
810.

66
Sharon P., Julie G., Alex L., Thanwalee S. and Jessica G. (2020). Nitrogen Fixation and
Productivity of Winter Annual Legume Cover in Upper Mid-West Cropping Systems.
Nutrient Cycle Agroecosystem, 117:61-76.
Sheleme Beyene, Walelign Worku, Berhanu Abate, Endalkachew W/Meske,l Molla Assefa ,
Legesse Hidoto, Wondwosen Tena, Tussa Dedefo and Regassa Ayana (2015). Chickpea
(Cicer arietinum L.) Production in the Southern Nations, Nationalities, and Peoples‟
Region of Ethiopia. https://www.researchgate.net/publication/322068589.
Sié M, Dogbé S. and Diatta M. (2010). Participatory Varietal Selection of Rice. The Technician's
Manual. Cotonou, Benin: 120 pp.
Sisay Belete (2018). Effects of Phosphorus Fertilizer and Inoculation on Yield and Nutritive
Values of Grain and Haulm of Selected Grain Legumes in Mixed Crop Livestock
Production System of Ethiopia. M.Sc. Thesis Submitted to the School of Graduate
Studies of Hawassa University, Ethiopia.
Sikdar S., Abuyusuf M., Ahmed S., Tazmin M.F. and Sikdar M. M.H. (2015). Variety and
Sowing Time on the Growth and Yield of Chickpea (Cicer arietinum L.) in Southern
Region of Bangladesh. European Academic Research, 3(6).
Sisay Belete, Melkamu Bezabih, Birhan Abdulkadir, Adugna Tolera, Kindu Mekonnen,
Endalkachew Wolde-meskel (2019). Inoculation and Phosphorus Fertilizer Improve
Food-Feed Traits of Grain Legumes in Mixed Crop Livestock Systems of Ethiopia.
Agriculture, Ecosystems and Environment, 279:58–64.
Soares B.A.M., Abreu J.M.F, Guedes A., Dias-da-Silva A. (2000). Chemical Composition, DM
and NDF Degradation Kinetics in Rumen of Seven Legume Straws. Animal Feed
Science and Technology, 83: 75–80.
Solomon Gizaw, Abule Ebro, Yayneshet Tesfaye, Zeleke Mekuriaw, Yoseph Mekasha, Dirk
Hoekstra, Berhanu Gebremedhin and Azage Tegegne (2017). Feed Resource in the
Highland of Ethiopia. A value Chain Assessment and Intervention Options. LIVES
Working Paper 27. Nairobi Kenyia: International Livestock Research Institute (ILRI).
Storck H., Emana B., Adnew B., Borowiccki A., Woldehawariat S. (1991). Farming Systems and
Resource Economics in the Tropics Farming System and Farm Management Practice
Smallhoders in the Hararghe Highland, Vol 2.

67
Sultan J.I., Inam-ur R., Haq N. and Muhammad Y. (2007). Nutritive Value of Marginal Land
Grasses of Northern Grassland of Pakistan. Pakistan of Journal of Botany, 39(4).
Tamiru Melate and Girma Abera (2019). Effects of Rhizobium Inoculation and Phosphorus
Fertilizer Rates on Growth, Yield and Yield Components of Chickpea (Cicer arietinum
L.) at Goro, Bale Zone, Oromia Regional State. International Journal of Applied
Agricultural Sciences, 5(3): 62-70.
Teame Gerezeir, Ephrem Seid and Lemma Diriba (2018). Participatory Evaluations of Faba
Bean (Vicia faba) Varieties in Enda Mekoni District, Northern Ethiopia. African Journal
of Agriculture, 4 (2): 263-268.
Tena Alemu (2016). Variability in Food-Feed Traits in Chickpea (Cicer arietinum L.) Varieties.
A Thesis Submitted to School of Graduate Studies Hawassa University, Ethiopia.
Tesfahun Mekuanint, Yemane Tsehaye., and Yemane G/ Egziabher (2018). Response of Two
Chickpea (Cicer arietinum L.) Varieties to Rates of Blended Fertilizer and Row Spacing
at Tselemti District, Northern Ethiopia.Advance in Agriculture,
DOI.org/10.1155/2018/5085163.
Tewodros Tefera (2014). Determinants of Smallholder Pulse Market Orientation in Southern
Ethiopia. Asian Journal of Business Management, 6(2):97-103.
Tibebu Belete, Firew Mekbib and Million Eshete (2017). Assessment of Genetic Improvement in
Grain Yield Potential and Related Traits of Kabuli Type Chickpea (Cicer arietinum L.)
Varieties in Ethiopia (1974-2009). Advances in Crop Science and Technology, 5:3.
Tibebu Kochare (2019). Nutritional Quality, Animal Preferences and Seasonal Availability of
Feed Resources and Livestock- Feed Balance in Small and Fragmented Landholdings of
Wolayta Zone, Southern Ethiopia. PhD Dissertation Submitted to the College of
Veterinary Medicine and Agriculture of Addis Ababa University, Bishoftu, Ethiopia
Tokuma Legesse, Habtamu Demelash and Amare Seyoum (2019). Participatory Variety
Selection for Enhanced Promotion and Adoption of Improved Sorghum [Sorghum
bicolor (L) Moench] Varieties for the Humid Lowland of Assosa Zone, Western
Ethiopia. Scientific Research and Reviews, 12:104.
Tolera Adugna. (2008). Feed Resources and Feeding Management: Ethiopia Sanitary and
Phytosanitary Standards and Livestock & Meat Marketing Program (SPS- LMM, Texas

68
Agricultural Experiment Station (TAES)/Texas A&M University. A Manual for Feedlot
Operators and Development Workers, Addis Ababa, Ethiopia.
Tolera Adugna, Alemayehu Mengistu, Diriba Geleti, Getnet Assefa, Alemu Yami, Lemma
Gizachew and Yirdaw Wolde Semayat (2012). Livestock Feed Resources in Ethiopia:
Challenges, Opportunities and the Need for Transformation, Ethiopian Animal Feeds
Industry Association, Addis Ababa, Ethiopia.
Van Soest P.J. and Robertson J.B. (1985): Analysis of Forages and Fibrous Foods. A Laboratory
Manual for Animal Science. Cornel University, Ithaca. New York, USA, 202p.
Van Soest P.J. (1994). Nutritional Ecology of Ruminants, 2nd
Edition. Cornell University press.
London.
Varshney R.K., Song C., Saxena R.K., Azam S. and Yu S. (2013). Draft Genome Sequence of
Chickpea (Cicer arietinum L.) Provides A Resource for Trait Improvement. Nature
Biotechnology, 31(3): 240-246.
Wilson J.R., Deinum B. and Engels F.M. (1991). Temperature Influences on Anatomy and
Digestibility Leaf and Stem of Tropical and Temperate Forage Species. Netherland
Journal of Agricultural Science, 39: 1-31.
Witcombe J.R., Joshi A. and Goyal S.N. (2003). Participatory Plant Breeding in Maize for Low-
input Systems. A Case from Gujarat, India. Euphytica, 130: 413-422.
Wubetie Adnew , Berhanu Abraha , Asaminew Tassew and Bimrew Asmare (2018). Evaluation
of Morphological Characteristics, Yield and Nutritive Value of Brachiaria Grass
Ecotypes in North Western Ethiopia. Agriculture and Food Security, 7:89.
Wuletaw Mekuria, Kindu Mekonnen and Marelign Adugna (2018a). Farm Diversification in the
Central Highlands of Ethiopia: Patterns, Determinants and its Effect on Household
Income. Review of Agricultural and Applied Economics, 23 (1) 73-82.
Wuletaw Mekuria, Kindu Mekonnen, Peter Thorne, Melkamu Bezabih, Lulseged Tamene and
Wuletawu Abera (2018b). Competition for Land Resources: Driving Forces and
Consequences in Crop-Livestock Production Systems of the Ethiopian Highlands,
Ecological processes, 7:30.

69
Yassin Esmael, Beriso Bati, Shemalis Gizachew and Asfew Negase(2019). Livestock Production
System and their Constraints in West Arsi Zone, Oromia National Regional State,
Ethiopia. International Journal of Biomedical Science and Engineering, 7(4): 79-84.
Yasin Goa and Mathewos Ashamo (2016). Yield Performancend Adaptation of Desi Chickpea
Varieties in Selected Districts of Wolayta and Hadiya Zones of South Ethiopia.
International Journal of Research – Granthaalayah, 4 (3): 33-41.
Yasin Goa, Demelash Bassa, Genene Gezahagn and Mekasha Chichaybelew (2017). Farmers
Participatory Evaluation of Chickpea Varieties in Mira Badwacho and Damot Fullasa
Districts of Southern Ethiopia. Hydrology Current Research, 8:1.
Yassin Gao and Genene Gezahegn (2018). Introduction of Desi Chickpea Varieties Through
Participatory Variety Selection: A Case for Konta and Tocha Districts in Southern
Ethiopia. Journal of Genetics and Genomes, 2:1.
Yayneshet Tesfay, Abrehaley Gebrelibanos, Dawit Woldemariam and Haile Tilahun (2016).
Feed Resources Availability, Utilization and Marketing in Central and Eastern Tigray,
Northern Ethiopia. LIVES Working Paper 11. Nairobi, Kenya: International Livestock
Research Institute (ILRI).
Yitbarek Tegegne (2017). Factors Affecting Adoption of Legume Technology and Its Impact on
Income of Farmers: The Case of Sienna and Ginir Woredas of Bale Zone. M.Sc. Thesis
Submitted to School of Graduate Studies of Haramaya University, Ethiopia

70
7. APPENDIX
Part Ⅰ. Questionnaires
General Information
No. Question Response Code
Q1 Name of enumerator To be coded ,after the data collected
Q2
Date of interview
(DD/MM/YYYY)
No need code
Q4 District/Woreda To be coded ,after the data collected
Q5 PA/Kebele To be coded ,after the data collected
Q6 Village No need code
Demographic and Socio-economic Information about the Household Head and the
Household
No. Question (Instructions) Response Code
1 What is your name? (write the name of
respondent )
Respondent
name……………………
Need to ID
2 What is your Marital status ? Single 1
Marriage 2
Divorced 3
Widow 4
3 What is your main occupation? Agriculture 1
Trade 2
Public service 3
Agriculture and trade 4
Other, specify…. 5
4 Educational status of the respondent
and if applicable in years of education
Illiterate 1
Read and write 2
Formal education(…………..) 3
Religious education 4

71
5 What is your relationship to the
household head?
(Circle the appropriate code)
1
2
3
6 What is the name of the household
head?
7 What is the gender of the household
head?
(Don‟t ask this question, just circle
appropriate code)
Female 0
Male 1
8 What is the household head‟s age in
years?
Years
9 How many schooling years did the
household head complete?
Years
10 What is the household head‟s
experience in farming practices?
Years
11 What is the total number of persons
currently living in the household?
________ Male ________ Female
12 In the last agricultural year (2011 EC), how many
household members were engaged in agricultural
activities?
________ Male ________
Female
Livestock and landholding
Livestock type How many do you currently own?
1
.
Milking cows
2
.
Non milking cows (mature)
3
.
Trained oxen for plowing
4
.
Bulls
5
.
Heifers
6
.
Calves

72
7
.
Mature goats
8
.
Young goats
9
.
Mature sheep
10
.
Young sheep
11
.
Donkeys
12
.
Horses
13
.
Mules
14
.
Mature chicken
15
.
Traditional bee hives
16
.
Modern bee hives
Land Holding
Land category
Cultivated land size
(cereals, legumes,
vegetables etc; in ha )
Uncultivated land size
(e.g. grazing,
homestead etc; in ha)
Forage production in
ha
Own land used
Rented/shared in land
Rented/shared out
land
Crop production and yield
Crop type Land allocated in ha Yield (q/ha)
Wheat
Barely
Chickpea
Faba bean
Field bean
Lentil

73
Linseed
Chickpea production
1. Have you ever planted any improved Kabuli chickpea variety during the last five years?
1 = Yes 0 = No
2. Do you remember when you planted improved Kabuli chickpea variety varieties for the first
time 1 = Yes, when? 0 = No
3. Have you been growing improved Kabuli chickpea continuously since you first planted it?
1 = Yes 0 = No
4. Have you ever planted any improved Desi chickpea variety during the last five years?
1 = Yes 0 = No
5. Where did you get the seed of the first improved Desi chickpea varieties? (if you get more
than one source pleas select all sources)1. Neighbor farmer(s) 2. Local market 3. Office
of agriculture 4. NGO in the area 5. Seed trader(s) 6. Farmers‟ cooperative 7. Research
centers 8. Local grocery shop 9. Relatives and friends 10. University 11.Other5
(specify)_____
6. Do you remember when you planted improved Desi chickpea variety for the first time?
1 = Yes, when? 0 = No
7. What is the most important factor (criteria) you consider in your varietal selection?
8. Chickpea variety selection criteria (select the selection criteria and separate in comma)
a. Early maturing
b. Good price and acceptance in the market
c. Resistance to disease
d. Accepted by the land (soil) conditions and suitable for local environment
e. Good productivity
f. Multipliable
g. Large seed size
h. Resistant to drought
i. Good straws for livestock
j. Other factors

74
Feed resources and feeding strategies
1. List most commonly used feed resources for your livestock in ranking order from topmost
ⅰ. ___________________________________
ⅱ. _________________________________
ⅲ. ___________________________________
ⅳ. ___________________________________
2. If you used crop residues, please respond the following question.
3. How many cropping seasons do you have per annum? __________________
4. Do you get enough year-round supply of crop residues? 1. Yes 0. No
5. If no, what is the reason? ________________________________________
6. Do you store surplus crop residues? 1. Yes 0. No
7. If yes, how? A. stacked outside B. stacked under shed C. baled outside D. baled under
shed E. others (specify) _____________________
8. 8. When do you start feeding of stored crop residue for your animals?
A. at the beginning of the dry season B. at the middle of the dry season C. at the end of
the dry season D. at the beginning of the rainy season
9. What type of crop residues are mostly used for livestock feeding?
___________________________________
10. Do you feed legume crop residues for your livestock? 1. Yes 0. No
11. If yes, what is the major legume haulms commonly used for your livestock in a ranking order
from top most
ⅰ. ___________________________________
ⅱ. ___________________________________
ⅲ. ___________________________________
9. If no, what are the reasons? __________________________________
10. Do you use chickpea haulm as livestock feed resources? 1. Yes 0. No
11. If yes, when you used? A. just as soon as threshing B. after store some time C. other
(specify)_________________________
12. For how long you store chickpea straw

75
Preference of chickpea Cultivar straw and Feeding systems chickpea straw
1. Which chickpea varieties do you prefer to feed your livestock? A. Dese type B. kabuli type
2. Which livestock do you feed chickpea straw? A. Large ruminants B. Small ruminants C.
Equines
3. How do you feed chickpea straws for your livestock?
A. solely B. mixed with cereal straws C. mixed with other supplements D. others (specify)
______________________
4. How/when/ do you feed chickpea straws?
Fresh………………… Dry…………………. Why...
5. For which type of animal, you offered chickpea haulms mostly? A. Small ruminants
…………B. Large ruminants…………………. C. Equines ………D. Other
(specify)_________________________
6. How often do you feed chickpea straws? ________________________
7. Which chickpea varieties are preferred by.
Small ruminants______________________________________________________
Large ruminants______________________________________________________
Equines_____________________________________________________________
Other (specify)_________________________
End
Thank you very much for your cooperation and time!!

76
Part Ⅱ. Conversion factors and other tables
Appendix Table 1. Conversion factors used to calculate Tropical Livestock Units (TLU)
Livestock category Conversion factor
Calf 0.25
Heifer and Bull 0.75
Cow and ox 1.00
Mature sheep and mature goat 0.13
Young sheep and young goat 0.06
Donkey 0.7
Horse 1.1
Chicken 0.013
Source. Storck et al., 1991
Appendix Table 2. Livestock holding and species composition per HH per TLU
Livestock
category
Kebeles
Herd structure Lemlem
Chefe
Girimi Adadi Goli Overall
Mean±SE Mean±SE Mean±SE
Cattle Milking cows 0.24±0.07 0.22±0.07 0.24±0.07 0.23±0.04 ns
Non milking
cows
0.24±0.07 0.22±0.07 0.24±0.07 0.23±0.04 ns
Trained oxen 2.88±0.18a 1.74±0.16
b 2.36±0.21
a 2.33±0.11 ***
Bulls 0.63±0.10a 0.35±0.08
b 0.73±0.13
a 0.57±0.06 *
Heifers 0.435±0.075 0.285±0.06
0
0.405±0.06
1
0.375±0.038 ns
Calves 0.23±0.04 0.20±0.03 0.21±0.02 0.21±0.02 ns
Goats Mature 0.05±0.02 0.01±0.00 0.01±0.01 0.04±0.01 ns
Young 0.03±0.01 0.01±0.01 0.01±0.01 0.01±0.01 ns

77
Sheep Mature 0.30±0.05 0.30±0.10 0.40±0.10 0.31±0.03 ns
Young 0.10±0.01 0.05±0.01 0.08±0.01 0.06±0.01 ns
Equines Donkeys 1.47±0.11 1.13±0.08 1.3±0.11 1.31±0.10 ns
Horses 0.10±0.04 0.00±0.00 0.10±0.04 0.05±0.02 ns
Chickens Mature 0.05±0.01 0.04±0.00 0.10±0.01 0.06±0.01 ***
Beehives Traditional 0.06±0.04 0.00±0.00 0.10±0.05 0.05±0.02 ns
Modern 0.18±0.07 0.06±0.06 0.04±0.03 0.09±0.03 ns
Livestock ownership in TLU 7.34±0.44a 5.13±0.30
b 6.90±0.42
a 6.44±0.24
a, b Mean values with different superscripts in a row indicate statistically significant differences
among kebeles at * (p<0.05), *** (p<0.001), probability level. SE= standard error,
TLU=Tropical livestock unit, HH= Household
Appendix Table 3. Analysis of variance for the yield and yield related traits of chickpea
varieties
Dependent Variable: GY
Sum of
Source DF Squares Mean Square F Value Pr > F
Model 10 2.95287500 0.29528750 18.92 <.0001
Error 21 0.32772500 0.01560595
Corrected Total 31 3.28060000
R-Square Coeff Var Root MSE GY Mean
0.900102 12.18769 0.124924 1.025000
Source DF Type III SS Mean Square F Value Pr > F
Var 7 2.74150000 0.39164286 25.10 <.0001
Block 3 0.21137500 0.07045833 4.51 0.0136
Dependent Variable: HY _
Sum of
Source DF Squares Mean Square F Value Pr > F
Model 10 3.62997500 0.36299750 4.33 0.0023
Error 21 1.76122500 0.08386786

78
Corrected Total 31 5.39120000
R-Square Coeff Var Root MSE SY_ Mean
0.673315 13.48542 0.289599 2.147500
Source DF Type III SS Mean Square F Value Pr > F
Var 7 2.28200000 0.32600000 3.89 0.0072
Block 3 1.34797500 0.44932500 5.36 0.0067
Dependent Variable: HI
Sum of
Source DF Squares Mean Square F Value Pr > F
Model 10 0.10214481 0.01021448 6.67 0.0001
Error 21 0.03214209 0.00153058
Corrected Total 31 0.13428690
R-Square Coeff Var Root MSE HI Mean
0.760646 12.17042 0.039123 0.321456
Source DF Type III SS Mean Square F Value Pr > F
Var 7 0.09102333 0.01300333 8.50 <.0001
Block 3 0.01112148 0.00370716 2.42 0.0944
Dependent Variable: HDMY
Sum of
Source DF Squares Mean Square F Value Pr > F
Model 10 2.00177675 0.20017768 1.77 0.1304
Error 21 2.37790925 0.11323377
Corrected Total 31 4.37968600
R-Square Coeff Var Root MSE HDMY Mean
0.457059 17.30089 0.336502 1.945000
Source DF Type III SS Mean Square F Value Pr > F
Var 7 0.88737150 0.12676736 1.12 0.3879
Block 3 1.11440525 0.37146842 3.28 0.0411

79
Dependent Variable: PUI
Sum of
Source DF Squares Mean Square F Value Pr > F
Model 10 0.07333025 0.00733302 1.66 0.1582
Error 21 0.09292963 0.00442522
Corrected Total 31 0.16625988
R-Square Coeff Var Root MSE PUI Mean
0.441058 13.78910 0.066522 0.482427
Source DF Type III SS Mean Square F Value Pr > F
Var 7 0.02294102 0.00327729 0.74 0.6408
Block 3 0.05038923 0.01679641 3.80 0.0255
Appendix Table 4. Analysis of variance for the chemical composition of chickpea varieties
haulms
Dependent Variable: DM___
Sum of
Source DF Squares Mean Square F Value Pr > F
Model 10 1.81565625 0.18156563 6.20 0.0002
Error 21 0.61479062 0.02927574
Corrected Total 31 2.43044688
R-Square Coeff Var Root MSE DM___ Mean
0.747046 0.189152 0.171102 90.45719
Source DF Type III SS Mean Square F Value Pr > F
Block 3 1.45673438 0.48557813 16.59 <.0001
Var 7 0.35892188 0.05127455 1.75 0.1511
Dependent Variable: Ash___
Sum of
Source DF Squares Mean Square F Value Pr > F
Model 10 26.13218125 2.61321813 6.77 0.0001

80
Error 21 8.10524062 0.38596384
Corrected Total 31 34.23742188
R-Square Coeff Var Root MSE Ash___ Mean
0.763264 7.596315 0.621260 8.178438
Source DF Type III SS Mean Square F Value Pr > F
Block 3 18.25358438 6.08452813 15.76 <.0001
Var 7 7.87859688 1.12551384 2.92 0.0269
Dependent Variable: CP___
Sum of
Source DF Squares Mean Square F Value Pr > F
Model 10 39.56670625 3.95667062 9.37 <.0001
Error 21 8.87181563 0.42246741
Corrected Total 31 48.43852188
R-Square Coeff Var Root MSE CP___ Mean
0.816844 15.95642 0.649975 4.073438
Source DF Type III SS Mean Square F Value Pr > F
Block 3 33.09870937 11.03290312 26.12 <.0001
Var 7 6.46799688 0.92399955 2.19 0.0781
Dependent Variable: NDF___
Sum of
Source DF Squares Mean Square F Value Pr > F
Model 10 321.9581313 32.1958131 4.46 0.0019
Error 21 151.4938406 7.2139924
Corrected Total 31 473.4519719
R-Square Coeff Var Root MSE NDF___ Mean
0.680023 4.846778 2.685888 55.41594
Source DF Type III SS Mean Square F Value Pr > F
Block 3 190.5797844 63.5265948 8.81 0.0006

81
Var 7 131.3783469 18.7683353 2.60 0.0423
Dependent Variable: ADF___
Sum of
Source DF Squares Mean Square F Value Pr > F
Model 10 315.0928250 31.5092825 6.07 0.0003
Error 21 108.9881750 5.1899131
Corrected Total 31 424.0810000
R-Square Coeff Var Root MSE ADF___ Mean
0.743002 5.121425 2.278138 44.48250
Source DF Type III SS Mean Square F Value Pr > F
Block 3 224.2398250 74.7466083 14.40 <.0001
Var 7 90.8530000 12.9790000 2.50 0.0490
Dependent Variable: ADL___
Sum of
Source DF Squares Mean Square F Value Pr > F
Model 10 16.37227500 1.63722750 8.88 <.0001
Error 21 3.87352500 0.18445357
Corrected Total 31 20.24580000
R-Square Coeff Var Root MSE ADL___ Mean
0.808675 4.182913 0.429481 10.26750
Source DF Type III SS Mean Square F Value Pr > F
Block 3 12.48247500 4.16082500 22.56 <.0001
Var 7 3.88980000 0.55568571 3.01 0.0235
Dependent Variable: ME_
Sum of
Source DF Squares Mean Square F Value Pr > F
Model 10 2.93685000 0.29368500 5.17 0.0008
Error 21 1.19315000 0.05681667
Corrected Total 31 4.13000000
R-Square Coeff Var Root MSE ME_MJ_Kg_ Mean

82
0.711102 3.330248 0.238362 7.157500
Source DF Type III SS Mean Square F Value Pr > F
Block 3 1.32705000 0.44235000 7.79 0.0011
Var 7 1.60980000 0.22997143 4.05 0.0059
Dependent Variable:IVOMD___
Sum of
Source DF Squares Mean Square F Value Pr > F
Model 10 133.8051813 13.3805181 6.50 0.0002
Error 21 43.2254406 2.0583543
Corrected Total 31 177.0306219
R-Square Coeff Var Root MSE IVOMD___ Mean
0.755831 2.939256 1.434697 48.81156
Source DF Type III SS Mean Square F Value Pr > F
Block 3 70.60338437 23.53446146 11.43 0.0001
Var 7 63.20179688 9.02882813 4.39 0.0039
Dependent Variable: RFV
Sum of
Source DF Squares Mean Square F Value Pr > F
Model 10 3661.456956 366.145696 6.43 0.0002
Error 21 1194.993477 56.904451
Corrected Total 31 4856.450433
R-Square Coeff Var Root MSE RFV Mean
0.753937 8.157474 7.543504 92.47353
Source DF Type III SS Mean Square F Value Pr > F
Block 3 3118.982869 1039.660956 18.27 <.0001
Var 7 542.474088 77.496298 1.36 0.2721
Dependent Variable: Cellulose

83
Sum of
Source DF Squares Mean Square F Value Pr > F
Model 10 195.0846000 19.5084600 5.14 0.0008
Error 21 79.7086000 3.7956476
Corrected Total 31 274.7932000
R-Square Coeff Var Root MSE cellulose Mean
0.709932 5.694117 1.948242 34.21500
Source DF Type III SS Mean Square F Value Pr > F
Block 3 135.2743000 45.0914333 11.88 <.0001
Var 7 59.8103000 8.5443286 2.25 0.0710
Dependent Variable: Hemicellulose
Sum of
Source DF Squares Mean Square F Value Pr > F
Model 10 12.67595625 1.26759562 1.08 0.4179
Error 21 24.61356563 1.17207455
Corrected Total 31 37.28952188
R-Square Coeff Var Root MSE hemicellulose Mean
0.339933 9.901954 1.082624 10.93344
Source DF Type III SS Mean Square F Value Pr > F
Block 3 6.92660938 2.30886979 1.97 0.1494
Var 7 5.74934688 0.82133527 0.70 0.6713
Appendix Table 5. Summary on analysis of variance for in sacco dry matter degradability of
chickpea varieties haulms
Incubation
time (hr)
DF Sum
Squares
Mean
Square
F
Value
Pr > F Root
MSE
CV R Square
0 7 68.7738 9.8248 78.60 <.0001 0.3536 1.8275 0.9717
6 7 659.0068 94.1438 13.17 <.0001 2.6739 9.1745 0.8521
12 7 629.8948 89.9850 22.02 <.0001 2.0217 5.8217 0.9059

84
24 7 574.0689 82.0099 112.99 <.0001 0.8520 1.9446 0.9802
48 7 404.6831 57.8119 34.14 <.0001 1.3012 2.5418 0.9373
72 7 513.3001 73.3286 42.93 <.0001 1.3069 2.4337 0.9495
96 7 818.6695 116.9528 67.36 <.0001 1.3177 2.3542 0.9672
Appendix Table 6.Summary on analysis of variance for in sacco dry matter degradability
characteristics of chickpea varieties haulm
Param
eters
DF Sum Squares Mean Square F Value Pr > F Root
MSE
CV R
Square
a 7 112.3616 16.0517 13.45 <.0001 1.0925 5.5707 0.8726
b 7 261.3867 37.3410 8.57 0.0004 2.0877 5.7815 0.8113
c 7 0.0018 0.0003 11.49 <.0001 0.0047 10.0197 0.8556
PD 7 482.2221 68.88888 32.50 <.0001 1.4560 2.6129 0.9423
ED 7 443.37596 63.33942 115.72 <.0001 0.7399 1.7841 0.9831
a = soluble fraction, b = slowly degradable fraction, c = rate of degradation, PD = potential
degradability, ED = effective degradability, SE= standard error of mean
Appendix Table 7. Name of varieties and assigned entry number
Local #1 , Ararti#2, Hora#3, Ejerie#4, Teketay#5 Minijar#6 Dalota#7
DZ-0058#8
Farmer I (Layout and Randomization)
variety # 7 5 8 4 6 3 1 2
Farmer II (Layout and Randomization)
variety # 1 7 4 2 8 5 6 3
Farmer III (Layout and Randomization)
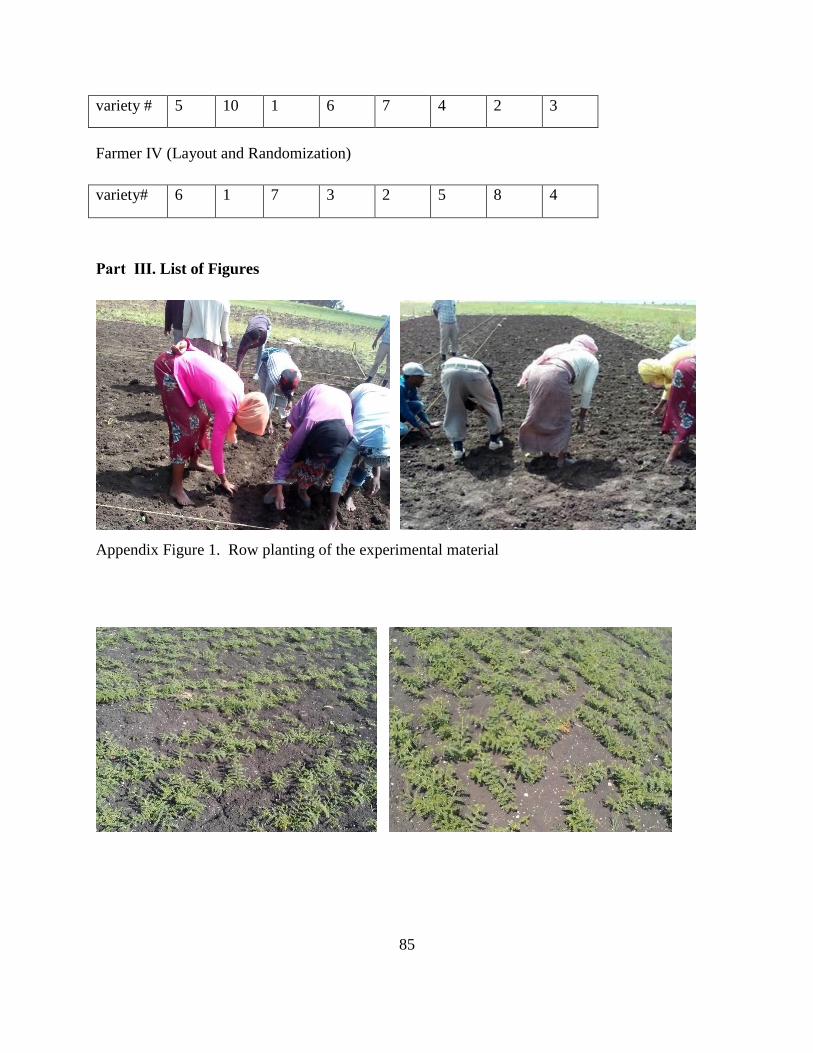
85
variety # 5 10 1 6 7 4 2 3
Farmer IV (Layout and Randomization)
variety# 6 1 7 3 2 5 8 4
Part Ⅲ. List of Figures
Appendix Figure 1. Row planting of the experimental material

86
Appendix Figure 2. Pictures of some experiment material plot
Appendix Figure 3. Farmer‟s participation during varieties selection
Copyright © 2022 FDOKUMEN