Phosphorus Requirement of Chickpea (Cicer ... - Thesis
140
Phosphorus Requirement of Chickpea (Cicer arietinum L.) Irrigated with Chloride and Sulphate Dominated Saline Water DyksjkbM ,oa lYQsV ;qDr yo.kh; ikuh ls flafpr pus ¼lkblj ,jsVhue~½ esa QkLQksjl dh vko’;drk Sita Ram Jat Thesis Master of Science in Agriculture 2011 Department of Soil Science and Agricultural Chemistry S.K.N. COLLEGE OF AGRICULTURE, JOBNER - 303329 SWAMI KESHWANAND RAJASTHAN AGRICULTURAL UNIVERSITY, BIKANER
-
Upload
khangminh22 -
Category
Documents
-
view
0 -
download
0
Transcript of Phosphorus Requirement of Chickpea (Cicer ... - Thesis

Phosphorus Requirement of Chickpea (Cicer arietinum L.) Irrigated with Chloride and
Sulphate Dominated Saline Water
DyksjkbM ,oa lYQsV ;qDr yo.kh; ikuh ls flafpr pus ¼lkblj ,jsVhue~½ esa
QkLQksjl dh vko’;drk
Sita Ram Jat
Thesis
Master of Science in Agriculture
2011
Department of Soil Science and Agricultural Chemistry
S.K.N. COLLEGE OF AGRICULTURE, JOBNER - 303329
SWAMI KESHWANAND RAJASTHAN AGRICULTURAL UNIVERSITY,
BIKANER

Phosphorus Requirement of Chickpea (Cicer arietinum L.) Irrigated with Chloride and Sulphate
Dominated Saline Water
DyksjkbM ,oa lYQsV ;qDr yo.kh; ikuh ls flafpr pus ¼lkblj ,jsVhue ,y-½
esa QkLQksjl dh vko’;drk
Thesis
Submitted to the
Swami Keshwanand Rajasthan Agricultural
University, Bikaner
in partial fulfilment of the requirement
for the degree of
Master of Science
in the
Faculty of Agriculture
(Soil Science & Agricultural Chemistry)
By
Sita Ram Jat

2011
Swami Keshwanand Rajasthan Agricultural University, Bikaner S.K.N. College of Agriculture, Jobner
CERTIFICATE- I
Dated : ----------2011
This is to certify that Mr. Sita Ram Jat has successfully
completed the comprehensive examination held on ……………….. as
required under the regulation for Master’s degree.
(B.L. Yadav)
Head
Department of Soil Science and Agril. & Chem.
S.K.N. College of Agriculture,
Jobner

Swami Keshwanand Rajasthan Agricultural University, Bikaner S.K.N. College of Agriculture, Jobner
CERTIFICATE- II
Dated :…………2011
This is to certify that the thesis entitled “Phosphorus
Requirement of Chickpea (Cicer arietinum L.) Irrigated with
Chloride and Sulphate Dominated Saline Water” submitted for the
degree of Master of Science in the subject of Soil Science and
Agricultural Chemistry embodies bonafide research work carried out
by Mr. Sita Ram Jat under my guidance and supervision and that no
part of this thesis has been submitted for any other degree. The
assistance and help received during the course of investigation have
been fully acknowledged. The draft of the thesis was also approved by
the advisory committee on …………….
(B.L. Yadav)
Head
Department of Soil Science and Agricultural Chemistry
(B.L. Yadav)
Major Advisor
(G.L. KESHWA)
Dean

S.K.N. College of Agriculture, Jobner
Swami Keshwanand Rajasthan Agricultural University, Bikaner S.K.N. College of Agriculture, Jobner
CERTIFICATE- III
Dated :----------- 2011
This is to certify that the thesis entitled “Phosphorus
Requirement of Chickpea (Cicer arietinum L.) Irrigated with
Chloride and Sulphate Dominated Saline Water” submitted by
Mr. Sita Ram Jat to the Swami Keshwanand Rajasthan Agricultural
University, Bikaner, in partial fulfilment of the requirements for the
degree of Master of Science in the subject of Soil Science and
Agricultural Chemistry after recommendation by the external
examiner, was defended by the candidate before the following members
of the advisory committee. The performance of the candidate in the oral
examination on his thesis has been found satisfactory. We therefore,
recommend that the thesis be approved.
(B.L. YADAV) (S.R. SHARMA)
Major Advisor Advisor
(L.R. YADAV) (S.C. Jain)
Advisor Dean, PGS, Nominee
(B.L. YADAV) (G.L. KESHWA)
Head DEAN
Department of Soil Science S.K.N. College of Agriculture,
& Agricultural Chemistry Jobner
Approved

DEAN
POST GRADUATE STUDIES
Swami Keshwanand Rajasthan Agricultural University, Bikaner S.K.N. College of Agriculture, Jobner
CERTIFICATE- IV
Dated :----------- 2011
This is to certify that Mr. Sita Ram Jat of the Department of Soil
Science and Agricultural Chemistry, S.K.N. College of Agriculture,
Jobner has made all corrections/modifications in the thesis entitled
“Phosphorus Requirement of Chickpea (Cicer arietinum L.)
Irrigated with Chloride and Sulphate Dominated Saline Water”
which were suggested by the external examiner and the advisory
committee in the oral examination held on --------------2011. The final
copies of the thesis duly bound and corrected were submitted on ---------
-----2011 and forwarded herewith for approval.
(B.L. YADAV)
Major Advisor
(B.L. YADAV)
Head
Department of Soil Science & Agricultural Chemistry S.K.N. College of Agriculture, Jobner
(G.L. KESHWA)
DEAN
S.K.N. College of Agriculture, Jobner
Approved

DEAN, PGS
SKRAU, Bikaner
Contents
Chapter No.
Particulars Page No.
1.
Introduction
………..
2. Review of Literature ………..
3. Materials and Methods ………..
4. Results ………..
5. Discussion ………..
6. Summary and Conclusion ………..
Bibliography ………..
Abstract (English) ………..
Abstract (Hindi) ………..
Appendix ………..

Table No.
Particulars Page No.
3.1 Mean weekly parameters for the period of experimentation
(2010-11) ………
3.2 Physico-chemical properties of original soil ………
3.3 Composition of irrigation water
3.4 Methods of soil and plant analysis ………
4.1 Effect of salinity of water (EC) and phosphorus on total and
effective number of root nodules and nodule index ………
4.2 Effect of salinity of water (EC) and phosphorus on plant
height (cm) and test weight (g) ………
4.3 Effect of salinity of water (EC) and phosphorus on number of
pods per plant and seeds per pod ………
4.4 Combined effect of salinity of water (EC) and phosphorus on
pods per plant ………
4.5 Effect of salinity of water (EC) and phosphorus on grain and
stover yield ………
4.6 Combined effect of salinity of water (EC) and phosphorus on
grain yield (g/pot) ………
4.7 Combined effect of salinity of water (EC) and phosphorus on
stover yield (g/pot) ………
4.8 Effect of salinity of water (EC) and phosphorus on
phosphorus content (%) in root and shoot and P-mobility
ratio at flowering stage
………
4.9 Effect of salinity of water (EC) and phosphorus on
phosphorus content (%) in root, stover and grain and P-
mobility ratio at harvest stage
………
4.10 Effect of salinity of water (EC) and phosphorus on nitrogen
and potassium content (%) in grain and stover ………
4.11 Effect of salinity of water (EC) and phosphorus on sulphur
content (%) in grain and stover ………
4.12 Effect of salinity of water (EC) and phosphorus on calcium,
magnesium and sodium content (%) in grain and stover ………
4.13 Effect of salinity of water (EC) and phosphorus on chloride
content in grain and stover ………
List of Tables

Table
No.
Particulars Page
No.
4.14 Effect of salinity of water (EC) and phosphorus on EC
(dSm-1), pH and SAR of soil after harvest of crop ………
4.15 Effect of salinity of water (EC) and phosphorus on available
phosphorus, sulphur and chloride content in soil after
harvest of crop
………
4.16 Effect of salinity of water (EC) and phosphorus on Na/K and
Ca/Mg ratio in grain and stover ………
4.17 Effect of salinity of water (EC) and phosphorus on Na+K/Ca
and Na/Ca ratio in grain and stover ………
4.18 Effect of salinity of water (EC) and phosphorus on ionic
regulation index for Ca, Na and K at harvest stage of crop ………
4.19 Effect of salinity of water (EC) and phosphorus on degree of
compartmentation at flowering stage ………
List of Tables

Figures
No.
Particulars Between
pages
3.1 Mean weekly parameters for the period of experimentation
(2010-11) ………
4.1 Combined effect of salinity of water (EC) and phosphorus
on pods per plant ………
4.2 Combined effect of salinity of water (EC) and phosphorus
on grain yield (g/pot) ………
4.3 Combined effect of salinity of water (EC) and phosphorus
on stover yield (g/pot) ………
List of Figures

Figures No.
Particulars Page No.
I Interrelationship (correlation) between grain yield, stover
yield, P content in grain and stover, P-mobility ratio at
harvest and soil physico-chemical properties of soil
………
II Analysis of variance for total and effective number of root
nodules and nodule index
III Analysis of variance for plant height (cm) and test weight (g) ………
IV Analysis of variance for number of pods per plant and seeds
per pod ………
V Analysis of variance for grain and stover yield ………
VI Analysis of variance for phosphorus content (%) in root and
shoot and mobility ratio at flowering stage ………
VII Analysis of variance for phosphorus content (%) in root,
stover and grain and mobility ratio at harvest stage ………
VIII Analysis of variance for nitrogen and potassium content (%)
in grain and stover ………
IX Analysis of variance for sulphur content (%) in grain and
stover ………
X Analysis of variance for calcium, magnesium and sodium
content (%) in grain and stover ………
XI Analysis of variance for chloride content in grain and stover ………
XII Analysis of variance for EC (dSm-1), pH and SAR of soil
(after harvest of crop) ………
XIII Analysis of variance for available phosphorus, sulphur and
chloride content in soil after harvest of crop ………
XIV Analysis of variance for Na/K and Ca/Mg ratio in grain and
stover ………
XV Analysis of variance for Na+K/Ca and Na/Ca ratio in grain
and stover ………
XVI Analysis of variance for ionic regulation index for Ca, Na and
K at harvest stage of crop ………
XVII Analysis of variance for degree of compartmentation at
flowering stage ………
List of Appendices

Acknowledgements
I take great pleasure to express my intense sense of gratitude to modest, industrious,
generous and courteous personality Dr. B.L. Yadav, Head, Department of Soil Science & Agricultural Chemistry, S.K.N. College of Agriculture, Jobner for suggesting and planning the present investigation, valuable guidance, helpful criticism and constant encouragement throughout
the course of investigation and preparation of this manuscript.
I am highly thankful to members of my advisory committee namely, Dr. S.R. Sharma, Associate Professor, Department of Soil Science and Agricultural Chemistry, Dr. L.R. Yadav,
Associate Professor, Department of Agronomy and Dr. S.C. Jain, Associate Professor, Department of Plant Pathology (Dean, PGS nominee) for their valuable guidance during the course of study.
Words can hardly acknowledge the help made by Dr. S.P. Majumdar, Ex-Prof., Head, Deptt. Soil Science and Agril. Chemistry and Dr. B.L. Kakraliya, Head, Department of Plant Physiology for providing necessary facilities and benevolent patronage.
I wish to record my cordial thanks to Dr. G.L. Keshwa, Dean, S.K.N. College of Agriculture, Jobner for providing necessary facilities during the study.
I feel gratified to record by cordial thanks to Dr R. S. Manohar and Dr. K.K. Sharma, Associate Professors, Sh. K.S. Manohar Assistant Professors, Sh. Teja Ram Boori, Sh. S.K. Kala
and B.R. Singh and other staff members of the Department of Soil Science and Agril. Chem. for their ready help whenever needed during the course of investigation.
Also the help rendered by my seniors Sita Ram Kumawat, Alka Choudhary, Rajendra
Bhanwaria, Manjeet Singh, Sita Kumawat, Pardeep Kumar, Bhoop Singh, Sewa Ram, colleagues Bhanwar Lal Meena, Kamla Choudhary, dear juniors Sita Ram, Raj Kumar, Champa Lal, Surendra, Hansa and friends Gangraj, Nema Ram, Dinesh, Gangaram, Rajendra, Mukesh,
Shankar, Rajesh, J.P. Bishnoi, Arvind ji, Vishnu ji and Hukma Ramji during study period is duly acknowledged for their regular support, motivation and inspiration.
My vocabulary falls short to express heartiest regards to my grand parents Late Sh.Kalu Ram Godara and Smt. Jayani Devi and my parents Sh. Kumbha Ram Godara and Smt. Jayani Devi whose consistent encouragement and blessings are beyond my expression that brought me here up to dream without which it could not have been sketched. I tender my deep affection to my younger brothers Sh. Bhanwar Lal, Parmeshwar Lal, and Bhabi Ji Manju Devi and Jyoti Devi, , sister Suman and Jijaji Sh. Abhishek, Nephew and niece Bhavishya, Parushi for their great affection, constant inspiration and moral support during my education.
The credit goes to my wife Mrs. Santosh whose sincere and continuous encouragement were the constant source of inspiration which have been always and all ways with me.
I am also grateful to Sh. Shankar and Suresh Yadav, M/s. Vimal Computer's, Jobner, for typing the script neatly and efficiently within a very short period.
Lastly I just do not find the words how to express my heartful feeling to my esteemed
mother Smt. Jayani Devi whose blessing, desire and spiritual effect sustained my good academic as well as social career, as gratification I bow my head and seek more blessings.
Last but not the least, a million thanks to almighty GOD, who made me to this task and
made every job a success for me.
Place : Jobner Dated : / /2011 (Sita Ram Jat)

1. Introduction
In many parts of the arid and semi-arid regions, ground water is the
major or the only source of irrigation. The salinity and sodicity of soil and
inadequate supply of water, that too of poor quality, are some of the severe
problems faced by the farmers of arid and semi arid regions, which leads to
unsatisfactory returns from their lands. The major constituents of irrigation
water are sodium, calcium, magnesium as cations and chloride, sulphate and
bicarbonate as anions. However, potassium, nitrate and carbonate ions are
also present in appreciable amount in some cases. Boron is also found in low
concentrations in irrigation water. These salts affect the physical and chemical
properties of soil and ultimately crop growth. Sometimes the concentrations of
a particular ion becomes too high, which causes toxicity. Most of the ground
water are highly saline and dominated not only by Cl- salts but a considerable
proportion of them are dominated by SO42- salts as well.
The use of saline water for irrigation adversely affects productivity of
soil by influencing the uptake of nutrients and many soil properties (Chauhan
et al., 1988). This problem becomes more aggravated when the chloride and
sulphate of saline waters occur in association with calcium and sodium
creating the problem of salinity.
Plant growth is either depressed or entirely prevented due to excessive
build-up of salinity in soil due to irrigation with saline water. In addition to the
osmotic stress, crop productivity is adversely affected due to specific ion
toxicities, inadequate nutrient availability and cationic imbalances within the

plants. These soils, which are underlain with poor quality ground waters in the
arid and semi-arid regions tested low in organic matter and hence are poor in
fertility (Bajwa et al, 1998). Therefore, the importance of judicious
management of plant nutrients in these soils is as important as their
reclamation.
In saline water irrigated saline soils, availability of P decreases due to
precipitation of applied P, higher retention of soluble P, antagonism due to
excess Cl- and SO42- and restricted root growth. As phosphorus and Cl- are
adsorbed by essentially the same mechanism, excess concentration of Cl- in
highly saline soils may adversely affect the uptake of phosphorus (Chhabra et
al. 1976). Therefore, P content and uptake is generally lowered by soil
salinity. P is relatively immobile nutrient in saline soil and for its uptake, plant
roots must mine the soil. Increasing soil salinity restricts root growth that in
turn decreases the sunface area of the roots in contac t with soil P,
consequently P uptake is decreased.
The supply of phosphorus to legumes is more important than nitrogen.
Phosphorus is necessary for growth of Rhizobium bacteria, responsible for
nitrogen fixation through nodulation. Phosphorus application to legume not
only benefits the current crop but also has favorable affects on succeeding
non-legume crop. Phosphorus has beneficial effects on nodulation
stimulation, growth and also hastens maturity as well as improves quality of
crop produce. It also improves the crop quality and resistance to diseases. It
is a part of ADP, ATP, nucleic acid, flavin nucleotides, thiamine phosphate,
phospholipids and phosphorehytade sugar etc. It act as a energy storage and

transformation in plant it is also essential for cell division, protein synthesis,
root development, flowering, fruiting and seed formation. It also provides
strength to straw to prevent them from logging. In saline condition phosphorus
application makes tolerant to plant from salt concentrations.
India grows a large variety of pulses. The most popular being of which
are gram, moong, arhar, masur and urad. Pulses are grown annually in 23.86
million hectares with a production of 15.12 million tonnes in India, however its
average productivity is only 633 kgha-1 (MoA, 2008). Among total pulses,
gram (Cicer arietinum L.) is the major contributor. In India, gram grows in 7.58
million hectares with annual production of 6.91 million tonnes and an average
productivity of 911 kg ha-1 (MoA, 2008). Gram contributes near about 45 per
cent pulse in total pulses production of India. Gram is consumed as a dry
pulse crop or as a green vegetable with the former use being most common.
Seeds are sold in markets either dry or canned. Area under gram in India
accounted 7.97 million hectares and production was 7.06 million tones
(Annual report, 2008-09). Area under chickpea in Rajasthan accounted 17.38
lac hectare and production was 16 lac tones (Directorate of Agriculture
Rajasthan, Jaipur, 2010-11).
Chickpea is the major pulse crop mainly grown under unirrigated
condition during the Rabi season. Chickpea besides being a rich source of
highly digestible dietary protein (17-21 per cent), it is also rich in calcium, iron,
niacin, vitamin C and vitamin B, fat (5%) and carbohydrate (55%). Its leaves
contain malic acid which is very useful for stomach ailments and blood
purification. Chickpea can be used for various kinds of food preparation which

not only increases the taste but also the quality of food. Its seed and straw are
highly rich in nutrients and are mostly used as productivity ratio. The major
gram growing state in India are Madhyapradesh, Maharashtra, Rajasthan,
Uttar Pradesh, Andhra Pradesh, Karnataka, Gujarat, Chhatisagarh, Bihar,
Orissa, Tamil Nadu, Jharkhand, West Bengal and Haryana. Rajasthan
contributes 13.48 per cent area and 13.74 per cent production for gram during
2006-07 (Singh et al., 2009).
Chickpea is an important pulse crop but its productivity particularly in
saline soil is quite low because the cultivars grown are not so tolerant to
salinity. However, information on its P requirement for growth under Cl- and
SO42- dominated salinities is scanty. Therefore, the present investigation
entitled “Phosphorus requirement of chickpea [Cicer arietinum L.] irrigated
with chloride and sulphate dominated saline water” was undertaken with
the following objectives:
(i) To explore the effect of saline water and phosphorus on yield and nutrient content of
chickpea
(ii) To evaluate the effect of saline water and phosphorus on soil properties and
(iii) To study the effect of phosphorus on salinity tolerance of chickpea.

2. Review of literature
Importance of chickpea has bean amply recognized in India and
abroad as it is valuable asset for human nutrition, soil fertility and medicinal
use. A brief review related to different aspects of the experiment entitled
“Phosphorus requirement of Chickpea (Cicer arietinum L.) irrigated with
chloride and sulphate dominated saline water” is being presented in this
chapter. However, a very few studies have tackled the salinity effect on
response of chickpea, therefore, some references from other crops have been
reviewed.
2.1 Effect of saline waters on
2.1.1 Yield attributes and yield
Ashraf and Rasal (1988) working on two Vigna radiata cultivars,
reported that increasing salt concentration, significantly reduced the
percentage germination, fresh and dry weight, leaf area, shoot and root
length, shoot/root ratio.
Khandelwal et al. (1990) reported that grain yield of chickpea cultivars
decreased significantly with increasing level of salinity (EC) of irrigation water
from 0.8 to 6.0 dSm-1. None of the cultivars survive at 6.0 dSm-1.

Mathur and Lal (1998) reported highly significant reduction in plant
height, number of pods per plant, number of grains per pods, grain yield per
plant and harvest index of fenugreek genotypes due to increasing levels of
salinity in clay loam soil under pot condition.
Pathan et al. (2000) reported that plant height, seed index, seed and
straw yield of clusterbean decreased significantly with increasing levels of
ECe and adjusted SAR of irrigation water.
Nayak et al. (2001) observed an at par situation in case of mustard
crop with application of one saline water irrigation of 4 dSm-1 at branching
stage and two irrigation with BAW (best available water) gives at par seed
yield with that of 3 irrigations with BAW without increase the soil salinity.
Gururaja Rao et al. (2003) reported that the yield attributes like
tiller, panicle length and test weight, plant height and yield of wheat crop
decreased with increase in number of saline water irrigation at MT (maximum
tillering) stage and rest with BAW (Best available water) resulted in
significantly higher yield (28.1 g ha-1) over saline water given at CRI stage,
(27.2 q ha-1) and F.I. (flower initiation) stage, (27.4 q ha-1).
Netwal (2003) reported that increasing level of soil salinity decreased
the plant height, number of branches, number of pod per plant, number of
seeds per pod, seed index, seed and stover yield and harvest index of
cowpea. Kumawat (2004) observed that increasing level of EC iw decreased
the plant height, total number of nodule per plant, seed and straw yield and
seed index of fenugreek.

Anantharaju and Muthiah (2007) reported that germination percentage,
seedling growth and dry matter production decreased in different cultivars of
gram by using different concentration of salt solutions (0, 4, 8 and 12 dSm-1).
These different salinity levels were created by dissolving NaCl solution in
distilled water.
2.1.2 Nutrient concentration
Lal and Bhardwaj (1984) studied the effect of two levels of soils salinity
(ECe 4.0 and 8.0 dSm-1) on mineral composition of field pea and found that
higher dose (ECe 8.0) of salinity were more deleterious than the lower (ECe
4.0) ones.
Khandelwal et al. (1990) stated that N content in grain increased while,
P and K content decreased significantly with an increase in salinity of
irrigation water from 0.8 to 6.0 dSm-1.
Sudhakar et al. (1990) reported that lower dry weight of shoot and root
of green gram under salt stress condition and there was significant increase in
the levels of Na+, Ca++ and Cl- in shoot and root of the plant. On the other
hand, in horse gram the increase in the levels of Na +, Ca++ and Cl- was less
than that of green gram which did not decrease the dry weight of its seedlings.
Besides growth, suppression due to salinity, chickpea plants also showed
necrosis and salt injury on the main (or primary) stem, its lower leaves being
first to suffer (Sharma, 1990).

Gill and Sharma (1993) conducted an experiment with soybean and
reported that the protein content in soybean reduced by higher salinity due to
decrease in K+ and increase in Na+ accumulation.
Pathan et al. (2000) studied the effect of increasing level of EC and
adjusted SAR of irrigation water and reported increased content of N and Na
while decreased content of P, K and Ca in grain and straw of clusterbean.
Essa (2002) worked on different levels of salinities (0.5, 2.5, 4.5, 6.5
and 8.5 dSm-1) on soybean and found a significant increase in Na+, Cl- and
decrease in the accumulation of K+, Ca2+ and Mg2+ in the leaves of plants.
Virdiya et al. (2008) reported that the effect of K on groundnut (Cv.
GG2) under different level of salinity. In this case nutrient concentration in
groundnut pod, the N and P concentration was not significantly affected by
salinity levels or potassium. Whereas, K, Ca and Mg concentration decreased
significantly with increasing salinity levels, while, Na concentration increased
significantly.
2.1.3 Soil properties
Kanwar and Kanwar (1968) studied that increase in EC of water
lowered the pH of the saturation paste but increase of SAR raised it.
An increase in pH values with an increase in SAR of irrigation water
and decrease in pH values with an increase in salt concentration of irrigation
water was also reported by Lal and Lal (1980).

Yadav and Tomar (1982) in a pot experiment involving the effect of
saline and sodic water on soil characteristics using a normal soil of sandy
loam texture, found increased salinization and alkalization of soil with
increasing EC and RSC of irrigation water. Also at the same level of EC, use
of sodic waters decreased the ECe of soil whereas pH and SAR value of the
soil increased with an increase in the RSC of irrigation water from 5 to 15
meL-1.
A decrease in pH of soil with increasing EC of irrigation water was also
reported by Puntamkar et al. (1988)
Sharma (1988) reported that increase in ECe of soil with increasing EC
and Adj. SAR of irrigation water.
Kumawat (1989) observed that the increasing levels of EC and Adj.
SAR of irrigation water increased the ECe, SAR and ESP of soil.
Khandelwal et al. (1990) reported that ECe of soil after harvest of crop
was increased significantly with an increase in irrigation water while, pH of
saturation paste decreased significantly.
Khandelwal and Lal (1991) found that the ECe of soil increased with an
increase in EC of irrigation water, ESP and pH of the soil increased with an
increase in SAR of irrigation water
Moolchandani (1994) reported that salinity of irrigation water increased
the EC of soil, cations (except Na+) and anion content of soil and decreased
the pH and SAR of soil solution.

Netwal (2003) reported that the available NPK, organic carbon, pH,
ESP decreased with increasing level of salinity whereas, the ECe increased.
Kumawat (2004) reported that available NPK, organic carbon, pH, ESP
decreased with increasing levels of EC iw . The ECe of soil increased with
increasing levels of EC iw .
Sharma et al. (2007) reported that concentration value in soil would not
only increase with the increase in the ECe of soil, but would also vary with the
predominance of Cl or SO4 salts.
2.1.4 Computation of salinity tolerance
The plant characteristics related to sodicity tolerance have been
studied in several ways at various stages of crop growth. There is great
variation in relation to the same crop as observed by different workers working
under varying conditions and varying parameters of convenience (e.g. seed
germination and foliage symptoms in seedling) or relevance to their
immediate need (Rana and Singh, 1977), ability to establish and survive
under severely limiting environments, vegetative growth potential and capacity
to yield (grain in case of cereals) are the most desired characteristics but
these are not synonymous. From practical point of view, yield appears to be
more acceptable criteria to designate a crop as tolerant, semi tolerant or
susceptible.

Chhipa (1984) conducted pot and field experiment and concluded that
seed of tolerant varieties of wheat varying in sodicity tolerance having Na/K
ratio less than 0.25 or straw of any variety having Na/K ratio less than 0.6
(less than 1.2 at tillering stage) can be designated as tolerant to sodicity.
Gupta and Srivastava (1989) also observed that under salinity and
alkalinity stress in a tolerant genotype of wheat (Kharchia-65), Na exclusion
mechanism was operative, K was preferentially observed, Na + K/Ca ratio in
tolerant genotype remained low, while on susceptible genotype with an
increase in salinity-alkalinity, rise in Na + K/Ca ratio was more abrupt. It is
suggested that Ca absorption is more important in salinity/alkalinity tolerance.
Sharma and Manchanda (1989) concluded that irrigation for chickpea
with HCO3 dominated sodic waters, was not as harmful as its irrigation with Cl
dominated sodic waters of equal EC and Na contents.
Sharma (1996) observed that growth reduction caused by increased
sodium in soil was accompanied by increased plant Na+ and Cl- content, Na/K
ratio and decreased concentration of K.
Misra (2001) reported that zinc helped in narrowing Na/K and Na/Ca +
Mg ratio in plant tissue of chickpea indicating an increase in tolerance to
alkalinity.

Rajpaul et al. (2006) conducted an experiment in microplots (2 m x 2
m) with four varieties of okra and these are grown under irrigation with 0.65
(canal), 2.75, 5.0 and 8.5 dSm-1 saline water. Three amendments of FYM @
15 t/ha, FYM @ 15 t/ha + phosphorus @ 50 % above the recommended dose
and FYM 15 t/ha + phosphorus @ 100% above the recommended dose were
applied in the height EC saline water. The mean germination, high of plant,
number of plant and fresh yield per pot decreased significantly with increase
in the EC of irrigation water.
2.2 Effect of phosphorus on
2.2.1 Yield attributes and yield
Kasturikrishna and Ahlawat (1999) pointed out that pods per plant,
number of grains per pod, and test weight of pea (Pisum sativum) significantly
increased with the application of 26.2 kg P ha-1 over 13.1 kg P ha-1 and
control.
Agarwal and Meena (1999) observed that the increasing levels of
phosphorus and sulphur also increased the yield attributes and seed yield
significantly in fenugreek. The interactions, I x P or I x S and P x S were found
significant for seed yield, net return and B:C ratio.
Thakur et al. (1999) reported that the yield attributes and yield of
chickpea significantly were higher with the application of phosphorus

throughout SSP and DAP over rock phosphate. The grain, quality and uptake
of phosphorus also improved with the application of SSP and DAP @ 21.8
and 32.7 kg P/ha as compared to rock phosphate.
In field experiment, Patra and Bhattacharya (2000) recorded highest
pod yield of pea with the application of 30 kg P2O5 ha-1.
Kumawat (2004) observed that the increasing level of P increased the
plant height, total number of nodules per plant, seed and straw yield, seed
index, NPK content and uptake by seed and straw of fenugreek.
Jat (2004) reported that P and S had no significant effect on number
and dry weight of nodules per plant. Application of P and S upto 80 kg P2O5
ha-1 and 100 kg S ha-1 significantly increased the biological yield, N and P
uptake of fenugreek. Yadav and Luthra (2005) at Durgapura reported a
significant increase in yield of pea up to 40 kg P2O5 ha-1.
Meena et al. (2006) observed that the application of P2O5 @ 60 kg
ha-1 gives significantly higher growth and yield attributes and seed yield of
chickpea as compared to preceding levels.
Sepat and Yadav (2008) reported that the increasing levels of
phosphorus upto 30 kg P2O5 ha-1 significantly increased the dry matter
accumulation per metre row length and number and dry weight of root
nodules per plant, yield attributes, yield, nitrogen, phosphorus and sulphur

concentration in seed and straw as well as protein content in seed of
mothbean were increased significantly at 30 kg P2O5 ha-1 but remained at par
with 45 kg P2O5 ha-1 straw yield increased significantly upto 45 kg P2O5 ha-1.
Kumar and Thenua (2008) reported that the increasing levels of
phosphorus and combination of rhizobium + PSB improve all growth
parameters and net cropping as well as phosphorus uptake by pigeonpea.
Tiwari and Kumar (2009) reported that application of 60 kg P2O5 ha-1
along with recommended dose of N (20 kg N ha-1) and K (20 kg K2O ha-1)
resulted in increased number of nodules per plant, yield attributes and yield of
green gram.
Deo and Khandelwal (2009) observed the synergistic effect of P and S
on yield and number of nodule per plant of chickpea and results indicated that
grain and straw yield, increased with increase in rate of application of P and S
individually as well as in various combinations, which range from 0, 15, 30 kg
ha-1 of S and 0, 20, 40 and 60 kg ha-1 of P.
Akbari et al. (2010) reported that plant height, number of branches and
number of pods per plant of groundnut significantly increased from different
duration of phosphorus application. Maximum value of each yield attributes
were obtained when phosphorus was applied @ 20 kg P2O5 ha-1.

Kumar (2011) conducted a field experiment on garden pea and
reported that the application of 120 kg P2O5 ha-1 with rhizobium inoculation
significantly increased the plant height, number of leaves per plant, number of
nodules per plant, fresh weight of nodules per plant and dry weight of nodules
per plant.
Nawange et al. (2011)reported that application of phosphorus upto 60
kgha-1 provide a linear increase in various growth characters, yield attributing
traits, seed and stalk yield of chickpea and application of 60 kg P2O5ha-1
produced the highest mean, seed yield and stalk yield.
2.2.2 Nutrient concentration
Agarwal (1997) reported that increasing levels of phosphorus upto 50
kg P2O5 ha-1 increased the nitrogen, phosphorus and protein content in grain
and straw and total uptake of N, P and S significantly.
Kumawat et al. (1998) conducted a field experiment at Jobner and
reported that application of 40 kg P2O5 ha-1 significantly increased the
nitrogen and protein content in seed and phosphorus content in seed and
straw of fenugreek.
Meena and Agarwal (1999) reported that with increasing levels of
phorphorus, uptake of N, P and S and protein content increased significantly
in fenugreek crop. The highest protein content in seed and straw and total N

uptake was obtained with combined use of 50 kg P2O5 and 60 kg S /ha as
compared to other combination of their lower levels.
Yakadri et al. (2004) conduct an experiment on green gram and it‟s
results indicate that 20 kg N + 60 kg P2O5 ha-1 recorded maximum dry matter
production, N and P uptake, higher seed and haulm yield, but increasing level
of N from 20 to 60 kg ha-1 did not show any response in this regard.
Singh et al. (2009) pointed out that the effect of P on fodder yield,
uptake and to establish the critical limit of available P for Indian mustard crop,
a screen house experiment was conducted on P deficit soil (Typic
Haplustept). Application of fifteen graded levels of P from 0 to 300 mg/kg soil
significantly increased the N content and uptakes of N, Fe and Cu upto 40 mg
P/kg soil. The P content significantly and subsequently increased with all level
of applied P whereas, its uptake was significantly enhanced only upto 80 mg
P/kg soil. The critical limit of Olsen‟s P was established as 13.5 kg P/ha for
forage production of Indian mustard crop.
2.2.3 Soil properties
Aulakh et al. (1990) reported that the amount of PO43- adsorbed in soil
is expected to be higher than SO42- because it is a stronger competitor for
anion adsorption site. They have shown that with the addition of P, the
increased addition of PO43- with time resulted in a concurrent desorption of

SO42- from the colloidal surfaces. Therefore, large dressings of fertilizer P may
result in increased S mobility and availability in soil and may make the soil
system devoid of SO42- due to its subsequent leaching.
Indiati et al. (1995) revealed that the soil P addition increased the
available phosphorus.
Bhal and Singh (1997) conducted a greenhouse experiment on ten
soils to study the effect of added P on Olsen‟s P and inorganic soil P fraction.
The amount of Olsen‟s extractable P decreased during first 40 days but
increased thereafter.
Panwar (1997) conducted an experiment with a sandy soil having pH
8.6, OC 0.6 g kg-1, CEC 3.2 cmol (p+) kg-1, Olsen P 4.2 mg kg-1. The
treatments comprised three levels of phosphorus (0, 20 and 40 mg P kg -1 soil
as DAP) and showed that addition of P significantly increased the Olsen P in
the soil. The mean value were 3.1, 9.1 and 17.7 mg P kg-1 soil at 0, 20 and 40
mg P kg-1 soil P, respectively at the harvest.
Deo and Khandelwal (2009) reported that the available P increased
consistently with increase in rate of P application in the soil. P content
increase from 24.5 kg ha-1 in control to 45.9 kg P2O5 ha-1 with application of
60 kg P2O5 ha-1. Phosphorus application had no effect on the sulphur content
in soil.

2.2.4 Salinity tolerance
Bernstein et al. (1974) reported that increasing level of phosphate (0.1
to 2.0 mM) aggravated salt injury in corn and decreased salt tolerance.
Cerda et al. (1977) reported that salinity reduced yield by 50% in pod
yield at an osmotic potential of approximately -2.7 bars. Increasing P
concentration increased yield only at low salinity levels.
Rajpaul et al. (2006) conducted an experiment in microplots (2 m x 2
m) with four varieties of okra and these are grown under irrigation with 0.65
(canal), 2.75, 5.0 and 8.5 dSm-1 saline water. Three amendments of FYM @
15 t/ha, FYM @ 15 t/ha + phosphorus @ 50 % above the recommended dose
and FYM 15 t/ha + phosphorus @ 100% above the recommended dose were
applied in the high EC saline water. The addition of FYM increased the mean
yield of Okra from 24.75 q/ha under EC of 8.5 dSm-1 in water to 26.75 q/ha
under EC of 8.5 dSm-1 in water plus FYM treated plots, which increased
further on addition of phosphorus to 27.50 q/ha. The double dose of
phosphorus further improved the yield to 27.75 q/ha. Maximum yield of okra
was obtained in all the varieties in canal water and minimum yield was
obtained in 8.5 dSm-1 EC in water.
Sharma et al. (2007) pointed out that the external P requirement of
wheat also increased with increase in the ECe of soil, as grain yield at 30 mg
P kg-1 soil at ECe 6 and 60 mg P kg-1 soil at ECe 8 under Cl and 30 mg P kg-1
at ECe 10 dSm-1 under SO4- salinity were comparable.

3 Materials and Methods
An investigation entitled “Phosphorus requirement of Chickpea (Cicer
arietinum L.) irrigated with chloride and sulphate dominated saline water” was
conducted in cage house of Department of Plant Physiology, S.K.N. College
of Agriculture, Jobner (Rajasthan) during the rabi season of 2010-11. The
materials used and the methods followed during the course of investigation
are described in this chapter.
3.1 Location of experimental site
Jobner is located at 75.280 East longitude and 26. 060 North latitude at
an altitude of 427 metres above M.S.L. This region falls under Agro Climatic
Zone III-A (Semi-arid eastern plain).
3.2 Climate and weather condition
The climate of the region is typically semi-arid characterized by the
aridity of atmosphere and salinity of rhizosphere with extremes of the
temperature both during summer and winter. The annual rainfall of locality
ranges between 400 to 500mm, which is mostly received between July and
September. Data on temperature, relative humidity, rainfall and evaporation
recorded at college meteorological observatory during the period of
experimentation are presented in Table-3.1 and diagrammatically depicted in
Fig. 3.1

Table 3.1 Mean weekly parameters for the period of experimentation
(2010-11)
SMW* Period Temperature Average
RH (%)
Evaporation
(mm/day)
Total
rainfall
(mm)
From To Max. Min.
16 12.11.10 18.11.10 28.2 18.1 74 01.8 0.00
17 19.1110 25.11.10 23.1 12.5 77 01.5 0.00
18 26.11.10 02.11.10 23.9 08.1 63 02.0 0.00
49 03.12.10 09.12.10 23.0 06.1 57 02.1 0.00
50 10.12.10 16.12.10 23.0 03.4 55 02.1 0.00
51 11.12.10 23.12.10 24.7 02.0 59 02.3 0.00
52 24.12.10 31.12.00 22.5 07.0 65 02.3 0.00
1 01.01.11 07.01.11 17.8 07.4 71 01.5 0.00
2 08.01.11 14.01.11 22.5 03.7 59 02.3 0.00
3 15.01.11 21.01.11 21.5 01.6 61 01.9 0.00
4 22.01.11 28.01.11 22.5 04.5 57 02.4 0.00
5 29.01.11 04.02.11 23.5 04.3 57 02.4 0.00
6 05.02.11 11.02.11 26.7 07.0 56 02.9 0.00
7 12.02.11 18.02.11 24.0 09.1 67 02.6 32.30
8 19.02.11 26.02.11 23.5 09.1 66 02.9 0.00
9 26.02.11 04.03.11 25.3 11.0 61 03.7 1.00
10 05.03.11 11.03.11 28.1 10.6 53 04.1 0.00
11 12.03.11 18.03.11 33.0 09.5 49 04.4 0.00
12 19.03.11 25.03.11 34.8 12.6 41 04.6 0.00
13 26.03.11 01.04.11 36.2 15.7 39 04.7 0.00
14 02.04.11 08.04.11 34.5 13.5 36 04.4 0.00
15 09.04.11 15.04.11 35.1 17.8 34 05.2 0.00
16 16.04.11 22.04.11 35.9 17.6 34 07.4 0.40
*SMW = Standard Meteorological Week

3.3 Soil
The loamy sand soil of the field was used for this pot experiment. The
physico-chemical properties of experimental soil are presented in Table 3.2.
Table-3.2 Physico-chemical properties of original soil
S.No Soil properties Value
1 Mechanical analysis
(i) Coarse sand (%) 35.68
(ii) fine sand (%) 44.49
(iii) Silt (%) 10.27
(iv) Clay % 8.91
(v) Textural class Loamy sand
2 Bulk density (Mg m-3) 1.48
3 Partical density (Mg m-3) 2.65
4 pH 8.0
5 ECe (dSm-1) at 25 0C 1.40
6 Na(meL-1) 11.0
7 Ca+Mg (meL-1) 2.8
8 SAR 9.32
9 Organic carbon (g kg-1) 1.80
10 CEC (cmol (P+) kg–1 soil 5.6
11 Exchangeable Na (cmol kg-1) 8.60
12 ESP 10.7
13 Available nutrients
(i) Nitrogen (kg ha-1) 118.10
(ii) Phosphorus (P2O5 kg ha-1) 13.25
(iii) Potassium (K2O kg ha-1) 152.18

3.4 Filling of pots
Soil was filled in cylindrical ceramic pots (20 cm in diameter and 28 cm
in height). Each pot had 10 kg of soil. At the time of filling the pots, the broken
pieces of stone were placed on the bottom hole to allow free drainage.
3.5 Quality of irrigation water used in the experiment
Three different types of irrigation water as per treatment were used for
irrigating the crop.
3.6 Development of salinity
The desired levels of salinity (i.e. 2, 4, 6 dSm-1) were prepared by
adding chloride and sulphate salts of Ca, Mg and Na in irrigation water (Table
3.3).
3.7 Detailed plan of the experiment
The pot experiment was conducted for one season by taking chickpea
crop in Completely Randomized Design with the following treatments.
3.7.1 Treatments details
A. Saline water of EC (dSm-1)
EC (dSm-1) Cl : SO4 Symbol
(i) Control (0.5) - C 0
(ii) 2 1:3 C1
(iii) 2 3:1 C2
(iv) 4 1:3 C3
(v) 4 3:1 C4
(vi) 6 1:3 C5
(vii) 6 3:1 C6

B. Phosphorus (mg kg-1)
Treatment Symbol
(i) Control P0
(ii) 15 P15
(iii) 30 P30
Table 3.3: Composition of irrigation water
ECe
(dSm-1)
Cl:SO4
(meq L-1)
Na
(meq L-1)
Ca
(meq L-1)
Mg
(meq L-1)
SO4
(meq L-1)
Cl
(meq L-1)
SAR
2 1:3 18.6 3.45 3.45 15 5 10
3:1 18.6 3.45 3.45 5 15 10
4 1:3 26.2 6.8 6.8 30 10 10
3:1 26.2 6.8 6.8 10 30 10
6 1:3 35.2 12.4 12.4 45 15 10
3:1 35.2 12.4 12.4 15 45 10
3.7.2 Experimental details
(i) Season Rabi 2010
(ii) Crop Chickpea
(iii) Variety RSG-888
(iv) Experimental design CRD
(v) Replication 3
(vi) Total number of treatments 21

(vii) Total number of pots 21x 3 = 63
(viii) Weight of soil per pot 10 kg
3.8 Treatment application
3.8.1 Application of phosphorus
Phosphorus was applied @ 15 and 30 mg kg-1 soil through NH4H2PO4
and throughly mixed in soil as per treatment before sowing.
3.9 Agronomical operations
3.9.1 Fertilizer application
Nitrogen was applied @ 15 mg kg-1 soil as basal dose. The nitrogen
supplied through NH4H2PO4 was taken into account in each treatment and the
remaining N was compensated through urea.
3.9.2 Sowing
The chickpea, seed of variety RSG-888 was treated with bavistin @ 3 g
kg-1 seed to control seed borne diseases followed by rhizobium inoculation. 10
treated seed per pot were sown on 5th November, 2010 and after germination,
only five plants per pot were maintained.

3.9.3 Irrigation
Measured volume (1.25 litres) of water was applied to each pot
according to plan of experiment. Besides one pre sowing irrigation eight
subsequent irrigations were given on field capacity of 11.5 per cent.
3.10 Treatment evaluation
The effect of treatments was evaluated in term of growth and quality
parameters.
3.10.1 Yield attributes and yield
3.10.1.1 Total number of nodule per plant
The number of nodules per plant were counted at 45 DAS. Two plants
randomly selected from each pot were uprooted carefully and soil mass
embodying the roots of the plant was washed off by water and total nodules
were counted. The mean value was recorded as total number of nod ules per
plant.
3.10.1.2 Effective nodule
Effective number of nodules was counted from same plants as taken
for total number of nodules. Healthy, pink coloured nodules were counted and
mean value was recorded as effective number of nodules per plant.

3.10.1.3 Nodule index
Number of nodule counted from randomly selected two plants from
each plots at the time of flowering stage and nodule index (number of nodule
per cm. of taproot) was computed by formula (Sandhu et al. 1992) :
No. of nodules per plant
Nodule index = ---------------------------------- Length (cm) of tap root
3.10.1.4 Plant height
The height of plant at harvest was measured from base of the plant to
tip of main shoot by metre scale.
3.10.1.5 Pods per plant
Plants used for recording the height were also used for counting the
number of pods and average was taken and recorded as pods per plant.
3.10.1.6 Seeds per pod
At the time of threshing, 10 pods were randomly selected from each
pot and total seeds were counted. The mean number of seeds per pod was
taken.
3.10.1.7 Test weight
One thousand seeds were counted from each sample and weight was
recorded in gram.

3.10.1.8 Grain yield
Three plants of each pot were harvested at maturity and tied up and
kept on threshing floor for sun drying. After complete sun drying the produce
of each pot was weighed for recording biological yield. After threshing,
winnowing and clearing the produce of each pot was weighted separately and
the weight recorded as seed yield in g pot-1.
3.10.1.9 Stover yield
The weight of harvested material after picking the pods and weight of
pod husk were added together and recorded as stover yield in gram per pot.
3.11 Chemical analysis and quality attributes
3.11.1 Nutrient content
For estimation of nitrogen, phosphorus, potassium, sulphur, calcium,
magnesium, sodium and choloride representative samples of seed and stover
taken at the time of threshing were ground to fine powder nutrient content in
seed and stover were estimated by using standard methods given in Table
3.4.
3.11.2 Empirical degree of compartmentation
Degree of compartmentation determined at flowering stage of crop with
the help of the following formula proposed by Kylin and Quatranto, (1975).
ECo-ECy
Degree of compartmentation = ----------------- x 100
ECo

ECo = Electrical conductivity of old leaves
ECy = Electrical conductivity of young leaves
3.11.3 Ionic regulation index
Ionic regulation index determined at harvest of crop with the help of the
following formula proposed by Sacher et al. (1982).
Foliar ion content (% DW) with specified concentration of salinity
IRI = ----------------------------------------------------------------------------------- Foliar ion content (% DW) with control
3.11.4 Phosphorus mobility ratio
Phosphorus mobility ratio determined at flowering and harvest stage of
crop with the help of the following formula :
P content in shoot/grain
P mobility ratio = ----------------------------------- x 100
P content in root
3.12 Soil studies
The soil of each pot was analysed for available phosphorus, sulphur
and Chloride, EC, pH and SAR as per method given inTable 3.4.
3.13 Collection of soil samples
Soil samples were collected from each pot after harvest of the crop.
These were dried and passed through 2.0 mm sieve for subsequent analysis.

3.14 Methods of analysis
Table 3.4 Methods of soil and plant analysis
S.No.
Item of analysis Methods Reference
A. Soil analysis (i) Mechanical
analysis International pipette method as described by Robinsons
Piper (1950)
(ii) Soil Reaction (pH)
By electronic method with systronics pH meter in 1:2 soil water suspension
Piper (1950)
(iii) Preparation of extract
Saturated soil paste and extract obtained as per method (3a) USDA Hand Book No. 60
Richards, (1954)
(iv) Electrical conductivity (ECe)
ECe of soil with the help of „solubridge‟ (In soil saturation extract) as per method (4b) of USDA Hand Book No. 60.
Richards (1954)
(v) Soluble cations (a) Ca++ + Mg++ Titration for Ca+Mg with standard EDTA
solution as per method No. 7 of USDA Hand Book No. 60.
Richards (1954)
(b) Na+ Sodium with the help of flame photometer as per method (10a) of USDA Hand Book No. 60
Richards (1954)
(vi) Sodium adsorption ratio (SAR)
Na+
SAR=-------------------------------------- Ca++ + Mg++/2
All cations being expressed as meL-1
(vii) Cation exchange capacity
The method No. 19 of USDA Hand Book No. 60
Richards (1954)
(viii) Available nitrogen
Alkaline potassium permanganate method
Subbiah and Asija (1956)
(ix) Available phosphorus
Extraction of soil with 0.5 m NaHCO3 at pH 8.5 and development of colour with SnCl2
Olsen et al. (1954)
(x) Available potassium
Estimation with 1 N ammonium acetate at pH 7.0 and determined by flame photometer
Jackson (1973)
(xi) Available sulphur Turbidimetric method Chesnin and Yien (1951)
(xii) Cl- content Titration for Cl- with standard AgNO3
solution as per method No.13 of USDA Hand Book No.60.
Richards (1954)
B. Plant analysis 1. Degestion of
plant sample-1
Wet digestion of plant sample with
H2SO4 and H2O2
Jackson (1973)
2. Nitrogen content Colorimetric determination on
spectronic-20 after development of
colour with Nesseler‟s reagent.
Snell and Snell
(1949)
3. Digestion of plant
sample-II
Wet digestion of sample with triacid
mixture (Nitric acid, sulphuric acid and
perchloric acid in ratio of 10 : 1 : 3
Johnson and Ulrich
(1959)
4. Phosphorus
content
Estimation of phosphorus on spectronic-
20 by using vanadomdybdo phosphoric
yellow colour method in nitric acid
system.
Jackson (1967)

5. Potassium
content
Analysis of suitable aliquot of digested
material with the help of flame
photometer
Richard (1954)
6. Calcium content Analysis of suitable aliquot of digested
material with the help of flame
photometer as per method 55a and 57a
respecivley as outlined in USDA Hand
Book No. 60.
Richard (1954)
7. Magnesium content
Digestion of plant sample diacid (HNO3 and HClO4) 9:4 ratio and analysis of suitable aliquot of digested material with flame photometer
Bhargava and Raghupati (1993)
8. Sulphur content Turbidimetric method Tabatabai and
Bremner, (1970)
9. Sodium content Digestion of plant sample in diacid (HNO3 and HClO4) 9:4 ratio and analysis of suitable aliquot of digested material with flame photometer
Bhargava and Raghupati (1993)
10. Cl- content Digestion of plant sample in diacid (HNO3 and HClO4) 9:4 ratio and analysis of suitable aliquot of digested material by AgNO3 titration.
Ward and Johnston (1962)
3.15 Statistical analysis
The experiment was laid out in Completely Randomized Design. The
statistical analysis of the data on the final value of nodule count, (Total,
effective, Nodule index), plant height, pods per plant, seeds per pod, test
weight, grain yield and stover yield content of N, P, K, S, Ca, Mg, Na and Cl in
seed and stover and soil analysis for available P and S, Cl- content, EC, pH
and SAR were done by statistical method of analysis of variance. To compare
the treatment difference, the critical difference (CD) at 5 per cent level of
significance was calculated as per method described by Panse and Sukhatme
(1967) wherever „F‟ test came out significant. The analysis of variance of
different characters is given in “Appendices”.

4. Results
The findings of the experiment are being presented in this chapter. In
the succeeding pages, experimental results obtained in the present
investigation have been presented in tabular form and summarized. The
appendices at the end show the analysis of variance. The results have also
been illustrated diagrammatically. The finding of the pot experiment are
described under the following headings:
4.1 PLANT STUDIES
4.1.1 Yield and yield attributes
4.1.1.1 Total and effective nodules per plant
Effect of salinity:
A reference to data in Table 4.1 revealed that different levels of salinity
of water significantly decreased the total and effective nodules per plant over
control (0.5 dSm-1). Irrigation water containing Cl->SO42- at the same level of
EC i.e. C2, C4 and C6 recorded significantly less nodules than those obtained
with water containing SO42- >Cl- at same level of EC i.e. C1, C3 and C5. The
treatment C1 remained at par with C0 for both total and effective nodules per
plant. Treatment C6 remain at par with C5 only for total nodule per plant. The
C1, C2, C3, C4, C5 and C6 decreased the number of total and effective nodule
per plant to the extent of 2.37, 5.46, 10.56, 15.66, 20.16 and 23.50 per cent in
total nodules and 3.00, 6.93, 22.86, 26.78, 44.57 and 50.58 per cent, in
effective nodules, respectively over control (C0).

Table : 4.1 Effect of salinity of water (EC) and phosphorus on total and
effective number of root nodules and nodule index
Treatments Total Effective Nodule index
Salinity EC (dSm-1)
C0 (Control) 8.43 4.33 1.75
C1- 2 (1:3)* 8.23 4.20 1.74
C2- 2 (3:1)* 7.97 4.03 1.67
C3- 4 (1:3)* 7.54 3.34 1.58
C4- 4 (3:1)* 7.11 3.17 1.54
C5- 6 (1:3)* 6.73 2.40 1.44
C6- 6 (3:1)* 6.47 2.14 1.37
SEm+ 0.13 0.06 0.03
CD (P=0.05) 0.37 0.17 0.08
P levels (mg P kg-1 soil)
P0 6.48 2.92 1.47
P15 7.61 3.26 1.58
P30 8.40 3.94 1.70
SEm+ 0.09 0.04 0.02
CD (P=0.05) 0.25 0.11 0.05
* Cl- :SO42-

Effect of phosphorus:
It is evident from the data in Table 4.1 reveal that the total and effective
number of root nodules per plant increased significantly with an increase in
the levels of phosphorus. The increase in total and effective root nodule were
recorded 17.44 and 29.63 per cent and 11.64 and 34.93 per cent over that of
control with application of phosphorus @ 15 and 30 mg kg-1, respectively.
4.1.1.2 Nodule index
Effective of salinity:
It is obvious from the data in Table 4.1 that nodule index significantly
decreased with increasing level of salinity. The maximum nodule index was
obtained under the treatment C0 and minimum under C6. The treatment C1
and C2 remained at par with C0 and each other. while, treatment C6 remained
at par with C5. Nodule index decreased by 0.57, 4.57, 9.71, 12.00, 17.7 and
21.71 per cent due to application of C1, C2, C3, C4, C5 and C6 over C0,
respectively.
Effect of phosphorus:
It is evident from the data summarized in Table 4.1 that increasing level
of phosphorus increased nodule index significantly with an extent of 7.48 and
15.64 per cent with the application of 15 mg P kg-1 and 30 mg P kg-1 of soil,
respectively as compared to control.

4.1.1.3 Plant height
Effect of salinity:
The plant height tended to decrease or decreased significantly with
increasing level of salinity in irrigation water and magnitude of decrease was
more pronounced in Cl- dominated water at all salinity level except 2 dSm-1
where both salinities (Cl- and SO42-) differed non significantly (Table 4.2). The
maximum plant height was obtained under the treatment C0 (31.29 cm) and
minimum under C6 (21.94 cm). The decrease in plant height was to the extent
of 9.50, 12.46, 14.54, 23.30, 24.38 and 29.88 per cent, respectively due to C1,
C2, C3, C4, C5 and C6 over C0.
Effect of phosphorus:
A perusal of the data (Table 4.2) further revealed that application of
phosphorus increased the plant height significantly. Application of 15 mg kg -1
and 30 mg kg-1 of phosphorus increased the plant height to the extent of
13.65 and 24.74 per cent, respectively over control and the maximum plant
height (29.14 cm) was recorded at 30 mg P kg-1 soil.
4.1.1.4 Test weight
Effect of salinity:
An examination of data (Table 4.2) indicate that test weight decreased
with increasing level of salinity in irrigation water and magnitude of decrease
was more pronounced in Cl- dominated water at all salinity levels. The
maximum test weight (123.42 g) was obtained under the treatment C0 and
minimum (104.57 g) under C6.

Table : 4.2 Effect of salinity of water (EC) and phosphorus on plant
height (cm) and test weight (g)
Treatments Plant height Test weight
Salinity EC (dSm-1)
C0 (Control) 31.29 123.42
C1- 2 (1:3)* 28.89 122.57
C2- 2 (3:1)* 27.94 119.14
C3- 4 (1:3)* 26.74 114.00
C4- 4 (3:1)* 24.00 110.57
C5- 6 (1:3)* 23.66 107.14
C6- 6 (3:1)* 21.94 104.57
SEm+ 0.40 1.98
CD (P=0.05) 1.15 5.65
P levels (mg P kg-1 soil)
P0 23.36 110.23
P15 26.55 114.94
P30 29.14 118.29
SEm+ 0.26 1.29
CD (P=0.05) 0.75 3.70
* Cl- :SO42-

Effect of phosphorus:
Data given in Table 4.2 further showed that the levels of phosphorus
influenced the test weight significantly. The application of 30 mg kg -1
phosphorus recorded significantly higher test weight over control but it
remained statistically at par with 15 mg P kg-1 soil. The highest (118.29 g) test
weight was recorded under 30 mg P kg-1 soil and lowest (110.23g) under
control (C0).
4.1.1.5 Number of pods per plant
The data relating to the effect of different levels of saline water and
phosphorus on number of pod per plant of chickpea have been summarized in
Table 4.3.
Effect of salinity:
The data in Table 4.3 shows that number of pods per plant significantly
decreased with increasing level of salinity in irrigation water and magnitude of
decrease was more pronounced in Cl- dominated water at all salinity levels.
However, the difference between C2 & C3, C4 & C5 and C5 & C6 remained
statistically at par. The C1, C2, C3, C4, C5 and C6 decreased the number of
pods per plant to the extent of 21.16, 33.52, 36.19, 46.47, 48.51 and 50.30
per cent, respectively over normal water (control).

Table : 4.3 Effect of salinity of water (EC) and phosphorus on number
of pods per plant and seeds per pod
Treatments Pods per plant Seeds per pod
Salinity EC (dSm-1)
C0 (Control) 25.09 2.10
C1- 2 (1:3)* 19.78 1.80
C2- 2 (3:1)* 16.68 1.70
C3- 4 (1:3)* 16.01 1.50
C4- 4 (3:1)* 13.43 1.37
C5- 6 (1:3)* 12.92 1.15
C6- 6 (3:1)* 12.47 1.01
SEm+ 0.32 0.03
CD (P=0.05) 0.91 0.09
P levels (mg P kg-1 soil)
P0 9.10 1.23
P15 17.58 1.54
P30 23.20 1.78
SEm+ 0.21 0.02
CD (P=0.05) 0.60 0.06
* Cl- :SO42-

Effect of phosphorus:
Application of phosphorus enhanced significantly the number of pods
per plant (Table 4.3). The highest number of pods were recorded under the
application of 30 mg P kg-1 soil which was higher by 154.95 and 31.97 per
cent over control and 15 mg P kg-1 soil.
Interactive effect of salinity and phosphorus:
Interactive effect of salinity and phosphorus levels on pods per plant
was found significant (Table 4.4 and Fig. 4.1). The data revealed that with
every level of salinity (EC), the pods per plant increased significantly with an
increase in the levels of phosphorus. The magnitude of reduction of pods per
plant was minimum with the application of P30 under all levels of salinity of
irrigation water e.g. reduction in pods per plant at C6P0 was 82.67 per cent
which decreased to 40.20 and 15.03 per cent, respectively due to application
of 15 and 30 mg P kg-1 soil at the same level of saline water i.e. C6P15 and
C6P30 combination.

Table 4.4 : Combined effect of salinity of water (EC) and phosphorus
on pods per plant
Treatments P0 P15 P30
C0 (Control) 23.08 24.50 27.70
C1- 2 (1:3)* 13.91 20.40 25.04
C2- 2 (3:1)* 7.12 18.02 24.91
C3- 4 (1:3)* 6.38 17.35 24.31
C4- 4 (3:1)* 4.90 14.76 20.62
C5- 6 (1:3)* 4.30 14.26 20.21
C6- 6 (3:1)* 4.00 13.80 19.61
SEm+ 0.55
CD (P=0.05) 1.58
* Cl- :SO42-
The maximum pods per plant was obtained with combined application
of C0 (control) and P30 (30 mg P kg-1 soil) while, minimum under C6 (6 dSm-1
Cl-:SO4-2 (3:1) and P0 (control). The treatment combination C1P15 remained
statistically at par with C4P30, C5P30 & C6P30.

4.1.1.6 Number of seeds per pod
Effect of salinity:
It is apparent from the data (Table 4.3) that the number of seeds per
pod significantly decreased with increasing level of salinity and magnitude of
decrease was more in Cl- dominated salinity as than that of SO42- salinity i.e.
19.05, 34.76 and 51.90 per cent under C2, C4 and C6 against 14.29, 28.57
and 45.24 per cent under C1, C3 and C5, respectively over control.
Effect of phosphorus:
Further reference to data given in Table 4.3 showed that application of
phosphorus increase the number of seeds per pod significantly. The highest
number of seeds per pod were recorded with P30 (30 mg P kg-1 soil) while
lowest with P0 (control). Application of 15 and 30 mg P kg-1 soil increased the
number of seed per pod to the extent of 25.20 and 44.72 per cent over
control.
4.1.1.7 Grain yield
The relating to the effect of different levels of saline water (EC) and
phosphorus on grain yield of chickpea have been summarized in Table 4.5.
Effect of salinity:
The grain yield of chickpea tended to decreased significantly with
increasing level of salinity in irrigation water and magnitude of decrease was
more pronounced in Cl- dominated water at all salinity levels (Table 4.5). The
maximum (19.46 g) grain yield was recorded under C0 and minimum (11.25 g)
under C6. However, the treatment C2 and C3 were remained at par with each
other. The decreasing order for salinity level was C0>C1>C2>C3>4>C5>C6. The
grain yield decreased by 10.18, 23.40, 25.87, 31.47, 36.85 and 42.20 per cent
with C1, C2, C3, C4, C5 and C6 over C0.

Table 4.5 : Effect of salinity of water (EC) and phosphorus on grain and
stover yield
Treatments Grain yield (g pot-1)
Stover yield (g pot-1)
Salinity EC (dSm-1)
C0 (Control) 19.46 25.29
C1- 2 (1:3)* 17.48 22.72
C2- 2 (3:1)* 14.90 19.37
C3- 4 (1:3)* 14.42 18.75
C4- 4 (3:1)* 13.33 17.33
C5- 6 (1:3)* 12.29 15.97
C6- 6 (3:1)* 11.25 14.62
SEm+ 0.27 0.36
CD (P=0.05) 0.78 1.02
P levels (mg P kg-1 soil)
P0 6.07 7.89
P15 18.22 23.69
P30 19.91 25.88
SEm+ 0.18 0.23
CD (P=0.05) 0.51 0.67
* Cl- :SO42-

Effect of phosphorus:
On going throught the data in Table 4.5 shows that the application of
phosphorus at increasing levels brought significant increase in grain yield of
chickpea. Phosphorus application @ 30 mg kg-1 soil gave significantly highest
(19.91 g pot-1) gain yield, respectively as compared to preceding phosphorus
levels. The increase in grain yield was obtained to the extent of 200.38 and
228.26 per cent with the application of 15 and 30 mg P kg-1 of soil,
respectively over to control.
Interactive effect of salinity and phosphorus:
Interactive effect of salinity and phosphorus levels on grain yield was
found significant (Table 4.6 and Fig. 4.2). The data revealed that with every
level of salinity (EC), the yield increased significantly with an increase in the
levels of phosphorus. The magnitude of yield reduction was minimum with the
application of P30 under all level of salinity in irrigation water e.g. reduction in
grain yield at C6P0 was 82.43 per cent which decreased to 12.18 and 19.26
per cent, respectively due to application of 15 and 30 mg P kg -1 soil over to
control. The magnitude of P response was maximum under chloride followed
by sulphate and least in normal saline water (control). Further the magnitude
of P response at the highest added P level under SO42- and Cl- salinity relative
to control (C0P0) was 2.1 and 4.2 times, respectively at EC of 2, 4.5 and 5.2
times, respectively at EC of 4 and 5.7 and 6.8 times, respectively at EC of 6
dSm-1 compared to only 1.8 in the normal water(control). Difference in yield
under treatment combinations viz., C1P15 and C2P30, C3P15 and C4P30, C5P15

and C6P30 was found non significant which indicate that for obtaining relatively
equal yield at comparable salinity level, the P requirement of chickpea was
considerably more (50%) under Cl- than SO42- salinity. The maximum grain
yield was obtained with combined application of C0 (control) and P30 (30 mg P
kg-1 soil) while, minimum under C6 [6 dSm-1 Cl-:SO42- (3:1)] and P0 (control).
Table 4.6 : Combined effect of salinity of water (EC) and phosphorus
on grain yield (g/pot)
Treatments P0 P15 P30
C0 (Control) 13.55 20.80 24.02
C1- 2 (1:3)* 10.30 20.51 21.62
C2- 2 (3:1)* 5.10 18.21 21.40
C3- 4 (1:3)* 4.55 18.26 20.46
C4- 4 (3:1)* 3.55 17.99 18.46
C5- 6 (1:3)* 3.03 16.57 17.26
C6- 6 (3:1)* 2.38 15.20 16.16
SEm+ 0.470
CD (P=0.05) 1.344
* Cl- :SO42-
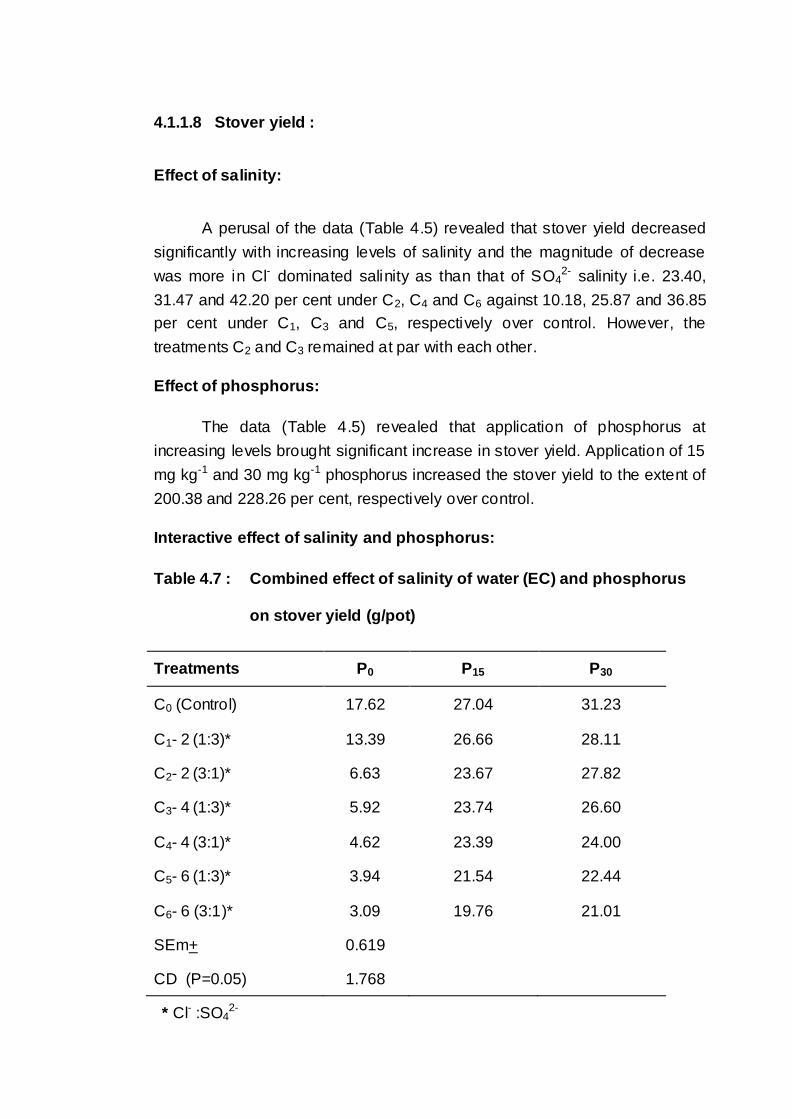
4.1.1.8 Stover yield :
Effect of salinity:
A perusal of the data (Table 4.5) revealed that stover yield decreased
significantly with increasing levels of salinity and the magnitude of decrease
was more in Cl- dominated salinity as than that of SO42- salinity i.e. 23.40,
31.47 and 42.20 per cent under C2, C4 and C6 against 10.18, 25.87 and 36.85
per cent under C1, C3 and C5, respectively over control. However, the
treatments C2 and C3 remained at par with each other.
Effect of phosphorus:
The data (Table 4.5) revealed that application of phosphorus at
increasing levels brought significant increase in stover yield. Application of 15
mg kg-1 and 30 mg kg-1 phosphorus increased the stover yield to the extent of
200.38 and 228.26 per cent, respectively over control.
Interactive effect of salinity and phosphorus:
Table 4.7 : Combined effect of salinity of water (EC) and phosphorus
on stover yield (g/pot)
Treatments P0 P15 P30
C0 (Control) 17.62 27.04 31.23
C1- 2 (1:3)* 13.39 26.66 28.11
C2- 2 (3:1)* 6.63 23.67 27.82
C3- 4 (1:3)* 5.92 23.74 26.60
C4- 4 (3:1)* 4.62 23.39 24.00
C5- 6 (1:3)* 3.94 21.54 22.44
C6- 6 (3:1)* 3.09 19.76 21.01
SEm+ 0.619
CD (P=0.05) 1.768
* Cl- :SO42-

Interactive effect of salinity and phosphorus levels on stover yield was
found significant (Table 4.7 and Fig. 4.3). The data revealed that with every
level of salinity (EC), the yield increased significantly with an increase in the
levels of phosphorus. The magnitude of yield reduction was minimum with the
application of P30 under all level of salinity in irrigation water e.g. reduction in
stover yield at C6P0 was 82.46 per cent which decreased to 12.14 and 19.23
per cent, respectively due to application of 15 and 30 mg kg -1 phosphorus
over to control. The magnitude of P response was similar to that of grain yield
under chloride followed by sulphate and least in normal saline water (control).
The maximum grain yield was obtained with combined application of C0
(control) and P30 (30 mg kg-1 phosphorus) while, minimum under C6 [6 dSm-1
Cl-:SO42- (3:1)] and P0 (control).
4.1.2 Mineral content
4.1.2.1 Phosphorus
4.1.2.1.1 Phosphorus content in root and shoot at flowering stage
Effect of salinity:
The data presented in Table 4.8 explicit that the phosphorus content in
root and shoot at flowering stage of chickpea significantly decreased with
increasing level of salinity and the magnitude of decrease was more in Cl-
dominated salinity as than that of SO42- salinity i.e. 8.00, 17.71 and 28.00 per
cent in root and 16.87, 35.54 and 46.99 per cent in shoot under C2, C4 and C6
against 3.43, 13.14, 22.86 per cent in root and 9.04, 27.11 and 42.17 per cent
in shoot under C1, C3 and C5, respectively over control. However, in case of
root the difference between C1 and C2 and C3 and C4 remained statistically at
par with each other.

Table : 4.8 Effect of salinity of water (EC) and phosphorus on
phosphorus content (%) in root and shoot and P-mobility ratio at flowering stage
Treatment P content P-mobility
ratio
Root Shoot
Salinity EC (dSm-1)
C0 (Control) 0.175 0.166 94.59
C1- 2 (1:3)* 0.169 0.151 89.16
C2- 2 (3:1)* 0.161 0.138 85.62
C3- 4 (1:3)* 0.152 0.121 79.62
C4- 4 (3:1)* 0.144 0.107 74.43
C5- 6 (1:3)* 0.135 0.096 71.34
C6- 6 (3:1)* 0.126 0.088 70.17
SEm+ 0.003 0.002 1.35
CD (P=0.05) 0.008 0.006 3.86
P levels (mg P kg-1 soil)
P0 0.131 0.103 77.72
P15 0.152 0.123 79.99
P30 0.171 0.146 84.40
SEm+ 0.002 0.001 0.88
CD (P=0.05) 0.005 0.004 2.53
* Cl- :SO42-

Effect of phosphorus:
On going throw the data in Table 4.8 show that phosphorus content in
root and shoot of chickpea at flowering stage increased significantly with the
application of phosphorus. Significantly highest P content in root and shoot
recorded with the application of 30 mg P kg-1 soil which was higher by 30.53
and 12.50 per cent in case of root and 41.75 and 18.70 per cent higher in
case of shoot over control and 15 mg P kg-1 soil, respectively.
4.1.2.1.2 P-mobility ratio at flowering stage
Effect of salinity:
The data given in Table 4.8 indicate that P mobility ratio of chickpea at
flowering decreased significantly by increasing salinity in irrigation water. The
magnitude of decrease was more pronounced in Cl- dominated water at all
salinity levels except 2 and 6 dSm-1 where both salinities (Cl- and SO42-)
differed non significantly. The maximum P-mobility ratio was obtained under
treatment C0 and minimum under C6. The decrease in P-mobility ratio at
flowering stage was to the extent of 5.74, 9.48, 15.83, 21.31, 24.58 and 25.82
per cent, respectively due to C1, C2, C3, C4, C5 and C6 over C0.
Effect of phosphorus:
It is explicit from the data (Table 4.8) that application of different levels
of phosphorus significantly increased the P-mobility ratio in chickpea at
flowering stage. Application of 15 and 30 mg P kg-1 of soil significantly
increased the P- mobility ratio to the extent of 2.92 and 8.59 per cent at
flowering stage, respectively over control. The treatment P15 remained at with
P0.

4.1.2.1.3 Phosphorus content in grain, stover and root at harvest stage
Effect of salinity:
An examination of data (Table 4.9) indicated that different levels of
salinity of water significantly decreased the P content in grain, stover and root
over control (0.5 dSm-1). Irrigation water containing Cl->SO42- i.e. C2, C4 and
C6 recorded significantly less P content than those obtained with water
containing SO42->Cl- i.e. C1, C3 and C5. In case of root C1 and C2 remained
statistically at par with each other. The C1, C2, C3, C4, C5 and C6 decreased
the phosphorus content in grain, stover and root to the extent of 7.23, 11.66,
19.11, 24.47, 29.60 and 34.73 per cent in grain, 8.98, 16.77, 26.95, 33.53,
40.72 and 46.71 per cent in stover and 4.97, 8.70, 13.66, 18.63, 22.36 and
27.33 per cent in root, respectively over contro l.
Effect of phosphorus:
Further reference to data given in Table 4.9 shows that increasing
levels of phosphorus increased the P content in grain, stover and root
significantly. Significantly highest P content in grain, stover and root recorded
with application of 30 mg P kg-1 soil which was higher by 27.33 and 14.45 per
cent in case of grain, 57.14 and 24.19 per cent in case of stover and in root, it
was 20.47 and 11.68 per cent over control and 15 mg P kg-1 soil, respectively.

Table : 4.9 Effect of salinity of water (EC) and phosphorus on
phosphorus content (%) in root, stover and grain and P- mobility ratio at harvest stage
Treatments P content P-mobility ratio
Root Stover Grain Stover Grain
Salinity EC (dSm-1)
C0 (Control) 0.161 0.167 0.429 102.79 266.07
C1- 2 (1:3)* 0.153 0.152 0.398 98.22 259.15
C2- 2 (3:1)* 0.147 0.139 0.379 93.48 256.83
C3- 4 (1:3)* 0.139 0.122 0.347 87.17 249.84
C4- 4 (3:1)* 0.131 0.111 0.324 84.38 248.13
C5- 6 (1:3)* 0.125 0.099 0.302 78.52 241.34
C6- 6 (3:1)* 0.117 0.089 0.280 75.37 238.93
SEm+ 0.002 0.002 0.005 0.81 2.22
CD (P=0.05) 0.007 0.006 0.015 2.31 6.35
P levels (mg P kg-1 soil)
P0 0.127 0.098 0.311 76.52 244.60
P15 0.137 0.124 0.346 89.75 252.27
P30 0.153 0.154 0.396 99.42 257.54
SEm+ 0.002 0.001 0.004 0.53 1.45
CD (P=0.05) 0.005 0.004 0.010 1.52 4.16
* Cl- :SO42-

4.1.2.1.4 P-mobility ratio in grain and stover at harvest stage
Effect of salinity:
A perusal of the data (Table 4.9) revealed that P-mobility ratio of
chickpea at harvest (in both grain and stover) decreased significantly with
increasing level of salinity in irrigation water and magnitude of decrease was
more in Cl- dominated salinity as than that of SO42- salinity i.e. 3.47, 6.74 and
10.20 per cent in grain and 9.06, 17.91 and 26.68 per cent in stover under C2,
C4 and C6 against 2.60, 6.10 and 9.29 per cent in grain and 4.45, 15.20 and
26.61 per cent in stover under C1, C3 and C5, respectively over control.
However, in case of mobility ratio of grain all salinity levels differed non
significantly. The maximum P-mobility ratio at harvest stage was obtained
under C0 and minimum under C6.
Effect of phosphorus:
On going throught the data in Table 4.9 show that application of
different levels of phosphorus significantly increase the P-mobility ratio in
chickpea at harvest stage in both grain and stover. Application of 15 and 30
mg P kg-1 soil significantly increased the P-mobility ratio to the extent of 3.14
and 5.29 per cent grain and 17.29 and 29.93 per cent in stover, respectively
over C0.

4.1.2.2 Nitrogen
Effect of salinity:
It is apparent from the data (Table 4.10) that N content in grain and
stover tended to increase or increased significantly with increasing level of
salinity in irrigation water and magnitude of increase was more pronounced in
Cl- dominated water at all salinity levels. Significantly higher N content in grain
was recorded with C6 over rest of the salinity levels. Similar trend of increase
was also notice in case of stover. Both Cl- and SO42- dominated treatments of
each salinity levels (2, 4 and 6 dSm-1) of irrigation water remained at par but
C1 and C2 remained at par with control (C0) only in case of stover. The C1, C2,
C3, C4, C5 and C6 increased the nitrogen content to the extent of 4.06, 5.37,
8.38, 10.04, 12.01 and 13.33, per cent in grain and 1.70, 3.70, 3.40, 7.84,
11.24, 22.48 and 46.01 per cent in stover, respectively over control.
Effect of phosphorus:
It is evident from the data summarized in Table 4.10 that increasing
levels of phosphorus increased the nitrogen content in grain and stover
significantly. Significantly highest N content in grain and stover recorded at 30
mg P kg-1 soil which was higher by 5.32 and 2.77 per cent in case of grain and
in stover it was 11.42 and 6.75 per cent over control and 15 mg P kg-1 soil,
respectively.

Table : 4.10 Effect of salinity of water (EC) and phosphorus on nitrogen
and potassium content (%) in grain and stover
Treatments Nitrogen Potassium
Grain Stover Grain Stover
Salinity EC (dSm-1)
C0 (Control) 2.589 0.765 0.970 1.845
C1- 2 (1:3)* 2.694 0.778 0.929 1.808
C2- 2 (3:1)* 2.728 0.791 0.896 1.758
C3- 4 (1:3)* 2.806 0.825 0.853 1.688
C4- 4 (3:1)* 2.849 0.851 0.808 1.628
C5- 6 (1:3)* 2.900 0.937 0.764 1.568
C6- 6 (3:1)* 2.934 1.117 0.741 1.468
SEm+ 0.017 0.014 0.013 0.026
CD (P=0.05) 0.048 0.040 0.037 0.075
P levels (mg P kg-1 soil)
P0 2.743 0.823 0.754 1.457
P15 2.811 0.859 0.861 1.690
P30 2.889 0.917 0.940 1.894
SEm+ 0.011 0.009 0.009 0.017
CD (P=0.05) 0.031 0.026 0.024 0.049
* Cl- :SO42-

4.1.2.3 Potassium
Effect of salinity:
A perusal of data the data (Table 4.10) revealed that different levels of
salinity of irrigation water significantly decreased the K content in grain and
stover over control (0.5 dSm-1). Irrigation water containing Cl->SO42- at same
level of EC i.e. C2, C4 and C6 recorded significantly less K content than those
obtained with water containing SO42->Cl- at same level of EC i.e. C1, C3 and
C5. In stover treatment C0 and C1 and C3 and C4 remained statistically at par
but treatment C1 and C2 and C5 and C6 remained at par in case of grain only.
The C1, C2, C3, C4, C5 and C6 decreased the potassium content to the extent
of 4.23, 7.58, 12.06, 16.70, 21.24 and 23.61 per cent in grain and 2.01, 4.72,
8.50, 11.76, 15.01 and 20.44 per cent in stover, respectively over control.
Effect of phosphorus:
Data revealed that (Table 4.10) increasing level of phosphorus
increased the K content in grain and stover significantly. In case of grain,
highest K content was obtained under the application of 30 mg P kg-1 soil and
it registered 24.67 and 9.18 per cent increase over control and 15 mg P kg -1
soil, respectively. Similarly, in stover, the corresponding K content was 29.99
and 12.07 per cent.

4.1.2.4 Sulphur
Effect of salinity:
On going through the data in Table 4.11 shows that S content in grain
and stover tended to increase or increased significantly with increasing levels
of salinity in irrigation water and magnitude of increase was more pronounced
in SO42- dominated water at all salinity levels except 6 dSm-1 where it was
more in Cl- dominated water. Both SO42- and Cl- dominated treatment of each
salinity levels (2, 4 and 6 dSm-1) of irrigation water remained at par. The
treatment C1 and C2 also found at par with C0 only in case of grain. The C1,
C2, C3, C4, C5 and C6 increased the S content to the extent of 8.97, 7.37,
20.19, 13.78, 23.40 and 29.81 per cent in grain and 9.15, 6.78, 16.95, 13.90,
22.03 and 26.78 per cent in stover, respectively over Control (normal water).
Effect of phosphorus:
It is evident from the data summarized in Table 4.11 that subsequent
addition of phosphorus significantly increased the S content in grain and
stover. Significantly highest (0.400 and 0.367 %) S content in grain and stover
recorded at 30 mg P kg-1 soil which was higher by 25.00 per cent in case of
grain and 32.33 per cent in case of stover over P0, respectively.

Table : 4.11 Effect of salinity of water (EC) and phosphorus on sulphur
content (%) in grain and stover
Treatments Sulphur
Grain Stover
Salinity EC (dSm-1)
C0 (Control) 0.312 0.295
C1- 2 (1:3)* 0.340 0.322
C2- 2 (3:1)* 0.335 0.315
C3- 4 (1:3)* 0.375 0.345
C4- 4 (3:1)* 0.355 0.336
C5- 6 (1:3)* 0.385 0.360
C6- 6 (3:1)* 0. 405 0. 374
SEm+ 0.010 0.008
CD (P=0.05) 0.028 0.023
P levels (mg P kg-1 soil)
P0 0.320 0.305
P15 0.355 0.335
P30 0.400 0.367
SEm+ 0.006 0.005
CD (P=0.05) 0.018 0.015
* Cl- :SO42-

4.1.2.5 Calcium
Effect of salinity:
A perusal of data (Table 4.12) revealed that calcium content in grain
and stover tended to increase or increased significantly with increasing levels
of salinity in irrigation water and magnitude of increase was more pronounced
in Cl- dominated water at all salinity levels. Significantly higher Ca content in
grain recorded with C6 over rest of saline water treatments. Similar trend of
increase was also notice in case of stover. The C1, C2, C3, C4, C5 and C6
increased the Ca content in grain and stover to the extent of 6.67, 16.97,
26.06, 35.76, 47.88 and 55.15 and 13.49, 24.34, 35.78, 48.09, 62.17 and
74.49 per cent, respectively over control (C0).
Effect of phosphorus:
The data presented in Table 4.12 explicit that increasing level of
phosphorus decreased the Ca content in grain and stover significantly.
Significantly highest Ca content in grain and stover recorded at P0 which was
higher by 12.14 and 20.31 per cent in case of grain and in stover was 16.98
and 50.81 per cent over P15 and P30, respectively.

Table : 4.12 Effect of salinity of water (EC) and phosphorus on calcium,
magnesium and sodium content (%) in grain and stover
Treatments Calcium Magnesium Sodium
Grain Stover Grain Stover Grain Stover
Salinity EC (dSm-1)
C0 (Control) 0.165 0.341 0.77 0.98 0.291 0.276
C1- 2 (1:3)* 0.176 0.387 0.80 1.08 0.306 0.290
C2- 2 (3:1)* 0.193 0.424 0.73 0.99 0.328 0.315
C3- 4 (1:3)* 0.208 0.463 0.76 1.04 0.345 0.337
C4- 4 (3:1)* 0.224 0.505 0.72 1.00 0.366 0.354
C5- 6 (1:3)* 0.244 0.553 0.84 1.12 0.384 0.374
C6- 6 (3:1)* 0.256 0.595 0.70 1.04 0.395 0.385
SEm+ 0.003 0.008 0.01 0.02 0.006 0.005
CD (P=0.05) 0.010 0.022 0.02 0.03 0.016 0.015
P levels (mg P kg-1 soil)
P0 0.231 0.558 0.80 1.05 0.361 0.353
P15 0.206 0.477 0.73 1.01 0.345 0.335
P30 0.192 0.370 0.70 1.00 0.328 0.311
SEm+ 0.002 0.005 0.01 0.01 0.004 0.003
CD (P=0.05) 0.006 0.014 0.02 0.03 0.010 0.010
* Cl- :SO42-

4.1.2.6 Magnesium
Effect of salinity:
The data pertaining (Table 4.12) to the effect of salinity of irrigation
water on Mg content in plant and revealed that Mg content in grain and stover
tend to increase or increased significantly due to application of increasing
level of salinity in irrigation water and magnitude of increase was more
pronounced in SO42- dominated salinity as than that of Cl- dominated salinity
i.e. 3.90, 1.30 and 9.09 per cent in grain and 10.20, 6.12 and 14.29 per cent in
stover under C1, C3 and C5 against 5.19, 6.49 and 9.09 per cent in grain and
1.02, 2.04 and 6.12 per cent in stover under C2, C4 and C6, respectively over
control. All salinity treatments differed significantly .Significantly higher Mg
content in grain and stover recorded with C5 over rest of salinity levels.
Effect of phosphorus:
Data (Table 4.12) revealed that every level of applied phosphorus
significantly decreased the Mg content in grain and stover. Application of
phosphorus @30 mg kg-1 soil decreased the value of Mg by 9.59 and 14.29
per cent in case of grain and 3.96 and 5.00 per cent lower in case of stover
over P15 and P30, respectively.

4.1.2.7 Sodium
Effect of salinity:
On going through the data in Table 4.12 show that effect of different
levels of salinity of irrigation water on Na content in grain and stover was
found significant and data revealed that a marked improvement in Na content
in grain and stover was recorded due to increase in salinity of irrigation water.
Irrigation water containing Cl->SO42- i.e. C2, C4 and C6 level recorded 12.71,
25.77, 35.74 per cent higher Na content in grain and 14.13, 28.26 and 39.49
per cent higher Na content in stover over control (C0), respectively. The
corresponding increase in Na content due to water containing SO42->Cl-
salinity i.e. C1, C3 and C5 was 5.15, 18.56 and 31.96 per cent in grain and
5.07, 22.10 and 35.51 per cent in stover. In grain and stover C0 with C1 and
C5 with C6 remained statistically at par to each other.
Effect of phosphorus:
It is evident from Table 4.12 that Na content in chickpea grain and
stover trend to decreased significantly with successive increase in the levels
of phosphorus. The application of 30 mg P kg-1 soil significantly decreased the
Na content by 9.14 and 4.92 per cent in case of grain and 11.90 and 7.16 per
cent in stover over control and application of 15 mg P kg-1 soil, respectively.

4.1.2.8 Chloride
Effect of salinity:
An examination of data (Table 4.13) indicate that the increasing level of
salinity increase the chloride content in grain and stover significantly and the
magnitude of increase was more pronounced in Cl- dominated water at all
salinity levels. The C1, C2, C3, C4, C5 and C6 increased the chloride content to
the extent of 67.09, 73.42, 79.75, 86.08, 92.41 and 100.00 per cent in grain
and 167.37, 174.74, 183.16, 193.68, 203.16 and 212.63 per cent in stover,
respectively over control (normal water).
Effect of phosphorus:
Data given in Table 4.13 further showed that application of phosphorus
significantly decreased the chloride content in grain and stover. Application of
15 and 30 mg P kg-1 soil decreased the chloride content to the extent of 7.59
and 12.41 per cent in grain and 7.14 and 12.41 per cent in stover, respectively
over control.

Table : 4.13 Effect of salinity of water (EC) and phosphorus on chloride
content in grain and stover
Chloride content (%)
Treatments Grain Stover
Salinity EC (dSm-1)
C0 (Control) 0.79 0.95
C1- 2 (1:3)* 1.32 2.54
C2- 2 (3:1)* 1.37 2.61
C3- 4 (1:3)* 1.42 2.69
C4- 4 (3:1)* 1.47 2.79
C5- 6 (1:3)* 1.52 2.88
C6- 6 (3:1)* 1.58 2.97
SEm+ 0.01 0.02
CD (P=0.05) 0.04 0.06
P levels (mg P kg-1 soil)
P0 1.45 2.66
P15 1.34 2.47
P30 1.27 2.33
SEm+ 0.01 0.01
CD (P=0.05) 0.03 0.04
* Cl- :SO42-

4.2 SOIL STUDIES
4.2.1 EC of soil
Effect of salinity:
A perusal of data in Table 4.14 revealed that the electrical conductivity
of soil saturation extract at harvest increased significantly with increasing
levels of salinity of irrigation water. Minimum EC was observed under C0
(normal water), while maximum under C6 [6 dSm-1 Cl-:SO42- (3:1)] which was 3
times higher as compared to C0. The general pattern of effect of different
levels of salinity of irrigation water on ECe of soil in increasing order was
C6>C5>C4>C3>C2>C1.
Effect of phosphorus :
Further reference to data given in Table 4.14 showed that EC in soil
influenced non-significantly (Appendix-XII) with application of phosphorus.
However, decreasing trend was observed with the application of phosphorus.
4.2.2 pH of soil
Effect of salinity:
It is apparent from the data given in Table 4.14 that application of
different saline water non-significantly decreased the soil pH over control. The
highest pH (8.79) of soil recorded under C0 (control) and minimum under C5.
The magnitude of decrease was more in SO42- dominated salinity as than that
of Cl- salinity. All salinity levels (2, 4 and 6 dSm-1) remained at par with in
them. The C1, C2, C3, C4, C5 and C6 decrease the soil pH to the extent of 3.64,
3.07, 6.14, 4.66, 7.74 and 6.71 per cent, respectively over C0 (control).

Table : 4.14 Effect of salinity of water (EC) and phosphorus on EC (dSm-
1), pH and SAR of soil after harvest of crop
Treatments EC pH SAR
Salinity EC (dSm-1)
C0 (Control) 1.94 8.79 11.29
C1- 2 (1:3)* 2.40 8.47 13.13
C2- 2 (3:1)* 3.11 8.52 14.78
C3- 4 (1:3)* 3.75 8.25 17.38
C4- 4 (3:1)* 3.94 8.38 19.22
C5- 6 (1:3)* 4.55 8.11 23.65
C6- 6 (3:1)* 5.65 8.20 25.15
SEm+ 0.06 0.15 0.46
CD (P=0.05) 0.18 0.41 1.30
P levels (mg P kg-1 soil)
P0 3.67 8.46 18.25
P15 3.61 8.38 17.90
P30 3.58 8.33 17.25
SEm+ 0.04 0.10 0.30
CD (P=0.05) NS NS NS
* Cl- :SO42-

Effect of phosphorus:
It evident from the data summarized in Table 4.14 that application of
phosphorus non-significantly influenced the soil pH (Appendix-XII).
4.2.3 SAR of soil
Effect of salinity:
A critical examination of the data in Table 4.14 indicate that different
levels of salinity significantly increased the SAR of soil over control (C0). The
magnitude of increase was more pronounced in Cl- dominated water at all
salinity levels. All the levels of salinity differed significantly among them. The
highest SAR (25.15) of soil was recorded under C6 and minimum (11.29)
under C0 (control).
Effect of phosphorus:
Further examination of the data revealed that (Table 4.14) the
application of phosphorus unable to attained the level of significance with
respect to SAR of soil (Appendix-XII).
4.2.4 Available phosphorus
Effect of salinity:
A perusal of the data (Table 4.15) revealed that available phosphorus
in soil after crop harvest significantly decreased with increasing level of EC iw
over C0 and decreasing trend was more pronounced in SO42- dominated water
at all salinity levels. All salinity treatments differed significantly. The maximum

(21.92 kg ha-1) available phosphorus obtained under the treatment C0 and
minimum (10.96 kg ha-1) under C5. The decrease in available phosphorus was
to the extent of 12.50, 5.79, 29.15, 22.45, 50.00 and 43.20 per cent,
respectively by C1, C2, C3, C4, C5 and C6 over control (normal water).
Effect of phosphorus:
Data presented in Table 4.15 clearly indicate that the available
phosphorus content in soil after crop harvest increased significantly with the
application of phosphorus. The maximum available phosphorus (21.67 kg ha -
1) recorded under P30 (30 mg P kg-1 soil) and it was higher by 77.04 and 31.17
per cent over control and 15 mg P kg-1 soil, respectively.
4.2.5 Available sulphur
Effect of salinity:
It is obvious from Table 4.15 the available S in soil after harvest of crop
increased significantly with irrigation of different levels of salinity over control.
The magnitude of increase was more in SO42- dominated salinity. The highest
(11.73 ppm) available sulphur was obtained under treatment C5 and lowest
(6.39 ppm) under C0. Available S in soil significantly increased with increasing
level of ECiw containing SO42->Cl- to the extent of 21.13, 47.10 and 83.56 per
cent, respectively by C1, C3, and C5 over control (normal water). Whereas,
water containing Cl- >SO42-, i.e. C2, C4 and C6, the extent of increase was
1.72, 28.79 and 69.17 per cent, respectively.

Table : 4.15 Effect of salinity of water (EC) and phosphorus on available
phosphorus, sulphur and chloride content in soil after harvest of crop
Treatments Phosphorus
(P2O5) (kg ha-1)
Sulphur
(ppm)
Chloride
(ppm)
Salinity EC (dSm-1)
C0 (Control) 21.92 6.39 1.63
C1- 2 (1:3)* 19.18 7.74 1.72
C2- 2 (3:1)* 20.65 6.50 1.90
C3- 4 (1:3)* 15.52 9.40 2.04
C4- 4 (3:1)* 17.00 8.23 2.26
C5- 6 (1:3)* 10.96 11.73 2.44
C6- 6 (3:1)* 12.45 10.81 2.71
SEm+ 0.51 0.21 0.05
CD (P=0.05) 1.46 0.61 0.15
P levels (mg P kg-1 soil)
P0 12.24 7.59 2.07
P15 16.52 8.55 2.08
P30 21.67 9.92 2.15
SEm+ 0.33 0.14 0.03
CD (P=0.05) 0.95 0.40 NS
* Cl- :SO42-
Effect of phosphorus:
The data pertaining to the effect of phosphorus on available S content
in soil after harvest of crop are summarized in Table 4.15 shows that available
sulphur increased significantly with all levels of phosphorus. The data further
indicate that the magnitude of increased in sulphur status of soil was found
more (9.92 ppm) under 30 mg P kg-1 soil compared to 15 mg P kg-1 soil over
control. The maximum available sulphur in soil recorded under P30 which was
higher by 30.70 and 16.02 per cent over control and 15 mg P kg -1 soil,
respectively.
4.2.6 Chloride content
Effect of salinity:
A reference to data in Table 4.15 revealed that chloride content in soil
after harvest of crop significantly increased with increasing level of EC iw to the
extent of 5.59, 16.71, 25.00, 38.94, 50.00 and 66.71 per cent, respectively by
C1, C2, C3, C4, C5, C6 over control (normal water). The magnitude of increase
was more in Cl- dominated salinity. The highest (2.71 ppm) Cl content was
obtained under treatment C6 and lowest (1.63 ppm) under C0 and treatment
C1 remained at par with C0 (control).
Effect of phosphorus:
On going through the data in Table 4.15 and Appendix-XIII obviously
show that Cl content in soil after harvest of crop influenced non-significantly
with all levels of phosphorus. However, increasing trend was observed with
the application of phosphorus.

4.3 COMPUTATION OF SALINITY TOLERANCE
4.3.1 Inoic ratio
4.3.1.1 Na/K ratio
Effect of salinity:
An examination of data presented in Table 4.16 revealed that Na/K
ratio in grain and stover increased significantly with increasing level of salinity
of irrigation water. The magnitude of increase was more pronounced in Cl-
dominated water at all salinity levels. The difference between C0 and C1
remained statistically at par with each other in both grain and stover. The
treatment C5 and C6 remained at par only in case of grain.
Effect of phosphorus:
Further examination of data (Table 4.16) shows that increasing level of
phosphorus significantly decreased the Na/K ratio in grain and stover. The
application of 30 mg P kg-1 soil decreased the Na/K ratio significantly to the
extent of 27.25 and 12.99 per cent in grain and 32.11 and 16.92 per cent in
stover over control (P0) and 15 mg P kg-1 soil (P15), respectively.

4.3.1.2 Ca/ Mg ratio
Effect of salinity:
The perusal of data given in Table 4.16 show that increasing level of
salinity of irrigation water significantly increased the Ca/Mg ratio in grain and
stover. The magnitude of increase was more in Cl- dominated water as than
that of SO42- dominated water. Irrigation water containing Cl- > SO4
2- i.e. C2,
C4 and C6 level recorded 23.36, 45.33 and 71.03 per cent higher Ca/Mg ratio
in grain and 24.14, 44.83 and 63.79 per cent higher Ca/Mg ratio in stover over
control (C0) respectively. The corresponding increase in Ca/Mg ratio due to
water containing SO42- >Cl- salinity i.e. C1, C3 and C5 was 2.80, 27.57 and
35.51 per cent in grain and 2.87, 27.59 and 41.38 per cent in stover. Highest
Ca/Mg ratio in grain and stover increased under C6.
Effect of phosphorus:
It is evident from the data (Table 4.16) that increasing level of
phosphorus significantly decreased the Ca/Mg ratio in grain and stover. The
application of 30 mg P kg-1 soil decreased the Ca/Mg ratio significantly to the
extent of 2.84 and 5.19 per cent in grain and 30.38 and 21.26 per cent in
stover over control and 15 mg P kg-1 soil, respectively.

Table : 4.16 Effect of salinity of water (EC) and phosphorus on Na/K and Ca/Mg ratio in grain and stover
Treatments Na/K Ca/Mg
Grain Stover Grain Stover
Salinity EC (dSm-1)
C0 (Control) 0.303 0.152 0.214 0.348
C1- 2 (1:3)* 0.333 0.163 0.220 0.358
C2- 2 (3:1)* 0.370 0.182 0.264 0.432
C3- 4 (1:3)* 0.409 0.203 0.273 0.444
C4- 4 (3:1)* 0.458 0.221 0.311 0.504
C5- 6 (1:3)* 0.508 0.243 0.290 0.492
C6- 6 (3:1)* 0.539 0.267 0.366 0.570
SEm+ 0.012 0.006 0.002 0.003
CD (P=0.05) 0.033 0.017 0.006 0.008
P levels (mg P kg-1 soil)
P0 0.488 0.246 0.289 0.530
P15 0.408 0.201 0.282 0.471
P30 0.355 0.167 0.274 0.369
SEm+ 0.008 0.004 0.001 0.002
CD (P=0.05) 0.022 0.011 0.004 0.005
* Cl- :SO42-

4.3.1.3 Na+K/Ca ratio
Effect of salinity:
Table 4.17 show that there was significant decrease in Na+K/Ca ratio
in grain and stover with increasing level of salinity of irrigation water. The
magnitude of decrease was more pronounced in Cl- dominated water. The
highest value of Na+K/Ca ratio of grain and stover under C0 (7.702 and
6.301). The C1, C2, C3, C4, C5 and C6 decrease the Na+K/Ca ratio to the
extent of 8.17, 16.98, 24.60, 31.39, 38.37 and 41.86 per cent, in grain and
10.32, 19.14, 27.69, 35.01, 41.87 and 48.47 per cent in stover, respectively
over control (normal water). The treatment C5 and C6 remained at par with
each other in both grain and stover.
Effect of phosphorus:
Further, reference to data given in Table 4.17 show that Na+K/Ca ratio
in grain and stover increased significantly with application of phosphorus. The
maximum Na+K/Ca ratio obtain under P30 and minimum under P0.
Significantly height Na+K/Ca ratio in grain and stover recorded with
application of 30 mg P kg-1 soil which was higher by 37.09 and 12.89 per cent
in case of grain and in stover was 84.05 and 40.52 per cent over control and
15 mg P kg-1 soil, respectively.

4.3.1.4 Na/Ca ratio
Effect of salinity:
It is obvious from data (Table 4.17) that Na/Ca ratio in grain and stover
decreased significantly with increasing level of salinity of irrigation water. The
trend of decrease was more pronounced in Cl- dominated water. The highest
value of Na/Ca ratio in grain and stover under C0 and lowest under C6. Both
SO42- and Cl- dominated treatment of each salinity levels (2, 4 and 6 dSm-1)
remained at par with each other. The C1, C2, C3, C4, C5 and C6 decrease the
Na/Ca ratio to the extent of 1.36, 3.52, 5.79, 7.15, 10.50 and 12.26 per cent in
grain and 4.74, 5.49, 7.37, 10.61, 13.86 and 17.60 per cent in stover,
respectively over control (normal water).
Effect of phosphorus:
Data (Table 4.17) reflect that Na/Ca ratio in grain and stover
significantly increased with application of increasing level of phosphorus.
Maximum Na/Ca ratio obtained under P30 and minimum under P0.
Significantly highest Na/Ca ratio in grain and stover recorded with application
of 30 mg P kg-1 soil which was higher by 9.35 and 2.02 per cent in case of
grain and in stover was 32.86 and 19.58 per cent over control and 15 mg P
kg-1 soil, respectively.

Table : 4.17 Effect of salinity of water (EC) and phosphorus on Na+K/Ca and Na/Ca ratio in grain and stover
Treatments Na+K/Ca Na/Ca
Grain Stover Grain Stover
Salinity EC (dSm-1)
C0 (Control) 7.702 6.301 1.762 0.801
C1- 2 (1:3)* 7.073 5.651 1.738 0.763
C2- 2 (3:1)* 6.394 5.095 1.700 0.757
C3- 4 (1:3)* 5.807 4.556 1.660 0.742
C4- 4 (3:1)* 5.284 4.095 1.636 0.716
C5- 6 (1:3)* 4.747 3.663 1.577 0.690
C6- 6 (3:1)* 4.478 3.247 1.546 0.660
SEm+ 0.127 0.149 0.040 0.020
CD (P=0.05) 0.363 0.426 0.114 0.056
P levels (mg P kg-1 soil)
P0 4.959 3.367 1.573 0.639
P15 6.022 4.410 1.686 0.710
P30 6.798 6.197 1.720 0.849
SEm+ 0.083 0.098 0.026 0.013
CD (P=0.05) 0.238 0.279 0.075 0.037
* Cl- :SO42-

4.3.2 Ionic regulation index for Ca
Effect of salinity:
An examination of data presented in table 4.18 revealed that significant
increase was recorded in IRI-Ca at harvest stage of chickpea under all levels
of salinity of irrigation water. The magnitude increase was more in Cl-
dominated salinity as than that of SO42- salinity. Both Cl- and SO4
2- dominated
salinity at each salinity levels (2, 4 and 6 dSm-1) remained statistically at par to
each other. The maximum IRI-Ca noted under C6 [6 dSm-1 Cl-:SO42- (3:1)]
which was significantly higher by 21.34, 16.83, 11.59, 8.64 and 1.62 per cent
over C1, C2, C3, C4 and C5, respectively.
Effect of phosphorus:
Further, reference to data (Table 4.18) indicate that IRI-Ca in chickpea
was increased significantly with the application of different levels of
phosphorus. The maximum value of IRI-Ca was observed under P30 and
minimum under P0 (control). Treatment P30 increased IRI-Ca significantly over
P0 and P15 to the extent of 28.24 and 10.10 per cent, respectively.

4.3.3 Ionic regulation index for Na
Effect of salinity:
The critical examination of data (Table 4.18) show that significant
increase was recorded in IRI-Na at harvest stage of chickpea under all the
levels of salinity of irrigation water. The magnitude of increase was more
pronounced in Cl- dominated salinity as than that of SO42- salinity. Both Cl-
and SO42- dominated treatments of each salinity levels (2, 4 and 6 dSm-1) of
irrigation water remained at par with each other. The maximum IRI-Na noted
under C6 which was significantly higher by 90.41, 80.94, 45.99, 38.67 and
5.30 per cent over C1, C2, C3, C4 and C5, respectively.
Effect of phosphorus:
It is explicit from the data in Table 4.18 IRI-Na in chickpea was
significantly decreased with increasing levels of phosphorus application. The
maximum value of IRI-Na was observed under control and minimum under
P30. Treatment P30 decreased the IRI-Na significantly over P0 and P15 to the
extent of 41.67 and 37.81 per cent, respectively.
4.3.4 Ionic regulation index for K
Effect of salinity:
A perusal of the data presented in Table 4.18 show that IRI-K
decreased significantly with increasing levels of salinity of irrigation water and
magnitude of decrease was more in Cl- dominated salinity as than that of
SO42- dominated salinity. At all salinity level (2, 4 and 6 dSm-1) both Cl- and

SO42- salinities remained statistically at par to each other. Significantly
highest IRI-K was observed under C1 while lowest under C6. The treatment C6
decreased the IRI-K to the extent of 31.67, 30.26, 22.12, 19.27 and 4.33 per
cent over C1, C2, C3, C4 and C5, respectively.
Table : 4.18 Effect of salinity of water (EC) and phosphorus on ionic
regulation index for Ca, Na and K at harvest stage of crop
Treatments Ca Na K
Salinity EC (dSm-1)
C1- 2 (1:3)* 0.881 1.147 0.840
C2- 2 (3:1)* 0.915 1.207 0.823
C3- 4 (1:3)* 0.958 1.496 0.737
C4- 4 (3:1)* 0.984 1.575 0.711
C5- 6 (1:3)* 1.052 2.074 0.600
C6- 6 (3:1)* 1.069 2.184 0.574
SEm+ 0.022 0.053 0.015
CD (P=0.05) 0.064 0.152 0.043
P levels (mg P kg-1 soil)
P0 0.850 1.920 0.621
P15 0.990 1.801 0.701
P30 1.090 1.120 0.820
SEm+ 0.016 0.038 0.011
CD (P=0.05) 0.045 0.107 0.031
* Cl- :SO42-

Effect of phosphorus:
Table 4.18 show that the effect of phosphorus on IRI-K in chickpea
increased significantly with application of different level of phosphorus. The
maximum value of IRI-K was observed under P30 and minimum under P0
(control). Treatment P30 increased the IRI-K significantly over P0 and P15 to
the extent of 32.05 and 16.98 per cent, respectively.
4.3.5 Degree of compartmentation
Effect of salinity:
A reference to data in Table 4.19 revealed that the increasing levels of
salinity of irrigation water significantly increased the degree of
compartmentation. The magnitude of increase was more pronounced in Cl-
dominated salinity as than that of SO42- salinity i.e. 3.61, 14.46 and 25.30 per
cent under C2, C4 and C6 against 1.81, 12.05 and 21.69 per cent under C1, C3
and C5, respectively over control. At all salinity levels (2, 4 and 6 dSm-1) Cl-
and SO42- dominated treatment remained at par to each other and treatment
C1 also remained at par with C0. The highest value of degree of
compartmentation was obtain under the application of C6 [6dSm-1 Cl-:SO42-
(3:1)] of irrigation water and it registered that C1, C2, C3, C4, C5 and C6
increased the degree of compartmentation to the extent of 1.81, 3.61, 12.05,
14.46, 21.69 and 25.30 per cent respectively over control (C0).
Effect of phosphorus:
Data presented in table 4.19 show that there was significant decrease
in degree of compartmentation with progressive increase in phosphorus
application up to 30 mg kg-1. The application of 30 mg P kg-1 soil significantly
decreased the value of degree of compartmentation to the extent of 19.52 and
10.24 per cent over control and 15 mg P kg-1 soil, respectively.

Table : 4.19 Effect of salinity of water (EC) and phosphorus on degree of
compartmentation at flowering stage
Treatments Degree of compartmentation
Salinity EC (dSm-1)
C0 (Control) 8.10
C1- 2 (1:3)* 8.45
C2- 2 (3:1)* 8.90
C3- 4 (1:3)* 9.60
C4- 4 (3:1)* 10.20
C5- 6 (1:3)* 10.19
C6- 6 (3:1)* 10.40
SEm+ 0.23
CD (P=0.05) 0.67
P levels (mg P kg-1 soil)
P0 10.45
P15 9.37
P30 8.41
SEm+ 0.15
CD (P=0.05) 0.44
* Cl- :SO42-

5 DISCUSSION
In the course of presenting the results of the experiment entitled
“Phosphorus requirement of chickpea (Cicer arietinum L.) irrigated with
chloride and sulphate dominated saline water” significant va riation in the
criteria used for evaluating the treatments were observed. In this chapter it is
endeavored to discuss the significant units or those assuming a definite
pattern in respect of various parameters studied, so as to establish cause and
effect relationship in the light of available evidences and literature.
5.1 Effect of salinity
5.1.1 Yield attributes and yield
The data about total and effective nodules per plant, nodule index,
plant height, test weight, pods per plant, seeds per pod, grain and stover yield
as influenced by different levels of salinity have been presented in Table 4.1,
4.2, 4.3 and 4.5 and appendices-II-V.
Significant reduction in total and effective nodules per plant, nodule
index, plant height, test weight, pods per plant, seeds per pod, grain and
stover yield with an increase in levels of salinity (EC) of irrigation water was
observed in present study. This is due to the build -up of salinity in soil
irrigated with different saline water containing excessive Cl- and SO42- of Na,
Ca and Mg which affects the plant growth adversely results from high osmotic
stress, low physiological availability of water and direct toxic effects of

individual ions. This may be explained on the basis of fact that increasing
levels of salinity in water increased the EC and SAR of soil resulting into
decreased availability of N, P and K (Bajwa et al., 1998). Soil salinity affects
nutrient availability by modifying retention, fixation and transformation of
nutrients in soils, interfering with the uptake and/or absorption of nutrients due
to disproportionate ionic composition have reduced nutrient metabolisms
mainly due to water stress which leads to poor plant growth and development
(Srinivasrao et al., 2004). Further, poor symbiotic N fixation due to toxic
effects of salts on rhizobia also leads to drastic reduction in nodulation. The
higher amount of salts may also adversely affect the enzymatic activities and
utilization of photosynthates in plant. There are several evidences that
cationic (Ca, Mg, Na, K) imbalance could lead to disturbances in
photosynthesis and activity of stroma enzymes (Brand and Beckler, 1984 and
Plaut and Griew, 1988).
The test weight decreased with increasing EC of irrigation water. This
is due to the fact that the anthesis and grain filling stages are most sensitive
stage to salinity stress in the soil. The grain remained shriveled if the crop
experience salinity, nutritional and water stress at this stage. The results are
in conformity with the work of Pathan et al. (2000) in clusterbean, Gururaja
Rao et al. (2003) in groundnut, Netwal (2003) in cowpea and Kumawat (2004)
in fenugreek.
Pods per plant and seeds per pod decreased with increase in EC of
irrigation water. This is because of the fact that high EC of irrigation water
resulting into high EC of soil which decreased the physiological availability of
water to plants. The normal cell division which is responsible for production of

yield attributes may also be slowed down under saline condition. The
reduction in number of pods per plant and seeds per pod may also be due to
destruction of naturally accruing hormones under saline conditions. Results of
these investigation are in similar line with those of Promila and Kumar (1982)
in pigeonpea, Mathur and Lal (1998) in fenugreek and Netwal (2003) in
cowpea.
The magnitude of decrease in all above yield attributes and yield was
more pronounced in Cl- dominated salinity as than that of SO42- salinity at all
levels of salinity. The adverse effect was less with SO42- than Cl- ions because
the efficient and more absorption of nutrients by plant under SO42- salinity
than under Cl- salinity due to synergism between SO42- and other ions and
antognism between Cl- and other ions particularly PO43- ions. This corroborate
earlier experience in wheat, barley and table pea (Manchanda et al., 1982,
Mor and Manchanda, 1992 and Sharma et al., 2007). Lauter and Munns
(1986) and Manchanda et al. (1991) also reported that chickpea produced
more yield in Na2SO4 than in NaCl salinity.
In general the significant decrease in yield under influence of
application of different salinity water was due to the increase in EC of soil
which inturn responsible for the reduction in grain and stover yield by causing
a restricted availability of water and nutrients to the plant. This was supported
by the existence of a significant negative correlation (Appendix-I) between
grain yield and EC (r = -0.404) and SAR (r = -0.435*) of soil. Several workers
have also observed the significant yield reduction of chickpea (Lauter and
Munns, 1986, Manchanda and Sharma, 1989, Khandelwal et al., 1990;

Manchanda et al., 1991, Sharma and Manchanda, 1989) with the increasing
level of salinity in irrigation water.
5.1.2 Nutrient content
The data about N, P, K, Ca, Mg, S, Na and Cl content in grain and
stover, P content in root and shoot at flowering stage and P content in root at
harvest stage and P-mobility ratio as influenced by different levels of salinity
(EC) in irrigation water have been presented in Table 4.8-4.13 and
Appendices-VI - XI.
P content in root and shoot and mobility ratio of P at flowering stage
(Table 4.8), P content in root, stover and grain and mobility ratio of P at
harvest stage (Table 4.9) decreased significantly with an increase in levels of
salinity (EC). The magnitude of decrease was more pronounced in Cl-
dominated salinity as than that of SO42- salinity. This decrease in P content
and mobility ratio may be due to synergism between SO42- and PO4
3- and
antagonism between Cl- and PO43- ions. Antagonism has also been reported
between Cl and P in wheat (Manchanda et al. 1982), tomato (Award et al.
1990), Chickpea (Manchanda and Sharma, 1989, Manchanda et al. (1991).
The correlation coefficient values (Appendix-I) also confirmed that EC of soil
correlated negatively and significantly with P content in grain (r= -0.817**), P
content in stover (r = -0.750**), mobility ratio of P in grain (r = -0.856**) and
stover (r = -0.713**).
N content in grain and stover increased significantly with increasing
levels of salinity and magnitude of increase was more in Cl- dominated salinity
as compared to SO42- salinity (Table 4.10). This increase may be explained on
the basis of hypothesis of Strogonov and Oknina (1961) who stated that in

crop plants grown under higher salinity, the contraction of protoplast destroys
the intercellular connections in many plant parts and this brings about a
diminution in the exchange of water and nutrients between the cells.
Accumulation of nitrogen content in grain of chickpea was also reported by
Manchanda et al. (1991) and in wheat by Sharma et al. (2007) with increasing
level of salinity in irrigation water.
K content in grain and stover of chickpea decreased with increasing
level of EC of irrigation water (Table 4.10) and the decrease was more in Cl-
dominated salinity than SO42- salinity at all EC level (Table 4.9). This is due to
an increase concentration of Na in the soil solution. The increased
concentration of Na in soil solution causes more absorption of Na by plants
and decreases the uptake of K as Na competes with K on absorbing sites.
The ability of crop to grow under high Na saturation is due to the toxic effect of
Na it self and K deficiency caused by antagonistic on the basis of hypothesis
of Heimann (1958) who was of the view that Na-K relationship may be
synergistic or antagonistic depending upon ratio between them. These results
find support from the work of Balki and Padole (1982), Chhipa (1984),
Manchanda and Sharma (1989), Khandelwal et al. (1990) and Manchanda et
al. (1991) who reported a reduction in K content with increasing level of
salinity of irrigation water.
S content in grain and stover increased significantly at all levels of
salinity (Table 4.11) and more with SO42- salinity except highest salinity levels
(6dSm-1) where it was more in Cl- dominated water might be due to the fact
that S absorption in plants was inhibited by Cl- ions, owing possibly to
antagonism between Cl- and SO42- ions. Greater S content in the grain and

stover at highest level of EC of water (6 dSm-1) under Cl- salinity relative to the
normal water could be attributed to connectration effect due to reduced
growth of plants at EC of water of 6 dSm-1. (Sharma et al., 2007). Similar
results were also reported by Manchanda et al. (1991) who reported that S
content in chickpea, broadbean and pea plants decreased with increasing
level of salinity of irrigation water and more so in Cl dominated salinity than
SO42- salinity.
Ca, Mg, Na and Cl content in grain and stover of chickpea (Table 4.12
and 4.13) increased significantly with the increase in EC of water but SO42-
dominated salinity generally contained more Na content in both grain and
stover, however, Ca and Cl content in grain and stover was more under Cl-
dominated salinity. This could be attributed to decreased Ca absorption in
SO42- salinity than in Cl- dominated salinity because of lower activity of Ca in
the former and higher activity of Cl- in later and decreased Ca absorption in
SO42- dominated salinity might have encouraged Mg absorption (Manchanda
et al., 1991). These results are agreement with those Lal and Bhardwaj
(1984), Sudhakar et al. (1990), Gill and Sharma (1993), Pathan et al. (2000),
Essa (2002) and Virdiya et al. (2008) who observed increase in Ca, Mg, Na
and Cl content in plant with increasing level of salinity (EC) of irrigation water.
5.1.3 Soil properties
The data about EC, pH SAR, available phosphorus (P2O5) S and Cl
content of soil after harvest of crop as influenced by different levels of salinity
have been presented in Table 4.14 and 4.15 and appendices-XII and XIII.
Data revealed that a marked increase in EC, SAR and Cl content of
soil have occurred as a result of an increase in levels of salinity of irrigation

water. The magnitude of increase was more pronounced in Cl- dominated
salinity as than that of SO42- salinity. EC of soil increased significantly with
increasing levels of EC of irrigation water. It appears that by increasing levels
of EC of irrigation water, more quantity of salt was delivered to the soil which
ultimately resulted in higher EC of soil. A close relationship between the salt
content of the soil and irrigation water has also been reported by Lal and
Singh (1974), Deo and Lal (1982), Agrawal et al. (2002) and Gururaja Rao et
al. (2003).
The results of present investigation also get support from the findings
of Sharma (1988), Kumawat (1990), Khandelwal et al. (1990) and Khandelwal
and Lal (1991).
pH of soil decreased significantly with increasing level of salinity and
magnitude of decrease was more in SO42- dominated salinity as than that of
Cl- salinity. The observed decrease in soil pH may further be ascribed to the
depression of thickness of the diffuse double layer at higher concentration of
soluble salts in the soil (Russell, 1963). The decrease in soil pH with an
increase in EC of irrigation water was also observed by Lal and Singh (1974),
Deo and Lal (1982), Khandelwal and Lal (1991) and Agrawal et al. (2002). As
described above, the SAR of soil increased significantly with an increase in
EC of irrigation water. Increase in SAR of soil may also be due to the fact that
during accumulation of salts due to irrigation and evaporation, the ratio of Na
to Ca is changed resulting into high SAR values in soil. The existence of
positive and significant correlation between EC and SAR (r = 0.976**) also
support this findings in present study (Appendix-I). The result find support
from the work of Deo (1979), Singh (1980), Pathan (1987), Sharma (1991),

Sharma and Minhas (2004) who found a considerable increase i n SAR of soil
with an increase in EC of irrigation water.
The availability of phosphorus in soil decreased significantly with the
increasing level of salinity in irrigation water. The adverse effect was less with
SO42- than Cl- ions because Na+ and Cl- ions increased the solubility of
CaCO3 more than SO42- ions, which tend to increase phosphate precipitation
(Minhas and Gupta, 1992). This contention also get support from the negative
and significant correlation of available P2O5 with EC (r = -0.635**) and SAR (r
= -0.707**) in present study (Appendix-I).
Available sulphur increased with application of increasing levels of
salinity but magnitude of increase was more pronounced in SO42- dominated
water than that of Cl- dominated water and reverse trend was observed in
case of chloride accumulation in the soil which might be due to the mutual
antoganism between SO42- and Cl- ions. Thus, when Cl content in the root
zone exceeds a threshold value, it adversely affected the availability of
sulphur (Mor and Manchanda, 1992). The findings of present investigation get
support from the work of Minhas and Gupta (1992), Moolchandani (1994),
Netwal (2003), Kumawat (2004) and Sharma et al. (2007).
5.1.4 Computation of salinity tolerance
5.1.4.1 Inoic ratio
The Na/K ratio in grain and stover of chickpea increased significantly
with increasing level of salinity. The magnitude of increase was more
pronounced in Cl- dominated salinity than that of SO42- salinity (Table 4.16
and appendix-XIV). This may be due to the fact that Na concentration

increased salinity by higher uptake of Na from soil solution and by using Na
salts in the experiment for development of salinity in irrigation water, while the
K concentration decreased. Salinity tolerance was associated with efficient K
regulation in shoot. K concentration and K fluxes were highest in the control
and decreased under salinity. The result find support from the work of Rana
and Singh (1977), Chhipa (1984) and Sharma and Manchanda (1989) who
also observed increased Na/K ratio in grain and stover with increasing level of
salinity.
The Ca/Mg ratio in grain and stover of chickpea increased significantly
with increasing level of salinity. The magnitude of increase was more
pronounced in Cl- dominated salinity than that of SO42- salinity (Table 4.16
and appendix-XIV). This may be due to the fact that Ca concentration
increased with the increasing level of salinity, while the Mg concentration
decreased. The results are in close conformity with Rana and Singh (1977)
and Sharma and Manchanda (1989) who reported increased Ca/Mg ratio in
grain and stover of chickpea with increasing level of salinity.
The Na+K/Ca and Na/Ca ratios in grain and stover decreased
significantly with increase in levels of salinity and magnitude of decrease was
more in Cl- dominated salinity than that of SO42- salinity (Table 4.17 and
appendix-XV). This may be due to the fact that increase in salinity, the
concentration of Ca increased in soil as well as in grain and stover of crop.
The lower Na+K/Ca and Na/Ca ratios at higher levels of EC showed more
tolerance to salinity than higher Na+K/Ca and Na/Ca ratios at lower levels of
EC. Yadav (1993) and Pathan et al. (2000) have also reported lower Na+K/Ca
ratios in wheat and clusterbean, respectively, at higher level of EC. The
results are in conformity with the findings of Gupta and Srivastava (1989),
Chhipa and Lal (1985) and Sharma and Manchanda (1989) who reported

lower Na+K/Ca and Na/Ca ratios in plant with increasing salinity of irrigation
water.
5.1.4.2 Ionic regulation index for Ca, Na and K (IRI-Ca, IRI-Na and IRI-
K)
The IRI-Ca and IRI-Na at harvest increased significantly with
increasing level of salinity in irrigation water and magnitude of increase was
more in Cl-dominated water as than that of SO42- dominated water (Table
4.18). This may be explained on the basis that under saline water,
concentration of Ca and Na increased in soil and Na depressed the uptake of
K and Ca due to competition for uptake across the plasma membrane of plant
cells. Na/K ratio also increased due to higher concentration of Na+, which
results in higher regulation of Ca2+, Na+ than K+ by chickpea. This maintains
high concentration of Na+ in plant cell resulting in reduced plant growth and
development and showed sensitivity at high salinity level. The results of
present investigation are in close conformity with work of Meena (1989),
Kumawat (1989) and Netwal (2003).
5.1.4.3 Degree of compartmentation
The degree of compartmentation is the active secretion of Na+ ions in
to the vacuole which protects the cytoplasm against high concentration of Na
(Kylin and Quatrano, 1975). The degree of compartmentation at flowering
stage of chickpea increased significantly with increasing level of salinity in
irrigation water (Table 4.19). The result are in agreement with the findings of
Meena (1989) and Kumawat (1989) who observed increase in EC of leaves of
wheat and pearlmillet with increasing levels of salt concentration. Higher value
of degree of compartmentation was recorded at higher salinity level and lower
under lower salinity level which shows a salt sensitive behaviour of chickpea.
The salt tolerance at lower degree of compartmentation regulated Na+ and K+

better than a salt susceptible species by maintaining a lower Na+ : K ratio in
each plant part (Qudar et al. 1980, Yadav, 1993 and Shekhawat, 1997).
5.2 Effect of phosphorus
5.2.1 Yield attributes and yield
The significant improvement in total and effective nodules per plant,
nodule index, plant height, test weight, pods per plant, seeds per pod, grain
and stover yield of chickpea with increasing level of phosphorus have been
presented in Table 4.1, 4.2, 4.3 and 4.5 and appendices-II-V.
Phosphorus has long been recognized as an essential constituent of all
living organisms and play an important role in the conservation and transfer of
energy in the metabolic reactions of living cells including biological energy
transformations. Phosphorus not only plays an important role in root
development and proliferation but it improves nodules formation and N2
fixation by supplying assimilates to the roots. It is the main constituent of co-
enzymes, ATP and ADP which acts as “energy currency” with in plants. Thus
phosphorus influences photosynthesis, biosynthesis of proteins and
phospholipids, nucleic acid synthesis, membrane transport and cytoplasmic
streaming. Increased availability of phosphorus owing to its application in the
soil which was otherwise poor in its content improved the nutrient availability
status resulting into greater uptake. The greater uptake of nutrients might
have increased the photosynthetic and carbohydrate synthesis and then
translocation to different parts for promoting meristamactic development in
potential apical buds and inter calary meristems which ultimately increased
root and shoot development e.g. plant height and root nodules per plant.

The results obtained in this investigation are in close conformity with
those of Kumawat (2004), Agarwal and Meena (1999) in fenugreek and
Thakur et al. (1999) in chickpea reported that total nodules per plant and plant
height increased significantly due to P fertilization.
The significant increase in grain and stover yield was observed due to
increasing levels of phosphorus upto 30 mg P kg-1 (Table 4.5 and appendix-
V). The increase in grain yield under application of phosphorus might be due
to the concomitant increase in number of pods per plant. This might be due to
the fact that excess assimilates stored in the leaves and later translocated into
grains at the time senescing being the closest sink. Thus, ultimately increased
the grain yield. Further, significant increase in stover yield was also noticed
with the application of 30 mg kg-1 phosphorus. The increase in stover yield
might be due to the result of over all increased growth and development of
plants.
These results were confirmed by Agarwal and Meena (1999) in
fenugreek, Kasturikrishana and Ahlawat (1999) in pea, Yadav and Jakhar
(2001) in mungbean, Patra and Bhattacharya (2000) in pea, Jat (2004) in
fenugreek, Sepat and Yadav (2008) in mothbean, Kumar and Thenua (2008)
in pigeonpea and Deo and Khandelwal (2009) in chickpea, who reported
increased test weight, pods per plant, seed per pod, grain and stover yields
due to P fertilization.
5.2.2 Nutrient content
The data about N, P, K, Ca, Mg, S, Na and Cl content in grain and
stover, P content in root and shoot at flowering stage and P content in root at
harvest stage and P-mobility ratio as influenced by different levels of

phosphorus in soil have been presented in Table 4.8-4.13 and appendices-
VI- XI.
P content in root and shoot and mobility ratio at flowering and harvest
stage, N, K and S in grain and stover increased significantly with levels of
phosphorus.
In saline water irrigated soils, availability of P decreases due to
precipitation of phosphorus, higher retention of soluble phosphorus,
antagonism due to excess Cl- and SO42- and restricted root growth. As
phosphorus and chloride are adsorbed by essentially the same mechanism,
excess concentration of Cl- may adversely affect the uptake of phosphorus
(Chhabra et al. 1976). Application of phosphatic ferti lizers in such condition
helps in increasing the uptake of P by increasing the surface area of the roots
in contact with soil solution P consequently higher mobility ratio of P in plant.
Increasing level of P over the recommended dose of P had a better effect on
yield and uptake of P in saline water condition was also reported by Minhas
and Gupta (1992). The increase in N content might be due to well developed
root system which might have increased the availability of phosphorus to soil
microbs which leads to increased multiplication of Rhizobium bacteria and
which inturn resulted in increased atomospheric N2 fixation and better
utilization of soil nitrogen (Tondon, 1991). The increased availability of P
status in soil increased the nutrient content both macro and micro with P
fertilization could be attributed to the balanced nutrient status of soil which
was deficient in N and P and medium in K (Table 3.2). The greater availability
of P improved the plant root system which resulted in greater K accumulation
in the crop. The increase in S content be due to increased available sulphur

status, better growth and increased absorption of sulphur by plants on
account of phosphorus application. These results are in the line with findings
of Agarwal (1997), Kumawat et al. (1998), Meena and Agarwal (1999) and
Singh et al. (2009). Ca, Mg and Na content in grain and stover decreased
significantly with increasing level of phosphorus application because that
SO42- and Cl- salts of Ca, Mg and Na are used in this experiment for
development of salinity (EC) in irrigation water. These Ca2+ and Mg2+ and Na+
ions react with soil-P and get precipited in their insoluble form (Ca-phosphate,
Mg phosphate and Na phosphate) by which availability of Ca, Mg and Na to
plant become very less with increasing level of phosphorus. Na+ and Ca2+
cations may also replaced by H2PO4- anions from exchangeable site by which
a decrease in Na and Ca absorption occur by plants ultimately Ca, Mg and Na
content in grain and stover decreased. Cl content decreased significantly in
grain and stover by application of increasing level of phosphorus due to the
antagonistic effect between PO43- and Cl- ion (Manchanda et al. 1991).
5.2.3 Soil properties
The data about EC, pH, SAR, available phosphorus (P2O5), S and Cl
content of soil after harvest of crop as influenced by different levels of
phosphorus have been presented in the table 4.14 and 4.15 and appendices-
XII and XIII.
The effect of application of P on EC, pH, SAR and Cl content of soil
was found to be non-significant.
The available phosphorus and S content in soil after harvest of crop
increased significantly with increasing levels of phosphorus. This is due to the
fact that P addition increased the available phosphorus. The increase in

available P content of soil with application of phosphorus could be due to the
utilization of native phosphorus with increasing rates of phosphorus which
resulted in building up to higher soil P status besides larger dressing of
fertilizers P may result in increased S mobility and availability in soil and may
make the soil system devoid of SO42- due to its subsequent leaching. A
synergistic effect of P on S availability was also reported by Virmani and
Gulati (1971).
These results of present investigation are supported by Aulakh et al.
(1990b), Indiati et al. (1995), Bhal and Singh (1997), Panwar (1997) and Deo
and Khandelwal (2009).
5.2.4 Computation of salinity tolerance
5.2.4.1 Ionic ratio
The Na/K and Ca/Mg ratios in grain and stover of chickpea decreased
significantly with the application of P (Table 4.16 and appendix-XIV). The
decrease in Na/K and Ca/Mg ratios could be due to the fact that P application
increases the cation exchange capacity of roots by increasing surface area
which helped in increasing absorption of nutrients from the soil. Increased
CEC of roots by P application, helps in more absorption of K+ and Mg2+ and
their translocation to upper parts of plants than Na+ and Ca2+ consequently
decreased Na+ regulation as well as Na/K and Ca/Mg ratios in grain and
stover. The present investigation is targeted to investigate the beneficial effect
of phosphorus application on inducement of salinity tolerance and is
concerned with the use of saline waters with P application. It is suggested
that application of phosphorus reduced the Na/K ratio and induced the salinity
tolerance in chickpea. Additional application of P helps in mitigating the

adverse effect of salinity by lowering the Na/K ratio in grain of wheat was also
stated by Lal and Lal (1992).
The Na/Ca and Na+K/Ca ratios in grain and stover increased
significantly with increase in P levels. P application under saline irrigation
waters, has great importance due to its beneficial role in many physiological,
biochemical and metabolic processes which help in the growth and
development of plant and ultimately in obtaining higher produce (Table 4.17).
This may be explained to the fact that P application decreased the
concentration of Ca2+ more as than of concentration of Na+ in grain and stover
and K+ concentration increased significantly with increasing levels of P
application. Due to increase in CEC of roots, there was more absorption and
translocation of K+ ion and Na+ ions to upper parts of plants including seeds.
Therefore, high concentration of K+, Na+ ions in plant cells leading to higher
Na/Ca and Na+K/Ca ratios in grain and stover due to P application. The
results get support from the findings of Manchanda et al. 1982 and Award et
al. (1990) who reported that increasing the solution P concentration reduced
the affect of salinity.
5.2.4.2 Ionic regulation index for Ca, Na and K (IRI-Ca, IRI-Na and IRI-K)
Application of P significantly increased the ionic regulation index for Ca
and K at harvest stage over control (Table 4.18 and appendix-XVI). The
increase in IRI-K and IRI-Ca in plant parts due to application of P might be
due to increase in K+ and Ca2+ concentration and uptake by plants. It is
evident from data on K, Ca and Na content (Table 4.10 and 4.12) in grain and
stover that P application decreased Na+ concentration, while, increased K+
and Ca2+ concentration resultant into decreased Na/K ratio in plant parts

indicating more regulation of K and Ca uptake than Na by chickpea plant and
higher concentration of K+ and Ca2+ in its cells resulting in higher yield
attributes and yield under P application. The steady state of Na+ ion fluxes as
well as the cytoplasmic and vascular Na+ ion contents were lower in presence
of K+ ions. Ionic regulation index for Na at harvest stage decreased
significantly (Tables 4.18). The decrease in IRI-Na in plant parts due to P
application could be due to decrease in concentration of Na+ and uptake by
plants and increase in uptake of K across the plasma membrane of plant
cells. This can result in lower Na/K ratio that improve the growth and
development of plant and eventually increases the yield. P application
reduces the regulation of Na+ uptake and lower concentration of Na in plant
cells. This shows that P application reduced the IRI-Na resulting in less
absorption of Na by plants which gave better results under higher salinity of
irrigation water. The results of present investigation are in close conformity
with work of Sacher et al. (1983) and Weir (1986).
5.2.4.3 Degree of compartmentation
The degree of compartmentation at flowering decreased significantly
with increasing level of P application (Table 4.19 and appendix-XVII).
The decrease in degree of compartmentation with increase in levels of
P application was due to decrease in Na/K ratio as a result of P application
which results in lower regulation of Na+ in plant cells that increase K+
absorption and regulation in plant cells indicating low salt accumulation in
cells, that‟s why, P application was more responsive under high saline water
conditions. P addition to the saline media enabled the maintenance of
relatively low levels of Na and high level of K in the immature leaves (at

flowering) demonstrates that P addition to saline conditions may enhance the
capacity to regulate ioinic distribution between plant parts (Awad et al. (1990).
The requirement of more P in salinized condition could thus be related to its
role in energy fixation and carbohydrate partitioning and transport (Gibson,
1980), however, P also involved in the formation of cell membrane lipids
which play a vital role in ionic regulation (Bieleski and Ferguson, 1983). The
results get supports with the findings of Awad et al. (1990) who reported that
accumulation of ions necessary for osmotic adjustment and restriction of Na
and Cl accumulation in immature leaves appears to be involved in P
enhancement of salt tolerance of tomato plants.
5.3 Interactive effect of salinity and phosphorus on pods per plant
and grain and stover yield
The combined effect of salinity and phosphorus on pods per plant and
grain and stover yield (Table 4.4, 4.6 and 4.7, appendix-IV & V and Fig. 4.1-
4.3) was found significant. Data show that at all EC levels, the crop under
SO42- salinity yielded more grain than did Cl- salinity at all P levels. As at EC of
2, 4 and 6 dSm-1, grain and stover yield at 30 mg P kg-1 soil under Cl- salinity
was nearly at par with 15 mg P kg-1 soil under SO42- salinity indicating that for
obtaining relatively equal yield at comparable EC levels, the P requirement of
chickpea was considerably more (50%) under Cl- salinity that under SO42-
salinity. In other words, the increased salt/Cl content in the soil accumulated
by Cl- dominated saline irrigation water enhanced the P requirement of
chickpea probably to offset the increased osmotic effects. The pods per plant,
grain and stover yield of chickpea increased with increasing levels of P at all
salinity levels of irrigation water. It can be explained with the fact that the

solubility and availability of P in saline water irrigated soil may increase or
decrease depending upon the total of salinity and nature of the reacting ions.
The adverse effect was less with SO42- than the Cl- because Na+ and Cl-
increased the solubility of CaCO3 more than SO42- ions, which tends to
increase phosphate precipitation. Application of P, thus, seems to mitigate the
adverse effect of salinity. These results showed that the absorption of P in
plant was more efficient under SO42- salinity than under Cl- salinity at
comparable EC levels, suggesting synergism between SO42- and PO4
3- and
antagonism between Cl- and SO42- ions. This corroborates earlier results in
wheat, barley and table pea (Manchanda et al., 1982, Mor and Manchanda,
1992 and Sharma et al., 2007). Studies of Minhas and Gupta (1992) and
Sharma et al. (2007) have also indicated that higher salinity waters can be
used for achieving same level of wheat production if Cl- : SO42- ratio of
irrigation water is lowered or additional doses of P are added indicating more
P requirement of wheat when irrigated with Cl- dominated than SO42-
dominated water having comparable EC values.

6 Summary and Conclusion
Investigation on “Phosphorus requirement of chickpea (Cicer arietinum
L.) irrigated with chloride and sulphate dominated saline water” was carried out
in rabi 2010-11 at cage house of Department of Plant Physiology, S.K.N.
College of Agriculture, Jobner.
The experiment consisted of 21 treatment combinations, comprising
seven levels of salinity waters [0, 2 dSm-1 Cl-:SO42- (1:3), 2 dSm-1 Cl-:SO4
2-
(3:1), 4 dSm-1 Cl-:SO42- (1:3), 4 dSm-1 Cl-:SO4
2- (3:1), 6 dSm-1 Cl-:SO42- (1:3)
and 6 dSm-1 Cl-:SO42- (3:1)], three levels of phosphorus (0, 15 and 30 mg ka-1
phosphorus). The experiment was conducted in pots and laid out in
completely randomized design, with three replications.
The results obtained during the course of investigation are summarized
and concluded as under.
1. Application of different salinity waters significantly decreased the total
and effective nodules, nodule index, plant height, test weight, pods
per plant, seed per pod, grain and stover yield of chickpea. The
magnitude of decrease was more pronounced in Cl- dominated salinity
than that of SO42- salinity.
2. Total and effective nodules, nodule index, plant height, test weight,
pods per plant, seed per pod, grain and stover yield of chickpea
increased significantly with increasing levels of phosphorus upto 30
mg P kg-1 soil.

3. Interactive effect of different salinity levels and P on pods per plant,
grain and stover yields was found significant and maximum were
recorded with C0P30 treatment combination.
4. Increasing levels of salinity resulted in significant decrease in P
content in root and shoot at flowering stage, P content in root, grain
and stover at harvest stage and K content in grain and stover. The
magnitude of decrease was more pronounced in Cl- dominated salinity
than that of SO42- salinity.
5. P-mobility ratio at flowering and harvest decreased significantly with
increasing levels of salinity and magnitude of decrease was more in
Cl- dominated salinity as than that of SO42- salinity.
6. N, Ca, Mg, Na and Cl content in grain and stover increased
significantly with increasing levels of salinity and magnitude of
increase was more in Cl- dominated salinity as compared to SO42-
salinity.
7. S content in grain and stover significantly increased at all level of
salinity but more with SO42- salinity except highest salinity levels
(6 dSm-1) where it was more in Cl- dominated salinity.
8. Application of phosphorus significantly increased P content in root and
shoot at flowering stage, P content in root, grain and stover at harvest
stage and N, K and S content in both grain and stover, while, Ca, Mg,
Na and Cl content in grain and stover decreased significantly.
9. Increasing levels of phosphorus significantly increased the P-mobility
ratio at both flowering and harvest stage upto 30 mg P kg-1 soil.

10. The EC, SAR and Cl content of post harvest soil was significantly
increased with increasing levels of salinity (EC) and magnitude of
increase was more in Cl- dominated salinity as than that of SO42-
salinity.
11. Available S also increased with increasing level of salinity but
magnitude of increase was more in SO42- dominated salinity.
12. Available P2O5 of soil decreased significantly with increasing levels of
salinity and magnitude of decrease was more pronounced in SO42-
dominated salinity than that of Cl- dominated salinity.
13. Available P and S in soil after harvest of crop increased signi ficantly
with increasing level of phosphorus.
14. Na/K and Ca/Mg ratios in grain and stover increased significantly with
increasing levels of salinity and magnitude of increase was more
pronounced in Cl- dominated salinity as than that of SO42- salinity.
15. Na+K/Ca and Na/Ca ratios in grain and stover decreased significantly
with increasing level of salinity and magnitude of decrease was more
in Cl- dominated salinity as than that of SO42- salinity.
16. Application of phosphorus significantly decreased Na/K and Ca/Mg
ratios in grain and stover.
17. Application of phosphorus significantly increased Na+K/Ca and Na/Ca
ratios in grain and stover.
18. IRI-Ca and IRI-Na at harvest increased significantly with increasing
levels of salinity and magnitude of increase was more in Cl- dominated
salinity as than that of SO42- salinity.

19. IRI-K at harvest decreased significantly with increasing levels of
salinity and magnitude of decrease was more in Cl- dominated salinity
as than that of SO42- salinity.
20. Application of phosphorus significantly increased the IRI-Ca and IRI-K
at harvest upto 30 mg P kg-1 soil.
21. IRI-Na at harvest decreased significantly with the application of
phosphorus.
22. Application of different levels of salinity (EC) significantly increased
the degree of compartmantation at flowering stage of chickpea.
23. Application of phosphorus significantly decreased the degree of
compartmatation at flowering stage of chickpea.
CONCLUSION
Based on the results of present study, it can be concluded as under:
1. Grain and stover yield and nutrient content data pointed out that for
obtaining comparable yield under Cl- and SO42- salinity at comparable
EC levels, P requirement of crop under Cl- salinity was enhanced
considerably as compared to SO42- salinity. The magnitude of
phosphorus response was maximum under Cl- dominated salinity
compared to SO42- dominated salinity suggesting that additional doses
of P are added for yield maximization.
2. Application of P narrowed the ionic ratios in grain and stover indicating
that P fertilization mitigates the adverse effect of salinity of water by
inducing tolerance to salinity in the crop. This showed that salinity
tolerance in chickpea could possible be enhanced to some extent by
application of 50 per cent more phosphorus than recommended under
Cl- dominated salinity.

Bibliography
Agarwal, H.R. 1997. Effect of irrigation, phosphorus and sulphur on fenugreek
(Trigonella foenum-graecum L.). Ph.D. (Ag.) Thesis, Rajasthan
Agricultural University, Bikaner (Raj.).
Agarwal, H.R. and Meena, N.L. 1999. Effect of irrigation, phosphorus and
sulphur on yield attributes and seed yield of fenugreek (Trigonhela
foenum graecum L.), 4th Agricultural Science Congress, February, 21-
24,Jaipur pp. 172 (P 324).
Agarwal, P.B.; Sinha, A.K. and Yadav, B.R. 2002. Influence of saline water
irrigation and varying soil moisture regimes on soil properties, crop
water use and yield of wheat inter-crop. Journal of the Indian Society of
Soil Science, 50 : 287-293.
Akbari, K.N., Sutaria, G.S.; Vora, V.D.; Hirpara, D.S. and Padmani, D.R. 2010.
Effect of periodical application of phosphorus with and without FYM on
yield of groundnut on vertic ustochrepts under rainfed agriculture.
Legume Research., 33: 64-66.
Anantharaju, P. and Muthiah, A.R. 2007. Effect of NaCl salinity sress on seed
germination and seedling growth of chickpea (Cicer arietinum L.).
Legume Research, 30 : 141-144.
Annomymous, 2009. Agriculture statistics at a glance. Directorate of
Economics and Statistic, Department of Agriculture and Cooperation
Ministry of Agriculture Government of India.
Annomymus, 2009. Danik Jagaran New Paper, 6th June, pp.1 New Delhi.

Ashraf, M. and Rasal, F. 1988. Salt tolerance of mungbean (Vigna radia (L.) at
low growth stages. Plant and Soil, 110 : 63-67.
Aulakh, M.S.; Pasricha, N.S. and Azad, A.S. 1990. P-S interrelationship for
soyabeans on P and S deficient soil. Soil Science, 149 : 705-709.
Awad, A.S.; Edwards, D.G. and Campbell, L.C. 1990. Phosphorus
enhancement of salt tolerance of tomato. Crop Science, 30 : 123-128.
Bajwa, M.S.; Choudhary, O.P. and Josan, A.S. 1998. Sodic water and their
management In : (N.K. Tyagi and P.S. minhas eds.) Agricultural
Salinity management in India. ICAR, New Dehli, India pp. 431-450.
Balki, A.S. and Padole, V.R. 1982. Effect of pre-soaking seed treatments with
plant hormones on wheat under conditions of soil salinity. Journal of
the Indian Society of Soil Science, 30 : 361-365.
Bernstein Leon, Francois, L.E. and Clark, R.A. 1974. Interactive effect of
salinity and fertility on yields of grains and vegetables. Agronomy
Journal. 412-421.
Bhal, G.S. and Singh, A. 1997. The inorganic soil phosphorus fraction and
available P as influenced by green manuring, cropping and phosphorus
fertilization. Journal of the Indian Society of soil Science, 45 :19-23.
Bhargava, B.S. and Raghupathi, H.B. 1993. In: Methods of analysis of soils,
plants, waters and fertilizers. H.L.S. Tondon (Ed.) F.D.C.O., New Delhi.
pp : 41.
Brand, J.J. and Becker, D.W. 1984. Evidence for direct role of calcium in
photosynthesis. Journal of Bioenergetics and Biomembranes, 16 : 239-
249.

Cerda, A. and Bingham, F.T. and Hoffman, G.J. 1977. Interactive effect of
salinity and phosphorus on sesame. Soil Science Society of America
Journal, 41 : 915-918.
Chauhan, R.P.S.; Bhudayal and Chauhan, C.P.S. 1988. Effect of residual
sodium carbonate in irrigation water on soil and bread wheat (Triticum
aestivum L.). Indian Journal of Agricultural Sciences, 58 : 454-458.
Chesnin, L. and Yien, C.H. 1951. Turbidimetric determination of available
sulphates. Soil Science Society of America Proceedings, 15 : 149-151.
Chhabra, R.; Ringoet, A. and Lamberts, D. 1976. Kinetics and interaction of
chloride and phosphate absorption by intact tomato plants from a dilute
nutrient solution. Journal of Pflanzen Physiology, 78 : 253-261.
Chhipa, B.R. 1984. A study on the indices of salinity, sodicity and boron
tolerance of Wheat crop. Ph. D. Thesis, Sukhadia University, Udaipur.
Deo Chandra and Khandelwal, R.B. 2009. Effect of P and S nutrition on yield
and quality of chickpea (Cicer arietinum L.). Journal of the Indian
Society of Soil Science, 57: 352-356.
Deo, Chandra 1979. A study on the effect of qualities of irrigation water and
soil moisture regimes on the performance of mustard T-59 and
taramira grown on loamy sand soil. M.Sc. (Ag.) Thesis, University of
Udaipur, Udaipur (Raj.)
Deo, Chandra and Lal, P. 1982. Effect of water quality and moisture regimes
on soil properties and yield of mustard and taramira (Eruca sativa).
Journal of the Indian Society of Soil Science, 30 : 411-414.
Essa, T.A. 2002. Effect of soil salinity on yield and quality of soybean. Journal
of Agronomy and Crop Science, 138 : 86-93.

Gibson, T.S. 1988. Carbohydrate metabolism and phosphorus salinity
interaction in wheat (Triticum aestivum L.). Plant and Soil, 111 : 25-35.
Gill, K.S. and Sharma, P.C. 1993. Mechanism of salt injury at seedling and
vegetative growth stages in Cajanus cajan L. Millsp. Plant Physiology
and Biochemistry, 20 : 49-52.
Gupta, S.C. and Srivastava, J.P. 1989. Effect of salt stress on morpho-
physiological parameters in wheat. Indian Journal of Plant Physiology,
32 : 169-171.
Gururaja Rao, G.; Nayak ,A.K. and Chinchmalatpure A. ,R. 2003. Yield and
yield attributes of wheat (Triticum aestivum L.) as influenced by
conjunctive use of saline water with surface water on saline black soils.
Journal of the Indian Society of Soil Science, 51 : 86-88.
Heimann, H. 1958. Irrigation with saline water and the ionic environment.
Potassium symposium International Potash Institute, Switzerland, P-
173-220.
Indiati, R.; Sharpley, A.N.; Izza, C. Figliolita, A.; Felici, B. and Sequi, P. 1995.
Soil phosphorus sorption and availablity as a function of high
phosphorus fertilizer addition. Communication in Soil Science and
Plant Analysis, 26 : 1863-1872.
Jackson, M.L. 1973. Soil chemical analysis. Printice Hall of India Pvt. Ltd.,
New Delhi.
Jat, B.L. 2004. Nodulation in fenugreek as affected by phosphorus sulphur
and bio-fertilizers in saline loamy sand soils. Legume Research, 27:
126-128.

Johnson, C.M. and Ulrich, A. 1959. Analytical method use in plant analysis.
California Agriculture Experiment station, Bulletin, 766.
Kanwar, J.S. and Kanwar, B.S. 1968. Quality of irrigation water. 9 th
Transaction on 9th International Congress on soil Science, 391-403.
Kasturikrishna, S. and Ahlawat, I.P.S. 1999. Growth and yield response of pea
(Pisum sativum L.) to moisture stress, PSB and Zn fertilizer on growth
and development. Indian Journal of Agronomy, 45 : 353-356.
Khandelwal, R.B. and Lal, P. 1991. Effect of salinity, sodicity and boron of
irrigation water on the properties of different soils and yield of wheat.
Journal of the Indian Society of Soil Science, 39 : 537-541.
Khandelwal, R.B., Singh, Baldev and Singh, Banani 1990. Effect of quality
irrigation water on soil properties, yield and nutrient composition of
different, gram genotypes. Journal of the Indian society of Soil Science,
38 : 358-360.
Kumar, Jitender, 2011. Effect of phosphorus and Rhizobium inoculation on the
growth, nodulation and yield of garden pea (Pisum sativum L.) cv.
“Matter Ageta-6”. Legume Research, 34 : 20-25.
Kumar, P. and Thenua, O.V.S. 2008. Performance of pigeonpea (Cajanus
cajan) as influenced by intercropping with blackgram (Vigna mungo),
phosphorus nutrition and bio-fertilizers. Annals of Agriculture Research,
28 : 58-62.
Kumawat, G.L. 1989. Response of millet (Pennisetum typholicles Burm. F.)
genotypes under supplemental irrigation with saline sodic waters and
composition of salt tolerance index. M.Sc. (Ag.). Thesis, Rajasthan
Agricultural University, Bikaner.

Kumawat, R.M. 2004. Effect of FYM and phosphorus on the performance of
fenugreek (Trigonella fenum-graecum L.) irrigated with saline water.
M.Sc. (Ag.) Thesis Rajasthan Agricultural University, Bikaner.
Kumawat, S.K.; Agarwal, H.R. and Pareek, R.G. 1998. Effect of row spacing
and phosphorus levels on fenugreek (Trigonella foenum-graecum L.)
with and without Rhizobium inoculation. Annals of Biology, 14: 161-
164.
Kylin, A. and Quatranto, R.S. 1975. Metabolic and biochemical aspects on salt
tolerance. In: A, Poljakoff-Mayber and Journal Gale : Ecological
studies, 15: 147-167.
Lal, P. and Lal F. 1980. A study on the evaluation of water quality with respect
to boron for wheat and barley grown on loamy sand soil. Annals of Arid
Zone, 19 : 239-241.
LAL, P. AND SINGH, K.S. 1974. A COMPARATIVE STUDY ON THE EFFECT
OF QUALITIES OF IRRIGATION WATER ON DIFFERENT SOILS.
JOURNAL OF THE INDIAN SOCIETY OF SOIL SCIENCE. 22 : 19-25.
Lal, R. and Lal, P. 1992. Some ionic ratios of wheat as affected by qualities of
irrigation water and N, P, and K fertilizers. Journal of the Indian Society
of Soil Science, 40 : 401-403.
Lal, R.K. and Bhardwaj, S.N. 1984. Effect of salinity on mineral and ionic
balance in field pea (Pisum sativum L.). Indian Journal of Plant
Physiology, 27 : 351-354.
Lauter, D.J. and Munns, D.N. 1986. Salt resistance of chickpea genotypes in
solution contained with NaCl and Na2SO4, Plant and Soil, 95 : 271-299.

Manchanda, H.R. and Sharma, S.K. 1989. Tolerance of chloride and sulphate
salinity in chickpea. Journal of Agricultural Sciences, 113 : 407-410.
Manchanda, H.R.; Sharma, S.K. and Bhandari, D.K. 1982. Response of barley
and wheat to phosphorus in the presence of chloride and sulphate
salinity. Plant and Soil, 66 : 233-241.
Manchanda, H.R.; Sharma, S.K. and Mor, R.P. 1991. Relative tolerance of
pulses for chloride and sulphate salinity. Indian Journal of Agricultural
Sciences, 61 : 20-26.
Mathur, V.L. and Lal, L. 1998. Stability of fenugreek (Trigonella foenm-
graecum L.) varieties under saline conditions. Legume Research, 21 :
151-158.
Meena, H.S. 1989. Response of wheat genotypes under irrigation with saline
sodic water and computation of salt tolerant index. M.Sc. (Ag.) Thesis,
Rajasthan Agricultural University, Bikaner (Rajasthan).
Meena, L.R.; Singh, R.K. and Gautam, R.C. 2006. Effect of moisture
conservation practices, phosphorus levels and bacterial inoculation on
growth, yield and economics of chickpea (Cicer arietinum L.). Legume
Research, 29 : 68-72.
Meena, N.L. and Agarwal, H.R. 1999. Effect of irrigation, phosphorus and
sulphur on quality and nutrient uptake in fenugreek (Trigonela foenum
graecum L.), 4th Agricultural Science Congress, February, 21-24,Jaipur
pp. 173 (P. 325).
Minhas, P.S. and Gupta, R.S. 1992. Quality of irrigation water: Assessment
and management. ICAR, New Dehli.

Misra, S.K. 2001. Salt tolerance of different cultivars of chickpea as influenced
by zinc ferti lization. Journal of the Indian Society of Soil Science, 49 :
135-140.
MoA 2008. Agriculture statistics at a glance, Ministry of Agriculture, New
Delhi.
Moolchandani, H. 1994. Effect of salinity and nitrate levels of irrigation water
on plant growth and soil properties. M.Sc. (Ag.) Thesis, Rajasthan
Agricultural University, Bikaner.
Mor, R.P. and Manchanda, H.R. 1992. Influence of phosphorus on the
tolerance of table pea to chloride and sulphate salinity in a sandy soil.
Arid Soil Research and Rehabilitation, 6 : 41-52.
Nawange D.D, Yadav ,A.S, Singh,R.V.2011.Effect of phosphorus and sulphur
application on growth, yield attributes and yield of chickpea (Cicer
arietinum L). Legume Research, 34: 48-50.
Nayak, A. K.; Gururaja Rao, G. and Chinchmalatpure, Anil R. 2001.
Conjunctive use of saline water in Indian Mustard on Salt-affted Black
soil. Journal of the Indian Society of Soil Science, 49 : 328.
Netwal, L.C. 2003. Effect of F.Y.M. and vermicompost on nutrient uptake and
quality of cowpea [Vigna unguiculata (L.) Walp] grown under saline
condition. M. Sc. (Ag.) Thesis Rajasthan Agricultural University,
Bikaner.
Olsen, S.R.; Cole, C.V.; Watanabe, F.S. and Dean, L.A. 1954. Estimation of
available P in soil by extraction with sodium bicarbonate. Circular,
United States Development of Agriculture,19 : 939.

Panse, V.G. and Sukhatme, P.V. 1967. Statistical method for agricultural
workers. ICAR, New Delhi.
Panwar, B.S. 1997. Effect of Cd and P application on Olsen‟s extractable
phosphorus in soil at different time interval. Journal of the Indian
Society of Soil Science, 45 : 398-399.
Pathan, A.R.K. 1987. Evaluation of salinity and sodicity hazard of irrigation
water for clusterbean (Cymposis tetragonoloba (L.) Taub.) grown on
different soils. M.Sc. (Ag.) Thesis, Sukhadia University, Udaipur.
Pathan, A.R.K. 2001. Effect of zinc application on tolerant and sensitive
verities of wheat grown on sodic soil. Ph. D. Thesis, Rajasthan
Agricultural University, Bikaner.
Pathan, A.R.K.; Chhipa, B.R.; Lal, P.; Vyas, K.K. 2000. Response of
clusterbean to saline and sodic waters under different soils. Annals of
Agriculture Research, 21 : 42-47.
Patra, P.K. and Bhattacharya, C. 2000. Response of pea (Pisum sativum L.)
to phosphorus fertilizer in the red latrite zone of West Bengal.
Environment and Ecology, 18 : 490-492.
Piper, C.S. 1950. Soil and plant analysis. University of Adelite, Australia, pp.
59-74.
Plaut, Z. and Grieve, C.M. 1988. Photosynthesis of salt-stressed maize as
influenced by Ca:Na ratios in the nutrient solution. Plant and Soil, 105 :
283-286.
Promila, K. and Kumar, S. 1982. Effect of salinity on flowering and yield
characters in pigeonpea. Indian Journal of Plant Physiology, 25 : 252-
257.

Puntamkar, S.S.; Kant, K. and Mathur, S.K. 1988. Effect of saline water
irrigation on soil properties. Transaction of International Society of
Desert Technology, Bikaner (Rajasthan), 2 : 69-72.
Qadar, A., Joshi, Y.C., Bal, A.R. and Dwivedi, R.S. 1980. Effect of calcium
salts on induction of sodicity resistance in rice. Current Agriculture, 4 :
83-86.
Rajpaul, Kapoor, A.K. and Sharma, S.K. 2006. Effect of saline water, FYM and
phosphorus on the performance of different varieties of okra. Haryana
Journal of Agronomy, 22 : 98-100.
Rana, R.S. and Singh, K.M. 1977. Evaluation of plant materials to saline/sodic
conditions. Annuals Report, CSSRI, Karnal, pp. 47-48.
Richards, L.A. 1954. Diagnosis and improvement of saline and alkali soils.
USDA Handbook No. 60.
Russel, R..D. 1963. Experiments on cumulative dressing of fertilizers on
calcareous soils in south-west England, Journal of Science and Food
Agriculture, 14 : 622-628.
Sacher, R.F.; R.C. Staples and R.W. Robinson 1983. Ion regulation and
response of tomato to sodium chloride: A homeostatic system. Journal
of American Society of Horticulture Science, 108 : 566-569.
Sacher, R.F.; Staples, R.C. and Robinson, R.W. 1982. Bio saline research-A
look to the future, Ed. by San pietro (Plenum publication), New York
325.
Sandhu, B.S.; Khera, K.L. and Sudhee Rajan, M. 1992. Response of summer
mungbean to irrigation and straw mulching on a loamy sand soil in

Northern India. Journal of the Indian Society of Soil Science. 40 : 240-
245.
Sepat, S. and Yadav, S.S. 2008. Phosphorus and sulphur management in
moth bean [Vigna aconitifolia (JACQ.) Marechal] under rainfed
condition. Annals of Agriculture Research, 29 : 38-42.
Sharma, D.R. and Minhas, P.S. 2004. Soil properties and yields of upland
crops as influenced by the long-term use of waters having variable
residual alkalinity, salinity and sodicity. Journal of the Indian Society of
Soil Science, 52 : 100-104.
SHARMA, M.K. 1991. EFFECT OF SALINITY, SODICITY AND BORON IN
IRRIGATION WATER ON QUALITY AND FORAGE YIELD OF OATS
(AVENA SATIVA L.) VAR-KENT. M.SC.(AG.) THESIS, RAJASTHAN
AGRICULTURAL UNIVERSITY, BIKANER.
Sharma, M.P. 1988. A study on the effect of zinc application on growth, yield
and nutrient uptake by wheat and barley under irrigation with sodic
waters. M.Sc. (Ag.) Thesis, Rajasthan Agricultural University, Bikaner.
Sharma, S.K. and Manchanda, H.R. 1989. Effect of irrigation with sodic water
of increasing residual sodium carbonate levels on yield and sodium
and chloride content of chickpea. Journal of the Indian Society of Soil
Science, 37 : 147-151.
Sharma, S.K. and Manchanda, H.R. 1989. Using sodic water with gypsum for
some crops in relation to soil ESP. Journal of the Indian Society of Soil
Science, 37 : 135-139.
Sharma, S.K.; Manchanda, H.R. and Kapoor, A.K. 2007. Phosphorus
requirement of wheat under chloride and sulphate dominated salinities.
Journal of the Indian Society of Soil Science, 55 :509-514.
Shekhawat, M.S. 1997. Response of different genotypes of wheat (Triticum
aestivum L.) under graded level of salinity and computation of salt
tolerance M.Sc. (Ag.) Thesis, Rajasthan Agricultural University,
Bikaner.
Shrivanivasrao, L.H.; Benzioni, A.E. and Waisel, Y. 2004. Effect of salinity on
root morphology and nutrient acquisition by Faba bean (Viciafeba L.).
Journal of the Indian Society of Soil Science, 52 : 184-191.
Singh, Hardayal, 1980. A study on the effect of qualities of irrigation water on
the performance of mustard T-59 (Brassica juncea L.) Czern and Coss)
and Taramira (Eruca sativa L.) grown on loamy sand soil. M.Sc. (Ag.)
Thesis, Sukhadia University. Udaipur.
Singh, M.; Kumar, R. and Panwar, B.S. 2009. Effect of phosphorus on fodder
yield, uptake and its critical limits in soils for Indian mustard . Forage
Research, 35 : 23-26.
SINGH, R.A. 1980. SOIL PHYSICAL ANALYSIS, KALYANI PUBLISHER,
LUDHIANA, INDIA.
Singh, Ram; Bishnoi, D.K. and Godara, A.S. 2009. Economics of rainfed gram
(Cicer arietinum L.) in Rajasthan. Legume Research, 33:58-60.
Snell, F.D. and Snell, C.T. 1949. Colorimeteric methods and analysis. 3 rd Edn.
Vol., 116, Van North and Co., Inc., New Delhi.
Strogonov, B.P. and Oknina, E.Z. 1961. Study on the dormancy of plants
under condition of irrigation with salt solution. Fiziol, Rast., 8 : 79-85.

Subbiah, B.V. and Ashija, G.L. 1956. A rapid procedure for estimation of
available nitrogen in soils. Current Science, 25 : 259-60.
Sudhakar, C.; Reddy, P.S. and Veeranjanellu, K. 1990. Effect of salt stress on
dry matter production and mineral content during early seedling growth
of horse bean and green gram. Journal of Plant Physiology and Bio-
chemistry, 17: 88-89.
Tabatabai, M.A. and Bremner, J.M. 1969.A simple turbidimetric method of
determination of total sulphur in plant materials. Agronomy Journal, 62
: 805-806.
Thakur, D.S.; Patel, S.R. and Lal, N. 1999. Effect of sources and levels of
phosphorus on the yield and grain quality of chickpea (Cicer arietinum
L.), 4th Agricultural Science Congress, February, 21-24, Jaipur pp. 106.
(P 195)
Tiwari, D. and Kumar, K. 2009. Effect of biofertilizer and phosphorus level on
growth, nodulation and yield of mungbean (In) International Conference
on Grain Legumes : Quality Improvement, Value Addition and Trade
held during, 14-16, February, 2009 at Indian Institute of Pulse
Research, Kanpur.
Tondan, H.L.S. 1991. Ferti lizer equivalents of FYM, green manures and
biofertilizers. Fertilizer News, 36 : 69-79.
Virdiya, M. B.; Golakiya, B.A. and Kikani, V.L. 2008. Effect of potassium and
salinity levels on nutrient concentration of groundnut (Arachis
hypogeae L.). Legume Research, 31 : 196-198.
Virmani, S.M. and Gulati, H.C. 1971. Effect of sulphur on the response of
Indian mustard (Brassica juncea L. Czern & Cross) to phosphorus
fertilization. Indian agriculture Science, 42 : 136-146.
Ward, G.M. and Johnston, F.B.1962. Chemical method of plant analysis .
Pulication1064, Research Branch, Canda Department of Agriculture.
Weir, R.G. 1986. Nutrient deficiencies in crops. P. 1-15. In Agfact AC. 11. 1st
ed. Dep. Agric. New South Wales, Australia.
Yadav, A.L. 1993. Response of wheat (Triticum aestivum L.) genotypes to
saline irrigation and computation of salt tolerance indices. M. Sc, (Ag.)
Thesis, RAU, Bikaner.
Yadav, B.L. and Jakhar, S.R. 2001. Effect of tillage practices and phosphorus
fertilization on yield and water expense efficiency of rainfed mungbean.
Journal of the Indian society of Soil Science, 49 : 193-194.
Yadav, J.S.P. and Tomar, O.S. 1982. Effect of saline and sodic water irrigation
on soil characteristics and growth of Eucalyptus hybrid. Transaction of
12th International Congress on Soil Science, 6 : 169.
Yadav, V.S. and Luthra, J.P. 2005. Effect of organic manure at different level
of phosphorus on yield and economics of vegetable pea. Udyanika, 11
: 119-121.
Yakadri, M.; Tahatikunta, R. and Latchanna, A. 2004. Dry matter production
and nutrient uptake of greengram (Vigna radiata L. Willczek) as
influenced by nitrogen and phosphorus application during wet season.
Legume Research, 21:58- 61.

Phosphorus requirement of chickpea (Cicer arietinum L.) irrigated
with chloride and sulphate dominated saline water
SITA RAM JAT* DR. B.L. YADAV**
(Scholar) (Major Advisor)
Abstract
A pot experiment was conducted during rabi 2010 at S.K.N. College of Agriculture, Jobner (Rajasthan) to study the Phosphorus requirement of chickpea (Cicer arietinum L.) irrigated with chloride and sulphate dominated saline water. The experiment was laid out in Completely Randomized Design with three replications by taking seven levels of saline water [0, 2 dSm
-1 keeping Cl
- : SO4
2- in
1:3 and 3:1 ratio, 4 dSm-1 keeping Cl- : SO42- in 1:3 and 3:1 ratio and 6 dSm-1 keeping
Cl- : SO4
2- in 1:3 and 3:1 ratio], three levels of phosphorus (0, 15 and 30 mg ka
-1
phosphorus) as variables. Results revealed that total and effective number of nodules per plant, nodule index, plant height, test weight, pods per plant, seeds per pod, grain and stover yield of chickpea, P content in root and shoot at flowering, P content in root, grain and stover at harvest, K content in grain and stover, P mobility ratio at flowering and harvest, IRI-K at harvest and Na+K/Ca and Na/Ca ratios in grain and stover decreased significantly with all level of salinity of irrigation water over control, while, EC, SAR and Cl content of soil and N, Ca, Mg, Na and Cl content in grain and stover, IRI-Ca and IRI-Na at harvest, degree of compartmentation at flowering and Na/K and Ca/Mg ratios in grain and stover increased significantly over control and magnitude of increase was more pronounced in Cl
- dominated salinity as than that of SO4
2-
dominated salinity but S content in grain and stover increased significantly at all levels of salinity more with SO4
2- dominated salinity except highest level of salinity (6dSm-1) whereas S content increased with Cl- dominated salinity. Available S of soil increased and available P and pH of soil decreased significantly with all level of salinity. The magnitude of increase and decrease was more pronounced in SO4
2- dominated salinity. Application of phosphorus significantly increased the total number of nodules per plant, nodule index, plant height, test weight, pods per plant, seed per pod, grain and stover yield of chickpea, P content in root and shoot at flowering, P content in root, grain and shoot at harvest, K content in grain and stover, P mobility ratio at flowering and harvest, IRI-Ca and IRI-K at harvest, Na+K/Ca and Na/Ca ratios in grain and stover and available P and S content in soil which recorded maximum with 30 mg kg-1 phosphorus. However, Ca, Mg, Na and Cl content in grain and stover, IRI-Na at harvest, degree of comparatmentation at flowering and Na/K and Ca/Mg ratios in grain and stover decreased significantly with increasing level of application.
* A Post Graduate Student, Department of Soil Science and Agricultural Chemistry S.K.N.
College of Agriculture, Jobner (Jaipur-Rajasthan) - 303329.
** Head, Department of Soil Science and Agricultural Chemistry, S.K.N. College of
Agriculture, (Swami Keshwanand Rajasthan Agricultural University, Bikaner), campus - Jobner (Jaipur- Rajasthan).

DyksjkbM ,oa lYQsV ;qDr yo.kh; ikuh ls flafpr pus ¼lkblj ,jsUVhue~½ esa
QkLQksjl dh vko’;drk
lhrk jke tkV* MkW- ch-,y-
;kno**
¼'kks/kdÙkkZ½ ¼eq[; lykgdkj½
vuq{ksi.k
Jh d.kZ ujsUnz d`f"k egkfo|ky;] tkscusj ¼jktLFkku½ esa
^^DyksjkbM ,oa lYQsV ;qDr yo.kh; ikuh ls flafpr pus ¼lkblj ,jsUVhue½
esa QkLQksjl dh vko‟;drk** dk v/;;u djus gsrq jch 2010 esa xeyksa
esa ,d iz;ksx lEiUu fd;k x;kA
;g iz;ksx iw.kZ ;kn`fPNd vfHkdYiuk esa rhu iqujko`fÙk;ksa lfgr
yo.kh; ikuh dh oS|qr pkydrk ds lkr Lrjksa (0] 2 Mslh lkbeu izfr ehVj
ftles DyksjkbM % lYQsV dk 1%3 rFkk 3%1 vuqikr] 4 Mslh lkbeu izfr
ehVj ftlesa DyksjkbM % lYQsV dk 1%3 rFkk 3%1 vuqikr vkSj 6 Mslh
lkbeu izfr ehVj ftlesa DyksjkbM % lYQsV dk 1%3 rFkk 3%1 vuqikr
j[kdj) ,oa QkWLQksjl ds rhu Lrjksa ¼0] 15 vkSj 30 fe-xzk- QkLQksjl
izfr fdxzk- e`nk½ ij izfrorhZ ds :i esa ysdj fd;k x;kA
ifj.kkeksa ls Kkr gqvk fd dqy ,oa izHkkoh xk¡Bks dh la[;k izfr
ikS/kk] xk¡B lwpdkad] ikni Å¡pkbZ] ijh{k.k Hkkj] Qfy;ksa dh la[;k izfr
ikS/kk] izfr Qyh nkuksa dh la[;k] pus ds nkuksa rFkk Hkwlk dh mit]
iq"ihdj.k voLFkk ij tM+ksa ,oa ruk eas QkLQksjl dh ek=k] dVkbZ ds le;
* Lukrdksrj Nk=] e`nk foKku ,oa d`f"k jlk;u foHkkx] Jh d-u- d`f"k egkfo|ky;]
tkscusj ¼t;iqj&jktLFkku½ & 303329

tM+ksa] nkuksa vkSj ruk esa QkLQksjl dh ek=k] nkuksa rFkk Hkwlk
esa iksVsf‟k;e dh ek=k] iq"ihdj.k voLFkk ,oa Qly dh dVkbZ ds le;
QkLQksjl ds laogu dk vuqikr] dVkbZ ds le; iksVsf‟k;e vk;uh; fu;U=hdj.k
lwpdkad rFkk nkuksa vkSj Hkwlk esa lksfM;e $ iksVsf‟k;e@ dSfY‟k;e
rFkk lksfM;e @ dSfY‟k;e ds vuqikrksa eas fu;U=.k dh rqyuk esa
flapkbZ ty ds yo.kh;rk ds lHkh Lrjksa ds lkFk lkFkZd deh ikbZ xbZA
tcfd e`nk dh oS|qr pkydrk] lksfM;e vf/k‟kks"k.k vuqikr ,oa DyksjkbM dh
ek=k] nkuksa rFkk Hkwlk esa u=tu] dSfY‟k;e] eSfXuf‟k;e] lksfM;e vkSj
DyksjkbM dh ek=k] dVkbZ ds le; dSfY‟k;e vk;uh; fu;U=hdj.k lwpdkad o
lksfM;e vk;uh; fu;U=hdj.k lwpdkad] iq"ihdj.k voLFkk ij foHkDrrk dh
rhozrk ,oa nkuksa rFkk Hkwlk esa lksfM;e @ iksVsf‟k;e o dSfY‟k;e @
eSfXuf‟k;e ds vuqikrksa esa fu;U=.k dh rqyuk esa lkFkZd o`f) ik;h xbZ
vkSj o`f) dk ;g Øe izpqj ek=k esa lYQsV izHkkoh yo.kh;rk dh vis{kk
DyksjkbM izHkkoh yo.kh;rk esa ik;k x;kA nkuksa rFkk Hkwlk esa lYQj
dh ek=k lkFkZd :i ls lYQsV yo.kh;rk esa ¼dsoy yo.kh;rk ds mPpre Lrj
dks NksM+dj½ flapkbZ ty dh yo.kh;rk ds lHkh Lrkjksa ds lkFk c<+hA
yo.kh;rk ds lHkh Lrjksa ds lkFk e`nk esa izkI; lYQj esa o`f) rFkk
izkI; QkLQksjl ,oa e`nk ih-,p- esa lkFkZd deh ik;h xbZA o`f) vkSj deh
dk izHkko lYQsV izHkkoh yo.kh;rk esa T;knk ik;k x;kA
QkLQksjl ds vuqiz;ksx ls dqy ,oa izHkkoh xk¡Bks dh la[;k izfr
ikS/kk] xk¡B lwpdkad] ikni Å¡pkbZ] ijh{k.k Hkkj] Qfy;ksa dh la[;k izfr
ikS/kk] izfr Qyh nkuksa dh la[;k] pus ds nkuksa rFkk Hkwlk dh mit]
iq"ihdj.k voLFkk ij tM+ksa ,oa ruk eas QkLQksjl dh ek=k] dVkbZ ds le;
tM+ksa] nkuksa vkSj ruk esa QkLQksjl dh ek=k] nkuksa rFkk Hkwlk
esa iksVsf‟k;e dh ek=k] Qwyksa dh voLFkk ,oa Qly dh dVkbZ ds le;
** foHkkxkv/;{k] e`nk foKku ,oa d`f"k jlk;u foHkkx] Jh d- u- d`f"k egkfo|ky;]
tkscusj ¼t;iqj½ ¼Lokeh ds‟okuUn d`f"k fo‟ofo|ky;] chdkus j½

QkLQksjl ds laogu dk vuqikr] dVkbZ ds le; dSfY‟k;e vk;uh; fu;U=hdj.k
lwpdkad ,oa ikSVsf‟k;e vk;uh; fu;U=hdj.k lwpdkad] nkuksa rFkk Hkwlk
esa lksfM;e $ ikSVsf‟k;e @ dSfY‟k;e ,oa lksfM;e @ dSfY‟k;e ds
vuqikrksa o e`nk esa izkI; QkLQksjl ,oa lYQj dh ek=k esa lkFkZd
c<+ksrjh ik;h xbZ tks vf/kdre 30 fe-xzk- izfr fdxzk- ds lkFk ntZ dh xbZA
tcfd nkuksa rFkk Hkwlk esa dSfY‟k;e] eSfXuf‟k;e lksfM;e vkSj
DyksjkbM dh ek=k] dVkbZ ds le; lksfM;e vk;uh; fu;U=hdj.k lwpdkad]
iq"ihdj.k voLFkk ij foHkDdrk dh rhozrk ,oa nkuksa rFkk Hkwlk esa
lksfM;e @ iksVsf‟k;e rFkk dSfY‟k;e @ eSfXuf‟k;e ds vuqikrksa esa
QkLQksjl vuqiz;ksx ds c<+rs Lrjksa ds lkFk lkFkZd fxjkoV ik;h xbZA

Appendix-I Interrelationship (correlation) between grain yield, stover yield, P content in grain and stover, mobility ratio at harvest and soil physico -
chemical properties of soil
Grain yield
Stover yield
P content in grain
P content in stover
Mobility ratio at harvest in
grain
Mobility ratio at
harvest in stover EC pH SAR Available P2O5
Grain yield 1.000 0.980** 0.759** 0.802** 0.763** 0.871** -0.404 0.135 -0.435* 0.796**
Stover yield 1.000 0.759** 0.802** 0.763** 0.871** -0.404 0.135 -0.435* 0.796**
P content in grain 1.000 0.990** 0.984** 0.976** -0.817** 0.588** -0.848** 0.933**
P content in stover 1.000 0.964** 0.989** -0.750** 0.498* -0.785** 0.954**
Mobility ratio at harvest in
grain 1.000 0.963** -0.856** 0.666** -0.888** 0.921**
Mobility ratio at harvest in
stover 1.000 -0.713** 0.459* -0.751** 0.956**
EC 1.000 -0.843** 0.976** -0.635**
pH 1.000 -0.843** 0.460*
SAR 1.000 -0.707**
Available P2O5 1.000
** Correlation is significant at the 0.01 level
* Correlat ion is significant at the 0.05 level

Appendix – II
Analysis of variance for total and effective number of root nodules and
nodule index
Source of
variation d.f.
Mean sum of square
Total no. of
nodules
Effective nodules
per plant
Nodule index
Salinity 6 5.1422* 6.7958* 0.1931*
Phosphorus 2 19.5593* 5.6782* 0.2613*
Salinity x P 12 0.0284 0.0538 0.0003
Error 40 0.1549 0.0318 0.0068
* Significant at 5% level of significance
Appendix – II
Analysis of variance for plant height (cm) and test weight (g)
Source of
variation d.f.
Mean sum of square
Plant height Test weight
Salinity 6 98.5224* 502.1799*
Phosphorus 2 176.3892* 344.1086*
Salinity x P 12 0.3972 0.2093
Error 40 1.4548 35.1366
* Significant at 5% level of significance

Appendix – IV
Analysis of variance for number of pods per plant and seeds per pod
Source of
variation d.f.
Mean sum of square
Number of pods per
plant
Seeds per pod
Salinity 6 184.8905* 1.2974*
Phosphorus 2 1058.3896* 1.5967*
Salinity x P 12 18.1072* 0.0142944
Error 40 0.9174 0.0098
* Significant at 5% level of significance
Appendix – V
Analysis of variance for grain and stover yield
Source of
variation
d.f.
Mean sum of square
Grain yield Stover yield
Salinity 6 1.0912* 0.2040*
Phosphorus 2 75.0957* 126.9117*
Salinity x P 12 1198.0199* 2024.6536*
Error 40 6.3589 10.7465
* Significant at 5% level of significance

APPENDIX – VI
Analysis of variance for phosphorus content (%) in root and shoot and mobility ratio at flowering stage
Source of
variation d.f.
Mean sum of square
P content Mobility ratio
Root Shoot
Salinity 6 0.0029* 0.0075* 791.4869*
Phosphorus 2 0.0084* 0.0097* 242.0281*
Salinity x P 12 0.00002 0.0001 0.4669
Error 40 0.0001 0.00004 16.4225
* Significant at 5% level of significance
Appendix – VII
Analysis of variance for phosphorus content (%) in root, stover and grain and mobility ratio at harvest stage
Source of
variation d.f.
Mean sum of square
P content Mobility ratio
Root Stover Grain Stover Grain
Salinity 6 0.0023* 0.0073* 0.0259* 921.4317* 861.5919*
Phosphorus 2 0.0038* 0.0165* 0.0383* 2777.5312* 889.8393*
Salinity x P 12 0.00001 0.0001 0.0001 5.0851 0.5676
Error 40 0.0001 0.00003 0.0003 5.9012 44.4337
* Significant at 5% level of significance

Appendix – VIII
Analysis of variance for nitrogen and potassium content (%) in grain and stover
Source of
variance
d.f.
Mean sum of square
Nitrogen Potassium
Grain Stover Grain Stover
Salinity 6 0.0682* 0.1405* 0.0657* 0.1646*
Phosphorus 2 0.1116* 0.0475* 0.1830* 1.0047*
Salinity x P 12 0.0000 0.0001 0.0003 0.0009
Error 40 0.0025 0.0018 0.0015 0.0061
* Significant at 5% level of significance
Appendix – IX
Analysis of variance for sulphur content (%) in grain and stover
Source of
variation
d.f.
Mean sum of square
Sulphur
Grain Stover
Salinity 6 0.0093* 0.0066*
Phosphorus 2 0.0338* 0.0202*
Salinity x P 12 0.00004 0.00002
Error 40 0.0008 0.0006
* Significant at 5% level of significance

Appendix – X
Analysis of variance for calcium, magnesium and sodium content (%) in grain and stover
Source of
variance d.f.
Mean of sum square
Calcium Magnesium Sodium
Grain Stover Grain Stover Grain Stover
Salinity 6 0.0103* 0.0698* 0.0312* 0.0540* 0.0138* 0.0154*
Phosphorus 2 0.0082* 0.1867* 0.0553* 0.0147* 0.0057* 0.0093*
Salinity x P 12 0.00003 0.0009 0.000049 0.0000 0.00001 0.00002
Error 40 0.0001 0.0005 0.00142 0.0029 0.0003 0.0003
* Significant at 5% level of significance
Appendix – XI
Analysis of variance for chloride content in grain and stover
Source of
variation d.f.
Mean sum of square
Chloride content (%)
Grain Stover
Salinity 6 0.6244* 4.3399*
Phosphorus 2 0.1729* 0.5761*
Salinity x P 12 0.0009 0.0064
Error 40 0.0021 0.0042
* Significant at 5% level of significance

Appendix – XII
Analysis of variance for ec (dsm-1), ph and sar of soil after harvest of crop
Source of
variance d.f.
Mean sum of square
EC pH SAR
Salinity 6 14.5140* 0.4764* 245.6208*
Phosphorus 2 0.0441 0.0903 5.4075
Salinity x P 12 0.0008 0.0000 0.0665
Error 40 0.0345 0.1896 1.8641
* Significant at 5% level of significance
Appendix – XIII
ANALYSIS OF VARIANCE FOR AVAILABLE PHOSPHORUS, SULPHUR AND CHLORIDE CONTENT IN SOIL AFTER HARVEST
OF CROP
Source of
variance
d.f.
Mean sum of square
Phosphorus
(P2O5) (kg ha-1)
Sulphur (ppm) Chloride (ppm)
Salinity 6 152.0441* 38.2368* 1.3985*
Phosphorus 2 468.1803* 28.6359* 0.0439
Salinity x P 12 3.9986 0.2304 0.0002
Error 40 2.3407 0.4049 0.0240
* Significant at 5% level of significance

Appendix – XIV
Analysis of variance for Na/K and Ca/Mg ratio in grain and stover
Source of
variance d.f.
Mean sum of square
Na/K Ca/Mg
Grain Stover Grain Stover
Salinity 6 0.0708* 0.0158* 0.0200* 0.0455*
Phosphorus 2 0.0931* 0.0331* 0.0011* 0.1387*
Salinity x P 12 0.0006 0.0002 0.000005 0.0005
Error 40 0.0012 0.0003 0.0000 0.0001
* Significant at 5% level of significance
Appendix – XV
Analysis of variance for Na+K/Ca and Na/Ca ratio in grain and stover
Source of
variance d.f.
Mean sum of square
Na+K/Ca Na/Ca
Grain Stover Grain Stover
Salinity 6 12.9044* 10.7784* 0.0578* 0.0204*
Phosphorus 2 17.9013* 43.0174* 0.1236* 0.2402*
Salinity x P 12 0.1532 0.3894 0.00004 0.0001
Error 40 0.1452 0.1999 0.0143 0.0035
* Significant at 5% level of significance

Appendix – XVI
Analysis of variance for ionic regulation index for calcium, sodium and potassium at harvest stage of crop
Source of
variance
d.f. Mean sum of square
Calcium Sodium Potassium
Salinity 5 0.0496* 1.6849* 0.1093*
Phosphorus 2 0.2616* 3.3538* 0.1805*
Salinity x P 10 0.0003 0.0402 0.0007
Error 34 0.0029 0.0254 0.0021
* Significant at 5% level of significance
Appendix – XVII
Analysis of variance for degree of compartmentation at flowering stage
Source of variance d.f. Mean sum of square
Degree of compartmentation
Salinity 6 7.7266*
Phosphorus 2 21.8736*
Salinity x P 12 0.0303
Error 40 0.4884
* Significant at 5% level of significance