Nutritive evaluation of some browse species
15
ELSEVIER Animal Feed Science Technology 67 ( 1997) 18 I- 195 Nutritive evaluation of some browse species Adugna Tolera * , K. Khazaal, E.R. 0rskov Rowett Research Institute, Bucksbum, Aberdeen, AB2 9SB. UK Accepted 16 September 1996 Abstract Browse plants play an important role in providing fodder for ruminants in most parts of the World. However, the presence of tannins and other phenolic compounds in a large number of these feed resources limits their utilization as animal feed. This paper presents the nutritive value of some browse species based on their chemical composition (nitrogen, polyphenolics and neutral detergent fibre (NDF) content), dry matter (DM) degradability in sacco and gas production in vitro including the effect of the phenolic binding compound, polyethyleneglycol-4000 (PEG 4000), on in vitro gas production. The browse species evaluated were Calluna vulgaris (heather), Sarotham- nus scoparius (broom), Ulex europaeus (gorse) and Chamaecytisus palmensis (tagasaste). The crude protein (CP) content was highest (P < 0.05) in broom (189 g kg-’ DM) followed by tagasaste (175 g kg-’ DM) and gorse pre-flower (168 g kg-’ DM) and the lowest was in heather (98 g kg-‘). Heather had the highest (P < 0.05) concentration of the phenolic compounds compared with all the other species. Gorse in-flower contained a higher concentration (P < 0.05) of total extractable phenols (TEPH), total extractable tannins (TETa) and NDF and a lower content of CP than gorse pre-flower which is a reflection of their stage of maturity. As a result, gorse pre-flower had a higher in sacco degradability and in vitro gas production than gorse in-flower. Heather had the lowest degradability values. The ranking order of the browse plants in gas production was gorse pre-flower > tagasaste > broom > gorse in-flower > heather which was similar to their in sacco degradability values. Increasing the amount of substrate incubated slightly depressed the amount of gas produced by the browse plants. The response to PEG treatment increased with increased concentration of phenolic compounds in the browse plants. Thus, in heather, gas production increased by 51% at 12 h of incubation as a result of PEG treatment while the response was zero in the species with a low content of phenolic compounds. The results show that the phenolic compounds depress in vitro * Corresponding author at: Department of Animal Production and Rangeland Management, Awassa College of Agriculture, P.O. Box 5, Awassa, Ethiopia. Tel.: +251-6-200221; fax: +251-6-200072; e-mail: [email protected]. 0377.8401/97/$17.00 0 1997 Elsevier Science B.V. All rights reserved. PI1 SO377-8401(96)01119-4
-
Upload
independent -
Category
Documents
-
view
1 -
download
0
Transcript of Nutritive evaluation of some browse species

ELSEVIER Animal Feed Science Technology 67 ( 1997) 18 I- 195
Nutritive evaluation of some browse species
Adugna Tolera * , K. Khazaal, E.R. 0rskov Rowett Research Institute, Bucksbum, Aberdeen, AB2 9SB. UK
Accepted 16 September 1996
Abstract
Browse plants play an important role in providing fodder for ruminants in most parts of the World. However, the presence of tannins and other phenolic compounds in a large number of these feed resources limits their utilization as animal feed. This paper presents the nutritive value of some browse species based on their chemical composition (nitrogen, polyphenolics and neutral detergent fibre (NDF) content), dry matter (DM) degradability in sacco and gas production in vitro including the effect of the phenolic binding compound, polyethyleneglycol-4000 (PEG 4000), on in vitro gas production. The browse species evaluated were Calluna vulgaris (heather), Sarotham- nus scoparius (broom), Ulex europaeus (gorse) and Chamaecytisus palmensis (tagasaste).
The crude protein (CP) content was highest (P < 0.05) in broom (189 g kg-’ DM) followed by tagasaste (175 g kg-’ DM) and gorse pre-flower (168 g kg-’ DM) and the lowest was in heather (98 g kg-‘). Heather had the highest (P < 0.05) concentration of the phenolic compounds compared with all the other species. Gorse in-flower contained a higher concentration (P < 0.05) of total extractable phenols (TEPH), total extractable tannins (TETa) and NDF and a lower content of CP than gorse pre-flower which is a reflection of their stage of maturity. As a result, gorse pre-flower had a higher in sacco degradability and in vitro gas production than gorse in-flower. Heather had the lowest degradability values.
The ranking order of the browse plants in gas production was gorse pre-flower > tagasaste > broom > gorse in-flower > heather which was similar to their in sacco degradability values. Increasing the amount of substrate incubated slightly depressed the amount of gas produced by the browse plants. The response to PEG treatment increased with increased concentration of phenolic compounds in the browse plants. Thus, in heather, gas production increased by 51% at 12 h of incubation as a result of PEG treatment while the response was zero in the species with a low content of phenolic compounds. The results show that the phenolic compounds depress in vitro
* Corresponding author at: Department of Animal Production and Rangeland Management, Awassa College of Agriculture, P.O. Box 5, Awassa, Ethiopia. Tel.: +251-6-200221; fax: +251-6-200072; e-mail: [email protected].
0377.8401/97/$17.00 0 1997 Elsevier Science B.V. All rights reserved. PI1 SO377-8401(96)01119-4

182 A. Tolera et al./Animal Feed Science Technology 67 (1997) 181-195
gas production and that PEG treatment has a potential for improving gas production and fermentation of feedstuffs high in phenolics due to the binding of the phenolic compounds to the PEG. 0 1997 Elsevier Science B.V.
Keywords: Browse; Phenolics; PEG; DM degradability in saeco; Gas production in vitro
1. Introduction
Browse (shrubs and tree foliage) plays a significant role in providing fodder for ruminants in many parts of the World. Most browse species have the advantage of maintaining their greenness and nutritive value throughout the dry season when grasses dry up and deteriorate both in quality and quantity. Tree fodder is generally richer in protein and minerals and is used as a dry season supplement to poor quality natural pasture and/or fibrous crop residues (Devendra, 1990; Kibon and &skov, 1993).
However, the presence of tannins and other phenolic compounds in a large number of nutritionally important shrubs and tree leaves hampers their utilization as animal feed. In general, most browse species contain phenolic compounds that reduce digestibility and availability of protein, and contribute to unpalatability and reduced intake (Woodward and Reed, 1989; Kumar and Vaithiyanathan, 1990; Kibon and Izhskov, 1993). In their review of occurrence, nutritional significance and effect on animal productivity of tannins in tree leaves, Kumar and Vaithiyanathan (1990) showed that both in vitro and in vivo dry matter (DM) digestibility of tree leaves decline with an increase in tannin content. Khazaal et al. (1993) reported a negative correlation between concentration of phenolics and in vitro gas production of Mediterranean browse from Greece. The influence of tannins on DM digestibility of browse is attributed to their bacteriostatic and bactericidal effects on rumen microbes (Henis et al., 1964) and inactivation of rumen microbial enzymes (Kumar and Singh, 1984; Horigome et al., 1988).
There have been several studies aimed at inactivating phenolic compounds by using phenolic binding agents (PBAs) such as polyvinylpyrrolidone (PVP) or polyethylene glycol (PEG). Thus, PEG has been used to adsorb plant phenolics during the extraction of enzymes because of its hydrophobic properties (Badran and Jones, 1965). A potential increase in in vitro (Kumar and Vaithiyanathan, 1990) and in vivo (Jones and Mangan, 1977) digestibility of tannin rich feeds by the addition of PEG-4000 has also been reported. Horigome et al. (1988) observed an increase from 49.1 to 70.7% in protein digestibility of Robiniu pseudoacacia leaves in rats and the increase was attributed to the binding of dietary tannins to PEG. Recently, the use of the in vitro gas production technique in conjunction with phenolics binding agents has been established by Khazaal et al. (1994) for the assessment of phenolics related antinutritive factors in browse species.
While the nutritional potential and limitations of many tropical and Mediterranean browse species have been documented, comparatively little has been done on temperate browse species. Thus, the objective of this study was to assess the nutritive value of some temperate browse species from Scotland and one multipurpose tree from the tropics based on their chemical composition (N, polyphenolics and neutral detergent
A. Tolera et aL/Animal Feed Science Technology 67 (1997) 181-195 183
fibre content), DM degradability in sacco and gas production in vitro. The response in gas production to the addition of various levels of the phenolic binding agent, poly- ethylene glycol-4000 (PEG-4OOOJ has also been assessed.
2. Materials and methods
2.1. Feed samples
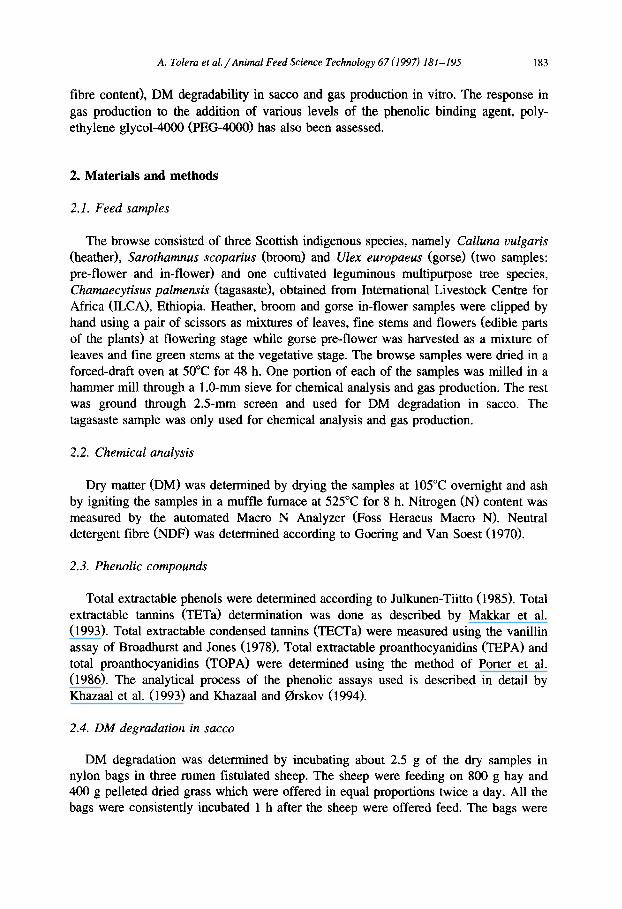
The browse consisted of three Scottish indigenous species, namely Calluna vulgaris (heather), Sarothumnus scoparius (broom) and Ulex europaeus (gorse) (two samples: pre-flower and in-flower) and one cultivated leguminous multipurpose tree species, Chamaecytisus palmensis (tagasaste), obtained from International Livestock Centre for Africa (ILCA), Ethiopia. Heather, broom and gorse in-flower samples were clipped by hand using a pair of scissors as mixtures of leaves, fine stems and flowers (edible parts of the plants) at flowering stage while gorse pre-flower was harvested as a mixture of leaves and fine green stems at the vegetative stage. The browse samples were dried in a forced-draft oven at 50°C for 48 h. One portion of each of the samples was milled in a hammer mill through a 1.0~mm sieve for chemical analysis and gas production. The rest was ground through 2.5mm screen and used for DM degradation in sacco. The tagasaste sample was only used for chemical analysis and gas production.
2.2. Chemical analysis
Dry matter (DM) was determined by drying the samples at 105°C overnight and ash by igniting the samples in a muffle furnace at 525°C for 8 h. Nitrogen (NJ content was measured by the automated Macro N Analyzer (Foss Heraeus Macro N). Neutral detergent fibre (NDF) was determined according to Goering and Van Soest (1970).
2.3. Phenolic compounds
Total extractable phenols were determined according to Julkunen-Tiitto (1985). Total extractable tannins (TETa) determination was done as described by Makkar et al. (1993). Total extractable condensed tannins (TECTa) were measured using the vanillin assay of Broadhurst and Jones (1978). Total extractable proanthocyanidins @EPA) and total proanthocyanidins (TOPA) were determined using the method of Porter et al. (1986). The analytical process of the phenolic assays used is described in detail by Khazaal et al. (1993) and Khazaal and 0rskov (1994).
2.4. DA4 degradation in sacco
DM degradation was determined by incubating about 2.5 g of the dry samples in nylon bags in three rumen fistulated sheep. The sheep were feeding on 800 g hay and 400 g pelleted dried grass which were offered in equal proportions twice a day. All the bags were consistently incubated 1 h after the sheep were offered feed. The bags were

184 A. Tolera et al./Animal Feed Science Technology 67 (1997) 181-195
withdrawn after 4, 8, 16, 24, 48, 72 and 96 h of incubation, washed for 20 min in a washing machine and dried for 48 h at 60°C. Washing losses were estimated by soaking two bags per sample in warm tap water (about 39°C) for 1 h followed by washing and drying as before. Duplicate bags of each sample were similarly dried to determine the DM content of the samples for calculation of DM disappearance.
The DM degradation data was fitted to the exponential equation p = a + b(1 - e-“1 (Orskov and McDonald, 1979; McDonald, 1981) where p is DM degradation (%) at time t. The lag time was estimated by fitting the model p = A for t I t,, and p=a+b(l -e -“> for t > t, and the degradation characteristics of the browse were defined as: A = washing loss (representing the soluble fraction of the feed); B = (a + b) - A, i.e. the insoluble but fermentable material; c = the rate of degradation of B and the lag phase (L) = l/c log,[ b/(a + b - A)] (0rskov and Ryle, 1990; Kibon and Idrskov, 1993).
2.5. In vitro gas production
The browse samples were incubated in vitro with rumen fluid in calibrated glass syringes as described by Khazaal et al. (1993) and Khazaal and Orskov (1994) following the procedures of Menke and Steingass (1988).
About 200 f 5 mg dry weight of the browse were weighed in duplicates with or without an equal weight of PEG, into calibrated glass syringes of 100 ml. The effect of increasing the amount of phenolics on fermentation was investigated by increasing the amount of substrate used to 300 f 5 mg with or without PEG. In the case of heather the amount of substrate was further increased to 400 f 5 mg which was incubated with or without 400 or 500 mg PEG, as the concentration of phenolics and response to PEG addition at the 200-mg level was highest from this species. The syringes were pre-warmed at 40°C before the injection of 30 + 1 ml rumen fluid-buffer mixture into each syringe, followed by incubation in a water bath at 39 + O.l”C. The syringes were gently shaken 30 min after the start of incubation and then every hour for the first 10 h of incubation. Readings were recorded before incubation (0 h) and 3, 6, 12, 24, 48, 72 and 96 h after incubation.
The results of gas volume readings (means of two duplicate runs) were fitted to the exponential equation of the form p = a + b(1 - e-“1 (0rskov and McDonald, 1979; Bliimmel and Idrskov, 1993) where p represents gas production at time t, (a + b) the potential gas production, c the rate of gas production and a, b and c are constants in the exponential equation.
2.6. Volatile fatty acids (VFAS)
At the end of the 96-h incubation of the last run, 4.0 ml the supematant was collected and 1.0 ml of 20% orthophosphoric acid solution containing 2-ethylbutyric acid as internal standard was added. The mixture was shaken and centrifuged at 22 694 X g for 10 min. The clear supematant was stored at -20°C until analysed by injecting 0.2-0.3 ~1 into a gas chromatograph following the method of Ottenstein and Bartley (1971). A standard solution of a mixture of VFAs was used to calculate the concentrations of

A. Tolera et al./Animul Feed Science Technology 67 (1997) 181-195 185
VFAs in the samples. VFA concentration in the samples was obtained after subtracting concentrations of VFAs from the blank (i.e. rumen liquor only).
2.7. Statistical analysis
Analysis of variance was carried out on phenolics, crude protein (CP) and NDF contents, in sacco degradability and in vitro gas production data and the statistical significance of the differences between means were tested using the least significant difference (LSD). The correlation of the in sacco DM degradability and in vitro gas production with the concentration of the phenolic compounds, CP and NDF was determined by simple correlation analysis @AS, 1987).
3. Results and discussion
3.1. Chemical composition
Organic matter (OM), crude protein (CP), NDF and phenolic compound concentra- tions of the browse species are shown in Table 1. The OM contents varied with a narrow range from 869 to 903 g kg-’ DM. The OM content was highest in gorse in-flower followed by tagasaste. The NDF content was relatively high in gorse (both stages) and relatively low in tagasaste while broom and heather were intermediate in their NDF content. The CP contents of broom, tagasaste and gorse pre-flower were sufficiently high to warrant consideration of their use as a protein supplement to poor quality pasture and fibrous crop residues. However, this point should be treated with caution as N digestibility of browse is dependent on soluble phenolics and insoluble proanthocyani- dins content of the browse species (Woodward and Reed, 1989). Heather had the lowest CP level. Sundstol et al. (1986) have also reported a CP content of 82 g kg-’ DM in young dried heather which is quite similar to the value obtained in this study.
In general, the presence of phenolic compounds such as tannins and their interference
Table 1 Content (g kg-’ DM) of organic matter (OM), crude protein (CP) and neutral detergent fibre (NDF) and concentration (mg g - ’ DM) of total extractable phenols (TEPH), total extractable tannins (TETa), total extractable condensed tannins (TECTa) and (absorbance at 550 nm per 100 mg DM) of total extractable proanthocyanidins (TEPA) and total proanthocyanidins (TOPA) of the browse plants
Browse species OM CP NDF Concentration of phenolics
Heather
TEPH TETa TECTa TEPA TOPA
870 c 98e 464d 236.2 a 159.0 a 139.5 a 44.5 = 97.31 a Gorse in-flower 903 a 120 d 567 a 60.6 d 15.2 d 5.9 b 0.41 bc 2.04 b Gorse pre-flower 869 ’ 168 c 557 b 32.3 ’ 6.1 e 5.1 b 0.15 L 1.07 b Broom 873 ’ 189a 482 ’ 116.0 ’ 32.9 ’ 7.8 b 0.39 bc 1.28 b Tagasaste 886 b 175 b 389 e 143.2 b 53.1 b 8.0 b 1.74 b 4.66 b SEM 1.6 1.0 1.1 1.0 1.1 2.0 0.19 1.36
Means with different superscripts within a column are significantly different (P < 0.05). SEM, standard error of the means.

186 A. Tolera et al. /Animal Feed Science Technology 67 (1997) 181-195
with the fibre fraction makes it impossible to determine the nutritive value of browse from chemical analysis, as is done for other forages. Studying Greek browse, Khazaal et al. (1993) have also concluded that fibre components cannot be used reliably to predict the nutritive value of browse.
Concentration of the phenolic compounds varied among species with heather having the highest concentration of total extractable phenols (TEPH), TETa, TECTa, TEPA and TOPA followed by tagasaste. Broom had a higher concentration of TEZPH and TPTa than gorse (both stages). On the other hand, TOPA concentrations tended to be lower (P > 0.05) in broom than in gorse in-flower. Gorse in-flower had higher (P < 0.05) concentrations of TEPH and TETa than gorse pre-flower. Gorse in-flower also contained higher concentrations of TECTa, TEPA and TOPA, although not significant (P > 0.051, than gorse pre-flower which is a reflection of their stage of maturity. The concentrations of the condensed tannins (TECTa, TEPA and TOPA) were strongly correlated to one another and to the TETa (see Table 3). This is similar to the findings of Makkar et al. (1993), who reported that tannins measured gravimetrically after precipitation with PVP, which is in principle similar to the TETa assay, were related (P < 0.05) to condensed tannin measured using other assays.
3.2. In sacco DM degradability
In sacco DM disappearance and degradability parameters of the browse species from Scotland is shown in Table 2. Gorse pre-flower and broom had significantly higher (P < 0.05) DM degradability than gorse in-flower and heather at 24, 48 and 72 h of incubation. Washing loss was highest in broom and lowest in heather. The rate constant (c) was highest in broom followed by gorse pre-flower. As a result, broom showed higher (P < 0.05) DM disappearance than the other species with the exception of gorse pre-flower. Gorse pre-flower surpassed broom in DM disappearance after 24 h of incubation, although the difference was not significant (P > 0.05). Heather had a lower (P < 0.05) potential DM degradability (A + B) than gorse pre-flower. The potential DM degradability value of heather also tended to be lower (P > 0.05) than that of broom and gorse in-flower. The lower DM disappearance and potential degradability
Table 2 DM disappearance (8) and degradability parameters of the Scottish browse species
Browse Incubation time (h) Degradability parameters species 4 8 16 24 48 72 96 A B A-f-B c L RSD
Gorse 33.3 b 45.7 b 53.9 ab 66.5’ 77.3’ 79.0 a 79.2 a 30.7’ 50.0 a 80.7 a 0.060 ab 3.0” 2.6 pre-flower
Gorse 33.5 ab 38.6 ’ 46.1 b 53.7 b 61.8 b 66.6 b 72.3 ab 31.6 b 44.3 ’ 75.9 ab 0.031 b 2.3 ab 2.8 in-flower
Broom 38.6 ’ 51.6 ’ 64.8 = 70.2 a 75.9 ’ 78.4 a 78.7 a 33.1 ’ 44.9 ’ 78.0 ab 0.089 ’ 2.3 ab 1.3 Heather 31.9 b 33.8 d 42.5 b 53.3 b 62.8 b 65.3 b 64.9 b 20.8 d 46.5 * 67.3 b 0.046 b 0.2 b 3.1
A = washing loss (%o); B = degradability of water insoluble fraction (8); c = rate degradation of B (fraction h-’ ); A + B = potential degradability (8); L = lag time (h); RSD = residual standard deviation. Means with different superscripts within a column are significantly different (P < 0.05).

A. Tolera et ai./Animal Feed Science Technology 67 (1997) 181-195 187
Table 3 Correlation coefficient (r) of the relationship between polyphenolics, CP, NDF and %DM degradation and degradation characteristics of the browse species
Parameter Correlation with
TEPH TETa TFLCTa TEPA TOPA CP NDF
TEPH 0.98 * ?? * 0.95 ’ * * 0.94 ?? * * 0.93 * * * -0.54 -0.88 * ETa 0.99 * * * 0.99 ?? * * 0.98 * * * -0.66 -0.11 * TECTa 0.99 * * * 0.99 * * * - 0.72 * -0.69 EPA 0.99 * * * -0.72 * -0.68 TOPA -0.73 * -0.61 CP 0.08 DM degradation after:
24 h - 0.39 - 0.43 -0.46 - 0.45 -0.44 0.76 * -0.14 48 h - 0.47 - 0.48 - 0.48 - 0.48 - 0.47 0.83 * - 0.03 96 h - 0.65 - 0.68 - 0.68 - 0.68 - 0.67 0.62 0.35
A -0.87 *** -0.95”’ -0.98 *** -0.98 *** -0.98 *** 0.77 * 0.55 B -0.1 -0.05 0.002 0.005 0.014 -0.13 0.16 AfB -0.63 * -0.64 * -0.62 * -0.62 * -0.61 * 0.39 0.49 c - 0.02 -0.1 -0.17 -0.17 -0.17 0.66 - 0.49
Significance levels: * P = 0.05; * * P = 0.01; * * * P = 0.001.
values of heather are indicators of poor digestibility that conform with the findings of Sundstol et al. (1986) who reported a low organic matter digestibility value of 36% for young, dried heather. The relatively higher DM degradability of gorse pre-flower after 24 h of incubation was due to the higher degradability of its water insoluble (B) fraction. The difference in degradability between gorse pre-flower and gorse in-flower is a reflection of their stage of maturity which showed a decrease in degradability of the water insoluble fraction and the degradation rate constant (c) with advanced stage of maturity.
Table 3 shows the correlation between polyphenolics, CP, NDF and in sacco DM degradability of the browse species. The potential degradability (A + B) was negatively correlated (I = -0.63, -0.64, -0.62, -0.62 and - 0.61; P < 0.05) to the concentra- tion of TEPH, TETa, TECTa, TEPA and TOPA, respectively. This was due mainly to the high negative correlation of the washing loss (A) (I = -0.87, -0.95, - 0.98, - 0.98 and - 0.98; P < O.OOl> with TEPH, TETa, TECTa, TEPA and TOPA, respec- tively. DM disappearance at 24, 48 and 96 h of incubation was negatively correlated to the phenolic content of the browse plants with correlation coefficient (r) ranging from - 0.39 to - 0.68. This was consistent with the established fact that phenolic compounds reduce digestibility and nutrient availability of feedstuffs (Kumar and Vaithiyanathan, 1990). The CP content was positively correlated (r = 0.62-0.83) while the NDF content did not show any correlation with DM degradation after 24, 48 and 96 h of incubation.
3.3. In vitro gas production
Table 4 shows the volume of gas produced in vitro (ml) per 200 mg DM after 12,24, 48 and 96 h of incubation without or with an equal amount of PEG, and Table 5 shows

188 A. Tolera et al./Animal Feed Science Technology 67 (1997) 181-195
Table 4 Effect of polyethylene glycol (PEG) on in vitro gas production (ml) per 200 mg DM of five species of browse incubated for 12, 24, 48 and 96 h
Browse species Time 200 mg substrate 300 mg substrate 400 mg substrate
(h) Omg 200 mg Omg 300 mg Omg 4OOmg 500 mg PEG PEG PEG PEG PEG PEG PEG
Heather 12 13.3 20.1 12.8 19.3 13.2 19.3 20.5 24 20.9 29.6 19.9 27.4 19.4 26.6 26.5 48 29.6 36.9 28.4 34.5 27.1 33.5 33.2 96 34.2 40.7 33.3 38.2 32.4 36.9 37.0
Gorse in-flower 12 19.0 19.7 16.0 17.9 24 30.1 30.7 27.2 29.5 48 31.5 37.5 34.1 36.5 96 41.3 41.2 38.1 39.8
Gorse pre-flower 12 25.2 25.6 24.8 24.5 24 37.6 38.1 36.4 36.2 48 44.2 44.1 43.6 43.6 96 47.1 47.9 46.8 46.9
Broom 12 26.9 26.9 24.0 25.0 24 36.6 37.6 34.1 35.5 48 42.4 43.3 40.5 40.8 96 45.6 46.5 44.3 44.7
Tagasaste 12 27.2 28.3 26.4 25.6 24 38.5 39.4 39.2 37.8 48 43.1 44.4 44.8 42.7 96 46.0 47.5 47.9 45.9
the gas production characteristics based on gas volume recordings at 3, 6, 12, 24, 48, 72 and 96 h of incubation. The statistical significance of the difference between the browse species in gas production after 12, 24, 48 and 96 h of incubation and in gas production characteristics is shown in Table 6. In vitro gas production was significantly higher (P < 0.05) in gorse pre-flower, tagasaste and broom than heather and gorse in-flower at 12, 24, 48 and 96 h of incubation and gorse in-flower produced significantly (P < 0.05) more gas than heather at 24, 48 and 96 h of incubation. Thus, based on their gas production performance the browse species showed the following ranking order: gorse pre-flower > tagasaste > broom > gorse in-flower > heather. However, the difference between gorse pre-flower and tagasaste was not significant (P > 0.05). The ranking order in gas production was in conformity with the in sacco DM degradability of the browse plants (Table 2). This is in agreement with the findings of Bltimrnel and Orskov (1993) of a similar ranking order in in sacco degradability and the volume of gas produced in vitro from ammonia treated barley and wheat straws. Thus the gas volume is a good reflection of substrate fermentation to VFAs and an estimate of potential digestibility in the rumen. Increasing the amount of substrate slightly depressed the amount of gas produced by the browse plants. However, the decrease in gas production due to increased substrate concentration was marked in heather which is attributed to its higher phenolic content.

A. Tolera et al./Animal Feed Science Technology 67 (1997) 181-195 189
Table 5 Effect of polyethylene glycol (PEG) on in vitro gas production characteristics of the browse species
Browse species Gas 200 mg substrate 300 mg substrate 400 mg substrate production
Omg characteristic PBG 200mg Omg PEG PEG
300mg Omg 400mg 5OOmg PEG PEG PEG PEG
Heather a b a+b c RSD
Gorse in-flower a b a-!-b
RSD Gorse pre-flower a
b a+b c RSD
Broom a b a+b c RSD
Tagasaste ; afb c RSD
1.9 0.8 1.5 1.1 2.2 1.6 2.7 33.4 39.3 33.0 36.8 31.3 35.1 33.7 35.2 40.2 34.5 37.9 33.5 36.7 36.4
0.036 0.056 0.035 0.054 0.034 0.055 0.055 0.39 0.54 0.29 0.62 0.51 0.73 1.17 0.2 -0.1 -0.3 -0.9
41.1 41.1 38.5 40.8 41.3 40.9 38.3 39.9
0.052 0.056 0.049 0.054 0.43 0.50 0.65 0.52
- 2.4 - 1.8 -2.1 -2.1 49.2 49.3 48.5 48.6 46.8 47.5 46.4 46.5
0.069 0.068 0.066 0.065 0.47 0.54 0.49 0.45
-1.6 - 1.8 - 1.8 - 1.1 46.2 47.4 45.2 44.8 44.6 45.6 43.3 43.7
0.076 0.075 0.067 0.070 0.91 0.78 0.85 0.91
-3.2 -2.8 -3.2 -3.4 48.3 49.4 50.5 48.5 45.2 46.6 47.4 45.0
0.081 0.080 0.076 0.076 0.77 0.81 0.82 0.82
Gas production characteristics: a, b and c are constants in the equation p = a + b(1 -e-“) describing gas production with time and a + b shows the potential in gas production where c is the rate constant; RSD, residual standard deviation.
Table 6 Statistical significance of differences between the browse species in gas production at 12, 24, 48, 96 h of incubation and in gas production characteristics
Species Gas production after Gas production characteristics
12h 24 h 48 h 96h a b a+b c
Heather 16.6 b 24.8 ’ 32.4 ’ 36.4 ’ 1.79 b - 35.6 * 37.0 d 0.0448 d Gorse in-flower 18.6 b 29.4 b 36.3 b 39.9 b 0.39 ab - 40.4 c 40.1 c 0.0527 ’ Gorse pre-flower 24.9 a 37.6 a 43.5 a 46.5 a b b - 1.75 48.9 ’ 46.8 a 0.0668 Broom 29.0 a 36.5 a 40.9 a 44.5 a 0.69 a 45.9 b 44.3 b 0.0719 ab Tagasaste 27.2 a 38.5 a 43.3 a 46.3 a 2.50 b - 49.2 = 46.0 ab 0.0775 B SEM 0.79 0.59 0.47 0.38 0.95 1.17 0.55 0.001
Means with different superscripts within a column are significantly different (P < 0.05). SEM, standard error of the means.

190 A. Tolera et al. /Animal Feed Science Technology 67 (1997) 181-195
The response in gas production as a result of treatment with PEG was minimal except in heather. In heather, gas production increased from 14% (at 96 h) to 5 1% (at 12 h) as a result of treatment with PEG. Increasing the amount of substrate and PEG above 200 mg resulted in lower percentage increase in gas production.
The response to PEG treatment increased with increased concentration of phenolic compounds in the browse plants (Table 1). This shows that the fermentation and digestibility of feedstuffs high in phenolics is improved by treatment with PEG, resulting from the binding of the phenolic compounds to PEG. However, although tagasaste contained a higher concentration of the total extractable phenolics and total extractable tannins than broom and gorse, its gas production without PEG treatment was relatively high and did not respond to PEG treatment. It appears that depression in in vitro gas production and improvement in gas production as a result of PEG treatment are mainly dependent on the condensed tannin content of the browse species rather than the content of total phenolics and total tannins (Table 1). Waghom et al. (1994) reported an increase in rumen ammonia concentration, DM digestibility and proportion of DM digested in the rumen when sheep feeding on Lotus pedunculatus (5.5% condensed tannins) were infused with 100 g PEG day-’ (molecular weight 3500, in 300 ml water) as compared with the untreated group. Ahn et al. (1989) also showed that the removal of tannins by PEG infusion increased consumption of barley straw and nitrogen digestibility from 624 to 761 g day-’ and from 20.7 to 39.2%, respectively, when Calliandra calothrysus (> 10% condensed tannins) was fed.
Table 7 shows the correlation between the phenolic compounds, CP, NDF, gas production at 24, 48 and 96 h of incubation, gas production characteristics and percentage increase in gas production as a result of PEG treatment of the browse species. There was a high degree of correlation between gas production after 24, 48 and 96 h of incubation and the phenolics (especially the TOPA, TEPA and TECTa) content
Table 7 Correlation coefficient (r) of the relationship of polyphenolics, CP and NDF with gas production and % increase in gas Droduction after 24. 48 and 96 h of incubation as a result of PEG treatment
Parameter Correlation with
TEPH TETa TECTa TEPA TOPA CP NDF
Gas prod. after: 24 h - 0.58 -0.75 ?? -0.83 * ?? -0.83 * * 48 h - 0.62 -0.74 * -0.83 * ?? -0.83 * * 96 h -0.61 -0.75 * -0.84 * * -0.83 ?? *
a+b -0.62 -0.74 * -0.82 * * -0.81 * ’ c - 0.48 -0.68 * -0.79 * * -0.79 ?? ’ % increase after PEG treatment:
24 h 0.79 * * 0.92 * * * 0.98 * ?? ?? 0.98 * ?? * 48 h 0.74 * 0.87 * * * 0.94 * * ?? 0.94 * * ??96 h 0.74 ’ 0.87 ?? * 0.94 * ?? * 0.94 ?? * ’
Significance levels: * P = 0.05; * * P = 0.01; ?? * L 4P = 0.001.
-0.83 * ’ -0.83 ?? ??
-0.83 ?? * -0.82 * * -0.80 * *
0.98 ?? * * 0.94 * * * 0.94 * * *
0.94 ?? * * 0.90 ?? * * 0.92 * * * 0.90 ?? * ??0.95 * ?? *
-0.78 * * -0.80 * * -0.76 *
-0.15 -0.12 -0.12 -0.10 -0.28
-0.12 - 0.07 -0.09

A. Tolera et al./Animal Feed Science Technology 67 (1997) 181-195 191
of the browse species ranging from r = -0.58 (with TEPH) at 24 h to r = -0.84 (with TECTa) at 96 h of incubation. In general, the condensed tannins (TECTa) and the proanthocyanidins (TEPA and TOPA) showed more strong negative correlation with in vitro gas production than the total phenolics (TEPH) and total tannins (TETa). The potential gas production (a + b) also showed negative correlation ( r = - 0.62, - 0.74, -0.82, -0.81 and -0.82) with TEPH, TETa, TECTa, TEPA and TOPA, respectively. On the other hand, the CP content showed a high positive correlation (r = 0.94, 0.90 and 0.92; P < 0.001) with gas production after 24, 48 and 96 h of incubation, respectively. However, no correlation was found between gas production and NDF content of the browse species. The percentage increase in gas production as a result of PEG treatment showed high positive correlation to the concentration of the phenolic compounds. This shows that the phenolic compounds depress in vitro gas production and that PEG has a potential for binding the phenolic compounds and improving gas production.
3.4. Volatile fatty acids
Table 8 shows the concentration (mmol) of the main and total volatile fatty acids (VFAS) and the effect of PEG on VFA production in heather. PEG treatment increased total VFA, butyric acid and propionic acid production. The increase in acetic acid production was minimal compared with propionic and butyric acids. Total VFA production increased by 19.9% when 200 mg of PEG was incubated with an equal dry weight of heather. Waghorn et al. (1994) found a significantly lower (P < 0.001) concentration of VFA in the rumen liquor of sheep fed Lotus pedunculutus (5.5% condensed tannins) without PEG treatment as compared with the PEG infused group of
Table 8 Main and total volatile fatty acids concentration (mmol) in the supematant of 30 ml rumen liquor/buffer and 200-400 mg DM of heather incubated with or without adding 200-500 mg polyethylene glycol (PEG4000) for 96 h using the in vitro gas production technique
Amount of heather Amount of PEG Acetic acid Propionic acid Butyric acid Total VFAs
Cont. % of total Cont. % of total Cont. % of total
200mg 0 19.3 81.8 3.4 14.4 0.9 3.8 23.6 200 mg 200 mg 20.0 70.7 6.0 21.2 1.74 6.1 28.3 % increase 3.6 76.4 93.3 19.9 300mg 0 19.0 72.5 5.5 21.0 1.7 6.5 26.2 300mg 300mg 21.0 74.2 5.7 20.1 1.6 5.7 28.3 % increase 10.5 3.6 12.5 8.0 400mg 0 19.7 74.9 5.4 20.5 1.2 4.6 26.3 400mg 400mg 21.4 70.4 6.2 20.4 2.25 7.4 30.4 % increase 8.6 14.8 87.5 15.6 400mg 5OOmg 19.8 70.5 5.7 20.3 1.9 6.8 28.1 % increase 0.5 5.5 58.3 6.8
% increase = [(VFA cont. with PEG-VFA cont. without PEG)/VFA cont. without PEG1 X 100.

192 A. Tolera et al./Animl Feed Science Technology 67 (1997) 181-195
sheep. The relative concentrations reported in their studies were 71.5 f 3.95 vs 103.8 + 59.8 and 58.0 f 2.06 vs 87.2 + 3.72 mm01 1-l on Days 9 and 21 of the experimental period, respectively. This was about 45-50% increase over the untreated group.
4. Conclusion
The browse species showed the same ranking order in their in sacco DM degradabil- ity and in vitro gas production values (Figs. 1 and 2). The concentration of the phenolic compounds, particularly the condensed tannins, appear to be the main factors depressing the in sacco degradability and in vitro gas production potential of the browse plants. Although the study was based on very few number of browse species the results showed that PEG treatment has a potential for improving fermentation of feedstuffs high in phenolics due to the binding of the phenolic compounds to the PEG (Fig. 3). However, future studies on the effect of PEG treatment on fermentation and digestibility of browse feeds should be based on more number of browse species that have high content of phenolic compounds and should also include practical animal feeding experiments.
-t-Gmepre-
-m-&E in-flower
-A-Broom
-o-Heather
Fig. 1. In sacco DM degradability of some browse species from Scotland.

45
A. Tolera et al. /Animal Feed Science Technology 67 (1997) 181-I 95 193
--C Gorse in&war
3 6 12 24 48
Incubation Time (hours)
Fig. 2. In vitro gas production of the browse species (without PEG treatment).
5
(2 24 48 72 96
Incubation Time (h)
-tHeathfs2cmmg
-m-Heather 200 mg +PE(
-A- Heather 300 mg
-M- Heather 300 ing+PEG
-at- Heather 400 mg
-a- Heather 400 mg+PEG
3
Fig. 3. In vitro gas production from heather with or without PEG treatment.

194 A. Tolera et al./Animal Feed Science Technology 67 (1997) 181-195
Acknowledgements
We are grateful to Mr. W.J. Shand for his technical assistance. Adugna Tolera would like to thank the Norwegian Universities Committee for Development Research and Education (NUFU) and the Norwegian Centre for International Agricultural Develop ment (NORAGRIC) for sponsoring his stay at the Rowett Research Institute while doing this work and Prof. Frik Sundstal for arranging the programme and for his valuable comments on the paper.
References
Ahn, J.H., Robertson, B.M., Elliot, R., Gutteridge, R.C. and Ford, C.W., 1989. Quality assessment of tropical browse legumes: tannin content and protein degradation. Anim. Feed Sci. Technol., 27: 147-156.
Badran, A.M. and Jones, D.E., 1965. Polyethylene glycols-tannin interaction in extracting enzyme. Nature, 206: 622-623.
Blllmmel, M. and phskov, E.R., 1993. Comparison of in vitro gas production and nylon bag degradability of roughages in predicting feed intake in cattle. Anim. Feed Sci. Technol., 40: 109-119.
Broadhurst, R.B. and Jones, W.T., 1978. Analysis of condensed tannins using acidified vanillin. J. Sci. Food Agric., 29: 788-794.
Devendra, C., 1990. The use of shrubs and tree fodders by ruminants. In: C. Devendra (Editor), Shrubs and Tree Fodders for Farm Animals, Proceedings of a Workshop, 24-29 July 1989, Denpasar, Indonesia. International Development Research Centre, Ottawa, Canada.
Goering, H.K. and Van Soest, P.J., 1970. Forage Fiber Analyses (Apparatus, Reagents, Procedures and Some Applications). Agriculture Handbook No. 379, Agricultural Research Services, USDA, Washington, DC.
Henis, Y., Tagari, H. and Volcani, R., 1964. Effect of water extract of carob pods tannic acid and their derivatives on the morphology and growth of microorganisms. Appl. Microbial., 12: 204-211.
Horigome, T., Kumar, R. and Okamoto, K., 1988. Effect of condensed tannins prepared from leaves of fodder plants on digestive enzymes in vitro and in the intestine of rats. Br. J. Nutr., 60: 275-285.
Jones, W.T. and Mangan, J.L., 1977. Complexes of the condensed tannins of sainfoin (Onobrychis uisifolia Stop.) with fraction 1 leaf protein and with submaxillary mucoprotein and their reversal by polyethylene glycol and PH. J. Sci. Food Agric., 28: 126-136.
Julkunen-Tiitto, R., 1985. Phenolics constituents in the leaves of northern willows: methods for the analysis of certain phenolics. J. Agric. Food Chem., 33: 213-217.
Khaxaal, K. and Orskov, E.R., 1994. The in vitro gas production technique: an investigation on its potential use with insoluble polyvinylpolypyrrolidone for the assessment of phenolics-related antinutritive factors in browse species. Anim. Feed Sci. Tecbnol., 47: 305-320.
Khazaal, K., Markantonatos, X., Nastis, A. and 0rskov, E.R., 1993. Changes with maturity in fibre composition and levels of extractable polyphenols in Greek browse: Effects on in vitro gas production and in sacco DM degradation. J. Sci. Food Agric., 63: 237-244.
Khazaal, K., Boza, J. and Brskov, E.R., 1994. Assessment of phenolics-related antinutritive effects in Mediterranean browse: a comparison between the use of the in vitro gas production technique with or without insoluble polyvinylpolypyrrolidone or nylon bag. Anim. Feed Sci. Technol., 49: 133-149.
Kibon, A. and 0rskov. E.R., 1993. The use of degradation characteristics of browse plants to predict intake and digestibility by goats. Anim. Prod., 57: 247-251.
Kumar, R. and Singh, M., 1984. Tannins, their adverse role in ruminant nutrition. J. Agric. Food Chem., 32: 447-453.
Kumar, R. and Vaithiyanathan, S., 1990. Ckcurrence, nutritional significance and effect on animal productivity of tannins in tree leaves. Anim. Feed Sci. Technol., 30: 21-38.
Makkar, H.P.S., Blttmmel, M., Borowy, N.K. and Becker, K., 1993. Gravimetric determination of tannins and their correlation with chemical and protein precipitation methods. J. Sci. Food Agric., 61: 161-165.

A. Tolera et al. /Animal Feed Science Technology 67 (1997) 181-195 195
McDonald, I., 1981. A revised model for the estimation of protein degradability in the rumen. J. Agric Sci., Camb., 96: 251-252.
Menke, K.H. and Steingass, H., 1988. Estimation of the energetic feed value obtained from chemical analysis and in vitro gas production using rumen fluid. Anim. Res. Develop., 28: 7-55.
0rskov. E.R. and McDonald, I., 1979. The estimation of protein degradability in the rumen from incubation measurements weighted according to rate of passage. J. Agric. Sci., Camb., 92: 499-503.
Illrskov, E.R. and Ryle, M., 1990. Energy Nutrition in Ruminants. Elsevier Applied Science, Oxford, p. 149. Ottenstein, D.M. and Bartley, D.A., 1971. Improved gas chromatography separation of free acids C,-C, in
dilute solution. Anal. Chem., 43(7): 952-955. Porter, L.J., Hrstich, L.N. and Chart, B.G., 1986. The conversion of procyanidins and prodelphinidins to
cyanidin and delphinidin. Phytochemistry, 25: 223-230. SAS, 1987. SAS/STAT Guide to Personal Computers. Version 6 Edition. Statistical Analysis System Institute
Inc., Cary, NC. Sundstol, F., Homb, T., Ekem, A. and Breirem, K., 1986. Sammensetning og Naeringsverdi av Norske
FOrmidler. K.K. Heje Lommeh!tndbok, P.F. Steensballes Forlag. Waghom, G.C., Shelton, I.D. and McNabb, W.C., 1994. Effects of condensed tannins in Lotus pedunculatus
on its nutritive value for sheep. 1. Non-nitrogenous aspects. J. Agric. Sci., Carnb., 123: 99-107. Woodward, A. and Reed, J.D., 1989. The influence of polyphenolics on the nutritive value of browse: a
summary of research conducted at ILCA. ILCA Bull., 35: 2-l 1.