The nutritive value of macadamia oil cake meal and wood ash ...
104
The nutritive value of macadamia oil cake meal and wood ash as alternative feed ingredients for chickens in rural areas By Mashilo Alpheus Phosa (B. Inst. Agrar: Animal Production) Submitted in partial fulfilment of the requirements for the degree M.Inst Agrar: (Animal production) at the Department of Animal and Wildlife Sciences Faculty of Natural and Agricultural Sciences University of Pretoria Pretoria January 2009 © University of Pretoria
-
Upload
khangminh22 -
Category
Documents
-
view
1 -
download
0
Transcript of The nutritive value of macadamia oil cake meal and wood ash ...

The nutritive value of macadamia oil cake meal and wood ash as
alternative feed ingredients for chickens in rural areas
By
Mashilo Alpheus Phosa
(B. Inst. Agrar: Animal Production)
Submitted in partial fulfilment of the requirements for the degree
M.Inst Agrar: (Animal production)
at the
Department of Animal and Wildlife Sciences
Faculty of Natural and Agricultural Sciences
University of Pretoria
Pretoria
January 2009
©© UUnniivveerrssiittyy ooff PPrreettoorriiaa

Declaration
I, Mashilo Alpheus Phosa, declare that this thesis, for the degree M. Inst. Agrar
(Animal Production) at the University of Pretoria, has not been submitted by me for a
degree at any other University.
……………………… Mashilo Alpheus Phosa Pretoria

ACKNOWLEDGEMENTS:
•••• Dr. C.J van Rensburg, my promoter, for her insight and technical support,
advice and reviewing of the manuscript.
•••• Prof. J.B.J van Ryssen, my co-promoter, for his patience and time spent
editing and correcting the manuscript.
•••• Mrs. D. Louw for time spent on the administration and keeping track of the
financial accounts.
•••• Mrs. E. Ferreira and her team with the laboratory analysis.
•••• The National Research Foundation for the provision of a bursary (NRF –
Scare skills bursary) and NEPAD for their funding for the research projects.
•••• Mr Roelf Coertze for all his time and patience with the statistical analysis.
•••• Farm workers for the help and courageous support.
•••• My parents, sisters and brothers for the support and patience.
•••• GOD Almighty for the wisdom, strength, courage, power and grace to study.

ABSTRACT The majority of South African household live in poverty with a limited variety of
foods available in their home. In most rural villages domestic poultry plays an
important role in improving household food security, but is limited by shortage of
feed and high feed costs. Using non-conventional feed ingredients in poultry diets
may ease the situation of malnutrition in rural populations, providing the family with
high quality animal protein at more affordable prices. Macadamia oil cake meal
(MOCM) is an inexpensive by-product from the macadamia oil industry of the
Limpopo Province. Although it is relatively high in crude protein (20-25%), MOCM
has never been considered as a feed ingredient for poultry feeds. The high and varying
fibre content (up to 25%, depending on the extrusion method applied) of MOCM may
render it unsuitable as an ingredient for high producing poultry such as broilers. The
question, however, arouse whether the inclusion of MOCM in the growing diet of
meat-producing chickens typically found in rural areas, would be cost-effective.
Calcium (Ca) in poultry rations is usually supplied as calcium carbonate from
limestone. Wood ash (WA) from fireplaces at homestead in rural villages was found
to be rich in Ca (approximately 26%) and has the potential of being a free and readily
available Ca supplement that could easily be added to the diet. The purpose of this
study was to evaluate the effects of MOCM and WA as alternative feed ingredients in
growth rations for chickens in rural areas. New Hampshire chickens were randomly
divided into eight treatment groups with four replicates per treatment and twelve
chicks in each replicates. The chicks were housed in an environmentally controlled
broiler house from day-old to 15-weeks of age. Four diets were formulated, one
without MOCM and the other three containing different levels of MOCM, viz. 10, 50
and 100% plus salt and a trace nutrient mixture. Each of these treatments was split in
two with one receiving limestone (CaCO3) and the other WA, as Ca sources, giving
eight treatments in total. All the treatments received diets with a Ca level close to 1 %.
Parameters measured on weekly basis were body weight (BW), feed intake (FI), and
body weight gain (BWG) and feed conversion efficiency (FCE) was determined. The
analysis of the carcass composition and tibia bone strength was done at the end of the
15 week period. An analysis of variance with the ANOVA model (SAS) was used to
determine the significance between different treatments for the balanced data.
Significance of difference (5%) between means was determined by multiple

comparisons using Tukey t-test. The treatment of 100% MOCM was terminated at
eight weeks since the chickens had retarded growth and low body weight gains,
demonstrating that the 100% MOCM diet both with and without Ca were not feasible.
The BW and feed intake of the diet of 100% MOCM plus WA was, however,
significantly higher than the diet of 100% MOCM plus lime. However, the inclusion
level of up to 50% MOCM had no significant differences in (muscle and fat), except
for FI, BWG and FCE between treatment diets. In conclusion, the results prove that
MOCM can be added to the ration at a 10% concentration level without any adverse
effect on growth. Higher inclusion levels of MOCM might also be beneficial,
especially when included at an older age of the bird. Wood ash proved to be an
efficient Ca source, as the substitution of limestone with WA showed no negative
effect on the tibia bone parameters measured.

i
TABLE OF CONTENTS
Table of contents i
List of tables and figures v
CHAPTER 1 - Literature Review 1
1.1 By-products as alternative feed ingredients in chickens reared in small-scale
farming system 1
1.2 Nutrient composition of conventional feed 3
1.2.1 Energy in broiler ration 3
1.2.2 Protein in broiler ration 4
1.2.3 Amino acids 4
1.3 Nutrient composition of by-products (non-conventional feed) as animal feeds 5
1.4 Macadamia nut as a by-product 5
1.4.1 Macadamia nut background 5
1.4.2 Macadamia oil cake meal 6
1.4.3 Production in South Africa 6
1.5 Wood ash (WA) as alternative calcium source 7
1.5.1 Wood ash characteristics 8
1.6 Hypothesis 10
1.7 Motivation 10
1.8 Objectives 11
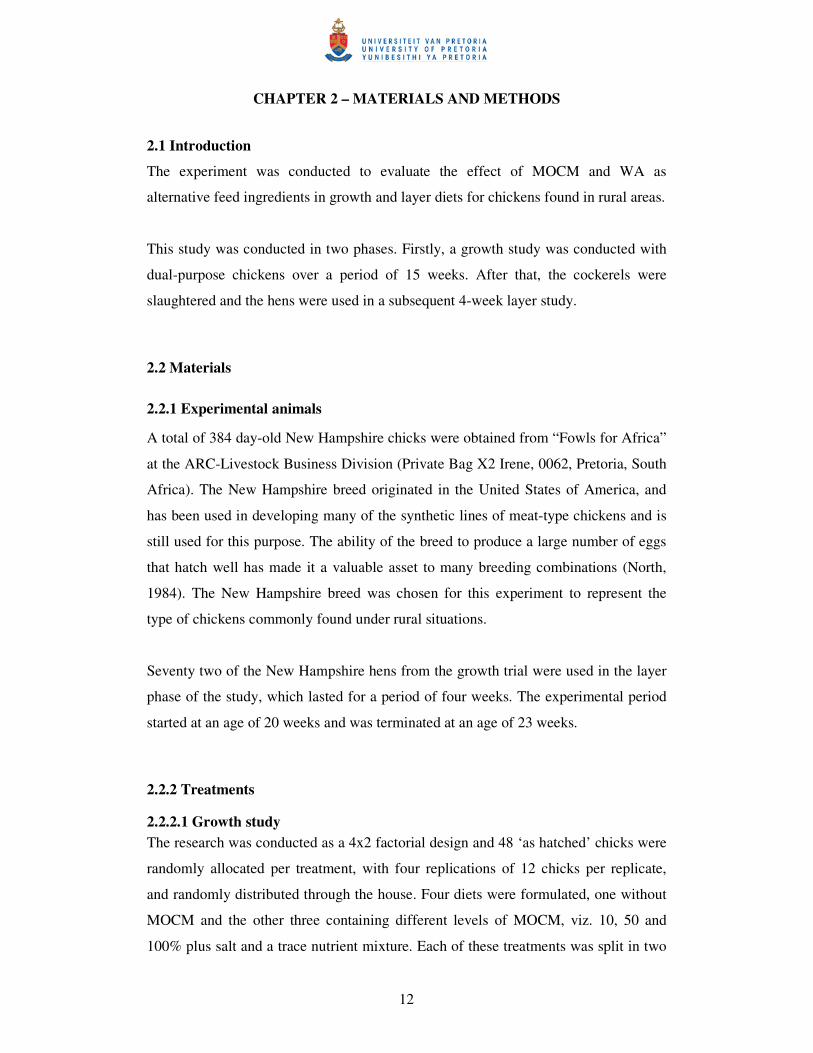
CHAPTER 2 – Materials and methods 12
2.1 Introduction 12
2.2 Materials 12
2.2.1 Experimental animals 12
2.2.2 Treatments 12

ii
2.2.2.1 Growth study 12
2.2.2.2 Layer study 13
2.2.3 Experimental terrain 14
2.3 Diet formulation and feeding facilities 15
2.4 Source of macadamia oil cake 15
2.5 Preparation of the ash 16
2.6 Vaccination programme 20
2.7 Slaughter procedure 20
2.8 Measurements taken 20
2.8.1 Growth study 20
2.8.1.1 Feed intake 20
2.8.1.2 Body weight 21
2.8.1.3 Feed conversion efficiency 21
2.8.1.4 Mortalities 21
2.8.2. Parameters determined after slaughtering 21
2.8.2.1. Carcass composition 21
2.8.2.2 Preparation of the tibiae 21
2.9. Layer study 22
2.10 Chemical analyses of feeds 22
2.10.1 Dry matter content 22
2.10.2 The ash content 22
2.10.3 Crude protein determination 23
2.10.4 Amino acids 23
2.10.5 Crude fibre (Proximate analysis method) 23
2.10.6 Neutral detergent fibre determination 24
2.10.7 Fat determination 25

iii
2.10.8 Minerals 25
2.10.9 Determination of metabolisable energy 25
2.10.10 Nitrogen free extracts 26
2.11 Breaking strength of the tibia bone and egg shell 26
2.11.1 Measurements on tibia bones 26
2.11.2 Breaking strength and Instron calibration 26
2.11.3 Egg breaking strength 27
2.12 Chemical analyses of tibia bones 28
2.13 Procedure to determine mineral crystalline composition of wood ash 28
2.14 Statistical analyses 29
CHAPTER 3 – Results 30
3.1 Chemical composition 30
3.2 Wood ash 31
3.3 The chemical composition of the experimental diets 34
3.4 The results of the performance parameters for the growth experiment study 39
3.4.1 Feed intake 39
3.4.2 Body weight 41
3.4.3 Body weight gain 44
3.4.4 Feed conversion efficiency 45
3.5 The carcass parameters 47
3.6 Mineral analysis of the tibia bones 53
3.7 The results of parameters measured during the layer experimental study 57
CHAPTER 4 – Discussion 60
4.1 Chemical composition 61

iv
4.1.1 Limiting order and amino acid profile 64
4.1.2 Wood ash 68
4.2 Growth experiment 68
4.2.1 Carcass composition 73
4.2.2 Analysis of the tibia bones 73
4.3 Layer experiment 74
CHAPTER 5 – General conclusions 77
5.1 Critical evaluation 77
5.2 Recommendations for further research 78
CHAPTER 6 - References 80

v
List of Tables and Figures Table 1 Amino acid requirements for broiler diets 4
Table 2.1 Number of birds per replicate for different treatments of the grower trial 13
Table 2.2 Number of birds per replicate for different treatments of the layer trial 14 Table 2.3 Ingredient composition of the starter diets used in the growth trial 17
Table 2.4 Ingredient composition of the grower diets used in the growth trial 18
Table 2.5 Ingredient composition of the grower diets used in the layer trial 19
Table 2.6 The vaccination programme of the birds during the growth trial 20
Table 3.1 Chemical composition of the macadamia oil cake meal (g/kg) used in the
study 30
Table 3.2 Amino acid composition (g/kg) of macadamia oil cake on ‘as is’ and dry
matter basis 31
Table 3.3 Approximate proportions of crystalline forms (XRD analysis) of minerals
in wood ash 32
Table 3.4 Chemical composition (%) of the different treatments of the starter diets on
an as fed, full fat basis 34
Table 3.5 Chemical compositions of different treatments of the grower diets, as fed,
full fat basis (%) 35
Table 3.6 Chemical compositions of different treatments of the layer diets on as fed,
full fat basis (%) 36
Table 3.7 Amino acid concentrations (%) of different treatment diets in the grower
experiment on an as fed, full fat basis 37
Table 3.8 Amino acid concentrations (%) of different treatment diets in the layer
experiment as fed, full fat basis 38
Table 3.9 The order of limiting amino acids (%) on as fed, full fat basis for both the
grower and layer for this experiment 39
Table 3.10 The effect of dietary level of macadamia oil cake meal (MOCM) and
calcium source on the weekly feed intake (g) per bird for the grower trial 40
Table 3.11 The effect of dietary level of macadamia oil cake meal (MOCM) and
calcium source on the weekly body weight (g) of the bird over the 15-week growth
trial 42

vi
Table 3.12 The effect of dietary level of macadamia oil cake meal (MOCM) and
calcium source using the regression analysis growth curve equation fitted for each
treatment diets 43
Table 3.13 The effect of dietary level of macadamia oil cake meal (MOCM) and
calcium source on the weekly body weight gain (g) per bird during the grower trial
45
Table 3.14 The effect of dietary level of macadamia oil cake meal (MOCM) and
calcium source on weekly feed conversion efficiency (g gain/ g feed) per bird for the
grower trial over a period of 15 – weeks 46
Table 3.15 The effect of dietary level of macadamia oil cake meal (MOCM) and
calcium source on carcass mass and muscle, fat and bone as percent carcass weight at
8 – weeks of age 49
Table 3.16 The effect of dietary level of macadamia oil cake meal (MOCM) and
calcium source on bone breaking strength (BBS), Newton (N) of the right and left
tibia as interpreted separately at the age of 8 – weeks old 50
Table 3.17 The effect of dietary level of macadamia oil cake meal (MOCM) and
calcium source on combined means of the two sources of calcium for the bone
breaking strength, Newton (N) of the right and left tibia as the age of 8 – weeks old
50
Table 3.18 The effect of dietary level of macadamia oil cake meal (MOCM) and
calcium source on both the right and left tibia weight (g), volume (l) and density (g/l)
on a wet bone basis of the birds at 8 weeks of age 51
Table 3.19 The combined effect of dietary level of macadamia oil cake meal
(MOCM) and calcium source on the tibia weight (g), volume (l) and density (g/l) of
both right and left tibia bones on a wet bone basis of the birds at 8 weeks of age 52
Table 3.20 The effect of dietary level of macadamia oil cake meal (MOCM) and
calcium source on the diameters (mm), of the right and left tibia of the birds at 8
weeks of age 53
Table 3.21 The effect of dietary level of macadamia oil cake meal (MOCM) and
calcium source on the means (g/kg) of the elemental composition of tibia bones (dry,
fat-free basis) and as percentage of bone ash 54

vii
Table 3.22 The effect of dietary level of macadamia oil cake meal (MOCM) and
calcium source on the combined means (g/kg) of the elemental composition of tibia
bones (dry, fat-free basis) 55
Table 3.23 The effect of dietary level of macadamia oil cake meal (MOCM) and
calcium source on feed intake (FI), egg weight (EW), egg production (EP), feed
conversion ratio (FCR) and eggshell strength (ESS) on hens during the 4-week layer
experiment 56
Table 4.1 Amino acid profile of MOCM (as fed, full-fat basis) as compared to the
nutrient requirement of poultry (NRC, 1994) 67
Figure 3.1 Graphical presentations of the crystalline forms in wood ash 33
Figure 3.2 The effect of macadamia oil cake meal (MOCM) and calcium source on
body weight for the grower trial over a period of 15 weeks, excluding the 100%
MOCM treatments 44
Figure 3.3 The effect of macadamia oil cake meal and wood ash on body weight of
laying hens 58
Figure 3.4 The effect of macadamia oil cake meal and wood ash on body weight gain
of laying hens 59

1
CHAPTER 1 - LITERATURE REVIEW 1.1 By-products as alternative feed ingredients in chickens reared in small-scale
farming system
A definition of a by-product feedstuff is a product that has value as an animal feed
and is obtained during the harvesting or processing of a commodity in which human
food or fibre is derived. By-product feedstuffs can be of either plant or animal origin.
Growing interest in technologies of identifying and quantifying by-product feedstuffs
is due to the desire to understand and monitor environmental waste in developed and
developing countries. The worldwide use of by-product feedstuffs is common practice
yet few published reports document the amounts of plant by-product feedstuffs
generated (Grasser et al., 1995; Van Horn and Hall, 1997).
Many by-products feedstuffs cannot be quantified because no standard equivalent is
available in the literature to make this conversion from a processed food to a by-
product feedstuff. Some by-products feedstuffs that are not easily quantified include
almond hulls, bagasse, beet pulp, and brewer’s grains. However, knowing the amount
of by-product feedstuffs generated is critical in defining the integral role of animals in
the food and fibre system. General information is known about animal by-product
feedstuffs that are recycled back to the animal (Romans et al., 1994).
Maize, wheat, barley and oats are the most commonly used energy-rich feedstuffs in
conventional poultry diets. Their production in countries such as Asia, Africa and
Pacific nations has never been adequate, both for human consumption and agricultural
use. Hence, there is a severe shortage of cereals for use in poultry feeds. Similarly the
cost of conventionally employed vegetable oil meals or cakes (soybean, peanut,
sunflower, sesamum and rape) and animal proteins such as fish and meat meal are
becoming scarce, making them very expensive and with an inconsistent supply
(Reddy & Quadratullah, 1996).
As an example, in Kenya the expansion of the commercial poultry industry is limited
by the supply of reasonably priced, good quality feeds. Although there is sufficient
milling capacity, there is a shortage of appropriate feedstuffs. Maize is the principal

2
ingredient used in Kenyan poultry diets but, because it is also a staple food in the diet
of most Kenyans, the quantity of maize available for use in animal feeds is limited
and expensive (Jacob et al., 1996). On the other hand, Ogunfowora (1984) stated that
the most logical step to take in the face of the increasing human population and
dwindling raw material supplies is to formulate livestock feeds from non-conventional
ingredients, such as by-products and wastes from plant processing procedures, which
are not directly utilized by man.
Not much has yet been published on macadamia oil cake meal (MOCM) as a feed
ingredient for poultry diets. However, over the decades, research has been conducted
worldwide on the use of non-conventional feed ingredients as feedstuffs for poultry
diets. The results of these studies showed that various unconventional feedstuffs can
serve as a viable alternative to maize in poultry diets (Damron et al., 1966, Day &
Dilworth, 1968, Daguro & Rivas, 1987, Saleh et al., 1996, Attia et al., 1997) and can
lead to reduced cost/kg of live weight of the birds, and consequently greatly reduce
the total cost of production (Eruvbetine & Afolami, 1996). There is a continuous
search for alternatives to reduce poultry feed costs and improve the efficiency of
small-scale poultry production units. An effort is thus being made to study the
possibility of utilising agricultural, animal and industrial by-product for the nutrition
of poultry (Fetuga and Olufemi, 1976; Dominguez, 1992;, El Boushy 2000).
By using non-conventional feed sources of energy in poultry diets, it could possibly
alleviate the situation of malnutrition in rural populations of South Africa and
worldwide by providing the family with high quality protein at low cost, thereby
decreasing the high incidence of protein deficiency.
Marketing by-products as animal feeds can help reduce pollution and minimise waste
treatment costs. If by-product recovery is feasible in a given situation, it is critical that
the material be kept free of contaminants, that inventory (if wet) be turned over
rapidly and that moisture and nutrient content be as consistent as possible. With
effective quality control, many livestock feeders can benefit from using food
processing by-products.

3
1.2 Nutrient composition of conventional feed
It is common practice to feed chickens a ration that is a mixture of economically
available ingredients so as to provide every known nutritional need in quantities
necessary for their daily well-being. Commercial poultry rations today are known as
“complete rations”; that is, they contain all the essential ingredients for the bird to
perform effectively, whether in growth, egg production or meat production (North,
1984).
Most of these feeds come from the common and major feed ingredients such as cereal
grains, protein and fat supplements, certain mill by-products and major minerals.
However, in most cases, a mixture of the ingredients would either not satisfy the
bird’s nutritional requirements, or be economically feasible. Certain vitamins,
minerals, by-products and other ingredients must be added to balance the diet.
1.2.1 Energy in broiler ration The energy content of the ration will govern the chicken’s daily feed consumption.
The amount of each of the other nutrients in the ration must be related to the feed’s
caloric content. This recommendation is based on the premise that the bird has a daily
requirement of each nutritional factor, when there is a variation in feed consumption
as a result of dietary changes in the caloric value of the ration or environmental or
other factors causing the bird to eat more or less feed, an adjustment must be made in
the non-energy portion of the diet (North, 1984).
The energy requirements may be defined as the amount of available energy that will
provide for growth or egg production at a high enough level to permit maximal
economic return for the production unit. Each primary energy source i.e.,
carbohydrates, fats and protein, has a specific function: all of them can be used to
provide energy for maintenance and production of poultry. From the standpoint of
providing the normal energy needs, however, carbohydrates are by far the most
important, whereas fats rank next as an energy source (North, 1984). The major
energy sources of poultry feeds are the cereal grains and their by-products and fats.
Maize is the most important grain used in poultry feeds in South Africa making up at
least half of the total feed which they consume. While the bulkiness of feed can alter

4
feed intake, the bird, for the most part will eat to satisfy its need for the most limiting
nutrient in the diet, which would normally be energy. Because of this, special
attention must be given to nutrient ratios, especially the ratio of energy to various
nutrients such as amino acids and minerals (North, 1984).
1.2.2 Protein in broiler ration From the standpoint of poultry nutrition, the amino acids that make up proteins are
really the essential nutrients, rather than the protein molecule itself. Hence, protein
content as a measure of the nutritional value of a feed is becoming less important, and
each amino acid is being considered individually. The usefulness of a protein
feedstuff depends upon its ability to furnish the essential amino acids required by the
bird, the digestibility of the protein and the presence or absence of toxic substances.
As a general rule, several different sources of protein produce better results than
single protein sources (North, 1984).
1.2.3 Amino acids When formulating poultry rations, they must be so designed as to supply all the
essential amino acids in ample amounts. Special attention needs to be given to
supplying the amino acids lysine (most limiting), arginine, methionine and cystine,
and tryptophan, which are sometimes referred to as the “critical amino acids” in
poultry nutrition, as others are usually supplied adequately by a combination of
feedstuffs (North, 1990b).
Table 1 Amino acid specification (%) for broiler diets (North, 1990b)
Ration
Amino Acids (%) Starter Grower Finisher
Arginine 1.44 1.20 1.00
Glycine + Serine 1.50 1.00 0.70
Lysine 1.20 1.00 0.85
Methionine 0.50 0.38 0.32
Methionine + Cystine 0.93 0.72 0.62
Tryptophan 0.23 0.20 0.17

5
1.3 Nutrient composition of by-products (non-conventional feed) as animal feeds
A definition of a by-product feedstuff is a product that has value as an animal feed
and is obtained during harvesting and or processing of a commodity in which human
food is derived. Many by-products have a substantial potential value as animal
feedstuff, though more in ruminant than monogastric nutrition. The main reason is
that ruminants have the unique ability to utilise fibre because of their rumen microbes.
This means that cereals can largely be replaced by the by-products (Boucqué &
Fiems, 1988) and thus reducing the competition between human and animals for
cereal products.
The use of by-products and waste as sources of nutrients for domesticated animals has
always reflected the ability of these animals to scavenge. From the early days of
domestication those parts of plants that were unsuitable for human consumption
because they were too fibrous, had undesirable taste or carried a high risk of infection,
were given to animals which lived nearby. With the development of organised crop
and animal production, the process of feeding animals on crop by-products developed
to a considerable extent (Wilkinson, 1988). In recent years, by-products are receiving
increasing attention from livestock producers and nutritionists. The growth of the
animal feed industry has allowed considerable use to be made of by-products and
wastes, some of which, although containing potentially toxic components, can be
safely included in compounded feeds in relatively low proportions (Wilkinson, 1988).
1.4 Macadamia nut as a by-product
1.4.1 Macadamia nut background Australian botanists discovered and named the macadamia nut in 1843, but it was
only 125 years later, when it was successfully cultivated in Hawaii, that it actually
became known. The macadamia nut is a rarity-a “new” crop, which was domesticated
for the first time in 1858 in Australia. It is the only native Australian plant ever
developed as a commercial food crop (Rosengarten, 1984). The edible nuts are
produced by two species of the genus Macadamia i.e. Macadamia intergrifolia,
known as the smooth-shelled type, and M. tetraphylla, commonly referred to as the

6
rough-shell type. The macadamia tree under favourable conditions begins to produce
in six to seven years. It is a long-lived tree, which may have a productive life of 60
years or more (Rosengarten, 1984). The first large-scale plantings were at Keauhou
and Kona, where 7 000 trees were established. The Hawaii Agricultural Experiment
Station (HAES) undertook research on the cultivation of macadamia. The first
processing factory was established in 1931 (ARC Bulletin, 426).
1.4.2 Macadamia oil cake meal
Macadamia oil cake meal is an inexpensive by-product, produced from the
macadamia oil industry. The high varying fibre content of MOCM may render it
unsuitable as an ingredient for high producing poultry such as commercial layers or
broilers. The nutritive value of MOCM depends on the processing i.e. the extrusion
process applied by the oil producing industries. It is therefore highly recommended
that the user of the by-product must be informed about the processing and that the
nutrient composition is known before it can be included in chicken rations.
1.4.3 Production in South Africa
It is not exactly known when the first macadamia trees were established in South
Africa, but the Durban Botanical Garden already had a tree in 1915. The Citrus and
Subtropical Fruit Research Institute (CSFRI, currently the ITSC) established the first
trees from seed imported in 1931, one of which is still bearing fruit. The CSFRI
started doing research on this new crop in 1963. As a result the industry is now well
established in the subtropical areas. Commercial orchards have been established in the
Soutpansberg area and in the vicinity of Tzaneen, Nelspruit, White River, Barberton,
Komatipoort, Rustenburg, Pietermaritzburg and Port Shepstone. The orchard
containing the largest variety of cultivars in South Africa was established on the farm,
Cheviot, near Tzaneen (ARC Bulletin 426).
Macadamia is a large evergreen tree indigenous to the coastal rainforest of Australia.
While 10 species have been identified, only two (Macadamia tetraphylla and M.
integrifolia) are grown commercially in Hawaii, Australia and New Zealand. When
fresh, these nuts have a moisture content of up to 30 %; they are dried to a moisture
content of 2 % for storage (Kaijser et al., 2000). Very little research has been carried

7
out on their composition but initial data on the composition of NZ-grown macadamia
nuts suggested that a wide variation of fatty acid profiles exists (Dawson and Savage,
1997).
Agro-industrial by-products (by-product feedstuffs, BPF) and crop residues have been
identified as possible alternative feed resources for farmers, as the conventional
feedstuffs are expensive. The nutrient content and any other potential limitations must
be known in order to identify the best way to use these feedstuffs (Skenjana et al.,
2003, unpublished).
1.5 Wood ash (WA) as alternative calcium source
Mineral supplements are required to fortify animal diets in order to meet the mineral
needs for optimum health and production of livestock. However, use of mineral
supplements without proper appraisal of the composition of dietary ingredients may
be detrimental, possibly because of mineral antagonism (Mertz, 1997).
Various calcium (Ca) sources differ in their origin (animal or plant), particle size
(Guinotte et al., 1991) and structure (Ajakaiye et al., 1996). While Ca is usually
supplied as calcium carbonate from limestone in poultry rations, other sources, such
as marine shells can be used as a substitute (Guinotte et al., 1991). As a consequence,
their physico-chemical characteristics are different (Reid and Weber, 1976). Calcium
and phosphorus are essential for bone formation, and numerous skeletal pathologies
are associated with dietary deficiency in these minerals (Williams et al., 2000).
Nutrient requirements, including mineral requirements, change with age (NRC, 1994),
and are likely to vary with the potential growth performance of a strain. In spite of the
large volume of research conducted on Ca nutrition over the years, little information
has been published on the comparative biological availability of Ca from different Ca
sources available in tropical climates for chickens and most of the published works
were conducted using conventional Ca sources available in temperate climates
(Ajakaiye et al, 2003). Mineral supplements are not readily available in the rural areas
to improve productivity, especially for small village farmers. Therefore, it is
necessary to identify cheap, readily available local mineral sources to supplement the
feed of livestock on small farms.

8
Wood ash may be one such material. Ochetim (1988) suggested the use of wood ash
as a source of minerals for poultry. Wood ash has been used to treat straws to improve
their digestibility (Nolte et al., 1987; Ramirez et al., 1991, 1992) and their mineral
contents (Ramirez et al., 1991, 1992).
1.5.1 Wood ash characteristics Wood ash is the inorganic and organic residue remaining after the combustion of
wood. The ash content and chemical composition are variable among tree species and
also depend on soil type and climate. Temperate-climate woods yield 1-10 g ash/kg
ash, while tropical and subtropical woods yield up to 50 g/kg. Hardwoods, in general,
contain more ash than softwoods (Campbell, 1990). Campbell (1990) stated that the
ash content is highly variable within trees, being highest in the foliage and then
decreasing in the bark, twigs, roots, branches and stems. Within the stem, ash is
highest in the pith, early wood (spring wood), and juvenile wood. Barks contain much
higher ash content than wood, as indicated by the 10-30 g ash/kg content in hog fuel.
Analyses of wood ash have shown the complex and heterogeneous nature of this
material, though, the physical and chemical properties of wood ash are largely
unexplored and more data are needed in order to develop recycling processes, which
could expand the use of ash. The micrographs obtained by a scanning electronic
microscope indicate that wood ash contains large porous particles of carbon and
several inorganic particles of irregular shape (Etiegni and Campbell, 1991). X-
diffraction and the infrared spectra methods have shown that the calcite (CaCO3) is
the major compound of wood ash (Etiegni and Campbell, 1991; Ohno, 1992). Lime
(CaO) and calcium silicate (Ca2SiO4) among others, were identified as additional
constituents (Etiegni and Campbell, 1991).
The alkalinity or neutralization capacity of wood ash is high. This characteristic is
largely influenced by the temperature of combustion and the period of storage, the
alkalinity decrease with increasing temperature of combustion and with period of
storage (Etiegni and Campbell, 1991).

9
It is well documented that wood ash is rich in Ca and has been used successfully as a
fertilizer especially to ameliorate the acidity in soils (Demeyer et al., 2001). The
product also showed promise as a mineral supplement to livestock in the tropics
(Imbeah, 1999) and the treating of low quality fibres to improve fibre utilization by
ruminants (Nolte et al., 1987; Ramirez et al., 1992). The calcium in the wood ash
used for this research was mainly in the form of CaCO3. This agrees with the results
found by Van Ryssen and Ndlovu (2003).
Several methods can enhance the feeding value of straw by biological, physical or
chemical treatments, or their combinations. Chemical treatment increases lignin
solubility, reduce cell wall volume and increase cell content digestibility. The most
common alkalis used are NaOH, Ca(OH)2 and urea-ammonia (Trung and Devendra,
1987). Another economical alkaline source is wood ash. Nolte et al. (1987) found that
treatment of wheat straw with a 30% solution of wood ash for 6 hours increased
digestibility of dry matter (DM), organic matter (OM), neutral detergent fibre (NDF)
and acid detergent fibre (ADF) in goats.
Wood ash has been known to be an important source of potash and lime for many
years (Agee, 1919; Yearbook of Agric., 1938), although recent comprehensive
reference makes little reference to it. In the Yearbook of Agriculture (1938), wood ash
was suggested to “rate as a potash material with comparatively high lime content,
some phosphoric acid and magnesium, and small amounts of other elements”. Several
research studies had been carried out on the utilisation of wood ash in agriculture and
forestry. It is generally accepted that wood ash can serve as a liming agent and its
application to the soil is a convenient way to recycle exported nutrient elements
(Demeyer et al., 2001). Wood ash has also been recommended to correct forest
nutrient deficiencies or imbalance due to acid deposition and leaching (Cronan and
Grigal, 1995).
Low digestibility is one of the several traits of many crop residues. Consequently,
such residues need to be treated before they can be used as unconventional feed
resources in animal nutrition. Grinding and alkali treatment have been used in various
countries to improve the nutritive value of fibrous residues. The effects of sodium

10
hydroxide on the nutritive value of maize cobs (Escobar et al., 1984), wheat, barley,
and oat straws (Moss et al., 1990) have been evaluated in previous studies.
1.6 Hypothesis
Macadamia oil cake meal (MOCM) and wood ash (WA) can be used as alternative
feed ingredients to rear chickens in rural small-scale production systems.
1.7 Motivation
Feed represents a major cost of producing poultry meat and eggs, and farmers often
cannot cope with feed cost, forcing them to close their farms. Insufficient food
supplies at both national and global level hinder food security at household level by
providing less production and stocks that cannot meet the nutritional needs or proper
diets for household consumption in general (McCalla et al. 1999). Smallholder
farming globally had often demonstrated that it can be efficient in the use of resources
and can spread the benefits from agricultural growth more widely than other
production systems. Smallholder farming on its own would not be a solution for food
insecurity and rural underdevelopment, but as part of a diverse sector which also
allows space for other types of farming, has a great deal to offer (Duncan, 1998).
Because of the relationship between malnutrition and infection its combined effect is
more severe than the independent actions alone and children in particular are
susceptible to viral, bacterial and parasitic infections when undernourished. Their
resistance to diseases decreases and simultaneously nitrogen losses occur from the
body. An increased level of intake for animal products would significantly add to their
health through increased energy, protein, iron and vitamin A consumption (Latham,
1997).
By using non-conventional feed sources of energy in poultry diets, it will be possible
to alleviate the situation of malnutrition in rural population of South Africa and
worldwide by providing the family with high quality protein at low cost, thereby
decreasing the high incidence of protein deficiency. Maize is mostly the principal feed
ingredient used in poultry feeds, but because it is also a staple in the diet of most
people in under-developed countries, the quantity of maize available for use in animal
feeds is limited and expensive (Jacob et al., 1996). Therefore, the use of non-

11
conventional ingredient like MOCM as feed ingredient could be a resultant solution to
the problem of limited and expensive supply of conventional diet to poultry. The
question, however, arouse whether the use or inclusion of MOCM in chicken diet
would be cost effective for the raising of chickens typically found in rural areas.
Macadamia oil cake is an inexpensive by-product from the oil producing industry.
The by-product is very cheap to obtain and can be used by rural people as feed
ingredient for chickens in small-scale production systems. Research has been
conducted worldwide on the use of non-conventional feedstuffs as feed ingredient, but
no published data are available yet on the use of MOCM as feed ingredient for
chickens yet. One of the objectives of the study is to evaluate the use of MOCM as
non-conventional feed ingredient for chickens found in rural areas taking into
consideration the extrusion process applied and its nutrient composition.
On the other hand, calcium sources in poultry diets are mainly supplied through
limestone. As limestone as source of calcium might be scares and not easily available
to rural small scale farmers, there is a need to develop locally produced sources of Ca.
Wood ash was found to have high calcium content (Van Ryssen and Ndlovu, 2003).
As it is very cheap and highly available to rural communities, it was thought to be
necessary to conduct a study to evaluate the use of wood ash as an alternative
supplement.
1.8 Objectives
The objective of this study was to evaluate the nutritive value of MOCM and WA as
alternative ingredients for chicken diets used in small-scale production systems in
rural areas.
12
CHAPTER 2 – MATERIALS AND METHODS
2.1 Introduction
The experiment was conducted to evaluate the effect of MOCM and WA as
alternative feed ingredients in growth and layer diets for chickens found in rural areas.
This study was conducted in two phases. Firstly, a growth study was conducted with
dual-purpose chickens over a period of 15 weeks. After that, the cockerels were
slaughtered and the hens were used in a subsequent 4-week layer study.
2.2 Materials
2.2.1 Experimental animals
A total of 384 day-old New Hampshire chicks were obtained from “Fowls for Africa”
at the ARC-Livestock Business Division (Private Bag X2 Irene, 0062, Pretoria, South
Africa). The New Hampshire breed originated in the United States of America, and
has been used in developing many of the synthetic lines of meat-type chickens and is
still used for this purpose. The ability of the breed to produce a large number of eggs
that hatch well has made it a valuable asset to many breeding combinations (North,
1984). The New Hampshire breed was chosen for this experiment to represent the
type of chickens commonly found under rural situations.
Seventy two of the New Hampshire hens from the growth trial were used in the layer
phase of the study, which lasted for a period of four weeks. The experimental period
started at an age of 20 weeks and was terminated at an age of 23 weeks.
2.2.2 Treatments
2.2.2.1 Growth study The research was conducted as a 4x2 factorial design and 48 ‘as hatched’ chicks were
randomly allocated per treatment, with four replications of 12 chicks per replicate,
and randomly distributed through the house. Four diets were formulated, one without
MOCM and the other three containing different levels of MOCM, viz. 10, 50 and
100% plus salt and a trace nutrient mixture. Each of these treatments was split in two

13
with one receiving limestone (CaCO3) and the other WA, as Ca sources, giving eight
treatments in total (Table 2.1). All the treatments received diets with a Ca level close
to 1 %.
2.2.2.2 Layer study
The hens used for the layer study were randomly assigned to individual cages and
divided into six treatment groups with four replicates per treatment and three hens per
replicate. An empty cage was left between each replicate so that no cross feeding
could have taken place. Three diets were formulated, one without MOCM and the
other two containing varying levels of MOCM, viz. 10 and 50 % plus salt and a trace
nutrient mixture. Each of these treatments was split in two with one receiving
limestone (CaCO3) and the other WA, as Ca sources, resulting in six treatments in
total (Table 2.2). The 12 hens used for each of the 4 treatments were randomly
selected from their corresponding treatment group of the growth study.
Table 2.1 Number of birds per replicate for the different treatments of the grower trial
Number of birds in each treatment group Total no.
Rep.* of birds
0% MOCM 10% MOCM 50% MOCM 100% MOCM
Lime WA Lime WA Lime WA Lime WA
1 12 12 12 12 12 12 12 12 96
2 12 12 12 12 12 12 12 12 96
3 12 12 12 12 12 12 12 12 96
4 12 12 12 12 12 12 12 12 96
Total 48 48 48 48 48 48 48 48 384
* Replicates, MOCM = Macadamia Oil Cake Meal, WA = Wood ash

14
Table 2.2 Number of birds per replicate for different treatments of the layer trial Number of birds in each treatment group Total no.
Rep.* of birds
0% MOCM 10% MOCM 50% MOCM
Lime WA Lime WA Lime WA
1 3 3 3 3 3 3 18
2 3 3 3 3 3 3 18
3 3 3 3 3 3 3 18
4 3 3 3 3 3 3 18
Total 12 12 12 12 12 12 72 * Replicates, MOCM = Macadamia Oil Cake Meal, WA = Wood ash
2.2.3 Experimental terrain
The growth study was conducted using an environmentally controlled broiler house at
the experimental farm of the University of Pretoria, Hatfield, Pretoria, South Africa.
Both the growth and the layer study were conducted with the approval of the Ethics
Committee (EC 030722-021) of the Faculty of Natural and Agricultural Sciences of
the University of Pretoria.
Inside the broiler house the replicate groups of chickens were placed randomly in pens
(3 x 1.5 m) enclosed with chicken mesh, and sawdust was used as litter material. The
sawdust was left in the pens for the duration of the trial. Light was provided for 24
hours per day and infrared bulbs were used as heating equipment. House temperature
was kept at 32 °C during the early stages and gradually reduced to 22 °C.
A naturally ventilated laying house on the experimental farm of the University of
Pretoria, Hatfield, Pretoria, South Africa was used for the layer experiment. Inside the
layer house the hens were placed randomly in cages measuring 400 mm x 500 mm x
420 mm with one hen per cage. Light was provided for 23 hours and 1-hour darkness.
Normal light bulbs were used as the light source.

15
2.3 Diet formulation and feeding facilities
A least cost feed formulation programme was used to formulate the six treatment diets
containing the 0%, 10% and 50% inclusion levels of MOCM. These diets were
formulated to meet or exceed nutrient specification levels for poultry starter, grower
and layer diets as given in the NRC (1994). In the treatments containing 100%
MOCM only the different calcium sources plus a salt and trace nutrient mixture were
added to the MOCM. The Ca level in WA was determined in advance and was found
to be 257 Ca/kg compared to the 380 g Ca/kg in limestone. The level of inclusion of
WA was therefore slightly higher than when limestone was used.
During the grower trial flat tray feeders were used for the first three weeks after which
tube feeders replaced flat tray feeders. Water was provided ad libitum using bell
drinkers that were adjusted to breast height of the chicks. The chickens were fed a
starter diet from 1 to 4 weeks of age and a grower diet from 4 to 15 weeks. After 15
weeks the growth trial was terminated and the cockerels were slaughtered. All hens
were kept in the broiler house until they reached 19 weeks of age. At 19 weeks, 12
hens from each treatment (except the 100% MOCM group) were randomly selected
and moved to a layer house for commencement of the layer trial.
The formulation of the starter, grower and layer rations are shown in Tables 2.3 to 2.5.
The analysed nutrient levels of these diets are shown in Tables 3.4 to 3.6.
During the layer trial feed troughs were used and ad libitum water was provided
through nipple drinkers. The hens were fed layer diets for a period of four weeks.
2.4 Source of macadamia oil cake
Macadamia oil cake was obtained from the Royal Macadamia processing plant for
both the growth and the layer trial. The macadamias originated from the Green Farm
and Royal Macadamia farms at Makhado (Louis Trichardt) in the Limpopo Province.
The MOCM was milled in a hammer mill. Samples were collected for laboratory
analysis and the balance was used to prepare the experimental diets.

16
2.5 Preparation of the ash
Dry wood from a variety of tree species was collected on the University experimental
farms. The wood was burned in a furnace and the ash was collected. Initially the ash
was sifted through a 5 mm sieve and the coarse material returned to burn further to
ash. After that the residue was sifted through a 1 mm sieve to remove any coarse
material. A sample of ash was analysed in the laboratory for mineral composition.

17
Table 2.3. Ingredient composition of the starter diets used in the growth trial
Treatment Group
0% MOCM 10% MOCM 50% MOCM 100% MOCM Lime WA Lime WA Lime WA Lime WA
Ingredient (g/kg ‘as fed’)
Yellow Maize 499 480 528 530 250 240 - -
Wheat bran 132 140 110 110 66 70 - -
Soya oil-cake meal 188 183 152 155 94 92 - -
Sunflower oil cake meal 80 81 97 91 40 41 - -
Fish meal 73 73 80 81 36 36 - -
Macadamia oil cake - - 110 110 483 483 680 570
Limestone 19 - 23 - 19 - 19 -
Wood ash - 33 - 26 - 27 - 30
Salt 10 10 10 10 10 10 10 10
Premix* 3 3 3 3 3 3 3 3 *Premix / kg, MOCM= Macadamia Oil Cake Meal, WA= Wood Ash

18
Table 2.4. Ingredient composition of the grower diets used in the growth trial
Treatments
0% MOCM 10% MOCM 50% MOCM 100% MOCM Lime WA Lime WA Lime WA Lime WA
Ingredient (g/kg ‘as fed’)
Yellow Maize 551 584 659 657 276 292 - -
Wheat bran 221 168 - - 110 84 - -
Soya oil-cake meal 111 120 143 140 56 60 - -
Fish meal 86 86 76 78 43 43 - -
Macadamia oil cake - - 97 97 493 493 650 570
Limestone 22 - 16 - 11 - 22 -
Wood ash - 33 - 19 - 17 - 30
Salt 10 10 10 10 10 10 10 10
Premix * 3 3 3 3 3 3 3 3 *Premix / kg, MOCM= Macadamia Oil Cake Meal, WA= Wood Ash

19
Table 2.5. Ingredient composition of the layer diets used in the layer trial
Treatments
0% MOCM 10% MOCM 50% MOCM Lime WA Lime WA Lime WA
Ingredient (g/kg ‘as fed’)
Yellow Maize 650 635.3 597.4 567.1 325.0 317.6
Wheat bran 80 60 - - - -
Soya oil-cake meal 150 159.5 183.8 191.4 75.0 79.8
Mono Calcium Phosphate 13.5 17.7 15.9 19.0 6.80 8.8
Macadamia oil cake - - 100 100 446.8 436.2
Limestone 100 - 96.2 - 100 -
Wood ash - 121.1 - 115.9 - 121.1
Salt 4 4 4 4 4 4
Premix * 2.5 2.5 2.5 2.5 2.5 2.5 *Premix / kg, MOCM= Macadamia Oil Cake Meal, WA= Wood Ash

20
2.6 Vaccination programme
The chickens were vaccinated against most common diseases. The vaccination
programme is given in Table 2.6.
Table 2.6. The vaccination programme of the birds during the growth trial
Age Disease Vaccine Application
route
Date of
Application
1 Day Mareks Mareks Injection 15/07/2003
12 Days Newcastle ND La Sota Fine Spray 27/07/2003
19 Days Gumboro TAD G Fine Spray 3/08/2003
23 Days Gumboro TAD G Fine Spray 7/08/2003
26 Days Newcastle ND La Sota Fine Spray 11/08/2003
The supplier vaccinated the chicks for Marek’s disease before the birds were
collected. The other vaccinations were done during the trial.
2.7 Slaughter procedure
At the end of the growth trial at 15 weeks, 48 cockerels per pen from the remaining
six treatments were humanely slaughtered. The slaughtered birds were dipped in
scalding warm water (60 °C) for ±1 min before defeathering. The carcasses were
dissected into two equal halves, and the right half was frozen until further analyses.
2.8 Measurements taken
2.8.1 Growth study
2.8.1.1 Feed intake
Feed intake was recorded every Monday morning on a weekly basis. Feed intake, was
calculated by subtracting feed leftovers from total feed offered.

21
2.8.1.2 Body weight
Total body weights of the birds per pen were recorded on a weekly basis every
Monday morning, and the mean body weight per bird per pen was determined.
2.8.1.3 Feed conversion efficiency
Feed conversion efficiency was calculated weekly as body weight (kg) gain per pen
over feed intake (kg).
2.8.1.4 Mortalities
Mortalities were recorded over the 15-week period. Dead birds were removed and
incinerated. Post mortems were not conducted because of financial constrains. The
100% MOCM treatments were terminated at nine weeks because of their poor growth
and high mortality rate.
2.8.2 Parameters determined after slaughtering
2.8.2.1. Carcass composition
Half carcasses (without the tibia, intestine, head and the neck) were weighed to record
the slaughter weight and taken for analysis of carcass composition. The carcasses
were stored in a freezer between –10 °C and –20 °C for further analyses. The half
carcass was thawed (at room temperature) weighed and carefully dissected into fat,
muscles (lean meat) and bone to calculate carcass composition as a percentage of
carcass weight.
2.8.2.2 Preparation of the tibiae
Both legs with tibia bones from each chicken were collected, labelled, wrapped,
sorted (by treatment number), and stored in a freezer at between –10 °C and –20 °C
for determination of bone strength. The legs were thawed and cleaned of adhering
tissues, and the tibiae were removed. The tibiae were wrapped in a Para film paper
and placed in the refrigerator. Before the breaking strength test was done, the bones
were dried in an oven at a temperature of between 60-80 oC. Both the dry tibiae from
each bird were weighed.

22
2.9. Layer study
Mortalities were recorded daily over a four- week period and dead birds were
removed and incinerated. Post-mortems were not conducted due to financial
constrains. Feed intake (g), egg weight (g) and egg production expressed in
percentage units (%) were determined daily. Feed conversion ratio was calculated
from the feed intake, egg weight and egg production. This was done for all the
treatments and their replicates. On the fourth week six eggs were randomly collected
from each of the six treatments for determination of shell breaking strength (Instron,
model 1011 Canton Massachusetts, USA).
2.10 Chemical analyses of feeds
The same procedure of chemical analyses of the feeds was done for both the growth
and layer study.
2.10.1 Dry matter content
The DM content analysis was done according to the AOAC (1995) methods. A
porcelain crucible was put into an oven for about one-hour in order to dry it
completely after which it was put into a desiccator to cool. One gram of each sample
of the by-product was weighed into a porcelain crucible, and then placed in an oven at
100 oC for 24 hours. The crucibles were then put in a desiccator that contained silica
gel for 30 minutes to cool before weighing. The DM content (%) was calculated as
recommended by AOAC (1995).
% DM = (dry sample mass/wet sample mass) x 100
2.10.2 The ash content
The ash content analysis was done according to the AOAC (1995) methods. Oven-
dried samples of the by-products in porcelain crucibles from the DM procedure were
incinerated in a muffle furnace for four hours at 600 oC. The furnace was then allowed
to cool down to approximately 250 oC. The crucibles were placed in a desiccator for
30 minutes and weighed. The ash content of the samples was calculated as follows:
% Ash = (ash mass/wet sample mass) x 100

23
2.10.3 Crude protein determination
The determination of the crude protein was done as described in the A.O.A.C. (2000),
using the Dumas’ method, with the Leco FP-428 version 2.40 of the Leco Corporation
St. Joseph MI USA.
Sample preparation:
1. Weigh out 4 standards, approximately 0.2 g of EDTA (note the exact mass)
into “cups”. Fold up the cups carefully into drumstick shape.
2. Weigh out samples, approximately 0.2 g, in duplicate, note the exact mass. If
the sample is extremely bulky reduce the sample mass to either 0.15 g or 0.1 g,
as appropriate. Fold up the cups carefully into drumstick shape. The results are
printed out after they have been analysed.
2.10.4 Amino acids The amino acid composition of the samples was determined using the Pico tag method
(Bidlingmeyer et al., 1984), courtesy of Ms Exley from the Department of
Biochemistry, University of Pretoria. A 10 mg defatted sample was weighed into a
hydrolysis flask and 1 mL of 6N HCl plus 1 % phenol was added. The flask was
evacuated and blown with N2 to remove O2 and then sealed off under vacuum (0.01
mm Hg). They were then placed in an oven for 24 hours at a temperature of 110 ºC.
After cooling, deionised water was added up to 5 mL. The samples were then
derivatized. After that, they were filtered and placed in WSIP (automatic loader). The
amino acids were separated by pumping the solution through a reverse fase column.
Tow pumps were used to form a gradient for optimum separation. SYSTEM GOLD
was used for calculations.
2.10.5 Crude fibre (Proximate analysis method)
The crude fibre (CF) concentration of the by-product samples was determined using
the same method followed by Goering & Van Soest (1970) using the Tecator fibretec
system. One gram of each sample was weighed into a filter crucible and placed on the
hot extraction units of the system. The extraction was carried with a 30 mL of 98 %
sulphuric acid H2SO4 (following Weende method) for 14 minutes, by boiling. The
H2SO4 was removed by switching on the vacuum pump and washed out (three times)
with warm distilled water. Sequential to the H2SO4 removal, 100 mL of sodium

24
hydroxide (NaOH) was added and boiled for 14 minutes and removed as with H2SO4.
The residue in the crucibles were dried at 100 oC overnight, then cooled in a
desiccator for 30 minutes and weighed. After weighing they were ashed in a muffle
furnace at 600 oC for 3 hours. The furnace was allowed to cool to at least 250 oC, and
then the crucibles were cooled in a desiccator for 30 minutes and weighed.
Percentage CF was calculated as follows:
% Crude fibre = Wrd – Wra
Ws
Wrd = weight of residue after drying in crucible
Wra = weight of residue after ashing in crucible
Ws = weight of initial sample
2.10.6 Neutral detergent fibre determination
The NDF concentration of the by-product samples was determined according to
Goering & Van Soest (1970) using the Tecator fibretec system. One gram of each
sample was weighed into a filter crucible and placed on the hot extraction units of the
system. The extraction was carried with a 100 mL of neutral detergent solution (NDS)
(following alpha amylase method) for one hour, after boiling has commenced. The
NDS was removed by washing out with hot distilled water. The residues in the
crucibles were dried at 100 oC overnight, then cooled in a desiccator for 30 minutes
and weighed. After weighing they were ashed in a muffle furnace at 600 oC for 3
hours. The furnace was allowed to cool to at least 250 oC, and then the crucibles were
cooled in a desiccator for 30 minutes and weighed.
Percentage NDF was calculated as follows:
% NDF = Wrd – Wra
Ws
Wrd = weight of residue after drying in crucible
Wra = weight of residue after ashing in crucible
Ws = weight of initial sample

25
2.10.7 Fat determination
Total fat content was determined according to the ether extraction method (AOAC,
1995) using the Soxtec HT6 Model. Three g of sample was weighed onto a filter
paper and then put into a thimble. The thimble was then placed on an extraction unit.
Petroleum ether of 60 oC - 80 oC was used for extraction. The extracts were collected
into extraction cups for two hours of boiling. The extraction cups were then dried in a
70 oC oven overnight, and removed and placed in a desiccator for 30 minutes to cool
and then weighed. The total fat was calculated as follows:
% Crude Fat = (Mass of flask plus residue – Mass of flask) x 100
Sample mass
2.10.8 Minerals
The concentration of minerals, Ca, phosphorus (P), and magnesium (Mg) were
determined in all the diet samples. A sample of 1 gram was digested in a block
digester at 230 oC using the wet digestion technique. One gram of sample was
weighed and put into a test tube together with 25 mL nitric acid (HNO3) (65 %) and
heated afterwards and 5 mL perchloric acid (HOCl) was added into the tubes after
about 10 minutes when almost half of the HNO3 had evaporated. The solution was
further allowed to boil for another 40 minutes until the solution was clear. The
solution was then allowed to cool down and up to 50 mL with distilled water. Each
sample was prepared in duplicates and analysed for the different minerals. Ca and Mg
were determined using the atomic absorption spectrophotometer (Perkin Elmer 2380
Model). P concentration was determined using a Technicon auto analyser and the
concentration obtained from a calibration curve.
2.10.9 Determination of metabolisable energy
The metabolisable energy (ME MJ/kg) values of the experimental diets were
calculated using the equation adapted from the National Research Council (NRC,
1994), in nutrient requirements for domestic animals, as shown:
ME= (((protein*194.7) + (fibre*13.1) + (fat*275.1) + (NFE*147.9))/1000)*0.96

26
2.10.10 Nitrogen free extract
Nitrogen free extract (NFE) is determined by subtracting from 100 the sum of the
amounts of ash, crude protein, ether extract, crude fibre and moisture (expressed in
g/kg) and is considered to be a measure of the digestible carbohydrates (Scott et al.,
1982).
NFE = 100-(ash + protein + fibre + fat + moisture)
2.11 Breaking strength of the tibia bone and egg shell
The same machine and procedure were used for the breaking strength of both the tibia
bones and eggshells, with the difference being with the applied load range. For the
eggshells and tibia bones a load range varying from 50 to 100 loads, respectively were
used.
2.11.1 Measurements on tibia bones
The major and minor exterior diameters were measured at the thinnest part of the tibia
diaphysis with a veneer calliper. All the bones were kept dry until the time of the
breaking test. Strength of the tibia was determined with an Instron Universal Testing
machine (Model No. 1011, Instron Corporation, Canton, MA, USA) using the
standard bending test (ASAE, 1993). Each tibia was placed horizontally on a three-
point bend fixture. The length of the tibia was measured and the plunger was placed in
the centre for breaking of the bone. The plunger mounted on the crosshead of the
testing machine was adjusted until it has touched the bone at the centre. The test was
done on both the right and left tibia. A set crosshead speed of 30 mm/min was used
for both the tibiae.
2.11.2 Breaking strength and Instron calibration
Method:
Calibration was done as follows:
Attach the compression probe before calibrating; make sure that the washer is used.
Switch the machine on 15 minutes beforehand.
Press function: Units [Enter]
SI [Enter]

27
Press transducer: 50 kg/500 N [Enter]
Balance knobs to zero
Load Range: Must be 10 % of max load
- 5 kg for 50 kg
- 50 N for 500 N
Speed: Set to 100 mm/min [Enter]
Balance knobs to zero and lock.
Hang 5 kg weight to attachment (using wire loop).
Use yellow screwdriver to adjust setting:
Set to 50 N
Remove 5 kg weight and set the gauge length
Set compression
Break action: set to return
Unlock balance knobs again and set to zero and lock again.
Date selection set/adjust to break to read the force on screen
The bone is placed horizontal with the three-point bend fixture before breaking
Breaking strength is red on the Instron screen in Newton
Printer:
• Start knob down
• Prop time knob down
• 1:20 knob down
• 10 X knob down
• Power on, Input knob on
• Each column on the paper will then represent 10 Newton
• Pen cap off and in down position
2.11.3 Egg breaking strength
Method:
The Instron Model 1011 was used to determine the breaking strength.
Calibration was done as follows:
Attach the compression probe before calibrating; make sure that the washer is used.
Switch the machine on 15 minutes beforehand.
Press function: Units [Enter]

28
SI [Enter]
Press transducer: 50 kg/500N [Enter]
Load Range: Must be 10% of max load
- 5 kg for 50 kg
- 50 N for 500 N
Speed: Set to 100 mm/min [Enter]
Balance knobs to zero and lock.
Hang 5 kg weight to attachment.
Use screwdriver to adjust setting: set to 50 N
Remove 5 kg weight and set the gauge length
Set compression
Break action: set to return
Unlock balance knobs again and set to zero, and lock.
Date selection: set to break
The egg was placed with its sharp end up before breaking
Breaking strength is red on the Instron screen in Newton
2.12 Chemical analyses of tibia bones
After determination of breaking strength, the bones were crushed and milled for
mineral analyses. Bones were further defatted by soxhlet extraction apparatus using
petroleum ether and chemical analysis were done according to the methods as
described in the AOAC (2002).
2.13 Procedure to determine mineral crystalline composition of wood ash
The analysis for the form in which Ca is available was done using X-ray diffraction
(XRD) (King & Alexander, 1974). The sample was prepared using standard Siemens
sample holders and the powder pressed into the holder using a glass slide.
The instrument used and data collection parameters:
• Instrument Siemens D-501
• Radiation Cu Ka (1.5418 Å)
• Temperature 25 ºC

29
• Specimen flat-plate, rotating (30 RPM)
• Power setting 40 kV, 40 mA
• Soller slits 2º (diffracted beam side)
• Divergence slits 1º
• Receiving slits 0.05º
• Monochromator secondary, graphite
• Detector scintillation counter
• Range of 2� 4-70º 2�
• Speed width 0.04º 2�
• Time per step 1.5 s
2.14 Statistical analyses
An analysis of variance with the ANOVA model (Statistical Analysis Systems, 1994)
was used to determine the significance between different treatments for the balanced
data, with the mortalities taken into consideration. Means and standard deviations
(SD) were calculated. The data was analysed for a 15 weeks period and the last two
treatments (100% MOCM plus limestone and WA) were excluded from the data of a
15-week period because they were terminated at an age of eight weeks due to their
poor growth performance.
Significance difference of (5%) between means was determined multiple comparisons
using the Tukey t-test (Samuels, 1989). Significance between repeated weeks was
analysed. Least square means (LSM) and standard errors (SE) were calculated.
Significance difference of (5%) between least square means for a week was
determined using the Bonferroni test (Samuels 1989).
30
CHAPTER 3 – RESULTS
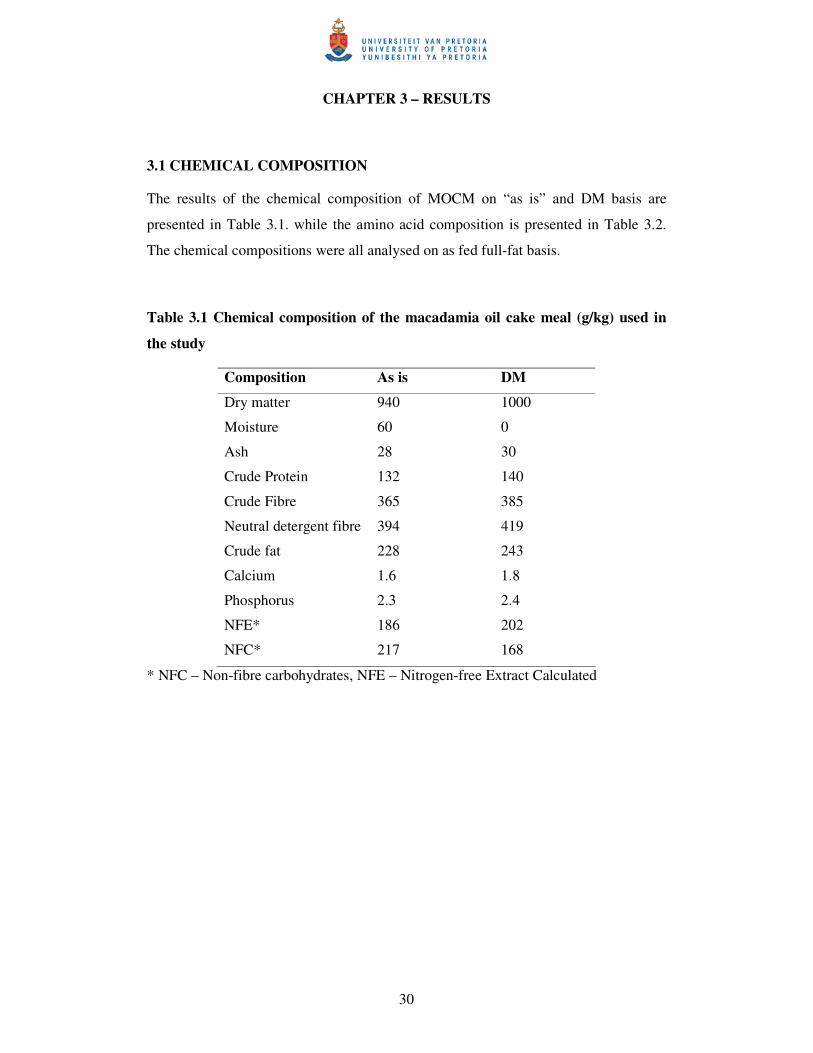
3.1 CHEMICAL COMPOSITION
The results of the chemical composition of MOCM on “as is” and DM basis are
presented in Table 3.1. while the amino acid composition is presented in Table 3.2.
The chemical compositions were all analysed on as fed full-fat basis.
Table 3.1 Chemical composition of the macadamia oil cake meal (g/kg) used in
the study
* NFC – Non-fibre carbohydrates, NFE – Nitrogen-free Extract Calculated
Composition As is DM
Dry matter 940 1000
Moisture 60 0
Ash 28 30
Crude Protein 132 140
Crude Fibre 365 385
Neutral detergent fibre 394 419
Crude fat 228 243
Calcium 1.6 1.8
Phosphorus 2.3 2.4
NFE* 186 202
NFC* 217 168

31
Table 3.2 Amino acid composition* (g/kg) of macadamia oil cake on as is and dry
matter basis
Amino acid % As is /100 g DM /100 g true protein ** As % of lysine
Aspartic acid 1.02 1.08 8.99 163
Glutamic acid 2.27 2.41 20.07 365
Serine 0.69 0.73 6.08 111
Glycine 0.70 0.74 6.16 112
Histidine 0.25 0.27 2.25 41
Arginine 1.17 1.24 10.32 188
Threonine 0.49 0.52 4.33 79
Alanine 0.67 0.71 5.91 107
Proline 0.65 0.69 5.75 105
Tyrosine 0.43 0.46 3.83 70
Valine 0.53 0.56 4.66 85
Methionine 0.19 0.20 1.67 30
Isoleucine 0.41 0.44 3.66 67
Leucine 0.77 0.82 6.83 124
Phenylalanine 0.45 0.48 4.00 73
Lysine 0.64 0.66 5.50 100
Total 12.01 100
* Tryptophan not determined, ** Based on sum of amino acids, i.e. 12.1 g/100 g
3.2 WOOD ASH
The crystalline forms of the elements in WA are presented in Table 3.3 and Figure
3.1. The results show that calcite (CaCO3) is the major compound of WA constituting
58.8% of the DM concentration, and then followed by periclase (MgO) at a
concentration of 19.30%. The other element viz. hydroxylapatite (Ca5 (PO4)3(OH)) to
sylvite (KCI) ranged from 7.4 % to 1.2%, respectively.

32
Table 3.3 Approximate proportions of crystalline forms (XRD analysis) of
minerals in wood ash
Crystalline form Symbol Percentage
Calcite CaCO3 58.8
Periclase MgO 19.4
Hydroxylapatite Ca5(PO4)3(OH) 7.4
Quartz SiO2 1.4
Ankerite Ca(Fe+2,Mg)(CO3)2 1.8
Halite KO4NaO6Cl 1.3
Fairchildlite K2Ca(CO3)2 6.5
Lime CaO 2.2
Sylvite KCl 1.2

33
W O O D -A S H
0 0 -0 2 1 -1 2 8 7 ( * ) - F ai r ch i l d it e , s yn - K2 C a (C O 3 )2 - H e xa g o n a l - I / Ic P D F 1 .5 - 0 0 -0 2 6 -0 9 1 9 ( C ) - H a li t e , p o ta ss ia n , s y n - K 0 .4 N a 0 .6 C l - C u b i c - 0 0 -0 4 1 -0 5 8 6 ( * ) - A n k er ite - C a (F e + 2 ,M g )( C O 3 )2 - H ex a g o n a l ( R h ) - I/ I c P D F 2 .8 -
0 0 - 0 4 1 - 1 4 7 6 (* ) - S yl v ite , s yn - KC l - C u b i c - 0 0 - 0 4 6 - 1 0 4 5 (* ) - Q u ar tz, s yn - S iO 2 - H e x a g o n al - I / Ic P D F 3 .4 - 0 0 - 0 3 7 - 1 4 9 7 (* ) - L i m e , s y n - C a O - C u b i c - 0 0 - 0 0 9 - 0 4 3 2 (I ) - H y d ro xy l ap at i te , sy n - C a5 (P O 4 ) 3 (O H ) - H e xa g o n a l - 0 0 - 0 4 5 - 0 9 4 6 (* ) - P e ri c l a se , s yn - M g O - C u b i c - I/ Ic PD F 1 . - 0 0 - 0 0 5 - 0 5 8 6 (* ) - C a l ci te , sy n - C aC O 3 - H e xa g o n a l (R h ) - I / Ic P D F 2 . - O p e ra t i on s: B a ck g ro u n d 0 .0 0 0 ,1 .0 0 0 | Im p o rtW O O D -A S H - F il e : VA N R E N S B U R G 0 4 - 1 . ra w - T y p e : 2 T h /T h l oc k ed - S tar t : 5 .0 0 0 ° - E n d : 7 0 .0 0 0 ° - S
Lin
(Cou
nts)
0
1 00
2 00
3 00
4 00
5 00
6 00
7 00
8 00
9 00
1 00 0
1 10 0
1 20 0
1 30 0
1 40 0
1 50 0
1 60 0
1 70 0
1 80 0
1 90 0
2 00 0
2 10 0
2 20 0
2 30 0
2 40 0
2 50 0
2 60 0
2 -T h e ta - S c a le
5 1 0 20 3 0 4 0 5 0 6 0 7 0
Figure 3.1 Graphical presentations of the crystalline forms in wood ash

34
3.3 The chemical composition of the experimental diets
The chemical compositions of the starter, grower and layer diets for the different
treatment diets are presented in Tables 3.4, 3.5 and 3.6, respectively. The diets were
formulated according to feed specification to conform to the standard of the NRC
(1994) for poultry. In general, the 50% MOCM diet had a slightly higher fat content
and much higher fibre content than the 0% and 10% MOCM diets.
Table 3.4 Chemical composition (g/kg) of the different treatments of the starter
diets on an as fed, full fat basis
Treatments
0%MOCM 10%MOCM 50%MOCM
Composition L W L W L W
Dry matter 900 900 900 900 920 920
Crude protein 210 230 230 230 190 180
Fat 60 40 50 50 80 100
Crude fibre 60 70 90 90 220 220
Calcium 10 10 10 10 10 10
Total phosphorus 5 7 6 6 4 4
Neutral detergent fibre 220 220 230 230 370 350
MOCM – Macadamia oil cake meal, L – Lime, W – Wood ash

35
Table 3.5 Chemical compositions of different treatments of the grower diets, as
fed, full fat basis (g/kg)
Treatments
0%MOCM 10%MOCM 50%MOCM
Composition L W L W L W
Dry matter 910 910 910 910 930 930
Crude protein 190 190 180 180 180 160
Fat 30 30 40 40 80 80
Crude fibre 40 40 50 50 160 190
Ash 70 70 60 60 70 80
Calcium 10 10 9 8 10 10
Total phosphorus 6 7 5 5 4 5
Magnesium 2 3 2 2 2 4
NDF
ME (MJ/kg)*
170
120
150
120
150
130
170
130
280
120
340
110 *ME – Metabolisable energy (calculated), NDF – Neutral detergent fibre, MOCM –
Macadamia oil cake meal, L – Lime, W – Wood ash
* ME= (((protein*194.7) + (fibre*13.1) + (fat*275.1) + (NFE*147.9))/1000)*0.96

36
Table 3.6 Chemical compositions of different treatments of the layer diets on as
fed, full fat basis (g/kg)
Treatments
Composition 0%MOCM 10%MOCM 50%MOCM
L W L W L W
Dry matter 910 910 910 920 920 930
Crude protein 130 130 140 150 130 120
Fat 20 20 30 20 60 50
Ash 110 140 110 140 100 120
Calcium 30 30 30 30 30 30
Total phosphorus 7 8 6 9 6 7
Magnesium 2 7 2 8 2 7
Neutral detergent fibre 140 120 130 130 280 280
ME (MJ/kg)* 120 110 120 110 110 110 *ME – Metabolisable energy (calculated), MOCM – Macadamia oil cake meal,
L – Lime, W – Wood ash
* ME= (((protein*194.7) + (fibre*13.1) + (fat*275.1) + (NFE*147.9))/1000)*0.96
The amino acid profiles of the grower and layer diets are presented in Tables 3.7 and
3.8.

37
Table 3.7 Amino acid concentrations (g/kg) of different treatment diets in the
grower experiment on an as fed, full fat basis
Treatments
Composition 0%MOCM 10%MOCM 50%MOCM
L W L W L W
Aspartic acid 10 10 11 10 9 9
Glutamic acid 26 26 25 24 26 23
Serine 7 7 7 7 6 6
Glycine 8 8 8 7 7 7
Histidine 3 3 3 3 3 3
Arginine 9 9 10 9 12 11
Threonine 6 6 6 5 5 5
Alanine 9 8 7 7 6 5
Proline 9 10 9 8 7 7
Tyrosine 5 5 5 5 5 5
Valine 8 6 7 7 6 6
Methionine 3 9 3 3 2 3
Cystine 6 2 0.3 0.0 0.2 0.2
Isoleucine 9 6 6 6 5 5
Leucine
Phenylalanine
Lysine
5
5
7
11
6
8
11
6
7
11
6
7
8
5
6
9
5
6
MOCM – Macadamia oil cake meal, L – Lime, W – Wood ash
38
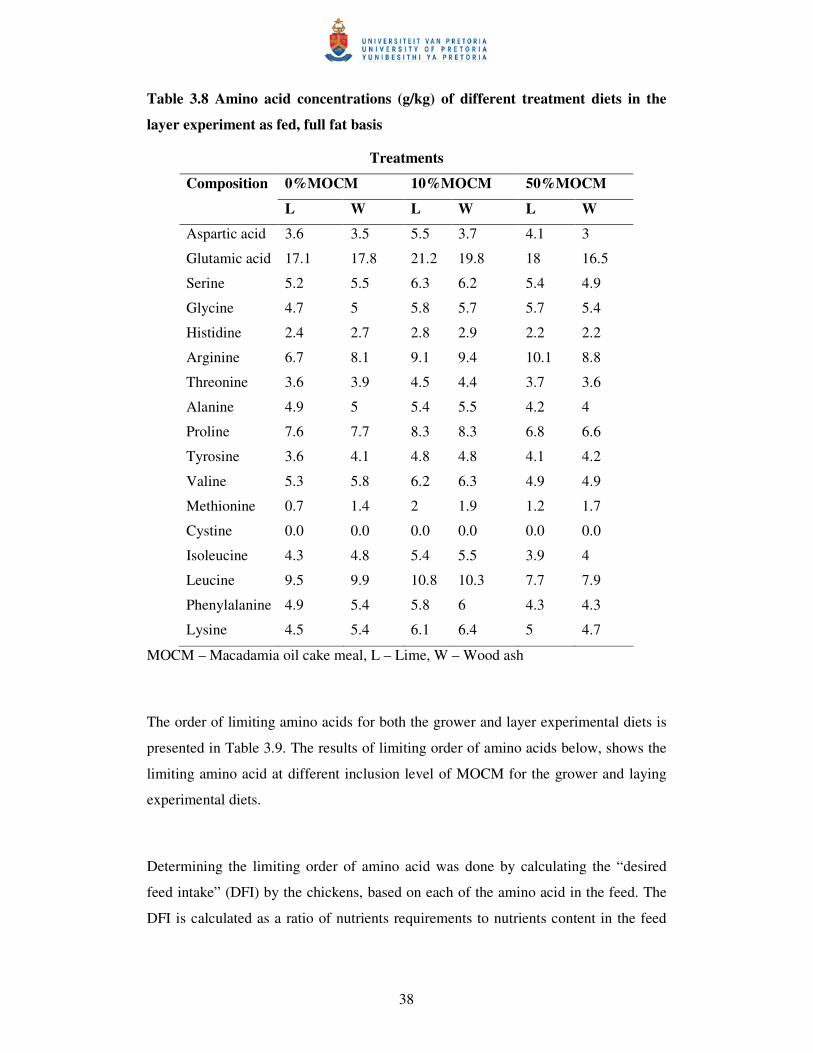
Table 3.8 Amino acid concentrations (g/kg) of different treatment diets in the
layer experiment as fed, full fat basis
Treatments
Composition 0%MOCM 10%MOCM 50%MOCM
L W L W L W
Aspartic acid 3.6 3.5 5.5 3.7 4.1 3
Glutamic acid 17.1 17.8 21.2 19.8 18 16.5
Serine 5.2 5.5 6.3 6.2 5.4 4.9
Glycine 4.7 5 5.8 5.7 5.7 5.4
Histidine 2.4 2.7 2.8 2.9 2.2 2.2
Arginine 6.7 8.1 9.1 9.4 10.1 8.8
Threonine 3.6 3.9 4.5 4.4 3.7 3.6
Alanine 4.9 5 5.4 5.5 4.2 4
Proline 7.6 7.7 8.3 8.3 6.8 6.6
Tyrosine 3.6 4.1 4.8 4.8 4.1 4.2
Valine 5.3 5.8 6.2 6.3 4.9 4.9
Methionine 0.7 1.4 2 1.9 1.2 1.7
Cystine 0.0 0.0 0.0 0.0 0.0 0.0
Isoleucine 4.3 4.8 5.4 5.5 3.9 4
Leucine
Phenylalanine
Lysine
9.5
4.9
4.5
9.9
5.4
5.4
10.8
5.8
6.1
10.3
6
6.4
7.7
4.3
5
7.9
4.3
4.7
MOCM – Macadamia oil cake meal, L – Lime, W – Wood ash
The order of limiting amino acids for both the grower and layer experimental diets is
presented in Table 3.9. The results of limiting order of amino acids below, shows the
limiting amino acid at different inclusion level of MOCM for the grower and laying
experimental diets.
Determining the limiting order of amino acid was done by calculating the “desired
feed intake” (DFI) by the chickens, based on each of the amino acid in the feed. The
DFI is calculated as a ratio of nutrients requirements to nutrients content in the feed

39
i.e. the daily requirements and the contents of each amino acid in the test feed. The
amino acid giving the highest DFI will be the first limiting.
Table 3.9 The order of limiting amino acids (g/kg) on as fed, full fat basis for
both the grower and layer diets
Grower diets Layer diets
Composition
0%
MOCM
10%
MOCM
50%
MOCM
0%
MOCM
10%
MOCM
50%
MOCM
Arginine 75.1 60.8 42.3 94.7 59.9 57.4
Histidine 49.0 49.0 49.0 47.9 38.5 66.9
Isoleucine 34.5 61.4 88.4 83.4 58.3 110.3
Leucine 100.0 52.9 79.0 59.8 50.1 92.5
Lysine 49.0 64.0 87.1 96.0 60.5 100.0
Methionine 14.7 58.8 58.8 364.5 110.3 196.0
Phenylalanine 49.0 49.0 70.6 53.4 36.4 60.1
Threonine 78.0 78.0 112.4 134.1 95.6 141.4
Valine 49.0 49.0 66.7 59.0 46.6 77.0
MOCM – Macadamia oil cake meal
3.4 The results of the performance parameters for the growth experiment study
3.4.1 Feed Intake
Results of the weekly feed intake (FI) of the treatment diets over a 15 – week period
are presented in Table 3.10. Feed intake of the 50% MOCM diet with WA was
significantly higher (P < .0.05) than for the diet containing 0% MOCM with WA.
Over a 15 – week period, the 50% MOCM diet had a higher (P < 0.05) FI compared
to the other diets, but the differences were not significant in some of the weeks. Also,
the diet of 10% MOCM had a higher (P < 0.05) FI compared to the 0% MOCM diet,
even though the differences were significant only in some weeks.

40
Table 3.10 The effect of dietary level of macadamia oil cake meal (MOCM) and
calcium source on the weekly feed intake (g) per bird for the grower trial
Treatments
0% MOCM 10% MOCM 50% MOCM
L W L W L W (±SEM)
Weeks
1 23.1ab 19.5b 20.8b 23.7ab 23.8ab 25.7a (±1.6)
2 26.6 27.1 27.0 30.2 30.1 28.9 (±2.2)
3 42.4 42.6 44.2 43.5 44.3 44.6 (±2.4)
4 46.0a 40.5b 46.2a 40.5b 41.4a 40.2b (±1.9)
5 66.4 68.9 72.2 72.2 67.7 75.9 (±5.3)
Sub-Total 204.5 198.5 210.5 210.1 207.2 215.3 (±7.1)
6 65.3a 66.5a 68.8a 70.5a 72.2b 70.9a (±1.9)
7 66.5a 66.5a 73.1ab 76.9b 78.8b 75.9b (±2.5)
8 88.3a 84.2a 79.9ac 54.7b 51.3b 70.2c (±4.6)
9 81.3a 67.4b 86.7a 78.3ab 76.0ab 84.5a (±3.7)
10 93.2a 91.4a 92.0a 96.8a 97.4a 107.3b (±2.4)
Sub-Total 394.6abc 376.1bc 400.6a 377.2bc 375.6c 408.8a (±7.2)
11 115.9 107.1 112.1 114.3 112.3 121.1 (±11.9)
12 96.3a 101.4ab 95.3a 96.7a 106.9b 116.1c (±2.9)
13 103.4a 105.5ab 105.9ab 114.4ab 120.4b 118.9ab (±5.7)
14 97.4a 96.8a 95.8a 95.5a 116.9b 125.2b (±4.8)
15 120.6 114.1 114.8 123.6 127.7 147.9 (±11.7)
Sub-Total 533.5b 524.8b 524.0b 544.5b 584.2ab 629.2a (±20.8)
Total FI over 15 weeks
1132.5b (±58.42)
1099.4b (±34.29)
1135.1b (±54.29)
1131.7b (±24.89)
1167.1ab (±83.69)
1253.3a (±35.87)
abc Means with different superscripts, within rows, differed significantly (P < 0.05)
MOCM – Macadamia oil cake meal, L – Lime, W – Wood ash
The sub-total feed intake i.e. from week 1 to 5, for the first phase showed no (P>0.05)
difference between treatment diets. However, the second phase (week 6 to 10) showed
a difference (P<0.05) between treatment diets. Birds on diets 10% MOCM + lime and
50% MOCM + WA had a higher (P<0.05) FI compared to the other treatment diets,

41
except for the diet of 0% MOCM + lime. In the third phase (week 11 to 15), the diet
of 50% MOCM + WA had a higher FI (P<0.05) compared to the other treatment diets,
except the diet of 50% MOCM + lime. The results in Table 3.10 also show the total
feed intake over a period of 15 weeks. There was an overall difference (P<0.05)
between the diet of 50% MOCM + WA and the other treatment diets except the diet
of 50% MOCM + lime.
3.4.2 Body Weight
The results of weekly and different phases on body weights (BW) of the birds for
treatment diets 0% MOCM to 50% MOCM over a period of 15 weeks are presented in
Table 3.11. The diet of 50% MOCM had a lower (P<0.05) BW compared to the other
treatment diets throughout the experimental period, the exception was in weeks 14
and 15 as the diet of 50% MOCM plus WA had no difference (P>0.05) with the diets
of 0% and 10% MOCM.
The results of BW for the different phases are also presented in Table 3.11. The diet
on 50% MOCM had a lower (P<0.05) BW compared to the other treatment diets for
the first phase (week 1 to 5). Also, the same was observed in the second phase (week
6 to 10) as in the first phase. In the third phase (week 11 to 15), the diet of 50%
MOCM differed from (P<0.05) the diet of 10% MOCM. Lastly, there was an overall
difference (P<0.05) between the diet of 10% MOCM as compared to the diet of 50%
MOCM.

42
Table 3.11 The effect of dietary level of macadamia oil cake meal (MOCM) and
calcium source on the weekly body weight (g) per bird over the 15-week growth
trial
Treatments
0% MOCM 10% MOCM 50% MOCM
L W L W L W (±SEM)
Weeks
1 8.0 8.6 8.8 8.0 8.2 8.3 (±0.3)
2 15.9 17.4 16.9 16.8 15.8 15.9 (±0.6)
3 26.6bc 28.3ab 28.9a 28.3ab 24.5c 24.9c (±0.7)
4 38.9bc 44.5a 42.6ab 37.0c 31.5d 32.1d (±1.7)
5 60.4b 63.1ab 64.6a 62.9ab 52.5c 50.5c (±1.4)
Sub-Total 149.9a 161.9a 161.8a 153.1a 132.5b 131.7b (±3.8)
6 79.9a 81.9a 83.4a 84.6a 69.5b 65.3b (±1.8)
7 103.8a 107.4a 109.2a 111.1a 88.3b 86.0b (±2.6)
8 121.9b 123.7b 131.3a 132.1a 109.6c 103.4c (±2.3)
9 151.6a 150.4a 159.2a 155.9a 138.4b 136.0b (±3.3)
10 170.9a 171.3a 176.7a 177.7a 152.9b 153.4b (±3.6)
Sub-Total 628.1a 634.7a 659.9a 661.5a 558.7b 554.2b (±11.1)
11 196.9a 195.8a 205.2a 204.7a 181.2b 181.9b (±3.7)
12 214.4a 225.1a 225.3a 227.6a 203.3b 203.4b (±4.9)
13 240.3a 237.5a 248.8a 255.4a 224.9b 233.8b (±7.1)
14 265.7a 266.8a 264.7a 276.2a 252.9b 266.7a (±8.3)
15 277.7ab 277.1ab 282.4ab 296.9a 261.8b 279.6ab (±10.3)
Sub-Total 1194.9abc 1202.4abc 1226.5ab 1260.9ab 1124.1c 1165.3c (±28.3)
Total BW/15 weeks
1972.9abc (±59.86)
1998.9ab (±62.65)
2048.2a (±62.72)
2075.5a (±92.24)
1815.3c (±79.02)
1841.2bc (±115.64)
abc Means with different superscripts, within rows, differed significantly (P < 0.05)
MOCM – Macadamia oil cake meal, L – Lime, W – Wood ash
The effect of dietary level of MOCM and Ca source using regression analysis of the
growth curve equation fitted for each treatment diet is presented in Table 3.12. The

43
objective was to determine the effect of level of inclusion of MOCM, lime and WA
for all the treatment diets. However, there was no (P>0.05) difference between
treatment diets.
Table 3.12 The effect of dietary level of macadamia oil cake meal (MOCM) and
calcium source using the regression analysis growth curve equation fitted for
each treatment diets
MOCM Ca Sources a b Correlation Index
0% Lime 351.2 -0.0068 0.9994
10% Lime 342.8 -0.0073 0.9990
50% Lime 338.2 -0.0078 0.9996
0% WA 376.6 -0.0067 0.9993
10% WA 366.7 -0.0057 0.9992
50% WA 470.0 -0.0041 0.9990
Means between treatments are not significantly different (P > 0.05)
MOCM – Macadamia-oil cake meal, Ca – Calcium, a – Max or Min values, b – slope, y – weight
Growth curve equation (using regression analysis):
y = a (1-eb^2)
y = weight (g)
a = maximum and minimum values
b= slope
The results of the BW for the birds on the 0% MOCM to 50% MOCM diets are
presented in Figure 3.2 to indicate the trends of growth through the growth curve.
Graphically, the BW for all the treatment diets shows a similar growth trend, with
slight, but not significant (P>0.05) differences throughout the trial period.

44
Figure 3.2 The effect of macadamia oil cake meal (MOCM) and calcium source
on body weight for the grower trial over a period of 15 weeks
3.4.3 Body weight gain
The results of the body weight gain (BWG) for the birds on the 0% MOCM to 50%
MOCM diets over a period of 15 – weeks are presented in Table 3.13. The BWG of
the birds on the 50% MOCM diet was lower (P<0.05) than that of the other treatment
diets up to eight weeks of age. From 9 to 14 weeks of age, the chickens in 50%
MOCM diets experienced a higher (P<0.05) BWG than those in the other treatments.
In week 15 the 0% MOCM diet had a lower (P<0.05) BWG than the other treatment
diets.
The birds fed on diet of 10% MOCM + lime in the first phase had a highest (P<0.05)
subtotal BWG compared to other treatment groups. In the 2nd phase, birds fed on diet
of 50% MOCM had a lowest (P<0.05) BWG compared to the other treatment groups,
however, did not (P>0.05) differ from the 10% MOCM + WA diet. There were no
(P>0.05) difference between treatment diets for the overall or total BWG for the 15
week period.
0
50
100
150
200
250
300
0 2 4 6 8 10 12 14 16 Time (weeks) Lime MOCM=0% WoodAsh MOCM=0%
Lime MOCM=10% WoodAsh MOCM=10% Lime MOCM=50% WoodAsh MOCM=50%
W
eigh
t (g
/kg)

45
Table 3.13 The effect of dietary level of macadamia oil cake meal (MOCM) and
calcium source on weekly body weight gain (g) per bird during the grower trial
Treatments
0% MOCM M 10% MOCM 50% MOCM
L W L W L W (±SEM)
Weeks
2 7.9 8.8 8.0 8.8 7.6 7.6 (±0.5)
3 10.3b 10.9ab 11.4a 11.1ab 8.7c 8.9c (±0.4)
4 12.3b 16.2a 13.6ab 9.3c 7.0c 7.3c (±1.3)
5 21.5ac 18.6ab 22.9ab 25.9b 20.9ac 18.3c (±1.6)
Sub-Total 51.9b 54.5ab 56.1a 55.2ab 44.3c 42.1c (±1.3)
6 19.8ab 18.8ab 18.9ab 20.7a 17.0bc 14.9c (±1.1)
7 23.9ab 25.6ab 25.8a 25.8a 18.8b 20.7b (±1.7)
8 18.0b 16.2b 22.1a 21.9a 21.3a 17.4b (±2.3)
9 29.7ab 26.8ab 27.9ab 24.2b 28.8ab 32.6a (±2.3)
10 19.4a 20.8a 17.5b 21.7a 14.5b 17.4b (±1.2)
Sub-Total 110.6a 108.2ab 112.1a 114.2a 100.4b 102.9b (±2.7)
11 25.9ab 24.6b 28.6a 27.0ab 24.9ab 28.4ab (±1.4)
12 15.0a 25.5b 20.1ab 22.9ab 21.5ab 21.6ab (±2.8)
13 22.4ab 16.7a 19.8a 24.9ab 22.3ab 30.4b (±3.4)
14 21.8ab 16.9a 19.9ab 23.9ab 27.9ab 32.9b (±4.7)
15 5.3c 4.7c 11.9ab 7.9b 8.9b 12.9a (±1.4)
Sub-Total 90.5b 88.3b 100.4b 106.7ab 108.9ab 126.2a (±7.1)
Total BWG over 15 weeks
253.1 (±20.82)
250.9 (±17.99)
268.6 (±13.25)
276.1 (±12.00)
253.6 (±18.88)
271.3 (±13.80)
abc Means with different superscripts, within rows, differed significantly (P < 0.05)
MOCM – Macadamia oil cake meal, L – Lime, W – Wood ash
3.4.4 Feed conversion efficiency
The results of weekly feed conversion efficiency (FCE) as measured in (kg gain/kg
feed) for the birds on the 0% MOCM to 50% MOCM diets over a 15 – week period
are presented in Table 3.14. Birds on the 50% MOCM diet had a lower (P < 0.05)
FCE than those on the other treatment diets up to the 11th week. The 0% MOCM and

46
10% MOCM + WA treatments also resulted in lower (P < 0.05) FCE compared to the
diet of 10% and 50% MOCM with lime and WA, respectively on the 15th week.
Table 3.14 The effect of dietary level of macadamia oil cake meal (MOCM) and
calcium source on weekly feed conversion efficiency (g gain/ g feed) per bird for
the grower trial over a period of 15 – weeks
Treatments
0% MOCM 10% MOCM 50% MOCM
L W L W L W (±SEM)
Weeks
2 0.30 0.32 0.30 0.30 0.25 0.26 (±0.02)
3 0.24ab 0.26a 0.26a 0.25a 0.19c 0.20bc (±0.01)
4 0.26b 0.40a 0.29b 0.23bc 0.16c 0.18c (±0.03)
5 0.32 0.27 0.32 0.36 0.35 0.24 (±0.04)
Sub-Total 1.14a 1.26a 1.18a 1.15a 0.97b 0.89b (±0.05)
6 0.30a 0.28a 0.27ab 0.29a 0.23bc 0.21c (±0.01)
7 0.36a 0.38a 0.35a 0.33a 0.24b 0.27b (±0.02)
8 0.21b 0.19b 0.27b 0.40a 0.42a 0.24b (±0.05)
9 0.36 0.39 0.32 0.32 0.38 0.38 (±0.03)
10 0.20ab 0.22a 0.18bc 0.22a 0.15d 0.16dc (±0.01)
Sub-Total 1.45b 1.48b 1.42b 1.59a 1.43b 1.28c (±0.04)
11 0.22 0.22 0.36 0.23 0.22 0.23 (±0.06)
12 0.15b 0.25a 0.21ab 0.23a 0.20ab 0.18ab (±0.02)
13 0.21ab 0.16b 0.18ab 0.22ab 0.18ab 0.25a (±0.03)
14 0.21 0.16 0.20 0.25 0.24 0.26 (±0.04)
15 0.04c 0.04c 0.10ab 0.06bc 0.07abc 0.08ab (±0.01)
Sub-Total 0.86ab 0.85b 1.07a 1.01ab 0.92ab 1.03ab (±0.08)
Total FCE over 15 weeks
3.45ab (±0.14)
3.59ab (±0.17)
3.67a (±0.31)
3.75a (±0.17)
3.32ab (±0.22)
3.20b (±0.14)
abcd Means with different superscripts, within rows, differed significantly (P < 0.05)
MOCM – Macadamia oil cake meal, L – Lime, W – Wood ash, SD – Standard deviation

47
The diet of 50% MOCM had a lower (P<0.05) difference in FCE as compared to the
other treatment diets in first phase (week 1 to 5). In the 2nd phase, the diet of 10%
MOCM + WA had a higher (P<0.05) difference in FCE compared to other diets,
while the diet of 50% MOCM + WA had a lower (P<0.05) FCE as compared to the
other treatment diets. The diet of 0% MOCM + WA in the 3rd phase had a (P<0.05)
different FCE when compared to the diet of 10% MOCM + lime. The overall results
showed a (P<0.05) difference FCE between the diet of 10% MOCM and 50% MOCM
+ WA diet.
3.5 The carcass parameters
The results of the carcass mass, muscle, fat and bone as percentage of carcass weight
of the treatment diets from 0% MOCM to 50% MOCM are presented in Table 3.15.
There was no (P > 0.05) difference in carcass weight between the treatment diets.
Muscle as percent of carcass mass in the treatment, 50% MOCM plus lime, was
higher (P < 0.05) than that in the 10% MOCM treatment diet. There was no (P > 0.05)
difference in muscle as percent carcass mass between the diets of 0%, 10% and 50%
MOCM plus WA.
The fat as percentage of carcass mass differed significantly between treatments. The
diet of 10% MOCM with lime had a higher (P < 0.05) fat content as percentage of
carcass mass as compared to the other treatment diets. There was no (P > 0.05)
difference in fat percentage between the diets of 10% MOCM plus WA with the other
treatment diets.
There was no (P > 0.05) difference in bone as percentage of carcass weight between
treatments.
The result of the bone breaking strength (BBS) of the right and left tibia of the
chickens are presented in Table 3.16. There was no (P > 0.05) difference in BBS
between the treatments. The combined results of the means for the two sources of Ca
on BBS are presented in Table 3.17.

48
The results of tibia weight, volume and density for both the right and left tibia of the
grower experiment are presented in Table 3.18. There was no (P > 0.05) difference in
tibia weight, volume and density between treatments for both the right and the left
tibia.
The results of the diameter of the right and the left tibia are presented in Table 3.22.
There was no (P > 0.05) difference in diameter between all treatments for both the
right and the left tibia. The combined results of the means for the two sources of Ca
on BBS are presented in Table 3.19.

49
Table 3.15 The effect of dietary level of macadamia oil cake meal (MOCM) and calcium source on carcass mass and muscle, fat and
bone as percent carcass weight at 8 – weeks of age
Carcass mass (g) Muscle (%) Fat (%) Bone (%)
Mean (±SEM) Mean (±SEM) Mean (±SEM) Mean (±SEM)
Treatment
0% MOCM (L) 817.3 (±46.5) 77.1ab (±0.42) 1.9b (±0.97) 19.5 (±1.27)
0% MOCM (W) 865.6 (±75.6) 77.8ab (±1.76) 2.2b (±1.02) 19.1 (±2.32)
10% MOCM (L) 869.5 (±69.7) 74.8b (±1.81) 4.8a (±0.63) 18.9 (±1.93)
10% MOCM (W) 852.2 (±24.4) 75.4b (±1.22) 3.3ab (±1.48) 19.3 (±0.84)
50% MOCM (L) 805.9 (±46.9) 79.6a (±2.11) 1.4b (±0.31) 17.9 (±2.14)
50% MOCM (W) 784.7 (±39.7) 75.7ab (±2.45) 2.4b (±1.04) 19.7 (±0.86) ab Means within columns and within parameters with different superscripts, differed significantly (P < 0.05)
MOCM – Macadamia oil cake meal, L – Lime, W – Wood ash

50
Table 3.16 The effect of dietary level of macadamia oil cake meal (MOCM) and
calcium source on bone breaking strength (BBS), Newton (N) of the right and left
tibia as interpreted separately at the age of 8 – weeks old
Right Tibia Left Tibia
Mean (±SEM) Mean (±SEM)
Treatments
0% MOCM (L) -235.0 (±78.9) -267.3 (±101.9)
0% MOCM (W) -234.4 (±67.9) -202.6 (±41.0)
10% MOCM (L) -236.6 (±37.1) -220.9 (±64.3)
10% MOCM (W) -240.5 (±52.6) -208.8 (±7.0)
50% MOCM (L) -220.5 (±54.2) -221.7 (±52.7)
50% MOCM (W) -169.2 (±24.6) -175.7 (±15.8)
Means between treatments are not significantly different (P > 0.05)
MOCM – Macadamia oil cake meal, L – Lime, W – Wood ash
Table 3.17 The effect of dietary level of macadamia oil cake meal (MOCM) and
calcium source on combined means of the two sources of calcium for the bone
breaking strength, Newton (N) of the right and left tibia as the age of 8 – weeks
old
MOCM Level Ca sources
0% 10% 50% Lime WA
Mean -234.8 -226.7 -196.8 -233.8 -205.2
(±SEM) (±69.0) (±36.3) (±43.8) (±60.4) (±39.8)
Means between treatments are not significantly different (P > 0.05)
MOCM – Macadamia oil cake meal, L – Lime, W – Wood ash

51
Table 3.18 The effect of dietary level of macadamia oil cake meal (MOCM) and calcium source on both the right and left tibia weight
(g), volume (l) and density (g/l) on a wet bone basis of the birds at 8 weeks of age
Weight (g) Volume (L) Density (g/L)
Right Tibia Left Tibia Right Tibia Left Tibia Right Tibia Left Tibia
Mean (±SEM) Mean (±SEM) Mean (±SEM) Mean (±SEM) Mean (±SEM) Mean (±SEM)
Treatments
0% MOCM (L) 5.7 (±0.66) 5.8 (±0.61) 4.3 (±0.80) 4.3 (±0.75) 1.4 (±0.14) 1.4 (±0.18)
0% MOCM (W) 5.8 (±0.49) 5.8 (±0.59) 4.7 (±0.43) 4.6 (±0.66) 1.2 (±0.02) 1.3 (±0.07)
10% MOCM (L) 5.1 (±0.13) 5.4 (±0.27) 4.2 (±0.24) 4.4 (±0.13) 1.2 (±0.05) 1.2 (±0.07)
10% MOCM (W) 5.5 (±0.72) 5.7 (±0.77) 4.4 (±0.75) 4.6 (±0.66) 1.3 (±0.09) 1.2 (±0.03)
10% MOCM (L) 5.8 (±0.77) 5.7 (±0.69) 4.6 (±0.78) 4.6 (±0.59) 1.3 (±0.08) 1.3 (±0.02)
50% MOCM (W) 5.3 (±0.59) 5.1 (±0.60) 4.3 (±0.47) 4.4 (±0.55) 1.2 (±0.06) 1.2 (±0.04)
Differences between means within columns and parameters are not significant (P > 0.05)
MOCM – Macadamia oil cake meal, L – Lime, W – Wood ash

52
Table 3.19 The combined effect of dietary level of macadamia oil cake meal
(MOCM) and calcium source on tibia weight (g), volume (l) and density (g/l) of
both right and left tibia bones on a wet bone basis of the birds at 8 weeks of age
Weight Volume Density Diameter major Diameter minor
Mean (±SEM) Mean (±SEM) Mean (±SEM) Mean (±SEM) Mean (±SEM)
MOCM 0% 5.8 (±0.5) 4.5 (±0.6) 1.3 (±0.1) 0.6 (±0.02) 0.3 (±0.03)
10% 5.4 (±05) 4.4 (±0.5) 1.2 (±0.04) 0.6 (±0.05) 0.3 (±0.06)
50% 5.5 (±0.7) 4.5 (±0.5) 1.2 (±0.05) 0.6 (±0.05) 0.3 (±0.06)
Calcium source Lime 5.6 (±0.6) 4.4 (±0.5) 1.3 (±0.1) 0.6 (±0.03) 0.3 (±0.05)
WA 5.5 (±0.6) 4.5 (±0.5) 1.2 (±0.04) 0.6 (±0.04) 0.3 (±0.05)
Differences between means within columns and parameters are not significant (P >
0.05)
L – Lime, W – Wood ash

53
Table 3.20 The effect of dietary level of macadamia oil cake meal (MOCM) and
calcium source on the diameters (mm) of the right and left tibia of the birds at 8
weeks of age
Right Tibia Left Tibia
Major Minor Major Minor
Mean (±SEM) Mean (±SEM) Mean (±SEM) Mean (±SEM)
Treatments
0%MOCM (L) 0.62 (±0.04) 0.27 (±0.04) 0.60 (±0.02) 0.29 (±0.07)
0%MOCM (W) 0.65 (±0.02) 0.28 (±0.03) 0.63 (±0.02) 0.30 (±0.02)
10%MOCM (L) 0.65 (±0.08) 0.27 (±0.04) 0.61 (±0.03) 0.27 (±0.05)
10%MOCM (W) 0.61 (±0.03) 0.28 (±0.07) 0.63 (±0.01) 0.28 (±0.11)
50%MOCM (L) 0.63 (±0.04) 0.34 (±0.12) 0.62 (±0.06) 0.32 (±0.04)
50%MOCM(W) 0.58 (±0.06) 0.25 (±0.07) 0.60 (±0.04) 0.27 (±0.04)
Means between treatments are not significantly different (P > 0.05)
L – Lime, W – Wood ash
3.6 Mineral analysis of the tibia bones
The results of the mean (±SEM) of the elemental composition of analysed tibia bones
on ash basis for the treatment diets of 0% MOCM to 50% MOCM are presented in
Tables 3.21. The tibia bones in the 0% MOCM treatment had a lower (P < 0.05) DM
content compared to the other treatment diets. The bones in the 50% MOCM
treatment also had a lower (P < 0.05) percentage of ash compared to the other
treatment diets. The 50% MOCM diet again, was lower (P < 0.05) in Ca and P
compared to the other treatment diets.

54
Table 3.21 The effect of dietary level of macadamia oil cake meal (MOCM) and calcium source on the means (g/kg) on the elemental
composition of tibia bones (dry, fat-free basis) and as percentage of bone ash
Dry matter
(g/kg)
Ash (g/kg) Calcium (g/kg) bone ash Phosphorus (g/kg) bone ash Magnesium (g/kg) bone Ash
Mean (±SEM) Mean (±SEM) Mean (±SEM) % in ash* Mean (±SEM) % in ash* Mean (±SEM) % in ash*
Treatments
0% MOCM (L) 91.8dc (±0.5) 58.0a (±0.5) 20.6ab (±0.3) 35.5 10.2a (±0.2) 17.6 0.36 (±0.01) 0.62
0% MOCM (W) 91.4d (±0.2) 57.7a (±0.3) 20.1b (±0.1) 34.8 10.4a (±0.1) 18.0 0.38 (±0.01) 0.66
10% MOCM (L) 92.5ab (±0.6) 58.9a (±1.3) 20.9a (±0.4) 35.5 10.6a (±0.3) 17.9 0.36 (±0.02) 0.61
10%MOCM (W) 92.6ab (±0.4) 58.1a (±1.1) 20.1b (±0.6) 34.6 10.3a (±0.5) 17.7 0.38 (±0.01) 0.65
50% MOCM (L) 92.9a (±0.3) 58.3a (±0.7) 19.5c (±0.2) 33.4 9.3b (±0.1) 16.0 0.37 (±0.02) 0.63
50%MOCM (W) 92.2bc (±0.4) 55.7b (±1.7) 19.4c (±0.2) 34.8 9.3b (±0.1) 16.7 0.37 (±0.02) 0.66 abcdMeans within columns with different superscripts are significantly different (P < 0.05)
L – Lime, W – Wood ash
* Calculated from means

55
Table 3.22 The effect of dietary level of macadamia oil cake meal (MOCM) and
calcium source on the combined means (g/kg) on the elemental composition of
tibia bones (dry, fat-free basis)
Dry Matter (g/kg)
Ash
(g/kg)
Calcium
(g/kg)
Phosphorus
(g/kg)
Magnesium
(g/kg)
Mean (±SEM) Mean (±SEM) Mean (±SEM) Mean (±SEM) Mean (±SEM)
MOCM Level
0% 91.6b (±0.4) 57.8ab (±0.4) 20.4a (±0.3) 10.3a (±0.2) 0.4 (±0.01)
10% 92.6a (±0.5) 58.6a (±1.2) 20.5a (±0.6) 10.4a (±0.4) 0.4 (±0.01)
50% 92.6a (±0.5) 56.9b (±1.8) 19.5b (±0.2) 9.3b (±0.1) 0.4 (±0.01)
Calcium source Lime 92.4 (±0.7) 58.4a (±0.9) 20.3a (±0.6) 10.0 (±0.6) 0.4 (±0.01)
WA 92.1 (±0.6) 57.2b (±1.5) 19.9b (±0.5) 10.0 (±0.6) 0.4 (±0.01) ab Means within columns and parameters within MOCM levels and calcium sources with different superscripts are significantly different (P<0.05)
L – Lime, W – Wood ash
The elemental composition of the tibia bones as affected by the main treatments,
MOCM level and Ca sources are presented in Table 3.22. The effects of MOCM
levels and Ca sources were statistically analysed and interpreted separately. The tibia
bones of the birds in the 50% MOCM treatment was lower (P < 0.05) in ash, Ca and P
concentrations than those in the other MOCM treatments. In addition, when using
WA as Ca source in the diet, it resulted in a lower Ca and ash content in the tibia
bones compared to the use of limestone.

56
Table 3.23 The effect of dietary level of macadamia oil cake meal (MOCM) and calcium source on feed intake (FI), egg weight (EW), egg
production (EP), feed conversion ratio (FCR) and eggshell strength (ESS) mean of hens during the 4-week layer experiment
Parameters
FI (g/day) EW (g/day) EP (%) FCR (g feed/g egg) ESS (N)
Mean (±SEM) Mean (±SEM) Mean (±SEM) Mean (±SEM) Mean (SEM)
Treatments 0% MOCM (L) 90.2b (±8.99) 42.1 (±1.28) 10.7 (±1.76) 5.4 (±1.15) -32.4 (±5.80)
0% MOCM (W) 84.6b (±8.64) 39.2 (±0.86) 11.0 (±4.63) 5.7 (±2.02) -34.5 (±3.88)
10% MOCM (L) 88.7b (±8.73) 41.2 (±2.11) 13.8 (±7.65) 5.3 (±2.37) -34.5 (±3.37)
10% MOCM (W) 81.9b (±8.42) 39.0 (±1.16) 14.4 (±1.34) 3.8 (±0.34) -27.1 (±4.26)
50% MOCM (L) 115.4 a (±4.03) 37.2 (±7.91) 8.4 (±7.18) 5.1 (±0.32) -26.3 (±7.01)
50% MOCM (W) 88.5b (±15.96) 40.6 (±10.02) 4.0 (±4.10) 6.2 (±2.03) -25.9 (±7.17) abMeans within columns within parameter with different superscript differed significantly (P<0.05)
L – Lime, W – Wood ash, N – Newton, EP (%) – number of eggs produced over a 4 week period per hen

57
3.7 The results of parameters measured during the layer study
The results of daily feed intake, egg weight, egg production, feed conversion ratio and
eggshell breaking strength per chicken over a four week period for the layer
experiment are presented in Table 3.23. The FI ranged from 81.9 g/day in the 10%
MOCM plus WA treatment to 115.4 g/day in diet of 50% MOCM plus lime. The diet
of 50% MOCM plus lime had a higher (P < 0.05) FI than the other treatment diets.
There was no (P > 0.05) difference in FI between the other treatment diets. The egg
weight (EW) ranged from 37.3 g/day in diet of 50% MOCM plus lime to 42.1 in diet
of 0% MOCM plus lime. There was no (P > 0.05) difference in EW between any of
the treatment diets. The egg production (EP) ranged from 4.0% in diet of 50%
MOCM plus WA to 14.4% in diet of 10% MOCM plus WA. There was no (P > 0.05)
difference in EP between any of the treatment diets. The diet of 10% MOCM plus
WA had a high EP, but without any significant difference compared to the other
treatment diets.
The FCR ranged from 3.8 in diet of 10% MOCM plus WA to 6.2 in diet of 50%
MOCM plus WA. There was no (P > 0.05) difference in FCR between any of the
treatment diets. The eggshell strength (ESS) ranged from –34.6 N in diet of 10%
MOCM plus lime to –25.9 N in diet of 50% MOCM plus WA. However, there was no
(P > 0.05) difference in ESS between the treatment diets.

58
Figure 3.3. The effect of macadamia oil cake meal and wood ash on body weight
of laying hens
The BW and BWG for the layer trial are presented in Figure 3.3 and 3.4, respectively.
The weight is presented in (kg) as it represents the total nine hens per treatment in the
layer trial. Graphically, the results in Fig. 3.3 show a fluctuation or drop in BW for
treatment diets of 0% MOCM + WA, 10% MOCM + lime in week 3, and also the
same for the diet of 50% MOCM in the same week. Results in Fig.3.4 concur with
the observation found in Fig. 3.3 as it clearly indicates loss in weight by hens in diets
of 0% MOCM + WA, 10% MOCM + lime and 50% MOCM, especially in the third
week.
0.0 1.0 2.0 3.0 4.0 5.0 6.0 7.0 8.0
1 2 3 4 5
Weeks
Bod
y w
eigh
t (k
g)
0% MOCM + Lime
0% MOCM + WA
10% MOCM +Lime
10% MOCM + WA
50% MOCM + Lime
50% MOCM + WA

59
Figure 3.4. The effect of macadamia oil cake meal and wood ash on body weight
gain of laying hens
-1.5
-1.0
-0.5
0.0
0.5
1.0
1 2 3 4
Weeks
BW
G
(kg)
0% MOCM + Lime
0% MOCM + WA
10% MOCM + Lime
10% MOCM + WA
50% MOCM + Lime
50% MOCM + WA

60
CHAPTER 4 – DISCUSSION
There is dearth of knowledge on the suitability and the appropriate levels of inclusion,
or substitution value, of MOCM as an ingredient in poultry diets. The efficient
utilization of agro-industrial by-products among others, MOCM, is of importance in
rural small-scale poultry production. Many authors and researchers have applauded
the need for research on the use of cheap by- and waste products as poultry feed. In an
effort to reduce the cost of poultry production, nutritionists have to utilize by- and
waste products that are not directly utilizable by humans (Ani and Okorie, 2005).
There are many potential oil crops in addition to soybean, each with strengths and
weaknesses that can be used as protein sources in animal nutrition. Local adaptation
to growing conditions and local availability provide distinct advantages for feed
production in many developing countries. A continuous supply of protein meal of
known quality can be made available, as is the case with palm kernel cake, the by-
products of oil palm production, e.g. in Malaysia and Indonesia (FAO, 2002).
A major consideration associated with the feeding of by-products is the variation in
quality after processing of the “parent” product. This inherent variation is considered
to resemble the nutrient composition of the “parent” product due to processing
methods employed to convert the product to a usable commercial product (Parsons et
al., 1997).
In the present study MOCM effectively replaced conventional feed ingredients in the
diets of chickens, though it had a poor nutrient composition, especially a low protein
and energy and high crude fibre content. However, this by-product has been found to
have suitable concentrations of nutrients, as reported by Skenjana et al. (2002); and
this can make the by-product to be a pivotal ingredient in diets for poultry.
The chickens used for the present study were the New Hampshire, a breed mostly kept
in rural areas and is therefore suitable for scavenging environments, and they are
characterised by relatively slow growth. Minh (2005) reported that the indigenous
poultry breeds have low productivity and are not suitable for intensive systems.

61
However, these breeds are very suitable for low-input scavenging and semi-
scavenging system. In contrast, the commercial breeds generally have superior
characteristics compared to indigenous breeds, such as higher body weight gains and
productivity (Vang, 2003).
4.1 Chemical composition
Little has been reported in the literature on the chemical composition and potential
nutritive value of MOCM, except a report by Skenjana et al. (2002). However, like
many by-products, variability of nutrient content is of concern for those who
contemplate using this product. Because MOCM has shown to vary considerably in
nutrient content, samples should be assayed continuously to ensure that high quality
MOCM is used in diets for animal feeding. The CP content of MOCM used in this
study was 140 g/kg DM, which is low compared to the mean value of 254 g/kg DM
reported by Skenjana et al. (2002). The MOCM contained a high level of CF (385
g/kg DM) and a relatively low available energy level which allows the by-product to
be classified as an “intermediate product” in poultry feeding (Van der Merwe &
Smith, 1977). The resulting fibre content was elevated in the by-product, while the
recommended is from 3-5% of crude fibre in complete diets of growing chickens
(NRC, 1994). However, the NDF concentration of the product used in the present
study is similar with that reported by Skenjana et al. (2002). The NDF content of
MOCM was 419 g/kg DM, indicating a fibrous product. Skenjana et al. (2002) could
classify the MOCM they analysed as a protein source because it contained more than
20% protein. The by-product in the present study cannot be classified as a protein
source due to its low CP (140 g/kg DM) and had relatively high fibre content (385
g/kg DM). Although the by-product (MOCM) contains high levels of fibre and fat and
a low level of protein, one can classify the product as a possible energy source or
filler. It is evident from the computer formulated experimental diets (Tables 2.3 to
2.5) that wheat bran, which can also be classified as an intermediate product, was
largely replaced by MOCM.
Although it is difficult to explain the reason for the differences between the samples
of MOCM, the oil cake used in the present study could have been derived from poor

62
quality macadamia nuts or was of inferior quality due to the processing technique
applied. However, a more likely reason could be that the macadamia seeds or the by-
product might have been subjected to conditions such as exposure to rain and poor
weather conditions that resulted in the leaching of nutrients from the product.
Skenjana et al. (2002) also evaluated a macadamia product that contained a mixture of
nuts and hulls and the product had a low nutritive value, though the batch tested in the
present study did not contain visible hull particles.
Feed ingredients should, therefore, be selected on the basis of availability, price and
the quality of the nutrients they contain. Certain ingredients invariably constitute the
greatest part of diets, in terms of amount and cost (NRC, 1994).
Arosemena et al. (1995) reported on the use of selected by-product feedstuffs (BFP)
where variability in chemical composition of the BFP influenced the composition of
the total diet. However, the impact was small compared with the contribution of the
other concentrates in the total mixture. They concluded that the magnitude of the
effect will depend on the contribution of the by-products to the total ration and the
nutrients of interest.
Irrespective of the low CP and high fibre content of the present product, this product
could become cheaply available to farmers in rural areas. Depending on the
processing technique applied, the MOCM by-product can be classified as protein,
energy source or intermediate product.
The mean Ca and P concentrations of the MOCM analysed by the Skenjana et al.
(2002) were 3.44 and 3.88 g/kg DM, respectively. This is higher than the 1.60 and
2.30 g/kg DM, respectively, found in MOCM of the present study. Furthermore, it is
likely that part of the P could be in the form of phytate. It is well known that the
majority of P in foodstuffs of plant origin such as maize and soyabean meal is in the
form of phytate, which has a low availability to monogastric animals, such as poultry
and pigs (Simons et al. 1990; NRC, 1994; Summers, 1997; Bedford, 2000; Lesson
and Summers, 2001). Therefore, phytate is referred to as an anti-nutrient (Spring,
2008). Phytic acid does not only reduce P availability in poultry, but also the
availability of other nutrients in poultry diets (Ravindra et al. 1999a,b; Ravindra et al.,

63
2001; Sebastian et al., 1996a,b; Punna et al. 2001; Lan et al. 2002; Shirley and
Edwards, 2003). Phytic acid acts as a chelator of Ca, Mg, Fe, and Zn and may inhibit
the absorption of these minerals. In a rural feeding situation it would not be feasible to
test a feed for anti-nutrients. However, poor animal performance would indicate the
presence of such factors.
A major problem in the use of MOCM as an animal feed in the rural situation is its
high and variable oil content. The product and feed mixtures containing MOCM
would be susceptibility to oxidation and the consequent rancidity. This would create
problems for rural farmers especially in hot weather conditions since they probably do
not have proper storage facilities.
The MOCM might contain other anti-nutritional factors (ANF) and/or non-starch
polysaccharides (NSP) causing a general inhibition of digestion and absorption in
monogastric animals as they don’t have the necessary enzymes to digest these
components. Anti-nutritional factors are substances which either by themselves or
through their metabolic products, interfere with the utilisation of dietary nutrients, and
cause depressions in growth and feed efficiency and affect animal health (Huisman &
Tolman, 1992).
The non-fibre carbohydrates (NFC) or non-starch polysaccharides (NSP) include any
of the carbohydrates not found in neutral detergent fibre (NDF). Therefore, NFC is the
water soluble and non-fibrous carbohydrates (starch, pectin and sugars). The
carbohydrates soluble in the neutral detergent comprise a very heterogeneous group,
both compositionally and nutritionally. Therefore, because it is calculated by
difference, errors from each of the component analyses accumulate in NFC. Rumen
microbes and animals utilizes the different fractions of protein, non-fibre
carbohydrates and structural (fibre) carbohydrate fractions differently and their
estimation in the feedstuffs elucidates more information about their availability
(Sniffen et al., 1992).
The presence of NSP in MOCM might have lead to the poor performance observed in
the birds that were fed 100% MOCM, which resulted in retarded growth and weight
gain. The NFC concentration of MOCM was in the range of 167.9 g/kg. However,

64
one can conclude that there were probably not high concentrations of NSP because the
birds fed 50% MOCM diet performed fairly well.
Non-starch polysaccharides cause an increase in viscosity of digesta and in intestinal
tension, which impair diffusion of nutrients for digestion and absorption due to sticky
droppings and, consequently, result in decreased energy value of feedstuffs and
worsened feed conversion (van Barneveld et al., 1995; Grieshop et al., 2001)
Nitrogen-free extract (NFE) is a group of substance consisting of starches, sugars,
dextroses, pentosans, organic acid, phytin, lignin and other substances. The
percentage of NFE is found by difference and not by actual analysis. According to
Ewing (1951), the cereal grains are particularly high in NFE, for example, maize,
wheat, grain sorghum etc. have about 700 g/kg. The NFE content of MOCM was in
the range of 201.9 g/kg DM, and this result is in agreement with the report by Janssen
and Carré (1985) who stated that the correlation between crude fibre and starch with
increasing fibre content resulted in reduced percentage of starch in NFE. In addition,
Janssen and Carré (1985) also stated that, the positive contribution of crude fibre (in
wheat by-products) to the feeding value is small since its digestibility is generally
very low. However, the negative influence is substantial as there is a strong negative
relationship with the digestibility of protein, fat and NFE. The last relationship is
probably due to the high negative correlation between crude fibre and starch as with
increasing fibre content, the percentage of starch in NFE diminishes.
4.1.1 Limiting order and amino acid profile
The amino acid concentration of the MOCM analysed in the present study was
compared with the standard of nutrient requirement for chickens and the concentration
was not high enough to meet the amino acid needs of poultry. The data shown in
Table 4.1 indicate the percentage of individual amino acid in comparison with the
requirements of broilers and layers, obtained from NRC (1994).
The results of the limiting order of amino acids are presented in Table 3.9. For the
grower diets, 0% MOCM had leucine as the first limiting amino acids with threonine
and arginine as being second and third limiting, respectively. The 10% MOCM diet

65
had threonine as the first limiting and with lysine being the second limiting, arginine
and isoleucine were third limiting as they had the same values (co-limiting). The diet
with 50% MOCM included, had threonine as the first limiting and isoleucine, lysine
and leucine as being second, third and fourth limiting amino acid, respectively.
For the layer diets, 0% MOCM had methionine as the first limiting amino acid,
threonine, lysine and arginine being second, third and fourth limiting, respectively.
The diet of 10% MOCM had methionine as the first limiting amino acid, threonine,
lysine and arginine being second, third and fourth limiting, respectively. The diet of
50% MOCM had methionine as the first limiting amino acid, threonine, isoleucine
and lysine being second, third and fourth limiting, respectively.
The sequence in which the amino acids of a protein become limiting for growth and
production can be calculated from knowledge of the amino acid requirements of the
animal and the amino acid composition of the dietary protein (Harper, 1959). By
comparing requirements and the actual amino acids present in feed, the order of
“limiting amino acids” can be estimated (Toride, 2000).
For chicks the ‘first limiting’ amino acid is most commonly methionine, although
lysine and perhaps arginine may also be deficient (McDonald et al. 2002). Therefore,
amino acid supplementation should focus on lysine and methionine concentration,
especially in low protein diets. However, scavenging birds can also get amino acids
from the environment, and these vary according to season and were significantly
higher for the rainy season compared to the dry season (Minh, 2005).
The findings of the current study on different treatment diets were relatively in
agreement with the findings by McDonald et al. (2002) as they reported relatively the
same limiting order of AA in poultry diets. The treatment diets within which the
grower experiment had threonine as the ‘first limiting’, arginine and lysine being the
second; isoleucine and leucine were also deficient. For the treatment diets in the layer
experiment, methionine was mostly the ‘first limiting’ with threonine being the
second limiting. On the other hand, lysine, arginine and isoleucine were less deficient
than the other amino acids.

66
The diet of 100% MOCM would definitely not be sufficient to meet the requirements
of AA by chickens, unless supplementation is provided (NRC, 1994). Baker and Han
(1994) reported that the amino acid requirements could not apply to all birds under all
dietary, gender and body compositional circumstances. These researchers supported
an idea of expressing the amino acid requirements as ideal ratios to lysine and similar
expression was done for MOCM as it is indicated in Table 3.2. The amino acid profile
needed for maintenance has been shown to be different from the profile needed to
produce optimum weight gains (Baker et al., 1996; Coon et al., 1998). The balance of
a mixture of AA in the diet is very unlikely to exactly meet the requirements of each
of the animal tissues. A deficiency of an AA is likely to cause a reduction in
performance and excesses of AA can also be deleterious (Buttery and ���� Mello,
1994). It has therefore been suggested that the most important single factor affecting
the efficiency of protein utilization for meat production is the dietary balance of AA
(Cole and Van Lumen, 1994).

67
Table 4.1 Amino acid profile of MOCM (as fed, full-fat basis) as compared to the
nutrient requirement of poultry (NRC, 1994)
Amino Acid profile Broilers*
(%)
Layers*
(%)
MOCM
(%)
10% MOCM
(%)
Arginine 1.25 0.88 1.24 0.91
Glycine+Serine 1.25 - 0.74 2.75
Histidine 0.35 0.21 0.27 0.28
Isoleucine 0.80 0.81 0.44 0.54
Leucine 1.20 1.03 0.82 1.08
Lysine 1.10 0.86 0.64 0.61
Methionine 0.50 0.38 0.20 0.20
Methionine+Cystine 0.90 0.73 - -
Phenylalanine 0.72 0.59 0.48 0.58
Phenylalanine+Tyrosine 1.34 1.04 - 1.06
Proline 0.60 - 0.69 0.83
Threonine 0.80 0.59 0.52 0.45
Tryptophan 0.20 0.20 - -
Valine 0.90 0.88 0.56 0.62 * NRC, 1994, MOCM – Macadamia oil cake meal
Many researchers have also stressed the supplementation of amino acids to most of
the by-product that are used as poultry feeds. From the evaluation of the AA in
MOCM in the present study, it can be concluded that supplementation of AA would
be necessary. The low concentration of a particular amino acid suggests that any diet
formulation that is MOCM based must be supplemented with the deficient amino
acids.
Knowledge of the availability of amino acids in feedstuffs is important for consistent
formulation of diets that meet the bird’s amino acid requirement. The amounts of
amino acids available to animals, are often much lower than the quantity contained in
feedstuffs (NRC, 1994).

68
4.1.2 Wood ash
The present study evaluated the possibility of using WA as an alternative for
limestone (source of Ca) in chicken diets. From the findings regarding the chemical
properties of WA, it was found that CaCO3, a form of Ca also in limestone is
available in high concentration; therefore this may suggest that the bioavailability of
Ca in both limestone and WA is the same. The Ca content in WA and limestone is 25
and 35%, respectively, which suggest that the replacement of limestone by WA will
require a higher inclusion percentage of WA as would with limestone.
From a nutritional point of view, little or no information is available for wood ash as
alternative source of Ca for poultry feeding. Data published on the properties of wood
ash are not as detailed as for ashes from coal. As a result, available data on the
properties of WA are very variable (Etiegni & Campell, 1991; Ulery et al., 1993;
Someshwar, 1996). The XRD analysis results indicated that Ca was mainly in the
form of calcite CaCO3, viz. 58.8%, and in the same form as in feed lime. This is in
agreement with results reported by Demeyer et al. (2001) and Van Ryssen & Ndlovu
(2003).
4.2 Growth experiment
The experimental diets were formulated to contain different levels of MOCM and to
simulate a possible practical situation for the feeding of poultry, and the different
treatment diets consisted of MOCM, conventional feed ingredients and WA and feed
lime as Ca sources. Birds in the control diet had a good performance, except for the
observed separation of WA from the feed ingredients. The separation may be due to
the fine particle sizes of WA and also less fat content in the control diet which may
help bind the WA. Alternative methods of mixing the feeds that contain WA as an
ingredient needs to be used to prevent the separation of fine particles, and one of the
methods can be through pelleting. It is believed that smaller particle size leads to
improved pellet quality (hardness) and efficiencies of pelleting process. Particle size
encompasses both the size of various feed ingredients used in poultry diets as well as
the consistency of the particle size. Many common issues such as mixing difficulties,

69
wrong particle size and ingredient separation can be overcome by relatively fine
milling of raw materials and exposing them to pelleting (Kleyn, 2006). However, once
the pellet is exposed to feed gastro intestinal tract digestion of the bird (the crop in
particular), the feed dissolves and we are in effect feeding a finely grounded mash diet
(Kleyn, 2006). Uniformity of the diet has long been assumed to be important for
optimum performance and it should be remembered that in young birds the beak
dimension mitigate against prehension of large particles and that the gizzard is less
well developed than in older birds (McCracken, 2002).
With the other treatment diets, it was observed that the inclusion of WA in diets were
MOCM was present, did not have any separation incidences and this may be due to
the fat content of MOCM as it resembled an adherence force to WA not to separate.
The fat content may be a solution to fine particle separation; however, the diet may
suffer the disadvantage of being susceptible to rancidity in store (McDonald, et al.,
1995).
The treatment of 100% MOCM was terminated at eight weeks since the chickens had
retarded growth and low body weight gains, demonstrating that the 100% MOCM diet
both with and without Ca were not feasible. However, the inclusion level of up to
50% MOCM had no (P>0.05) differences in (muscle and fat), except for FI, BWG
and FCE between treatment diets. The findings of the study are relative to the study
conducted by Dong (2005) on the effect of replacement of concentrate with agro-
industrial by-products (e.g. brewery waste, soya waste etc.) on duck performance and
carcass composition traits, they reported that, concentrate supplied was reduced by
more than 50%, and resulted in significantly lowered daily gain and as the ducks were
unable to fully compensate for lower ME and digestible CP in the diets.
It is evident from low feed intake and body weight (birds in 100% MOCM diet) that
they had from an early stage of growth; they had retarded growth which indicated
their inefficient utilization of feed due to high fibre and low protein in the diet.
However, the incidence of mortalities among the birds in the 100 % MOCM diet was
low, suggesting that MOCM may not contain toxic substances. A poor performance
could be expected on a diet containing such a low concentration of CP of 140 g/kg for

70
growing birds. However, considering the high CP concentration of 254 g/kg reported
by Skenjana et al. (2002) indicates that MOCM could be fed at relatively high levels
to poultry under rural farming conditions.
The effect of including MOCM as an alternative feed ingredient in diets for chickens,
on feed intake showed differences between treatments. Because the inclusion rates of
MOCM were predetermined in these diets, the major difference between the diets
containing 0, 10 and 50% MOCM was their fibre content. Gear et al. (1981) observed
that dietary fibre prevents effective utilization of dietary nutrients because of rapid
transit times of the diets through the digestive tract.
Differences in FI between the different treatment groups fluctuated during the early
stage of the growth study, but did not show a specific pattern. However, from week 10
onwards the feed intake of the 50% MOCM + WA group was significantly higher
than that of the other groups, with the 50% MOCM + lime having higher intakes from
week 12 compared to the 0% and 10% treatment diets. These findings are in line with
that of other researchers.
Mc Donald et al. (1995) pointed out that within limits, the dilution of the energy
content of the diets of monogastric animals could result in increased DM intakes in an
attempt to maintain the level of available energy intake. Smith (2001) also stated that
feed intake of poultry is determined mainly by their energy requirements and the
major dietary factor that affects feed intake is the concentration of energy in the diets.
Sonaiya (1995) reported that most of the materials available for scavenging have a
relatively low concentration of ME, since they contain high levels of crude fibre.
Therefore, feeding poultry diets that are low in ME and high fibre would result in
higher feed intake, as the chickens will eat more to satisfy or meet their energy
requirements. The findings of Savory and Gentle (1976a, b) on agro-industrial by-
products, suggested that a greater weight and volume of food is necessary to meet the
requirements for energy and other nutrients at higher concentrations of fibrous
ingredients in the diet. Also, Shim et al. (1989) and Onifade and Babatunde (1998)
reported higher feed intake of broilers given diets based on high levels of fibrous
brewer dried grains. Leeson et al. (1996a, b) reported that the increased feed

71
consumption is definitively a response to energy dilution of the diets and the attempt
by the birds to consume adequate amounts for maintenance as well as growth.
It could be speculated that the high fibre content in the 50% + WA treatment resulted
in a higher rate of passage of the ingesta. However, the 50% MOCM + lime treatment
contained similarly high fibre content, though did not show the same response in feed
intake.
Although there was a linear decrease in performance with high level of MOCM,
optimum growth rates were obtained when 10% MOCM was included in diets for
chickens, especially the grower diet. The birds on the 10% MOCM diet had the same
performance as those on the control diet, which clearly indicates that MOCM can be
included in diet for chickens up to a level of 10% without adversely affecting
performance of the bird. Akinola and Abiola (1999) and Abiola and Adekunle (2002),
reported that, the use of melon husk (MH) in which it could replace 10% of maize in
cockerel diets, the by-product has low level of protein content 9.5% and high crude
fibre content 29%.
The chickens receiving the 50% MOCM treatment diet had lower body weights
during most of the growing period. The low body weight of chickens in this diet
does not correlate with the high feed intake, mentioned earlier. McDonald et al.
(1995) stated that, the digestibility of a food is closely related to its chemical
composition and the fibre fraction of a feed has the greatest influence on the
digestibility, both the amount and chemical composition of the fibre are important.
Various authors reported the implications of a fibrous diet on nutrient utilisation.
Though the chickens had a high feed intake in the diet of 50% MOCM, the BW was
lower compared to the other treatment diets. This may be due to the presence of anti-
nutritional factors contained in MOCM, which if present, would make nutrients
unavailable to the birds. In addition the, chickens does not have the necessary
enzymes to digest high fibre content feeds.
Due to the high fibre content of the MOCM, chickens in 50% MOCM diet had a
lower BWG at an early stage and recover as they grew older. The results on the BWG
correlate with the body weight mentioned above, and again the fibre content of the

72
feed contributed to the less BWG of the chickens in 50% MOCM diet. Abiola et al.,
(2002) reported that, the best result obtained with regard to body weight gain was 19.1
g/bird/day where alkali-treated melon husk (ATMH) replaced 10% maize, suggesting
poor efficiency of feed utilisation by the birds due to the fibrous nature of the diets.
The same results were found in the current study about the BWG, as the chickens in
treatment diet of 50% MOCM compared to 10% MOCM, had lower BWG possibly
due to the high fibre content of the diet as a result of high inclusion of MOCM.
The increase in BW by chick of 50% MOCM at an older stage, may suggest that a
high level of inclusion of MOCM may be suitable for chickens at a later stage of
growth as they seem to tolerate the high fibre and able to digest the diets as compared
to young birds, because the gizzard is not well developed in young chicks than in
older birds (McCracken, 2002). Birds on fibrous diets are known to exhibit greater
mechanical grinding, and this usually stimulates the muscular walls of the gizzard and
increases the intestinal length (Abiola, et al., 2002)
Feed conversion efficiency (FCE) is a key measure of performance and in poultry
terms it means the return of one unit of bodyweight for x units of feed (King, 2006).
Feed conversion efficiency was decreased with increased level of inclusion of MOCM
(esp. for 50% MOCM) up to 11th week, and there after an increase was realized and
the cause of poor FCE was due to the decreased BWG with increasing level of
MOCM in the diet. Considering the performance of chickens in treatment diet of 10%
MOCM alone, it could be observed that the diet had a good FCE as compared to the
diet of 50% MOCM. Ali, et al., (2001) reported that a poorer FCE obtained may
possibly be attributed to poorer utilization of ingested energy and possibly high fibre.
In addition, they found that FCE were increased with increased level of soybean oil up
to 6% but with higher level, the FCE were decreased on finisher period of broilers.
The incidence of poor FCE in the diet of 50% MOCM may have resulted due to the
high fibre content and possibly anti-nutritional factors in the diet. Although there were
improvements in gains and feed efficiency at 50% MOCM level of inclusion, the
differences were not statistically significant.

73
4.2.1 Carcass composition
The result from the growth experiment clearly indicate similar carcass compositions
in terms of carcass mass and bone percentage between the control and the diets in
which 10% and 50% MOCM were included. The exception was with the 10% MOCM
plus lime treatment, in that the carcasses in this treatment contained more fat
compared to those in the other treatments. These results suggest that the inclusion
level of MOCM and also the use of WA as an alternative to feed lime did not have an
effect on the carcass mass and bone percentage of the chickens. Muscle as a percent
carcass mass of 50% MOCM with feed lime diet was significantly higher (P<0.05)
than the other treatment diets.
4.2.2 Analysis of the tibia bones
The physical measurements of both the right and left tibia bones did not yield any
differences for all the treatment diets, including the comparison between the Ca
sources. The BBS as a factor of Ca availability and deposition from the source
provided to the chickens was the same for both limestone and WA. These results
suggest that WA can be used as an alternative for limestone, with the same effect on
bone strength for the chickens. Bone strength depends in part on the relative amounts
and properties of the mineral content and organic matrix (Boskey et al., 1999). In
contrast, the results obtained by Williams et al. (2000) showed that the breaking
strength of the tibia of chickens at 2 weeks of age was unaffected by dietary Ca and
available P content, despite variation in occurring between diets.
The mineral content i.e. Ca and P of the tibia bone showed some difference in the diet
of 50% MOCM compared to the other treatment diets. But the low Ca and P content
of the bones did not have any influence on the BBS as there were no significant
differences between the treatment diets. The ash to calcium ratio of the tibia bone for
the study was in a range of 34-36%. Eastoe (1961) listed Ca and P in bone ash of
mammals to be 35.6 to 36.3% and 15.5 to 16.4%, respectively. According to Field et
al. (1974) bovine bone ash contains approximately 37% calcium and the percentage is

74
constant over a wide age range. The result of Ca and P as percent ash for the present
study was in the range of 33.4 to 35.5% and 16.0 to 18.0%, respectively.
4.3 Layer experiment
The results of the layer trial clearly indicated less significant differences between
treatments with regard to the performance parameters measured. The hens used in the
current study were of a dual purpose breed (New Hampshire). They are slow growing,
which in turn results in hens reaching point-of-lay at an older age compared to
commercial breeds. In addition, the New Hampshire breed is comparable with
indigenous chickens that make them suitable as scavenging hens, and this is the
production system mostly practised in rural and peri-urban areas. Minh (2005) stated
that the major limitations of scavenging are generally the low productivity, especially
under smallholder conditions and remote areas, and mainly as a result of low intake of
nutrients and un-balanced nutrient diets. However, supplementation of energy, protein
and amino acid improved performance and reduced production costs.
Minh (2005) reported that replacing soya bean meal (SBM) with 20% cassava leaf
meal (CLM) in scavenging chickens did not affect the production performance of
pullets and laying hens, although feed intake increased by about 10% compared to the
control diet, possibly caused by high fibre in the CLM diets. The findings are in line
with the result of the current study, as the diet of 50% MOCM with lime had a
significantly higher (P<0.05) FI compared with the other diets (especially the control
diet), which did not differ significantly between treatments. In addition, McNaughton
and Deaton (1981) reported that sunflower seed meal (SFM) could be included in
layer diets up to 30% without adversely affecting body weight, egg production or egg
weight. In addition, they found that using high fibre SFM (24 % fibre) up to 30% in a
layer diet significantly decreased feed efficiency while egg production, egg weight,
eggshell strength and mortality were not affected.
The findings of the current study with regard to body weight as one of the parameters
measured during the trial period, showed a reduced BWG in the diets of 0% MOCM +

75
WA, 10% MOCM + lime and 50% MOCM. The cause of loss in weight is not clear.
These may be due to the change in production system i.e. cages vs. floor systems, as
they were exposed to the floor system before reaching point-of-lay. In addition, the
low body weight gain especially in diets contain MOCM might be associated with the
ANF’s that the MOCM might contain, which would reduce nutrient digestibility.
Though the inclusion level of MOCM in the current study seems to be high in
comparison with the level reported on CLM, the fact remain that, the CLM is a by-
product high in fibre and the difference is with regard to plant species. The level of
CLM in practical poultry diets will also depend on the type of ingredients that are
being replaced, and CLM was included in layer diets up to 25%, without adversely
effecting egg production, egg quality and feed efficiency Minh (2005). Feed to gain
ratio may not reveal much about the expected economic performance of a diet, yet it
is a good indicator of biological efficiency (Sabamiwa and Akinwale, 1999). Odunsi
(2002) reported that an increase in the dietary level of cashew kernel meal (CKM) did
not significantly affect the hen day egg production. However, hens in confinement fed
a balanced diet will convert food weight to egg weight at an efficiency of about 2.8 kg
of feed per kilogram of egg weight (Sonaiya & Swan, 2004).
Diets based on SFM or SFM and groundnut (50:50) produced better responses in
terms of egg production, FI, feed efficiency and egg weight than diets with only
groundnut meal as a protein source Singh and Prasad (1981). The significant
reduction in cost of production was due to the inclusion of bio-degraded agro by-
products in the diets. Each of them replaced 50% of the maize allowing for the
reduction of the maize from 400 g/kg to 200 g/kg in the tested diets. Bio-degrading of
the agro by-products enhanced their feeding values by increasing their protein and
energy levels and ensuring adequate egg production, Iyayi and Aderolu (2004).
Eggshell strength did not differ significantly between the diets as indicated in Table
3.26. The results support the findings of the BBS as mentioned earlier, where it was
found that WA can be used as an alternative for limestone with regard to Ca
supplementation to chickens. Therefore, the availability and efficient utilisation Ca in
WA for both bone and egg shell strength is of the same value to the use of limestone
as a Ca source. However, Odunsi et al. (2002) reported that shells of eggs produced

76
by layers fed agro-industrial by-products (such as palm kernel cake) were thinner than
from hens fed conventional diets. The authors noted that dietary sources high in non-
starch polysaccharides probably through the carboxyl groups of the uronic acids can
bind divalent cations such as Ca, Fe, Cu and Zn. Consequently, such diet may require
additional supplementation.
In general, the results show the beneficial effects of MOCM and wood ash that can be
obtained by feeding non-conventional feed ingredients to chickens. The results also
demonstrated how efficient MOCM and WA could be utilized in comparison with
conventional feed ingredients. This would be of the financial advantage to small-scale
farmers, because the MOCM by-product is cheap to buy as it is regarded as a waste
from the oil producing industry. On the other hand, WA as source of Ca can be
produced by the “burning of wood” which is a norm that is commonly practiced in
rural areas.
Even though wood ash had lower calcium content than feed lime, the results were the
same as indicated by the breaking of the egg shell and tibia bones results, as there
were no significant differences found between treatments. The inclusion of wood ash
in feed, in comparison with feed lime was high in order to increase the calcium
content and availability in wood ash. The calcium content in wood ash is in the form
of calcium carbonate, (Table 3) similar to that in feed lime calcium. Therefore, the
assumption made was that, the availability of calcium in wood ash for chickens would
be the same as that of feed lime and this assumption was proven to be correct,
suggesting that the Ca in wood ash has a bio-availability similar to the Ca in feed
lime.

77
CHAPTER 5- GENERAL CONCLUSION 5.1 CRITICAL EVALUATION
As mentioned earlier that MOCM might be of high or low quality, it was unfortunate
that the batch received for the present study was of bad or low quality. Therefore, the
sample or batch was low in protein and it demonstrates the risk of using any batch of
the by-product. It would be necessary for analysis to be done on the by-product before
it can be fed to chickens. This might be difficult for rural situation as they don’t have
the necessary technology to do the analysis of feed ingredients that they feed to
chickens. Apart from the downside mentioned about MOCM, the by-product if of
high quality can be beneficial to a rural situation as it can be fed to chickens at a
particular level and reduce the cost incurred during feeding of the chickens.
The feeding of MOCM as a sole feed ration proved to be an unfeasible practice as
evident from the poor performance of chickens that received MOCM alone. It can be
given provided the birds scavenge, as a way to supplement the required nutrients. A
balanced diet, whereby different feed ingredients are mixed as a feed ration for
chickens, would be a solution for the well being of chickens, but in rural conditions it
would be difficult for farmers to provide a balanced diet unless it is bought as a
complete feed.
The high fibre content in MOCM may interfere with the digestibility of the by-
product if used as feed ingredient for high producing chickens, i.e. commercial layers
or broilers. Most of the chickens raised in rural areas are of types with a slower
growth potential that do not need feed of very high nutrient densities.
The period of the layer trial was too short (and hens were still early in the production
cycle) for any conclusion to be made regarding the value of WA as Ca source for
layer hens. The research should have been continued throughout the production cycle
to see the effect of wood ash during the laying period. Financial, time and housing
forced a premature termination of the trial.

78
The feeding of laying hens with wood ash as a calcium supplement was problematic
when feed ingredients did not have enough fat that could bind the wood ash. The
problem was evident from the diet where MOCM was not included in the ration, then
WA tended to separate from other ingredients and the intake of WA was lowered due
to its fine particle size. Therefore, care should be taken when formulating feeds for
layers.
Some of the egg quality indices were not monitored in this research, for example,
blood and meat spot, Haugh unit measure of internal egg quality and specific gravity.
They are also parameters to be included in an egg trial as they affect egg quality,
especially the internal quality. Other analyses that could have been included are
phytate and non starch polysaccharides (NSP) determination in the MOCM.
Wood ash is an important by-product of the burning of wood and has potential as a
valuable Ca source for chickens, especially in rural areas. The use of WA as an
alternative for limestone seems to be a valuable option when considering the
economic conditions of low-input subsistence farming systems found in rural areas.
Further investigations are needed in order to evaluate its feasibility and effectiveness
in the local livestock production systems, particularly in relation to labour availability,
and to determine levels of land-use pressure to ensure the sustainability of the
resource.
Due to the varying nutrient composition of MOCM as a result of the processing,
analysis of the by-product is highly recommended before it can be fed to chickens and
also farmers must be informed about the processing method applied.
5.2 RECOMMENDATIONS FOR FURTHER RESEARCH
The results of the study have shown that MOCM and wood ash are acceptable to
chickens as feed ingredients. These non-conventional feed ingredients competed well
with the more commonly used conventional feed ingredients included in poultry
feeds.

79
As the MOCM is cheap and highly available in areas in close proximity of macadamia
oil plants, this by-product has definite potential to reduce feed cost. More research is
necessary to ensure the optimum utilisation of MOCM.
The results of the study have shown that wood ash can be an effective Ca supplement.
However, these results need to be validated in subsequent trials using longer laying
periods and the availability of the Ca in WA needs to be determined.
The importance of unconventional feed resources for family or rural poultry
production depends on their availability in sufficient quantities for farm use, simple
preparation and processing methods, knowledge of the potential nutritive value and
(for comparison) the price and availability of conventional commercial feeds.

80
CHAPTER 6- REFERENCES
Abiola, S.S., Adekunle, A.O., 2002. Nutritive value of melon husk in the diet of
chickens. Bioresour. Technol. 81, 265-267.
Absa Bank. 1993. Economic Spotlight-The structure of the South African Economy.
No. 7, July.
Agee, A., Right use of lime in soil improvement, Orange Judd Co., New York, 1919.
Aherne, F.X. & Kennelly, J.J., 1982. Oilseed meals for livestock feeding. In: Recent
Advances in anima nutrition. Ed. Haresing, W., Butterworths, London. Pp. 39-
89.
Ajakaiye, A., Atteh, J.O., Lesson, S., 2003. Biological availability of calcium in
broiler chicks from different calcium sources found in Nigeria. Anim. Feed
Sci. Tech.104, 209-214.
Ajakaiye, A., Atteh, J.O., Lesson, S., 1996. Effects of calcium sources, particle size
and time on in-vitro calcium solubility of some indigenous Nigerian mineral
ingredient for poultry diets. Anim. Feed Sci.Tech. 65, 293-298.
Akinola, S.O., and Abiola, S.S., 1999. Blood chemistry and carcass yield of cockerels
fed melon husk diets. Trop. J. Anim. Sci. 2 (2), 39-44.
Ali, M.L., Miah, A.G., Salma, U. and Chowdhury, R.P., 2001. Effect of Soybean oil
on finisher period of broiler at hot weather in Bangladesh. Journal of
Biological Scinces. 1 (8): 714-716.
Ani, O.A. and Okorie, A.U., 2005. The effects of graded levels of dehulled and
cooked castor oil bean (Ricinus communis) meal on performance of broiler
starters. Nig. J. Anim. Prod. 32, 54-60
ARC Bulletin 426. The cultivation of Macadamias. Institute for Tropical and
Subtropical Crops.
Aregheore, E.M., 1993. Chemical composition of some Zambia crop residues for
ruminant nutrition. Zambia J. Agric. Sci. 3, 11-16.
Arosemena, A; DePeters, E.J; Fadel, J.G, 1995. Extent of variability in nutrient
composition within selected by-products feedstuffs. Anim. Feed Science and
Tech, 54, 103-120.
ASAE 1993. Bone, shear and three point bending, S349. ASAE standards 40, 462463.

81
Association of Official Agricultural Chemists (A.O.A.C), 1990. Official methods of
analysis, 15th ed. Association of Official Analytic Chemists, Inc. Arlington,
Virginia, USA.
Association of Official Agricultural Chemists, 1995. Official methods of analysis,
15th ed. AOAC, Washington, DC.
Association of Official Agricultural Chemists, 2000. Official methods of analysis,
15th ed. AOAC, Washington, DC.
Attia F.M., Alsobayel, A.A., Kriadees, M.s., Al-Saiady and Bayoumi, M.S., 1997.
Nutrient composition and feeding value of salicorniabigelovii torr meal in
broiler diets. Anim. Feed Sci. Tech. 65, 257-263.
Ayanwale, B.A and Aya, V.E., 2006. Nutritional evaluation of cornflakes waste in
diets for broilers. Pakistan Journal of Nutrition, 5(5): 485 - 489.
Barber, S.A., “Liming materials and practice,” in Soil acidity and liming (R.W.
Pearson and F. Adams, Ed.), Am. Soc. Of Agron. Madison, Wis. p. 125.
Barker, D.H., Parsons, C.M., Fernandez, S., Aoyagai, S and Han, Y., 1993. Arkansas
Nutr. Conf.., Fayetteville, USA.
Barker, D.H., and Han, Y., 1994. Ideal amino acid profile for broiler chicks during the
first three weeks post-hatching. Poultry Sci. 73: 1441-1447.
Barker, D.H., Fernandez, S.R., Webel, D.M., and Parsons, C.M., 1996. Sulfur amino
acid requirement and cystine replacement value of broiler chicks during the
period three to six weeks post-hatching. Poultry Sci. 75: 737-742.
Batty, J., 2003. Breeds of poultry and their characteristics. 5th Ed., Northbrook
Publishing, Ltd. West Sussex, Midhurst. p. 155.
Bedford, M.R., 2000. Exogenous enzymes in monogastric nutrition-their current value
and future benefits. Anim. Feed Sci. Tec., 86: 1-13.
Bender, A.E., Nutritional value of meat, 1974. In: Meat- Proceedings of the twenty-
first Easter school in Agricultural sciences, University of Nottingham.
Bidlingmeyer, B.A., Cohen, S.A., Tarvin, T., 1984. Rapid analysis of amino acids
using Pre-column Derivatization. J. Chromatography 336, 93, 104-110.
Boucqué, C.H.V & Fiems, L.O., 1988. Vegetable by-products of Agro-Industrial
origin. Livestock Prod. Sci. 19, 97-135.
Boskey, A.L., Wright, T.M., and Blank, R.D., 1999. Perspective Collagen and bone
strength. In: Bone and mineral research, 14: 3. Blackwell Science Inc.

82
Branckaert, R. 1967. Feeding brewer’s dried grains. In Poultry Feed from Waste,
1994. ElBoushy, A.R.Y. Publ. By Chapman & Hall, Lodon UK. p.322.
Buttery, P.J. and D�Mello, J.P.F., 1994. Amino acid metabolism in farm animals: An
overview. In: D�Mello, J.P.F. (ed.) Amino acid in farm animal Nutrition. CAB
International, Wallingford, UK. Pp. 1-10.
Campbell, A.G., 1990. Recycling and disposing of wood ash. Tappi J. 141-146. (On
volume).
Cole, D.J.A and Van Lumen, T.A., 1994. Ideal amino acid patterns. Amino acid in
farm animal Nutrition. (Ed) D�Mello, J.P.F. CAB International, Wallingford,
UK. p. 37-62.
Cooli, B.J., Nakata, S., Nomura, D.M., and Awada, M., 1958. Fertiliser components
in macadamia nuts. Hawaii Farm Sci. 7(1), 4.
Coon, C., Hruby, M., and Leske, K., 1999. Proc. Maryland Nutr. Conf. 26-42.
Cronan, C.S., Grigal, D.F., 1995. Use of calcium/aluminium ratios as indicators of
stress in forest ecosystems. J. Environ. Qual. 24, 209-226.
Daguro, A.E. & Rivas, E.T., 1987. Cassava as source of energy for broiler production.
CMU Journal of Agriculture, Food and Nutrition. 9, 49-59.
Damron, B.L., Waldroup, P.W., & Harms, R.H., 1966. Evaluation of dried Bakery
products used in broiler diets. Poultry Science. 44, 1122-1126.
Dawson, C.O., & Savage, G.P. 1997. Fatty acid content of New Zealand grown
macadamia nuts, In J. O’Connor & D.T. Lai Eds. Proceedings of the
international conference on plant oils and marine lipids. Auckland, New
Zealand.
Day, E.J., & Dilworth, B.C., 1968. Dried Bakery products in broiler diets. Mississippi
State University Exp. Sta. Bull. 763. Mississippi State Univ., Mississippi
State, MS.
Demeyer, A., Voundi Kkana, J.C. & Verloo, M.G., 2001. Characteristics of wood ash
and influence of soil properties and nutrient uptake: an overview. Biores.
Technol. 77, 287-295.
Dominiquez, P.L., 1992. Feeding of sweet potato to monogastrics. FAO Animal
Production and Health paper, 95: 217-233.
Duncan, A., 1998. The food security challenge for southern Africa. Food Policy, Vol.
23, No. 6, pp. 459-475.

83
Eastoe, J.E., 1961. Chemical composition of animal tissues. P. 717. In: Long, C. (Ed.)
Biochemists Handbook.
El Boushy, A.R.Y., 2000. The benefit of feed from waste. In: El Boushy A.R.Y and
Van deer Pole, A.F.B. (Eds), Formulating feed from waste and by-products.
2nd Ed. Kluwer Academic Publishers: 1-28.
Erich, M.S., Ohno, T., 1992a. Titrimetric determination of calcium carbonate
equivalent of wood ash. Analyst. 117, 993-995.
Eruvbetine, D., Afolami, C.A., 1996. Proceedings XIX World poultry congress
Amsterdam. 20-24 September. 3, 187-188.
Escobar, A., Parra, R., Parra, O., 1984. Effect of alkali treatment on digestibility,
fermentation rate and intake of maize cobs. Trop. Anim. Health Prod. 9, 45-
52.
Etiégni, L. and Campbell, A.G., 1991. Physical and chemical characteristics of wood
ash. Bioresource Tech. 37: 173-178.
Ewing, W.R. 1951. Minerals in poultry ration. In: Ewing, W.R., (Ed), Poultry
Nutrition. 4th ed. South Pasadena, California: 484-508.
Ezieshi, E.V and Olomu, J.M., 2004. Comparative performance of broiler chickens
fed varying levels of Palm Kernel Cake and Maize Offal. Pakistan Journal of
Nutrition, 3(4): 254 – 257.
FAO, 2002. Animal production and health: Protein sources for the animal feed
industry. Expert Consultation and Workshop, 29 April – 3 May, Bangkok.
FAO, 2005b. Brewers grains, Wet brewers grains, Dried brewers grains, Brewers
spent grain, Brewers Dried Yeast. In Animal Feed Resources Information
System. http://www.fao.org/ag/aga/agap/frg/afris/Data/468.htm; pp. 1-3
(accessed April 20, 2005).
Fetuga, B.L & Oluyemi, J.A., 1976. The metabolisable energy of some tropical tuber
meals for chicks. Poultry Science, 55: 868-873.
Field, R.A., Riley, M.L., Mello, F.C., Corbridge, J.H., and Kotula, A.W., 1974. Bone
composition in cattle, pigs, sheep and poultry. J. Anim. Sci. 39: 493-499.
Field, R.A., 2000. Ash and calcium as measures of bone in meat and born mixtures.
Meat Science, 55, 255-264.
Gear, J.S.S., Bredribb, A.J., Ware, A., Mann, J.J., 1981. Fibre and bowel transit times.
Br. J. Nutrit. 45, 77-82.

84
Goering, H.K. and Van Soest, P.J., 1970. Forage fibre analysis (apparatus, reagents,
procedures and some applications). USDA/ARS. Handbook No. 379.,
Washington, D.C.
Gohl, B., 1981. Tropical feeds. Feed information summaries and nutritive value.
FAO, Rome, pp. 529.
Grasser, L.A., Fadel, J.G., Garnett, I., Depeters, E.J., 1995. Quantiyt and economic
importance of nine selected by-products used in California dairy rations. J.
Dairy Sci. 78, 962-971.
Grieshop, C.M., Reese, D.E. and Fahley, Jr., G.C., 2001. Non-starch polysaccharides
and oligosaccharides in swine nutrition. In: A.J. Lewis and L.L. Southern, eds.
Swine Nutrition. 2nd ed, pp.108-129. CRC. Press, New York, USA.
Guinotte, F., Nys, Y., de Monredon, F., 1991. The effect of particle size and origin of
calcium carbonate on performance and classification characteristics in broiler
chicks. Poult. Sci. 70, 1908-1920.
Ha, J.K, Kim, S.W and Kim, W.Y, 1996. Use of agro-industrial by-products as animal
feed in Korea.
Harper, A.E., 1959. Amino acid balance and imbalance. Dietary level of protein and
amino acid imbalance. Ibid., 68: 405.
Huisman, J. and Tolman, G.H., 1992. Anti-nutritional factors in the plant proteins of
diets for non-ruminants. In: Recent Advances in Animal Nutrition, 1992.
Chp.1: 3-31.
Imbeah, M., 1999. Wood ash as mineral supplement for growing lambs under village
conditions in the tropics. Small Rumin. Res. 32, 191-194.
Iyayi, E.A and Aderolu, Z.A., 2004. Enhancement of feeding value of some agro-
industrial by-products for laying hens after their solid state fermentation with
Trichoderma Viride. African Journal of Biotech. 3 (3): 182 – 185.
Jacob, J.P, Mitaru, B.N, Mbugua, P.N, & Blair, R; 1996. The feeding value of
Kenyan sorghum, sunflower seeds cake and sesame seed cake for broilers and
layers. Anim. Feed Sci. Tech. 61, 41-56.
Janssen, W.M.M.A., and Carré, B., 1985. Influence of fibre on digestibility of poultry
feeds. Pp. 71-86 in Recent Advances in Animal Nutrition. Haresign, W. and
Cole, D.J., (Ed.) Butterworths, London, UK.

85
Joseph, J.K. and Abalaji, J., 1997. Effects of replacing maize with graded levels of
cooked Nigerian mango-seed kernels (Mangifera Indica) on the performance,
carcass yield and meat quality of broiler chickens. Bioresource Technology
61, 99-102.
Kaijser, A., Dutta, P. & Savage, G., 2000. Oxidative stability and lipid composition of
macadamia nuts grown in New Zealand. Food Chem. 71, 67-70.
King, H.P and Alexander, L.E., 1974. X-ray Diffraction Procedures for
polycrystalline and amorphous material, Second Ed. A Wiley-interscience
publication, New York, London.
King, N, 2006. Organic poultry. Teagasc, Mellows Development Centre, Athenry, Co.
Galway. www.teagasc.ie
Kleyn, R. 2003. The effect of particle size on poultry performance. Afma matrix, 12:
3, 3-8.
Lan, G.Q., Abdullah, N., Jalaludin, S and Ho, Y.W., 2002. Efficacy of
supplementation of phytase-producing bacterial culture on the performance
and nutrient use of broiler chickens fed corn-soybean meal diets. Poult. Sci.,
1522-1532.
Latham, M.C., 1997. In: Human Nutrition in Developing World, FAO Food and
Nutrition Series, Vol. 29, p. 509.
Lesson, S., Caston, L. and Summers, J.D., 1996a. Broiler response to energy and
protein dilution in the finisher diet. Poult. Sci., 75: 522-528.
Lesson, S., Caston, L. and Summers, J.D., 1996b. Broiler response to diet energy.
Poult. Sci., 75: 529-535.
Lesson, S. and Summers, J.D., 2001. Nutrition of the chicken, 4th Edition, pp, 331
-482.
MacGregor, R.G., & Abrams, L., 1996. Peri-urban and rural poultry outreach and
upliftment scheme. Proceedings XX World's poultry congress, 3, 652-661.
McCalla, A.F., 1998. Prospects for food security in the 21st Century: with special
emphasis on Africa. Agricultural Economics 20, 95-103.
McCraken, K.J., 2002. Effect of physical processing on the nutritive value of poultry
diets. Poultry Feedstuffs: Supply composition and nutritive value. Eds:
McDonald, P., Edwards, R.A., Greenhalgh, J.F.D & Morgan, C.A., 1995. Animal
Nutrition. 5th ed. Page 4-5. Longman publisher.

86
McDonald, P., Edwards, R.A., Greenhalgh, J.F.D & Morgan, C.A., 2002. Animal
Nutrition 6th ed. Pearson Education Ltd, Edinburg Gate, Harlow, Essex,
England.
McNab, J.M. and K.N. Boorman, CAB International.
McNaughton, J.L, and Deaton, J.M., 1981. Sunflower poultry applications. Feed
Management, 32: 27 – 28.
Meluzzi, A., Sirri, F., Manfreda, G., Tallarico, N., and Franchini, A., 2000. Effects of
Dietary Vitamin E on Quality of Table Eggs Enriched with n-3 long-chain
fatty acids. Poultry Science 79, 539-545.
Menke, K.H, Steingass, H., 1988. Estimation of the energetic feed value from
chemical analysis and in vitro gas production using rumen fluid. Anim. Res.
Develop. 28, 7-55.
Mertz, W. 1997. Food fortification in the United States. Nutr. Rev. 55 (2) 44-49.
Miller, C.D., and Branthoover, B., 1957. Nutritive values of some Hawaii foods.
Hawai Agr. Exp. Sta. Circ. 52, 8.
Minh, D.V., 2005. Effect of supplemtation, breed, season and location on feed intake
and performance of scavenging chickens in Vietnam. Doctoral thesis –
Swedish University of Agricultural Science, Uppsala.
Moe, P.W., and Tyrrell, H.F., 1976. Estimating metabolizable and net energy of feeds.
First International Symposium, Feed composition, Animal nutrient
Requirements and Computerization of Diets. (Edited by P.V. Fonnesbeck,
L.E. Harris, and L.C. Kearl) Utah Agr. Exp. Sta., Utah State University,
Logan, Utah.
Monnikhof, M.O, 1997. The poultry industry, worldwide. Poultry Bulletin, May: 189-
200.
Moss, A.R., Givens, D.J., Everington, J.M., 1990. The effect of sodium hydroxide
treatment on the chemical composition, digestibility and digestible energy
content of wheat, barley and oat straws. Anim. Feed Sci. Technol. 29, 73-87.
Nolte, M.E., Cline, J.H., Dehority, B.A., Loerch, S.C. & Parker, C.F., 1987.
Treatment of wheat straw with alkaline solutions prepared from wood ashes
to improve fibre utilization by ruminants. J. Anim. Sci. 64, 669-677.
North, M.O. 1984. Commercial chicken production manual. 3rd ed. Westport, Conn.

87
North, M.O. 1990b. Feeding Broiler, Roaster and Capon. In: North, M.O & Bell, D.D
(Eds), Commercial Chicken Production Manual. 4th ed. New York: Chapman
& Hall San Diego, California: 721-740.
NRC, 1994. Nutrient Requirements of Poultry (9th Ed). National Academy Press
Washington DC.
Ochetim, S., 1988. Small scale farming in Zambia: how to prepare local poultry feed.
Misset Int. Poultry 2 (2), 36-37.
Odunsi, A.A. 2002. Effect of feeding reject cashew kernel meal on pre- and early –
laying performance pullets. Dept. of Animal production and Health. Ladoke
Akintola University of Technology. Ogbomoso, Nigeria.
Odunsi, A.A., Akande, T.O., Yusuph, A.S. and Salami, R.I., 2002. Comparative
utilization of high inclusion rates of four agro-industrial by-products in the
diets of egg type chickens. Arch. Zootec., 51, 465-468.
Ogunfowora, O. 1984. Structure of cost and returns in feed mill. In Feed mill
Management Training Workshop. Dept. of Agric Ecens. University of Ibadan,
Ibadan.
Ohno, T., 1992. Neutralisation of soil acidity and release of phosphorus and
potassium by wood ash. J. Environ. Qual. 21, 433-438.
Olanders, B., and Steenari, B.M., 1995. Characterization of ashes from wood and
straw. Biomass and Bio energy, 8; 2, 105-115.
Onifade, A.A. 1993. Comperative utilization of three dietary fibre sources by broiler
chickens. PhD. Thesis, University of Ibada, Ibadan, Nigeria.
Onifade, A.A. and Babatunde, G.M., 1998. Comparison of the utilization of palm
kernel meal, brewer’s dried grains and maize offal by broiler chicks. Br. Poult.
Sci., 39: 245-250.
Parsons, C.M, Castanon, F, Han, Y, 1997. Protein and amino acid quality of meat and
bone meal. Poult. Sci. 76, 361-368.
Patrick, H. and Schaible, P. 1980. Poultry: Feeds and nutrition (2nd Ed.). AVI
Publishing Company, Inc. Westport, Connecticut.
Punna, S., D.A. Roland, Sir., 2001. Influence of dietary phytase supplementation on
incidence and severity in broiler divergently selected for tibial
dyschondroplasia. Poult. Sci., 80: 735-740.
Rajorhia, G.S., 1999. Analysis of aga studies on peri-urban livestock production
system in Asia, West Asia and near East, Africa and Latin America. In: Food

88
and Agriculture Organisation, Vialle Delle Terme Di Caracalla. Rome, Italy.
December 1999.
Ramirez, R.G., Garza, J., Martinez, J., Ayala, N., 1991. Wood ash, sodium hydroxide
and urine to increase straw utilisation by sheep. Small Ruminants Res. 5, 83
-92.
Ramirez, R.G., Cruz, F. & Gonzalez, C.C., 1992. Effects of treating corn Stover with
wood ashes and sodium hydroxide on nutrient digestibility by sheep and goats.
Small Rumin. Res. 7, 225-233.
Ravindran, V., Selle, P.H and Bryden, W.L., 1999a. Effects of phytase
supplementation, individually and in combination, with glycanase, on the
nutritive value of wheat and barley. Poult. Sci., 78: 1588-1595.
Ravindran, V., Cabahug, S., Ravindran, G., and Bryden, W.L., 1999b. Influence of
microbial phytase on apparent ileal amino acid digestibility of
feedstuffs for broilers. Poult. Sci., 78: 699-706.
Ravindran, V., Selle, P.H., Ravindran, G., Morel, P.C.H., Kies, A.K and Bryden,
W.L., 2001. Microbial phytase improves performance, apparent metabolizable
energy and ileal amino acid digestibility of broilers fed a lysine-deficient diet.
Poult. Sci., 80: 338-344.
Reddy, C.V., & Quadratullah, S., 1996. Strategic feeding supplementation through
locally available resources. Proceedings XX World's poultry congress, 1, 3-15.
Reid, B.L., Weber, C.W., 1976. Calcium availability and trace mineral composition of
feed grade calcium supplements. Poult. Sci. 55, 600-605.
Roenigk, P.W, 1999. Symposium: muscle and development. World Poultry
consumption. Poultry Science, 78: 72-728.
Romans, J.R., Costello, W.J., Carlson, C.W., Greaser, M.L., Jones, K.W., 1994. The
Meat we Eat. Interstate Publishers, Danville, IL.
Rosengarten, Jr. F., 1984. The book o edible nuts. Walker publishing Company Inc,
USA. Ch. 7, p 117-143.
Saleeb, W.F., Yermanos.D.M, and Huszar, C.k., 1973. The oil and protein in nuts of
macadamia tetraphylla L. Johnson, Macadamia integrifolia Maiden and
Betche, and their F1 hybrid. J. Amer. Soc. Hort. Sci. 98, 453-4 56.
Saleh, E.A., Watkins, S.E., & Waldroup, P.W., 1996. High-level usage of dried
bakery product in broiler diets. Journal of Applied Poultry Research. 5, 33-38.

89
Samuels, M.L., 1989. Statistics for the life sciences. Collier MacMillian publishers,
London.
Savory, C.J. and Gentle, M.J., 1976a. Effects of dietary dilution with fibre on the food
intake and gut dimension of Japanese quail. Br. Poult. Sci., 17: 561-570.
Savory, C.J. and Gentle, M.J., 1976b. Changes in food intake and gut size in Japanese
quail in response to manipulation of dietary fibre content. Br. Poult. Sci., 17:
571-580.
Scott, M.L., Nesheim, M.C., and Young, R.J., 1982. Nutrition of the chicken. 3rd Ed.,
M. L. Scott and Associates, Publishers Ithaca, New York. p. 522.
Sebastian, S., Touchburn, S.P., Chavez, E.R and Lague, P.C., 1996a. Efficacy of
supplemental microbial phytase at different dietary calcium levels on growth
performance and mineral utilization of broiler chickens. Poult. Sci., 75: 1516
-1523.
Sebastian, S., Touchburn, S.P., Chavez, E.R and Lague, P.C., 1996b. The effects of
supplemental microbial phytase on the performance and utilisation of dietary
calcium, phosphorus, copper, and zinc in broiler chickens fed corn-soybean
diets. Poult. Sci., 75: 729-736.
Sherrod, L.B. and Isahizaki, S.M., (2000). Effects of substituting various levels of
feed- grade macadamia nuts for grain upon the nutritive value of concentrate
rations for sheep. Hawaii, Agri. Exp. Sta. Hilo.
Shim, K.F., Ghen, T.W., Teo, L.H. and Khin, M.W., 1989. Utilisation of wet spent
brewer’s grain by ducks. Nutrition Reports International. 40: 261-270.
Shirley, R.B. and Edwards, H.M. Jr., 2003. Graded levels of phytase past industry
standards improves broiler performance. Poult. Sci., 82: 671-680.
Simons, P.C.M., Versteegh, H.A.J., Jongbloed, A.W., Kemme, P.A., Slumps, P., Bos,
K.D., Wolters, M.G.E., Beudekers, R.F and Verschoor, G.J., 1990.
Improvement of phosphorus availability by microbial phytase in broiler and
pigs. Br. J. Nutr., 64: 525-541.
Singh, K.S and Prasad, J.M., 1981. Feeding value of sunflower and groundnut cakes
for laying hens. Anim. Feed Sci. Tech., 6: 63 – 71.
Skenjana, A., Van Ryssen, J.B.J., Acheampong-Boateng, O., Roets, M., Dombo,
M.H., & Nkosi, D.B. 2003. Nutrient composition and Dry matter
disappearance of waste from the subtropical fruit industry in the rumen of
sheep (un published).

90
Smith, A.J., 2001. Poultry-Tropical Agricultural Series. Revised edition, CTA,
MacMillian Press Ltd., London.
Sobamiwa, O and Akinwale, T.O., 1999. Replacement value of cocoa husk meal for
maize in diets of growing pullets. Tropic. J. Anim. Sci., 1, 111-116.
Someshwar, A.V., 1996. Wood ash and combination wood-fired boiler ash
characterisation. J. Environ. Qual. 25, 962-972.
Sonaiya, E.B., 1995. Feed resources for smallholder poultry in Nigeria. World Animal
Review. FAO, 82 (1995/1). 255-260.
Sniffen, C.J., O’Connor, J.D., Van Soest, P.J., Fox, D.G and Russel, J.B., 1992. A net
carbohydrate and protein system for evaluating cattle diets: II Carbohydrate
and protein availability. J. Anim. Sci., 70: 356-3577.
Statistical Analysis Systems, 1994. SAS User’s Guide: Statistics Version 6. SAS
Institute Inc. Cary, NC, USA.
Stufflebeam, C.E., 1983. Principles of animal Agriculture. Prentice-Hall, Inc.,
Englewood Cliffs, USA.
Su, A.K and Station, H.C, 1996. Utilization of agricultural by-products in Taiwaan, p
1-6.
Summers, J.D., 1997. Precision phosphorus nutrition. J. Appl. Poult. Res., 6: 495-500.
Technical Bulletin Vol. PO46.
Trung, L.T and Devendra, C., 1987. Options for increasing the utilisation of cereal
straws. Proc. IV Int. Conf. On goats. Brazilia, Brazil, March 1987, pp. 1161-
1183.
Ulery, A.L., Graham, R.C., Amrhein, C., 1993. Wood-ash composition and soil pH
following intense burning. Soil Sci. 156, 358-364.
Van Barneveld, R.J., Baker, J., Szarvas, S.R. and Choct, M. 1995. Effect of lupin non-
starch polysaccharides (NSP) on nutrient digestion and microbial activity in
growing pigs. Proc. Nutr. Society of Australia. 19: 43.
Van der Merwe, F.J. & Smith, W.A., 1977. Dierevoeding. Hersiene Uitgawe, Kosmo
Uitgewers, Stellenbosch.
Van der Zijpp, A.J., 1999. Animal food production: the perspective of human
consumption, production, trade and disease control. Livestock Production
Science 59, 199-206.
Vang, N.D. 2003. Study on selection and pure-breeding to improve the performance
and quality of some local and exotic chicken breeds and produce suitable

91
crossbreds for household production systems. In: proceedings of the third
Vietnamese – Hungarian conference on domestic animal production and
aquaculture-quality and rural development, Hanoi, 18-19th October, 2003.
Van Horn, H.H., Hall, M.B., 1997. Agricultural and environmental issues in the
management of cattle manure. In: Rechcigl, J.E., MacKinnon, H.C. (Eds.),
Agricultural uses of by-product and wastes, American Chemical Society,
Washington, DC, p. 91.
Van Ryssen, J.B.J., & Ndlovu, H., 2003. Ash from fireplaces at homestead in rural
regions of South Africa as potential source of minerals to goats (un published).
Waldroup, P.W., 2001. Present status of the use of digestible amino acid values in
formulation of broiler diets: opportunities and obstacles. ASA
Wilkinson, J.M. 1988. The feed value of by-products and wastes. In: World Animal
Science, B4 Feed Science, 4. Disciplinary approach. Ed. E.R. Ørskov.
Elsevier Science, Amsterdam, The Netherlands. Pp. 313-327.
Williams, B., Waddington, D., Solomon, S., and Farquharson, C., 2000. Dietary
effects on bone quality and turnover, and calcium and phosphorus metabolism
in chickens. Vet. Science, 69, 81-87.
Yearbook of Agriculture 1938, USDA, p. 518

Filename: Phosa Thesis 2009 Directory: E: Template: C:\Documents and Settings\user\Application
Data\Microsoft\Templates\Normal.dot Title: The nutritive value of macadamia oil cake meal and
wood ash as alternative feed ingredient in for chickens in rural areas Subject: Author: ALPHEUS Keywords: Comments: Creation Date: 7/7/2009 11:33:00 AM Change Number: 6 Last Saved On: 7/7/2009 11:56:00 AM Last Saved By: user Total Editing Time: 24 Minutes Last Printed On: 7/7/2009 12:01:00 PM As of Last Complete Printing Number of Pages: 103 Number of Words: 24,360 (approx.) Number of Characters: 138,854 (approx.)