Biological Evaluation of Soybean Meal and Cottonseed Meal ...
81
Louisiana State University LSU Digital Commons LSU Historical Dissertations and eses Graduate School 1962 Biological Evaluation of Soybean Meal and Coonseed Meal by Amino Acid Digestibility and Protein Efficiency Ratio Studies. James Joshua Miner Louisiana State University and Agricultural & Mechanical College Follow this and additional works at: hps://digitalcommons.lsu.edu/gradschool_disstheses is Dissertation is brought to you for free and open access by the Graduate School at LSU Digital Commons. It has been accepted for inclusion in LSU Historical Dissertations and eses by an authorized administrator of LSU Digital Commons. For more information, please contact [email protected]. Recommended Citation Miner, James Joshua, "Biological Evaluation of Soybean Meal and Coonseed Meal by Amino Acid Digestibility and Protein Efficiency Ratio Studies." (1962). LSU Historical Dissertations and eses. 789. hps://digitalcommons.lsu.edu/gradschool_disstheses/789
-
Upload
khangminh22 -
Category
Documents
-
view
1 -
download
0
Transcript of Biological Evaluation of Soybean Meal and Cottonseed Meal ...

Louisiana State UniversityLSU Digital Commons
LSU Historical Dissertations and Theses Graduate School
1962
Biological Evaluation of Soybean Meal andCottonseed Meal by Amino Acid Digestibility andProtein Efficiency Ratio Studies.James Joshua MinerLouisiana State University and Agricultural & Mechanical College
Follow this and additional works at: https://digitalcommons.lsu.edu/gradschool_disstheses
This Dissertation is brought to you for free and open access by the Graduate School at LSU Digital Commons. It has been accepted for inclusion inLSU Historical Dissertations and Theses by an authorized administrator of LSU Digital Commons. For more information, please [email protected].
Recommended CitationMiner, James Joshua, "Biological Evaluation of Soybean Meal and Cottonseed Meal by Amino Acid Digestibility and Protein EfficiencyRatio Studies." (1962). LSU Historical Dissertations and Theses. 789.https://digitalcommons.lsu.edu/gradschool_disstheses/789

T his d isser ta tio n has been 63-2783m icro film ed ex a ctly as rece iv ed
MINER, Jam es Joshua, 1 9 2 8 - BIO LOGICAL EVALUATION OF SOYBEAN MEAL AND COTTONSEED M EAL BY AMINO ACID DIGESTIBILITY AND PROTEIN EFFICIENCY RATIO STUDIES.
L ouisiana State U n iv ersity , P h .D ., 1962 A g ricu ltu re , anim al culture
University Microfilms, Inc., Ann Arbor, Michigan

BIOLOGICAL EVALUATION OF SOYBEAN MEAL AND COTTONSEED MEAL BY AMINO ACID DIGESTIBILITY AND PROTEIN
EFFICIENCY RATIO STUDIES
A Dissertation
Submitted to the Graduate Faculty of the Louisiana State University and
Agricultural and Mechanical College in partial fulfillment of the requirements for the degree of
Doctor of Philosophy
in
The Department of Poultry Science
byJames Joshua Miner
B.S., University of Arkansas, 1953 M.S., University of Arkansas, 195k
August, 1962

ACKNOWLEDGMENT
I wish to express my sincere appreciation to all those
who have aided me in my graduate program. I am especially grateful
to Dr. A. B. Watts for his guidance as my major professor and to
Dr. W. A. Johnson for aid in the statistical analysis reported in
this dissertation.
The financial assistance of the Research and Educational
Division of the National Cottonseed Products Association, Inc. is
gratefully acknowledged.
I also wish to thank Dr. Jordan G. Lee, Department of
Biochemistry, and the entire faculty, staff and students of the
Poultry Science Department.
I am grateful also to my wife, Betty, for her encourage
ment and assistance in the preparation of this manuscript.

TABLE OF CONTENTS
Page
ACKNOWLEDGMENT ....................................... ii
LIST OF TABLES ..................... iv
LIST OF FIGURES ...................................... v
ABSTRACT ........................................ vi
I INTRODUCTION ......................................... 1
II REVIEW OF LITERATURE ................................ 3
III EXPERIMENTAL ......................................... 12
IV RESULTS AND DISCUSSION .............................. 26
V SUMMARY AND CONCLUSIONS ............ bh
VI SELECTED REFERENCES .................................. U6
VII APPENDIX SECTION I .................................. h9
VIII APPENDIX SECTION II ................................. 66
IX AUTOBIOGRAPHY........................................ 71
iii

LIST OF TABLES
Page
I The Balanced Single Square ......................... 13
II Non-Protein Diet ...................................
III Chemical Analysis of Cottonseed Meal ............... 16
IV Analysis of Experimental Diets .......... 18
V Composition of Practical Type Preliminary ChickDiet .............................................. 20
VI Composition of Semi-Purified Type PreliminaryChick Diet ................................... 21
VII Outline of Treatments in Chick Study ............... 22
VIII Experimental Chick Diets .................. 23
IX Total Nitrogen Digestibility Data and MeanSeparation...................... 27
X Average Amino Acid Intake per Collection Period(Hen Experiment) ................ 29
XI Average Digestibility Coefficient of Hen Study 30
XII Threonine-Analysis of Variance of DigestibilityCoefficients ....................... 33
XIII Summary of Protein Evaluation Study Using Chicks .... 37
XIV Analysis of Variance of Protein Efficiency Data(Chick Study) ..................................... 36
XV Results of Duncan Multiple Range Test on Meansof Meals .......................................... 39
XVI Conversion Table .................................... 63
iv

Page
XVII Color Yield Data and Calculation Factors ........... 6JU
XVIII Hen Digestion Trial Data ..... 67
XIX Protein Evaluation Study (Chicks) .................. 69
LIST OF FIGURES
Page
1 Leucine Standard Curve ....... 65
v

ABSTRACT
This study was designed to determine whether there was a
difference in the digestibility of the various amino acids in three
different samples of cottonseed meal and soybean meal. Chick growth
tests were used to determine the protein efficiency on these same
meals. An attempt was made to correlate amino acid digestibility
with protein efficiency.
Digestibility of most of the common amino acids was
obtained for these various meals when fed to adult hens on a semi
purified type diet. Surgically modified (exteriorized recta) White
Leghorn type hens were used in order to collect the feces and urine
separately.
Amino acid analyses were made by the method of Moore and
Stein except for tryptophan which was determined microbiologically.
Protein efficiency data with chicks were obtained on these
same meals with both 12 and 20 per cent protein diets using practical
and semi-purified type diets. The protein efficiencies were signi
ficantly higher for the lower protein diets. However the relative
rank of the various meals was approximately the same regardless of
level of protein or type of diet used.
The digestibility of the following amino acids was
significantly different among the meals tested— aspartic acid,

threonine, serine, glutamic acid, alanine, cystine, valine,
isoleucine, leucine, tyrosine, phenylalanine, lysine, arginine,
histidine, and tryptophan. In general the digestibilities were
higher in Soybean Meal and Acetone Extracted Cottonseed Meal than
they were in the other two cottonseed meals.
The relationship of digestible amino acid intake and
total amino acid intake with gain or protein efficiency was
determined using multiple correlation analyses. Digestible amino
acid intake did not prove to be superior to total amino acid
intake in its relation to either of these two factors. Both of
these factors were found to be highly associated with either
gain or protein efficiency (R = 0.89 to 0.97).

INTRODUCTION
Numerous attempts have been made to measure the bio
logical value of proteins. Most of them have been used -with some
degree of success. However, the need is still apparent for a
short term assay which would be more valid over a wide range of
conditions.
The biological value of a protein is affected by at
least five factors: 1. Quantity of essential amino acids present.
2. Digestibility or availability of the amino acids. 3. Balance
among the amino acids. U. Presence of growth inhibitory factors.
3. Unknown growth promoting factors present. Most of the methods
used to evaluate a protein are measuring the summation of all these
factors under the conditions of the assay. Fortunately a number of
these tests obtain values which are in close agreement with actual
feeding values within a relatively narrow range of defined conditions.
In studies with the rat Kuiken (1932) found a marked
variation in the availability of individual amino acids due to
processing of cottonseed meal. This strongly suggests the need
for such data with the avian species.
Differences in digestibility or availability may account
for some of the poor correlations of amino acid analyses with
nutritive value. Therefore a short term digestion trial with the

2
species concerned might be a valuable test to use in the evaluation
of a protein. If this is a valid assay, then digestible amino
acids would have a closer correlation with nutritive value than
the total amino acids.
It was felt that the development of the chromatographic
technique of amino acid analysis makes it possible to consider
digestibility of the individual amino acids. This, plus more
accurate data on the amino acid requirements, should make it
possible to better evaluate a protein.
This study was designed to determine whether there was
a difference in the digestibility of the various amino acids in
three different cottonseed meal samples and a soybean meal.
Chicks were used to run a protein efficiency test on these same
meals. An attempt was made to correlate amino acid digestibility
with the protein efficiencies.
REVIEW OF LITERATURE
The primary function of dietary proteins is to furnish
a mixture of amino acids of the proper pattern for the synthesis
of tissue proteins, and all methods for estimating the nutritive
value of a diet evaluate directly or indirectly this function.
Methods
An excellent review of the various methods for bio
logical evaluation of proteins was presented by Allison (1955).
Growth
Normal growth is an integrated process in which a nice
balance is maintained between all tissues. This normal
increase, expressed in terms of body weight, follows definite
mathematical patterns and can be closely correlated with an
increase of body proteins, a major component of growth. Such
a correlation was presented by Osborne, et al. (Allison, 1955),
who developed a method for determination of nutritive value
of dietary proteins, a measurement of protein efficiency that
has been revised and simplified into the most popular of all
methods. The protein efficiency ratio has been defined either
as the weight gain per gram of protein or nitrogen consumed.
3

h
The Rat-Repletion Method
Cannon, Benditt, Wissler, Frazier, Woolridge, Steffee,
Humphreys and others (Allison, 1955), have developed a
rapid, accurate and useful determination of nutritive value
of protein by first depleting and then repleting the protein
stores of the adult rat. Depletion can be accomplished by
feeding a protein-free diet until the rats have lost 25 per
cent of their initial body weight. The animals are then fed
nitrogen in the test diet and the rate of repletion measured.
Cannon has found 7 days repletion usually sufficient for
estimation of nutritive value. Excellent correlation was
obtained between gain in weight during repletion with the
regeneration of blood, liver or carcass proteins, making
weight recovery alone a good measure of nutritive value.
Nitrogen Balance
Growth of young animals and gain in weight of protein-
depleted animals are correlated with retention of dietary
nitrogen in the body, but nitrogen balance is a more direct
measure of nitrogen retention. By definition, nitrogen
balance is the difference between dietary nitrogen intake
and the nitrogen excreted.
The assumption is often made that a steady state can
be maintained so that proteins may be evaluated according
to the amount of nitrogen needed to maintain equilibrium,
a method that has been called the determination of protein
minima. This determination was made a quantitative procedure

5
by the work of Melnick and Cowgill (Allison, 1955).
"Biological Value"
A more fundamental and less variable measure of the
nutritive value of a dietary protein was formulated by
Thomas (Allison, 1955) who defined the percentage of
absorbed nitrogen retained in the body of the animal as the
"biological value". This (B. V.) can be expressed mathe
matically as follows:
B.V. £2 .. B + Fm + Ue I - (F - Fm)
B £= Nitrogen balance
Fm £2 Metabolic fecal nitrogen
Ue - Endogenous urinary nitrogen
I = Nitrogen intake
F r= Fecal nitrogen
Nitrogen Balance Index
This index has been defined as the tangent to the curve
relating nitrogen balance to absorbed nitrogen at some value
for absorbed nitrogen.
Nitrogen Balance and Repletion
These methods measure the magnitude of the positive
balance that can be produced by a dietary. This is a function
of both the degree of depletion in the labile protein stores
of the animal and the nutritive value of the protein.
Production of Plasma Proteins
The first experiment which clearly demonstrated that
diet affected repletion in plasma proteins was reported in

6
1918. That discovery stimulated a series of valuable
studies on plasma protein repletion by Whipple and
associates (Allison, 1955) at the University of Rochester.
Filling the Liver Protein Compartment
The protein content of the liver, under certain experi
mental conditions, is a function of dietary protein, both
amount and nutritive value. Addis and associates (Allison,
1955) were the first to emphasize this function while
Kosterlitz and Campbell have done much to make the measure
ment of filling the liver protein compartment a valuable
method for determination of nutritive value of dietary
proteins.
Correlation with Microbiological and Chemical Methods
Simpler and more rapid tests for nutritive value based
upon growth of protozoa or microorganisms have been developed
by a number of workers. Dunn and Rockland (Allison, 1955)
for example found that Tetrahymena geleii H. utilized unhy
drolyzed proteins. They determined nutritive value of casein,
lactalbumin, gelatin, and a protein hydrolysate for growth,
which were in close agreement with those obtained by other
procedures. Horn et al. (Allison, 1955) used Leuconostoc
mesenteroides P-60 to determine nutritive value of enzymatic
digests of cottonseed proteins, their results agreeing well
with protein efficiencies in the rat. One of the goals of the
chemical methods has been to correlate amino acid analysis of
protein with nutritive value. This has been considered by
several workers. Among these were Mitchell and Block (Allison,
7
1955), who selected the pattern of amino acids in egg
protein as the standard for growth. They assumed that the
amino acid in the test protein with the greatest deficit
when compared to egg protein does limit the amounts of all
the other essential amino acids that can be used for growth.
The proteins of food or feed may be ranked in the order of
their decreasing nutritive efficiency on the basis of in
creasing percentage deficit in their respective limiting
essential amino acids.
Two other similar methods of evaluation were reported
in the publication Improved Cottonseed Meals For Feeding Poultry
and Swine 19^4 - 55, Rubins et al. (1957).
Ingram et al. (Rubins, et al., 1957) studied the libera
tion of certain amino acids by acid and enzymatic hydrolysis of
cottonseed meal. The enzymatic release of these amino acids was
correlated with growth of the chicks. The results show a good
correlation between the release of certain amino acids by the in
vitro technique employed in these studies and the growth supported
in chicks by cottonseed meals.
Lyman et al. (Rubins et al., 1957) found a good correla
tion between the chemical index values and the chick growth rate.
Their chemical index took into account both total gossypol content
and nitrogen solubility in 0.02N sodium hydroxide.

Other Related Information
From a comparison of the amino acid content in the food
eaten and the feces produced, Kuiken (1952) found a marked varia
tion in individual amino acid availability within and between
cottonseed meal samples processed in various ways. Rats were used
as the experimental animal in these studies.
According to Sauberlich (1956) growth of weanling rats
was depressed more than 50 per cent when oxidized casein was added
to a diet containing peanut meal as a protein source. This growth
depression (or imbalance) could be corrected by addition of
methionine to the diet. The amino acid imbalance increased the
amount of feed required per gram of gain in body weight. However,
this was corrected by supplementation of the diet with the corre
sponding amino acid. Plasma levels of methionine were not altered
by methionine imbalances. Tryptophan deficiency, however, caused
a reduction in plasma amino acids.
Numerous studies showing the importance of the amount
of protein or amino acids are in the literature. However,
Johnson and Fisher (1956) first classified the essential amino
acid and set forth a quantitative requirement for the laying hen.
Qualitatively the hen's requirement for production is the same as
the chick except glycine is not classified essential for the hen.
Stephenson (1956) reported the ratio of lysine to
methionine to be 2:1 and extremely critical in practical
broiler feeds. He also noted that increasing the energy level
through use of high level of fat appears to magnify the imbalance.

9
Rosenberg and Baldini (1957) studied the methionine
requirement of the growing chick when fed diets of various
protein and energy contents. They found when sufficient energy
is available from non-protein sources to permit full utilization
of the protein for tissue synthesis and repair that the methionine
requirement expressed as a per cent of the diet increases as
protein level increases.
Using a crystalline amino acid diet Klain et al. (1958)
demonstrated a higher requirement for L-histidine and lower
requirement for glycine, DL-Methionine and L-phenylalanine than
those recommended by NRC (195U).
Amino acid imbalance was shown to affect nitrogen
retention by Deshpande et al. (1958). Rats fed a 6 per cent
fibrin diet supplemented with methionine and phenylalanine, which
created an imbalance, caused a reduction in food consumption, in
total nitrogen retention, and in per cent of ingested nitrogen
retained. On adding four more amino acids to overcome the
imbalance, food intake was increased, and there was a gradual
rise in the percentage of ingested nitrogen retained.
Harper (1959) used a protein lacking tryptophan
(gelatin), or an amino acid mixture lacking threonine, to
create amino acid imbalances involving tryptophan or threonine
in diets for rats containing casein supplemented with methionine.
He found the magnitude of growth depression caused by the addition
of gelatin increased as the level of gelatin was increased. The
magnitude of growth depression caused by a constant amount of amino -

10
acid mixture lacking in threonine was shown to be related to
the growth supported by the original diet.
In studies with adult dogs, Longenecker and Hause (1959)
presented evidence that plasma amino acid changes after a meal are
directly dependent upon the amino acid composition of the protein
ingested, if it is postulated that the individual essential amino
acids are removed from the blood by the body tissues at a rate
proportional to the amino acid requirement. By this method,
lysine was found to be the first limiting amino acid in wheat
gluten, tryptophan in gelatin, and arginine in casein for the
adult dog.
Gray et al. (i960) fed a lysine-deficient basal diet,
both with and without supplemental lysine added, to Barred
Plymouth Rock cockerels from hatching to Ij. weeks of age when
blood samples were taken. Twelve amino acids were determined
in the deproteinized plasma by microbiological assay. Bepro-
teinized plasma from birds receiving the lysine-deficient diet
was lower in lysine content and higher in threonine and tyrosine
than from birds fed the lysine-supplemented diet. Other amino
acids showed small differences.
Bender (I960) using a 10-day assay technique with rats,
and new target values for the requirement, obtained an improved
relationship between chemical score and biological value.
Kumta and Harper (1961) fed rats a diet containing 6
per cent of fibrin supplemented with methionine and phenylalanine
and found that the low food intake on this diet did not seem to be

11
associated with a slower rate of stomach emptying. Neither did
the feeding of this imbalanced diet reduce the ability of the rat
to synthesize the enzyme tryptophan pyrrolase.
The blood urea concentration of rats was greatly elevated
three hours after the rats ingested diets supplemented with mix
tures of methionine and phenylalanine or arginine and threonine,
both of which resulted in depression in growth and food intake.
However, several pairs of amino acids that caused depression in
growth and food intake did not cause a rise in blood urea con
centrations .

EXPERIMENTAL
Introduction
The work reported in this study is divided into two parts:
1. A digestibility study using hens to determine the digestibility
of individual amino acids in three different samples of cottonseed
meal and a sample of commercial soybean meal. 2. Chick growth
studies using these same meals to determine protein efficiency.
Digestibility Study
The digestibility portion of this study was initiated in
April of 1959. Four White Leghorn type hens which had been surgi
cally modified (exteriorized recta) according to the technique of
Richardson et al. (I960) were used in this study. The Extra-Period
Latin-Square Change Over Design, Lucas (1957), was the experimental
design used in this study, which is illustrated in Table I.
The hens had been on a standard type laying ration
several weeks prior to this experiment. Just prior to the first
collection period all hens were placed on the Soybean Meal Diet
(Diet 1H) for two days. At the end of this two day period the birds were placed on the Non-Protein Diet for a 1 day preliminary period
followed by a 2 day collection period on the same diet. After this
the following sequence was followed:
12

13
TABLE I
THE BALANCED SINGLE SQUARE
W ... U2 ' 1:3 ..wPeriod
No.
1 Diet Designation 1H 2H 3H in
1A Diet Designation NPD NPD NPD NPD
2 Diet Designation 2H in 1H 3H2A Diet Designation NPD NPD NPD NPD
3 Diet Designation 3H 1H in 2H3A Diet Designation NPD NPD NPD NPD
h Diet Designation in 3H 2H 1H
UA Diet Designation NPD NPD NPD NPD
5 Diet Designation in 3H 2H in
DIETS USED IN HEN STUDY
Diet 1H - Soybean Meal Diet
Diet 2H - Cottonseed Meal 65
Diet 3H - Acetone Extracted Cottonseed Meal
Diet In - Cottonseed Meal 59Diet NPD - Non-Protein Diet

ih
Two-day preliminary period on the experimental diets.Two-day collection period on the experimental diets.One-day preliminary period on the Non-Protein Diet.Two-day collection period on the Non-Protein Diet.
The above procedure was repeated until the necessary collection of
feces and urine was made as described, Table I.
The Non-Protein Diet used in this study is shown in
Table II.
The experimental diets were made by taking 75.73 gms. of
the Non-Protein Diet and adding enough of the meal in question to
be equivalent to 10 gms. of protein (N x 6.25); this amount was
offered to each hen daily. Feed was weighed back daily to obtain
actual daily intake.
The soybean meal used was a sample of commercial dehulled
soybean meal taken from a routine farm purchase. The cottonseed meals
used were obtained from Southern Utilization Research and Development
Division of the U. S. Department of Agriculture through the courtesy
of Dr. Vernon L. Frampton. Certain chemical data on the cottonseed
meal is presented in Table III.
The protein (N x 6.25) in these meals was as follows:
Soybean Meal, 50.75 per cent; Cottonseed Meal 65, b l .hO per cent;
Acetone Extracted Cottonseed Meal, 58.60 per cent; Cottonseed
Meal 59, Ul.20 per cent.
Body weight, feed intake, urine excreted, feces excreted
and egg weights were all recorded on a daily basis. The method of
collection was the same as that reported by Richardson et al. (i960).
About 2 gms. of boric acid powder was added to each collection

15
TABLE II
NON-PROTEIN DIET
Per cent
Corn Starch 52.90
Cerelose 27.78Vegetable Oil 5.29Vitamin Mixture^" 1.32
Mineral Mixture2 3.UUAgar 2.65Oyster Shell Flour 2.65Dicalcium Phosphate 3.97% 166.00
Contained the following per pound of vitamin mixture: Thiamine. HC1, 11.3 mg.; Riboflavin, 7.26 mg.; Ca Pantothenate,9.08 mg.; Vitamin B]_2, 9.0 meg.; Pyridoxine. HC1, 2.72 mg.; biotin, 0.27 mg.; Folacin, 1.82 mg.; I-inositol, h5.U5 gm.; 2-Methyl-l, U-Naphthoquinone, 2.27 mg.; Niacin, 68.18 mg.; Choline Chloride, 1000 mg.; Vitamin A, U000 I.U.; Vitamin Do, 750 I.C.U.; Vitamin E, 10 I.U.
^Contained the following per pound of mineral mixture:Na Cl, 63.17 gms.; KI^PO^, 176.37 gms.; MgSOk, 25.98 gms.; CaCOo, 172.96 gms.; FeS0[l.7H20, 12.2 gms.; KI, 0.36 gms.; MnS0ji.2H20,2,02 gms.; ZnCl2, 0*12 gms.; CuSO^, 0.22 gms.; C0CI2.6H2O, 0.01 gms.

16
TABLE III
CHEMICAL ANALYSIS OF COTTONSEED MEALS1
Epsilon Amino Gossypol Free Total
Residual NitrogenMeal Free Lysine Oil Solubility
gm./l6 gm.N % % % %
AECSM b.32 0.08 0.27 0.28 98.aCSM 59 2.70 0.02 0.83 a.39 36.aCSM 65 3.33 0.0U 0.77 0.76 65.0
CODE FOR MEALS
AECSM - Acetone Extracted Cottonseed Meal
CSM - Cottonseed Meal
^Furnished by D. Vernon L. Frampton, Southern Utilization Research and Development Division, U. S. Department of Agriculture.
2The per cent of the nitrogen soluble in 0.02N NaOH.

17
bottle when they were placed on the hen each night. These
samples of feces and urine were taken and placed in polyethylene
bottles, labeled and frozen for later analysis.
After the collections were complete, the feces from
each hen were pooled for the period. This was done by letting
the samples thaw at room temperature, and then thoroughly mixing
all feces from a given hen to get a pooled sample for the period.
Dry matter determinations were made on each hen for each period.
This was accomplished by placing duplicate samples in a convection
oven at 90° C. until a constant weight was reached. These dry
samples were then used for nitrogen determinations by the Macro
Kjeldahl procedure.
The urine was also pooled for each hen by periods and
made up to a known volume and thoroughly mixed. Nitrogen determi
nations were also made on the urine by the Macro Kjeldahl procedure.
After the pooling and mixing of these samples, both the
feces and urine were frozen again.
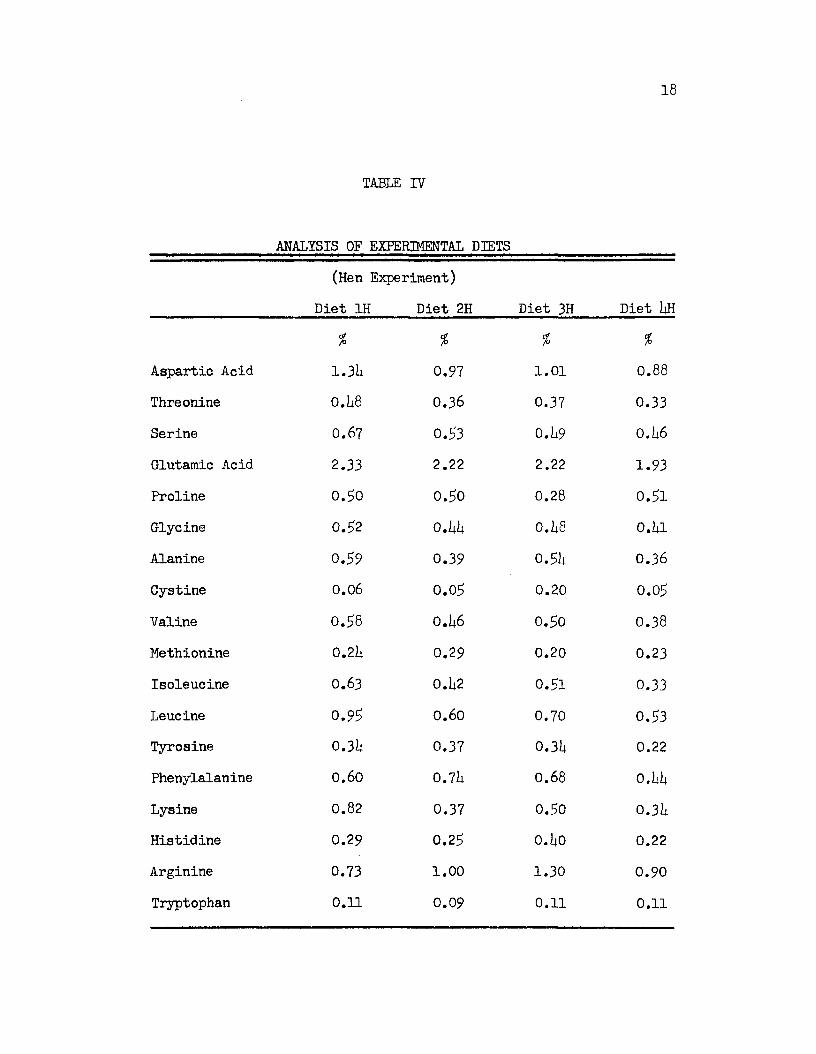
Amino acid composition of these diets was determined
for 18 of the commonly occurring amino acids, Table IV. All
analyses except tryptophan were made by the chromatographic
procedure of Moore, Stein and associates which is described in
Appendix, Section I. A sample of feed or feces containing
approximately 0.9 gms. of dry matter was used for hydrolysis.
Tryptophan was determined using the microbiological
procedure. These determinations were made by the Wisconsin Alumni
Research Foundation using the method of Henderson and Snell (19U8).
18
TABLE IV
ANALYSIS OF EXPERIMENTAL DIETS
(Hen Experiment)
Diet 1H Diet 2H Diet 3H Diet 1*H
% % % %
Aspartic Acid 1.3U 0 .91 1.01 0.88
Threonine 0.1*8 0.36 0.37 0.33Serine 0.6? 0 .53 0.1*9 0 .1*6
Glutamic Acid 2.33 2.22 2.22 1.93Proline 0.30 0.50 0.28 0.51Glycine 0.52 O.kb 0.1*8 0 .1*1
Alanine 0.59 0.39 o .5 k 0.36
Cystine 0.06 0.05 0.20 0.05Valine 0 .5 8 0.1*6 0.50 0.38
Methionine 0 .2 k 0.29 0.20 0.23Isoleucine 0.63 0.1*2 0.51 0.33Leucine 0 .9 5 0.60 0.70 0.53Tyrosine 0 .3 k 0.37 0.31* 0.22Phenylalanine 0.60 0.7l* 0.68 0.1*1*Lysine 0.82 0.37 0.50 0 .31*Histidine 0.29 0.29 0.1*0 0.22
Arginine 0.73 1.00 1.30 0.90
Tryptophan 0.11 0.09 0.11 0.11

19
Chick Study
The chick portion of this study was set up to evaluate
the same soybean and cottonseed meal samples used in the diges
tion studies with the hens. The criteria of evaluation were
protein efficiency and gain in body weight. Protein efficiency
for the purpose of this study is defined as grams of gain per
gram of protein consumed.
One thousand day-old broiler type chicks were obtained
from Western Hatcheries for this study. Five hundred (23>0 males
and 2^0 females) were placed on a practical type preliminary diet,
Table V. The same number was placed on a semi-purified prelimi
nary diet, Table VI. After 9 days on these diets, the chicks were
weighed, divided into weight groups and randomized on the basis
of weight group and sex, keeping separate those from the two
different types of preliminary diets. Those chicks receiving the
practical type preliminary diet also received a practical type
experimental diet, and those receiving semi-purified preliminary
diet received the semi-purified experimental diet. Within each
dietary regime, two levels of protein (12 per cent and 20 per cent)
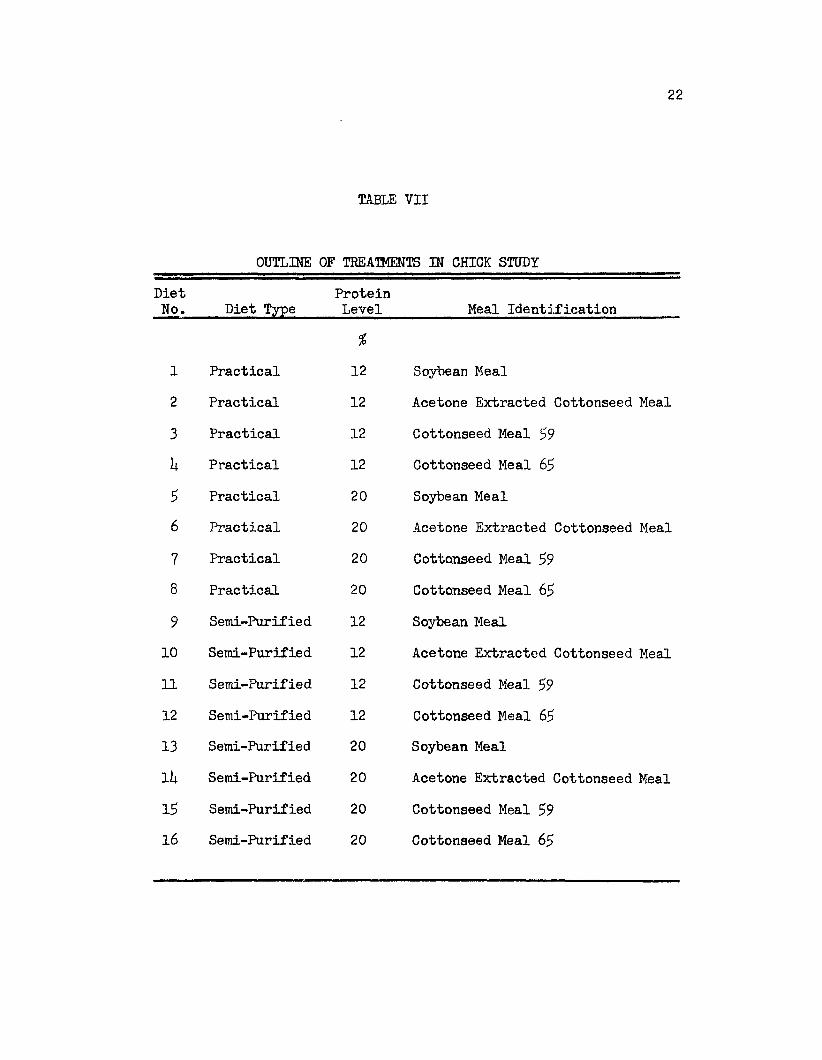
of each of the four meals were fed. The outline of treatments is
presented in Table VII.
The practical type experimental diets were made up in
such a way that about 6 per cent of the protein (N x 6 .25) came
from corn and the remainder from the meal in question. The com
position of the experimental diets is presented in Table VIII.

20
TABLE V
COMPOSITION OF PRACTICAL TYPE PRELIMINARY CHICK DIET
%
Ground yellow corn 9li.3
Dicalcium Phosphate 3 .5
Salt 0.5
Trace Mineral Mix1 0 .5
Vitamin Premix^ 1 .2100.0
Trace mineral mix consists of the following: ll.ii5gm., NaoMoO^. 2H2O; 2011.50 gm., Na2S0 ;̂ 0.8llt gm., Na2 WO^.2H20j 3u.l3 gm., Cupric Sulfate; 32. U2 gm., Zinc Carbonate;113.00 gm., Mn SO^ (70$); 57.0 gm., Ground Corn Meal. (This adds to the finished feed 10 ppm molybdenum, 1 ppm tungsten,30 ppm copper, 1000 ppm inorganic sulfur, kh ppm zinc.)
2Vitamin premix consists of the following: Vitamin A(10.000 U.S.P. units/gm.), 360.0 gms.; Vitamin D3 (15,000 I.C.U./ gm.), 2U.0; Vitamin E (20,000 I.U./lb.); 113U gm.; K (menadione), J4.O gm.; B-mixture (2 gm. of riboflavin, U gm. Ca pantothenate 9 gm. niacin, 10 gm. choline chloride per pound), 1587.6 gm.; i-Inositol, 1|50.0 gm.; Pyridoxine, 3.0 gm.; Biotin, O.lli gm.; Folacin (10$), 20.0 gm.; Vitamin B12 (20 mg./lb.), 227.0 gm.; Choline Chloride (70$), 1235.0 gm.; Thiamine Chloride, l.U gm.; DPPD, 10 gm.; Oxytetracycline (25 gm./lb.), 91.0 gm.; Ground Corn, 281.0 gm.

21
TABLE VI
COMPOSITION OF SEMI-PURIFIED TYPE PRELIMINARY CHICK DIET
$Starch 1*2.50
Cerelose 1*2.50Jones-Foster Salt Mix #12 i*.30Alphacel (Nutritional Biochemical Corp.) U .00
Tallow 5.00
Vitamin Mixture-*- 1.20OTrace Mineral Mixc 0.50
100.00
Vitamin premix consists the following: Vitamin A10.000 U.S.P. units/gm.), 360.0 gm.; Vitamin D3 (15,000 I.C.U./gm.), 21;.0; Vitamin E (20,000 I.U./lb.; 1131*.0 gm.; Vitamin K (menadione), 1*.0 gm.; Vitamin B-mixture (2 gm. of riboflavin, k gm. Ca pantothenate 9 gm. niacin, 10 gm. choline chloride per pound), 1587.6 gms.; i-Inositol, U50.0 gm.; Pyridoxine, 3.0; Biotin, O.ll* gm.; Folacin (10$), 20.0 gm.; B12 (20 mg./lb.). 227.0 gm.; Choline Chloride (70$),1235.0 gg.; Thiamine Chloride, 1.1* gm.; DPPD, 10 gm.; Octytetra- cycline (25 g m . / l b . ) , 91.0 gm.; Ground Com, 281.0 gm.
pTrace mineral mix consistBof the following: 11.1*5 gm.,Na2Mo0l;. 2HoO; 2011.50 gm., NaoSOl*; 0.811; gm., Na2 WOl*. 2H2O;3l*.13 gm., Cupric Sulfate; 32.1*2 gm., Zinc Carbonate; 113.00 gm.,Mn SOl; (70$); 57.0 gm., Ground c o m meal. (This adds to the finished feed 10 ppm molybdenum, 1 ppm tungsten, 30 ppm copper 1000 ppm inorganic sulfur, 1*1* ppm zinc.)
DietNo.
1
2
3
U
36
7
89
10111213
11*
1516
22
TABLE VII
OUTLINE OF TREATMENTS IN CHICK STUDY
ProteinDiet Type______Level Meal Identification
%
Practical 12 Soybean Meal
Practical 12 Acetone Extracted Cottonseed Meal
Practical 12 Cottonseed Meal 59
Practical 12 Cottonseed Meal 65
Practical 20 Soybean MealPractical 20 Acetone Extracted Cottonseed Meal
Practical 20 Cottonseed Meal 59
Practical 20 Cottonseed Meal 65
Semi-Purified 12 Soybean MealSemi-Purified 12 Acetone Extracted Cottonseed Meal
Semi-Purified 12 Cottonseed Meal 59
Semi-Purified 12 Cottonseed Meal 65
Semi-Purified 20 Soybean Meal
Semi-Purified 20 Acetone Extracted Cottonseed Meal
Semi-Purified 20 Cottonseed Meal 59
Semi-Purified 20 Cottonseed Meal 65

TABLE VIII EXPERIMENTAL CHICK DIETS
PRACTICAL TYPE DIETSProtein Supplement Meal
Diet No. Ingredients
SM1
' ’ AECT2
Csm 59 3
■■■"csrsr"4
■ ‘SM’5
■"■jfficsr-”6
'CSM’597
CSM '658
% C7/o % % % "<5n d>/o %
Ground Yellow C o m 67.00 67.00 67.00 67.00 66.72 67.00 60.32 60.49Dicalcium Phosphate 3 .50 3.50 3.50 3 .50 3.50 3.50 3.50 3.50Salt 0.50 0.50 o.5o 0.50 0.50 0.50 0.50 0.50Vitamin Pre-Mix-1- 1 .20 1.20 1 .20 1 .20 1 .20 1.20 1 .20 1.20Trace Mineral Mix^ 0.50 0.50 0.50 0.50 0.50 0.50 0.50 0.50Protein Supplement Meal 11.80 Hi. 56 14.49 14.49 27.58 23.89 33.98 33.81Starch 7.75 8.53 6.37 6.41 0.00 1.71 0.00 0.00Cerelose 7.75 8.53 6.37 6.41 0.00 1.71 0.00 0.00
IB O O 106.06 lo o . 05 I 'c o r 1 3 0 6 100.61 I’CS ."65 100.00
SEMI-PURIFIED TYPE DIETSProtein Supplement Meal Sm AECSM CSM 59 CSM 65 sto AECSM CSM 59
Diet No. 9 10 11 12 13 14 15 16Ingredients
i % fo % 4 % $ dPCerelose 30.68 32.27 26.1jl; 26.51 22.80 25.44 16.73 16.85Starch 30.68 32.27 26.14; 26.51 22.80 25.44 16.73 16.85Protein Supplement Meal 23.61; 20.47 29.12 28.98 39.40 34.12 48.54 48.30Jones-Foster Salt Mix #12 li.30 4 .30 4.30 4 .30 4.30 4 .30 4.30 4 .30Cellulose (Alphacel) 4.00 It. 00 4 .0 0 4.00 4.00 4.00 4 .00 4.00Tallow 5.oo 5.oo 8.00 8.00 5.00 5.oo 8.00 8.00Vitamin Pre-Mix^ 1 .2 0 1 .20 1.20 1.20 1.20 1 .20 1 .2 0 1 .20Trace Mineral Mix^ 0.50 0.50 0.50 o.5o 0 .50 o.5o 0 .50 0.50
100.00 100.01 100.00 100.00 100.00 106.00 106.05 100.00
Vitamin premix consist of the following: Vitamin A (10,000 U.S.P. units/gm.), 360.0 gm.;Vitamin D3 (15,000 I.C.U./gm.), 21;.0 gm.; Vitamin E (20,000 I.U./lb.; 1131;.0 gm.; Vitamin K (menadione),4.0 gm.; B-mixture (2 gm. of riboflavin, 1; gm. Ca Pantothenate 9 gm. Niacin, 10 gm. choline chloride per

TABLE VIII (Continued)
pound), 1587.6 gm.; I-inositol, U50.0 gm.; Pyridoxine, 3.0; Biotin, O.lij. gm.; Folacin (10$), 20.0 gm. B]_2 (20 mg./lb.), 227.0 gm.; choline chloride (70$), 1235.0 gm.; Thiamine Chloride, l.U gm.; DPPD, 10 Oxytetracycline (25 gm./lb.), 91.0 gm.; Ground corn, 281.0 gm.
pTrace mineral mix consist of the following: 11.U5 gm., Na2Mo0lu 2H2O; 2011.50 gm., Na20|i;O.8H 4 gm., Na2 W0U. 2HoO; 3U.13 gm., Cupric sulfate; 32.U2 gm., Zinc carbonate; 113.00 gm., Mn SO^ (70$); 57.0 gm., Ground corn meal. This adds to the finished feed 10 ppm molybdenum, 1 ppm Tungsten, 30 ppm Copper, 1000 ppm inorganic sulfur, J4I1 ppm Zinc.

25
There were 3 pens composed of 5 male and 5 female chicks fed
each diet.
Dividers were used to make 2 pens on each deck of con
ventional starting batteries. These pens were numbered from top
to bottom with 10 pens per battery. The first 2k pens being used
for the practical type diet and the next 2k being used for the
semi-purified type diet. The first 8 pens in each series constituted 1 block. This gave a total of 3 blocks. Treatments of
each type diet were randomized within its section of the block.
Initial weights of the individual birds were recorded,
and two following weekly weights were recorded. Feed consumption
was also recorded on a weekly basis. However, the evaluation of
the experiment is based on two weeks gain and feed consumption.
Protein (N x 6.25) consumption was calculated from feed consumption.
Amino acid intake was calculated based on the analysis
of the meal made for the digestion study. By talcing the digestion
coefficients for each of the amino acids from the hen study the
amount of each amino acid digested was calculated for each diet.
Multiple correlations were made on the basis of both intake of
total and digested amino acids with gain and protein efficiency
as dependent variables. These were made with all 18 of the amino
acids and then with the 11 "essential amino acids".
Feed and water were supplied ad lib.

RESULTS AND DISCUSSION
Digestibility Study
Data pertaining to the collection periods are presented
Appendix Section II, Table XVIII. Feed consumption was fairly
uniform for a trial of this nature. However, consumption usually
dropped when the hens were placed on the Non-Protein Diet. The
birds were in negative nitrogen balance during the collection
period on the Non-Protein Diet. Even though these hens had been
modified for several months their general health apparently remained
good. Though not at a high rate, these hens continued to lay
during the period of about 2 months when these samples were
collected. This seems to indicate that these birds were still
functioning normally.
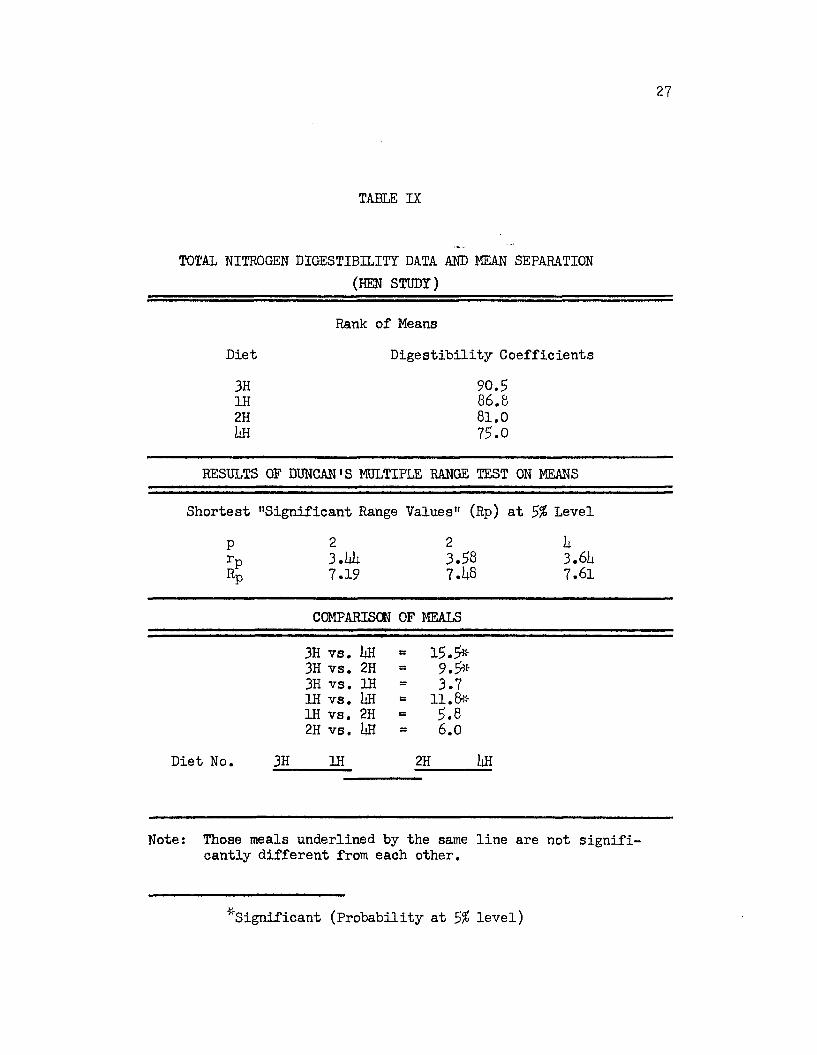
A real difference was found in the digestibility of
total nitrogen among meals. In this study it appears that the
difference in digestibility of total nitrogen would tend to
separate the meal in much the same way as these meals were separated
on the basis of several amino acid digestibility coefficients.
Nitrogen digestibility coefficients and separation of means by
Duncan's Multiple Range Test, Le Clerg (1957), are presented in
Table IX.
26
27
TABLE IX
TOTAL NITROGEN DIGESTIBILITY DATA AND MEAN SEPARATION(HEN STUDY)
Rank of Means
Diet Digestibility Coefficients
3H 90.51H 86.82H 81.0m 75.0
RESULTS OF DUNCAN*S MULTIPLE RANGE TEST ON MEANS
Shortest "Significant Range Values" (Rp) at 5% Level
P 2 2 hrp 3 .b b 3.58 3.61;Rp 7.19 7.U8 7.61
COMPARISON OF MEALS
3H vs. IjH S3 15.5*3H vs. 2H =r 9.5*3H vs. 1H ss 3.7IB vs. 1|H = 11.6*1H vs. 2H £3 5.82H vs. IjH SS 6.0
1H 2HDiet No. 3H 1H 2H IiH
Note: Those meals underlined by the same line are not significantly different from each other.
^Significant (Probability at 3% level)
28
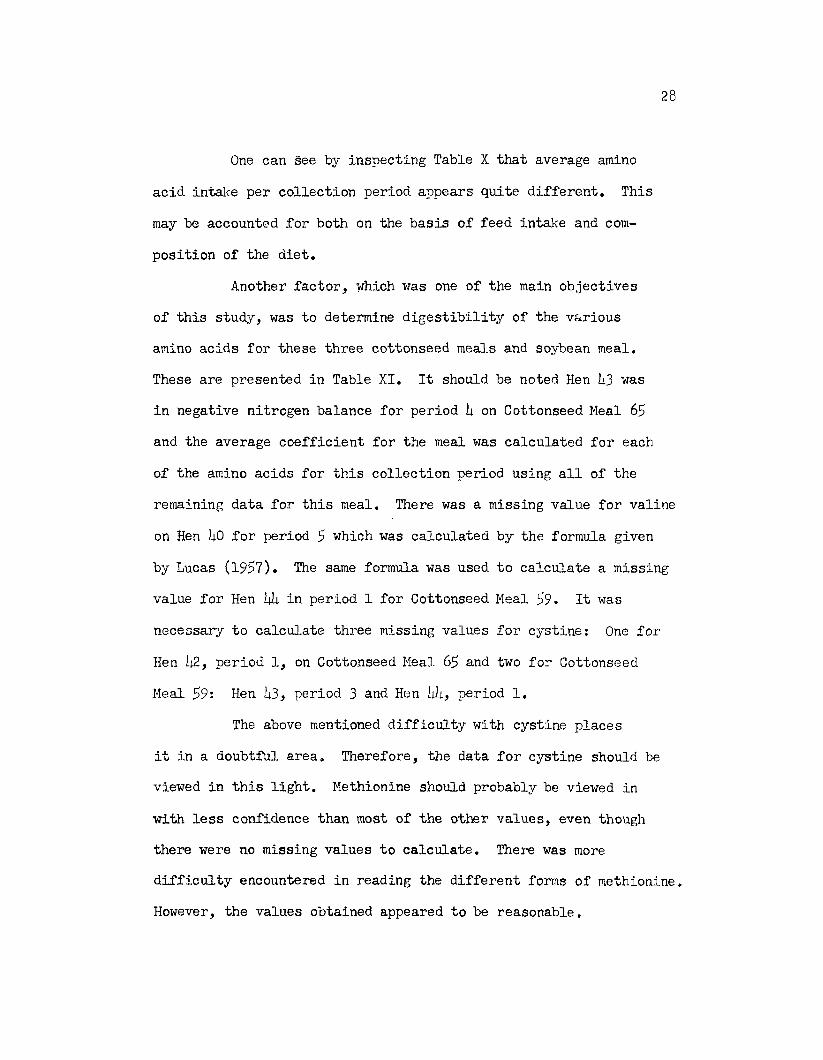
One can see by inspecting Table X that average amino
acid intake per collection period appears quite different. This
may be accounted for both on the basis of feed intake and com
position of the diet.
Another factor, which was one of the main objectives
of this study, was to determine digestibility of the various
amino acids for these three cottonseed meals and soybean meal.
These are presented in Table XI. It should be noted Hen 1*3 was
in negative nitrogen balance for period 1* on Cottonseed Meal 65
and the average coefficient for the meal was calculated for each
of the amino acids for this collection period using all of the
remaining data for this meal. There was a missing value for valine
on Hen 1*0 for period 5 which was calculated by the formula given
by Lucas (1957). The same formula was used to calculate a missing
value for Hen 1*1* in period 1 for Cottonseed Meal 59. It was
necessary to calculate three missing values for cystine: One for
Hen 1*2, period 1, on Cottonseed Meal 65 and two for Cottonseed
Meal 59: Hen 1*3, period 3 and Hen 1*1*, period 1.
The above mentioned difficulty with cystine places
it in a doubtful area. Therefore, the data for cystine should be
viewed in this light. Methionine should probably be viewed in
with less confidence than most of the other values, even though
there were no missing values to calculate. There was more
difficulty encountered in reading the different forms of methionine.
However, the values obtained appeared to be reasonable.

29
TABLE X
AVERAGE AMINO ACID INTAKE PER COLLECTION PERIOD
SBMgm.
AECSMgm.
CSM 63 gm.
CSM 59gm.
Aspartic Acid 2.28 1.73 1.68 1.28
Threonine 0,82 0.61* 0.59 0.1*8
Serine l.li* 0.81* 0.92 0.67Glutamic Acid 3.96 3.81* 3.85 3.51Proline 0.89 0.1*8 0.87 0.93Glycine 0.88 0.83 0.76 0.60
Alanine 1.00 0.93 0.68 0.52
Cystine 0.10 0.33 0.08 0.08
Valine 0.98 0.87 0.80 0.69Methionine 0.1*1 0.33 0.51 0.33Isoleucine 1.07 0.88 0.73 0.1*8
Leucine 1.61 1.21 1.01* 0.77Tyrosine 0.58 0.39 0.61* 0.32Phenylalanine 1.02 1.17 1.28 0.61*Lysine 1.39 0.87 0.61* o.5oHistidine 0.1*9 0.69 0.1*1* 0.32Arginine 1.21 2.23 1.73 1.36Tryptophan 0.19 0.19 0.16 0.17

30
TABLE XI
AVERAGE DIGESTIBILITY COEFFICIENT OF HEN STUDY
Diet 3H AECSM
Diet 1H SM
Diet 2H CSM 63
Diet I4H CSM 39
Threonine 86.6 86.3 77.6 63.7Serine 90.2 89.7 83.2 71.3
Glutamic Acid 93.6 9h.l 90.3 8lu8
Isoleucine 90.7 8I4.8 77.3 66.0
Tyrosine 83.1 8U .0 80. k U7.8
Phenylalanine 93. h 88.2 80.6 69.0
Diet 3H AECSM
Diet 1H SM
Diet bH CSM 39
Diet 2H CSM 63
Glycine________________ 8L J _________83^0_________72lO________ 71J4
Alanine 85.3_________ 8luh 70.7______ 67.2
Cystine 9U.U 82.8 7U.1 63.7Arginine 97.0 9U.2 89.3 87.2
Histidine 93.7 90.3 77.0 68.1
Tryptophan 91.8 90.3 80.3 79. U

31
TABLE XI (Continued)
Diet 1H SM
Diet 3H AECSM
Diet 2H CSM 65
Diet ItH CSM 59
Aspartic Acid 92.2 91.0 8U.3 79.1Leucine 92.0 88.8 79.3 73.3
Diet 1H SM
Diet 3H AECSM
Diet IjH CSM 59
Diet 2H CSM 65
Valine 90.9 88.5 85.0 80.it
Lysine 90.7 88.lt 55.0 U5.2
Diet 1H SM
Diet 2H CSM 65
Diet 3H AECSM
Diet itH CSM 59
Methionine 88.lt 8U.5 83.6 81.0
Diet 2H CSM 65
Diet 1H SM
Diet 3H AECSM
Diet ItH CSM 59
Proline 91.7 91.2 8U.U 82.5
Note: Any two means not included by the same line aresignificantly different from the other means in the array.
Any two means included by the same line are not significantly different.
32
An analysis of variance of the digestibility coeffi
cients showed that there was a difference among meals in
digestibility of all the amino acids except proline, glycine
and methionine. There was no carry-over effect or difference
between hens or periods in any case except with alanine and
lysine.
In the case of lysine there was no difference between
periods, but a significant difference between hens and highly
significant difference related to meals and residual or carry
over effect. Alanine showed a significant difference between
periods and carry-over effect and a highly significant difference
between hens and meals.
An analysis of variance of the digestibility coeffi
cients for threonine is presented in Table XII. This shows the
type of analysis used and what might be considered typical "F"
values for all the amino acids except lysine and alanine.
After it was shown that a significant difference in
digestibility existed among most of these meals, Duncan's Multiple
Range Test was used as the method of separating the means. Coeffi
cients in Table XI underlined by the same line are not signifi
cantly different from each other, while those not underlined by
the same line are significantly different from all other values
in that comparison.
As presented in Table XI, the digestibilities of threonine,
serine, glutamic acid, isoleucine, tyrosine, and phenylalanine for
the Acetone Extracted Cottonseed Meal, Soybean Meal, and Cottonseed

33
TABLE XII
THREONINE - ANALYSIS OF VARIANCE OF DIGESTIBILITY COEFFICIENTS
Sources of Variation d.f. Mean Square F
Periods It 5,U0 5 1.29
Hens 3 8,878 2.12
Meals 3 Itlt,806 10.69*-*
Residual Effect 3 7,203 1.72
Error 6 It,190
-SHi-Highly significant (Probability at 1% level)

3h
Meal 65 are not different. While the digestibility coefficients
for threonine, serine, glutamic acid, and isoleucine of these
three meals are significantly different from those for Cotton
seed Meal 59. In the case of phenylalanine, there is no signi
ficant difference in the coefficients for Cottonseed Meal 65 and
Cottonseed Meal 59. Under the second grouping on this Table,
alanine, histidine, and tryptophan are separated into pairs with
either member of the pair being significantly different from
either member of the other pair. The Acetone Extracted Cotton
seed Meal and Soybean Meal Diets make up one pair and Cottonseed
Meals 65 and 59 make up the other pair.
Cystine and arginine are alike in that the digestibility
coefficients for the various meals fall into the same parameters
for both these amino acids. This means that there is no real
difference in the digestibility between these two amino acids in
Soybean Meal and Acetone Extracted Cottonseed Meal. Acetone
Extracted Cottonseed Meal had a significantly higher coefficient
of digestibility than Cottonseed Meal 65 or 59. However, the
coefficients for Soybean Meal were not truly different from those
of Cottonseed Meal 59.
Alanine, histidine, and tryptophan fall into the same
type pairing. That is, Acetone Extracted Cottonseed Meal and
Soybean Meal form one pair. This means that there is no difference
in the digestibility of these amino acids in Acetone Extracted
Cottonseed Meal and Soybean Meal, but either is significantly better
than either of the other cottonseed meals. Even though the array

35
of the means is slightly different for leucine it falls into the
same pattern as alanine, histidine and tryptophan. Soybean Meal
and the Acetone Extracted Cottonseed Meal make one pair 'd
Cottonseed Meal 65 and Cottonseed Meal 59 make the other pair.
The digestibility of aspartic acid is no different in
Soybean Meal and Acetone Extracted Cottonseed Meal. However, Soy
bean Meal is significantly better than either Cottonseed Meal 65
or Cottonseed Meal 59. There is no significant difference in
digestibility of the aspartic acid in Acetone Extracted Cottonseed
Meal and Cottonseed Meal 65 but the digestibility of aspartic
acid in the Acetone Extracted Cottonseed Meal is significantly
better than that in Cottonseed Meal 59.
Again there is no significant difference in the digesti
bility of the valine in Soybean Meal and Acetone Extracted Cotton
seed Meal. The digestibility coefficient for Soybean Meal is
significantly higher than those for Cottonseed Meal 59 and Cotton
seed Meal 65. However, in this case the coefficient for Acetone
Extracted Cottonseed Meal was not significantly higher than the
other two cottonseed meals.
The digestibility coefficient for glycine, methionine,
and proline showed only chance variation from meal to meal.
Even though there were significant differences in the
digestibilities of many of these individual amino acids between
the various meals, no one meal was clearly separated from all the
other meals based on digestibility of all the amino acids. This
may be a confounding factor when the meals are evaluated for the

36
effect of protein in gain. Cottonseed Meal 59 was clearly separated
from all other in four cases; however, only two essential amino
acids were involved here— threonine and isoleucine. This observa
tion is of importance in interpreting the results of the chick assay
only if either or both of these amino acids are the first limiting
amino acids in the proteins. In general, there appears to be a
tendency for Soybean Meal and Acetone Extracted Cottonseed Meal to
form one pair based on digestibilities and Cottonseed Meals 65 and
59 to form another pair. However, as pointed out previously,
there is much overlapping in the parameters formed by the digestibi
lity coefficients of the various amino acids in these meals.
Chick Study
A summary of the protein evaluation study using the
chicks is presented in Table XIII, and a more complete set of data
is presented in Table XIX of the Appendix Section II. In Table
XIV is presented an analysis of variance of the protein efficiency
data from this study and the results of Duncan's Multiple Range
Test is presented in Table XV.
As shown in the analysis of variance, there was no
difference in protein efficiency due to type of diet used. There
was a significant difference due to protein level in favor of the
12 per cent protein diets. Even though there was a significant
difference due to protein level, the rank of the different meals
remained about the same between the two protein levels as evidenced
by the fact that there was no interaction between protein level and
meals.

37
TABLE XIII
SUMMARY OF PROTEIN EVALUATION STUDY USING CHICKS________
Average Protein Efficiency
Soybean Meal 3.32
Acetone Extracted Cottonseed Meal 2.62
Cottonseed Meal 59 1.U9
Cottonseed Meal 65 2.13
12% Protein 2.57
20$ Protein 2.35
Practical Type Diet 2.U5
Semi-Purified Type Diet 2 .h 7

38
TABLE XIV
ANALYSIS OF VARIANCE OF PROTEIN EFFICIENCY DATA1
Chick Study___________________Sources d.f. Mean Squares F
Replicates 2 1,059 1.16
Protein Level 1 5,9lil 6.51*Type Diet 1 52 0.06
Meals 3 95,272 10li. U&h;-
Rep. x Prot. Level 2 hh2 0.U9Rep. x Type Diet 2 195 0.21
Rep. x Meal 6 U30 0.b7Protein Level x Type Diet 1 U57 0.50
Protein Level x Meal 3 639 0.70
Type Diet x Meal 3 311 0.3UResidual 23 912
-xSignifleant (Probability at 5% level)
-SBfHighly significant (Probability at 1% level)
^ote the values used in this analysis of variance were coded in that the decimal was removed 2 places to the right in values used. For example the protein efficiency of 3.32 was used as the whole number 332.

39
TABLE XV
RESULTS OF DUNCAN MULTIPLE RANGE TEST ON MEANS OF MEALS
Shortest "Significant Range Values" Rp at 1% Level
P 2 3 h
rp 3.99 lul7 U.28
Rp 0.39 0.36 0.37
Rank of Mean of Meals
SM - Soybean Meal 3.32
AECSM - Acetone Extracted CSM 2,62
CSM 63- Cottonseed Meal 63 2.13
CSM 39- Cottonseed Meal 39 1.U9
Comparison of Means
SM vs. CSM 39 = 1.83#*SM vs. CSM 63 “ 1.19#*SM vs. CSM 39 = 0.70#*AECSM vs. CSM 39 = 1.13#*AECSM vs. CSM 63 = 0.1i9##CSM 63 vs. CSM 39 = 0.61*#*
**Highly significant (Probability at 1% level)

k o
Based on this study it would appear that it does not
make any difference whether protein supplements are compared in
a practical type or semi-purified type diet. Either a 12 or 20
per cent protein level would appear to be a satisfactory protein
level to evaluate various protein supplements.
All correlations on digested amino acids were based on
the assumption that the same digestibility was obtained in the
chick as in the hen. Admittedly this may be subject to some
question.
The association of the total intake of the 11 "essential
amino acids" with protein efficiency accounts for 79 per cent of
the variance, while the intake of the 18 amino acids accounts for
83 per cent of the variance. In the case of gain, these same
factors account for 91 per cent and 9$ per cent of the variance
respectively. The values obtained with digestible amino acid
intake were almost identical with those obtained with total amino
acid intake. They were as follows: The multiple correlation for
the association of the 11 "essential amino acids" and gain was
0.92 and with these amino acids and protein efficiency was 0.78.
The for all 18 of the amino acids with protein efficiency and
gain were 0.82 and 0.9k respectively.
It appears that the digestible amino acid intake was not
superior to total amino acid intake in predicting either gain or
protein efficiency. Gain was slightly more highly associated with
these values than was protein efficiency although both of these
criteria were highly associated with amino acid intake.

Since there was a significant difference in the digesti
bility of a number of these amino acids among meals, one would
expect to get a higher correlation with digested amino acids than
total amino acid intake. This was not obtained. One explanation
for this would be that the basic assumption of the same digestibi
lity for the chick and the hen is not correct. However, the con
founding effect previously mentioned— that no one of these meals
was consistently separated from all others on the basis of digesti
bility— would appear to be a plausible explanation. A lower digest
ibility figure for an amino acid does not necessarily result in this
amino acid being limiting. When gain or protein efficiency is
measured, the array of available amino acids is measured rather
than the individual amino acids. So, if there is no amino acid
deficiency created by lower digestibilities, then one would not
expect any higher correlation with digested amino acids than amino
acid intake.
The fact that no higher correlation was obtained with
total amino acid intake than with digestible amino acid intake
suggests that factors other than digestibility must be influencing
these results. The lack of variation in intake of certain amino
acids along with the lack of a particular pattern of deficiencies
attributable to any one protein supplement appear to be responsible,
at least in part, for the two measures of amino acid intake yielding
essentially the same results. It is also possible that differen
tial rates of release of various amino acids during digestion may
have influenced the performance of chicks fed these diets.

U2
In this study it was noted that in certain pens the
chicks started pecking each other around the beaks. This condi
tion was observed in a total of 5 pens. Four of these five pens
were receiving Cottonseed Meal 59> while the other pen was receiving
the Acetone Extracted Cottonseed Meal. Whether this is associated
with^ a particular deficiency is not known. Since it occurred
primarily on Cottonseed Meal 59 and this was the poorest quality
meal from the standpoint of amino acid digestibility and content;
it appears that this condition is more likely to occur where the
amino acid deficiency is most severe.
Another condition which was observed on the final weigh
day of this experiment was swollen abdomens in 6 chicks. Five of
these were submitted to the W. E. Anderson Livestock Diagnostic
Laboratory. According to a report by Dr. Herbert B. Elliott of
that Laboratory, the post mortem on the birds revealed body
weakness, listlessness, slight subcutis edema and severe abdominal
distension. The cultures were negative for Pasteurellosis,
Salmonellosis and Vibrio. Test for PFLO for 3 of these birds were
positive. They were negative for Newcastle's disease and Pullorum.
Also, test for coccidia was negative.
The known dietary factor common to all these chicks was
that all were removed from pens receiving semi-purified diets.
The next most common dietary factor was that U of these birds
were receiving diets containing Cottonseed Meal 65 and the other 2
were receiving diets containing the Acetone Extracted Cottonseed
Meal. These 6 birds were found in 5 different pens. None of the
U3
other birds in these pens appeared to be affected. The supply of
these cottonseed meals was exhausted, therefore it was not possible
to study this condition further.
Another abnormality noted, which had been previously
noted in this laboratory in a routine evaluation of a series of
cottonseed meals, was a condition which might be described as a
knobby feather condition. It was not severe in this study. How
ever, this condition appeared more in the pens receiving the
Cottonseed Meal $9 , which gave the lowest gain and poorest protein
efficiency. This was also the case in the previous study when
this was first observed. One postulated reason for this abnormal
feather development is the lack of available amino acids to give
an even rate of growth of the feathers. Other body processes may
be taking priority over feather development causing brief periods
of retarded feather growth which might be responsible for the
enlargement. However, these data do not suggest any explanation
for this condition.

SUMMARY AND CONCLUSIONS
Using surgically modified hens, the digestibility of 18
commonly occurring amino acids were determined in three samples of
cottonseed meal and a sample of commercial soybean meal. The
digestibility coefficients of all the amino acids checked were
found significantly different among meals except glycine,
methionine and proline. Basically this is in agreement with
Kuiken's (1952) work with the rat. However, no difference was
observed in digestibility of methionine which he found. One of
the weakest points of this procedure was the analysis for the
sulfur containing amino acids; therefore, methionine differences
may have existed and were not detected.
In most cases either Soybean Meal or Acetone Extracted
Cottonseed Meal had the highest digestibility coefficient. How
ever, there was no clear line of separation.
These same meals were used in chick growth studies and
protein efficiency was determined. There was a significant
difference in protein efficiency due to protein level and meals.
The type diet (Practical or Semi-purified) used to study protein
efficiency made no difference. Although the protein efficiencies
were higher on the 12 per cent protein level; protein level did
not change the rank of the various meals. Soybean Meal was
111*

superior followed in order by Acetone Extracted Cottonseed Meal,
Cottonseed Meal 65 and Cottonseed Meal 59.
In the multiple correlation studies, gain appeared to
be a slightly better measure of protein value than protein
efficiency. There appeared to be a slightly higher multiple
correlation between all 18 amino acids and gain or protein
efficiency than just the 11 "essential amino acids".
No difference was found in the multiple correlation
studies between the use of total intake of amino acids or digested
amino acids. One explanation for this is that no one meal was
clearly separated from another on the basis of amino acid
digestibility. Another factor that could be involved is the
lack of variation in amino acid intake.
If these digestibility figures can be assumed to be
correct, it is evident that the various amino acids within a
protein can and do vary considerably in their digestibility. It
is also true that a particular protein supplement such as cotton
seed meal can vary considerably in the total content of particular
amino acids from one sample to another. These factors are
certainly important in the formulation of adequate diets for
chickens.
SELECTED REFERENCES
Allison, J. B. 1955. Biological evaluation of proteins. Physiol. Rev. 35:665-700.
Bender, A. E. I960. Correlation of amino acid composition with nutritive value of proteins. Clin. Chim. Acta. 5:1-5.
Block, R. J. and K. W. Wiess. 1956. Amino acid handbook.Charles C. Thomas, Springfield, Illinois.
Deshpande, P. D., A. E. Harper and C. A. Elvehjem. 1958. Amino acid imbalance and nitrogen retention. J. Biol. Chem. 230: 335-352.
Frampton, V. F. 1961. Personal Communication.
Gray, J. A., E. M. Olsen, D. C. Hill and H. D. Branion. I960. Effect of a dietary lysine deficiency on the concentration of amino acids in the deproteinized blood plasma of chicks. Can. J. Biochem. Physiol. 38:535-551.
Hamilton, P. B. 1958. Ion exchange chromatography of amino acids — effect of resin particle size on column performance. Anal. Chem. 30:915-919.
Harper, A. E. 1959. Amino acid balance and imbalance. 1. Dietary level of protein and amino acid imbalance. J. Nutrition 68:505-518.
Henderson, L. M. and E. E. Snell. 1958. A uniform medium for determination of amino acids with various microorganisms.J. Biol. Chem. 172:15-29.
Johnson, D., Jr. and H. Fisher. 1956. The amino acid requirement of the laying hen. II. Classification of the essential amino acids required for egg production. J. Nutrition 60:275-282.
Klain, G. J., H. M. Scott and B. C. Johnson. 1958. The amino acid requirement of the growing chick fed crystalline amino acids. Poultry Sci. 57:976-977.
Kuiken, K. U. 1952. Availability of the essential amino acids in cottonseed meal. J. Nutrition 56:13-25.
56

Kumta, U. S. and A. E. Harper. 1961. Amino acid balance and and imbalance. VII. Effect of dietary additions of amino acids on food intake and blood urea concentration of rats fed low-protein diets containing fibrin. J. Nutrition 75:139-157.
Le Clerg, E. L. 1957. Mean separation by the functional analysis of variance and multiple comparisons. U. S. Dept, of Agriculture. ARS-30:3.
Longenecker, J. B. and N. L. Hause. 1959. Relationship between plasma amino acid and composition of the ingested protein.Arch. Biochem. and Biophys. 85:56-59.
Lucas, H. L. 1957. Extra-period latin-square change-over design.J. Dairy Sci. 50:225-239.
Moore, S. and W. H. Stein. 1958. Photometric ninhydrin method for use in the chromatographv of amino acids. J. Biol. Chem. 176: 367-388.
Moore, S. and ¥. H. Stein. 1955a. Procedures for the chromatographic determination of amino acids on four percent gross linked sulfonated polystryrene resins. J. Biol. Chem. 211: 893-906.
Moore, S. and W. H. Stein. 1955b. Reagent for the photometricdetermination of amino acids and related compounds. J. Biol. Chem. 211:907-913.
Moore, S., D. H. Spockman and W. H. Stein. 1958. Chromatography of amino acids on sulfonated polystyrene resins— an improved system. Anal. Chem. 30:1185-1190.
National Research Council. 1955. Nutrient Requirements Domestic Animals. No. 1. Nutrient Requirements for Poultry.
Richardson, C. E., A. B. Watts, W. S. Wilkinson and J. M. Dixon. I960. Techniques used in metabolism studies with surgically modified hens. Poultry Sci. 39:532-51:0.
Rosenberg, H. R. and J. T. Baldini, 1957. Effect of dietary protein level on the methione-energy relationship on broiler diets. Poultry Sci. 36:257-252.
Rubins, R. K., K. L. Baringer and D. B. Skau, 1957. Improved cottonseed meals for feeding poultry and swine 1955-55.U. S. Dept, of Agriculture. ARS-72-10. pp 55-56.

hQ
Sauberlich, H. E. 1956. Amino acid imbalances as related to methionine, isoleucine, threonine and tryptophan requirement of rat or mouse. J. Nutrition 59:353-370.
Stephenson, E. L. 1956. Amino acid interrelationship. Poultry Sci. 35:117U (Abstract).

APPENDIX SECTION I
CHROMATOGRAPHIC ANALYSIS OF AMINO ACIDS
19

CHROMATOGRAPHIC ANALYSIS OF AMINO ACIDS
Introduction
The method used was that developed by Moore, Stein, and
associates. Various aspects of this method have been described in
a series of publications by these authors beginning in 19U8. This
method is described below along with certain modifications used in
this study.
Resin
Type II Amberlite IR-120 (CG-120) produced by Rohm and
Haas Co. and marketed through the Fisher Scientific Co. was used
in this study.
Separation of Particles of the Appropriate Size (Moore et al., 1958)
One pound of the dry sodium salt of the resin, as pur
chased, was transferred to a jar containing 10 liters of water.
Resin present in the foam after the initial stirring of the mixture
was transferred to a beaker, treated with a little acetone, and
added back to the main suspension. After thorough distribution of
the resin in the water, the mixture was allowed to settle for about
six hours. Then the supernatant suspension, which contains very
fine particles of resin, was withdrawn by suction. The resin was
suspended and resettled four times. The product was then transferred
50

5i
to a large Buchner funnel and washed slowly with 2 liters of
U N HC1 and 500 ml. of water. The moist resin was then suspended
in 2 liters of 2 N NaOH, and the mixture was heated in a steam
bath for 1 hour. The resin was finally collected on a Buchner
funnel and washed with water until neutral.
Without discussing the equipment used for the hydraulic
separation of the particles as described by Hamilton (1958) the
process is briefly as follows: About lj.00 ml. of the settled resin,
prepared as described above, was suspended in water to give a total
volume of about 1 liter and was transferred to the 2 liter separa
tory funnel. The water tube which allows water to enter the bottom
of the separatory funnel, was opened and flow at full speed (about
600 ml. per minute) was started through the funnel. When the funnel
was about 3/U full, the rate of flow was reduced to 110 ml. per
minute by means of the needle valve, and maintained at this rate
until no more particles could be seen leaving the outlet tube.
The resin removed at this flow rate was collected in a large jar
and permitted to settle out.
The flow rate was increased to 280 ml. per minute. The
resin that came over under these conditions was termed Fraction C.
Similarly, Fraction D was collected after the flow rate was raised
to 580 ml. per minute. Each of these collected fractions was sub
fractionated using the flow rate just under which they were
collected. For example, Fraction C, which was collected at a flow
rate of 280 ml. per minute, was recycled at 110 ml. per minute.
Anything coming over at 110 ml. per minute was added to Fraction B

52
(initially obtained at 110 ml. per minute). Any material remaining,
after 280 ml. per minute, was added to Fraction D (580 ml. per
minute). This procedure was applied to Fraction C and D since
they were the only two fractions used.
Fractions of resin that were to be stored for later use
were suspended in 0.2 N NaOH and kept in dark bottles at about
U0° C.
Preparation of Ion Exchange Columns
The 150 cm. column was poured with the Fraction D (580 ml.
per minute) obtained by the hydraulic fractionation of the powdered
Amberlite IR-120. About 100 ml. of settled resin is required for
each 150 cm. column.
The resin to be used was washed on a Buchner funnel with
about 1 liter of approximately b N HC1 per 200-300 ml. of settled
resin in order to remove metal ions that may have been absorbed
from the tap water during the fractionation. After washing with
water, 2 N NaOH was percolated through the resin cake until the
filtrate was strongly alkaline. The sodium salt of the resin was
washed with water and then with several hundred ml. of 0.2 N buffer
at pH b.25 (without BRIJ 35 or thiodiglycol) until the filtrate was
about pH b.O.
In the packing of the 150 cm. column, considerable deviation was made from the method described by Moore £t al. (1958).
About 300 ml. of settled resin was placed in a 1000 ml. aspirator
bottle; to which about 300 ml. of boiled buffer, pH b.25 (without

53
BIJR 35 or thiodiglycol) was added. By use of a polyethylene
covered magnetic slug and a magnetic stirrer to keep this
thoroughly mixed, the 150 cm. column was poured in one continuous
operation. After stirring was started, the lower opening in the
aspirator bottle was opened to the column and about 25 cm. of
pressure was applied to the top of the bottle.
Before use, the new 150 cm. column was washed with
0.2 N NaOH and equilibrated with boiled buffer at pH 3.25 as
described below for the regeneration of the columns. Both of
these operations can be carried out at room temperature. The
rate of flow at 50° should then be checked.
According to Moore et al. (1958), if the column is too
tight to permit delivery of 12 ml. of effluent per hour under 20
to 1+0 cm. pressure, the resin is withdrawn from the tube and some
of the finest particles removed by settling or by refractionation,
and the column re-poured. If the column permits a much faster
flow rate than 12 ml. per hour at 20 cm. pressure, a test chroma
tographic may be run, but the column is likely too loose to give
desired resolving power. Flotation to remove more of the larger
particles would then be required.
The columns used in this study allowed a flow rate of
about 11+-15 nil. per hour at 20 cm. pressure. This probably means
that there were some particles too large, which should have been
removed. These larger particles probably account for these
columns not having as great a capacity as those described by
Moore et al. (1958).

5U
The 15 cm. columns were poured in one or two sections,
with Fraction C resin (280 ml. per minute) that had been slurried
in 0.35 N buffer at pH 5.28. An extension was made with a glass
tube about the size of the column and connected to the column by
means of a rubber tube to give the necessary length for packing.
A pressure of 25-30 cm. was used to pack this column. This column
was equilibrated before use with 5.28 boiled buffer (without BRIJ
35 or thiodiglycol).
Buffers
The buffers used were made up according to the specifica
tions given by Moore et al. (1958). The buffers were prepared in
17 liter quantities and stored in an air-conditioned laboratory
at approximately 21-22° C. without any apparent difficulties.
357.0 gms. Ili0.3 gms.181.1 gms.17.0 liters17.0 gms.
357.0 gms. 1^0.3 gms.85.0 ml.17.0 liters17.0 gms.
ijl7.U gms. 2i|ii.8 gms. 115.6 ml.17.0 liters17.0 gms.
Buffer pH 3.25 ± 0.01
Citric Acid . H2O AR NaOH (97%) AR HC1 (Cone.)Final Volume Phenol added
Buffer pH h .2 $ t 0.02
Citric Acid . H2O AR NaOH (97%) AR HC1 (Cone.)Final volume Phenol added
Buffer pH 5.28 ± 0.02
Citric Acid . H~0 AR NaOH (97%) AR HC1 (Cone.)Final volume Phenol added

55
If adjustment of pH is necessary, addition of 1 ml. of
$0% NaOH or 2 ml. of conc. HC1 caused a change of about 0.02 pH
units.
Buffer for immediate use was kept in a 500 ml. separatory
funnel fitted with a stopcock and connected to the top of the
column. In order to prevent the formation of bubbles in the resin
bed, which would occur as a result of the release of air when the
buffers are heated to 50° C., a 500 ml. quantity of buffer was
brought to a boil and added while hot to a separatory funnel and
about 50 ml. of mineral oil was layered over the buffer. A long- stem funnel was employed to introduce subsequent lots of boiled
buffer below the level of the oil.
Just before the buffer came to a boil thiodiglycol was
added to the two buffers for the 150 cm. column at the rate of 1 ml.
per 100 ml. of buffer, but no thiodiglycol was added to the buffer
for the 15 cm. column.
The thiodiglycol used was a technical grade purchased
from the Matheson Co. and was not purified. Some thiodiglycol
on which an attempt was made at purification went bad after standing
for a few months and caused very high blanks.
No BRIJ 35 detergent solution was used in any case.
Operation of the 150 Cm. Column
1. The column was prepared for re-use by eluting with
0.2N NaOH. This was accomplished by gravity flow overnight, or by
a few cm. of pressure until the visible advancing front of NaOH
was more than half-way down the column.

56
2. It was re-equilibrated for the next analysis by
following the NaOH elution with about 150 ml. of buffer at pH
3.25.3. Place sample on column, Moore and Stein (I95ba).
Optimum recommended load is 0.5 to 1.0 micromole per amino acid
or 1 to 2 mg. of hydrolyzed protein, Moore et_ aCL. (1958). The
separation was very poor if the lower limit of the recommended
load was exceeded.
The sample was placed on the column by means of a pipette,
letting it run down the inner wall of the column, then driven
down by about 10 cm. pressure to almost complete dryness, about 1
ml. of the initial buffer was added in the same manner that the
sample was added. It was then driven down in the above manner.
A second aliquot of buffer was added in the same manner and the
above process i-ias repeated. Then a few ml. of the buffer was
added by pipette before connecting with the separatory funnel.
L,. The initial buffer at pH 3.25 was introduced; the
column was maintained at 50° C. throughout the analysis. A
flow rate of about 10 to 12 ml. per hour was maintained.
5. An eluent at pH it.25 was introduced at a time
designed to allow valine to emerge with the new buffer. The
change was made at an effluent volume 2.15 times that which the
aspartic acid peak was emerged, or about 250 ml.
6. About 500 ml. of eluent was collected and then
analysed photometrically.

57
Mote: Buffers for the 150 cm. column were boiled for a short
period without appreciable change in total volume after the addition
of thiodiglycol (l ml./lOO ml. of buffer).
Operation of the 15 Cm. Column
1. Normally this column can be used repeatedly without
regeneration, since most samples do not contain any ninhydrin-positive
constituents with a greater retardation than arginine. Regeneration,
if required, can be accomplished with 10 ml. of 0.35 N NaOH.
2. If NaOH was used, then it was re-equilibrated by
running about 80 ml. of the buffer at pH 5.28 through the column
before re-use.
3. The sample was placed on the column in the same manner
described for the 150 cm. column. Only about one-half as much amino
acids or hydrolyzed protein was used on the 150 cm. column.
h. Elution was carried out at 50 degrees with a buffer
at a pH 5.28 and flow rate of 25 to 30 ml. per hour. About seventy
2-ml. samples were collected and analyzed photometrically.
Note: The position of histidine is fairly sensitive to pH,
and adjustments of buffer at pH 5.28 may be necessary to center
peak between those of lysine and ammonia.
Note: No thiodiglycol was used in the buffer for the 15 cm.
column.
Analysis of Effluent Fraction (Moore and Stein, 195Ua)
1. One ml. of modified ninhydrin was added to each tube
containing 2 ml. of collected material.

58
2. Tubes were capped and shaken about 10 seconds by-
hand, and boiled for 15 minutes (accurately- timed) in a covered
water bath at 100° C.
3. Then 5 ml. of 50:50 ethanol-water was added to each
tube. If this did not bring the optical density to 1.0 or less,
5 or 10 ml. more was added.
U. After this dilution they were cooled to below 30° C.
in front of an electric fan.
5. After cooling they were shaken for about 30 seconds in
a mechanical shaker.
6. They were read at 570 mu. except for proline which
was read at UUO mu.
Note: With the modified reagent the blank readings for the
sample containing 2 ml. eluent and 1 ml. of ninhydrin solution
were between 0.05 to 0.10 on the optical density scale for the long
column. The 15 cm. column blanks read about 0.135 to 0.150 on the
optical density scale. These are read against the 50:50 ethanol-
water blank.
The blank or base-line tubes against which the peak
tubes are read are usually chosen from tubes before or after the
peak. In the case of methionine, isoleucine, and leucine; the
blank was chosen from fraction emerging after the leucine peak.

59
Preparation of Ninhydrin (Moore and Stein, 195^b)
1. Twenty gms. of ninhydrin and 3 gms. of hydrindantin
were dissolved in 750 ml. of methyl cellosolve^ (monomethyl ether
of ethylene glycol). Both ninhydrin and hydrindantin were obtained
from Pierce Chemical Co., Rockford, 111.
2. Then 250 ml. of U N sodium acetate buffer^ at pH 5.5
was added and the resulting reagent solution was immediately trans
ferred to a 1 liter dark bottle arranged to permit the solution to
be stored under nitrogen.
Photometer Tubes
The tubes used in this procedure were matched from pyrex
tubes (15 x 125 mm.), without lips. A solution of methyl red in
0.03 N HC1 of such strength as to give a reading at 525 mm. of 0.6
to 0.7 on the optical density scale against a water blank was used.
About 5 ml. of this solution was added to each tube by means of a
^Each lot was tested for peroxide content by adding 2 ml.of Ine solvent to 1 ml. of freshly prepared h% aqueous KI. A colorless to light straw-yellow test indicated it was satisfactory from a peroxide point of view.
Another simple test that it should pass is that it be completely soluble in an equal part of water. If not, it results in acolloidial suspension in the blanks and peaks.
2The b N sodium acetate buffer (pH 5.5) was prepared by adding to 2 liters of water 2720 gms. of NaQAc.3 H20 (reagent grade)and stirred on a hot water bath until the solution was complete.Then it was cooled to room temperature and 500 ml. of glacial acetic acid was added. It was then made up to a final volume of 5 liters. The solution should be at pH 5.5l * 0.03. If final adjustmerit isnecessary, 5 gms. of NaOH corresponds to about O.OI4 pH unit. Thebuffer was successfully stored at 20-22° C. without a preservative.
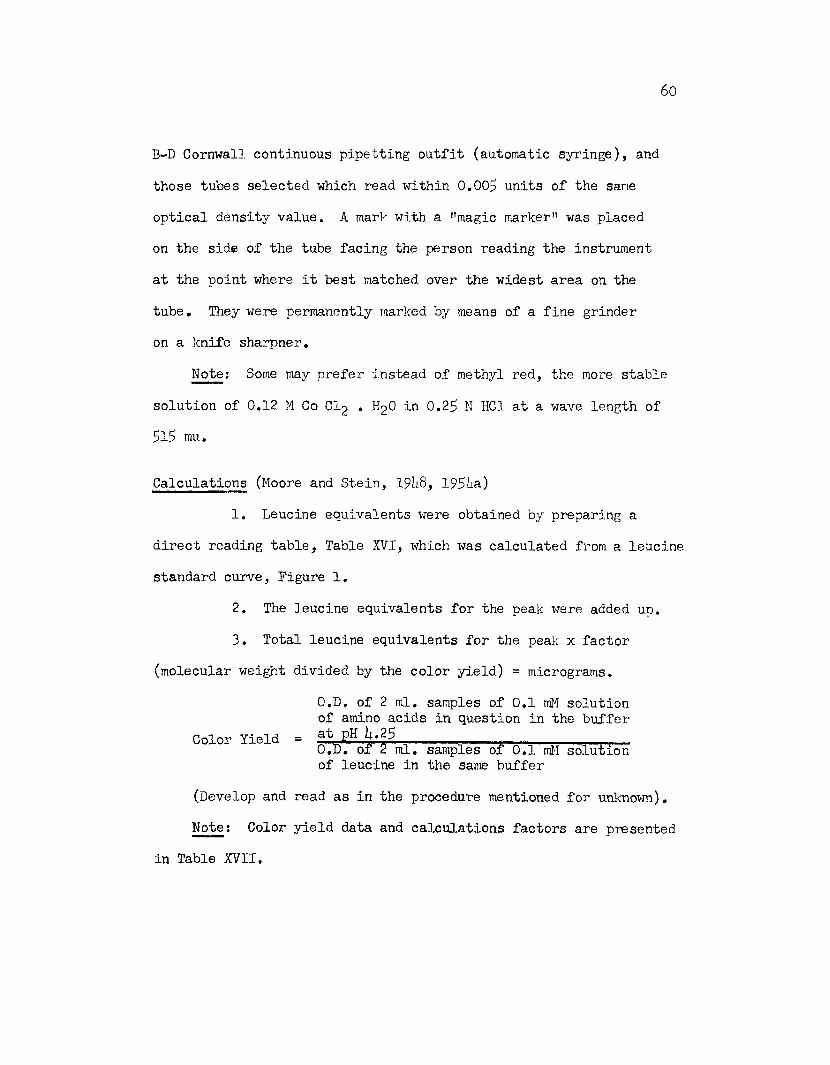
60
B-D Cornwall continuous pipetting outfit (automatic syringe), and
those tubes selected which read within 0.003 units of the same
optical density value. A mark with a "magic marker" was placed
on the side of the tube facing the person reading the instrument
at the point where it best matched over the widest area on the
tube. They were permanently marked by means of a fine grinder
on a knife sharpner.
Note; Some may prefer instead of methyl red, the more stable
solution of 0.12 M Co CI2 . H2O in 0.23 N HC1 at a wave length of
5l5 mu.
Calculations (Moore and Stein, 19U8, 19Sha)
1. Leucine equivalents were obtained by preparing a
direct reading table, Table XVI, which was calculated from a leucine
standard curve, Figure 1.
2. The leucine equivalents for the peak were added up.
3. Total leucine equivalents for the peak x factor
(molecular weight divided by the color yield) = micrograms.
O.D. of 2 ml. samples of 0.1 rriM solutionof amino acids in question in the buffer
Color Yield = ^.P,11, ,---- ----------------O.D. of 2 ml. samples of 0.1 mM solutionof leucine in the same buffer
(Develop and read as in the procedure mentioned for unknown).
Note; Color yield data and calculations factors are presented
in Table XVII.

61
Preparation of Leucine Curve (Moore and Stein, 19b8)
A standard curve was plotted by utilizing 2 ml. samples
of leucine (0.028 to 0.20 triM) in 0.1 M citrate buffer at pH £.0.
These 2 ml. samples were run in triplicate and developed in the
usual manner as described previously. By establishing eight
points a standard curve was plotted.
From this standard curve a direct reading table was
prepared giving 2 X micromoles per liter corresponding to optical
density readings from 0.01 to 1.00, in steps of 0.01 units. The
concentrations were multiplied by 13/8 and 18/8 to give concentra
tions corresponding to the readings obtained after dilution of the
8.0 ml. sample with one and two additional 5 ml. aliquots of the
diluent.
For example, on the standard curve an optical density
reading of 0.100 intersects the curve to correspond to .OlU mM
concentration. In order to make this a direct reading table for
2 ml. samples, this is multiplied by 2 to give .028 mM. Therefore,
a 2 ml. sample after developing with only 5 ml. of diluent would
contain 28 micromoles per liter of leucine equivalents. To obtain
micromoles for one additional aliquot of diluent 28 X 13/8 = U6
and for two additional aliquots of diluent it is 28 X 18/8 = 63.
The buffer was prepared from 11.5 gms. of citric acid.
H2O (reagent grade) and 200 ml. 0.5 N NaOH. The total volume was made up to 500 ml. with distilled water.
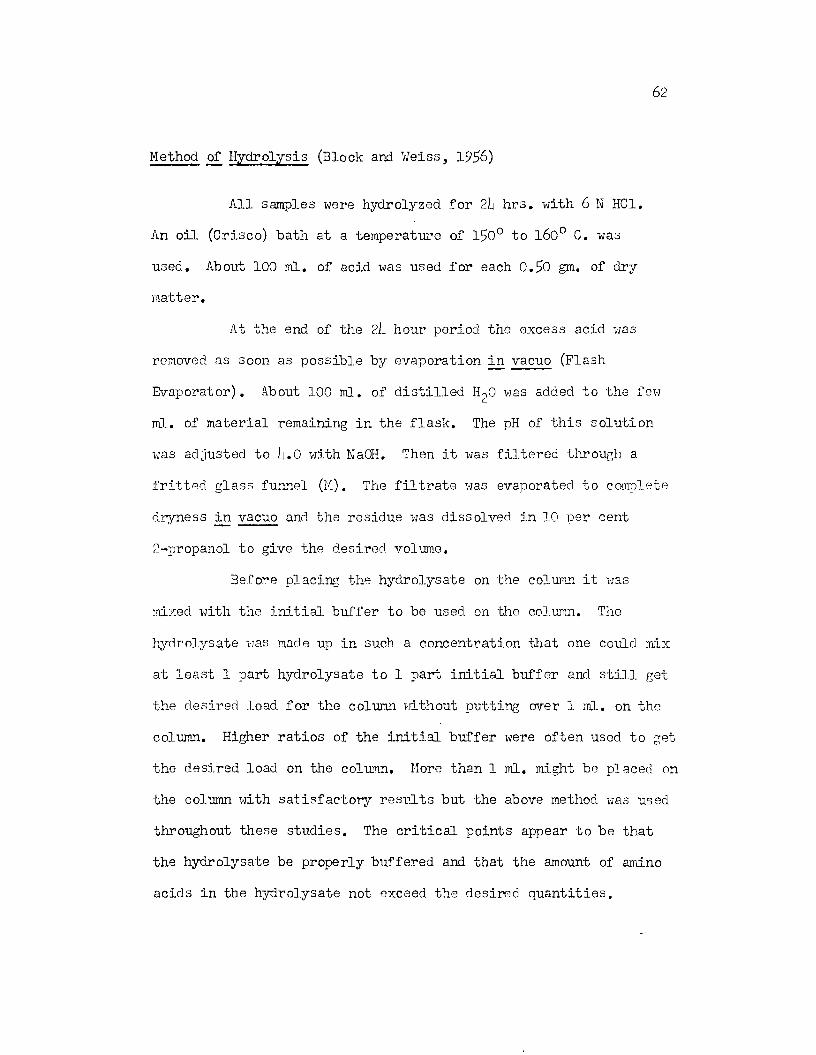
62
Method of Hydrolysis (Block and Weiss, 1956)
All samples were hydrolyzed for 2lj hrs. with 6 N HC1.
An oil (Crisco) bath at a temperature of l50° to l60° C. was
used. About 100 ml. of acid was used for each 0.50 gm. of dry
matter.
At the end of the 2h hour period the excess acid was
removed as soon as possible by evaporation in vacuo (Flash
Evaporator). About 100 ml. of distilled I^O was added to the few
ml. of material remaining in the flask. The pH of this solution
was adjusted to li.O with NaOH. Then it was filtered through a
fritted glass funnel (M). The filtrate was evaporated to complete
dryness in vacuo and the residue was dissolved in 10 per cent
2-propanol to give the desired volume.
Before placing the hydrolysate on the column it was
mixed with the initial, buffer to be used on the column. The
hydrolysate was made up in such a concentration that one could mix
at least 1 part hydrolysate to 1 part initial buffer and still get
the desired load for the column without putting over 1 ml. on the
column. Higher ratios of the initial buffer were often used to get
the desired load on the column. More than 1 ml. might be placed on
the column with satisfactory results but the above method \-ias used
throughout these studies. The critical points appear to be that
the hydrolysate be properly buffered and that the amount of amino
acids in the hydrolysate not exceed the desired quantities.

TABLE XVICONVERSION TABLE
2cc Sample Concentration in 2X micro-moles/literlcc Ninhydrin____________________________ Leucine Equivalent
100 xOD Reading
Concentration Concentration Concentration | ConcentrationUndiluted +5cc +10cc
100 xOD Reading
Undiluted +5cc +10cc
100 xOD Reading
Undiluted +5cc +10cc
100 x OD Reading
Undiluted +5cc +10cc
1 3 5 7 26 71* 120 167 51 li*5 236 326 76 216 351 1*862 6 10 lli 27 76 121; 171 52 ll*8 21*1 333 77 220 358 1*973 8 13 18 28 80 130 180 53 151 21*5 31*0 78 222 361 500U 12 20 27 29 82 133 185 51* 151* 250 3h7 79 226 367 5085 111 23 32 30 85 138 191 55 157 255 353 80 228 371 5156 17 28 38 31 88 lli3 198 56 160 260 360 81 231 375 5227 20 33 U5 32 91 lli8 205 57 162 263 365 82 231* 380 5298 23 37 52 33 9U 153 212 58 165 268 371 83 237 385 5339 26 U2 57 3li 96 156 216 59 168 273 380 81* 2h0 390 51*2
10 28 li6 63 35 100 163 225 60 171 282 385 85 2k2 393 51*5
li 31 5o 70 36 102 166 230 6l 173 281 389 86 2I4.6 1*00 551*12 35 57 79 37 105 171 236 62 177 288 398 87 21*8 1*03 55813 37 60 83 38 108 176 2U3 63 180 293 1*07 88 252 klO 567Hi 1*0 65 90 39 ill 180 250 61* 182 296 1*11 89 251* 1*13 57215 li2 68 95 liO H U 185 257 65 185 301 las 90 257 1*18 578
16 U5 73 101 111 117 190 263 66 188 306 1*25 91 260 1*23 58517 li8 78 108 1*2 120 195 270 67 191 310 1*30 92 263 1*27 59218 51 83 115 ii3 122 198 275 68 191* 315 1*37 93 266 1*32 59919 5ii 88 122 lili 125 203 283 69 197 320 U*3 9k 268 1*36 60620 57 93 128 li5 128 208 288 70 200 325 1*50 95 271 1*1*0 610
21 60 98 135 li6 131 213 295 71 202 328 1*55 96 271* 1*1*5 61722 62 101 m o ii7 131* 218 303 72 205 333 U61 97 277 1*50 62323 66 107 lli 9 li8 136 221 307 73 208 338 1*70 98 280 1*55 6302ii 68 111 153 1*9 139 226 313 71* 211 31*3 1*75 99 283 1*60 63725 71 115 160 50 11*2 231 320 75 211* 3U8 1*82 100 286 1*65 61*1*

6b
TABLE XVII
COLOR YIELD DATA AND CALCULATION FACTORSMol. Wt. Color Yield Calculation
Factor1-
Aspartic acid 131.1 .98 133.8Threonine 119.1 .93 128.0
Serine 103.1 .91* 111.8
Glutamic acid 1JU7.1 .98 130.1
Proline 113.1 .23 300. bGlycine 73.0 .93 78.9Alanine 89.1 .96 92.8
Cystine 2U0.3 1.12 21b.6
Valine 117.2 1.02 lib.9Methionine 11*9.2 1.00 lb9.2
Isoleucine 131.1 1.00 131.1Leucine 131.1 1.00 131.1Tyrosine 181.2 0.9b 192.8Phenylalanine 163.2 0.96 172.0Lysine 11*6.2 1 .06 137.9Histidine 133.2 0.9b 163.1Arginine 17b.2 1.02 170.8Cysteic acid 169.1 0.992 170.8Methionine sulfane 181.2 1.022 177.6
Methionine sulfoxide 163.2 0.982 168.3
■^Molecular weight divided by the color yield 2Taken from Moore and Stein data.

OPTICAL
DENS
ITY
1.0
Figure 1. Leucine Standard Curve
0.8
0.6
O.U
0.2
0.00 0.02 O.Ol* 0.06 0.08 0.10 0.12 ^
CONCENTRATION (Micromoles)

APPENDIX SECTION II
TABULAR EXPERIMENTAL DATA
66

TABLE XVIII
HEN DIGESTION TRIAL DATA
Per.No.
HenNo.
DietDesignation
FeedConsumed
gm.
Total N Intake
gm.
FecesExcretedWet
Total Feces Dry Matter
gm.
Total Fecal Nitrogen Excreted gm.
Apparent Digestibility %
UrineMl.
Total Urine N
gm.
RetainedNgm.
A 2o NPD 33 O.Oi+2 28 3.2+66 0.118 160 0.363 -0.2391 b o 1 176 3.113 110 16.060 0.303 90.2 180 0.213 2.3951A b o NPD 121 0.113 31 10.332 0.120 132 0.138 -0.1252 b o 2 123 2.038 82 16.777 0.362 82.2 132 0.293 1.1832A h o NPD 122 0.098 32 10.832 0.103 202 0.320 -0.3253 bO 3 172 3.130 119 18.21+3 0.323 89.0 193 0.390 2.1953A b o NPD 66 0.031 3 b 7.011+ 0.090 100 0.268 -0.3072 b o b 116 1.833 108 23.173 0.322 71.2 137 0.293 0.8162a b o NPD 113 0.090 36 11.732 0.131 133 0.260 -0.3013 b o b 102 1-61*3 82 16.621 0.202 73.2 122 0.278 0.761
A b 2 NPD 33 0.0U2 12 1.693 0.006 291 0.728 -0.6921 22 2 195 3.179 126 27.306 0.309 82.0 218 ' 1.268 1.2021A b 2 NPD 132 0.122 33 10.236 0.132 189 0.228 -0.2782 b 2 b 200 3.160 131 26.632 0.631 80.0 266 1.322 1.2052A1 b 2 NPD 132 0.122 38 7.279 0.138 310 _____23 b 2 1 183 3.239 102 13.638 0.322 90.0 172 1.033 1.8623A b 2 NPD 1 h h 0.113 32 12.128 0.128 321 0.612 -0.6252 b 2 3 183 3.331 66 6.292 0.123 96.3 310 1.092 2.1122A 1x2 NPD 127 0.118 37 12.187 0.123 186 0.225 -0.2523 b 2 3 186 3.383 111 12.683 0.323 89.8 232 1.192 1.828
ON

TABLE XVIII (Continued)
Per.No.
HenNo.
DietDesign-
FeedConsumedgm.
Total NIntakegm.
FecesExcretedWet
Total Feces Dry Matter
gm.
Total Fecal Nitrogen Excreted gm.
Apparent Digestibility %
UrineMl.
Total Urine N
gm
RetainedNgm.
A 1+3 NPD 92 0.07h 1+3 5.990 0.175 90 0.1+15 -0.5161 13 3 H+3 2.603 97 11+.026 0.278 89.3 ll+l 1.095 1.2301A h3 NPD 151 0.121 71 16.018 0.11+7 161 0.270 -0.2962 h3 1 li+O 2.1+78 121+ 18.997 0.1+11+ 83.3 136 1.253 0.8112A k3 NPD 150 0.120 70 16.373 0.165 167 0.1+13 -0.1+583 h3 b 181+ 2.907 98 21.511 0.1+1+7 81+. 6 190 1.175 1.2853A k3 NPD H+9 0.119 53 11.1+1+8 0.137 3 173 0.290 -0.3081+ h3 2 26 0.1+21+ 101 18.392 0.1+25 101+ 1.075 -1.0761+A h3 NPD 135 0.108 55 11.798 0.122 179 0.238 -0.2525 h3 2 195 3.218 182 33.652 0.717 77.7 210 0.978 1.523A hb NPD b3 0.03h 21 3.551 0.113 127 0.728 -0.8071 bk b 12 3 1.91+3 137 31.003 0.682 61+.9 83 0.755 0.5061A hb NPD 11+2 0.111+ 63 10.697 0.165 113 0.178 -0.2292 hb 3 180 3.276 123 19.889 0.381+ 88.3 175 0.870 2.0222A hb NPD 35 0.028 13 2.159 0.039 211+ 1.295 -1.3063 hb 2 178 2.901 11+8 28.653 0.510 82.7 162 1.003 1.3883A bb NPD 108 0.086 69 13.611+ 0.150 11+3 0.173 -0.2371+ bb 1 181 3.201+ 11+9 19.832 0.1+68 85.a 160 1.178 1.5581+A bb NPD 102 0.082 63 12.11+6 0.131 152 0.363 -0.1+125 hb 1 169 2.991 11+8 19.311+ 0.1.1+1+ 85.2 126 0.970 1.58
^Based on a three day collection period.?Mixed sample with other urine and could not get accurate assay.This bird dropped down in feed consumption and went into negative nitrogen balance.

111222333bhb333666777888
69
TABLE XIX
PROTEIN EVALUATION STUDY (Chicks)
Practical Type DietPen Mortality Feed Cons. Gain Protein Eff. No.
1 0 1732 797 3.7913 0 1738 79k 3.7620 0 1733 766 3.607 0 1093 378 2.88
11 0 1291 bl2 2.6619 0 lnlt 333 2.663 0 868 188 1.80
10 1 788 11*7 1.3317 0 99b 22b 1.883 0 903 208 1.92
16 0 998 219 1.8323 0 1032 2b9 2.018 0 2313 1878 3.7b
lii 0 2728 1908 3.b82b 0 267U 1796 3.366 0 1303 330 2.11
12 0 1379 621 2.2321 0 Uj2lt 689 2.b22 0 973 317 1.639 0 1001 317 1.38
18 0 1096 37b 1.71It 1 1203 b96 2.06
13 0 lb79 393 2.0122 0 1U3U 390 2.06

70
TABLE XIX (Continued)
Semi-Purified Type Diet
DietNo.
PenNo.
Mortality Feed Cons, gms.
Gain Protein Eff.
9 29 0 1679 791 3.889 36 0 1599 676 3.529 i*e 0 1173 610 h.33
10 30 0 11*23 5814 3.1*210 39 0 1273 333 2.1810 ia- 0 11*1*5 1*1*8 2.5811 25 2 728 85 0.9711 37 1 6o5 95 1.31-11 1|2 1 655 135 1.7012 28 1 958 321 2.7912 35 1 983 310 2.6312 U6 0 1058 252 2.0213 27 0 2113 1397 3.3113 33 0 2313 1518 3.2713 1*1* 0 21*21 1527 3.151U 26 1 1992 1170 2.91*lit 1*0 0 2037 111*8 2.81ll* h i 0 1926 981 2.5515 31 0 1065 286 1.31*15 38 1 986 257 1.3015 1*8 0 871 188 1.0816 32 0 ll*ll* 590 2.0916 3U 1 ll*05 51*1 1.9316 1*3 0 1389 597 2.15
Note: Diet numbers are identified in Table 711 of themain body.

AUTOBIOGRAPHY
I was b o m June 11, 1928, the first son of Jesse Davis
and Vera Vesta Miner of Waldo, Arkansas. I graduated from Waldo
High School in 19U6. Following graduation I entered Southern
State College, Magnolia, Arkansas, and completed the two year
agricultural program. I then taught about two years in the
Veterans Farm Training Program at Waldo, Arkansas.
I entered the University of Arkansas in September 1951
and obtained my B. S. in General Agriculture in 1953. I then
obtained an assistantship in the Department of Animal Industry to
work in nutrition where I received my Master of Science in 1951*.
Shortly after receiving my M. S., I entered the Army for
a two year tour of duty, most of which was spent at the Walter
Reed Army Institute of Research.
After my separation from the Army, I was employed by the
U. S. Department of Agriculture in the Poultry Research Branch
at Beltsville, Maryland.
On June 21, 1957 > I married the former Betty Jane Foster
of Washington, D. C. We have three children, Melinda Sue born May
11, 1958, James Davis born August 9, 1959, and Nancy Mae born June
11, 1961.I entered Graduate School at Louisiana State University
February, 1958 to work toward the Ph. D. degree in Poultry Science.
71
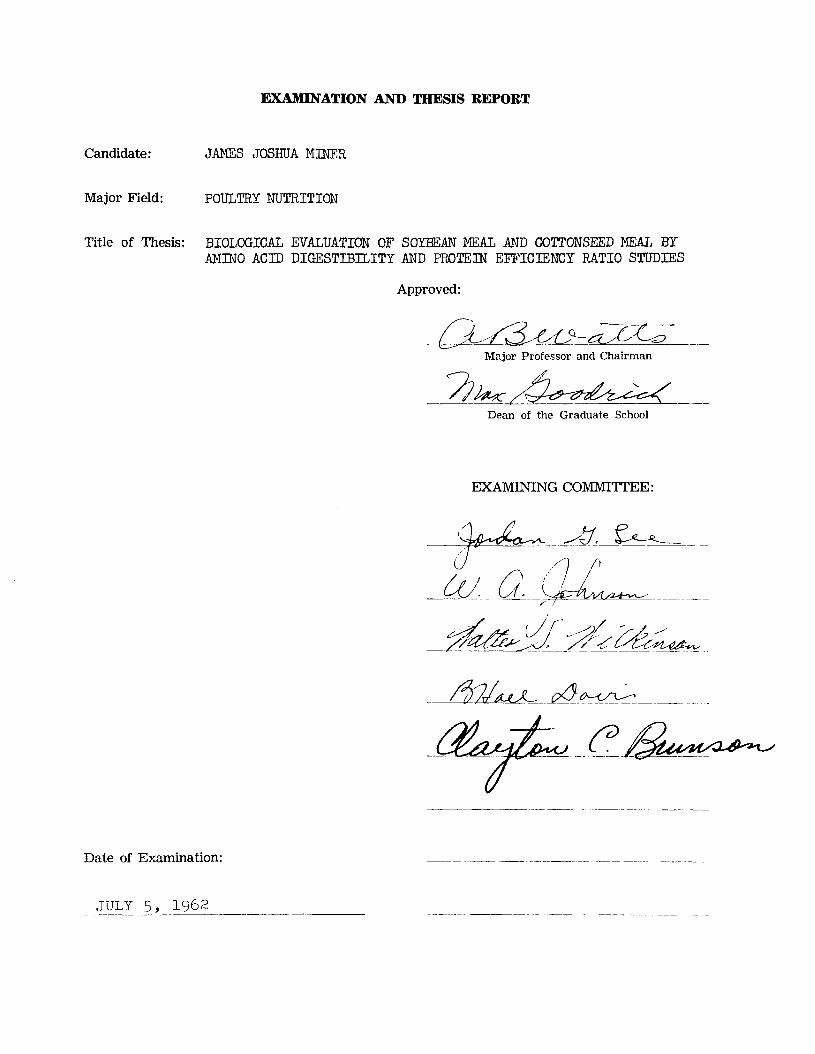
EXAMINATION AND THESIS REPORT
Candidate:
Major Field:
Title of Thesis:
JAMES JOSHUA MINER
POULTRY NUTRITION
BIOLOGICAL EVALUATION OF SOYBEAN MEAL AND COTTONSEED MEAL BY AMINO ACID DIGESTIBILITY AND PROTEIN EFFICIENCY RATIO STUDIES
Approved:
Major Professor and Chairman
Dean of the Graduate School
EXAMINING COMMITTEE:
Date of Examination:
JULY 5, 1962