EATING MEALS TOGETHER: A PERCEPTION OF FAMILY FUNCTIONING THROUGH FAMILY RITUALS AMONG TEENAGERS
87
EATING MEALS TOGETHER: A PERCEPTION OF FAMILY FUNCTIONING THROUGH FAMILY RITUALS AMONG TEENAGERS A Research Presented to the Faculty of Department of Psychology Our Lady of Fatima University Q.C. In Partial Fulfillment of the Requirements for the Degree Bachelor of Science in Psychology by: Asnan, Rejien Marie Kind D.C Manalo, Rickee Mae B. Villanueva, Medalyn April R. October 2014
Transcript of EATING MEALS TOGETHER: A PERCEPTION OF FAMILY FUNCTIONING THROUGH FAMILY RITUALS AMONG TEENAGERS
EATING MEALS TOGETHER: A PERCEPTION OF FAMILY FUNCTIONING
THROUGH FAMILY RITUALS AMONG TEENAGERS
A Research
Presented to
the Faculty of Department of Psychology
Our Lady of Fatima University Q.C.
In Partial Fulfillment of the Requirements for the Degree
Bachelor of Science in Psychology
by:
Asnan, Rejien Marie Kind D.C
Manalo, Rickee Mae B.
Villanueva, Medalyn April R.
October 2014
Table of Contents
Page
Title Page ……………………………………………………………………………………….
i.
Recommendation
……………………………………………………………………………...ii.
Approval Sheet
……………………………………………………………………………iii.
Acknowledgement
……………………………………………………………………….iv.
Dedication
…………………………………………………………………………...v.
Table of Contents
………………………………………………………………………………..vi.
List of Tables
……………………………………………………………………………………vii.
Abstract
………………………………………………………………………………………...viii.
CHAPTER
1 THE PROBLEM AND ITS SETTING
Introduction 1
Statement of the Problem 3
Significance of the Study 4
Scope and Limitation 5
Definition of terms 5
2 REVIEW OF RELATED LITERATURE
FAMILY FUNCTIONING 11
Theoretical Framework 19
Research Paradigm 22
3 RESEARCH METHODOLOGY
Research Design 24
Research Setting 25
Research Subject 25
Research Instrument 25
Validation of Instrument
26
4 PRESENTATION, ANALYSIS AND INTERPRETATION OF DATA 40
5 SUMMARY OF FINDINGS, CONCLUSIONS AND RECOMMENDATIONS
Summary of findings 47
Conclusions 50
Recommendations 63
BIBLIOGRAPHY
……………………………………………………………………………………..54
APPENDICES……………………………………………………………………………………
……58
CURRICULUM VITAE
……………………………………………………………………………….

List of Tables
Tables Page
1.1. Frequency and Percentage Distribution of the Demographic
Profile of the Respondents According to Gender………………………..31
1.2. Demographic Profile of the Respondents in Terms of
Family Socio-Economic Status…………………………………………….32
1.3. Number of Meals that the Respondents had with
their Families in a Day………………………………………………………33
2.1. The Perception of the Respondents towards
Family Functioning in terms of Competence…………………………….34
2.2. The Perception of the Respondents towards
Family Functioning in terms of Cohesion………………………………..35
2.3. The Perception of the Respondents towards
Family Functioning in terms of Conflict…………………………………...36
2.4. The Perception of the Respondents towards
Family Functioning in terms of Leadership……………………………….38
2.5. The Perception of the Respondents towards
Family Functioning in terms of Expressiveness………………………….39
3.1. Test of Difference in terms of Family Competence When Respondents
are Grouped According to their Demographic Profile
(Frequency of Meals)………………………………………………………40
3.2. Test of Difference in terms of Family Cohesion When Respondents
are Grouped According to their Demographic Profile
(Frequency of Meals)………………………………………………………41
3.3. Test of Difference in terms of Family Conflict When Respondents
are Grouped According to their Demographic Profile
(Frequency of Meals)………………………………………………………43
3.4. Test of Difference in terms of Leadership When Respondents

are Grouped According to their Demographic Profile
(Frequency of Meals)………………………………………………………44
3.5. Test of Difference in terms of Expressiveness When Respondents
are Grouped According to their Demographic Profile
(Frequency of Meals)………………………………………………………45
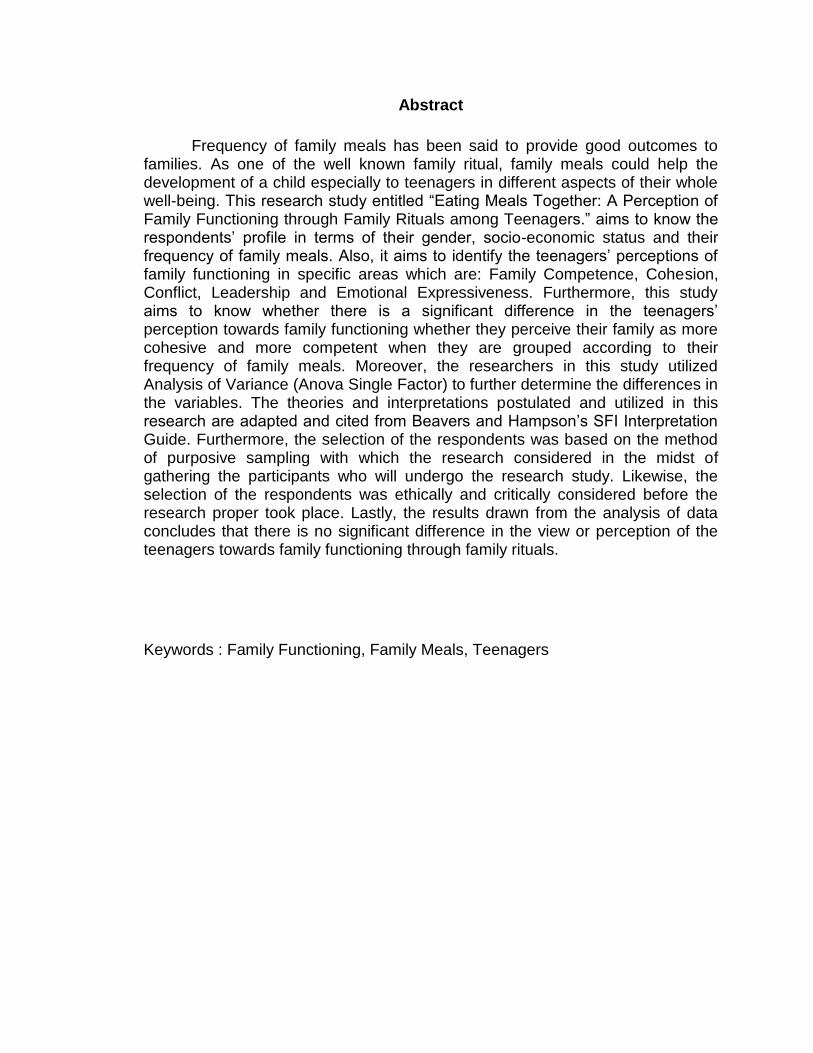
Abstract
Frequency of family meals has been said to provide good outcomes to families. As one of the well known family ritual, family meals could help the development of a child especially to teenagers in different aspects of their whole well-being. This research study entitled “Eating Meals Together: A Perception of Family Functioning through Family Rituals among Teenagers.” aims to know the respondents’ profile in terms of their gender, socio-economic status and their frequency of family meals. Also, it aims to identify the teenagers’ perceptions of family functioning in specific areas which are: Family Competence, Cohesion, Conflict, Leadership and Emotional Expressiveness. Furthermore, this study aims to know whether there is a significant difference in the teenagers’ perception towards family functioning whether they perceive their family as more cohesive and more competent when they are grouped according to their frequency of family meals. Moreover, the researchers in this study utilized Analysis of Variance (Anova Single Factor) to further determine the differences in the variables. The theories and interpretations postulated and utilized in this research are adapted and cited from Beavers and Hampson’s SFI Interpretation Guide. Furthermore, the selection of the respondents was based on the method of purposive sampling with which the research considered in the midst of gathering the participants who will undergo the research study. Likewise, the selection of the respondents was ethically and critically considered before the research proper took place. Lastly, the results drawn from the analysis of data concludes that there is no significant difference in the view or perception of the teenagers towards family functioning through family rituals.
Keywords : Family Functioning, Family Meals, Teenagers


Chapter 1
THE PROBLEM AND ITS SETTING
This chapter gives the readers an overview of the whole study. This
includes the introduction, statement of the problem, hypothesis, significance of
the study, the scope and delimitation and the definition of terms.
Introduction
Sitting together in one table yet didn’t talk to each other at all, holding
some gadgets seemed to be having their own worlds, living in one roof but one
wall apart. This is the reality with most of the families today. “Happy is said to be
the family which can eat onions together. They are, for the time being, separate,
from the world, and have a harmony of aspiration.” as what stated by the famous
American essayist Charles Dudely Warner (1829-1900). Families are said to be
the basic unit of the society and the first one to shape an individual but as Mom
and Dad got busier , indeed, the families today slowly falls apart because of lack
of connections among its family members.
Family mealtimes have received considerable attention in the popular
media as a barometer of family well-being. Dinnertime, they report, is an
endangered or defunct family ritual that has given way to the demands of
parents’ work and children’s extracurricular activities (RMC Research
Corporation 2005). As one of the well known family ritual, family meals could help
the development of a child especially to teenagers in different aspects of their
whole well-being. According to several studies that the researchers have read,

family meal times can also help lessen the growing population of delinquency
and substance use among teenagers. Few studies consider such factors in
assessing the link between family meals and child well-being. In particular, there
is little work controlling for aspects of family functioning that may jointly account
for the frequency of family meals and child well-being. Studies by Eisenberg and
colleagues are an exception. They find significant associations between family
meals and psychological well-being (2004) and substance use (2008) net of
family connectedness—a composite of adolescent responses to questions about
how much they feel their parents care about them and how much they feel they
can talk with their parents about problems. Most studies assessing the frequency
of family meals and child well-being lack a rich set of controls to rule out potential
confounding factors. The essence of family meals is that families have their
quality time together talking about what’s going on in their lives making it able for
parents to know how to maintain an intimate relationship towards their children
as well as to give guidance to their future adults. In general, both parents and
adolescents viewed family meals in a positive light, with parents being more
positive than adolescents. Although there were differences between the parents
and their children, responses showed that family meals are perceived positively
by both parents and adolescents, suggesting that family meals may be a useful
vehicle for enhancing family togetherness. According to the study of Neumark-
Sztainer 2010, n general, family meal frequency was also positively associated
with socio-economic status.
Moreover, this study investigates the associations between family meals
and the perceived family functioning of an individual. The researchers wanted to
explore and make a study if the frequency of family meal could affect the
perception of the teenagers towards their family functioning, specifically with the
areas of family competence, cohesion, conflict, leadership and their
expressiveness towards family members. Do the teenagers perceive their family
to be well functioning by eating meals together or do they perceive their family to
be more competent or does not have any difference at all?
Statement of the Problem
This study aims to investigate the perception of family members
towards family functioning through eating meals together.
The following specific problems will likewise be answered:
1. What is the demographic profile of the respondents based on :
1.1. Gender
1.2. Family Socio-economic status
1.3. How does the frequency of meals of the respondents can be
described?
2. What is the perception of the respondents towards family functioning base on
the following areas :
2.1. Competence;

2.2. Conflict;
2.3. Cohesion;
2.4. Leadership; and
2.5. Expressiveness?
3. Is there any significant difference in perception of the respondents towards
family functioning when grouped according to their frequency of family meals?
Hypothesis
Ho: There is no significant difference in perception of the respondents
towards family functioning when grouped according to their frequency of
family meals?
Significance of the Study
In our continuous evolving society and modernized way of living, making
humanity busy, family rituals seemed to be threatened. It is a struggle today for
some families to spend time together especially in eating meals where they
engage in communications making a strong connection between its family
members. The study emphasizes the “Eating Meals Together: A Perception of
Family Functioning among Selected teenagers.
As to the students, researchers seek answers to these problems in order
to know more to open the minds of the students that eating regular meals

together can help the bonding of the family. And to open the minds that students
can help through their everyday lives. To the youth, this serves as their guide to
make their family happy. They will know that eating meals together as a family
help steer kids away from risky behavior. Lastly, to every family to be informed
about the importance of having quality time together for further growth and
development of each individual. This also serves as an example to the students
and future researchers for their future researches and to explain the study of
eating meals together towards perceived family functioning.
Scope and Limitation
The researchers will be having the teenagers, specifically with ages 13-19
years old as the respondents will conduct the study in Tala High School with the
survey Questionnaires of Self-report Family Inventory II test which is composed
of 36 items that measures the perceptions of family functioning in five areas:
Competence, Conflict, Cohesion, Leadership, and Expressiveness. This
instrument is a screening device to assess a teenager's view on family
functioning. The researchers draw a sample population which was the 100
respondents. The Sampling method used in the study is the purposive sampling
method whereas the respondents were according to the criteria of the
researchers.
Definition of terms
The definition of terms aims to define the following variables and
unfamiliar terms . This includes the definition of variables and other terms being
used in the study for further understanding of the readers.
Cohesion The emotional bonding that family members have toward one
another (Olson, Russell, & Sprenkle, 1982). They defined group cohesion as the
group property that emerges from the set of bonds that exist in a group. A
cohesive group is one where a majority of the participants possess a
commitment to the group, to one another, and to the leader (Bruhn, 2009).Family
cohesion is characterized by a feeling of closeness among family members,
enjoyment of family activities, and a style of decision making in which all family
members feel involved (Olson et al.,1985).
Cohesion is one of the factors of the Self-Report Family Inventory Version
II. Cohesion defined as the closeness of a family or any individual to someone.
This will serve as a measurement on how strong the families are bonded
together.
Communication Skills is being able to communicate with others is one
of the best life skills a person can develop.
Competence It involves the ability to meet complex demands, by drawing
on and mobilizing psychosocial resources. It is a potential ability and/or a
capability function in a given situation. Competency focuses on one’s actual
performance in a situation. Competence is the ability to perform a specific task,
action or function successfully. Competencies are used to create unique
standards within disciplines and specialties (Norman 1985).
Competence is one of the factors of Self Report Family Inventory Version II.
Competence scale includes happiness, optimism, problem-solving and
negotiation skills, family love, strength of parental coalitions, emphasis on
autonomy and individuality, and responsibility.
Conflict The perception of threat, or actual occurrence of conflict, is
necessary for the initiation of conflict prevention or management measures, and
hence it is essential to address the concept of conflict before exploring how to
prevent and manage such occurrences (Swanstrom & Weissman 2005 ).
In this study, conflict is being used as a warning or the awareness of risks
or danger in a specific situation. This factor in Self Report Family Inventory
Version II is used in order to measure how the respondents is able to foresee the
existing conflict.
Emotional Intimacy is a warm and personal communication that is
sensitive to deep feelings and cares for another's state (Davis 2012).
Empathy is the "capacity" to share and understand another’s "state of
mind" or emotion. It is often characterized as the ability to “put oneself into

another’s shoes”, or in some way experience the outlook or emotions of another
being within oneself (International Journal of Caring Sciences 2008).
Expressiveness Showing emotions clearly and openly. It is spontaneous
facial, vocal, or verbal displays of emotion, frequency of emotion words in
everyday conversations, or the ability to pose emotions in ways that can be
recognized by others (Dunsmore, 2000). As members of an intimate group, each
one takes personal responsibility for his or her mixed, ambivalent thoughts and
feelings. The family thus displays flexible responses to life events and are able to
focus on their issues with goal-direction and clarity. A deep sense of emotional
security allows these families to resolve conflicts because they have a sense that
“we can work it out.” There is a sense of respect that the needs of the self, and
the needs of the group, can be resolved in a cooperative way. Instead of using
emotionally coercive tactics such as intimidation and guilt, adequate and optimal
families share power and allow for the expression of a wide range of feelings and
thoughts. Differences are welcomed as enriching everyone. Thus intimacy is
safe. Members are free to be both separate and connected ( Beavers 1990 ).
In this study, expressiveness is being used as expressing feelings of an
individual towards family members. Expressiveness was used to refer to family
members’ willingness to discuss problems and say what was on their minds.
Family Functioning is conceptualized according to organizational
principles governing interaction. Such processes involve the integration and
maintenance of the family unit and its ability to carry out essential tasks for the
growth and well-being of its members, such as the nurturance and protection of
offspring (Walsh, 1993). Defined through a variety of emotional attributes, family
governance frameworks, cognitive engagement and development characteristics,
physical health habits. Intra- familial relationships and social connectedness. Is
characterized by emotional closeness, warmth, support and security; well
communicated and consistently applied age appropriate expectations; stimulating
and educational interactions; the cultivation and modelling of physical health
promotion strategies; high quality relationships between all family members; and
involvement of family members in community activities (Pezzullo et al, 2001).
Family Functioning is one of the main variables in the study whereas it is
being defined as building of relationships in every family members and
maintaining connections through establishing activities within the families.
Family Rituals Developmental transitions provide opportunities, as well
as challenges, to negotiate routines and create meaningful rituals that can enrich
family life (Fiese, 2006). Family rituals make people “feel happier, better loved,
and more strongly a part of families.” (Harrar 2003). Family Rituals defined as the
regulation of the activities of the family members whereas it is considered as the
routines given by the member of the family specifically the parents. It is one of
the main variables that are being used in the study.
Leadership the process of influencing others to understand and agree
about what needs to be done and how to do it, and the process of facilitating
individual and collective efforts to accomplish shared objectives (Yuki 2006).
Leadership as one of the factors of Self Report Family Inventory Version II that is
being used in the study to measure how members of the family has the capability
in influencing others in a good manner. Leadership is defined as persuading
individuals by giving an affect with a power of an authority.
Meals Any of the regular occasions in a day when a reasonably large
amount of food is eaten, such as breakfast, lunch, or dinner. The food eaten on
regular occasions.
Perception is more than the sum of static, individual sensory inputs.
Perception clearly involves some integration and, perhaps, some interpretation of
the sensations (SAGE Publications 2009). Perception is closely related to
attitudes. Perception is the process by which organisms interpret and organize
sensation to produce a meaningful experience of the world. In other words, a
person is confronted with a situation or stimuli. The person interprets the stimuli
into something meaningful to him or her based on prior experiences. However,
what an individual interprets or perceives may be substantially different from
reality. (Lindsay & Norman, 1977).
Psychological well-being emphasize the differing challenges
confronted at various phases of the life cycle; the absence of illness, also offer
extensive descriptions of what it means to be in good psychological health (Ryff
et al 1996).

Relationships is a continuing succession of interactions between two
people that are affected by their shared past interactions and that also affect their
future interactions. (Parke et al, 2008)
Social Connectedness is one of many terms used to describe the
intricate relationship between individuals which involves the way that we relate
with others and how we see ourselves in regards to those bonds and
associations. (Smithson, 2011)
Chapter 2
REVIEW OF RELATED LITERATURE
This chapter contains the related literatures, theoretical framework of the
study and the research paradigm that is pertinent to the research. This chapter
begins with the related literature and how appropriate and pertinent the articles
are obtained.
FAMILY FUNCTIONING
Defined through a variety of emotional attributes, family governance
frameworks, cognitive engagement and development characteristics, physical
health habits. Intra-familial relationships and social connectedness. Is
characterized by emotional closeness, warmth, support and security; well
communicated and consistently applied age appropriate expectations; stimulating
and educational interactions; the cultivation and modeling of physical health
promotion strategies; high quality relationships between all family members; and
involvement of family members in community activities (Pezzullo et al., 2001).
In general, both parents and adolescents viewed family meals in a positive
light, with parents being more positive than adolescents. Although there were
differences between the parents and their children, responses showed that family
meals are perceived positively by both parents and adolescents, suggesting that
family meals may be a useful vehicle for enhancing family togetherness . In
general, family meal frequency was positively associated with socio-economic
status
( Neumark-Sztainer et al. , 2010).
“Increased frequency of family dinners (FFD) is associated with lower
probabilities of all substance-use and running away for females; binge-drinking,
physical fights, property-destruction, stealing and running away for males; and
less marijuana use for both genders. In addition, these effects are evident even
when the empirical models control for good family connectedness, close parental
monitoring, and other potential confounders.” By providing structure, stability, and
improving family communication, eating meals together as a family is one aspect
of family life consistently associated with more positive outcomes for young
people. (Bisakha Sen 2010).
Researchers note that family meals may provide a unique context for
parents to connect with and share important information with their children .The
frequency of family meals is also likely related to the quality of family
relationships, which in turn is associated with child well-being into young
adulthood .Greater family meal frequency is indeed associated with higher quality
family relationships. Few researchers have attempted to measure what it is
specifically about family meals that may lead to improved outcomes. Possible
factors include empathy, family cohesion, communication skills, and family
attitudes (Amato & Sobolewski 2001; Musick & Meier, 2012). Researchers note
that family meals may provide a unique context for parents to connect with and
share important information with their children (Musick & Meier). Family dinners
may be part and parcel of a broader package of practices, routines, and rituals

that reflect parenting beliefs and priorities. Interventions aimed at increasing the
frequency of family meals may be successful only if they can change the family
habits that tend to go along with eating as a family (Musick & Meyer 2012.)
As noted by Musick and Meier, the routine of family meals can generate feelings
of closeness and comfort. Even when mealtimes feel hectic or disorganized, take
comfort in the fact that the simple act of regular mealtimes may be providing your
child with stability. While research on family meals is still evolving, and scholars
face challenges in indentifying the “true” effects of family meals, evidence to date
suggests that family meals do provide benefits for children and youth. In sum of
extant studies, many associations between family meals and well-being in
adolescence held up to controls for various aspects of family functioning.
In fact, less frequent family meals are generally associated with lower
socioeconomic status, maternal employment, single parenthood, and poor quality
family relationships; thus it is difficult to separate the effects that family meals
have on positive child outcomes from those of these other factors (Musick &
Meier, 2012)
Most research notes some type of improvement in child outcomes when a
family participated in at least three family meals together each week. Of course
this is not possible for all families. If not, try to substitute family dinners with
shared breakfasts, evening snacks or any similar activity that will allow your
family to gather more regularly.
Teens themselves understand the value of family dinners: nearly three-
quarters of teens think that eating dinner together with their parents is important.
Most teens (60 percent) who have dinner with their parents fewer than five nights
a week wish they could eat dinner with their parents more often. Compared to
teens who don’t talk to their parents about what’s going on in their lives at dinner,
those who do are more likely to think frequent family dinners are important and to
want to have them more often. Dinner isn’t the only time when parents can
engage with their children. Parents who aren’t able to make it to the dinner table
can take advantage of other opportunities for conversation. Wherever these
conversations occur, it’s important for parents to make talking to teens about
what’s going on in their lives routine. Teens who talk to their parents about
what’s going on in their lives at dinner are more likely to think frequent family
dinners are important than teens who don’t talk to their parents about what’s
going on in their lives during dinner. Family Dinners and Academic Performance.
Teens who report typically receiving mostly C’s or lower grades in school are
likelier to smoke, drink and use drugs compared to teens who typically receive all
A’s or A’s and B’s in school. Evidence suggests that children who take part in
family meals are less likely to be overweight, eat more healthy foods, have less
delinquency, greater academic achievement ,improved psychological well-being.
A substantial body of research has demonstrated strong associations between
the frequency of family meals and a range of positive adolescent outcomes,
including healthy body weight, psychological well-being, academic achievement,
and risk behavior avoidance (Council of Economic Advisers, 2000; Eisenberg et
al., 2004; Fulkerson et al., 2006, 2009; CASA, 2010), and positive family
interactions (Neumark-Sztainer et al., 2008; Neumark-Sztainer, Wall, Story, &
Fulkerson, 2004, Jacobs & Fiese, 2007, Fiese, Foley, & Spagnola, 2006)
(Eisenberg, Neumark-Sztainera, Shira Feldman, 2009; CASA, 2010; Council of
Economic Advisers, 2000). But the frequency of family meals is undoubtedly
related to family resources, relationships, and other characteristics that contribute
to well-being, and these may confound associations between family meals and
child outcomes. For instance, lower socioeconomic status, maternal employment,
single parenthood, and poor quality family relationships have all been linked to
less frequent family meals (CASA, 2010; Cawley & Liu, 2007; Eisenberg et al.,
2004; Fulkerson et al., 2006; Neumark-Sztainer et al., 2003; Stewart & Menning,
2009). These factors are in turn closely associated with child well-being (Duncan,
Ziol-Guest, & Kalil, 2010; Fertig, Glomm, & Tchernis, 2009; Morrisey, Dunifon, &
Kalil, 2011; Musick & Meier, 2010; Resnick et al., 1997). Families with older
teenagers, fewer socioeconomic resources, and lower quality family relationships
have been found to eat together less frequently (CASA, 2010; Cawley & Liu,
2007; Eisenberg et al., 2004; Fulkerson et al.,2006; Neumark-Sztainer et al.,
2003; Stewart & Menning, 2009); Prior research was mixed in finding gender
differences in associations between family meals and adolescent outcomes
(e.g.,Eisenberg et al., 2004, and Fisher et al., 2007, reported stronger
associations among girls; Sen,2010, found limited gender differences and
Fulkerson et al., 2006, found no important differences).

Family meals provide a regular context for parent-child conversation and
communication, which may directly influence adolescent mental health and risk-
taking. But the frequency of family meals is also closely related to other aspects
of family resources, organization, relationships, and overall climate that
contribute to adolescent well-being. For example, families in poverty are less
likely to eat together (Neumark-Sztainer et al. 2003), and poverty is in turn
associated with multiple dimensions of child well-being (Duncan et al. 2010).
Conflict is defined as the perception of threat, or actual occurrence of
conflict, is necessary for the initiation of conflict prevention or management
measures, and hence it is essential to address the concept of conflict before
exploring how to prevent and manage such occurrences (Swanstrom &
Weissman 2005 ).
The discussion assumes that family time is quality time. For some
families, shared time is another opportunity for conflict. Indeed, observational
studies of mealtime suggest that effective affect management, interpersonal
involvement, and communication in families relate to child health. The families
that do sit down to meals together may be more likely to be families that get
along and thus contribute to the positive relations presented in this study, in both
the short-term and long-term . However, there is emerging evidence to suggest
that mealtime interactions that include positive forms of communication are not
solely markers of overall family functioning but may represent a unique
contribution to children’s health and well-being Shared family meals may act as a

protective factor for many nutrition-related health problems during childhood and
adolescence. Children and adolescents in families who share meals three or
more times per week are more likely to be in a normal weight range and have
healthier eating patterns than those who share family meals less frequently.
Frequency. Researchers have found varying benefits based on the frequency of
weekly family meal times (i.e, low=0-2, medium=3-4, and high=5-7 meals) Most
studies have found that medium and high levels (i.e., 3 or more days per week)
of frequent meals yield the most positive benefits for children (Hammons, A. J., &
Fiese, B. H. 2011).
As a defined field of study, conflict resolution started in the 1950s and
1960s.This was at the height of the Cold War, when the development of nuclear
weapons and the conflict between the superpowers seemed to threaten human
survival. A group of pioneers from different disciplines saw the value of studying
conflict as a general phenomenon, with similar properties whether it occurs in
international relations, domestic politics, industrial relations, communities or
families or between individuals (Bercovitch et al., 2009).
Increased frequency of all family meals have been associated with many
aspects of adolescent health including positive impacts on vocabulary and
intellectual development, Furthermore ,girls who ate with their parents more often
in Study Years 1 and 3 exhibited higher levels of family cohesion and problem-
and emotion-focused coping in Years 7/8, even after adjusting for these
mediators measured concurrently with family meals (Years 2/3). This finding
suggests that frequent family meals foster closer family ties and may be helpful in
teaching children coping skills. Our data are consistent with Fulkerson, Neumark-
Sztainer, and Story (2006), who found associations between a positive
atmosphere and frequency of family meals, suggesting that family meals may
enhance family communication and provide good role modelling that is important
because as a YA’s age and scheduling become issues, YAs may not be at family
dinners as frequently, however, fostering dyad communication at family dinners
may be an important component to maintaining FDF into adolescence. As the
work of family scholars suggests, the family table, like the broader household, is
a potential arena of conflict (Fulkerson et al., 2011)
It was also hypothesized that greater frequency of family meals would be
positively associated with greater family cohesion in adolescents, and that the
association between family meal frequency and individual food choice would be
partially mediated by family cohesion. However, previous longitudinal research
suggests that frequency of family meals predicts improved family cohesion over
time. These findings suggest that family meals may have a positive impact on all
family members, and not just adolescents. However, evidence for the mediating
role of family cohesion for this relationship was lacking. It was hypothesized that
frequency of family meals was positively associated with perceived family
cohesion, which in turn would be related to healthier dietary intake (Welsh et
al.,2010).
For families characterized by poor quality relationships, gathering regularly
around the table may produce another site for conflict thereby dampening,
eliminating, or reversing any good that may come of the family meal (Wilk, 2010).
Planned family meals also promote regular meal times and routines that
encourage less snacking between meals (Fruh et al. 2011).
Yuki (2006) defines leadership as “the process of influencing others to
understand and agree about what needs to be done and how to do it, and the
process of facilitating individual and collective efforts to accomplish shared
objectives.”
Leadership is defined as a complex process and we have serious
reservations over the extent to which a set of standards, qualities or
competencies can ever fully capture the nature of what makes some
leaders/organisations successful and others unsuccessful ( Bolden, R. et
al.,2003 ).
The term Family Leadership is based on the premise that all family
members are of equal value and that family dynamics change as children move
from one age and stage to another . Family Leadership is based on the premise
that families are the experts in their own lives and demands that the main
function of support agencies is to increase their resilience. Brothers and sisters
usually know each other really well and are able to put forward a different view to
the parental perspective (Murray 2011).
The diversity of disciplinary and organisational members means that the
full range of individual, family, social, economic and environmental factors known
to affect the development of children and young people are integrated into new
knowledge (Sanson 2008).
Consistent with this notion, aspects of the family environment may be
seen as a package of family features that influence youth development, with
shared meals and other family processes reinforcing each other (Furstenberg,
2011).
Theoretical Framework
For the present study of the perception of family functioning among
teenagers through eating meals together, the researchers made use of Social
Identity Theory by Henri Tajfel to support this study. This only shows that in every
situation that every family has will be the result of everyone’s behavior. This will
also cultivate the child’s attitude and behavior depending on what the child
observed by his or her parents. Same with eating meals together, when a parent
or any members of the family discusses some matter during mealtime like doing
usual but proper ritual the family possesses , the child itself as an individual will
develop his own beliefs about themselves to others. This will motivate them to
know more about the world, and to be understood by other people. As what the
drive theory states, the more the family is present, the more the child is motivated
and that will serve as a positive response towards the functioning of family.
Family assistance may provide a sense of purpose and belonging for
children, and this sense of meaning may help them cope with the potential
challenges of providing assistance to the family (Fuligni, Alvarez, Bachman, &
Ruble, 2005). Likewise, a social identity perspective suggests that family
assistance can be beneficial for youths’ wellbeing (Fuligni & Flook, 2005). The
family is the first and primary social group to which children belong. According to
social identity theory, identifying with a social group enhances one’s willingness
to support and assist that group, especially if one feels valued and accepted by
the group (Hogg, 2003). Feeling like a valued member of a group has been
associated with better emotional well-being
(Hogg, 2003). Thus, assisting the family may increase one’s sense of connection
to the family, which can provide adolescents with a sense of support and
structure to help them deal with the challenges associated with being a teenager
in U.S. society (Hardway & Fuligni, 2006).
The group mind theory also describes how a group continuity depends in
part on the group being an important idea in the mind of its members, the for
boundaries and structures in which differentiation and specialization of function
could occur ; and the importance of customs and habits, so that member to
member relation could be fixed and defined (McDougall 1920). In The Group
Mind, William McDougall identified what he called "the principles of collective
psychology" and explained how basic human drives, as natural inherited
instincts, form the basis of human conduct. According to McDougall, the cohesive
nature of various groups rests upon the intrinsic collective mentality of its
individual members.
A more scientific and empirical approach to the group dynamics, was
ushered in during the 1940’s by kurt lewin, whose field theory psychologist (
Lewin 1951) guided a generation of researchers, industrial psychologist, group
therapist, and agents of social change between individuals and their
environment. Another of Lewins important discoveries was that group
discussions are superior to individual instruction or lecturing for changing ideas
and behavior. These findings suggest that family meetings are more effective
than separate meetings with individual. The field theory is the "proposition that
human behavior is the function of both the person and the environment. For Kurt
Lewin, behaviour was determined by totality of an individual’s situation. In his
field theory, a field is defined as the totality of coexisting facts which are
conceived of as mutually interdependent (Lewin 1951: 240). Individuals were
seen to behave differently according to the way in which tensions between
perceptions of the self and of the environment were worked through. The whole
psychological field, or life space, within which people acted had to be viewed, in
order to understand behavior. Within this individuals and groups could be seen in
topological terms (using map-like representations). Individuals participate in a
series of life spaces (such as the family, work, school and church), and these
were constructed under the influence of various force vectors (Lewin 1952).

Figure 1. Theoretical Framework
Research Paradigm
The figure 1 shows the theories used in the researcher’s study.
This study aims to know the perception of the teenagers towards family
functioning through eating meals together. Data gathered from the
research was processed and carried out in survey questionnaires then
distributed to the selected teenagers. The outcome of the study is that a
teenager’s meal together with family affects their perception of family
functioning and that Frequency of eating meals together increases family
cohesion and decreases conflict among the family.
Family Rituals
Teenagers' Perception towards family functioning
Family Functioning : -Competence,
conflict , cohesion, leadership and
expressiveness.

Figure 2. Research Paradigm Table
The figure 2 presents the input of the study which includes the statement
of the problem, the Process which is the instrument to be used to gather data as
well as the output or the outcome of the study and the researcher’s proposed
program.
INPUT
• STATEMENT OF THE PROBLEM
•1. What is the demographic profile of the respondents based on :
•Gender
•Socio-economic status :
•1.3.1. 5,000 – 10,000/ month
•1.3.2. 15,000-20,000/month
•1.3.3. 25,000 and above /month
•2. How does the frequency of family meals of the respondents can be described?
•Once a day;
•Twice a day;
•Thrice a day;
•Every Weekends;
•Never?
•3. What is the perception of the respondents towards family functioning base on the following areas as measured by Family Inventory II of Beavers 1990:
•2.1. Competence;
•2.2. Conflict;
•2.3. Cohesion;
•2.4. Leadership; and
•2.5. Expressiveness?
•4.Is there any significant difference in the perception of the respondents towards family functioning when grouped according to their frequency of family meal?
PROCESS
•The researhers made use of a Self-report Family Inventory Test questionnaire which was based on the following studies : Beavers, W. R., & Hampson,R.B.(1990).Successful families: Assessment and intervention. New York: Norton.
•Each questionnaire consists of 36 items :19 items for the domain of competence, 12 items for conflict, 5 for cohesion , 3 items for leadership and 5 for expressiveness.
OUTPUT
•OUTCOME OF THE
STUDY:
•(1) A teenager's meal
together with family affects
their functioning as a
family member,
(2)Frequency of eating
meals together makes
cohesion and have less
conflict among the family.
•PROPOSED PROGRAM:
(1) to distribute pamphlets
to families of each
household or hold a
seminar or family
orientation for both the
teenagers and families to
become aware how eating
meals together increases
family cohesion and
decreases conflict among
family members. (2) to
hold a symposium for the
general public in order for
others to be aware of how
eating meals together with
family affects family
functioning.
Chapter 3
RESEARCH METHODOLOGY
This chapter is bound to discuss the research method to be used, variety
of procedure made, and the tabulation and analysis of data gathered. The
population and the determined sample size, the research instrumentation and the
statistical treatment of data to be followed in order to attain the needed
information to establish this study. It discusses the entire route of preparation of
the study and drawn conclusion from the gathered data.
Research Design
In the field of the study, the researchers will be using the descriptive
method which is a factually grounded or informative study rather than normative .
Methods that yield descriptions of behavior but not necessarily causal
explanations. The descriptions were yielded through the instrument of Beavers
and Hampson 1990 for a measure of perceptions of family functioning in five
areas: Health/Competence, Conflict, Cohesion, Leadership, and Expressiveness.
In this research, purposive sampling method was used whereas the
respondents were according to the criteria of researchers. Moreover, the study
aim to determine the perception of the teenagers, specifically, the students of
Tala High School towards family functioning through family rituals; specifically in
eating meals together.
Research Setting
To be able to complete the number of respondents, the study was
conducted in Tala High School located in Yakal Street Tala Caloocan City
wherein the respondents answered the questionnaires inside their respective
classrooms. To be specific, we surveyed simultaneously first, in 3rd year class,
secondly, to the two sections of 4th year high school to complete the 100
respondents. The researchers surveyed on three corresponding sections.
Research Subject
The respondents of this study were teenagers, specifically, from 13-19
years old, both male and females. The teenagers were students of Tala High
School specifically, 3rd year and 4th year high school.
Research Instrument
In achieving the objectives of the study, the researchers used an
instrument from the study of Beaver’s and Hampson (1990) which is the Self-
Report Family Inventory II. The instrument serves as a screening device to
assess the overall five areas: Health/ Competence that has a mean of 19 items;
Conflict has 12; Cohesion has 5; Leadership has 3; and Expressiveness that has
5 items. the scale descriptors are 1 = YES: Fits our family very well, 3 = SOME:
Fits our family some, and 5 = NO: Does not fit our family. The last two items have
response scales specific to the items. Lower scores represent greater family
competence.

Competence, Mean of 19 items. A lower score reflects greater global family
competence. Themes addressed in this scale include happiness, optimism,
problem-solving and negotiation skills, family love, strength of parental coalitions,
emphasis on autonomy and individuality, and responsibility.
Conflict, Mean of 12 items. A lower score reflects less overt unresolved family
conflict, fighting, blaming, and arguing, and more negotiation and acceptance of
personal responsibility in resolving conflicts.
Cohesion, Mean of 5 items. A lower score reflects greater family closeness.
Leadership, Mean of 3 items. A lower score reflects strong and consistent
patterns of adult leadership in the family.
Expressiveness, Mean of 5 items. A lower score reflects greater feelings of
closeness and more expression of positive feelings, warmth, and caring.
Validation of Instrument
The scale authors reported test-retest correlation ranges for 1- to 3-month
periods as follows: Family Health/Competence, .84-.87; Conflict, .50-.59;
Cohesion, .50-.70; Leadership, .41-.49; and Expressiveness, .79-.89. Validity is
demonstrated through correlations of SFI scores with scores from other

assessments of family functioning, including the Family Environment Scale, the
Family Assessment Device, FACES II, and FACES III. Additional information
about reliability and validity of the SFI can be found in Beavers & Hampson
(1990), and in the scoring information from the family assessment manual that
Hampson mailed to us on August 2014.
Data Gathering Procedure
As an initial preparation of data gathering, the researchers seek for the
permission of the school principal having signed the approval letter. After
securing approbation, the researchers gathered data about the topic. Then, the
researchers distributed survey questionnaires to measure the respondent’s
family functioning as well as their demographic profile in terms of family socio-
economic status and frequency of meals together with their family. The
researchers will ask the permission of the respondents to participate on the
study. The following measures will be given to the following respondents after
confirming to participate in the study, having expounded the terms by which the
researchers presented. The researchers will use the Self-Report Family
Inventory: Version II (SFI) by Beavers, W.R., & Hampson, R. B. (1990) to the
respondents and supply the given instructions for the selected participants of the
study of the said test.
All in all, the researchers will collect the data by means of a survey
questionnaire that encompasses the basic information part which was the source

of the demographic profile information of the respondents, the frequency of family
that eats together and the Self Report Family Inventory: Version II (SFI)
Statistical Treatment
The gathered data were used to determine the respondent’s gender,
socioeconomic status and frequency of family meals.
Mean (or average) a set of data values is the sum of all the data values divided
by the number of data values (Higgenbottom, 2014). That is:
Symbolically,
Where (read as ‘ ) is the mean of the set of values.
∑ is the sum of all the values, and
is the number of values
Percentage. It is used to determine the sample size and the percentage of
distribution of the demographic profile of the respondents according to their
gender, family socioeconomic status and frequency of family meals.
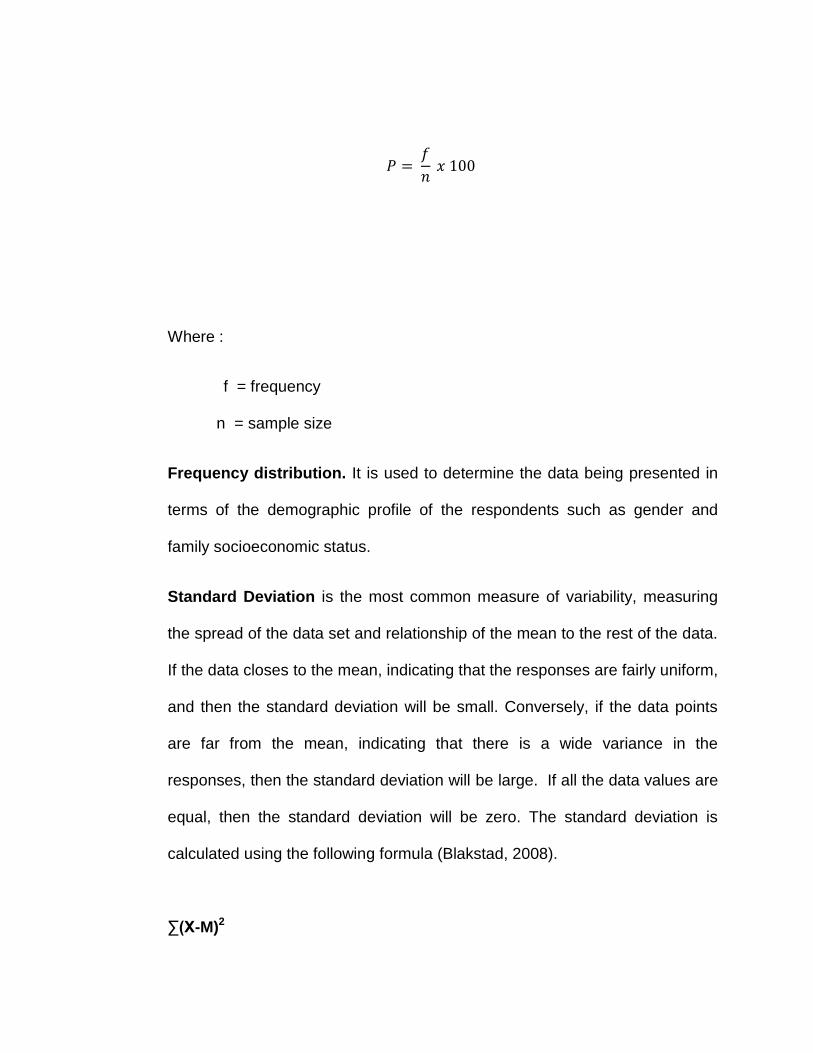
Where :
f = frequency
n = sample size
Frequency distribution. It is used to determine the data being presented in
terms of the demographic profile of the respondents such as gender and
family socioeconomic status.
Standard Deviation is the most common measure of variability, measuring
the spread of the data set and relationship of the mean to the rest of the data.
If the data closes to the mean, indicating that the responses are fairly uniform,
and then the standard deviation will be small. Conversely, if the data points
are far from the mean, indicating that there is a wide variance in the
responses, then the standard deviation will be large. If all the data values are
equal, then the standard deviation will be zero. The standard deviation is
calculated using the following formula (Blakstad, 2008).
∑(X-M)2

S2 = n-1
Where ∑ = sum of
X = Individual score
M = Mean of all scores
N = Sample Size (number of scores)
ANOVA Single Factor is a statistical test which analyzes variance. It is
helpful in making comparison of two or more means which enables
researchers to draw various results and predictions about two or more sets of
data. It has been achieved by subdividing the total sum of squares. Anova
test includes One-way Anova, Two-way Anova or Multiple Anova depending
upon the type and arrangement of the data. The purpose is to test for
significant differences between class means, and this is done by analyzing
the variances. One- way Anova has the following test statistics:
Where:
F = Anova Coefficient
MST = Mean Sum of the squares due to treatment
MSE = mean sum of squares due to error.
Formula for MST is given below:
2
Chapter 4
PRESENTATION, ANALYSIS AND INTERPRETATION OF DATA
This chapter contains the tabulation, analysis and interpretation of all data
gathered through the questionnaires as well as the supporting studies.
1. Demographic Profile of the Respondents
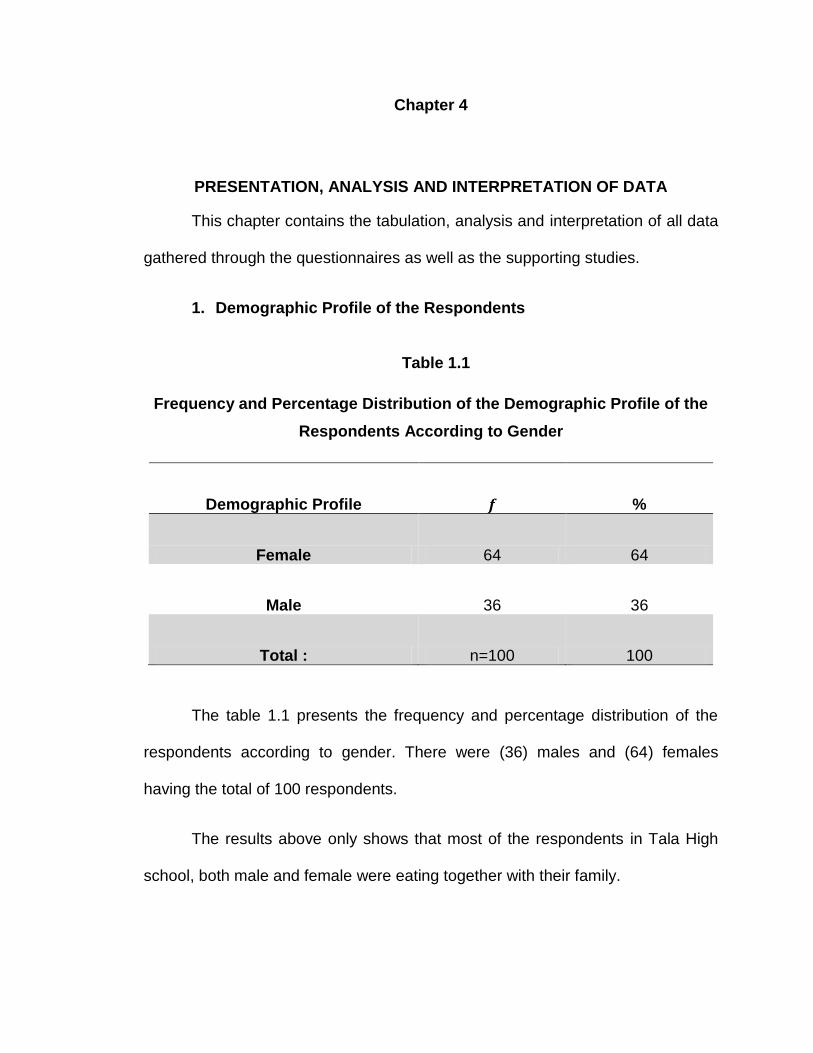
Table 1.1
Frequency and Percentage Distribution of the Demographic Profile of the
Respondents According to Gender
Demographic Profile %
Female 64 64
Male 36 36
Total : n=100 100
The table 1.1 presents the frequency and percentage distribution of the
respondents according to gender. There were (36) males and (64) females
having the total of 100 respondents.
The results above only shows that most of the respondents in Tala High
school, both male and female were eating together with their family.

Table 1.2
Demographic Profile of the Respondents in Terms of Family Socio-
Economic Status
Family Income: %
P 60,000 and above 25 25
P 45,000-P59,000 11 11
P 30,000 - P44,000 14 14
P 15,000- P 29,000 22 22
P 15,000 and below 28 28
Total : n=100 100
The table 1.2 shows the demographic profile of the respondents in Tala
High School in terms of family socioeconomic status. As what is being shown
above, only (0.25%) of the respondents got the highest family income of P
60,000 and above. The (0.11%) gets P 45,000 – P 59,000 income while (0.14%)
of other respondents gets P30,000-P 40,000. The (0.22%) of respondents gets P
15,000- P29,000, then the remaining (0.28%) of the respondents has P 15,000
and below income. Most of the respondents’ annual family incomes fall on
P15,000 and below.
The yielding result shows that the respondents are of lower family
Socioeconomic Status. In this case, less frequency of meals is associated with
the teenagers’ family Socioeconomic Status.
In general, both parents and adolescents view family meals in a positive
way but parents view it more positively. Although there are differences between
the parents and their children, responses show that family meals are perceived
positively by both of them. This suggests that family meals may serve as a useful
vehicle for enhancing family togetherness. In general, family meal frequency was
positively associated with socio-economic status.
( Neumark-Sztainer et al. , 2010).
For instance, lower socioeconomic status, maternal employment, single
parenthood, and poor quality family relationships have all been linked to less
frequent family meals (CASA, 2010; Cawley & Liu, 2007; Eisenberg et al., 2004;
Fulkerson et al., 2006; Neumark-Sztainer et al., 2003; Stewart & Menning, 2009).
These factors are in turn closely associated with child well-being (Duncan,
Ziol-Guest, & Kalil, 2010; Fertig, Glomm, & Tchernis, 2009; Morrisey, Dunifon, &
Kalil, 2011; Musick & Meier, 2010; Resnick et al., 1997). Families with older
teenagers, fewer socioeconomic resources, and lower quality family relationships
have been found to eat together less frequently (CASA, 2010; Cawley & Liu,
2007; Eisenberg et al., 2004; Fulkerson et al.,2006; Neumark-Sztainer et al.,
2003; Stewart & Menning, 2009).
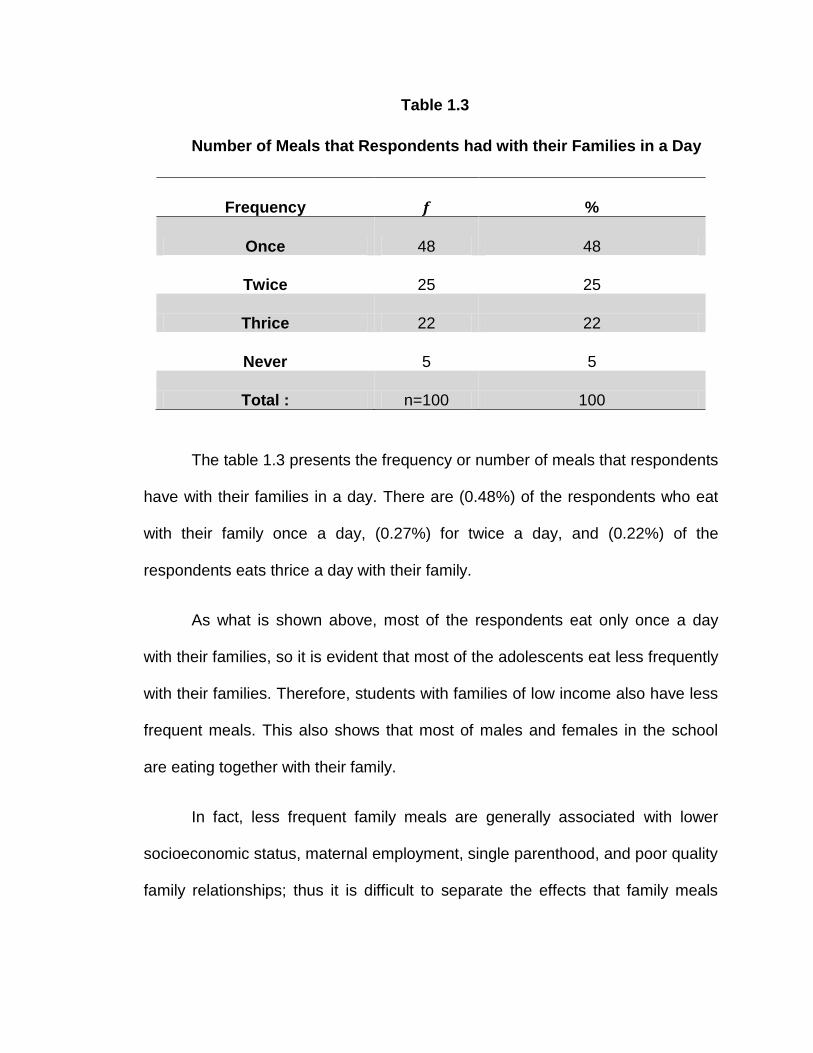
Table 1.3
Number of Meals that Respondents had with their Families in a Day
Frequency %
Once 48 48
Twice 25 25
Thrice 22 22
Never 5 5
Total : n=100 100
The table 1.3 presents the frequency or number of meals that respondents
have with their families in a day. There are (0.48%) of the respondents who eat
with their family once a day, (0.27%) for twice a day, and (0.22%) of the
respondents eats thrice a day with their family.
As what is shown above, most of the respondents eat only once a day
with their families, so it is evident that most of the adolescents eat less frequently
with their families. Therefore, students with families of low income also have less
frequent meals. This also shows that most of males and females in the school
are eating together with their family.
In fact, less frequent family meals are generally associated with lower
socioeconomic status, maternal employment, single parenthood, and poor quality
family relationships; thus it is difficult to separate the effects that family meals

have on positive child outcomes from those of these other factors (Musick &
Meier, 2011)
2. The Perception of the Respondents Towards Family Functioning
Table 2.1
The Perception of the Respondents Towards Family Functioning
in Terms of Competence
Competence %
Less Competent 39 39
More Competent 61 61
Ave: 43.52 Total: 100
n= 100 More Competent This table shows that 61% of the respondents are more likely to be
competent within the family than the 39% says who are not likely to be
competent within the household. This table also shows the average mean score
of the respondents according to the factor domain given by the SFI is 43.52. This
means that most of the perception of the respondents towards family
competence goes on a more competent direction.
This result falls to Mid-range families. This means that most of the
respondents are relatively concerned with control and overt power differences
but more likely ambivalently handled by repression or projection by the other.
These families are characterized by being functional but having vulnerable
children. Vulnerable children are easily hurt or harmed physically, mentally or

emotionally and open to attack, harm, or damage. Family members do not have
boundary problems. Although there are frequent projections, the family roles
allow for rebuttal, and invasion of one member’s inner space by another is
resisted.
Table 2.2
The Perception of the Respondents Towards Family Functioning
in Terms of Cohesion
Cohesion %
Less Cohesive 74 74
More Cohesive 26 26
Ave: 12.84 Total: 100
n= 100 Less Cohesive
The table shows that 74% of the respondents are less cohesive while 26%
of other respondents are more cohesive within the family. It also shows in this
table the average mean score of the respondents according to the factor domain
given by the SFI is 12.84 .
This result falls to Mid-range families. This means that most of the
respondents are relatively concerned with control and overt power differences
but more likely ambivalently handled by repression or projection by the other.
These families are characterized by being functional but having vulnerable
children. Vulnerable children are easily hurt or harmed physically, mentally or

emotionally and open to attack, harm, or damage. Family members do not have
boundary problems. Although there are frequent projections, the family roles
allow for rebuttal, and invasion of one member’s inner space by another is
resisted.
Table 2.3
The Perception of The Respondents Towards Family Functioning
in Terms of Conflict
Conflict %
Less Conflict 58 58
More Conflict 42 42
Ave: 31.93 Total: 100
n= 100 Less Conflict
In this table, it shows that 58% of the respondents are less likely to have
conflict in the family, contrary to the 42% of the respondents who has more
conflict within the family. This table also shows the mean average of the
respondents according to the factor domain given by the SFI is 31.93.
According to the SFI interpretation manual , the respondents fall on mid-
range type of families which means that their ambivalence is frequently handled
by denying one half of a pair of strong feelings and using repression or projection

for the other sibling. Thus, teenagers tend to repress strong emotions to avoid
conflict in the family. Examples are stated in the interpretation guide.
In this case, based on the table results, most of the respondents are
having less conflict, less meals within their family. Factors include less talks and
discussion within the family.
According to a research, discord at the dinner table is rarely seen, discussed,
or analyzed (Wilk 2010).
In the research of NCASA, 2005 (North Carolina Association of School
Administrators), as being stated by Wilk, 37% say the TV is usually on during family dinners
and 14% admit that there is not much talking.
Table 2.4
The Perception of The Respondents Towards Family Functioning
in Terms of Leadership
Leadership %
Lesser Leadership 50 50
Greater Leadership 50 50
Ave: 7.43 Total: 100
n= 100 Greater or lesser
Leadership
This table shows that 50% of the respondents has greater leadership
while 50% of the results given shows lesser leadership within the family. It also

shows in this table the average mean score of the respondents according to the
factor domain given by the SFI is 7.43.
As what the interpretation guide states, as characterized by mid-range
type of families, the respondents show great concern for rules and authority and
attempted to use control by intimidation, however, they do not expect their efforts
to be successful. Therefore, authority is being demonstrated.
A less ideologically loaded approach suggests that the family dinner table
is a place where public and private politics intersect, where the connections
between gender and authority can be seen in all their pervasive and
encompassing complexity (see Lakoff, 1996) as being cited by Wilk 2010.
Furthermore, Family meals are often the setting where imbalances of
power based on age and gender are forced to the surface, events where
authority is demonstrated and roles are enforced, where some people serve and
obey while others make choices and arbitrary decisions, in other words, where
individuals confront the power embedded in daily discourse, bodily habits, and
the routines of everyday life (Neumann, 1996) cited by Wilk 2010.
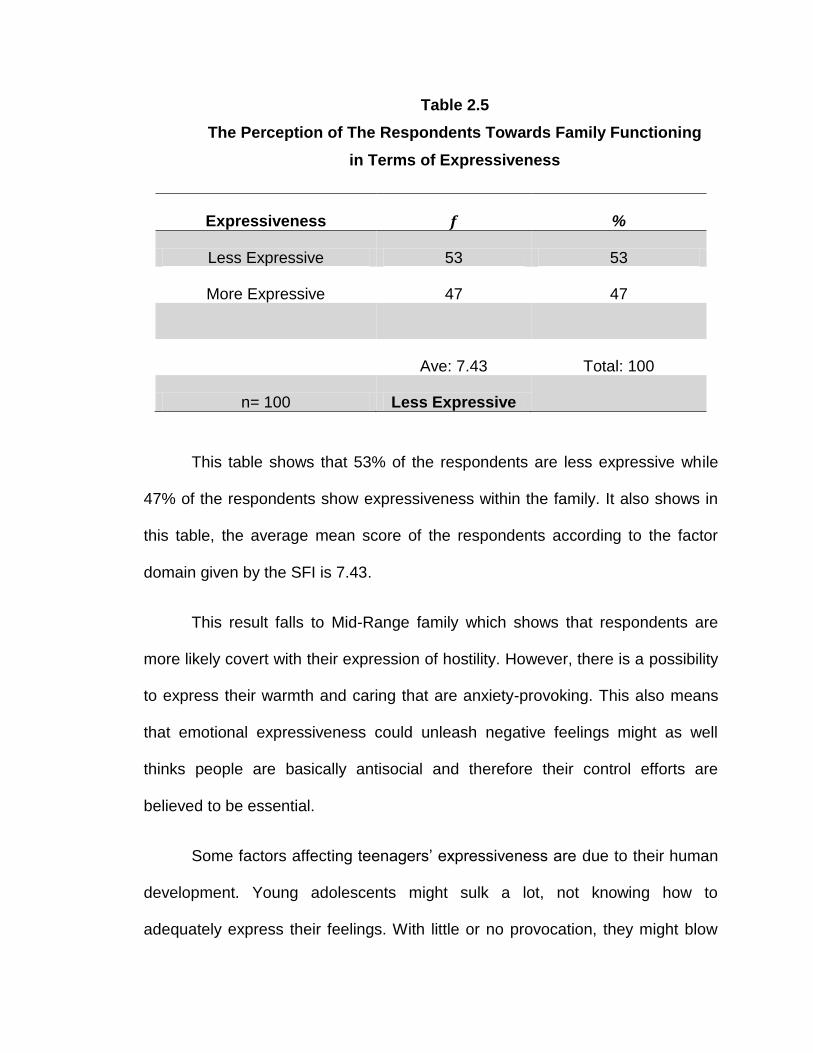
Table 2.5
The Perception of The Respondents Towards Family Functioning
in Terms of Expressiveness
This table shows that 53% of the respondents are less expressive while
47% of the respondents show expressiveness within the family. It also shows in
this table, the average mean score of the respondents according to the factor
domain given by the SFI is 7.43.
This result falls to Mid-Range family which shows that respondents are
more likely covert with their expression of hostility. However, there is a possibility
to express their warmth and caring that are anxiety-provoking. This also means
that emotional expressiveness could unleash negative feelings might as well
thinks people are basically antisocial and therefore their control efforts are
believed to be essential.
Some factors affecting teenagers’ expressiveness are due to their human
development. Young adolescents might sulk a lot, not knowing how to
adequately express their feelings. With little or no provocation, they might blow
Expressiveness %
Less Expressive 53 53
More Expressive 47 47
Ave: 7.43 Total: 100
n= 100 Less Expressive
up at their parents or siblings, a response that might reflect the defense
mechanism of displacing their feelings onto another person. Indeed,
environmental experiences may contribute more to the emotions of adolescence
than hormonal changes.
According to the instrument’s author’s research with his co-researcher,
teenagers, with ages 13 and higher are less likely to express themselves. In
summary, emotional expressiveness was rated as greatest at age 10, lowest at
age 16 and at an intermediate level currently (Hampson and Hyman 1994).
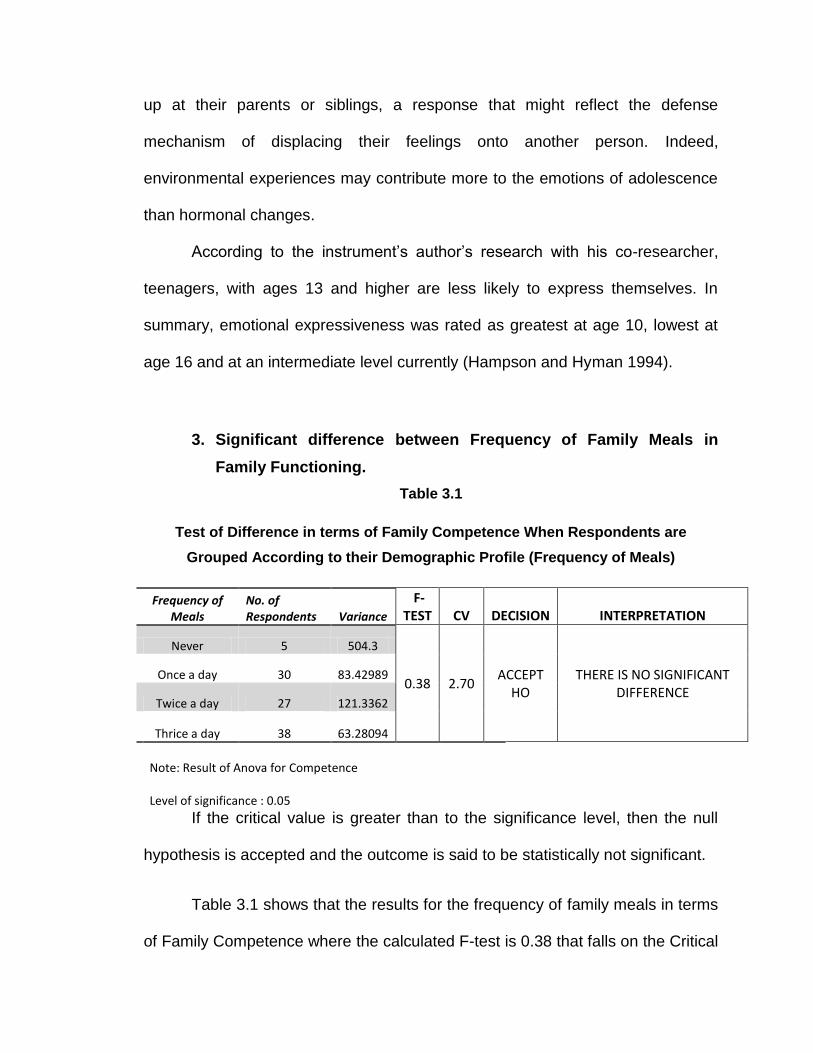
3. Significant difference between Frequency of Family Meals in
Family Functioning.
Table 3.1
Test of Difference in terms of Family Competence When Respondents are
Grouped According to their Demographic Profile (Frequency of Meals)
Frequency of Meals
No. of Respondents Variance
F-TEST CV DECISION INTERPRETATION
Never 5 504.3
0.38 2.70 ACCEPT
HO THERE IS NO SIGNIFICANT
DIFFERENCE Once a day 30 83.42989
Twice a day 27 121.3362
Thrice a day 38 63.28094
Note: Result of Anova for Competence
Level of significance : 0.05
If the critical value is greater than to the significance level, then the null
hypothesis is accepted and the outcome is said to be statistically not significant.
Table 3.1 shows that the results for the frequency of family meals in terms
of Family Competence where the calculated F-test is 0.38 that falls on the Critical

Value of 2.70 which is greater than the Alpha (α) level 0.05. This means that the
null hypothesis is being accepted. Thus, there is no significant difference
between frequency of family meals of the respondents and their perceived family
competence.
The result as seen in the table, frequency of eating meals with their family
could not really determine their family’s competence. Though the family eats
once, or thrice, the family could still be competent in facing challenges in life.
Consistent with this notion, aspects of the family environment may be
seen as a package of family features that influence youth development, with
shared meals and other family processes reinforcing each other (Furstenberg,
2011).
Table 3.2
Test of Difference in terms of Family Cohesion When Respondents are Grouped
According to their Demographic Profile (Frequency of Meals)
Frequency of Meals
No. of Respondents Variance
F-TEST CV DECISION INTERPRETATION
Never 5 45.7
0.3 2.7 ACCEPT
HO THERE IS NO SIGNIFICANT
DIFFERENCE
Once a day 30 5.895402
Twice a day 27 9.977208
Thrice a day 38 8.958748
Note : Result of Anova for Cohesion
Level of significance : 0.05
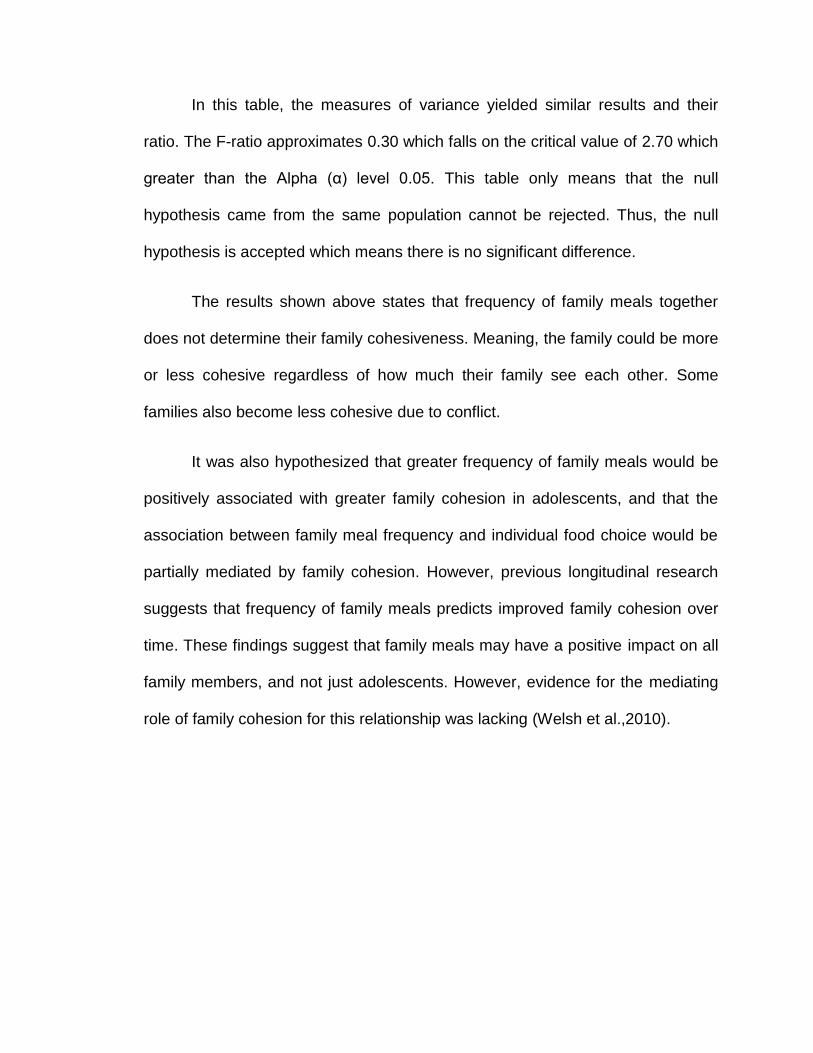
In this table, the measures of variance yielded similar results and their
ratio. The F-ratio approximates 0.30 which falls on the critical value of 2.70 which
greater than the Alpha (α) level 0.05. This table only means that the null
hypothesis came from the same population cannot be rejected. Thus, the null
hypothesis is accepted which means there is no significant difference.
The results shown above states that frequency of family meals together
does not determine their family cohesiveness. Meaning, the family could be more
or less cohesive regardless of how much their family see each other. Some
families also become less cohesive due to conflict.
It was also hypothesized that greater frequency of family meals would be
positively associated with greater family cohesion in adolescents, and that the
association between family meal frequency and individual food choice would be
partially mediated by family cohesion. However, previous longitudinal research
suggests that frequency of family meals predicts improved family cohesion over
time. These findings suggest that family meals may have a positive impact on all
family members, and not just adolescents. However, evidence for the mediating
role of family cohesion for this relationship was lacking (Welsh et al.,2010).
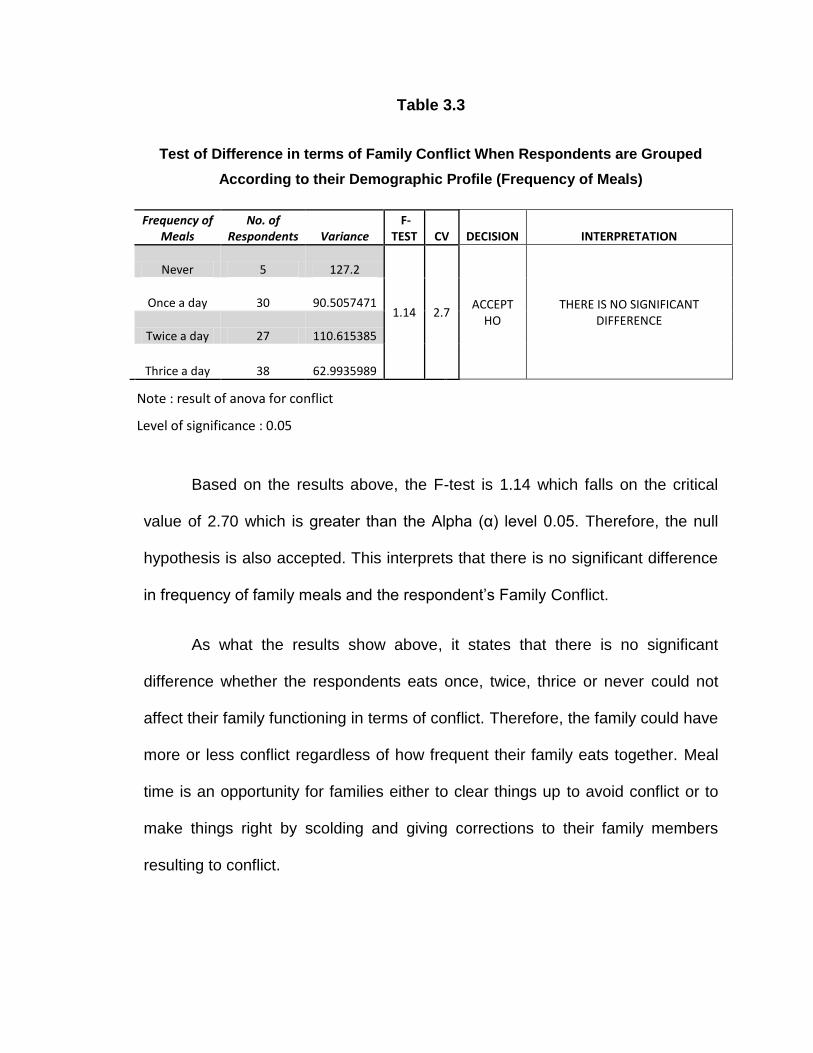
Table 3.3
Test of Difference in terms of Family Conflict When Respondents are Grouped
According to their Demographic Profile (Frequency of Meals)
Frequency of Meals
No. of Respondents Variance
F-TEST CV DECISION INTERPRETATION
Never 5 127.2
1.14 2.7 ACCEPT
HO THERE IS NO SIGNIFICANT
DIFFERENCE
Once a day 30 90.5057471
Twice a day 27 110.615385
Thrice a day 38 62.9935989
Note : result of anova for conflict
Level of significance : 0.05
Based on the results above, the F-test is 1.14 which falls on the critical
value of 2.70 which is greater than the Alpha (α) level 0.05. Therefore, the null
hypothesis is also accepted. This interprets that there is no significant difference
in frequency of family meals and the respondent’s Family Conflict.
As what the results show above, it states that there is no significant
difference whether the respondents eats once, twice, thrice or never could not
affect their family functioning in terms of conflict. Therefore, the family could have
more or less conflict regardless of how frequent their family eats together. Meal
time is an opportunity for families either to clear things up to avoid conflict or to
make things right by scolding and giving corrections to their family members
resulting to conflict.

The discussion assumes that family time is quality time. For some
families, shared time is another opportunity for conflict (Hammons, A. J., & Fiese,
B. H. 2011).
Table 3.4
Test of Difference in terms of Leadership When Respondents are Grouped
According to their Demographic Profile (Frequency of Meals)
The table shows that the calculated F-test is 0.65. This result falls at the
Critical Value of 2.70 which is greater than the Alpha (α) level 0.05. This
interprets that there is no significant difference between frequency of family
meals and the respondent’s perception towards leadership in the family.
The results above state that the respondents have greater or lesser
perceived Leadership in the family regardless of their frequency of meals
together. This means that parents and other family members could still
communicate with one another to accomplish some tasks and objectives within
the family. This is also concerned in parental leadership and directive leadership
versus rigid control in the family. Directive leadership is characterized by setting
Frequency of Meals
No. of Respondents Variance
F-TEST CV DECISION INTERPRETATION
Never 5 14.2
0.65 2.7 ACCEPT
HO THERE IS NO SIGNIFICANT
DIFFERENCE
Once a day 30 17.9954023
Twice a day 27 4.73789174
Thrice a day 38 14.8485064
Note : Result of anova for Leadership Level of significance : 0.05
clear objectives and rules for your subordinates and ensuring that your
expectations and directions are clearly defined and understood by your
subordinates while rigid families have trouble when faced with changing or
difficult family issues. This means that the respondents’ families may be inclined
to both type of leadership.
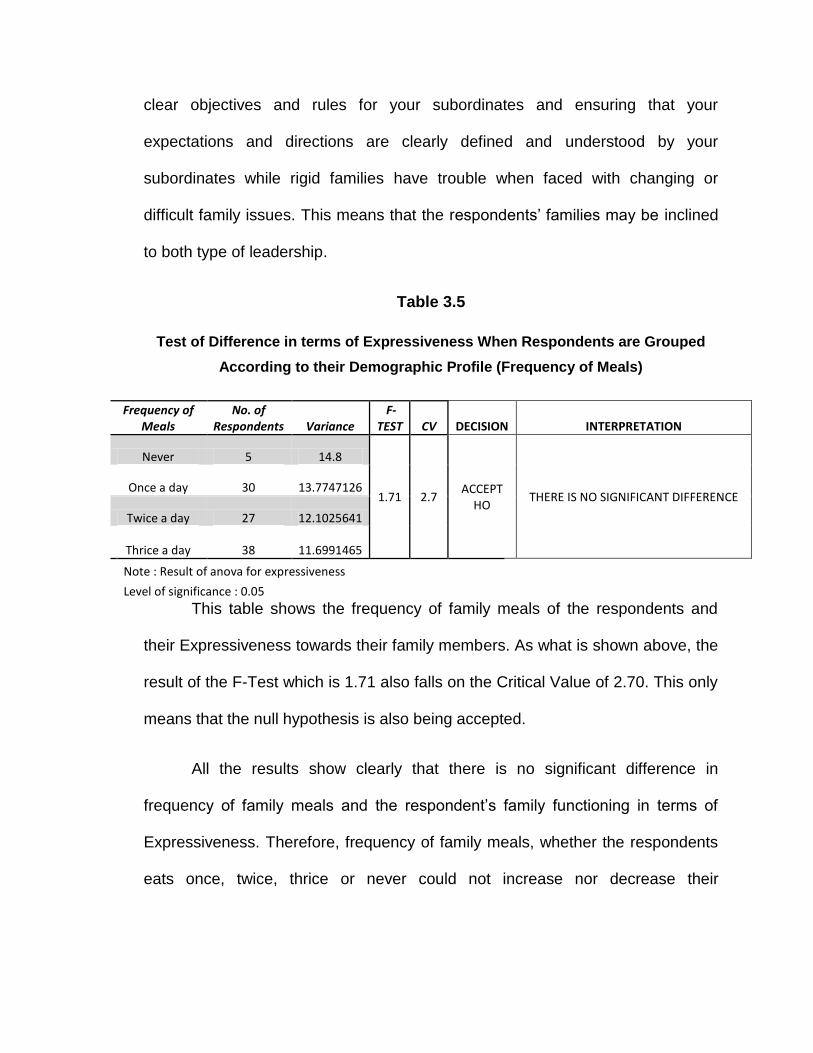
Table 3.5
Test of Difference in terms of Expressiveness When Respondents are Grouped
According to their Demographic Profile (Frequency of Meals)
This table shows the frequency of family meals of the respondents and
their Expressiveness towards their family members. As what is shown above, the
result of the F-Test which is 1.71 also falls on the Critical Value of 2.70. This only
means that the null hypothesis is also being accepted.
All the results show clearly that there is no significant difference in
frequency of family meals and the respondent’s family functioning in terms of
Expressiveness. Therefore, frequency of family meals, whether the respondents
eats once, twice, thrice or never could not increase nor decrease their
Frequency of Meals
No. of Respondents Variance
F-TEST CV DECISION INTERPRETATION
Never 5 14.8
1.71 2.7 ACCEPT
HO THERE IS NO SIGNIFICANT DIFFERENCE
Once a day 30 13.7747126
Twice a day 27 12.1025641
Thrice a day 38 11.6991465
Note : Result of anova for expressiveness
Level of significance : 0.05

expressiveness towards their family members regardless of their frequency of
meals.

Chapter 5
SUMMARY OF FINDINGS, CONCLUSIONS AND RECOMMENDATIONS
This chapter presents the summary of findings based on the results and
the researchers’ conclusions and recommendations.
Summary of findings
This study was conceptualized to know the perceived family functioning of
teenagers through family rituals, specifically in eating meals together.
1. In terms of the demographic profile of the respondents was according to their
gender, socioeconomic status and how does the frequency of meals of the
respondents can be described, the researchers have summed up the
following :
1.1. Based on the gathered data, most of the respondents are
between ages 14-17 years old and there are (36) males and
(64) females having the total of 100 respondents.
1.2. In terms of the respondents’ Family Socio-economic status,
only (0.25%) of the respondents got the highest family
income of P 60,000 and above, also, (0.11%) that have P
45,000 – P 59,000 while (0.14%) of the other respondents
got P30,000 – P 40,000 while (0.22%) for respondents got P
15,000- P29,000 then the remaining (0.28%) for the
respondents that have P 15,000 and below income. Most of
the respondent’s yearly family incomes fall on P15,000 and
below.
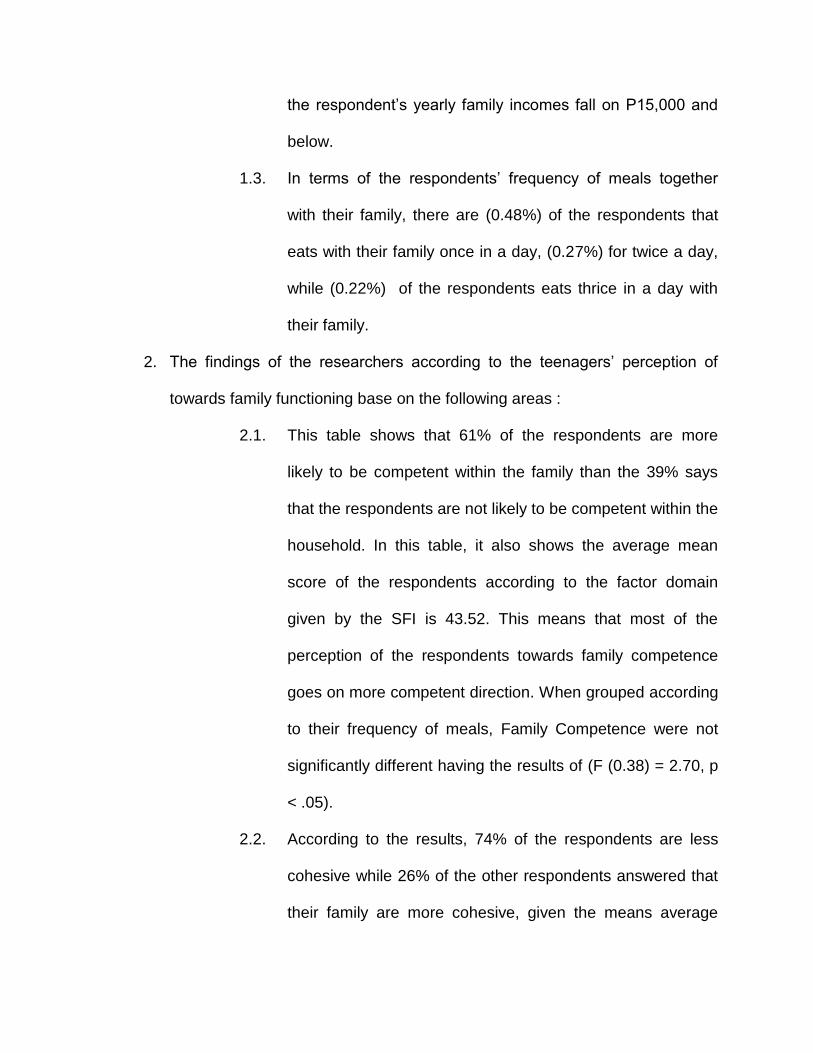
1.3. In terms of the respondents’ frequency of meals together
with their family, there are (0.48%) of the respondents that
eats with their family once in a day, (0.27%) for twice a day,
while (0.22%) of the respondents eats thrice in a day with
their family.
2. The findings of the researchers according to the teenagers’ perception of
towards family functioning base on the following areas :
2.1. This table shows that 61% of the respondents are more
likely to be competent within the family than the 39% says
that the respondents are not likely to be competent within the
household. In this table, it also shows the average mean
score of the respondents according to the factor domain
given by the SFI is 43.52. This means that most of the
perception of the respondents towards family competence
goes on more competent direction. When grouped according
to their frequency of meals, Family Competence were not
significantly different having the results of (F (0.38) = 2.70, p
< .05).
2.2. According to the results, 74% of the respondents are less
cohesive while 26% of the other respondents answered that
their family are more cohesive, given the means average
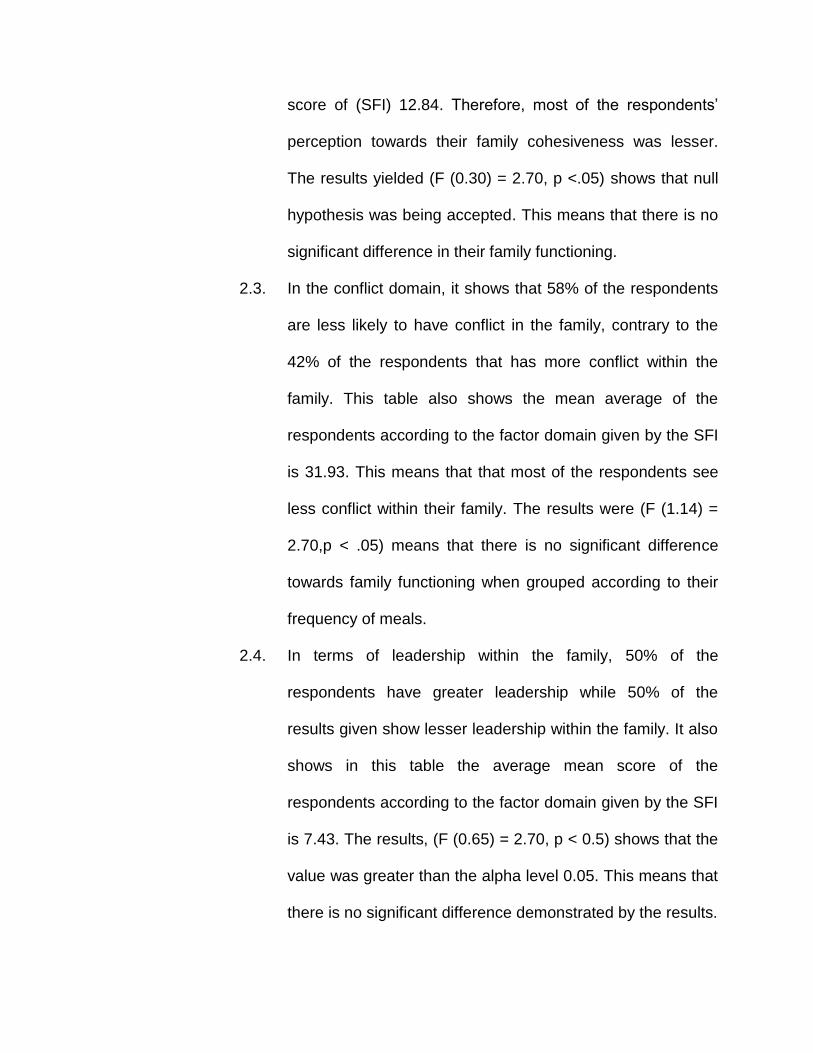
score of (SFI) 12.84. Therefore, most of the respondents’
perception towards their family cohesiveness was lesser.
The results yielded (F (0.30) = 2.70, p <.05) shows that null
hypothesis was being accepted. This means that there is no
significant difference in their family functioning.
2.3. In the conflict domain, it shows that 58% of the respondents
are less likely to have conflict in the family, contrary to the
42% of the respondents that has more conflict within the
family. This table also shows the mean average of the
respondents according to the factor domain given by the SFI
is 31.93. This means that that most of the respondents see
less conflict within their family. The results were (F (1.14) =
2.70,p < .05) means that there is no significant difference
towards family functioning when grouped according to their
frequency of meals.
2.4. In terms of leadership within the family, 50% of the
respondents have greater leadership while 50% of the
results given show lesser leadership within the family. It also
shows in this table the average mean score of the
respondents according to the factor domain given by the SFI
is 7.43. The results, (F (0.65) = 2.70, p < 0.5) shows that the
value was greater than the alpha level 0.05. This means that
there is no significant difference demonstrated by the results.

2.5. In terms of the respondents’ expressiveness, 53% of the
respondents are less expressive while 47% of the
respondents shows expressiveness within the family. It also
shows in this table, the average mean score of the
respondents according to the factor domain given by the SFI
is 7.43. Analysis of the results shows the result of (F (1.71) =
2.70, p < .05). This only means that the null hypothesis is
also being accepted that there is no significant difference
when grouped according to their frequency of family meals in
terms of the respondents’ expressiveness towards their
family members.
3. All the results show < .05 which means that null hypothesis that there is no
significant difference in frequency of family meals and the respondents’
perception on family functioning. Therefore, frequency of family meals,
whether the respondents eats once, twice, thrice or never could not increase
nor decrease their perception of family functioning towards their family
members.
Conclusions
1. In terms of the respondents’ demographic profile, the researchers have
concluded the following :
1.1. In terms of their demographic, the researchers’ respondents are
teenagers. With this, the researchers conclude that most of the
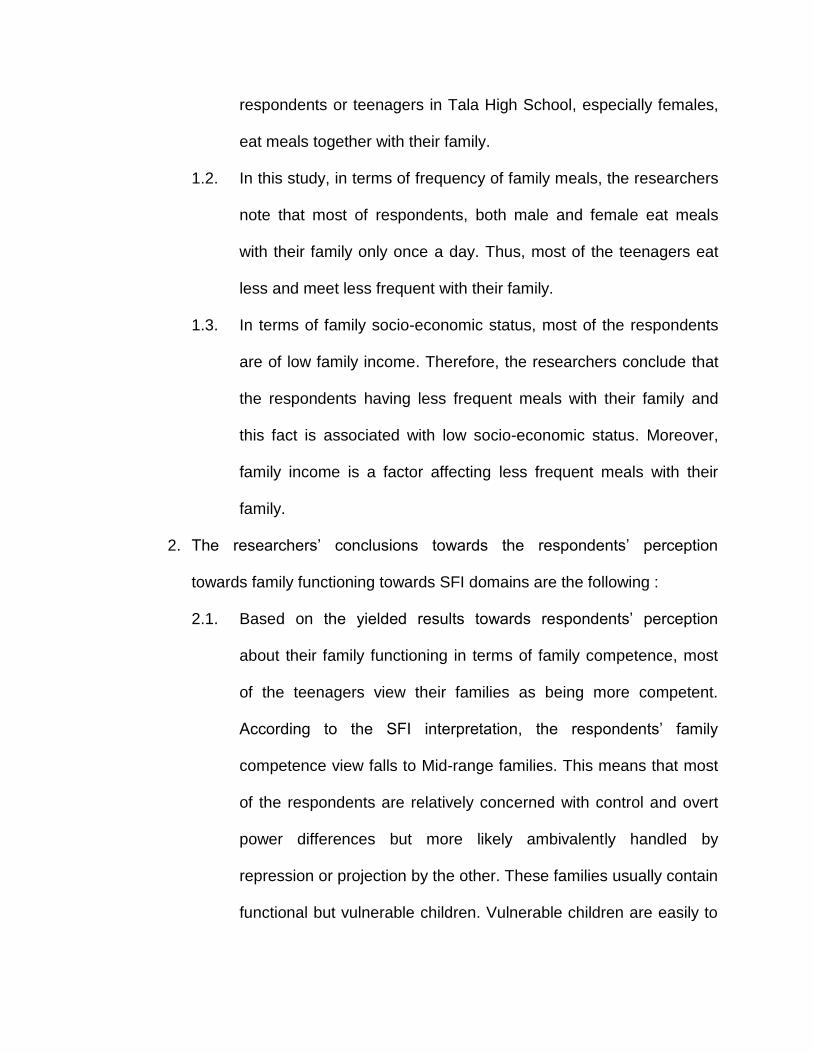
respondents or teenagers in Tala High School, especially females,
eat meals together with their family.
1.2. In this study, in terms of frequency of family meals, the researchers
note that most of respondents, both male and female eat meals
with their family only once a day. Thus, most of the teenagers eat
less and meet less frequent with their family.
1.3. In terms of family socio-economic status, most of the respondents
are of low family income. Therefore, the researchers conclude that
the respondents having less frequent meals with their family and
this fact is associated with low socio-economic status. Moreover,
family income is a factor affecting less frequent meals with their
family.
2. The researchers’ conclusions towards the respondents’ perception
towards family functioning towards SFI domains are the following :
2.1. Based on the yielded results towards respondents’ perception
about their family functioning in terms of family competence, most
of the teenagers view their families as being more competent.
According to the SFI interpretation, the respondents’ family
competence view falls to Mid-range families. This means that most
of the respondents are relatively concerned with control and overt
power differences but more likely ambivalently handled by
repression or projection by the other. These families usually contain
functional but vulnerable children. Vulnerable children are easily to
be hurt or harmed physically, mentally or emotionally and open to
attack, harm, or damage. With this, the researchers conclude that
the results were due to less frequent opportunities for the family
members to communicate with each other, to know what’s
happening with their lives, misunderstanding occurs. On the other
hand, the respondents’ families were functional. This means that
the families still have remedies to cope up with the issues and
problems within their family.
2.2. In terms of the respondents’ perception of their family
cohesiveness, according to the SFI interpretation guide meaning,
most of the respondents falls on mid-range families which states
that coalition or partnership between parents that is tenuous with
unresolved family issues are openly displayed. This means that
most of the respondents’ family was less cohesive due to blaming,
attacking and overt hostility towards their family members. With
less talks and meetings, the researchers conclude also that this is
due to miscommunications among family members and that less
cohesiveness occurs when less frequent gatherings becomes an
opportunity for scolding than understanding.
2.3. In terms of family conflict, the respondents view their family as
having less conflict. According to the interpretation manual,
ambivalence is frequently handled by denying one half of a pair of
strong feelings and using repression or projection for the other. As

what the researchers concluded, the family members were prone of
repressing and denials being tolerated resulting to less conflict.
2.4. Lastly, in terms of the respondents’ emotional expressiveness, mid-
range family type shows that respondents are more likely covert
with their expressions of hostility. However, there is a possibility to
express their warmth and caring that are anxiety-provoking.
3. Moreover, the results show that there is no significant difference towards
the perception of the teenagers towards family functioning when grouped
according to their frequency of family meals. Meaning, regardless of how
frequent the respondents eat together, the respondents could still yield
positive or negative view of their family functioning.
Recommendations
Based on the reported findings and conclusions, the researchers
recommend the following:
1. The researchers recommended that both genders should be equally distributed for the
study not to be biased to the overall results. Thus, this study is for the future
researchers who are interested about variables pertaining to family’s role to teenagers,
that they may obtain further results by including gender differences in their study.
2. As what is based on the findings of study, most of the respondents were of low family
income where it affects their decreasing meals together with their family. However, the
teenagers are still being encouraged by the researchers to consistently communicate

and draw more quality time together with their families aside from having family
dinners.
3. The researchers considerately recommend to parents especially those who already
have teens to at least make interesting topics while having meals together instead of
using mealtimes as an opportunity to scold them or blame so that they will know what’s
happening to their child.
4. For mothers, to create appetizing meals that is affordable so that the teenagers would
indulge themselves to eat along with their family members and share the things that are
happening to them to lessen misunderstandings.
5. The researchers recommend this study to be beneficial for the school in considering the
family functioning in relation to eating meals together. In this matter, the researchers
respectfully recommend the school to provide seminars and activities ascribed to
increase the students’ understanding with regards on their regulation of meals with
their family.
6. For those individuals who needs further information that eating meals together can
help family happy and the essence of family meals is that families have their quality time
together talking about what’s going on in their lives making it able for parents to know
how to maintain an intimate relationship towards their children as well as to give
guidance to their future adults.
References
BOOKS
Nichols, M., & Schwartz, R. (2007). The essentials of family therapy (3rd ed.).
Boston: Pearson/Allyn & Bacon.
JOURNALS
Welsh, E., French, S., & Wall, M. (2011). Examining the Relationship Between
Family Meal Frequency and Individual Dietary Intake: Does Family Cohesion
Play a Role? Journal of Nutrition Education and Behavior, 229-235.
Stewart, S., & Menning, C. (2009). Family Structure, Nonresident Father
Involvement, And Adolescent Eating Patterns. Journal of Adolescent Health, 193-
201.
Cornell University. Survey Research Institute. Cornell National Social Survey.
(2011)
[Computer file]. CISER version 1. Ithaca, NY: Cornell Institute for Social and
Economic
Research [producer and distributor], 2012.
Johnson, D., & Young, R. (2011). Toward best practices in analyzing data sets
with missing data: Comparisons and recommendations. Journal of Marriage and
Family, (10.1111), 926-945.
Hammons, A., & Fiese, B. (2011). Is Frequency Of Shared Family Meals Related
To The Nutritional Health Of Children And Adolescents? Pediatrics, (10.1542),
E1565-E1574

Musick, K., & Meier, A. (2012). Assessing Causality and Persistence in
Associations between Family Dinners and Adolescent Well-Being. Journal of
Marriage and Family, (10.1111), 476-493.
Bisakha, S. et al. (2010). Does the Frequency of Family Meals Affect Adolescent
Problem Behavior? Journal of Adolescence, 20.
Neumark-Sztainer, D., Larson, N., Fulkerson, J., Eisenberg, M., & Story, M.
(2010). Family Meals And Adolescents: What Have We Learned From Project
EAT (Eating Among Teens)?Public Health Nutrition, (10.1017), 1113-1121.
Murray, P. (2011). A Discussion Paper on Personalized Transition from The
Centre for Welfare Reform. Developing Family Leadership.
Pezullo, L., Taylor, P., Mitchell, S., Pejoski, L., Le, K., & Bilgrami, A. (2010). Final
Report by Access Economics Pty Limited for Department of Families, Housing,
Community Services and Indigenous Affairs. Positive Family Functioning.
Neumark-Sztainer, D., Hannan, P., Story, M., Croll, J., & Perry, C. (2003). Family
meal patterns: Associations with sociodemographic characteristics and improved
dietary intake among adolescents. Journal of the American Dietetic
Association, 317-322.
Fulkerson, J., Kubik, M., Story, M., Lytle, L., & Arcan, C. (2009). Are There
Nutritional And Other Benefits Associated With Family Meals Among At-Risk
Youth? Journal of Adolescent Health, 389-395.
Duncan Gregory J., Kathleen M. Ziol-Guest, and Ariel Kalil. (2010). “Early-
Childhood Poverty and Adult Attainment, Behavior, and Health.” Child
Development 81(1):306-25.

Sen, B. (2010). The relationship between frequency of family dinner and
adolescent problem behaviors after adjusting for other family
characteristics. Journal of Adolescence,187-196.
Fruh, S., Fulkerson, J., Mulekar, M., Kendrick, L., & Clanton, C. (2011). The
Surprising Benefits of the Family Meal. The Journal for Nurse Practitioners, 7 (1),
18-22.
Harrar, S. (2003). Family rituals bring comfort and joy. Prevention, 55 (7), 28 [On-
line]. Available: Academic Search Premier database.
Shriner, J., & Shriner, J. (2007). The importance of Rituals in Family Life. Fact
Sheet.
Sarsour, K., Sheridan, M., Jutte, D., Nuru-Jeter, A., Hinshaw, S., & Boyce, W.
(2011). Family Socioeconomic Status and Child Executive Functions: The Roles
of Language, Home Environment, and Single Parenthood. Journal of the
International Neuropsychological Society, (10.1017/S1355617710001335), 120-
132.
Wilk, R. (2010). Power at the Table: Food Fights and Happy Meals. Cultural
Studies Critical Methodologies, (10.1177/1532708610372764), 428-436.
WEBSITES
Do Family Meals Really Make a Difference? (2012, January 1). Retrieved from
http://www.human.cornell.edu/pam/outreach/upload/Family-Mealtimes-2.pdf
Ciccone, Jillian, "Parent and young adolescent perspectives of family meals and
meal preparation and the influence of the Kinect-Ed program" (2013). Electronic
Theses and Dissertations. Paper 4878. http://scholar.uwindsor.ca/etd/4878

Crumbo, Christine. "Rituals bind families closer. (Originated from Knight-Ridder
Newspapers)." Knight Ridder/Tribune News Service. McClatchy-Tribune
Information Services. 1993. Retrieved October 14, 2014 from HighBeam
Research:http://www.highbeam.com/doc/1G1-14737833.html
APPENDICES
Appendix A : Letter of Permissions
-Permission to conduct a research
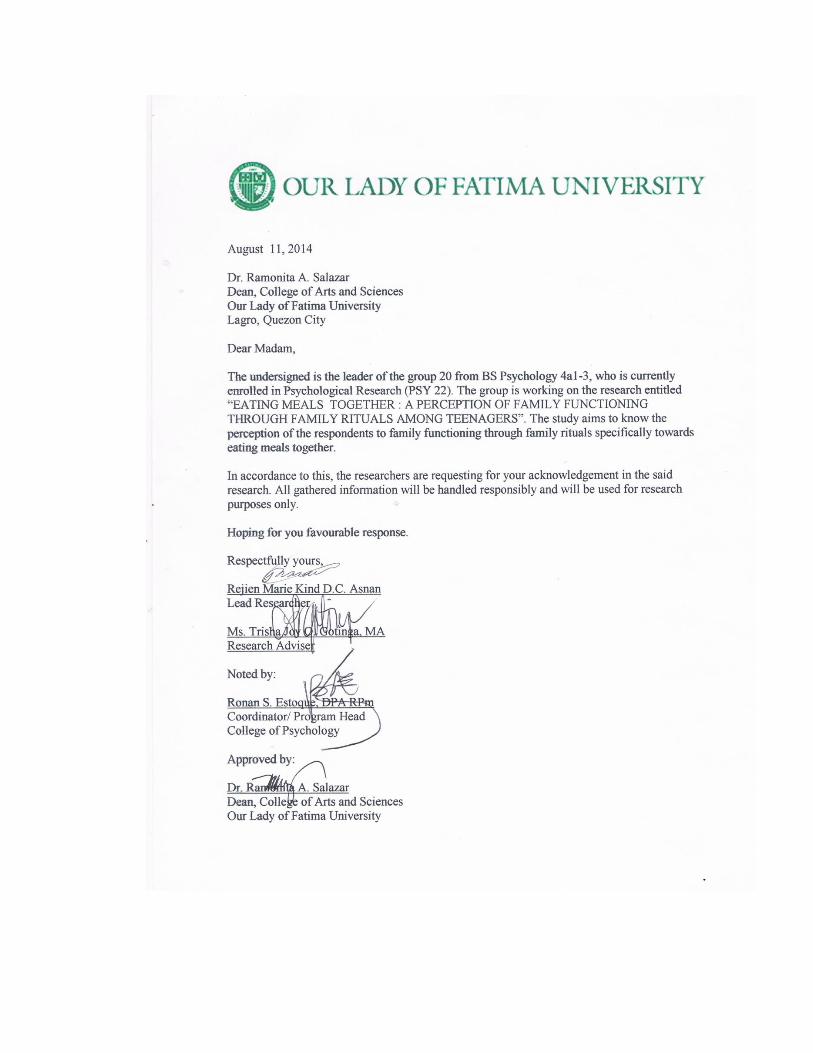
-Permission to conduct a Survey
Appendix B : Approval Sheet
RECOMMENDATION
This is to certify that the study entitled: EATING MEALS TOGTHER : A
PERCEPTION OF FAMILY FUNCTIONING THROUGH FAMILY RITUALS
AMONG TEENAGERS prepared by Asnan, Rejien Marie Kind D.C., Manalo, Rickee
Mae B., and Villanueva, Medalyn April R. has been examined and recommended for
FINAL-ORAL defense.
TRISHA JOY O. GOTINGA, MA CHERYL P. LUMIGUEN, MAT
Adviser Statistician
APPROVAL SHEET
This is to certify that the study entitled: EATING MEALS TOGTHER : A
PERCEPTION OF FAMILY FUNCTIONING THROUGH FAMILY RITUALS
AMONG TEENAGERS prepared by Asnan, Rejien Marie Kind D.C., Manalo, Rickee
Mae B., and Villanueva, Medalyn April R. has PASSED the FINAL-ORAL defense.
DR. RONAN S. ESTOQUE, RPm JIGO RAFAEL C. CATAMIO, MAEd.,RGC
Member Member
JOHN ERLIX A. BARRION
Chairman
Accepted and approved in partial fulfillment of the requirements for the degree Bachelor
of Science in Psychology.
CHERYL P. LUMIGUEN, MAT
Coordinator, Research and Development
DR. RONAN S. ESTOQUE, RPm
Program Head, Department of Psychology
RAMONITA SALAZAR, Ed. D.
Dean, College of Arts and Sciences

Appendix C : Letter of Consent
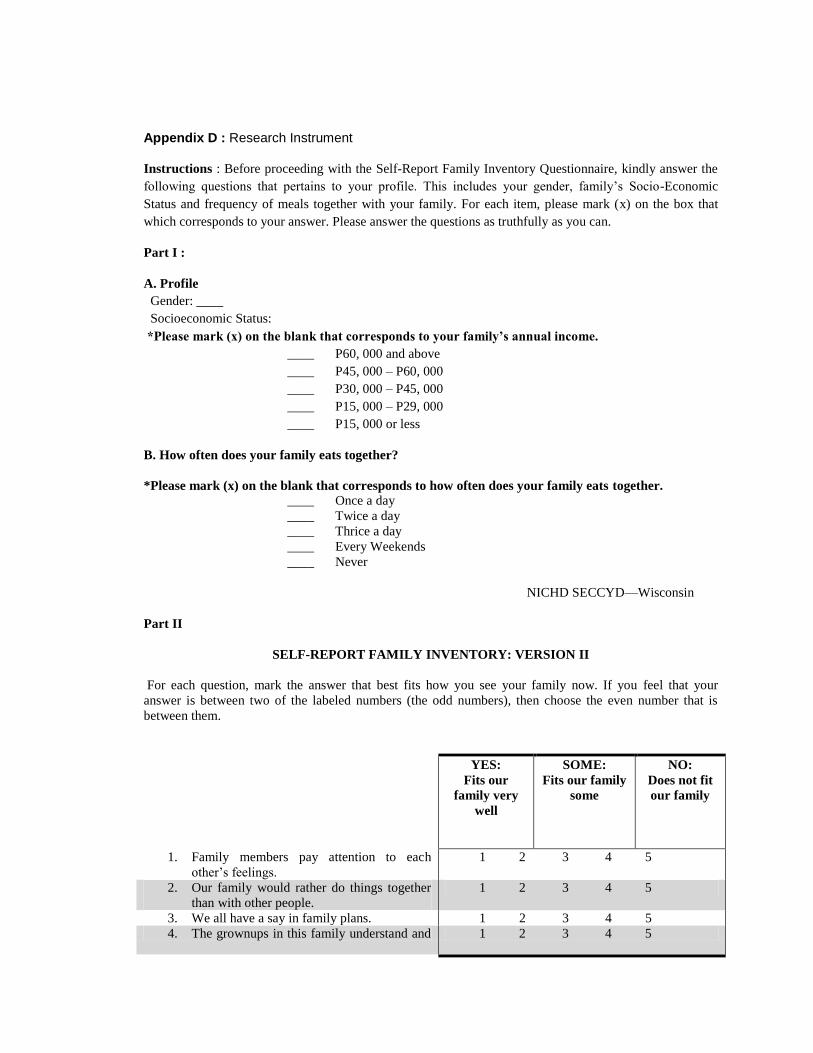
Appendix D : Research Instrument
Instructions : Before proceeding with the Self-Report Family Inventory Questionnaire, kindly answer the
following questions that pertains to your profile. This includes your gender, family’s Socio-Economic
Status and frequency of meals together with your family. For each item, please mark (x) on the box that
which corresponds to your answer. Please answer the questions as truthfully as you can.
Part I :
A. Profile
Gender: ____
Socioeconomic Status:
*Please mark (x) on the blank that corresponds to your family’s annual income.
____ P60, 000 and above
____ P45, 000 – P60, 000
____ P30, 000 – P45, 000
____ P15, 000 – P29, 000
____ P15, 000 or less
B. How often does your family eats together?
*Please mark (x) on the blank that corresponds to how often does your family eats together.
____ Once a day
____ Twice a day
____ Thrice a day
____ Every Weekends
____ Never
NICHD SECCYD—Wisconsin
Part II
SELF-REPORT FAMILY INVENTORY: VERSION II
For each question, mark the answer that best fits how you see your family now. If you feel that your
answer is between two of the labeled numbers (the odd numbers), then choose the even number that is
between them.
YES:
Fits our
family very
well
SOME:
Fits our family
some
NO:
Does not fit
our family
1. Family members pay attention to each
other’s feelings.
1 2 3 4 5
2. Our family would rather do things together
than with other people.
1 2 3 4 5
3. We all have a say in family plans. 1 2 3 4 5
4. The grownups in this family understand and 1 2 3 4 5

agree on family decisions.
5. Grownups in the family compete and fight
with each other.
1 2 3 4 5
6. There is closeness in my family but each
person is allowed to be special and different.
1 2 3 4 5
7. We accept each other friends. 1 2 3 4 5
8. There is confusion in our family because
there is no leader.
1 2 3 4 5
9. Our family members touch and hug each
other.
1 2 3 4 5
10. Family members put each other down. 1 2 3 4 5
11. We speak our minds, no matter what. 1 2 3 4 5
12. In our home, we feel loved. 1 2 3 4 5
13. Even when we feel close, our family our
family is embarrassed to admit it.
1 2 3 4 5
14. We argue a lot and never solve problems. 1 2 3 4 5
15. Our happiest times are at home. 1 2 3 4 5
16. The grownups in this family are strong
leaders.
1 2 3 4 5
17. The future looks good to our family. 1 2 3 4 5
18. We usually blame one person in our family
when things aren’t going right.
1 2 3 4 5
19. Family members go their own way most of
the time.
1 2 3 4 5
20. Our family is proud of being close. 1 2 3 4 5
21. Our family is good at solving problems
together.
1 2 3 4 5
22. Family members easily express warmth and
caring towards each other.
1 2 3 4 5
23. It’s okay to fight and yell in our family. 1 2 3 4 5
24. One of the adults in this family has a
favorite child.
1 2 3 4 5
25. When things go wrong we blame each other. 1 2 3 4 5
26. We say what we think and feel. 1 2 3 4 5
27. Our family members would rather do things
with other people than together.
1 2 3 4 5
28. Family members pay attention to each other
and listen to what it is said.
1 2 3 4 5
29. We worry about each other’s feelings. 1 2 3 4 5
30. The mood in my family is usually sad and
blue.
1 2 3 4 5
31. We argue a lot. 1 2 3 4 5
32. One person controls and leads our family. 1 2 3 4 5
33. My family is happy most of the time. 1 2 3 4 5
34. Each person takes responsibility for his/her
behavior.
1 2 3 4 5
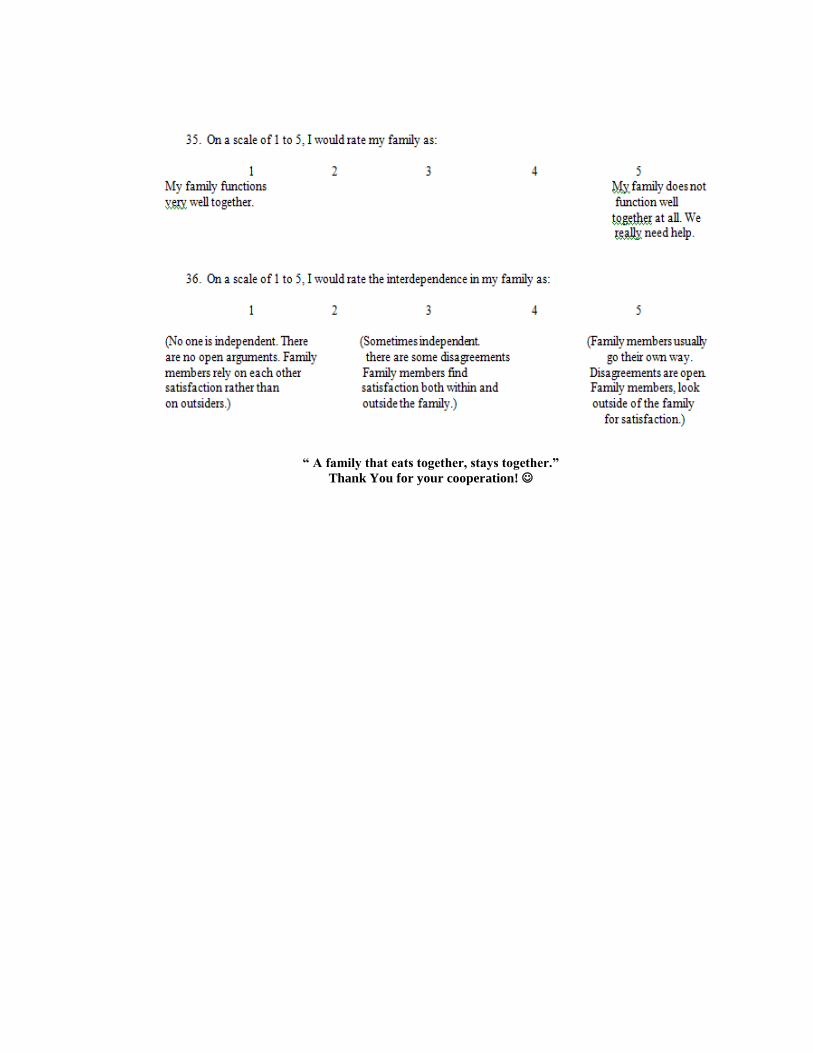
“ A family that eats together, stays together.”
Thank You for your cooperation!
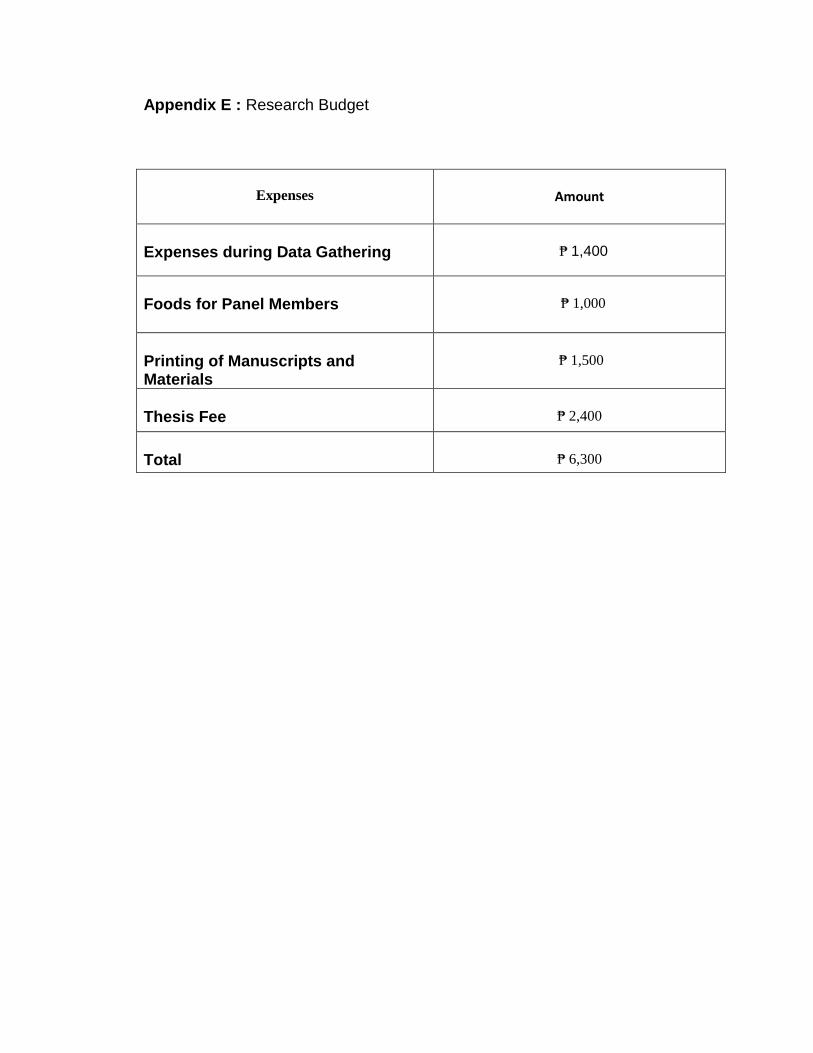
Appendix E : Research Budget
Expenses
Amount
Expenses during Data Gathering
₱ 1,400
Foods for Panel Members
₱ 1,000
Printing of Manuscripts and Materials
₱ 1,500
Thesis Fee
₱ 2,400
Total
₱ 6,300

Appendix F : Research Timeline
Dates Activities
June16-18 Orientation
June 23-26 Title Oral Defense
June 30-July 2 Lectures: Formulation of Chapter 1
July 7-9 Submission and checking of chapter 1
July 14-16 Lecture: Formulation of Chapter 2
July 21-23 Submission and checking of chapter 2
July 22-26 Preliminary Examination
July 28 Eidl Ftr
July 30 Lecture: Formulation of Chapter 3
August 4-6 Submission and checking of chapter 3
August 11, 13, 18, 20 Pre-Oral Defense
August 21 Ninoy Aquino Day
August 25 National Heroes Day
August 27-September 1 Data Gathering
September 2-6 Midterm Examination
September 8-10 Lecture: Formulation of Chapter 4 and 5
September 15-17 Final Checking of Manuscript
September 22, 24, 29 Final Oral Defense
October 6-8 Final
Revisions/modifications/improvement
Of manuscript
October 6 Signing of the Panel members
October 13 Submission of manuscript to the
Research Coordinator for book
binding
October 14 Final Examination
October 20-25 Semestral Break

Appendix G : Certifications
CERTIFICATE OF ORIGINALITY
We, hereby certify that this Research is our own work and that, to the best of our
knowledge and belief, it contains no material previously written or published by another person
or organization nor any material which has been accepted for award of any other degree or
diploma from a university or institution of higher learning, except where due acknowledgement is
made thereof.
Furthermore, we declare that the intellectual contact of this research is the product of our
work although we have received assistance from others on the manner of organization,
presentation, language and style.
Rejien Marie Kind D.C. Asnan
Rickee Mae B. Manalo
Medalyn April R. Villanueva
Researchers
Date:October 22, 2014
Attested by:
TRISHA JOY O. GOTINGA, MA
Adviser
Date: October 22, 2014
CERTIFICATE OF ETHICS
We, hereby certify that this research study undergone certain procedures and considered
the ethical standards before conducting the research proper. Thus, contain materials that are
complied with the administrative staffs of the respondent together with the approval of the
institution as implied to the required rules and regulation.
Furthermore, we declare that the procedures and considerations during the collection of
data and gathering of information were critically and ethically considered. Hence, approved and
acknowledge ethical by the researcher’s adviser and research panelist.
Rejien Marie Kind D.C. Asnan
Rickee Mae B. Manalo
Medalyn April R. Villanueva
Researchers
Date: October 22, 2014
Attested by:
TRISHA JOY O. GOTINGA, MA
Adviser
Date: October 22, 2014

Appendix H : Curriculum Vitae
Rejien Marie Kind D.C. Asnan
#350 Ilang-Ilang St. Bo. Sto. Nino Tala, Caloocan City
Personal Information
Date of Birth: November 16, 1994
Age: 19 years old
Gender: Female
Educational Attainment
Tertiary Our Lady of Fatima University 2011-present
Secondary Holy Rosary College Foundation 2006-2010
Primary Apolinario Mabini Elementary School 2000-2006
Seminars Attended
Peer Counseling Training Program April 3 – 4,
2013
PSYCHSUMMIT 2 (Knowledge, Attitude and Behavior) March 01, 2014 26TH Annual Convention of the Psychological January 18, 2013 Association of the Philippines. Sharpen Your Innate Leadership Skills for Better January 19, 2013

Medalyn April R. Villanueva
#432 G. Bautista St. San Jose Rodriguez Rizal
Contact No. 09353879974
Personal Information
Gender: Female Height : 5
Civil Status: Single Weight : 43 kg
Age: 25 Religion : Roman
Catholic
Birth Date: April 21, 1989 Citizenship : Filipino
Birth Place: Manila Educational Attainment Primary: Eulogio Rodriguez Jr. Elementary School 1997-2003
Secondary: San Jose Nat’l High School 2003-
2007
Collage: Our Lady of Fatima University
Course: BS Psychology
Work
Experience_______________________________________________________________
____
Mercury Drug Corporation We Serve
Pharmacy Generic
OJT- Pharmacy
Assistant
October to December 2011 January 28, 2013 –
present 2014

JP Rizal, Marikina City Urban Rodriguez
Rizal
Character
References___________________________________________________
Mrs. Sherilyn P. Jimenez Mr. Rusty Ross
Macchetti
Register Pharmacist Supervisor
Mercury Drug Corporation We Serve
Pharmacy
JP Rizal, Marikina City Urban Rodriguez
Rizal
09172550501 09424827336