influence of three meals versus six meals per day on rate of ...
131
INFLUENCE OF THREE MEALS VERSUS SIX MEALS PER DAY ON RATE OF BODY METABOLISM By VELLA MARIE BURNS Bachelor of Science Oklahoma ~tate University Stillwater, Oklahoma 1957 Submitted to the Faculty of the Graduate School of the Oklahoma State University in partial fulfillment of the requirements for the degree of MASTER OF SCIENCE August, 1965
-
Upload
khangminh22 -
Category
Documents
-
view
1 -
download
0
Transcript of influence of three meals versus six meals per day on rate of ...
INFLUENCE OF THREE MEALS VERSUS SIX MEALS PER
DAY ON RATE OF BODY METABOLISM
By
VELLA MARIE BURNS
Bachelor of Science
Oklahoma ~tate University
Stillwater, Oklahoma
1957
Submitted to the Faculty of the Graduate School of the Oklahoma State University
in partial fulfillment of the requirements for the degree of MASTER OF SCIENCE
August, 1965

/ c;,/c:·' / {,, / • ...,1
r./. {~' / 7 I :..) / u' .,A.-,J
c . (i f' 2,

INFLUENCE OF THREE MEALS VERSUS SIX MEALS PER
DAY ON RATE Of BODY METABOLISM
The sh Approved;
ii
592722
ACKNOWLEDGEMENTS
Indebtedness is acknowledged to Miss Cheryl Bittle, Miss Sherry
Davison, Miss Glenda Howl, Miss Margaret Ann Morgan and Miss Joyce
Phillips for their invaluable assistance, keen interest and generous
grants of time while serving as subjects in this study; Dr. Helen F.
Barbour, thesis adviser, for sharing her vast knowledge, valtiable
guidance, keen interest and grants of time for without her painstaking
efforts this study would not be possible; Mr. Louis L. Share, Laboratory
and X-Ray Technician, Oklahoma State University Hospital for the loan
of the Jones Waterless Motor-Basal Metabolism Unit, his willingness
to give invaluable assistance and keen interest in this study; Dr.
Donald L. Cooper, M.D., Director of the Oklahoma State University
Hospital and Clinic, for sharing his vast knowledge and valuable time;
Mrs. Julius Pat~llo, Head Dietitian, Willard Hall, Oklahoma State
University for her assistance in obtaining the menus in advance; and
to my family fo:i;- all their understanding, patience and assistance
during this trying time.
iii
Chapter
I.
II.
TABLE OF CONTENTS
INTRODUCTION. . . . REVIEW OF. LITERATURE. • r • •
Historical Review •• • • 1' •
Calorimetry. • • . • • . • • • • . Res·pir at ion. . • • • • • •.• . ~. . . . . . . . Basal Metabolism •••.•• Basal Metabolism Standards. Energy Expenditure • • . • • ..•. Standards for Energy Requirement Effects of D;i.ets ••••
. . . . , .
...
I II • METHOD OF PROCEDURE • • . . . . . . . . . . . . . . . . .
Page
1
5
5 10 14 15 17 19 23 26
33
Physi~al Measurements. • • • • . • r • ~. • . • 35 Calculation of D;i.ets... • • • • . • • • 37 How to Make the Metabolic Test. • • • . • • • 39 Simple Instructions for Operating the Jones
Motor-Basal. • • • · • . • • • • • • • • 42
IV. RESULTS AND DISCUSSION •.• . ................ . 44
V. SUMMARY AND CONCLUSIONS .•• . . . . . . . . . . 57
BIBLIOGRAPHY . . . 60
APPENDICES .•. . ' . . . 63
iv

LIST OF TABLES
Table
1. Physical measurements of subjects, • • I •
2. Basal metabolic rates of subjects •• . . 3. Increased oxygen consumption above basal (S.D.A.).
4. Three weeks sununary of food intake for subjects con-SUilling three meals per day . • . ..•
5. * Cumulative temperature readings of subjects (basal state) recorded during the seven week period •••
* 6. Cumulative temperature readings of subjects (S.D.A.) recorded during the seven week period. . ••.
7. Cumulative weight of subjects during the seven weeks .
* 8. Cumulative pulse rate record of subjects before and
9.
10.
11.
12.
13.
14.
after determination of basal metabolism during the seven weeks ••
* Cumulative pulse rate record of subjects (S,D.A.) after the ingestion of food during the seven weeks . ••
* Cumulative respiration rate of subjects (basal state) during the seven weeks •..•.••..••••••
* Cumulative respiration rate of subjects (S.D.A.) during the seven weeks. , • • • •••••• , •••
Basal metabolic rates of subjects eating six meals per day.
Increased oxygen consumption above basal after the ingestion of food (S.D.A.) when six meals per day are eaten ...
Four weeks summary of food intake for subjects consuming six meals per ' day ••.•••..•••••.•••.•
v
Page
33
44
45
47
48
48
49
50
52
53
53
54
54
56

APPENDIX
Page
A. Daily Record of Food Intake ••• 65
New Reconunended Allowances. . . . . . . . . . 68
B. Diet Patterns. • • • • . . . . . 70
c. Food Exchange Lists. 81
D. A Modified Fruit Exchange List • f • • 86
E. Weekly Summary of Food Intake for Subjects Consuming '.J;hr ee Meals Per Day • • • • • • • . • . • . • • , • • • • 88
F. Weekly·Summaryof Foed Intake·for Subjects Consuming Six Meals Per Day. • • • • • • • • • • • • • • • • • 104
LIST OF ILLUSTRATIONS
Plate
I. A Typical ~etabolic Record ••• 40
II. The Jones .Motor-Basal Metabolism Unit •.• . . . 43
vi
CHAPTER I
INTRODUCTION
During recent years there has been a very considerable increase
of interest as to what role different eating patterns play as a factor
in regulating intermediary metabolism of man. More specific research
methods especially adapted for studying the component parts of total
metabolism must be applied in this type of study, which is physio
chemical in nature.
The purpose of this study is to determine the effect of food on
the basal metabolic rate and the changes in rate of energy metabolism
which occur after different patterns of food ingestion: to study and
compare the daily pattern of metabolism when regular meals are eaten
with the daily pattern of metabolism when small, frequent meals are
eaten and moderate exercise·. is performed between the meals. In Cohn's
(7) study the consumption of full meals spaced at three regular times
per day were contrasted with frequent small feedings. His results
with experimental rats eating three full meals showed (a) increased
body fat, (b) decreased body protein and water, (c) altered thyroid
and tissue enzymatic activities, (d) enhan~ed atherosclerosis, and
(e) an· increase in the severity of diabetes.
In this study the following assumptions have been accepted:
1. If a subject is fed an isocaloric diet containing known
1

nutrient levels, but the frequency of feeding. is varied
throughout the day, over a period of time changes.in
basal and energy metabolism can be attributed to the
spacing of the meals.
2. The environmental conditions of subjects for this study
can be controlled.
3. Subjects can be obtained who are approximately the same
age and sex.
4. Subjects can be obtained who are within 10 per cent of
desirable body weight for age and height.
5. Subjects can be obtained who are free from disease.
6. Three to four weeks of adherence to spacing of meals
into three meals per day and six meals per day is
sufficiently long to determine some·change in basal and
energy metabolism, if such takes place.
The author plans to test the following hypotheses:
2
1. A diet containing a constant amount and source of nutrients
but consumed at three and six intervals during the day can demon
strate·. a relationship between spacing of meals and the basal and
energy metabolic rate.
2. When a subject ingests a standardized diet over a period
of time, the rate of metabolism will be· greater when the food is
eaten in six meals as compared with three meals per day.
Studies.in eating habits and body metabolism have yielded results
suggesting that man reacts as do other species physiologically. The
results of this study appear to have an important relationship to the
metabolic diseases in man.

3
In order to clarify the terminology used in this study the fol-
lowing definitions are accepted.
1. BASAL METABOLISM is the energy metabolism of the body at complete rest, in a ccafortable position and comfortably warm and relaxed, both mentally and physically. The patient must also be in a post-absorptive state i.e., the last meal must have been eaten 12 to 18 hours previously (22, p. 137).
Chaney (6) indicated that the subject should be awake as do many
other authors. The investigator accepts this as a necessary require-
ment.
2. ENERGY METABOLISM is the total energy expenditur e of the individual represented by a sunnnation of five factors: basal metabolism, specific dynamic action, mechanical work (voluntary activity), heat regulation, and growth (22, p. 137).
3. DIRECT CALORIMETRY is the measurement of energy expenditure in the form of heat; all types of energy are converted to heat and then measured. Since energy is utilized in the human body by means of chemical reactions it is possible to evaluate ~nergy utilization from the measurements of the substances consumed and the products formed (11, p. 2).
4. INDIRECT CALORIMETRY is the energy expenditure determined from the amounts of oxygen consumed and carbon dioxide produced and is proportional to the total energy used (11, p. 2).
5. RESPIRATORY EXCHANGE RATIO OR RESPIRATORY QUOTIENT (RQ) is defined as the volume ratio of carbon dioxid e production and the oxygen consumption, i.e., co2Production
O Consumption (ll, p . 6). 2
6. CLOSED CIRCUIT METHOD. The subj ect r ebrea t hes the air contained in a closed system and the carbon dioxide eliminated by the subject is removed by soda-lime and weighed; a measured volume of oxygen is supplied to replenish that which has been absorbed (2, p. 612).
7. OPEN CIRCUIT METHOD. The subject inspires room air and expires into some form of container; the ent i r e volume of expired air is measured and a sample analyzed f or its carbon dioxide and oxygen percentages (2, p. 612).

4
8. SPECIFIC DYNAMIC ACTION. Specific dynamic effect or specific dynamic action or heat increment refers to the increase in heat production resulting from the ingestion of food (39, p. 123).
Briefly the following procedure will be followed during this study.
Young college women having approximately equal energy expenditures,
within 10 per cent of desired body weight and fr.ee from disease, will
serve as the experimental subjects •. The five subjects will be placed
on a fixed diet for one week before the test period. Thus, the vari-
ability introduced by the ingestion of different quantities and varie•
ties of food will be minimized. The physical measurements that will be
taken are body temperature, pulse rate, respiration rate, height, and
weight of the subjects. It is anticipated that at least three ·to four
weeks of exp~rimental feeding on three meals per day and the same
period of time on six meals per day will be necessary to allow for the
body to adjust to the spacing of the meals. The Jones Motor-Basal
Metabolism Unit will be used to determine the basal and energy metab-
olism of the subjects. This basal metabolism test is a quantitative,
not a qualitative, determination and therefore· requires more than
ordinary precision in technique. This unit is most convenient when
using the indirect method. The Waterless Motor Basal Unit is owned
and used by over 30,000 physicians, hospitals, clinics, medical col-
leges, universities and medical laboratories, world-wide.

CHAPTER II
REVIEW OF LITERATURE
Historical Review
Metabolism. is associated with the beginning of life, for without
this process life would not be possible. The date is unknown as to
when ~an first recognized, through his experiences, that there·was any
correlation between the food he consumed and the energy he expended.
It cari be assumed that early man and man today have in common the same
reasoning ability concerning food. Many people today do not recognize
the fact that constantly eating may cause the probl~ of overweight .
. One of the first respiration e~periments cited was the experiment
of Erasistratus (310 to 250 B.C.) who "put fowls in a jar and then
weighed them and their excreta both before.and after food" (9, p. 837).
This was about two thousand years before the many experiments
Sanctorius made upon himself and others to determine the amount of in
sensible perspiration. An· old cut shows Sanctorius sitting in a chair
suspended from a large steelyard~ He determined his beginning weight
.plus the amount of food he·proposed to eat·before consuming each meal.
Then he ate until the scale showed he attained this former weight (4).
Philo of Byzantium (150 B.C.) (36) made the first experiment with
the atmosphere. A candle was burned in a flask, with the·mouth in
verted and immersed in water. After many observations he recorded
5

6
that after a time the candle went out and the water was drawn into t he
flask. Philo of Byzantium explained that the flame of the candle trans
formed particles of the air into small dimensions so they would pass
through the flask.
Lavoisier and Segium (1) were the first to discover through their
classical research that the ingestion of food causes an increase in the
metabolism in the body. Lavoisier's remarkable experiments also gave
the first information concerning quantitative values for physiological
body processes. It is almost unbelieveable how clear his conceptions
were of the problems involved in the digestion and muscular work of man.
In reviewing the literature of the past and Lavoisier's first paper we
have the earliest recorded estimate of an increased requirement of
energy needed for the digestion of a meal.
Between the early experiments of Lavoisier and the next discovery
of definite evidence, a lengthy period of time lapsed. In 1843,
Scharling (1) constructed a large wooden box f or the purpose of making
direct determinations of the carbon dioxide produced by man. The con
structed box was ventilated by a pump and had approximately a 1 cubic
meter capacity. Zurttz (23) criticized Scharling's experimental tech
nique, showing that carbon dioxide escaped by means of absorption.
However, the conclusions obtained by Scharling are interesting due to
the fact that he concluded that other things being equal, man will
expire more carbon dioxide following the ingestion of food than when he
has not eaten food.
Next to the classical experiments of Lavoisier and Segium no
early research is more frequently cited than that of Edward Smith in
1857 (36) .. Smith's studies included 1200 observations en the effects
ef varied conditions ef life and on the magnitude of energy require
ments of man. A metal mask with. a meter, valves and absorbers fer
carbon dioxide and water was used by Smith to measure the·intake of
air.
7
In 1849, Regnault and Reiset (23) described an apparatus that
measured oxygen consumptien and carbon dioxide elimination. The general
principles used in this apparatus are applied in all of the closed
circuit apparatus of today. Regnault and Reiset found that the ratio
between oxygen inspired and carbon diexide expired depended upon the
origin of the food instead of the species of animals.
Abeut 1866, Pettenkofer and Voit (23) built a chamber large eneugh
ta hold a bed. The chamber was ventilated with a known volume of out
side air. Carben dioxide.and water were analyzed.in both.incoming and
outgoing• air. Oxygen consumption was measured by difference.
In June 18~1 Ranke (1) used the respiratien chamber, constructed
by Pettenkofer and Voit (23) in Munich, for the first time with man as
the subject. Ranke·carried out a series ef experiments upon himself
and later published his results. In these experiments a period of 24
hours was used and the subject was either given an ordinary diet of
undetermined nat~re, a mixed diet of known composition, a high protein
diet er the subject was fasted.
One of Voit's mast illustrious pupils, Max Rubner, (36) perfected
the procedures• for computation that are now used .in the study of animal
calorimetry. Rubner established the relationship between body surface
. and food requirements • of animals.

8
Several years· later Rubner discovered the specific dynamic action
ef varieus · foeds. He established that carbohydrate and fat were inter
changeable in nutritien. This isedynamic law of Rubner stated that
feod-stuffs under certain ccnditions replace ·each other according ta
their heat preducing value. Rubner found that 100 grams· of fat were
equal ta 256 grams of glucose, 234 grams ef cane sugar, 232 grams of
starch, or 211 grams of protein. Results with the bomb calorimeter
gave the fellowing determinatiens expressed as averages in calories per
gram: carbehydrates 4.1; fat 9,5; and protein 5.7 (36). Rubner con
cluded that protein dominated the dynamic effect (increase in heat pro
duction) of diets.
In 1891 Nathan Zuntz, with Geppert (23) constructed an apparatus
. in which the volume of expired air was determined by passing it through
a gas meter. The metabolism was determined by analyzing the carbon
diexide content. This difficult technic preved ta be very accurate.
In 1895 Magnus-Levy, (23) using a portable respiratien apparatus
designed by Zuntz and using the Geppert technic, studied the metabolism
of peeple whe suffered from abnormal thyroid functien .. His studies laid
the groundwork fer the use of basal metabolism studies in clinical work
for diagnostic purpeses.
Atwater, (35) who had been a pupil ef Voit, Rubner and Zuntz, with
the assistance of E. B. Rosa, constructed a calorimeter capable of
measuring the ameunt of heat given eff by a subject living in the
apparatus. Atwater's work showed that the energy expended by physical
exercise is exactly equal to the energy liberated through metabolism
in the body, thus·confirming Rubner's experiments.

9
· Edward Frankland' s (36) calorie·value ·of feods, metabolic value
·of foods and metabolic products, were obtained using a combusion calori
meter designed by Lewis Thomson. With this calorimeter and by his,pro
cedure Frankland determined .the heats of combusion of twenty-nine foods
connnonly used. Frankland confirmed the conclusions previously stated
by Edward Smith (1) and others; namely, that muscles function at the
expense· of energy derived from the oxidation of fats and carbohydrates -
non-nitrogenous foods.
The respir_ation studies of Regnault and Reiset in 1849 (1) were
important as they were the first to devise a closed system for respi
ration studies. Considerable accuracy was achieved.in determining the
relationship between the volume·of oxygen.absorbed and the volume of
carbon dioxide excreted during respiration. The above relation became
known as the respiratory quotient (1).
In 1909, the first description of an.apparatus for determining the
respiratory quotient and the gaseous exchange· of man during short periods
was devised by Benedict (9) .. The apparatus was· a closed-circuit type
which provided a graphic record of the respiration •
. During 1910~.zo, metabolism studies remained largely within the
field of research. Normal standards of metabolism were established
from a. tremendous collection of data (23).
During this decade Gephart and Du Bois, 1915-1916 (1) and Aub and
Du Bois, 1917 (1) continued extensive research using the calorimeter to
determine the effect of food and the specific dynamic action of protein.
The Jones Motor-Basal Metabolism Unit is a modification of the
original ''waterless" metabolism apparatus designed by Horry M. Jones,
. M.D., Ph.D., in the Department of Experimental Medicine, University of
10
Illinois, College ·of Medicine, Chicago,. Illinois, 1919. Below is
listed, in summary, outstanding features·of the Jones Motor-Basal Unit.
· 1. Operative simplicity, verified accuracy and. low cost. 2. Waterless, a modification and :modernization of our
original waterless unit, developed and perfected through 32 years· of research to simplify the B.M.R. test and to-enable us to guarantee accuracy.
3 .. The quantity of oxygen to be metabolized is automatically corrected to standard volume, regardless of temperature and pressure changes .
. 4. All calculations and thei:r possible errors are elimi.nated by use of.Jones Automatic Basal Metabolism Calculator.
5 .. The entire tracing ·during test is in full view of the ·operator so that ~orrect progress of test can be managed.
6. The hold on. accuracy af:f;orded by the protractor is highly important because it discloses technical errors and prevents the use of inaccurate tracings.
7. Safety-release valves, in both breathing. and measuring .chambers, prevent damage from over-pressure.
8. Made accurate by the mathematical precision of chemistry and physics. Guaranteed .greater than 99% accurate.
9. Use·of motor-blower, with visible anemometer, assures maximum breathing comfort of patient.
10 .. The tracing pen will not smear,. is easy to clean, easy to fill, never becomes clogged, and makes a clean-cut, accurate tracing. An.inkless stylus, for use with special inkless tracing sheets, is avail.able if desired, at slight additional cost (31, p. 28).
The original Zuntz (23) apparatus·was developed into a new form by
Kofrany and Michaelis in l.941 (11). In 1952, Muller and.Franz (11)
modified the Kofrany and Michaelis· respiration gas meter in the Max -
Planck Institute for Work Physiology in Germany.
Calorimetry
Calorimetry is the measurement of energy expenditure by the human
body through the production of heat or energy. Calorimetry may be
·measured by either using direct or indirect methods. The law of con~
servation of energy is the basis for calorimetry. This law states

11
that energy can neither be cre!ated ot destroyed, and thus. an increase
or decrease in the energy content of any system can only be accomplished
by .the amount of energy t~at is added or subtracted from the system (11).
According to Swift (39) there are five major types of calorimeters
used for the direct measurement of heat production.
1. Lavoisier & Laplace .... the· latent type such as the
ice calorimeter.
2 •. Lefevre - the bath· calorimeter and the fixed amount
of water type.
3. Atwater & Rosa, Lefevre, and Armsby ~ respiration
calorimeters, the types that employ circulating air
or water to remove.the heat as it is produced.
4. Rubner's emission type and Benedict & Lee's compensating
type·- these. are both heat recording types.
5. Murlin.& Benziner - gradient or heat flow calorimeters.
Today's direct calorimeters in use generally remove the heat elimi
nated by radiation. Conduction is measured by means.of a stream·of cold
water flowip.g through the chamber in tubing. . The heat of the subject
is expended in evaporation of water by the lungs and skin. By passing
the air in the chamber through sulfuric acid absorbers some 25 per cent
of the total water at normal temperature and humidity levels is de
termined, thus measuring the amount.of water from this source gravi
metrically. The closed-circuit type or open-circuit type may be used
with direct calorimetry.
Indirect calorimetry is. a chemical method ef determining the heat
·production of an ~perimental subject. Respiratory metabolism may be

12
obtained by using an air-tight chamber or an apparatus connected to
the respiratory passages. Ventilation can be either the closed or
open~circuit type,
Consolazio (11) states that the closed-circuit method was .first
devised in the United States in 1918 by Benedict, and Krogh followed
in 1923, The subject, while in a basal state, rebreathes pure oxygen
from a spirometer that contains soda lime for the absorption of the
carbon dioxide from the air expired. The collection period ranges
from 6 to 10 minutes. The amount of oxygen consumed is recorded by a
system on a chart fixed to a kymograph. Immediately after the col·
lection period the slope· of the line is measured by the decrease· in
oxygen volume. In 1957, Fowler et al., reviewed this method which has
been used universally by clinicians. The following data was presented
by Fowler et al,, showing the discrepancies recorded by several men
in this field between the closed and open-circuit methods:
Table 1=2. COMPARISON BETWEEN CLOSED AND OPEN CIRCUIT BMR
Authors
Krogh & Rasmussen (1922) Hunt (1926) Lewis et al. (1943) Willard & Wolf (1951) Fowler et al. (1957) Harmon (1953)
* Adults
Number of Subjects
5 of 19 20 of 25 13 of 25*
8 of 18* 52,'c
Difference
6 to 11% of open circuit values 12% of open circuit values 5% of open circuit values 10% of open circuit values S.D. 7% of open circuit values S.D. 7% of open circuit values
( 11 ' p O • 23))
Fowler et al. (11) felt tqat a standard error using the closed
2 circuit method (approximately 2.3 kcal/meter /hr.), which was equiva~
lent to 6 or 7 per cent of the BMR, was of clinical importance. The

13
inter;..individual variability-of the normal healthy population has a
standard.deviation of 2.5 kcal/rneter 2/hr. The open-circuit method has
. fewer errors than the closed ... circuit method. Consolazio has listed
the most common.errors in using the closed-circuit method as:
1. Errors in the volumetric calibration of the spirometer may occur.
2 .. The kymograph may be inaccurate . . 3. Changes in temperature affect volumes. 4. The possible lack of complete absorption of carbon
dioxide· from the expired air requires careful replacement of soda lime.
5. The degree of the aqueous saturation of the spirometer gases may be miscalculated.
6. Leakage of gas around the mask, mouthpiece, or noseclip occurs.
7. Leaks in the inspiratory system will add gas into the c.losed system and cause falsely low values for oxygen intake.
8 .. Inspiratory and expiratory leaks produce errors that are ot equal volume to the leak, and the percentage error is the ratio of the leak rate to the metabolic rate.
9. A given expiratory· leak in the open-circuit method causes only 1/25 of the error proquced in the closedacircuit method. Expiratory leakag~ of 1 ml/breath or 15 ml/min will result in. a false elevation of 5 per cent or more in the BMR in the latter.
10. The possibility of. leaks in the spirometer bell exists. 11. With the open-circuit method the error ratio of the
change of lung volume to the total ventilation is only 1/25 as large.
12.. Unless the ratios · of oxygen up take. and of nitrogen elimination are equal and opposite, or are zero, the rate of volume clJ.ange· of the spirometer will not equal the rate of oxygen utilization. '[Krogh .and Rasmussen (1922) felt that 5 minutes was sufficient to attain equilibrium, but studies by Jones (1959) have shown that equilibrium is far from complete·in 5 min]
13. Errors of less than 1 per cent will result from neglecting the ·metabolism of protein •.
(11, p. 23).
In using the open-circuit method the same apparatus and reagents
are used as for the energy expenditure·measurement. Additional
apparatus needed includes .an oral clinical thermometer, a clinical
scale, a measuring device for height and a 130 liter gasometer.

14
Respiration
"Respiration refers to the interchang_e of gases that takes place
between.an organism and its environment" (25, p. 275). The passage
·of oxygen from the air into the alveoli of the lungs and then into the
blood is known as the. external type of respiration. True respiration
refers to the actual utilization of oxygen by the cells of the body.
The passage of oxygen from the blood into the tissues is known.as
internal respiration.
The act of breathing occurs in two phases, known as inspiration
and expiration. In.a normal inspiration .the amount of air that passes
into the intrapulmonic cavity amounts to about 500 cc. and this is
called tidal air. An inrush of an additional quantity of air from
forced or labored inspirations· is often .. called complemental air or
inspiratory reserve, which. amounts to approximately 2500 cc. or 3000 cc.
if tidal air is considered with the amount of complemental air. The
amaunt -of air still remaining_within-the lungs after a forcible
expiration.amounts to approximately 1500 cc. and is called residual
air. The total amount of air that can be expelled by the most forcible
expiration after the most forcible inspiration amounts to 3500 to
4500.cc. in the average person. Vital capacity is the sum of the
complemental,. tidal, and supplemental airs. The maximum volume of
air that the lungs can expel may be summar,ized into the following
three divisions:
Forced inspiration 1. Complemental air 2500. cc .. (3000 cc. if tidal air is included)
Normal respiration 2. Tidal air 500 cc. Farced expiration 3. Supplemental air 1000 cc. (1500 cc.
if tidal air is included) 4 . . Vital capacity 4000.cc.
(25, p. 285)
15
In normal adults vital capacity varies from 1500 to 7000 cc. That of
average adult women, between the ages of 18 and 30, is approximately
3100 cc.
In normal respiration the average is 17 per minute with the rate
ranging between 14 and 20 per minute. Factors such as age, muscuiar
activity, emotion, and heart action influence the rate and depth of
respiration. In normal respiration the chest is enlarged by the descent
of the diaphragm and the elevation of the ribs. Costal breathing is
the elevation of the ribs causing movement in the upper chest region
and is characteristic of female breathing as a rule.
The atmospheric air Oxygen
we inhale has the·following compositio:n:
Carbon dioxide Nitrogen
The average normal and produces about when at rest.
20 . 9 6 per cent 0.04 per cent
79.00 per cent adult consumes about 250 cc. of oxygen 200 cc. of carbon dioxide per minute
Expired air has the following composition: Oxygen 15.8 per cent Carbon qioxide 4.0 per cent Nitrogen 80.2 per cent
(25, p. 302)
There is a higher percentage·of nitrogen in the dry, expired air than
in the dry, inspired air (25).
Basal Metabolism
During the first 25 years of this century the most fundamental
work was done on basal metabolism of humans and animals. Recent studies
on. basa~ metabolism have dealt mainly with the quantitative measure=
ments of people differing in race, environrriental climate, occupationj
or diet. Basal metabolism is an expression of the heat production of
the body in complete mental and physical repose, and in a postabsorptive
state as stated on page 3.
Conditions that may cause variations in determining the basal
metabolic rate are discussed below:
16
1. Size - Guyton (24) states that if one person is much larger
than another the total amount of energy utilized by the two people will
be different because of differences in body size. The average basal
metabolic rate varies approximately in proportion with the body surface
area among normal persons. The metabolic rate may be expressed as
calories per square meter of surface area per hour or per 24 hours.
2. Age and Sex - According to Fleck and Munves (22) basal metab
olism.is influenced by age. The highest basal metabolic rate per unit
of surface area (55 calories per square meter per hour) occurs at the
age of approximately two years. At birth the basal metabolism is 27
calories per ~quare meter per hour and at ages 20-50 for normal men
it is 3.8-40 calories per square meter per hour. The metabolic rate
for women is approximately eight per cent less than that of man with
the rate decreasing with age.
3. Undernutrition - The basal metabolic rate falls sometimes to
as low as -20 when prolonged malnutrition exists. The decrease is
assumed to be due to a paucity within the cells of appropriate food
substances, also various vitamin deficiencies help to decrease the
basal metabolic rate (24). Fleck and Munves (22) state that approxi
mately a 50 per cent rate. reduction will occur in order to conserve
the body's fuel in a state·of undernutrition. The caloric level is
much lower than that under ordinary circumstances.
4. Glandular Disturbance·- Magnus-Levy determined the well known
action of the thyroid gland in regulating the rate of combustion in
17
the body. Other factors may affect the rate of heat production, but
in the majority of uses the· variations in the basal metabolic rate may
be interpreted as variations in the function of the thyroid gland (39).
5. Fever - Fever caused by any factor increases the basal meta~
bolic rate. Approximately an increase of seven per cent in metabolic
rate-occurs for each degree Fahrenheit body temperature increase. This
has an unfortunate effect, for once the body temperature rises to a
high level the increase in the metabolism rate makes .it difficult for
the body's·. temperature regulating mechanisms to again· lower the tempera..,
ture to normal (22) .
. 6. Climate - Keys estimated a lower metabolic rate by five to
ten per cent in a warm climate and a ten to 15 per cent decrease· in
a hot climate. It has been observed that only slight acceleration
occurs• in cold climates and that shivering may increase the resting
metabolic rate by 50 to 100 per cent (6).
7. Other Factors. - Many other factors may cause variations in the
computation and interpretation of basal metabolism. A person's occu
pation, previous diet, menstruation, emqtions, environmental tempera
ture, and the time of year are all factors which may play a part in
the results obtained (39).
Other conditions which will lower the basal metabolic rate are
myxedema and lipoid nephrosis. Exophthalmic or toxic goiter, leukemia
or polycythemia will increase the basal metabolic rate (22).
Basal Metabolism.Standards
Many measurements of basal metabolism have been proposed during
the last three decades. Only a very few of the better known standards

18
will be discussed in this paper. In 1879, Meeh's (39) work was pub~
lished. Meeh used six adults and ten children as subjects measuring
the surface area as well as possible by covering the body with paper
strips. Du Bois and Du Bois (15, 17) in 1915 determined the surface
·area.of five subjects who v&ried greatly in shape. From the data col-
lected they formulated the following for the calculation of surface
area including weight and height:
A= w· 425 X H" 725 X 71.84
A is surface in square centimeters, w is the weight in kilograms and H is the height in centimeters.
(39, p. 160)
In 1936, the "Aub and Du Bois" table was published in the form of
a chart devised by Du Bois (16) in which the surface.area could be de~
termined at a glance.
A .second important base· for determining the basal rate· of a person
was that of Harris and Benedict, which is based on weight and standing
height. The Carnegie Nutrition Laboratory Standards of Harris and
Benedict are based on 136 males and 103 females (6).
Many hundreds of formulas for surface area have been published
through the years. Another mention of important work was that of
Boothby and associates (3). Basal metabolic rate determinations had
been made on more than 60,000 people by December 1926. From this
vast number 6,888 subjects were selected (1,822 males and 5,066
females). These subjects revealed no abnormalities which would affect
the heat production. The Mayo Foundation standards of Boothby,
Berkson, and Dunn are based on 639 males and 828 females. According
to Keys, this standard overestimates true basal metabolism by about

19
ten per cent and the standards for women may even be higher (6),
In 1952, Robertson and Reid compiled a table of basal metabolism
standards for normal people in Britain. The British standards are
based on 987 males and 1,323 females. The figures are about ten per
cent lower than those generally accepted for use in this country. The
·reason for this is because the British standards are based on the lowest
results on the third day of testing and the American standards are based
largely on the first tests (6).
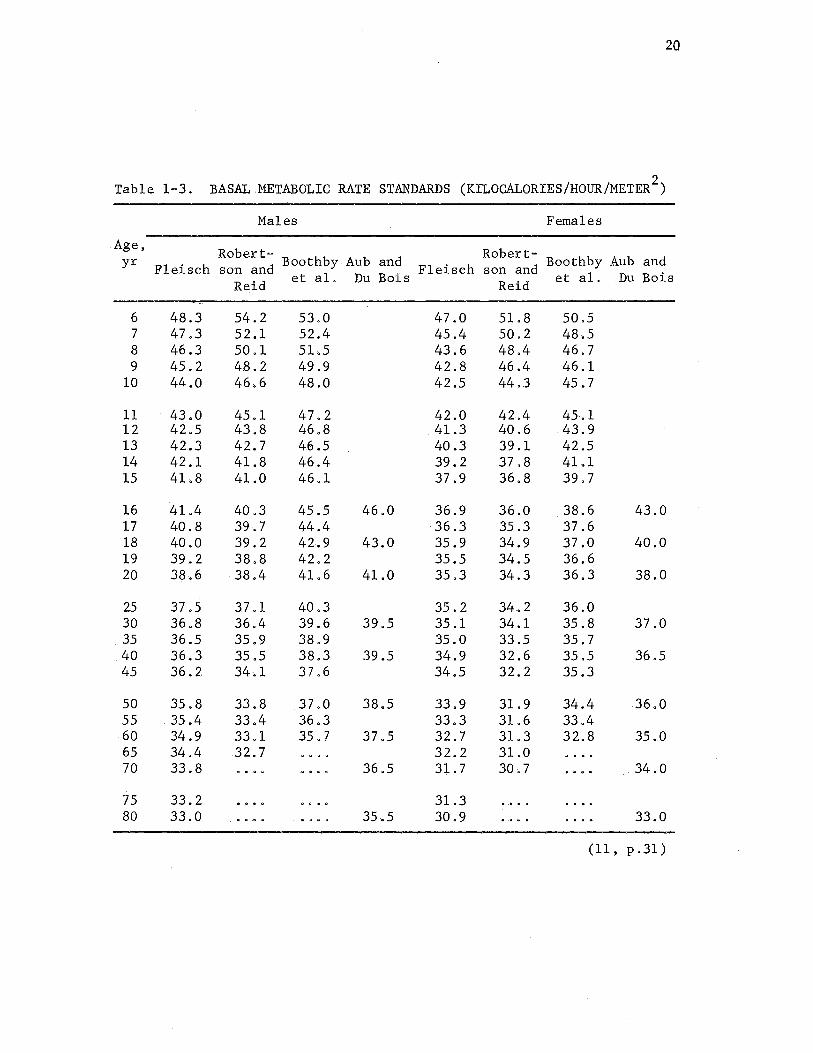
It is believed that some of the best work published in this field
was by Fleisch in 1951, who tabulated the values for kilacalories. per
2 hour per meter from 24 sets of standards. Fleisch calculated the
arithmetic mean for each age group. After these computations he
weighted the values.for the total number of subjects and smoothed out
the curve. Basal Metabolic Rate Standards (Kilocalories/Hour/Meter 2)
as given by Fleisch in Table·l--3, show these values as compared to the
standards obtained by Robertson and Reid, Boothby et .. al., and Aub and
. Du Bois (11).
Energy Expenditure
Many studies have been conducted .in order to determine the energy
expenditure· involved in varied activities. Energy metabolism as de-
fined on page 3 has been determined by both direct and indirect
calo~imetry methods. Through the ~any investigations, standards have
been set which are useful. in making predic;ations of the fuel needs of
a person.
The following qiscussion will. concern the factors which affect
20
Table 1-3. BASAL METABOLIC RATE STANDARDS (KILOCALORIES/HOUR/METER2)
Age, yr
6 7 8 9
10
11 12 13 14 15
16 17 18 19 20
25 30 35 40 45
50 55 60 65 70
75 80
Males Females
Robert- Robert- Boothb Aub and Fleisch son and Boothby Aub an~ Fleisch son and y .
Reid et al. Du Bois Reid et al. Du Bois
48.3 47.3 46.3 45.2 44.0
43.0 42.5 42. 3 42.1 41.8
41.4 40.8 40.0 39.2 38.6
37.5 36.8 36.5 36.3 36.2
35.8 35.4 34.9 34.4 33.8
33.2 33.0
54.2 52.1 50.l 48.2 46.6
45.1 43.8 42. 7 41.8 41.0
40,3 39.7 39.2 38.8 38.4
37.1 36.4 35.9 35.5 34.1
33.8 33.4 33.1 32.7
53.0 52.4 51.5 49.9 48.0
47.2 46.8 46.5 46.4 46.1
45.5 46.0 44.4 42.9 43.0 42. 2 41.6 41.0
40.3 39.6 39.5 38.9 38.3 39.5 37.6
37.0 38.5 36.3 35.7 37.5
. 36 .5
35.5
47.0 45.4 43.6 42.8 42 .5
42.0 41.3 40.3 39.2 37.9
36.9 36.3 35.9
.35.5 35.3
35. 2 35.1 35.0 34.9 34.5
33.9 33.3 32.7 32. 2 31. 7
31.3 30.9
51.8 50.2 48.4 46.4 44.3
42.4 40.6 39.1 37.8 36.8
36.0 35.3 34.9 34.5 34.3
34.2 34.1 33.5 32.6 32.2
31.9 31.6 31.3 31.0 30.7
50.5 48.5 46.7 46.1 45.7
45.1 43.9 42.5 41.1 39.7
38.6 37.6 37.0 36.6 36.3
36.0 35.8 35.7 35.5 35.3
34.4 33.4 32. 8
43.0
40.0
38.0
37.0
36.5
36.0
35.0
34.0
33.0
(11, p.31)

the total energy requirement of the body. The interrelationships be
tween the three major items affecting energy expenditure are:
1. activity increases the need above the basal rate,
2. control of body temperature is a continually operating
·factor,
3. and food influences the total calorie requirement--these
have been the subject of investigation since the time of
Rubner (6).
In determining the total energy needs the performance of work is
the biggest variable due to the following reasons:
1. Various activities during a 24 hour period require a
different number of calories.
2. The activities can vary considerably in the amount of time
spent.
3. Individuality differences occur due to size, age and the
manner or method used .in accomplishing a task.
Early methods for detenp.ining energy expenditures were made ·using the
respiration chamber and a Douglas bag. The newer techniques have
21
given recent research on energy expenditure a greater flexibility in
collecting information. The Max Planck Institute for Arbeitsphysiologie
in Dortmund, Germany, introduced the Kofranyi-Michaelis respirometer
just before the beginning of World War II.
Mental work does not effectively increase (adds three to four per
cent to the total expenditure) total metabolism and for s.11 practical
purposes can be ignored (22) .
. Environmental temperature is another important factor in the pro
duction of heat. The normal body temperature for man is: about 98. 6° F.

22
External control of body temperature is affected by climate, humidity,
air currents, clothing, housing, heating and cooling devices. These
external means and most of the internal means are physical in nature
(6).
The range of thermal neutrality is not the same for all animals
and may be influenced by the clothing,. body weight, and by the ingestion
of food. In the classical experiments of Lavoisier on calorimetry he
discovered that the ingestion of food caused an increase in heat pro-
duction. Specific dynamic action is defined on page 4. Specific
dynamic effect values have been expressed in many ways as follows:
(1) Maximum rise above the basal production, ( 2) the average rise for various periods of time, and (3) the percentage of the energy of the food ingested or
metabolized that is lost in the S.D.E. (39, p. 123)
· The amount of nutrient given, the basal metabolism, and the
nutritive condition of the subject determine the amount or extent of
the specific dynamic effect. In a mixture of nutrients the specific
dynamic action is less than the sum of the dynamic effects of the corn~
ponents determined individually.
According to the studies of Forbes and Swift, rnetabolizable energy
rather than the protein content of the diets dominated the production
of heat thus indicating that the quantity of food ingested was of
greater importance than its relative content of protein. The cause of
the specific dynamic effect of nutrients is unknown (39).
From Swift's (40). extensive· studies on the dynamic effects of two
diets with the same energy content, but different protein content he
concluded that in overall energy utilization of equal .. calorie diets of
different protein content, the differences were very small. Swift

23
suggested that five to six per cent of the total food energy may be due
to the dynamic effect. Energy expended each day in this manner is not
considered a major factor and is usually calculated only in precise
research experiments (39).
One's metabolic rate may increase as high as 30 or 40 per cent
above normal after ingesting a meal containing a large amount of
carbohydrate. This increase in metabolic rate may last for two to five
hours. A meal high in· fat may raise the metabolic rate ten to 15 per
cent, the effect appears three to four hours after the meal and lasts
seven to nine hours. After the ingestion of a meal high in protein
the metabolic rate may begin rising within one to two hours and reaches
a maximum of 50 to 70 per cent above the control value and may last
from ten to 12 hours. It is obvious why metabolic measurements must
be made after digestion and intermediary metabolism have ceased for the
basal metabolic rates to be calculated (24).
Standards for Energy Requirement
Noted men such as Voit, . Atwater, Tigerstedt ,, and Langworthy tabu~
lated results according to general type of activity or occupation of
subjects in many previous experiments. The estimations of energy re~
quirements are based on the results of actual studies. An estimate
·of the energy expenditure is calculated from an individual's basal
metabolic rate, the energy used for digestion and calories used during
sleep, work, and play. A record must be kept by the individual in
order to calculate more accurately the total energy metabolism. In
this method of calculation the assumption is made that the energy

24
output, when accompanied by maintenance ·of body weight,. is indicative
·of the body's requirement (6).
In 1940, . the Food. and Nutrition Board of the- National Research
Council published a guide· of dietary standards titled "Reconunended. Daily
Dietary Allewances." This was based on the opinions· of more than 50
nutrition authorities. This table has been revised at frequent inter-
vals since ·the first publication •. The sixth ec;lition was published .in
1963 and. a copy· of this revision may be found .in Appendix A. In· 1957,
the second committee on calorie ·requirements dev0ted .most of their
attention to the relationship between the activities and the energy r.e ...
· qqirements. The revised Recommended Dietary Allewances, as adopted by
the Food and Nutrition Board in November 1963, . show a downward re-
vision in calories based on the opinion that the reference man defined
by the Food and Agriculture-Organization probably exerts more energy
in physical activity than .in the case of the average American man (19).
Whereas both are assumed · to be· gainfully employed 8 hr. <;laily, the FAO reference 11J,an is subjected to occasional bursts of hard physical labor while in this country, this is probably rare. Also, the-reference man in the United States probably does not spend more than one .. third .. as much time walking as does the FAO reference man,. ancl also, probably ·engages· in less household work and recreation. . Corrections• for these· lowered activi• ties bring the energy expenditure of the American reference ·man to 2895 calories per day,. rounded to 2900. The mathematical expression is revised as follows for the reference ·man· in the United States: calories= 725 + 31.0 Xwt. (kg)= 2895.
It is hoped that. the Recommended Dietary Allowances will continue to serve the valuable function of providing a yardstick in planning adequate dietaries, their primary intended use. It
.is also hoped that their sole use as a means of assessing nutritional status·of individuals will be viewed with caution.
(19, p. 94)
In 1963 Fabry et. al. (21) studied the energy metabolism and growth
in rats adapted to intermittent starvation •. Three ·groups·of male,

25
albino. rats were measured .for femur length, amount of food intake and
weight gain. These groups ·were divided so that one group was: inter
mittently (one-three days) fasted and then given free access to food
(one· day), . another· group was &iven a .restricted daily food ration. and
the last group was fed ad libitum •. From the data collected .it appeared
that the rats adapted to intermittent starvation by a reduced energy
· output during the period of 11).a:dmum physical activity, for the· increase
· in tissue o:ddation activity and also by ·a h,igher resting and basal
metabolisll)..
In 1958, Durnin and Brockway (18) studied the determination of the
. total claily energy expenditure. in man by indirect calorimetry and made
an assessment of the accuracy of a modern technique. The subjects
were four young male students, ages ranging from 21 to 23, weight ranging
. from 62.5 to 78.0 kg., height ranging from 164 to 182 cm •. and BMR rang-
ing from .1.08 to 1.27 cal/min. The food intake was weighed accurately
and recorded with any plate waste being deducted from the original
weight of the food. The energy value, protein, fat, carbohydrate,
mineral and vitamin content were estimated from tables supplied by the
Ministry of Agriculture, Fisheries and Food. The nutrient conversion
· factors were l?ased largely on those· compiled in 1945 by the Medical
Research Council. The basal metabolic rate was calculated by using
the method of Fleisch in· 1951. The ·metabolic cost of various daily
activities was measured using the Max Planck respirometer and a suit
able technique for calibrating and 11).aintaining the Max Planck respiro
meter •
. In 1954, Insull 's (29) m.ain objective was to assimilate into the
26
methods of indirect calorimetry recently developed apparatus and tech ..
niques and to evaluate the accuracy of the resultant method. The
Muller-Franz gas meter,. Pauling oxygen analyzer, and Weir formula for
energy calculation were the chosen methods to be used for the human
indirect calorimetry. The resultant method of Insull provided a more
convenient and accurate technique when compared to older methods.
In 1960, Langford (32) studied the influence· of age and body weight
. on the energy expenditure of women .during a controlled physical activ
ity at Iowa State University of Science and Technology. The summary
of her experimental findings indicated that:
1. Basal metabolism of women was. influenced by age and
by body weight.
2. Energy expenditure for physical activity was influenced
directly by body weight.
3. There was a tendency toward an increase in mean body
weight with a mean increase in age for the young, middle
aged and older women, although all were judged to be
desirable in body weight for their height.
4 .. The metabolic cost of physical activity apparently was
not influenced by age apart from the concomitant increase
on body weight (32, abstract).
Effect~ of Diets
By varying the proportion or kind of food in the diet the metabolic
response may be changeg. A diet which is to be used must be flexible
and practicable. The Human Nutrition Res~arch Service Laboratories of
the Agricultural Researc11 Service have designed the "Standard Diet"
27
and the "Uniform Diet" for metabolic studies. The Standard Diet was
developed for study of the utilization and requ~rement for a variety
of nutrients. When it is necessary to keep constant the proportion and
source-of nutrients from meal to meal and day to day a Uniform Diet is
used. The Uniform Diet was developed from the diet of Crampton et al.
(12). 'lll.is diet consisted of muffins, orange juice, butter, and jelly.
The advantages of this diet were. the ease of pr_eparation and the ease
with which it was served. The Uni.form Diet's main disadvantage was its
lack af flexibility (30).
'lll.e University of Wiscansin Diet was divided into six er more
·feedings a day rather than three meals and was used _in the University
Hospitals. 'l'he diet was written using the Exchange Lists of the
American Dietetic. Association and American Diabetes Association in the
calculation of diabetic diets (41). i
In a study made by Qlson and et al. (37) over a ·period of 18
months, 60 patients were maintained on a .constant formula diet for
periods of from one to four months. The advantage of this type of diet
was the ease of preparation and the intake-constancy. This procedure
may be used in institutions ·where metabolic ward facilities are not
available.
Cohn (9) states that a nibbling diet should satisfy two general
principles:
(a) it must be adequate in, protein, vitamins, calories, and esseri,tial fatty-acids-and
(b) fat ~pd carbohydrate must be ingested within a limited time period after the protein has been consumed, if nitrq~en balance is to be attained.
(9, p. 435)
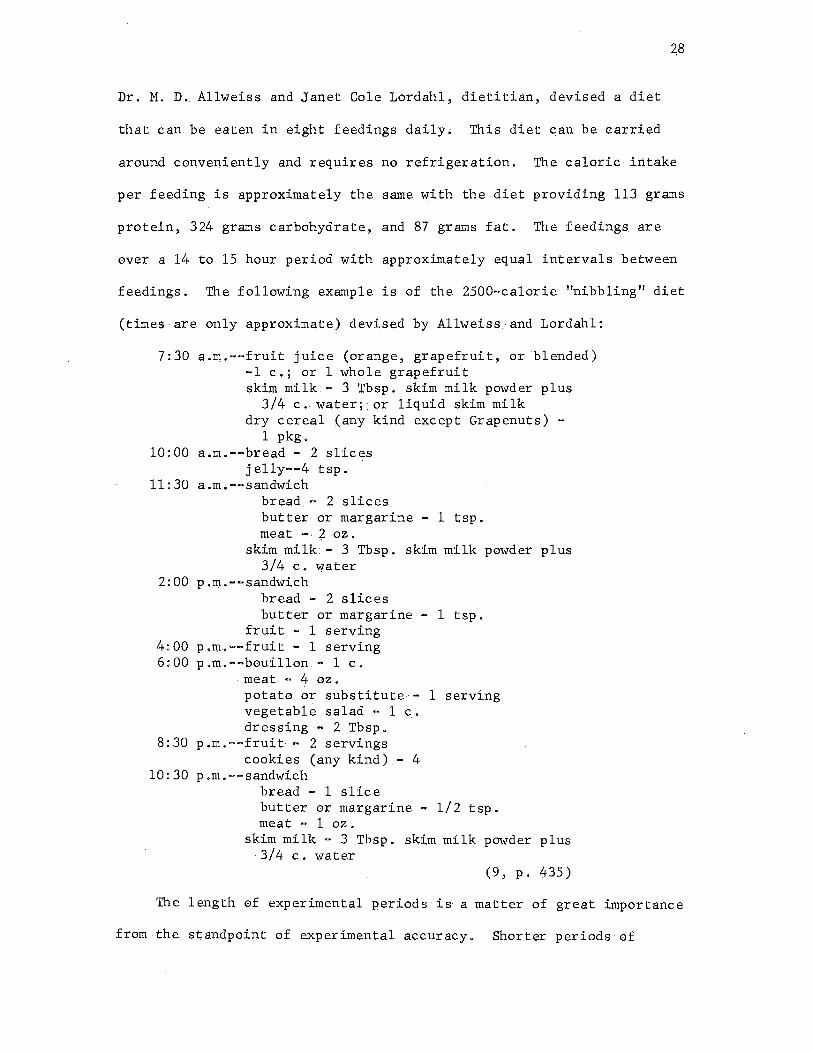
Dr. M. D._ Allweiss and Janet Cole Lordahl, dietitian, devised a diet
that can be eaten in eight feedings daily. This diet can be ·carried
around conveniently -and requires no refrigeration .. The· caloric ;i.rttake
per feeding is approximately the same with the diet providing 113 grams
protein, 324 grams carbohydrate, and 87 grams fat. The feedings are
over a 14 to 15 hour period with approximately equal intervals between
. feedings .. The following example is of the 2500-calorie "nibbling" di.et
(times -are only approximate) devised by Allweiss_ and Lordahl:
7:30 a.rn .• --fruit juice (orange,. grapefruit, or blended) . -1 c.; or 1 whole grapefruit
skim milk - 3 Tbsp. skim milk powder plus - 3/4 c. ·water; or liquid skim milk
dry cereal (any kind except Grapenuts) -1 pkg.
10:00 a.m.--bread - 2 slices j elly--4 tsp.
11:30 a.rn.--sandwich bread_ - 2 slices butter or margarine - 1 tsp. meat - - :2 -oz .
skim milk - 3 Tbsp. skim milk powder plus - 3/4 c. water
2:00 p.m.--sandwich bread - 2 slices butter or margarine - 1 tsp.
fruit - 1 serving 4:00 p.m.--fruit - 1 serving 6:00 p.m.--bouillon • 1 c.
- meat - 4 oz. potato or substitute-· 1 serving vegetable salad - 1 c. dressing.~ 2 Tbsp.
8:30 p.rn.--fruit- - 2 servings cookies (any kind) - 4
10:30 p.m.-•sandwich bread .. 1 slice butter or margarine .. 1/2 tsp. meat - 1 oz.
skim milk - 3 Tbsp. skim milk powder plus 3/4 c. water
(9, p. 435)
The length of experimental periods is a matter of great importance
from the standpoint of experimental accuracy. _ Shorter periods of

29
observation may contain errors of measurement which are magnified
greatly. when computed to a standard interval of time. It is necessary
in ~any studies such as basal metabolism to observe short intervals.
Long time periods are not necessarily superior to short periods (39).
Evidence was· found by Cohn and Joseph (7) that the experimental
rats used in their study on changes in body composition attendant on
forced feeding should be placed on their respective diets one week in
advance. to the experimental period (14 days). This was necessary in
order to accustom the rats to the eating pabits.
In Consolazio I s. (11) investigations of the nutrient regimen of
the control period. he found evidence to support the need of a two-week
control period on a fixed diet in order to reduce variability q]l).Ong. the
subjects. The primary purpose of the study was to investigate the in•
fluence of a variety of nutritional and work regimens on the functioning
:of the organs and systems of the human body.
Cohn.and Joseph believe that:
Two types of animals may be described with respect to feeding patterns. - the meal eaters· and the nibblers. Both feeding patterns may be traced to evolutionary vestiges, custom: and habit •. We· feel that the l.aboratory rat is "by nature" a nibbler, and that force· feeding is merely a way of conditioning him to become a 111ea,l eater. Because of his natural eating Qabits, the rat has proved to be an ideal subject for studying metabolism as influenced by the rate,' of ingestion of the diet under specifically controlled conditions •. When the nibbling animal 'is. forced to become a meal eater, attendant changes in the rate of ingestion and absorption of foodstuffs and calories may well produce
·changes· in intermediary enzymatic pathways. In place ·of the slew, . continuous metering of foodstuffs from the gastrointestinal tract,. such as occurs in the nibbling animal, the meal eater· is· faced with.· the necessity of disposing of the
· calories with which it is flooded several times daily. Thus it appears· plausible in view of a number of rate-limiting steps, that the rate of ingress of the foodstuffs, as well
. as the timing of ingestion of the· food, may play a role in
\

the regulation of traffic over specific enzymatic. pathways when multiple alternate pathways are ava:Uahle (10, p. 492).
30
Meal eating as contrasted to nibbling resulted in a 50 to 100 per
cent increase in body fat. over pair=fed rats; a 10 to 20 per cent de=
crease i.n the synthesis of protein; and flooding the rat with calories
by the consumption of full. meals is associated with a more economical
use of calories, thus leading to obesity (10).
Fabry and et al. (20) conduc.te.d a. su:rve.y in which Li,40 men, age.s
· 60-64, had their serum~cholesterol level, skinfold thickness, body=
weight and height. and. glucose tolerance in relation to mea.l intake
frequency studied. Fabry states that "so far as meal frequency is con=
cerned, however, little :ls yet known about the consequences of different
d:i.etary hab:i.ts i.n. people under normal living and working conditions" (20,
p. 614),
The. results of a study on the effect of nibbling versus gorging
on serum lipids in man indicate that when the meal pattern· in man is
. changed from three meals a day to nibbling the.re is an immediate de=
crease :i.n serum lipid levels. When man I s eating habits are changed
from three. meals a day to gorging there is an immediate increase in
serum lipid levels, The results of this study were acute ones and it
is not known whether prolonged maintenance on either gorging or nib-
bling regimens is accompanied by persistent alteration in blood lipids
( 26).
Cohn°s (8) study on feeding frequency and body composition sug=
gested that the rate of ingestion of the diet plays a significant role
in the regulation of body composition.. It appears that when the same
dal.ly food is ingested with. a decrease in the frequency of meals, more
of the dietary constituents.are channeled toward fat storage and less
protein formation. Evidence was presented in this study to suggest
that protein synthesis may be subject to rate-limiting enzymatic re
actions .•
31
As previously stated the studies of man,. with. respect to his eating
habits and reactions have not been systematically undertaken. At birth,
a baby is fed "on demand" but soon a number of factors change his meal
eating habits. These factors are convenience, working conditions, habit
and custom. Itis of greatest importance to man to determine the effects
of eating patterns from the physiological, epidemiological, . and thera
peutic considerations. Cohn states that "studies so far· accomplished
in man, with respect to body metabolism and eating habits, have yielded
results suggesting that man reacts physiologically. as do other specie$"
(9, p. 436).
Leverton, Gram, and Chaloupka (33) studied for 54 days two groups
of eight young women for the effect of the time factor and calorie level
on nitrogen utilization. One group had a daily intake of 43 grams of
protein and the other group had approximately 63 grams of protein. The
group with the 43 grams of protein intake had a significantly lower
urinary nitrogen excretion when the animal protein in the form of milk
was present in the noon meal than when the milk was omitted. The group
with the higher protein intake showed no difference in nitrogen
excretion in relation to the presence·or absenceof milk in the noon
meal. When calories were increased. from 1800 to 2400 and the animal
protein was absent from the noon meal there was a highly significant
reduction in nitrogen. The nitrogen sparing action af the extra calories
was greatest at the 43 grams level af protein intake.
32
In ccmclusion "the implications are that the lower the intake of
protein and calories, the· greater the n,eed far including high quality
protein in .each meal if nitrogen is to be well.utilized" (33, p, 544).
Hunscher (28) has pointed out that there i$ a vast amount of data
available in the literature·on metabolic balance. Metabolic studies as
long as 50 years-ago and thereafter can answer, in part, withrecon ..
sideration and creative thought, some of the present day questions.
Many ·factors are linked together and are difficult to separate. Some
-of these influencing factors which should be studied are individuality,
variability, duration of study, activity versus basal stijte, nutritive
background and emotions.
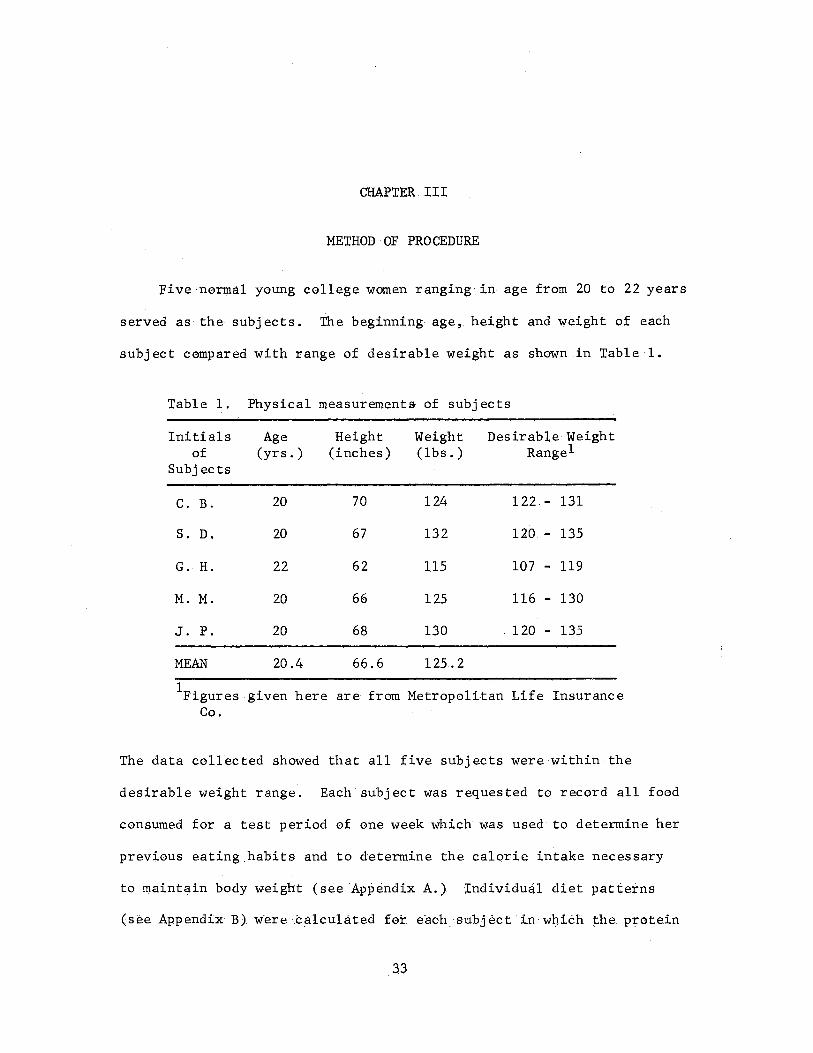
CHAPTER III
METHOD OF PROCEDURE
Five normal young college women ranging in age from 20 to 22 years
served .. as the subjects. The beginning age, height and weight of each
subject compared with range of desirable weight as shown in Table 1.
Table 1. Physical measurement& of subjects
Initials Age Height Weight Desirable Weight of (yrs.) (inches) (lbs.) Rangel
Subjects
c. B. 20 70 124 122 - 131
s. D. 20 67 132 120 - 135
G. H. 22 62 115 107 - 119
M. M. 20 66 125 116 - 130
J. P. 20 68 130 120 - 135
MEAN 20.4 66.6 125.2
lF. 1.gures given here are from Metropolitan Life Insurance Co.
The data collected showed that all five subjects were within the
desirable weight range. Each subject was requested to record all food
consumed for a test period of one week which was used to determine her
previous eating.habits and to determine the calorie intake necessary
to maintain body weight (see Appendix A.) Individud diet pattei"'ns
(see Appendix B) were ·c~lculated for e'ach .. ,subject · :tn: wgidi i:;he, p;i;-otein

34
level, 83 grams, and fat level, 38 per cent of total calories, was held.
constant and the variability was only in carbohydrate and calories.
Coffee and tea were eliminated from the subjects' diets due to the
possible·role caffeine might play in the increment of basal metabolic
rate. In calcul~tion of the diets of the subjects the exchanges lists
(see Appendix C) were used in order to offer a shorter method of calcu-
lation and more variety in the kinds of foods.allowed on the diets
during the seven weeks of the study.
All five subjects were students majoringin the Food, Nutrition,
and Institutional Administration Department of Oklahoma State University.
Four of the young college women were juniors and one was a graduate
student. The selected group of young women had grade point averages
ranging from 2.95 to 3.54. The subjects chose their food from the cafe-
teria at Willard Hall and the Student Union with few exceptions.
During the three-week period when only three meals were consumed
daily accurate records were kept by each subject of the amounts of food
consumed and the hour and place of eating. See Appendix B.
A basal metabolism test was taken each week on each subject during
the three-week period. Each subject came to the laboratory at 6 a.m. \
once a week and the same day of the week as scheduled. After one hour
of complete bed rest the subject's temperature and pulse were recorded.
Then the basal metabolism test was taken. Following the test and while
the subject was still in bed her pulse was taken again. The basal
me.tabolism and respiration rate was calculated iim11ediately following the
test of each subject.
Physical Measurements
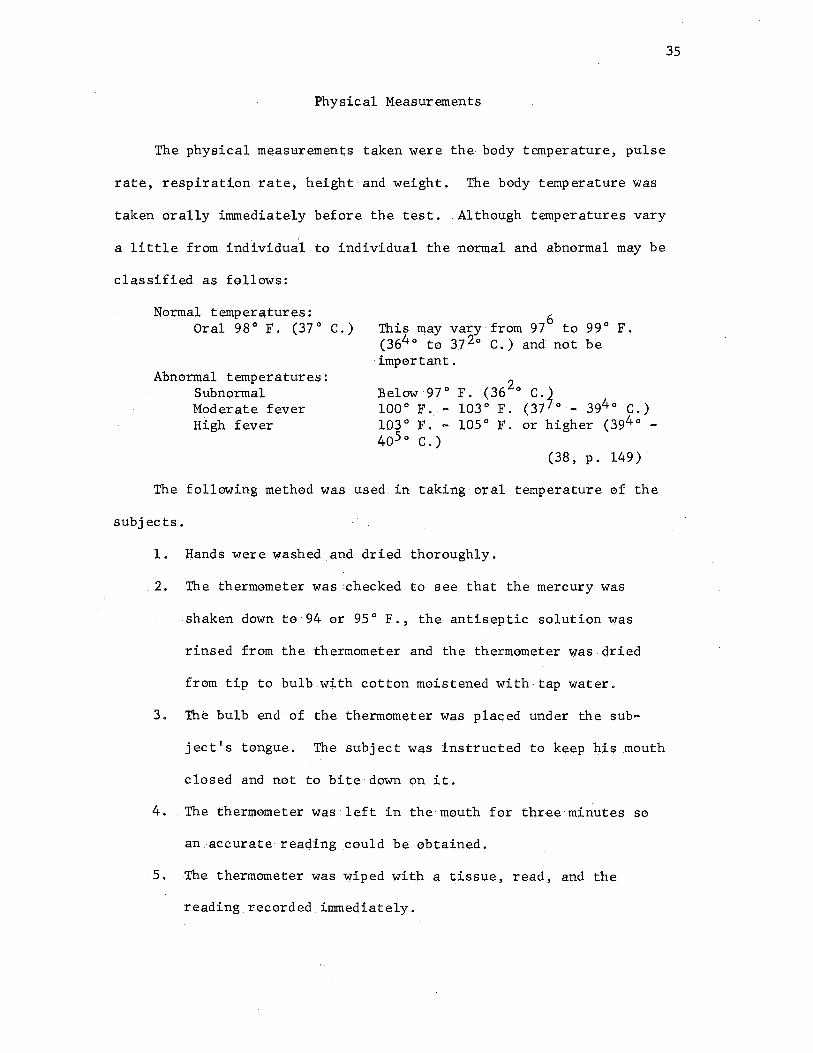
The physical measurements· taken were the body temperature, pulse
rate, respiration rate, height and weight. The body temperature was
taken orally inunediately before the test •. Although temperatures vary
a little from individua1l to individual the normal and abnormal may be
classified as follows:
Normal temperatures: This may vary· from 9i to 99 ° F. (364° to 372° C.) a~d not be
·important.
Oral 98° F. (37° C.)
Abnormal temperatures: Below 97° F. (36 20 c.) Subnor~al
Moderate fever H:i.gh fever
100° F, - 103° F. (377°·- 394° C.) 103° F .. - 105° F. or higher (394° 405 ° C.)
(38, p. 149).
The following method was used in taking oral temperature of the
subjects.
1. Hands were·washed and dried thoroughly.
2. The thermometer was ,checked to see that the mercury was
shaken down to· 94 er 95 ° F., the anti1:1:eptic solution was
rinsed from the thermometer and the thermometer was dried
from tip to bulb with cotton moistened with tap water.
3. The bulb end of the thermometer was placed under the sub-
ject's tongue. The subject was instructed to keep J::i.is mouth
closed and not to bite down on it.
4 .. The thermometer was left.in the·mouth for three minutes so
an. accurate· reaging .Gould be· obtained.
5. The thermometer was wiped with a tissue, read, and the
reading.recorded immediately.
35

6. The thermometer was returned to the container of 70%
.alcohol antiseptic solution for future use.
While the· subject had the thermometer in his mouth the pulse ·was
counted.
A pl.';lint where an artery crosses a bone close to the surface· of
the skin is called a pressure point. The site most commonly used for
taking the pulse, and the most convenient, is where the radial artery
crosses the bone on the thumb side of the wrist. If for any reason a
radial pulse cannot be taken, the alternatives are at the temple, cm
the jawbone about one inch from the angle -of the jaw, in the neck be
side the windpipe, just behind the inner end of the collar bone, or
midway in the groin where the artery passes over the pelvic bone.
The characteristics of the pulse are rhythm, rate or frequency,
force or volume, and tension. Th~ age, sex, and size of the person
may influence.the pulse .. The average rate for one minute for women
· is 65 to 80 beats.
36
The following method was used. in taking the pulse of the subjects.
1. While the subject had the thermometer in her mouth and was
in a reclining position, with her arm on the chest, place
tips of first three fingers over radial artery. Use only
·enough pressure to count accurately.
2. The beat. was counted for one full minute and the pulse
rate was recorded immediately.
Respiration is the process by which· oxygen is brought into the
body and the carbon dioxide is eliminated. One full respiration con
sists of an inspiration of air into the lungs and the expiration of
air from the lungs. The two characteristics of respiration are the

37
rate and amount. The· rate is· the number of full respirations. in a
minute. The average for one minute for women is 14 to 20 per minute
(25). Instead of c0ur1.ting the number of respirations per minute it was
discovered that a mere ac·curate record cauld be ·obtained .from the
metabolic tracing in which. one minute was .equivalent to ene inch.
The Fairbanks scale m,edel 50 ... 206 was used to det¢rmine the weight
and a measuring bar was used to determine the height of the subjects.
1. The subjects were weighed at the same time each day and
with the same type of clething .
. 2 .. The scale was balanced before the subject stepped. on it.
3. The scale was read and the weight ef the subject was recerded
immediately.
4. The subject stoed .. erect while the measuring bar was adjusted
until. it teuched the top of the head •
. 5. The height reading was taken and recorded immediately (38).
The weight of the subjects was compared with the desirable weight
fer height of women.as given in The Metropolitan Life Insurance-Campany
charts. The portien fer women is found in Table 1, page 38.
Calculatien of Diets
The calculation ef the diets fer the subjects were determined using
the exchange lists preparE\d by the American Diabetes Asseciation, the
American Dietetic Asseciatien,.and the Diabetes Branch, U.S. Public
Health Service. These ·exchange ·lists· of feed values. offer a shert,
. accurate method fer calculating diets (5). A medified fruit exchange
· list· was prepared .for sweetened fruits and fruit juices (13) when fresh
er unsweetened. fruit and fruit juices were not available. See Appendix D.

38
Table· 1 .. Desirable ·weights for women, acGordh1g to height and frame, ages twenty-five and over*
WEIGHT IN INDOOR CLOTHING
HEIGHT . Small Medium Large {in shoes) Frame Frame :Frame
Women
4 ft. 10 in. 92- 98 96-107 104-119 4 ft. 11 in. 94 .. 101 98-110 -106-122 5 ft. 96-104 101-113 109-125 5 ft. 1 in. 99-107 104-116 112-128 5 ft. 2 in. · 102-110 107-119 115-131 5 ft . . 3 in. . 105-113 110-122 118-134 5 ft. 4 in. 108-116 113-126 121-138 5 ft. ·5 in. . 111-119 116-130 125-142 5 ft . . 6 in. 114-123 120-135 129-146 5 ft. 7 in. 118-127 124-139 133-150 5 ft. 8 in. 122-131 128-143 137-154 5 ft. 9 in. . 126-135 132-147 141-158 5 ft. 10 in. 130-140 136-151 145-163 5 ft. 11 in. 134-144. 140-155 149-168 6 ft. 138-146 144-159 153-173
* Met. Life Ins. Co ..
For girls between 18 and 24 years, subtract 1 lb. for each year under 25.
(34, p •. 325)

39
How to Make the Metabolic Test
When the subject is attached to the apparatus his breathing causes
back and forth motion of the pen. With the pen applied to the paper
and with the clock-plate in motion, the tracing begins (see graph on
opposite page).
The absorption of oxygen from the bellows by the subject causes
the graph to move inward until it crosses the printed base line at A
when a liter of oxygen is released into the bellows. This is automati
cally corrected in volume for changes in barometer and thermometer. The
release of this liter of oxygen causes the pen to trace the outward
swing seen in the graph. The tracing continues until the pen again
crosses printed base line, thi,s time at B, when the test is ended.
The liter of oxygen metabolized at the end of test from base line
A to Bis then measured in inches, which equals the number of minutes
to fix the percent Basal Metabolic Rate. The rate is instantaneously
determined without figuring of any kind by the Jones· Automatic Basal
Metabolism Calculator or Slide Rule.
A liter thrust measurement is made without having a subject at
tached to the apparatus, and is only· traced once to adjust protractor
rules and is not repeated unless protractor rules are out of adjustment.
This measurement is automatically corrected by the gauge for variation
in temperature, pressure and aqueous tension. The liter thrust is de
termined by introducing into the breathing chamber an exact liter of
oxygen, as measured by the measuring chamber and gauge. The i,ntro
duction of this liter of oxygen causes the lateral movements of the
pen which is recorded on the tracing sheet (31).

! i ... ~! ! :r
m -... ... ... ·- ... .......
0 .. a, ... r.>
... . .., ~
.......... . ... ;._: ·.... ~ . .... ~ ~
.. •i i -i ·1 ~
8 7 6 S 4 3 2 1 TOTAL 2.( HOUll CALOIUl! otrrPUT. For ~le. if patient ~keel 51,G. mmutes to - one liler of·-,.eo bf dais-. f"mcl beside die ,~ iada 1324, ~ti!II !iii U boar calorie output UNDER BASAL CONDmONS. .
-------t"' -----3: -----m
:)
0:1 r'
I'll I
..a
-< ··n··- . · i'liesc figures were obtained by the formula, 0 4~· n:;nutesr 1~/ testfrs) x 4.825 (calories. in l i. Os) =Total 24 hr. b~ 011tput. Poocl iotake to maintain this .heat Olllpllt must
• (1 me o 1s . . . be about ill% more for effect of digestion on this basal rate, and another 15 to 25% inorc for average physical exertion (as housekeeping or office work) up to 80 or 100% more for hard physical labor. Therefore, if desired to decrease. patient's body '"eight, ·reduce his 24 hour food iotake BELOW this 24 hour basal calorie loss (basal metabolism). To incroase his wtight, · increase his· 24 hour fond intake ABOVE bis basal rate and add 10% more for effort of digestion OD his B.M.R. and an additional percentage sufficient to make good his additional losses due to physical exertion. •(See chapter 3 in monogr~ph entitle<;I .. The Cause or Goiter", price $5.00 postpaid). .
JOMES METABOLISM E9UIPMENT CO. • 315 SOUTH HONORE STREEt . • £~GO. ILLINOIS
·~
'"3
I ·~ .... n Ill ... 3: ID
. "" Ill er Cl -.... n ::0 ., n Cl '1 Q.
~ > ~ ·1-4 .
+' 0
41
The protractor is a mechanical check devised to detect errors in
the operative technique and the accuracy of the test. The protractor
will fit the two graph slope lines by adjustment if tracing is acc'l.1,rate.
Should some technical error occur during the making of a tracing the
two protractor rulers could not be ·made to coincide with the two graph
slopes. Any error in technique,. no matter what the nature of the error,
would cause the graph slopes tci be out of parallel or wrongly spaced
apart from each other (31).

42
Simple Instructions for Operating
the Jones Motor-Basal
1. Adjust Tracing Sheet on Clock Plate and insert Plate into slot at front of Clock Housing.
2. Turn 3-Way Valve (Breathing Valve) parallel to floor, collapse Bellows completely and allow Bellows to expand, filling with room air until Pen is at 'AIR' position on Tracing Sheet. Then turn 3-Way Valve perpendicular to floor to hold Bellows fixed in. this position.
3. Close Needle Valve and admit some oxygen into Measuring Chamber, driving black indicator to about the 20° C. mark on face of pressure ga1,1ge.
4. Open Needle Valve and admit enough of this unknown quantity of oxygen into Bellows to push Pen from 'AIR' position to S, Mor L, according to weight of patient.
(S--125 lbs. or less; M ... -125-175 lbs.; L--175 lbs. or over.)
5. Fill Pen with ink and adjust against Tracing Sheet.
6. Measure off exact liter of oxygen within Measuring Chamber by driving black indicator around to position exactly over red temperature indicator on gauge.
7. Adjust Nosepiece and, after making certain that there is no leakage, insert Mouthpiece. Ask patient to take one deep breath, then to allow breathing to occur naturally.
8. Plug in Motor-Blower. Measure patient's pulse.
9. At exact end of patient's normal expiration (not forced) turn 3-Way Valve parallel to floor, connecting patient with unknown mixture in Bellows.
10. Start Clock to begin tracing.
11, When tracing has definitely crossed within first printed line (see sample graph) glance at gauge to check liter-volume, then open Needle Valve and admit the exact liter of oxygen to Bellows.
12. When tracing has definitely crossed within first printed line for second time, (see sample graph) the test is over. Pull Pen away from Sheet, stop Clock, stop Motor-Blower, close 3-Way Valve, remove Mouthpiece and, after again testing for nose leakage, remove Nosepiece. Again, take pulse.
13. With aid of Protractor, check tracing and find time to consume exact liter of oxygen; with Automatic Calculator compute results of test. In case of doubt of any test send it to the Jones Metabolism Equipment Company, 315-323 South Honore Street, Chicago 12, Illinois for free checking and correction (31).
(To avoid confusion, remember the difference between the 3-Way Valve and the Needle Valve.)

THE Jo11e1 MOTOR-BASAL METABOLISM UNIT Owned and used by over 30,000 Physicians, Hospitals, Clinics,
Medical Colleqea, Universities and Medical Laboratories, World-Wide. A modificallon of the original "waterle11" metabolism apparatus designed by Horry M. Jones. · M. p,, Ph. D.. in the Department of Experimental Medicine University of Illinoia. College of Medicine, Cl)icago, Illinois, 1919.
An Important Requl8lte for Any Complete Examination: For differential dlagno1l1 of the aymptom-c:omplex of fatigue, nervcu1ne11, increahd h•art·rate, tremor, emotional inatablllty and. deprNaed menta! and phyalcal efficiency, nothing i1 10 re· vealing aa an accurate BMR determination and nothing 11 ao important aa· the selective chooaing of the proper BMR·teaUng apparatua to prov1de that accuracy.
Tlm•Proven Feature, of the JonH Motor·Baaal: ACCURACY,,,
• ltandarct.lller oxy9enJqu9e meaaure1 pre,determllled exact liter of 011y91n, CNlomallaally correct for barometer, thermometer and aqueou1 tenelon ahan;ee: aocuraay prov•n to within ,... than 1 '9.
• Eqlllppld with unique device to prevent chance technical 1rrora, thereby pro, t1etln9 patient and ~ootor from expenalve conHquenc11 of lncorrtat reporll.
• u.. of two,alope 9raph to cancel out errot1 Qalllld by br1athln9 chamber re1l1tanot varlatlona Htn In "1ln9l1,1lope" or other type1 of. 9raphl.
CONVENIENCE , , , • llmDllllid technical routine, eaally followed. • No &arom111r of thermometer correctlon1, No tablu or ahart1. • ln1tant,readln9 11lde rule ellmlnat11 all calwlallon1 and compula,
t!Oftl, with their r•ullln9 mathematical errore. • l!aally movable from bed to bid, or room to room. • Pormll1 direct r1adln9 of volume for vital capacity m1a1uromont1
and othu roa;,ltatory 1tudlon, thu1 lncrocuilng dla;no1tla UDO,
DEPENDABILITY •• , • Guaranteed a9aln1t defecta In workman1hlp er material, Rubber
bellow• ;uaranteld for five yeare. • T11ted and approved by mllllone of 1at11f11ctory 11111, throu;hout
mort than 25 yecr1 of \Ill, by more, than 30,000 1at111led 111ere. • Con1tr11ct1d to wlthatand heavy duty and 9lve yeare of 1atllfactory
Hrvlce.
J,. ~ to the above important .requi1ite1, the Jones Motor-Basal has "eye-appeal"-is an impressive and good-looking addition to the other equipment in the office or laboratory. Although, from· a 11tand· point of diagnostic value, Beauty may be the least important factor, it must not be overlooked.
The first Waterleu BMR Unit, built over a third of a century ago, has been improved and refined by the addition of many scientific devices to aBBure accuracy, operative simplicity and last a lifetime of heavy duty. Through the years, every part of the apparatus has been improv"'d in construction and ma· terial. to provide a most accurate, durable, trouble-free and beautiful unit. ( 3 J ).
43
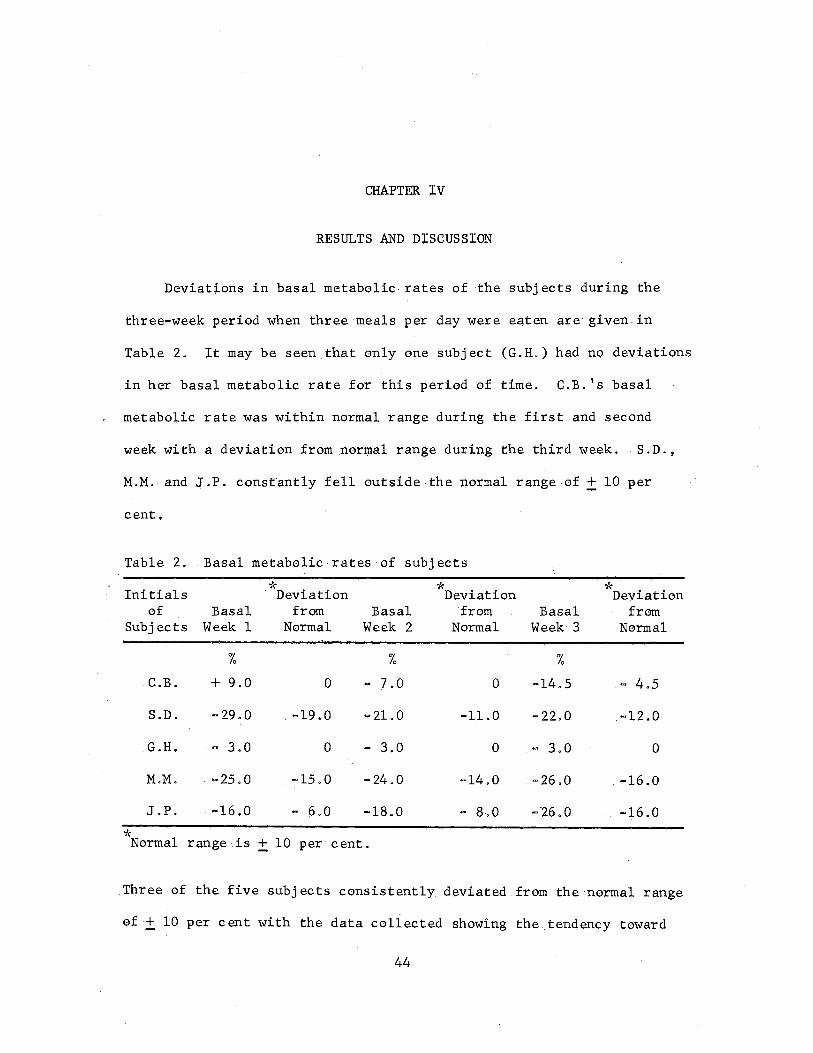
CHAPTER IV
RESULTS AND DISCUSSION
. Deviattons in basal metabolic-rates of the subjects during the
three-week period when three meals per day were eaten are given. in
Table 2. It may be seen that only one subject (G.H.) had no deviations
.in her basal metabolic rate for this period of time. C.B. 's.basal
metabolic rate was within normal range during the first and second
week with a deviation from .normal range during the third week .. S.D.,
M.M. and J.P. const·antly fell outside the normal range -of + 10 per
cent,
. Table 2. Basal metabolic-rates of subjects
* ·,* * Initiah Deviation Deviation Deviation of Basal from Basal from Basal from
Subjects Week 1 -Normal Week 2 Normal Week 3 -Nermal
% % %
G.B. + 9.0 0 - 7.0 0 -14.5 - 4.5
S.D. -29.0 . -19.0 ...21.0 -ll.O -22.0 . -12.0
G.H. , - 3.0 0 ... 3.0 0 - 3.0 0
M,M. .. 25.0 -15~0 -24.0 -14.0 -26.0 . -16.0
J.P. · -16.0 .. 6.0 .. 1a.o - 8.0 -'26.0 ... -16.0
* Normal range is+ 10 per· cent.
Three· of the five subjects consistently deviated. from the ·normal range
of·± 10 per cent with the data collected showing the. tend,ency toward
44
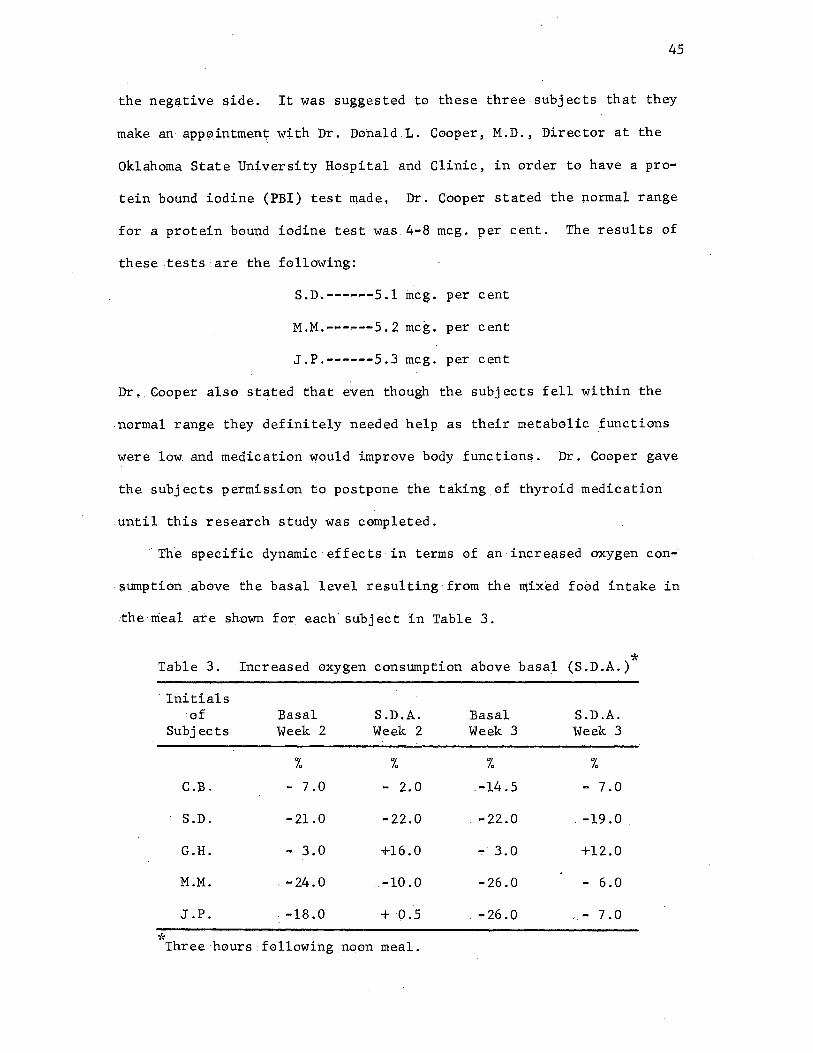
45
the negative side. It was suggested to these three,subjects that they
make an appc;3intmen~ with Dr. I)onald L. C0oper, M.D., Director at the
Oklah0ma State University H0spital and Clinic, in order to have a pro-
tein bound iodine (PBI) test made, Dr. Cooper stated the normal range
for a protein bound iodine test was.4-8 mcg. per cent. The results of
these tests are the following:
s.D .. ----... -5.1 incg. per cent
M.M.------5.2 mcg. per cent
J .. P. ------5. 3 mcg. per cent
Dr. Cooper· also 1;1tated that even though the subjects fell within the
nermal range they definitely needed help as their metabolic ,functions
were low and medication would improve body functiens. Dr. Cooper gave
the subjects permission to postpone the taking of thyroid medication
until this research study was completed.
· The specific dynamic· effects in terms of an increased oxygen con-
1;1umption _above the basal level resulting from the n(ix'ed food intake in
:the meal ar·e shown for. each· subject in Table 3.
Table 3.
*
Initials :of
Subjects
C.B.
S.D.
G.H.
M.M.
J.P.
* Increased oxygen consumption above basal (S.D.A.)
Basal Week 2
% - 7.0
·21.0
.... 3.0
. -24.0
. -18.0
S.D.A. Week 2
- 2.0
-22.0
+16.0
.-10.0
+ 0.5
Basal Week 3
%
.-14.5
.. -22.0
- 3.0
-26.0
-26.0
S.D.A. Week 3
%
- 7.0
.-19 .0
+12,0
- 6.0
- 7.0
Three hours following nQon meal.

46
The results show there was a substantial increase in the demand for
oxygen consumption per minute when compared with the basal level of
consumption with one exceptton. S.D. in week two. showed a slight qe
crease. The decrease in per cent of specifi.c dynamic action for S.D.
could have been due to an error in technic or the subject was not in a
true basal state when the metabolic tracing was made. Emotional tension
could have influenced the results obtained.
In evaluating the response in metabolism to the diet consumed. it
was felt that the time element was just as important as the amount and
kind of food eaten. In Table 4 is shown the food intake summary for
the subjects consuming three regularly spaced meals per day for a three
weeks' .. period. The results show that each subject conformed to her.
dietary pattern well with the following deviations:
Protein - from O to =2 grams
Fat====-- from =5 to +2 grams·
These two nutrients ·were to be held constant with the variance in the
carbohydrates and calories ~n each of the diets according to the
previous patterns set during the test period.
The temperature readings recorded during the three=week period
when the subjects were consuming three meals per day were within the
normal variance allowed. In Table 5 is shown the temperature range of
subjects at the time of taking the basal metabolism, The temperature
range of subjects recorded following ingestion of food are given in
Table 6.
Findings in Table 7 indicate that the weight of the subjects did
not fluctuate more than five lbs. during the three~week period.
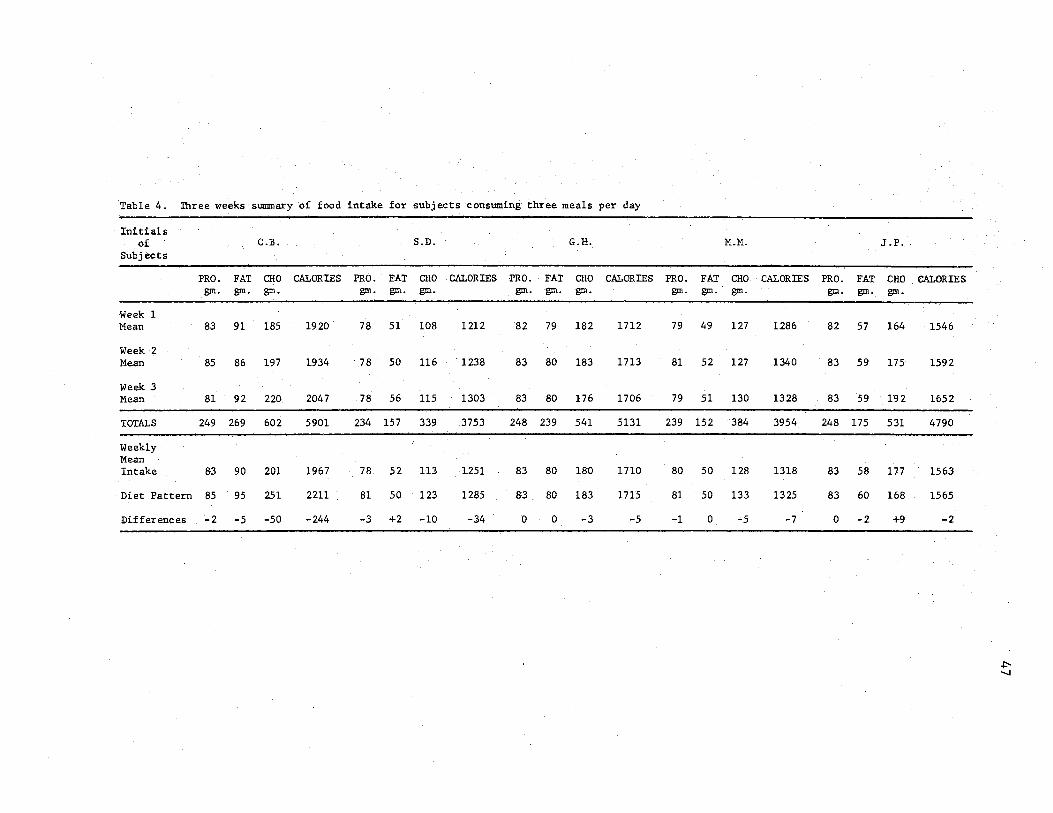
Table 4. lhree weeks summary. of food intake for subjects consuming three meals per day
Initials of C.B. S.D. G.lL.
Subjects
PRO. FAT CHO CALORIES PRO. FAT CHO CALORIES PRO, FAT CHO CALORIES . gm. gm. gm. gm. gm. gm. gm. gm. gm .
Week 1 Mean · 83 91 185 1920 .78 51 108 1212 82 79 182 1712
Week 2 Mean 85 86 197 1934 .· .78 50 116 . 1238. 83 80 183 1713
Week 3 Mean 81 92 220. 2047 78 56 115 1303. 83 80 176 i706
.TOTALS 249 269 602 5901 234 157 339 .3753 248 239 541 5131
Weekly Mean In.take 83 90 201 1967 78. 52 113 . 1251 83 80 180 1710
Di.et Pattern 85 , 95 251 2211 81 50 123 1285 83 80 183 1715
Differences -2 -5 -so -244 -3 +2 -10 -34 0 0 -3 ~5
M.M.
PRO. FAT CHO. CALORIES gm. gm. gm.
79 49 127 1286
81 52 127 1340
79 51 130 1328
239 152 384 3954
80 50 128 1318
81 50 133 1325
-1 0 ... 5 -7
PRO. FAT gm. gm.
82 57
83 59
83 59
248 175
83 58
83 60
0 -2
J.P.·.
CHO gm.
164
175
192
531
177
168
+9
. CALORIES
1546
1592.
1652
4790
1563
1565
-2
~ -...J

48
* (basal state) Table 5. Cumulative temperature readings of subjects recerded during the seven week period
Initials of ·week 1 Week 2 Week 3 Week 4 Week 5 Week 6 Week 7
Subjects Fo Fo Fo Fo Fo Fo Fo
C.B. 98.4 98.4 98.6 98.4 98.5 98.4 98.6
S .D. 98.0 98.4 98.4 98.3 98.4 98.4 98.6
G.H. 98.4. 98.4 . 98~5 98.4 98.6 98.4 98.6
M.M. 98.4 98.3 ·98. 2 98,4 98.4 98.4 98.6
J.P. 98.0 98.0 98.5 98.4 98.3 98.4 98.6
* temperature may vary 6 Nermal from 97 ·to 99° F.
Table 6 . . Cumulative * temperature readings of subjects (S.D.A.) re-corded during the seven week period
Initials of Week 1 Week 2 Week 3 Week 4 Week 5 Week 6 Week 7
Subjects Fo Fo Fo Fo Fo Fo Fo
C.B. 98.3 98.6 99.0 98.6 98.2 99,0
S.D. 98.4 98.4 98.2 98.4 98.4 98.6
G.H. 98.4 98.8 98.6 98.6 98.4 98.6
M.M. 98.4 98.4 98.0 98.4 98.4 98.6
J.P. 98.4 98.1 98,6 98.6 98.6 98.0
* 6 Normal temperature may vary from 97 to 99° F.
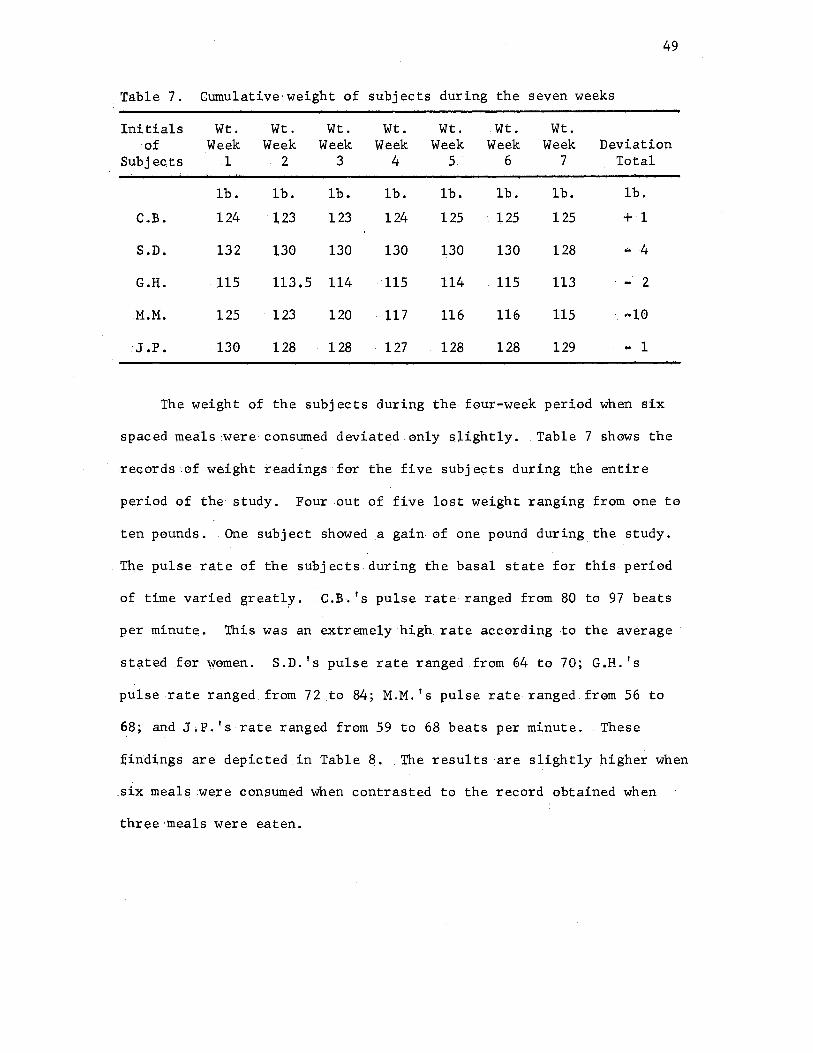
49
Table 7, Cumulative·weight of subjects during the seven weeks
Initials Wt. Wt. Wt. Wt. Wt. . Wt. Wt. of Week Week Week Week Week Week Week Deviat;l.on
Subj eo.ts 1 2 .3 4 5. 6 7 Total
lb. lb. lb. lb. lb. lb. lb. lb.
C.B. 124 l23 123 124 125 125 125 + 1
S.D. 132 130 130 130 130 130 128 .. 4
G.H. 115 113.5 114 115 114 115 113 - 2
M.M. 125 123 120 117 116 116 ·115 . -1(!)
J.P. 130 128 128 127 128 128 129 .. 1
The weight of the subjects during the four-week period when six
spaced meals :were·consumed deviated only slightly .. Table 7 shows the
records ·of weight readings for the :l;ive subjec;:ts during the entire
period of the study. Four .out of five lost weight ranging from one te
ten pounds .. One subject shewed a gain of one pound during the study .
. Tlle pulse. rate of the subjects. during the basal state· fer this peried
of time varied greatly. C.B. 's pulse rate ranged from 80 to 97 beats
per IQ.inute. This was .an extremely high rate accarding :ta the average
stated for women. S.D.'s pulse rate ranged .from 64 to 70; G.H. 's
pulse rate ranged from 72 .to 84; M.M. 's pulse rate ranged from 56 to
68; and J.P. 's rate ranged from 59 to 68 beats per minute .. These
:f;iridings are depicted in Table 8, . The results .are slightly higher when
:six meali:i :were consumed when contrasted to the record_ obtained when
three·meals were eaten.
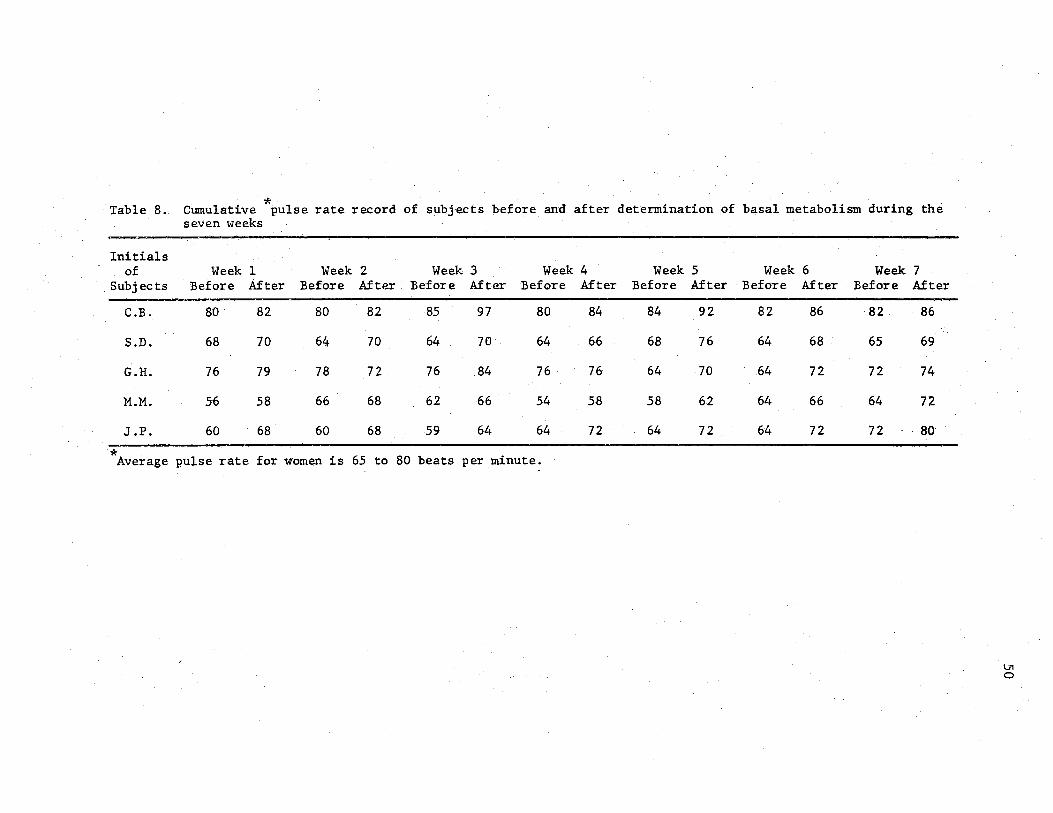
Table 8. Cumulative * . . . pul.se rate record of subjects before and after determination of basal metabolism during the seven weeks
Initials of Week 1 Week 2 Week 3 Week 4 Week 5 Week 6 Week 7
Subjects Before After Before After . Before After Before After Before After Before After Before After
C.B. 80 .82 80 82 85 97 80 84 84 92 82 86 82 86
S.D. 68 70 64 70 64 70 64 66 68 76 64 68 65 69
G.H. 76 79 78 72 76 84 76 76 64 70. 64 72 72 74
M.M.: 56 58 66 68 "62 66 54 58 58 62 64 66 64 72
J.P. 60 .. 68 60 68 59 64 64 72 64 72 64 72 72 ·. · BO
* Average pulse rate for women is 65 to 80 beats per minute.
V1 0
51
The pulse rate showed less deviation for the five subjects when
the energy metabolic test was taken with the exception of one. C.B . 's
pulse .rate had a wider range when the energy metabolic test was taken
·than when the basal metabolism was taken as stated in Table 9, page 52.
The respiration was below the normal respiration rate for women
which ranges from 14-20 per minute. As shown in Table 10, page 53,
the range was quite low, from 6-12 for the five subjects during the
basal state.
The respiration rate of the subjects three hours following the
ingestion of food was slightly increased, from 8 to 15 per minute.
These ·findings are presented in Table 11, page 53.
During the four-week period when six meals were consumed the basal
metabolic rates of the five subjects deviated less from the normal range
than when three meals were eaten daily. The tabulated results for the
subjects are shown in Table 12, page 54. The basal metabolic rates for
all of the subjects were higher during the four-week period when six
meals were consumed than when the three meals per day were eaten.
Indicated in the results is a suggestion that the spacing of meals
alters the metabolic activities of man and in some manner causes an
increased metabolic rate.
The increased oxygen consumption above the basal level resulting
from the ingestion of six spaced meals per day is shown in Table 13,
page 54. The figures in Table 13 show a substantial increase in the
demand for oxygen consumption per minute for all subjects when con
trasted to the results obtained when three meals were eaten. See
Table 4, page 47.

Table 9.
Initia,ls of
Subjects
C.B.
S.D.
G.H.
M.M.
J.P.
Cumulative * . . . pulse rate record of subjects (S.D.A.) after the ingesti.on of food during the seven weeks
Week 1 Week 2 Week 3 Week 4 Week 5 Week 6 Week 7 Before After Before After Before After Before After Before After Before · After Before After·
- --· 67 68 86 96 84 76 82 86 76 80 85 95
--· - 68 74 60 65 66 66 68 68 69 78 72 . 76
-- ·-- 82 80 7'6: 74 68 68 84 96 72 80 74 78
·-·- ··-- 60 64 74 7'8 60 66 5:6 66 62 76 80 84
-- -·- 65 72 60 66 60 64 68 76 60 65 ··64 · · 72
\J1 N

53
* Table 10. Cumulative respiration rate of subjects (basal ~tate) during the seven weeks
Initials of
Subjects Week 1 Week 2 Week 3 Week 4 Week 5 Week 6 Week 7
per/min per/min per/min per/min per/min per/min per/min
C.B. 12 12 12 10 11 12 11
S.D. 9.5 6 9 6 8 11 11
G.H. 9 9 7 8 9 9 10
M.M. 12 12 11 11 12 11 14
J.P. 6 6 7 7 8 9 10
•k Table 11. Cumulative respiration rate of subjects (S .D .A.) during the
Initials of
seven weeks
Subjects Week 1 . Week 2 Week 3 Week 4 Week 5 Week 6 Week 7
per/min per /min per /min per/min per /min per /min per /min
C.B. 14 15 16 14 14 14
S .D. 11 8 8 9 8 9
G.H. 9 9 9 9 9 9
M.M. 14 13 13 12 14 1.3
J.P. 9 9 10 7 7 7.5
* Normal respiration rate for women is 14·20 per minute.
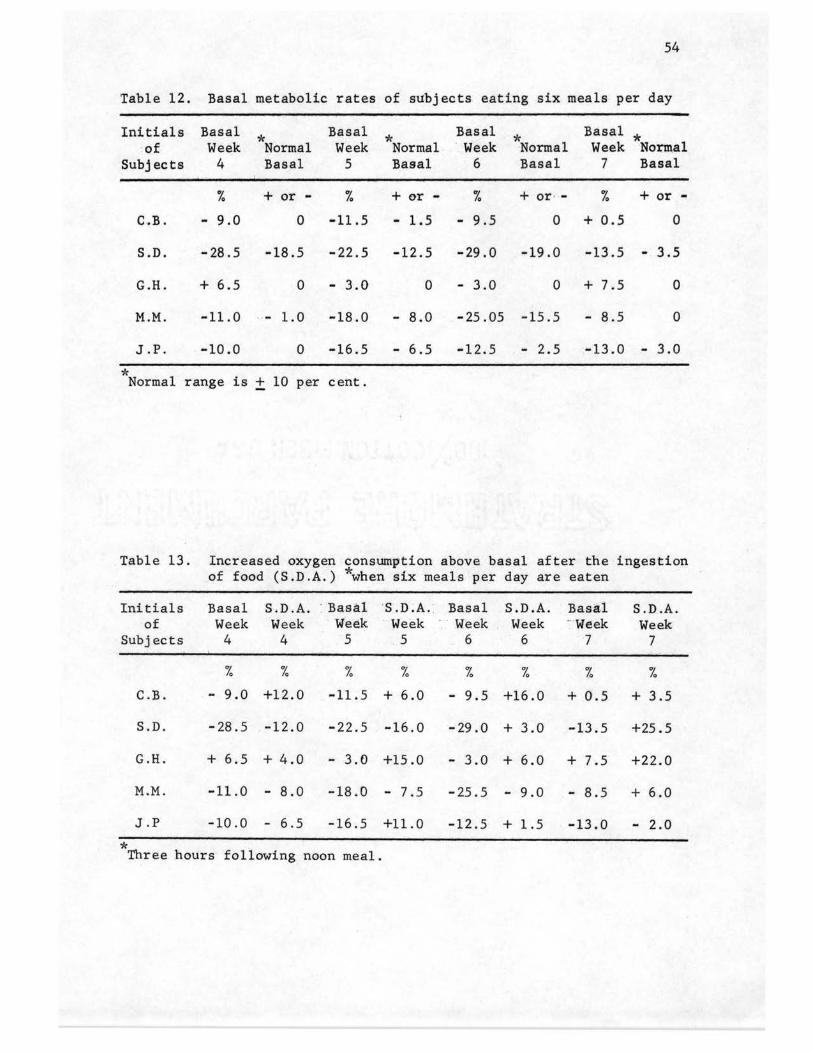
54
Table 12. Basal metabolic rates of subjects eating six meals per day
Initials Basal *
Basal *
Basal *
Basal * of Week Normal Week Normal · Week Normal Week Norlt\al
Subjects 4 Basal 5 Basal 6 Basal 7 Basal
% + or - % + or - % + or · - % + or -
C.B. - 9.0 0 -11.5 - 1.5 - 9.5 0 + 0.5 0
S.D. -28 .5 -18.5 -22.5 -12.5 -29 .0 -19.0 -13.5 - 3.5
G.H. + 6.5 0 - 3.0 0 - 3.0 0 + 7 .5 0
M.M. -11.0 1.0 -18.0 - 8.0 -25 .05 -15.5 - 8.5 0
J.P. -10.0 0 -16.5 - 6.5 -12.5 - 2.5 -13.0 - 3.0
* Normal range is + 10 per cent.
Table 13. Increased oxygen consumption above basal after the ingestion of food (S.D.A.) *when six meals per day are eaten
Initials Basal S.D.A. • Basal S.D.A. Basal S.D.A. Basal S.D.A. of Week Week Week Week · Week Week · week Week
Subjects 4 4 5 . 5 6 6 7 7
% % % % % % % %
C.B. - 9.0 +12.0 -11.5 + 6.0 - 9.5 +16.0 + 0.5 + 3 . 5
S.D. -28.5 -12.0 -22.5 -16.0 -29 .0 + 3.0 -13.5 +25.5
G.H. + 6.5 + 4.0 - 3.0 +15.0 - 3.0 + 6.0 + 7.5 +22.0
M.M. -11.0 - 8.0 -18 .0 - 7.5 -25.5 - 9.0 - 8.5 + 6.0
J.P -10.0 - 6.5 -16.5 +11.0 -12.5 + 1.5 -13.0 - 2.0
* Three hours following noon meal.

55
The four-week summary of food intake·· for the five sub~ ects con
suming six spaced meals per day is presented in Table 14. The protein
and fat content of the diet was held constant with the only v~riance
being .in carbohydrates and calories. The diet patterns of the subjects
consuming six spaced meals for the four-week period are located in
Appendix B. Results show that the subjects conformed to their indi,.;. ·
vidual dietary patterns well with the range in protein from Oto -1 a~d
fat ranging from Oto -3 and Oto +2.
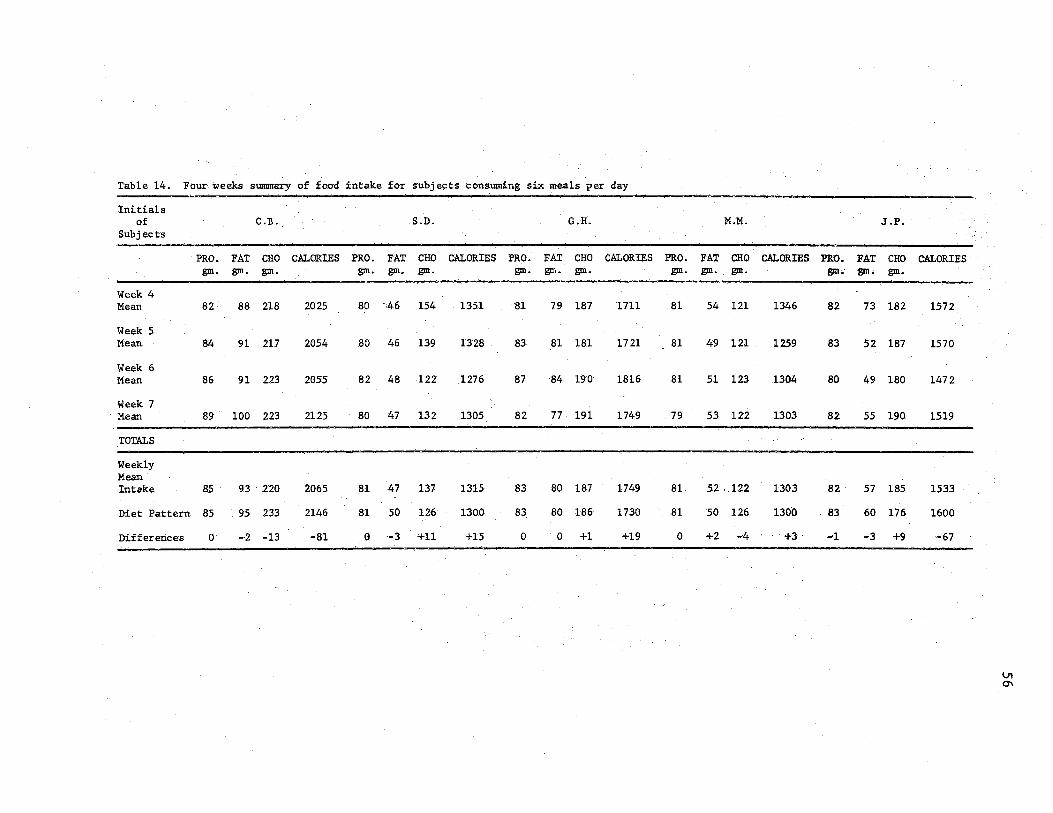
Table 14. Four· weeks summary of foo·d ·intake for subjects.-cons~ing .six meals per day
Initials of C.B. S.D. G.H.
Subjects
PRO •. FAT CHO CALORIES PRO. FAT CHO CALORIES PRO. FAT CHO CALORIES gm. gm. gm. gm. gm.. gm. gm. gm. gm.
Week 4 Mean 82 88 218 2025 80 '46 154 . 1351 81 . 79 187 1711
Week 5 ··Mean 84 91 217 2054 BO 46 139 1328 83 .. 81 181 1721
Week 6 ' Mean 86 91 2.23 2055 82 48 122 .1276 87 84 190 1816
Week 7 · Mean 89 100 223 2125 80 47 132 1305 82 77 191 1749
TOTALS -Weekly Mean In rake 85. 93 220 2065 · 81 47 137 1315 83 80 187 1749
Diet Pa:.ttern 85 9'5 233 2146 81 50 l.26 1300 83 80 186 1730
Differences 0 -2 -13 -81 0 -3 +11 +15 0 0 +1 +19
M;M.
PRO. FAT CHO CALORIES gm. gm •. gm.
81 54 121 1346.
.81 49 121. 1259 ..
81 51 123 .1304
79 53 122 1303
81 52 ,_122 1303.
81 50 126 1300
0 +2 -4 .· +3
PRO. FAX gm.- gm.
lJ2 73
83 52
80 49
82 55
82 · 57
. 83 60
-1 -3
J.P.
CHO gm.
182
187
180
190
185
176
+9
CALORIES
1572
1570
1472
1519
1533
1600
-67
v, O'\

CHAPrER V
SUMMARY ANp CONCLUSIONS
th-is study involved the f¢eding of a controlled diet to.five young
college women over a period of seven weeks. A preliminary peri9d of
one week proceeded the experimental study in which each subject ate
the diet to which she ·was accustomed, but kept a careful record of the
vi:i.riety and quantity of food consumed. After calculations of this week I s
food intake for each subject a dietary pattern was devised.
During the ·experimenta.l period each subject consumed 83 grams of
protein, 38 per cent of the total calories as·fat and sufficient carbo
hydrates to maintain body weight. To make it possible for the'Sie col..,
lege students to obtain food .from a campus cafeteria a series o~ ex
change lists were devised for their use.
The diet described above was ingested by the five subjects for a
three .. weeks I period. During this· period a weekly basal and energy
metabolic test was administrated.
In the following four··we~ks a diet of identical composition was
consumed by the five subjects but was spaced in intervals of six meals
. per day. Again basal and energy metaboli.c tests were administrated
weekly.
From the·results of these tests the following information was
·obtained:
1. Basal metabolic rates·of the subjects in which they consumed
57

three meals per day were considerably lower than the tests
made when six meals per day were ingested.
2. Respiration and pulse rate showed a considerable increase
during the period wh~n six spaced meals per day were eaten
in contrast to the three meals.
3. During a four-week period when six spaced meals were eaten
per day the deviations of basal metabolism from the normal
range appeared to be greatly lessened.
58
4. In the four-week period, during which meals were spaced six
per day, changes in rate of both basal and energy metabolism
were substantially increased. During the three-week three
meal period, there was practically no change.
5. Some indication, though small, was observed in relation to
weight loss of some of the subjects.
When one works with human subjects one encounters many factors
which complicate the adherence to a controlled diet. Basal and energy
metabolism studies are very time consuming for the researcher and the
subjects. They are meaningless unless carried out with great accuracy.
It would be highly desirable if the subjects could eat in a central
place so their diets could be prepared, weighed and served to them.
In lieu of recent articles there is evidence to indicate that
variety and quantity of carbohydrate may be an influencing factor in
basal metabolic rates as well as protein and fat.
The results of this study indicate the adjustment of basal meta
bolic rates which deviate considerably from the normal range may tend
to adjust themselves to normal when six meals per day are consumed.
This aspect of the study merits further research.

59
Although three to four~week feeding experiments with human beings
are suffic;i.ently long to bring about some change the author feels the
e~tension of time from .. six to eight weeks might reveal much more meaning
ful information.
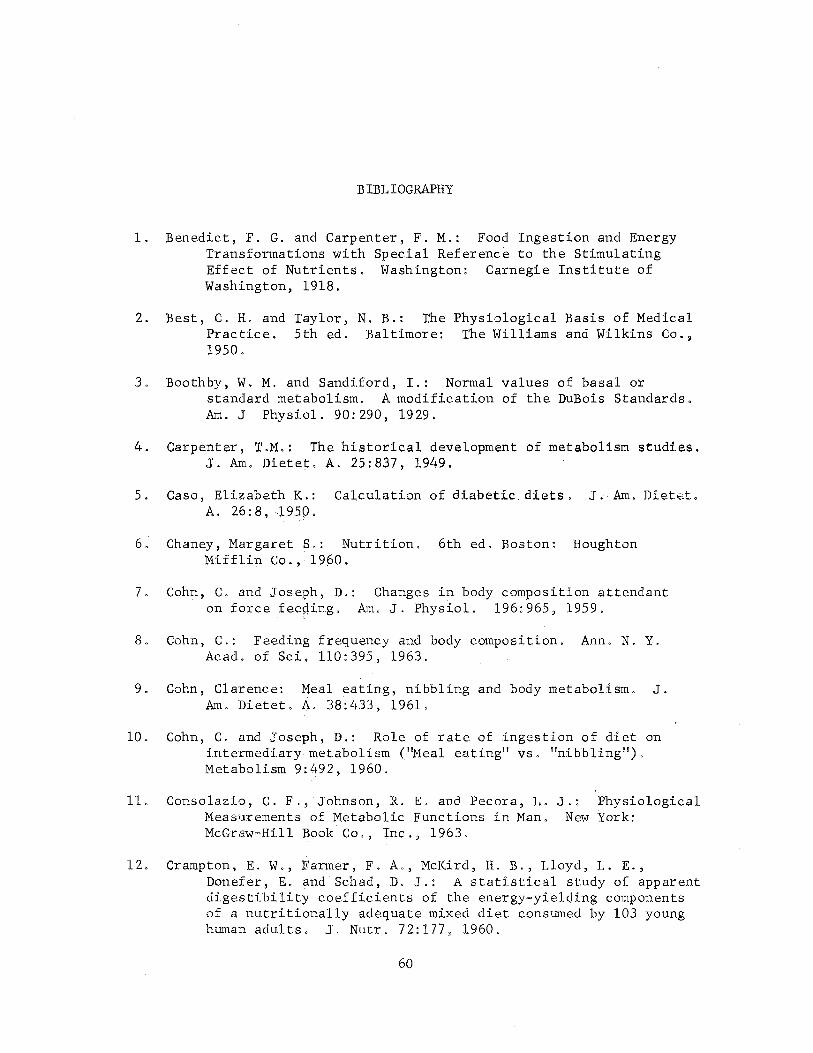
BIBLIOGRAPHY
1. Benedict, F. G. and Carpenter, F. M.: Food Ingestion and Energy Transformations with Spec.ial Reference to the Stimulating Effect of Nutrients. Washington: Carnegie Institute of Washington, 1918.
2. Best, C.H. and Taylor, N. B.: The Physiological Basis of Medical Practice. 5th ed. Baltimore: The Willi.ams and Wilkins Co., 1950.
3. Boothby, W. M. and Sandi.ford, I. : Normal values of basal or standard metabolism. A modification of the DuBois Standards. Am. J Physiol. 90:290, 1929.
4. Carpenter, T .M.: The historical development of metabolism studies. J. Am. DieteJ:. A. 25:837, 1949.
5. Caso, Elizabeth K.: Cdculation of diabetic. diets. J. Am. Dietet. A. 26:8, <L9~p.
6. Chaney, Margaret~.: Nutrition. 6th ed. Boston: Houghton Mifflin Co., 19p0.
7. Cohn, C. and JosE1ph, D.: Changes in body composition attendant on force feeping. Am. J. Physiol. 196: 965, 1959.
~ .
8. Cohn, C.: Feeding frequency and body composition. Ann. N. Y. Acad. of Sci., 110:395, 1963.
9. Cohn, Clarence: M:eal eating, nibbling and body metabolism. J. Am. Dietet. A,. 38:433, 1961.
10. Cohn, C. and Joseph, D.: Role of rate of ingestion of diet on intermediary metabolism (''Meal eating" vs. "nibbling"). Metabolism 9:492, 1960.
11. Consolazio, C. F., Johnson, R. E. and Pecora, L. J.: Physiological Measurements of Metabolic Functions in Man. New York: McGraw-Hill Book Co., Inc., 1963.
12. Crampton, E.W., Farmer, F. A., McKird, H.B., Lloyd, L. E., Donefer, E. and Schad, D. J.: A statistical study of apparent digestibility coefficients of the energy-yielding components of a nutritionally adequate mixed diet consumed by 103 young human adults. J. Nutr. 72:177, 1960.
60

61
13. Church, C. F. and Church, H. N.: Food Values of Portions Commonly Used. 9th ed. Philadelphia: J. B. Lippincott Co., 1963.
14. Daheln, W. V. and Saltin, B.: Diet and work metabolism. Nutr. Rev. 21:211, 1963.
15. DuBois, D. and DuBois, E. F.: Clinical cal. X. A formula to estimate the approximate surface area if height and weight are known. Arch. Int. Med. 17:863, 1915.
16. DuBois, E. F.: Basal Metabolism in Health and Disease. 3rd ed.
17.
Philadelphia: Lea and Febiger, 1936.
DuBois, D., and DuBois, E. F.: of the surface area of man.
Clinical cal. V. The measurement Arch. Inst. Med., 15:868, 1915.
18 . Durnin, J. V. G. A. and Brockway, J.M. : Determination of the total daily energy expenditure in man by indirect calorimetry: assessment of the accuracy of a modern technique. Brit. J. Nutr. 13:41, 1959.
19. Engel, R. W.: 1963 Recommended Dietary Allowances . J. Am. Dietet. A. 44: 91, 1964.
20. Fabry, P., Hejl, Z., Fodor, J., Braun, T. and Zvolankova, Kamila: The frequency of meals its relation to overweight, hypercholesterolaemia, and decreased glucose-tolerance. Lancet ii:614, 1964.
21. Fabry, P., Petrasek, R., Horakova, Eva, Konopasek, E. and Braun, T. : Energy metabolism and growth in rats adapted to intermittent starvation. Brit. J. Nutr. 17 : 295, 1963.
22 . Fleck, Henrietta and Munves, Elizabeth: Introduction to Nutrition, lst ed. New York : · The MacMillan Co., 1962.
23 . Glasser, 0., ed. Metabolism: Apparatus and Methods. Medical Physics. Chicago: Yearbook Puhl., Inc., 1944.
24 . Guyton, Arthur C.: Philadalphia:
Textbook of Medical Physiology. W. B. Saunders Co., 1956.
2d ed.
25. Grollman, Sigmund: The Human Body - Its Structure And Physiology. lst ed. New York: The MacMillan · Co., 1964.
26. Gwinup, G., Byron, R. C., Roush, W. H., Kruger, F . A. and Hamwi, G. J.: Effect of nibbling versus gorging on serum lipids in man. Am. J. Clin. Nutr. 13:209, 1963.
27. Hipsley, E. H.: The time factor in energy exchanges. Australian Institute of Anatomy. Food and Nutrition Notes and Reviews. 21:100 (Sept. and Oct.), 1964.
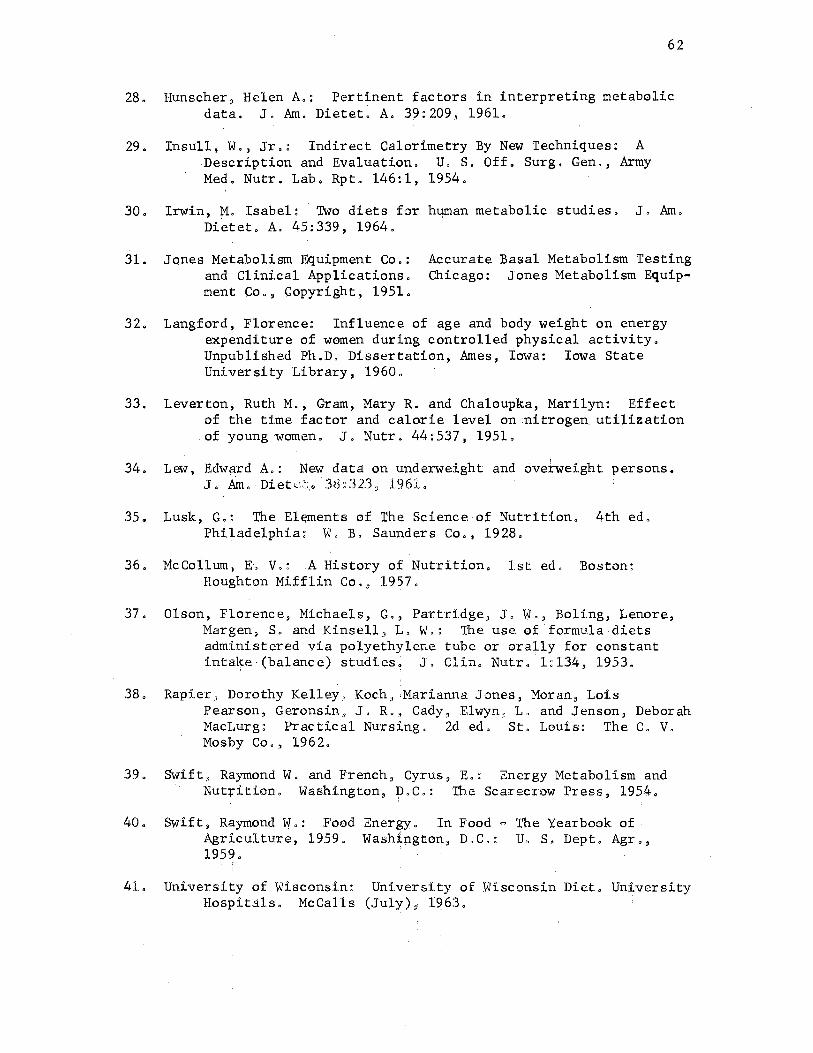
62
28. Hunscher, Helen A.: Pertinent factors in interpreting metabolic data. J. Am. Dietet~ A. 39:209, 1961.
29. Insull, W., Jr.: Indirect Calorimetry By New Techniques: A Description and Evaluation. U. S. Off. Surg. Gen., Army Med. Nutr. Lab. Rpt. 146:1, 1954.
30. Irwin, M. Isabel: Two diets for h~man metabolic studies. J. Am. Di~tet. A. 45:339, 1964.
31. Jones Metabolism. Equipment Co.: and Clinical Applications. ment Co., Copyright, 1951.
Accurate Basal Metabolism Testing Chicago: Jones Metabolism Equip-
32. Langford, Florence: Influence of age and body weight on energy expenditure of women during controlled physical activity. Unpublished Ph.D. Dissertation, Ames, Iowa: Iowa State University Library, 1960.
33. Leverton, Ruth M., Gram, Mary R. and Chaloupka, Marilyn: Effect of the time factor and calorie level on:nitrogen. utilization of young women. J. Nutr. 44:537, 1951.
34. Lew, Edw~rd A.: New data on underweight and ove~weight persons. J. Am. Dieti...i·::: .•. 38:323~ 1961.
35. Lusk, G.: The El~ents of The Science of Nutrition. 4th ed. Philadelphia: W. B. Saunders Co., 1928.
36. McCollum, E. V.: A History of Nutrition. 1st ed. Boston: Houghton Mifflin Co., 1957.
37. Olson, Florence, Michaels, G., Partridge, J. w., Boling, Lenore, Margen, S. and Kinsell, L. W.: The use of formula diets administered via polyethylene tube or orally for constant inta~e·(balance) studies~ J. Clin. Nutr, '1:134, 1953.
38. Rapier~ Dorothy Kelley, Koch, ,Marianna Jones, Moran, Lois Pearson, Geronsin, J. R., Cady, Elwyn, L. and Jenson, Deborah MacLurg: Practical Nursing. 2d ed. St. Louis: The C. V. Mosby Co., 1962. ·
39. Swift:;, Raymond W. and French, Cyrus"' E.: Energy Metabolism and · Nutrition. Washington, D.C.: The Scarecrow Press, 1954.
40. Swift, Raymond W.: Food Agriculture, 1959. 1959.
-~·
I
Energy. in Food= The Yearbook of· Washiµgton, D.C.: U. s. Dept. Agr.,
41. University of Wisconsin: University of Wisconsin Diet. University Hospitals. McCalls (July)~ 1Q63.

Al>J,>ENDICES
63

APPENDIX A
64

DAILY RECORD OF FOOD INTAKE
l~ Include all foods eaten.
2. Estimate ·size of serving and fractional part, if less than 1 serving is eaten. i.e. mashed potato - H; servings
65
3. Include all items added to servings of food such as gravy; salad dressing; butter or margarine on bread; icing or sauce on cake; whipped cream, or ice cream on pie; lettuce, oniop, tomato, mustard, catsup and such; cream or sugar in beverages; jam, jellies or marmalade; pickles, olives, nuts, candy, soft drinks, fruit garnishes, potato chips, cookies, crackers, ahd popcorn.
4. If sandwiches are eaten record number of slices of bread and kind and amount of filling. If mayonnaise or butter are used on bread estimate how much. ·
5. When pie is eaten estimate size of piece. i.e. 1/6 of a 10" diameter pie.
6. When cake is eaten indicate size by such means as: l" x 2\" x 2\". Also include plain, or kind of icing and butter or sponge cake.
7. If nuts are included in desserts or salads, indicate kind and approximate amount.
8. Select simple foods as often as possible to avoid complicated mixtures.
9. Indicate manner of preparation of meats and vegetables. i.e. fried, baked, smothered, creamed, with cheese and such.
10. Be sure to indicate kind of milk ingested. i.e. buttermilk, whole, skimmed, evaporated, dried.
11. Be sure to ipdicate kind of fruit eaten. i.e. fresh fruit, canned fruit (syrup pack or water pack).
12. ··· Please record all foods eaten for a period of 1 week (Monday through Sunday) and return the 7 days record on the following Monday so that calculations can be made immediately.
13. I would like to express my gratefulness to all of you for your willingness to give invaluable assistance, keen interest, and generous grants of time, for without your painstaking efforts this study would not be possible.
Mrs. Vella Marie Burns Phone No. FR2-1757
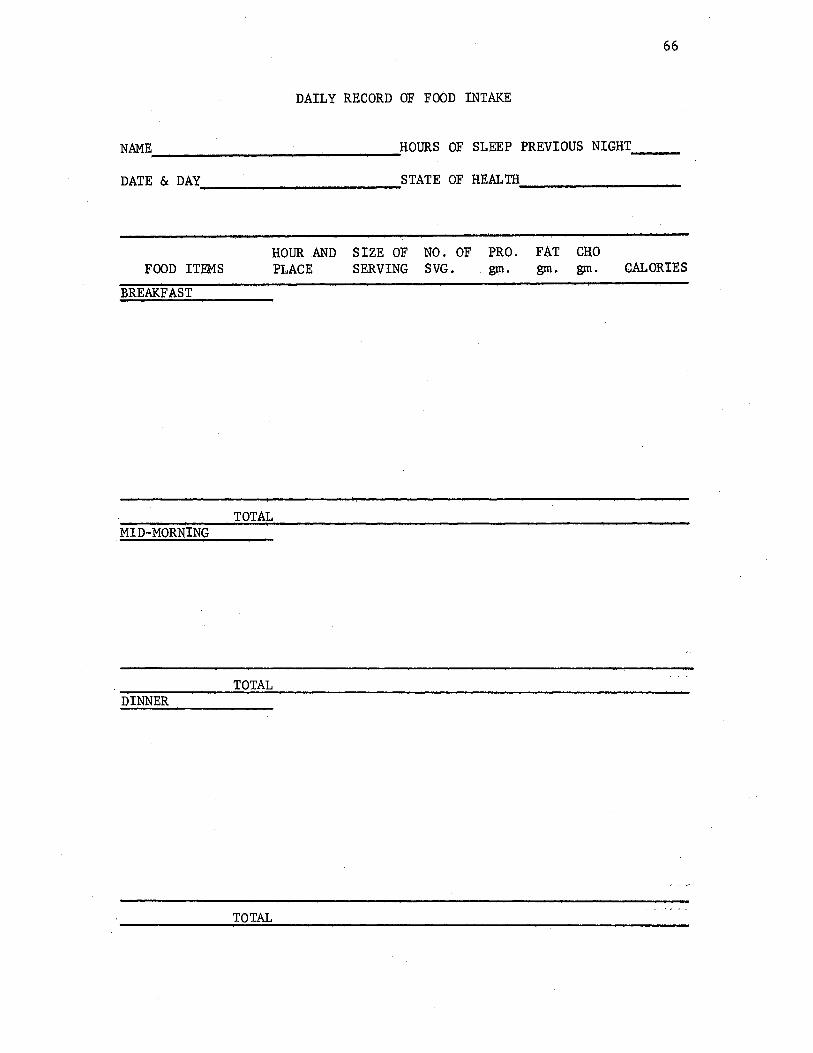
66
DAILY RECORD OF FOOD INTAKE
NAME. ______________ HOURS OF SLEEP PREVIOUS NIGHT __ _
DATE & DAY ___________ STATE OF HEALTH. ________ _
HOUR AND SIZE OF NO. OF PRO. FAT CHO FOOD ITEMS PLACE SERVING SVG. gm. gm. gm. CALORIES
BREAKFAST
TOTAL MID-MORNING
TOTAL DINNER
TOTAL
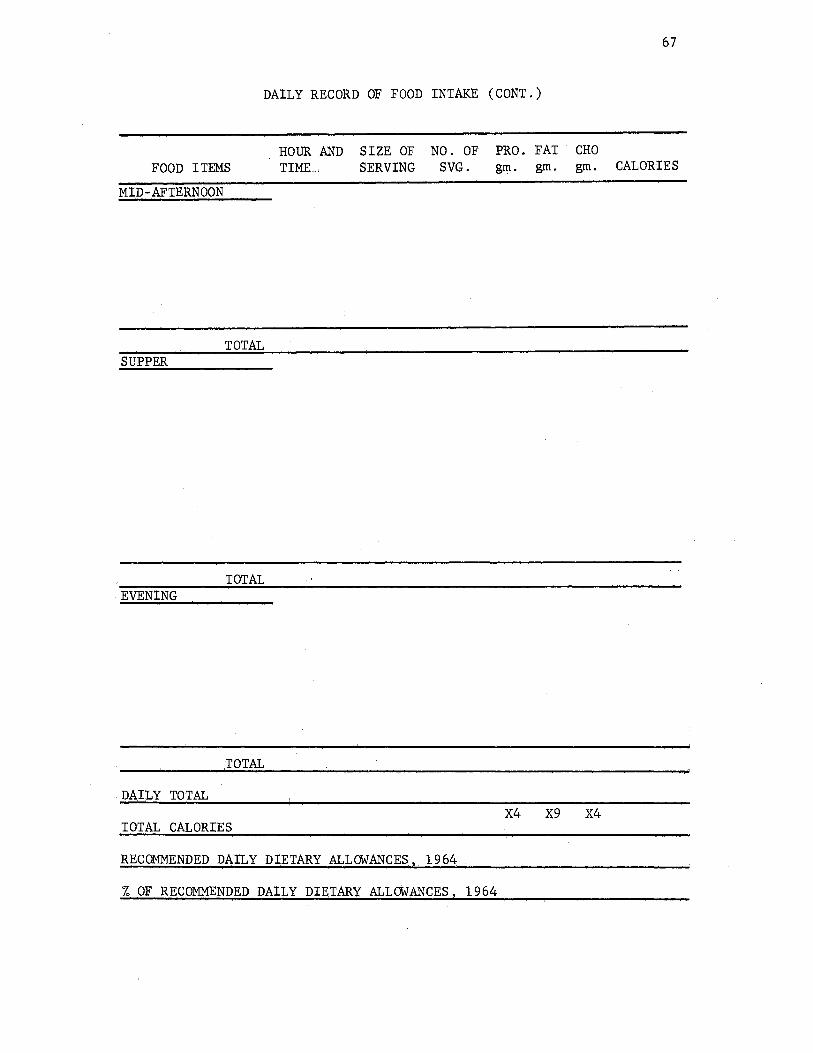
67
DAILY RECORD OF FOOD INTAKE (CONT.)
HOUR AND SIZE OF NO. OF PRO. FAT. CHO FOOD ITEMS TIME:, SERVING SVG. gm. gm. gm. CALORIES
MID-AFTERNOON
TOTAL SUPPER
TOTAL EVENING
.TOTAL
. DA.IL Y TOTAL X4 X9 X4
.TOTAL CALORIES
RECOMMENDED DAILY DIETARY ALLOWANCES, 1964 .
% OF RECOMMENDED DAI:I.. Y DIE,TARY ALLOWANCES, 196.4

68
New Recommended Allowances
Recomntonded Dietary Allowances, Revised 1963*-Food and Nutrition Board, National Academ,; of ScloncesNatlonal Research Council
Designed for the maintenance of good nutr-ition of practically all healthy persons in the United States (Allowances al'e intended for pel'sons normally active in a temperate climate.)
AGEi AND SEX
Men 18-35 ye~re 35,55 years 66-75 ycaro
Women 18-35 years 36-55 yeoro 55-75 year. Prr11nont (2nd
ilnd 3r<I trime11tcr)
Loctath111
lnhmh. up to 1 year1
Cl1ildrcn 1-3 year~ 3-0 yrurs ll·D yeun JIO)'S
0-12 years 12-15 ycor• 15-18 yearo
Girls D-12 ycao
12-16 yeuro · 16-18 yporo
WEIGHT
ko. (lb.)
70 UM) 70. (IM) 70 (164)
58 (128) 51! (121!) 58 (12'8)
8 (18)
1a < 29) 18 ( 40) 24 ( 53)
33 ( 72) 45 ( 98) 01 (134)
33 ( 72) 47 (103) 63 (117)
HEIGHT CA~ORIESI PROTEIN CALCIUM
cm, (in.)
1.75 (69) 175 (60) 175 (09)
163 (04) lli3 (04) 103 (04)
87 (34) 107 (42) 124 (40)
140 (56) 160 (01) 172 (08)
140 (55) 158 (02) 103 (04)
2900 2600 2200
2100 1000 UiOO
+ 200 HOOO
om.
70 70 70
58 58 58
+20 HO
ka. x 115 kg. x 2.6 .. 15 =0.5
1300 1000 2100
2400 3000 3400
2200 2500 2300
32 40 52
60 75 85
56 62 58
(}Iii,
0.8 0.8 0.8
O.jl 0.8 0.8
+o.s +o.5
0.7
0.8 0.8 0.8
I. I 1.4 1.4
I. I t. a 1.3
IRON
mu.
10 10 10
15 15 10
+ 5 + 5
k11. X 1.0
8 10 12
15 15 15
15 15 15
VITAMIN THIA. A MINE
J.U.
5000 5000 5000
5000 5000 5000.
+1000 +3000
1500
2000 2500 3500
4500 5000 5000
4500 5000 5000
mo.
1.2 1.0 0.9
0.8 0.8 0.8
+0.2 +0.4
0.4
0.5 0.6 0.8
1.0 1.2 I.~
0.0 1.0 o.u
--------------RIBO·
FLAVIN
1.7 I.II I.:!
1.3 1.2 1.2
+o.a +o.o
0.0
0.8 1.0 1.3
1.4 1.8 2.0
J .3 1.5 1.a
NIACIN ASCOR, VITA· EOUIYA· 81': MIN LENTS# ACID I>
mo.
10 17 15
14 13 13
+ 3 +1
0
D II 14
10 20 22
16 17 15
11if),
70 70 70
70 70 70
+30 +30
30
40 60 00
70 80 80
80 80 70
l.U,
400 400
400
400 400 400
400 400 400
400 400 400
•'l'hc allowo.1wt' lev,•le om intN1d<•d to rover individunl varlt1tione a111011a most normal pcrtiona H they Hva in the Un_itcd Stt4tn under UliU&I environ .. 111t"11tal •trv~uw1. The reroru111t•ndCd allowum·u can h<> uttniucd with a variety or commoo roodH, providina: other uutriu1118 Cor which human requirements huvc l>,,"•1 lc.•tta well d,·Om•d. St•,• rorth<'omlnJ. tt'xt for mar,~ dt!tailc-d discuaalon of o.llowu.1u!l'8 und or nutritmta not tu.bulut,.•d.
t1·:utrh111 on linm• for llK" r,rngl, 1~a6 y,•uu rc1>r,•11cnt the 26·yt•au llKt", AH othl•r cntri"a rcpn•1;,•nt ullowaur.t•e; for tho 111id·point of the apcciH~d OMO IH'riodtt, i.f•., l'hildl'('ll 1·:i- )'l'UfB ib for Ul(l'. 2 )'(•Ufli (:H months) i 3-0 )'f.'l\r6 is for llitl' 4 ti )'('UfH (6-& IIIOUthd) i und liO on.
S'l'ublo 1 and 2 uud 1-'hcurn 1 uud 2 in the rorOwo111i11g h•xl will sl1ow ,·u.loric udj~t111c11la for W('ight and U6(r. ISiudu ,;11uivuh•11hd1lf'lud1• di,·tnry liourc-t•H or tl1P pr,·loruu·d ,·itnmin nud the prC'rursor, try1)toplu1-1 (00 lllK· trya,toplurn rc•1uct1it•ut 1 n1M,. uinriu). ,-rlw rulurir und 11rot1•in 11lluwn111·,1tt 1wr kilo1emm for iufuuh urc 1•om1id,•red lo d,•,·rellHC progr<•t1iaiv,·ly from Uir1h. Allowam·,·" for culcium, thhuuine,
ril,lflu\•iu, irnd ullu·in ilwrt•u,u· pro11urti'unllh•I)• with <'1tluriu to thl' uuuimuiu vuluc.·s Hhown.

APPENDIX B
69

70
NAME OF PERSON CHERYL BITTLE WEEKS l, 2, & 3
DIET - PRO. (GM} 85 FAT(GM} 95 CHO(GM} 251 CALORIES 2211
DIET PATTERN
KINDS OF EXCHANGES NO. OF EXCH. PROTEIN FAT CHO CALORIES BREAKFAST (gm.} (gm.} (gm.}
Fruit Ex_change 1\ 15 60
t,ieat Exchange 1 7 5 75
Bread Exchange 1- 2 15 70
Fat Exchange 2 10 · 90
M:Uk Exchange 1 whole 8 10 12 170
Other Foods Jelli 2 TbSQ, 26 100
TOTAL 17 25 68 565
DINNER
t,ieat Exchange1;1 3 21 15 -- 225
11A11 Vegetable Exch. ANY AMOUNT
Fruit Exchanges 2\ 25 100
Bread Exchanges 1 2 15 70
Fat Exchanges 1 5 45
Milk Exchanges 1 whole 8 10 12 170
Other Foods Jelli 2 TbsE. 26 100
TOTAL 31 30 78 710
SUPPER
Meat Exchanges 3 21 15 225
"A" Vegetable Exch. ANY AMOUNT
''B" Vegetable Exch. 1 2 7 35
Fruit Exchanges 2~ 25 100
Bread Exchanges 1 2 15 70.
Fat Exchanges 1 5 45
l1ilk Exchanges 1 whole § 10 12 J.ZO Other Foods Cake 1 3.8 9.9 46.4 291
TOTAL 36.8 39.9 105.4 936 . TOTALS FOR THE DAY 85 95 251 22U

71
NAI-lE OF l?ERSON SHERRY.DAVISON WEEKS l 1 21 & 3
.DIET - PRO •. (GM) 81 . FAT(G1) 50 CHO(GM) 123 CALORIES 1285 ·
DIET. PATTERN
KINDS OF EXCHANGES NO. OF EXCH. PROTEIN FAT CHO CALORIES BREAKFAST (gm.) (gm.) (gm.)
Fruit·Exchange 1~ 15 60
Meat Excha11;ge 1 z 5 -- 25 Bread Exchange. J 2 .. -- 15 zo Fat Exchange 1. -.. 5 45
MHk Excha.nge 1 skim ··8 -- -12 80
Other Foods NONE .... TOTAL 17 10 42 330
·DINNER
Meat Exchanges ~ 21 15 225
"A" Vegetable Exch. ANY AMOUNT
.. Fruit· Exchan.ges l 10 40 ..
Br.ead Exchanges·. 1 2 15 70
Fat Exchanges .. 1 -· 5 45
-Milk Exchanges 1 skim·· 8 12 80 . .
Other Foods. NONE --· --TOTAL 31 20 37 460 ·
.. SUJ:>PER ,
Meat Exchal}ges . 3 2f 15 ·- 225
i 1A.11 Vegetable Exch •. ANY AMOUNT · nB" Vegetable Exch. l 2 -- 7 35
Fruit Exchanges.· 1 _ ... 10 4()
Bread Exchanges 1 2 ... -9!1'· 15 70
Fat Exchanges. 1 5 45
Milk Exchap.ges 1 skim 8 .. - 12 80
Other Foods NON;E -.... -· _.., ·TOTAL 33 20 44 495
.TOTALS FOR THE DAY 81 50 123 1285
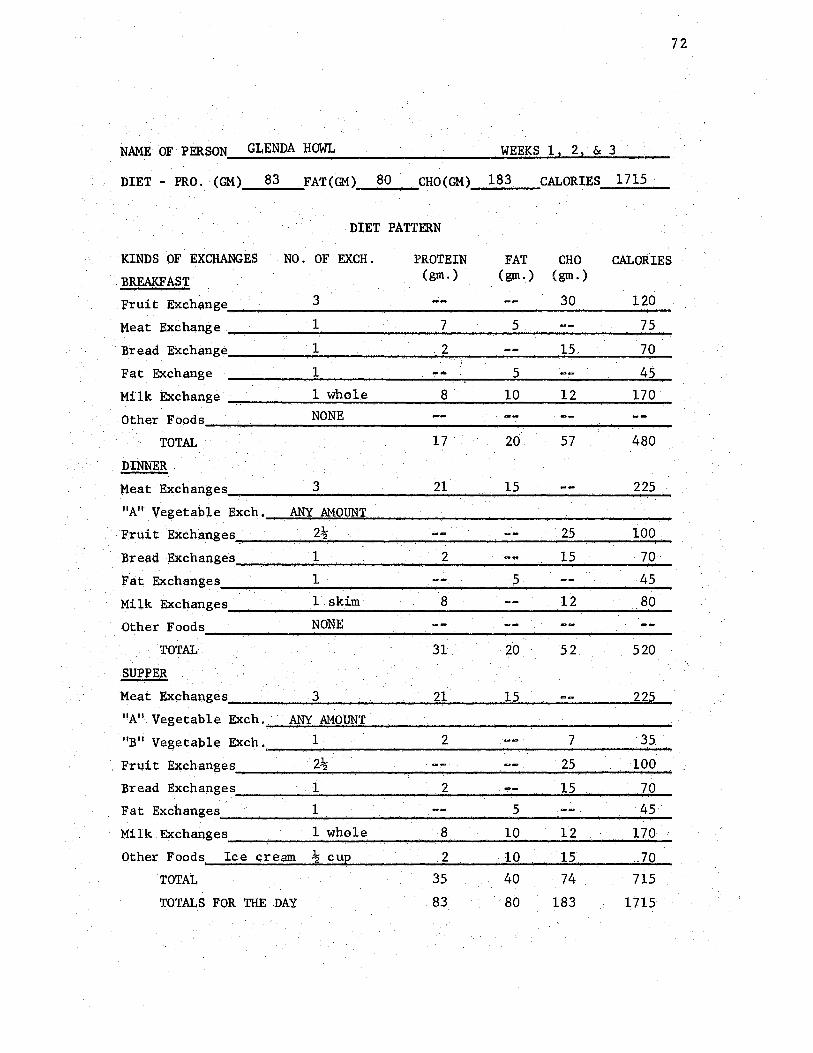
72
NAME OF· PERSON GLENDA HOWL WEEKS 11 21 & 3
DIET - PRO. (GM) 83 FAT(GM) 80 CHO(GM) 183 CALORIES 1715
DIET PATTERN
KINDS OF EXCHANGES NO. OF EXCH. PROTEIN FAT CHO CALORIES BREAKFAST (gm.) (gm.) (gm.)
Fruit Exchange 3 30 120
Meat Exchange 1 7 5 75
Bread Exchange 1 .2 15. 70
Fat Exchange 1 -· I 5 45
Milk Exchange 1 whole 8 10 12 170
Other Foods NONE
TOTAL 17 20 57 480
DINNER
tteat·Exchanges 3 21 15 225
11A11 Vegetable Exch. ANY AMOUNT
Fruit·Exchanges 2\ 25 100
13read Exchanges 1 2 -.. 15 70
'.Fat Exchanges 1 5 45
Milk Exchanges 1 skim 8 12 80 ..
Other foods NONE
TOTAL 31 20 52 520
SUPPER
· Meat Exchanges 3 21 15 225
"A11 Vegetable Exch. ANY AMOUNT
"13" Vegetable Exch. 1 2 -- 7 35
Fruit Exchanges 2\ .... _ 25 100
Bread Exchanges 1 2 15 70
Fat Exchanges 1 5 45
Milk Exchanges 1 whole 8 10 12 170
Other Foods Ice cream \ cue 2 10 15 .. 70
TOTAL 35 40 74 715
TOTALS FOR THE DAY 83 80 183 1715

73.
NAME.OF :PERSON . MARGARET.ANN MORGAN . WEEKS 1 1 . 2 1 & 3 .
DIET ~ PRO; (~) 81 FAT(GM)_s;;,.,;;"o_· - ..... ·. CHO(aM) 133 CALORIES 1325 ·
DIET PATTERN
KINDS OF ··EXCHANGES NO. OF EXCH. PROTEIN FAT CJIO CALORIES BllEAKFAS! (gm.) (gm.) (gm.)
Fruit Exchange 1 -- -- 10 40.
·Meat E~change 1 7 5 75
Bread Exchange 1 2 l!i zo Fat Exchange 1
" .. - 5 45
Milk Exchange· 1 skim. 8 12 80
Other.Foods NONE --TO!AL 17 10 37 310
PINNER · Meat E:i<changes. .3 21 15 -- 225
i'A" Vegetable Exch. ANY AMOUNT Fruit·Exchanges 1 -- 10 40
Bread Exchanges 1 2 _._. 15 70 ·
Fat Exchanges 1 5 --. 45 "
". . .
Milk . . .
1 skim 8 12 80 Exchanges ...... Other Foods .. NONE ·-
·. TO!Al. 31 20 37 460
SUPPER,.
Meat Exchanges 3. 21 15 225
. ."A" Vegetable Exch. ANY·AMOUNT ''Bu Vegetable Exch. 1 2 -- 7 35.
·. 21., Fruit Exchanges ,.. ... 25 100 2
Bread. Exchanges 1 2 " -- 15 70
;Fat Exchanges. 1 5. 45
Milk Exchanges 1 skim 8 12 80
Other Foods NONE .... -- -~-TOTAL 33 20 59 '5.55
. · TOl'ALS FOR THE DAY ' 81 50 .133 1325

74
NAME OF PERSON JOYCE PHILLIPS WEEKSl, 2, & 3
DIET - PRO. (GM) 83 FAT(GM) 60 CHO(GM) ........ 16 __ 8 ____ CALORIES 1565
DIET :PATTERN·
KINDS OF EXCHANGES NO. OF EXCH. PROTEIN FAT CHO. CALORIES .BREAKFAST (gm.) (gm.) (gm.)
., . .,_
Fruit Exchange l~ 15 60
Meat.·Exchange 1 7 5 75
Bread Exchan.ge 2 4 . -- 30 140
fat Exchange 1 5 45
Milk Exchange 1 skim 8 12 80
Other Food$ NONE
TOTAL 19 10 57 400
DINNER
Meat Exchanges 3 21 15 225
"A" Vegetable Exch. ANY AMOUNT
Fruit Exchanges 2~ 25 100 '
:Breiad Exchanges· 1 2 15 70
Fat E.xchanges 1 5 -- 45
Milk Excllan.ges 1 skim .. 8 .1.2 80
Other Foods. NONE ~.,.
TOTAL 31 20 52 520
SUPl'ER
Meat Exchanges 3 21 15 225
"A'' Vegetable Exch. ANY AMOUNT
''B" Vegetable Exch. 1 2 7 35
Fruit Exchanges 2\ .. -- -- 25. 100
:13:read Exchanges 1 2 15 70
Fat Exchanges 1 5 . .,.. ... 45
Milk Exchanges .. l whole 8 10 12 170
Other Foods NONE --..
TOTAL 33 30 59 645
TOTALS FOR THE DAY 83 '60 168 1565
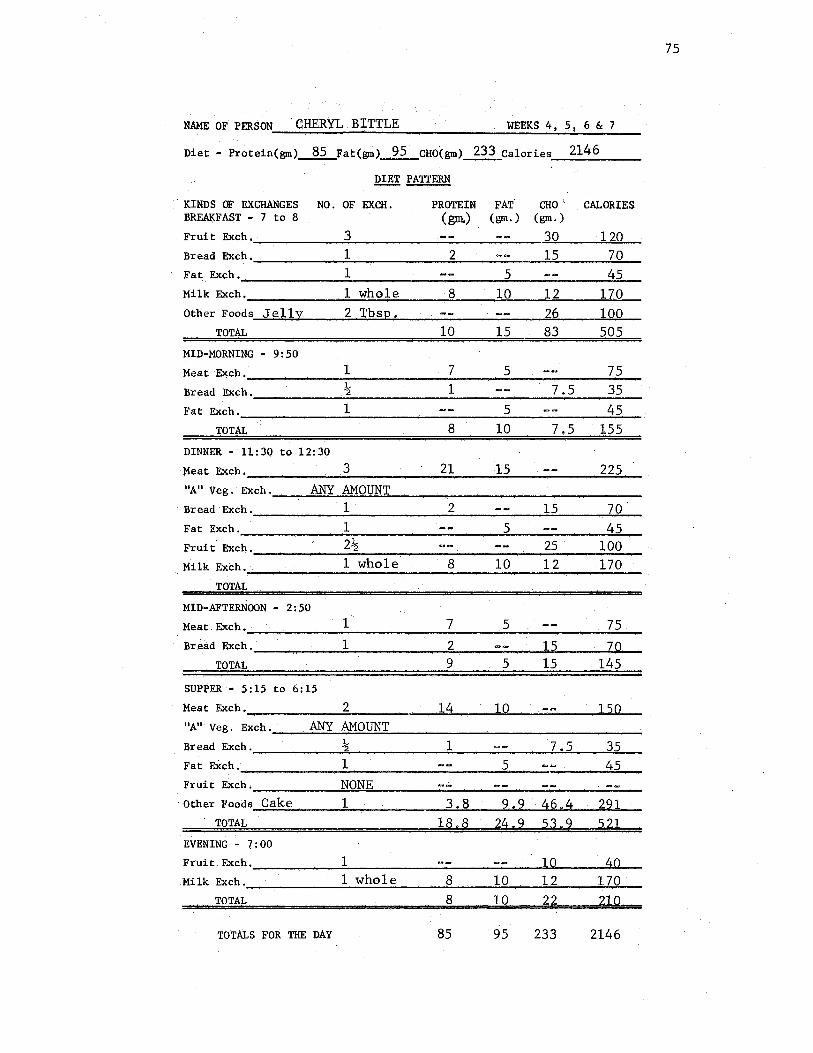
75
NAME OF PERSON CHERYL BITTLE WEEKS 4, 5, 6 & 7
Diet - Protein(gm) __ §.;2 _ _Fat(gm)_.21._cHO(gm)~Calories 2146
.!2!fil PATTERN
KINDS OF EXCHANGES NO. OF EXCH. PROTEIN FAT CHO', CALORIES BR~FAST - 7 to 8 (gm.) (gm.) (gm.) Fruit Exch . ______ 3 ______________ 3'""'0 ____ __.l...,2=0---
Bread Exch • ________ 1 ________ 2 ______ 1 __ 5 _____ 7 ...... 0.....-
Fat Exch. 1 5 45 ----------------------~----------------Milk Exch . ________ l_w_h_o_l_e ___ . __ 8 ____ 1 __ 0 ___ 1..,2 ______ 1~7 ...... 0 ___
Other Foods___,_J ...... e __ l __ l __ y ___ 2 ___ T ___ b __ s_._p ....... _________ _.2=6 ____ ___.l,..,0_.0...__
TOTAL 10 15 83 505
MID-MORNING· 9:50 Meat Exch. _______ 1 ________ 7 ____ 5 __ .,...... ____ 7_5_
Bread Exch. \ 1 7 .5 35 ----------------------------------------Fat Exch. 1 5 45 -----------------------------------------TOTAL 8 10 7 • 5 15 5
DINNER - 11:30 to 12:30 Meat Exch ·-----------"-3 __________ 2_1 ______ 1_5 ________ 2""'2_5 __
"A" Veg. Exch . ___ ...;ANY=-c=--..;AM=O"'-UN=-=T=----------------------Bread Exch . ______ 1 _______ ..c.2 _______ __..:;l;;;:5 ____ 7""'0'---
Fat Exch. 1 5 45 ---------------------...--------------...... --Fruit Exch. 2\ 25 . 100 ------------------------------------Milk Exch. lwbole 8 10 12 170 -----------------------------------------TO TA L
MID-AFTERNOON - 2:50 Meat Exch ·---------'----1 ________ 7 __ ---_5 ____________ 7_5_
Bread Exch . _________ 1---_______ 2'------------=1""5-'--__ ..._7...,.0'---TOTAL 9 5 15 145
SUPPER - 5:15 to 6:15
Meat Exch ·----------2 _____ ~ _ __..1..._4__,,_--=1=0----------] ...,5...,0_ "A" Veg. Exch . ____ AN_Y~._AM_O __ UN"-=T.a---------------------Bread Exch . ______ __..\ _________ 1 ______ __,7_ • ..,_5 __ =3..:.5_
Fat Exch. _________ 1 _____________ __..5~--'-·-----4~. 5;..;..._
Fruit Exch, _______ -""'N~O=N=E---------p----------------~ Other Foods_C_a_k-e ___ =l----~--=3.._. __ 8....,..._.,._9= • .,.,9_ ..... 4...:6 ...... _.4_--==2=9 .... l_
TOTAL 18 • 8 24 • 9 5 3 • 9 5 21 EVENING - 7: 00
Fruit Exch.-'-----~---=-1 __________ -_~ ______ ......,l~0----~4~0-. __ Milk Exch . ______ 1_· _w_h_o-'-l--'-'-e ____ ;;:.8 __ -=l.;:..0 ______ .::.1.::2 ___ -=1.:..,7""'0_._
TOTAL 8 10 22 210
TOTALS FOR THE DAY 85 95 233 2146
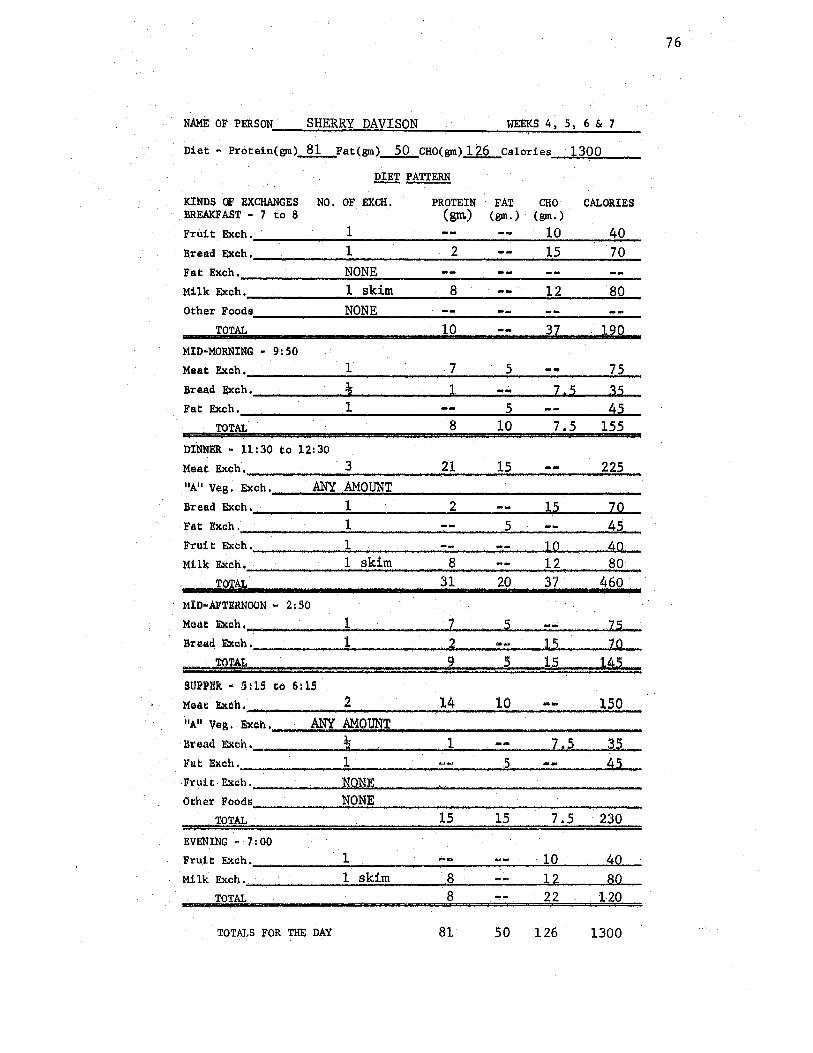
76
NAME OF PERSON SHERRY DAVISON WEEKS 4, 5, 6 & 7
Diet; - Protein(gm) 81 . Fat(gm) 50. CHO(gm) 126 Calories ~ . ~~. ~~
· 1300
fil! PATTERN
KINDS OF EXCHANGES NO. OF EXCH. PROTEIN FAT CHO CALORIES BREAJ,<FAST • 7 to 8 (gm.) (gm.) (gm.)
. Fruit Exch. 1 10 40 Bread Exch. 1 2 15 70 Fat Exch. NONE Milk Exch. 1 skim 8 12 80 Other Foods NONE
TOTAL 10 37 1~~ MID-MORNING· 9:50
Meat Exch. 1 7 5 75 Bread Exch. ~ l, Z,5 35 Fat Exch. 1 5 4,2
TOTAL 8 10 7.5 155
DINNER - 11:30 to 12:30
Meat Exch. 3 21 15 225 11A11 Veg. Exch. ANY AMOUNT Bread Exch. 1 2 1.2 ZQ
· Fat; Exch. 1 5 45 fruit Exch. 1 lQ aa Mil.k Exch. 1 skim 8 12 80
TOTAL 31 .. 20 ';,7 460 MID•AFTERNOON .. 2:50 Meat E:xch, 1 7 5 ---~ z.s :Bread Exch , 1 2 l~ ZQ
TOTAL 9 5 15 1~~ SUPPER• 5:15 to 6:lS Meat Exch. 2 14 10 150 IIA" Veg. Exch. ANY AMOUNT Buad Exch._ ~ 1 7.5 3,2 Fat Exch. 1 .5 ... .. S:5 Fruit Exch. liQliE Other Foods NONE
TOTAL 15 15 7.5 230 EVENING - 7:00 Fruit Exch. 1 10 4Q Milk Exch. 1 skim 8 12 8Q
TOTAL 8 22 120
TOTALS FOR THE DAY 81 50 126 1300

77
NAME OF PERSON GLENDA HOWL WEEKS 4, 5, 6 & 7
Diet: ,. Pro1:ein(gm).,..§LFat(gm).....§..Q__cHO(gm)-1.§&_Calories ·1730
filfil PATTERN
KINDS OF EXCHANGES NO. OF EXCH. PROTEIN FAT CHO CALORIES BREAl{.FAST .. 7 to 8 (gm.) (gm.) (gm.)
Fruit Exch. 3 30 120 Bread Exch. 1 2 15 zo Fat Exch. NOlil:; Milk Exch. 1 whole 8 10 12 170 Other Foods NONE ,' --
TOTAL 10 10 57 360
MID•MORNING • 9:50
Meat Exch. 1 7 5 .. ... 75 Bread Exch. !ti 1 Z1S J5 Fat: Exch. 1 ~ ~5
TOTAL 8 10 z.~ .~~ DINNER· ll:30 to 12: 30
Meat Exch. 3 21 l;i 22~ uA" yeg. Exch. ANY AMOUNT Bread Exch. 1 2 1.5 zo Fat Exch. 1 ..... 5 ~5 Fruit Exch. 2i 25 lQO M:!.lk Exch. 1 s_k:i,m 8 ... 12 80
TOTAL ... 31 20 52 520 MID•AFTERNOON .. 2:50
Meat Exch. 1 7 5 25 B:read Exch •.. l 2 15 zo
.TOTAL 9 5 15 145
SUPPER .. 5:15 to 6:lS Meat Exch. 2 14 10 150 "A" Veg. Ex.ch. ANY AMOUNT :Bread Exch. ~ 1 ..~ Zt2 J.2 Fat Exch. 1 .2 ~5 Fruit Exch. 1 -- 10 40 Other Foods Ice Cream \ CU)2 2 lO J. 5 ZQ
TOTAL 17 25 32.5 340 EVENING - 7:00
Fruit Exch •. 1 10 40 Milk Exch. 1 whole 8 10 12 170
TOTAL 8 10 22 210
TOTALS FOR.THE DAY 83 80 186 1730
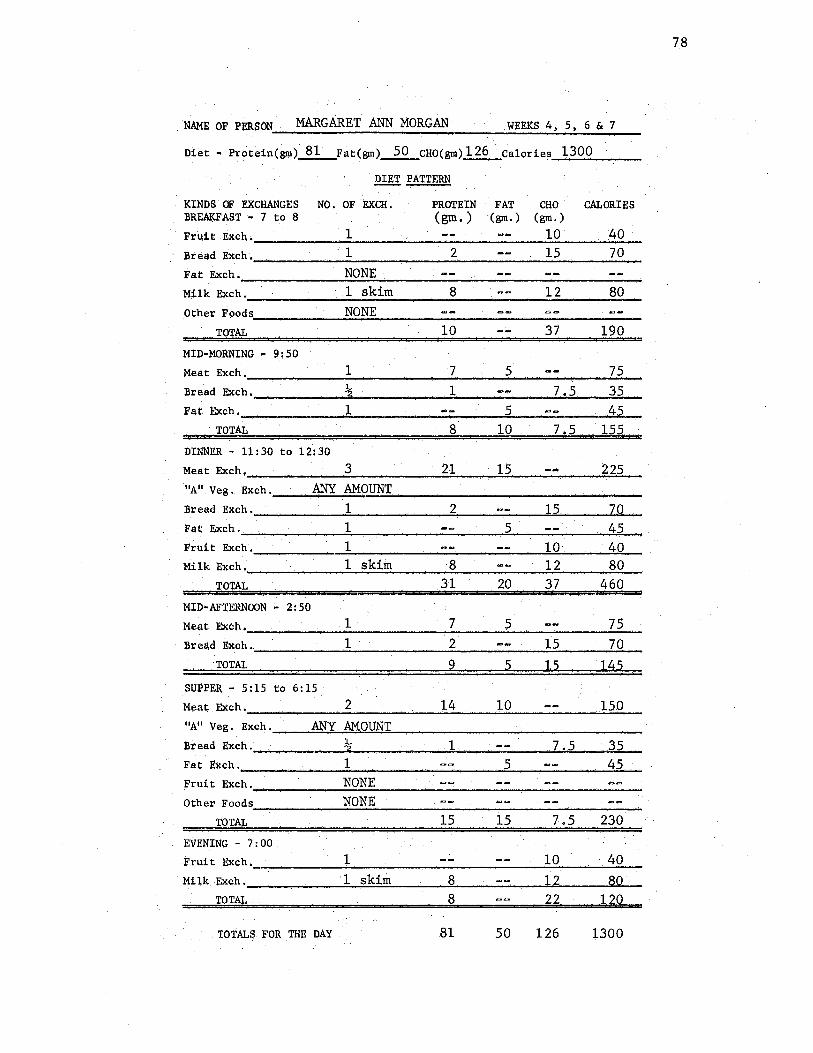
78
. NAME OF PERSON MARGARET ANN MORGAN· .WEEKS 4, 5, 6 & 7 ..
:Qiet. "' Prc;,tein(gm)J!l._Fat(gm)~CHO(gm).!1§._calories 1300
!WIT, PATTERN
KINDS OF EXCHANGES NO. OF EXCH •. PROTEIN FAT CHO CALORIES BREAl<FAST - 7 to.8 (gm.) (gm.) (gm.)
Fruit Exch. 1 -- -- 10 40 '.Bread Exch • ·1 2 15 70
. . Fat Exch. NONE --Milk Exch. 1 skim 8 12 80 .Other Foods NONE
TOTAL 10 37 190 MID-MORNING .. !>_:50
Meat Exch. 1 7 5 75 Bread Exch. \ 1 -- 7.5 35 Fat Exch. 1 5 ~2
TOTAL 8 10 7.5 15~. DINNER - 11:30 to 12:30
.Meat Eltch, 3 21 15 225 11Au Veg,. Exch. ANY AMOUNT .. B:r ead Exch • 1 2 15 ZO·. Fat; Exch. 1 5 45 fruit Eltch. 1 10 .40. Milk Exch; 1 skim 8 12 80
TOTAL 31 20 37 460 MID-AFTERNOON - 2:50
Meat Exch. i 7 5 75 ..
Brea.cl Exch. 1 2 is 70 ·TOTAL 2 5 15 ·i~s
SUPPER.· 5:15 to 6: 15
Meat; Exch •. 2 ~4 _10 150 ilAII Veg. Exch. ANY AMOUNT B:i:ead Exch. · 1 1 . 7.5 · 35 . Fat Exch •.. ·J. 5 ... _
····- 45 Fru:/.1: Exch. NONE : ca~ c:aa.
Other Foods NONE . --. TOTAL 15 15 7.5 230
J!:VENING .. 7:00
Fruit Eltch. 1 10 40 Milk. Exch. 1 skim. 8 12 BQ
TOTAL. 8 22 120
TOTALS FOi THE DAY. 81 50 126 1300
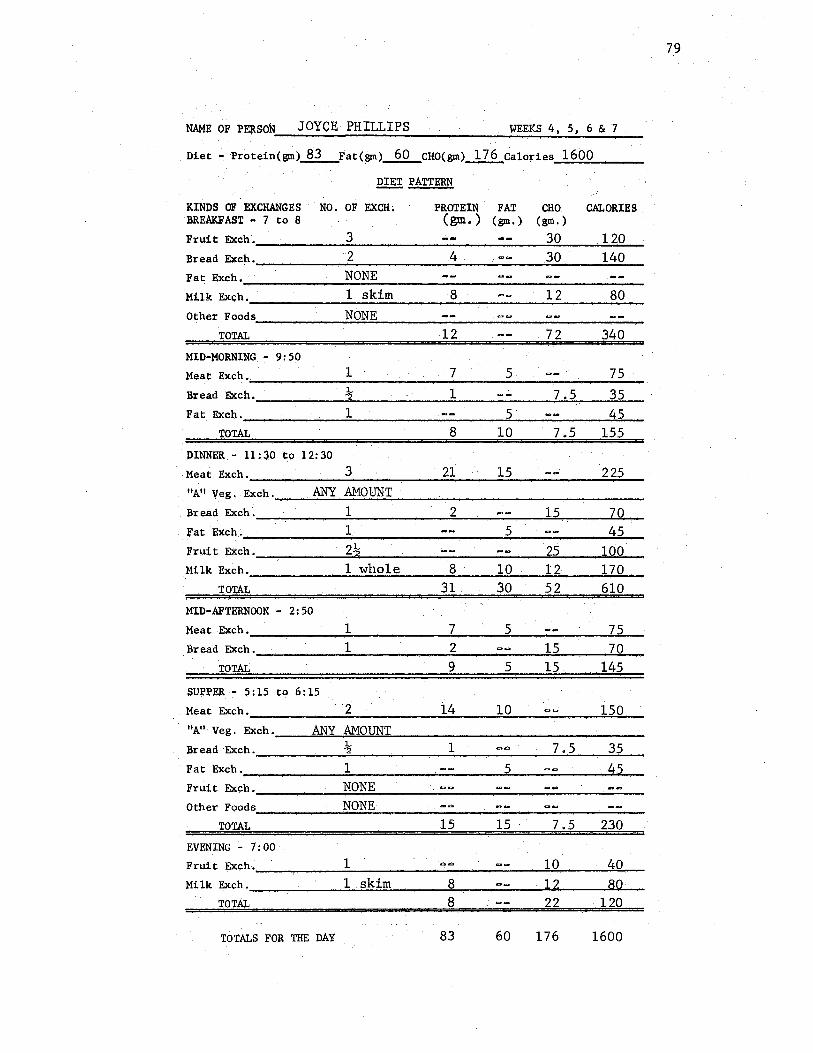
NAME OF PER.Sot{ JOYCE PHILLIPS WEEKS 4, 5, 6 & 7 .
Diet .:. Protein(gm) 83. Fat(gm) 60 CHO(gm) 176 Calories 1600 ' ' ~. --..-· - . ------
Q!fil'. PATTERN
KINDS OJi' EXCHANGES ·. NO. OF EXCH; "BREAl,<FAST • 7 to 8
PROTEIN FAT CHO. (gm.) (gm,) (gm.)
CALORIES
Fruit Exch. ______ 3 ______ -_ ... ___________ 3_0.....__...;· 1_2_0 ___
Bread ExcJ;i. ____ --··_2 ______ 4'----------~30 ___ ___;1;:.4.;.;0;;.....-
Fat Exch. ________ N_O_N_E ________ .. _. ---------------Milk Exc:;h. ______ l_s_k_i_m _____ 8 ______ 1_2 ____ 8_0_
Other Food.s ______ N_O ... N_E __________________ --.....
TOTAL 12 72 340
MID-MORNING.~ 9;5p Meat Exch • ....._...,... ____ 1 ______ . .,..7 ___ 5_. ----------7_5_ . ...,.·
Bread Excl). ___ ----__ \....._ ______ 1=------------7.:-;.• 5..,.._...;3:.:5_._ Fat Exch. ________ 1 ____________ ...;5 _________ ~4£5 __
TOTAL 8 10 7 .5 155
DINNER - 11:30 to 12:30
-Meat Exch'. 3 · 21 15 225 ---------------------------------------. ''A'' Veg. Exch • ______ AN_,_Y--AM __ O .. UN....;...;;;T ....... _-"' _________ ...,... __ _,.._
Bread Exch • ______ 1;;....· ,....· ------=2:..... ____ ,.. _____ l:.5~--_,7...,.0......_
Fat Exch ·---------1 .... · -------· -_____ 5 _______ ..._ ... 4 .... 5__, :Fru:l.t Exch._....,.,.. ___ ..,....._2_~ .... _____ ... _ .. _ . .__ _____ ,_25..._ _ _,,..1-0....,0_,
Milk Exch .• _____ ~1-w .... h .... o--1-e.----"'8---1_0..__._l:.::::2:..,· ___ 1::..7._.0_._
TOTAL 31. 30 52 610
MID-AFTERNOON .. 2:50 Meat Exch._· _______ ._1 ________ 7 __ ..,....5 _______ · ...... 7,..5_
Bread Exch . ________ 1 _______ ..... 2 __________ 1=5--_,...__._.7 ..... 0--.....
TOTAL 9 5 15 . 145
SUPPER_·· 5:15 tq 6:15 . Meat Exch. _______ 2_· ______ i4 ___ 1_0 _____ -_______ l....,5 __ 0_
"A"· Veg. Exch • ____ AN___.Y.....,.AM....,.O...,.lJN......,T ________________ __,. _ _,.._ Bread Exch. ________ \ ____________ 1 __________ 7_._5 ____ 3 __ 5_
· Fat Exch . ________ ..... 1 _____________ -=5 ________ _.4...,.5..,._
Fruit Exch • __ . ______ N-0 .... N .... E ____ . .,.. .. _ .. ____________ . ---------Other Foods _________ N_O_N_E_· -----·· _-_ .. ______ ........, _________ _
TOTAL 15 15 7.5 230
EVENING - 7:00
Fruit Ex¢h·------"""1--------------l;;:.;0;:;,...... ___ 4 .... 0....-Milk Exch. . _______ l ___ s""k;.;;;i:;;;;m,_· ......,_,......8""-_______ -_.1 ... 2 ... · __ ..,.......__..8,..0 .... ·-
TOTAL 8 -- . 22 120
TOTALS FOR THE DAY 83 60 176 1600
79

APPENDIX C
80

FOOD EXCHANGE LISTS
MILK EXCHA~'GES~(lc,....-_On~,•chaogool milk cor••~tl~ 9ram1 Coi~Jt , • .,.. ~" ~:.n;~••••1hram1Prol•ln, I09rom1fotaofl70(o.l~
Milk i1 one of our most important foods. You can use the milk on your meal plan to drink, in colfee, on cereal, or with other foods.
This list 1how1 the different types of milk to use for one exchange:
Type of Milk Amount to Use Whole milk (plain or homogenized). . . . . . . . . 1 cup
• Skim milk . . . . . . . . . . . . . . . . . . . . . . . . . 1 cup Evaporated milk . . ................... , . Y2 cup Powdered whole milk . . . . . . . . . . . . . . . . Y.. cup
• Powdered skim milk (Mon-fat dried milk) ..... V, cup Buttermilk (made from whole milk). . . . . 1 cup
* Buttermilk (made from skim milk). . . . . . . . . . 1 cup Yo11 can 11se one type of milk instead of another. For
example, you may use one-half cup evaporated milk in place of one c11p of whole milk.
All vegetables contain sugar but some have more 1ugar than o~era. The vegetables have been divided into three groups according to the amount of sugar they have:
List 2A vegetable.s have the smallest amount of sugar, List 2B vegetables contain more sugar. List • (see page 11) contains som\} vegetables which have
a large amount of sugar.
VEGETABLE EXC:HAMGES A (Contain little Carbohydrate, Protein, or Calories)
You may eat as much of these vegetables raw as you wish, except tomatoes. (Limit tomatoes to one tomato or \lz cup tomato juice at a meal), If these vegetables are cooked, you can use as much as on, cup at a time. When you want more, you can use another cup of these vegetables in exchange for a list 2B vegetable,
A1parogu1 • Broccoli
Brussels Sprauh Cabbage Cauliflower Celery
• Chicory Cucumben
• Escarole Eggplant
• GREENS Beet Green. Chard Collard D.andelian Kale Mustard Spinach Turnip Greens
Lettuce Mushrooms Okra
• Pepper Radishes Sauerkraut String Beans, youag Summer Squash
• Tomatoes • Watercress
" These . vegetables contain a lot of Vitamin A.
81
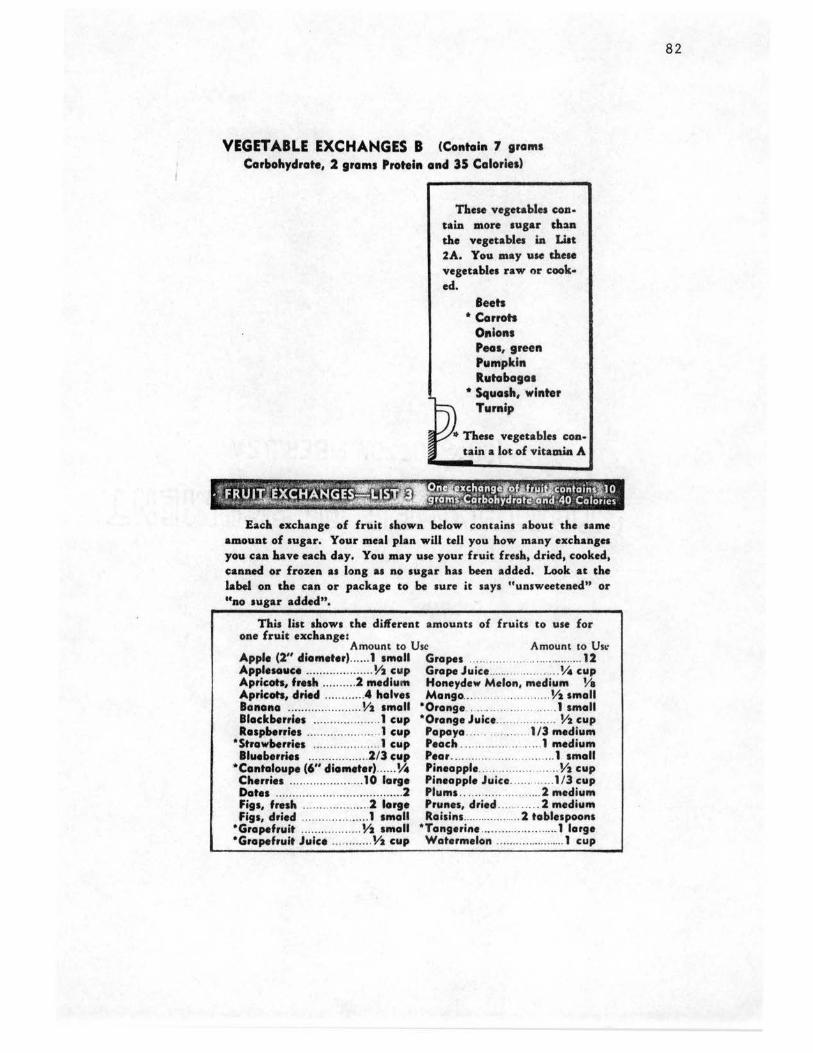
VEGETABLE EXCHANGES B (Contain 7 grams Carbohydrate, 2 9ram1 Protein and 35 Calories)
These vegetables contain more sugar th:in the vegetables in Lilt 2A. You may use these vegetables raw or cook· ed.
Beeb • Carroh
011ion1 Peas, green Pumpkin Rutabagas
• Squash, winter Turnip
O These vegetables contain a lot of vitamill A
Each exchange of fruit shown below contains about the same amount of sugar. Your meal plan will tell you how many exchanges you can have each day. You may use your fruit fresh, dried, cooked, canned or frozen as long as no sugar has been added. Look at the label on the can or package to be sure it says "unsweetened" or ttno sugar added".
This list shows the different amounts of fruits to use for one fruit exchange:
Amount to Use Amount to Usi: Apple (2" diameter) ...... 1 small Gropes ... .. ..... .... . .......... .. .. . 12 .Applesauce ........ ... ......... Yi cup Grape Juice .... .. .... .... ..... .. ~ cup .Apricots, fresh ..... ... .. 2 medium Honeydew Melon, medium Ya .Apricots, dried ........ .... 4 halves Mango... ........ . . . ... . Yi small Bonano ..... ... .. .... ........ Yi small *Orange. .... .. . . .... .. 1 small Blockberrles ...... ..... ......... 1 cup *Orange Juice .. ... ... ........ .. Yi cup Raspberries ......... ....... .. .. 1 cup Popoyo .... .. . .. 1 /3 medium
• Strawberries .. ............. ..... 1 cup Peach . ..... .. ......... .. . .. .. 1 medium Blueberries .................. 2/3 cup Pear ....... ... ........ ......... .... 1 small
'*Cantaloupe (6" diameter) ... ... ~ Pineapple ... ... ...... .. . ... .... Yi cup Cherries ...... ... .. ........... 10 large Pineapple Juice ...... .... ... 1 /3 cup Dates ..... .... ... .. ...... ..... ......... .... 2 Plums ..... ... ... ........ .... 2 medium Figs, fresh .. .. .. .......... ... . 2 large Prunes, dried . ... ... ..... 2 medium Figs, dried .. .. .. . ....... ... .. 1 small Raisins .... ...... .... .... . 2 tablespoons
*Grapefruit ....... .... ....... Yi small *Tangerine ... ........ .... ........ 1 large *Grapefruit Juice .... ....... . Y2 cup Watermelon ... ... .......... ...... 1 cup
82
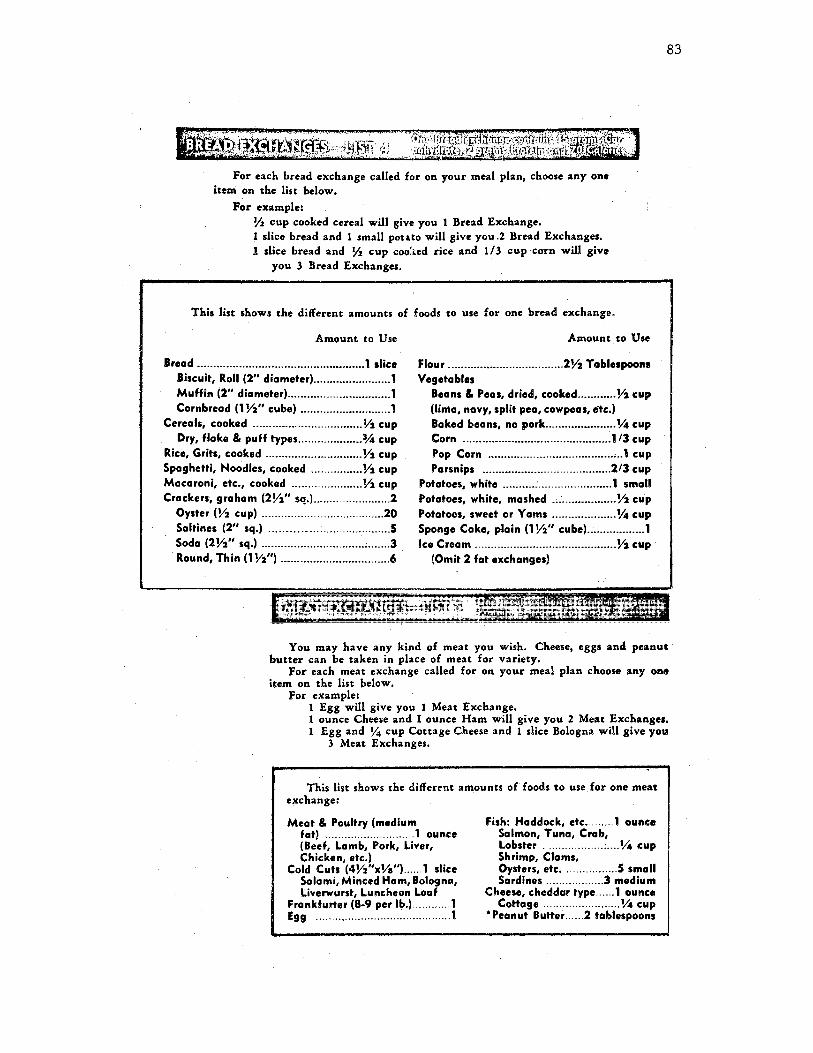
For each bread exchange called for on your meal plan, choose any one item on the list below.
Por example: Yz cup cooked cereal will give you 1 Bread Exchange. 1 slice bread and 1 small potato will give you .2 Bread Exchanges. l slice bread and Yz cup coof.ted rice and 1/3 cup corn will give
you 3 Bread Exchanges.
This list shows the different amounts of foods to use for one bread exchange.
Amount to Use Amount to Use
Bread .................................................... 1 slice Flour .................................... 2V2 Tablespoons Biscuit, Roll (2" diameter) ........................ 1 Vegetables Muffin (2" diameter) ................................ 1 Beans & Peas, dried, cooked ............ Y2 cup Cornbread (1 V2" cube) ............................ 1 (limo, navy, split pea, cowpeas, etc.)
Cereals, cooked ......... , ........................ Vi cup Baked beans, no pork ...................... V.. cup Dry, flake & puff types .................... 3/.t cup Corn .............................................. 113 cup
Rice, Grits, cooked .............................. Vi cup Pop Corn ............................... ~·········· 1 cup Spaghetti, Noodles, cooked ................ Vi cup Parsnips ........................................ 2/3 cup Macaroni, etc., cooked ...................... V2 cup Potatoes, white .......... ; ....................... 1 small Crackers, graham (2V2" sq.) ........................ 2 Potatoes, white, mashed ., .................. Y2 cup
Oyster (V2 cup) ...................................... 20 Potatoes, sweet or Yams .................... V.. cup Saltines (2" sq.) .................................... 5 Sponge Cake, plain (1 V2" cube) .................. 1 Soda (2V2" sq.) ................................ : ....... 3 Ice Cream .......................................... ,.¥2 cup·
' Round, Thin (1 Vi") .................................. 6 (Omit 2 fat exchanges)
83
You may have any kind of meat you wish. Cheese, eggs and peanut butter can be taken in place of meat for variety. .
For each meat exchange called for on your meal plan choose any one item on the list below,
For example: l Egg will give you 1 Meat Exchange. I ounce Cheese and I ounce Ham will give you 2 Meat Exchanges, 1 Egg and !4 cup Cottage Cheese and l slice Bologna will give you
3 Meat Exchanges, ·
This list shows the different amounts of foods to use for one meat exchange: .
Meat & Poultry (medium fat) -. ......... , ................ 1 ounce (Beef, Lamb, Pork, Liver, Chicken, etc.)
Cold Cuts (4Vi"xYa") ...... 1 slice Solami, Minced Ham, Bologna, Liverwurst, Luncheon Loaf
Frankfurter (8-9 per lb.) ............ 1 Egg .................................. , ....... 1
Fish: Haddock, etc ......... 1 ounce Salmon, Tuna, Crab, Lobster ... , ................... V.. cup Shrimp, Clams, Oysters, etc .................. 5 small Sardines .................. 3 medium
Cheese, cheddar type ...... 1 ounce Cottage ........................ y,. cup
*Peanut Butter ...... 2 tablespoons

All fat foods are high in calories. Too much fat or too much of any .' food may cause you to gain weight. A person with diabetes should try
to reach bis ideal weight, If be weighs too much his diabetes will be harder to control,
Use the foods on this list only as allowed on yollr meal plan. You may use your fat exchanges in preparing such foods as vegetables
and meats. For example, if you use a teaspoon of fat to fry an egg give ' up one fat exchange.
For each fat exchange called for on your meal plan choose any one item on the list below.
For example: 1 teaspoon butter will give you 1 Fat Exchange. 1 teaspoon margarine and I slice bacon will give you 2 Fat
Exchanges.
This list shows the different foods to use for one fat exchange.
Butter or Margarine .. , 1 teaspoon Bacon, crisp ....... , 1 slice Cream, light ........ 2 Tables;,oons Cream, heavy . . . . . . . 1 Tablespoon Cream Cheese . . . . . . 1 Tablespoon Avocado 14" diameter). ~
French Dressing . . • 1 Tablespoon Mayonnaise . . ....• 1 teaspooll Oil or Cooking Fat. . . . 1 teaspoon Nuts .....• , , , ..... · 6 small Olives . . . . . . . . . . . . . 5 small
(47)
84

APPENDIX D
85

: FRUITS
Applesauce, sweetened Apricots
· .Blackberries .. Raspberries
A MODIFIED FRUIT EXCHANGE LIST
FRUITS, CANNED IN SIR UP
AMOUNTS
1/2 cup 4 med. halves, 2 Tbsp. sirup 1/2 cup 1/2 cup
Strawberries, frozen, sl. 1/2 cup · Blueberries Cherries, sweet Figs, Kadota Fruit Cocktail Grapefruit Sections .Peaches, Cling
Pears
.. Pineapple
· .. Plums
Prunes
Rhubarb
1/2 cup 1/2 cup 3 figs, 1 Tbsp. S. 1/2 cup 1/2 cup 2med. halves, 2 Tbsp. sirup 2 med. halves, 2 Tbsp. sir up 1 large or 2 small & sirup 3 plums, 2 Tbsp. sirup 4-5 med., 2 Tbsp. juice 1/2 cup solids w/ 1:i,quid
TOTALS . MEANS
CALORIES CHO
92 25.0 80 21.4
85 22.8 48. 12.0
140 35.7 li3 30.0 105 28.5
43 10.0 81 21.4 80 21.3 84 22.3
78 21, l
93 25 .3
91 24 .5
119 31.2
137 35 .1
1469 97.93
387.6 25 .84
86
IF YOU USE ANY OF THE ABOVE FRUITS EACH SERVING WILL BE 2~ FRUIT EXCHANGES
FRUIT JUICES, SWEETENED
FRUIT JUICES AMOUNTS CALORIES CHO
Apple Juice 1/2 cup 62 17.l Apricot Nectar 1/2 cup 67 18.1 .Grapefruit, canned & SW, 1/2 cup · 53 13.9 Lemonade, sweet & frozen 1/2 cup 55 14.0 L:imeade, sweet .& frozen 1/2 cup 53 13.5 Orange J1,1ice 1/2 cup 58 13.5 Peach Nectar .. 1/2 cup 62 · 16. 8 ·
TOTALS 410 106.9 MEANS 58.59 15. 27
·. . IF YOU USE ANY OF THE ABOVE JUICES EACH SERVING WILL BE H FRUIT EXCHANGES
REFERENCE: Church, C. F. and Church, H. N.: Food Values of Portions Commonly Used. 9th ed. Philadelphia: J. B •. Lippincott Co., 1963.

APPENDIX E
87

88
: .' . ' . . ': ·. . . .
'WE!l:KLY SUMMARY OF·FOOD INTAKE FOR SUBJECTS CONSUMING .THREE MEALS :,,>ER DAY
NAME CHERYL BITTL;E
])ATE DAY 1965 ·.
April 5 .· Monday
April 6 Tuesdi:!y
April 7 Wednesday .
Apr:i,1 8 .Thursday·
April 9 .. ~riday .·
April j Saturday
Apr.ii 4. Sunday
WEEl<LY TOTAL .. · . ·. . .. ,.
MEAN DAILY INtAI<E
' •,)
·.. :·
. CALCULATED DIET., .
WEEK 1 .
PROTEIN gm.
· 84.1
'86.1
.84.8
84.8
81.8
84~ 7 ·.··
. 74 ',
580 .3 .
83
·. 85
FAT gm.
· 94
· 94
CHO gin.
i55.5
182.5
. 89.9 199.4
·94.9 199.4
94.9 221.4
'91.8 .172.8
·80 164
639 ~5 129 .5 · ,' '
... ·. 91 .. · .. 185
95 251
'CALORIES
1825
1940
. 1966
2011
2081
1932
·, 1685
·,,
.·13440
. 1920
· 2211
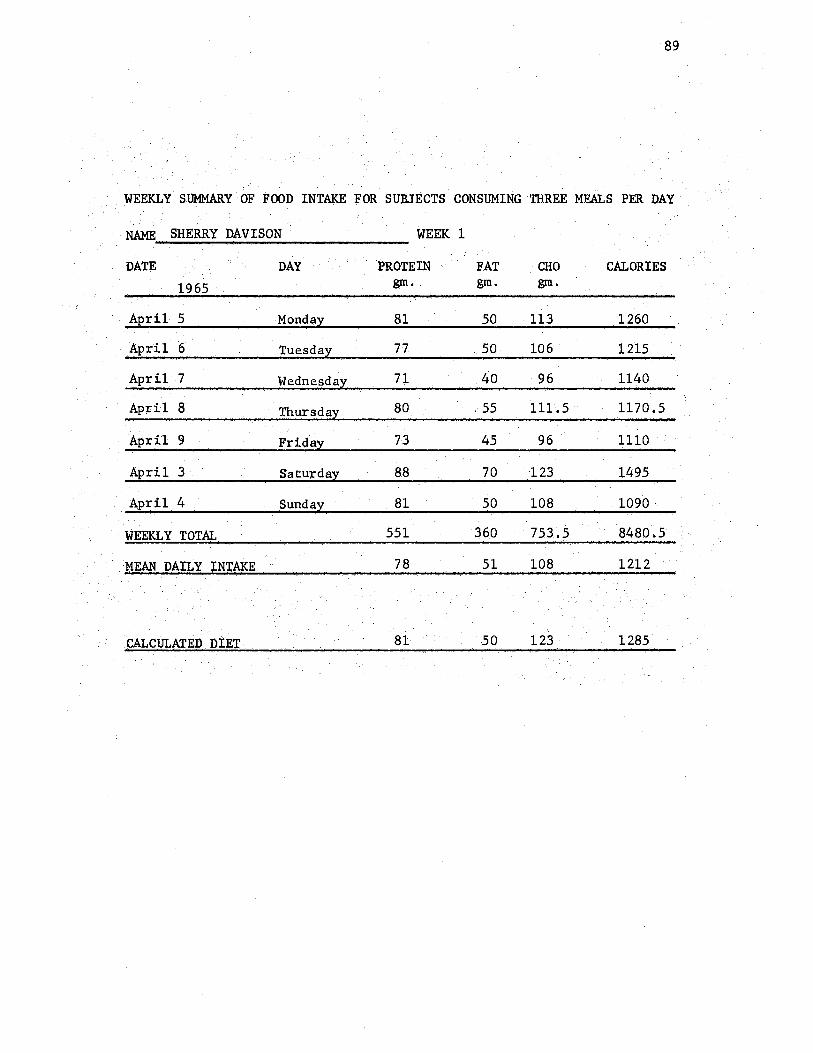
89
. . . . . . . . . .
. •··. WEEKLY· SUMMARY OF. FOOD INTAKE fOR SUBJECTS. CONSUMING THREE MEALS PER DAY ... ·
NAME SHERRY DAVISO:t-1 ·. WEEK 1.
DATE DAY PROTEIN FAT CHO CALORIES
1965 gm. gm. gm.
Aeril 5. ·Monday 81 50 113 .. 1260
. April 6 77 .50 106 ..
1215. · . ·Tuesday .. .
· April 7 Wednesday 71 40 96 1140 ·.
April 8 Thursday 80 .55 111.5 1170,5
·April 9 Friday 73 45 96 HlO·
April 3 Saturday 8.8 70 123 1495
· A,pril 4 Sunday 81 50 108 ... 1090···
WEEKLY TOTAL 551 360 753~5 8480.5
. 1>1EAN DAILY lN'l'AKE 78 51 io8 1212
CALCULATED. DIE'l' .. 81 50 123 ·. 1285
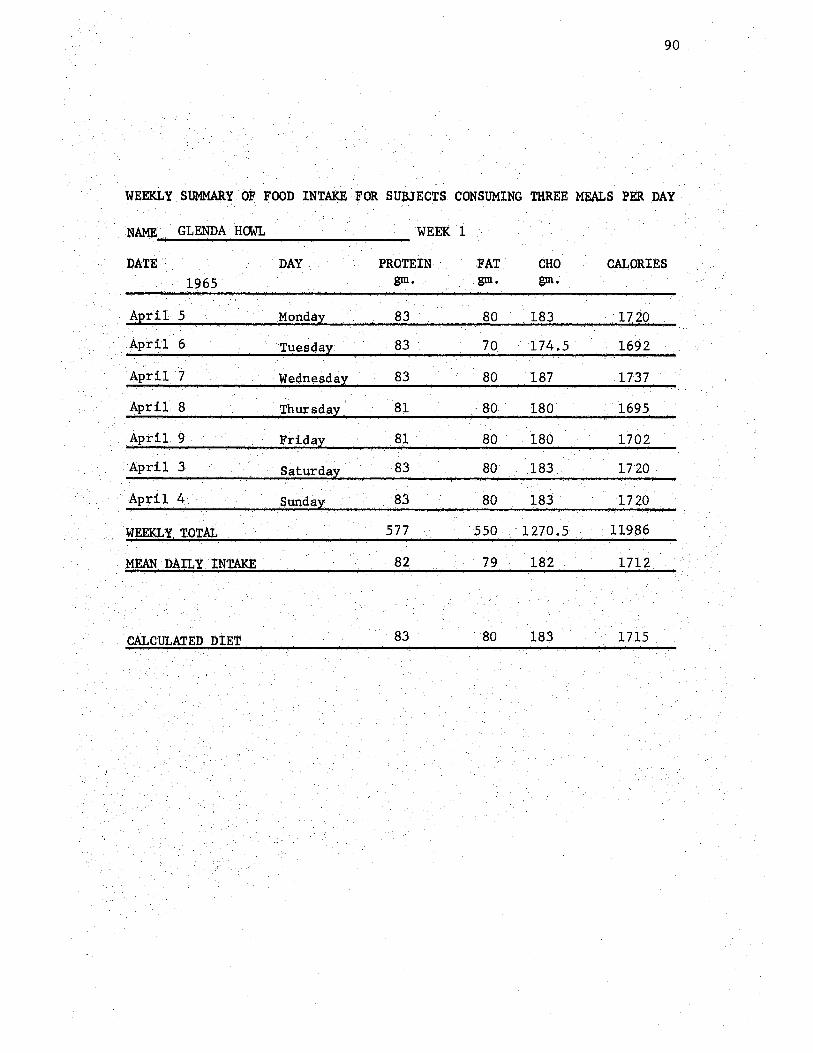
90
WEEKLY . SUMMARY OF. FOOD INTAKE 'FOR' SU.n.JE;CTS . CONSUMING THREE MEALS PER .DAY· ..
. .•. NAM! GLENDA• HOWL
DATJ!! .. ·.
1965:
April 5
~pril 6 .· ..
. April 7 · · .
ApriL 8 .·
WEEK l
DAY ·. PROTEIN · gm •. ·.
·.Monday . 83
Tuesday ·. 83 · . .
· Wednesday .. . . 83 ·
· !hu;i;-sday · .. · · · 81 .
. ,April. 9. . •· . Frid~y •. · · . . 8.1 · ·
'.April. 3 . . · . . . . . . . . . : .
· Satqrday · 83
•· Apri1.4. ·.· .· . .
.. <WEEKLY, T~'UL .· . ·.·. 577 . . . . ..
. · .. · MEAN, PAIL Y INTAKE · •. • 8~ ·.
CALCULATE:0 J)!Et ... 83 ·
.FAT. gm •.
··.so
70
80
'80
80
so
80
..
CHO. gm~
183
174.5
187
180
180
183 .
183
CALORIES
.. · 1720
1692
.1737
.·.· 1695.
1702
1720
1720
. 550 .. 1270.5 .· .. · • .11986
· 79 . · 182 .1712.
80 ·. 183 · 1715 ..
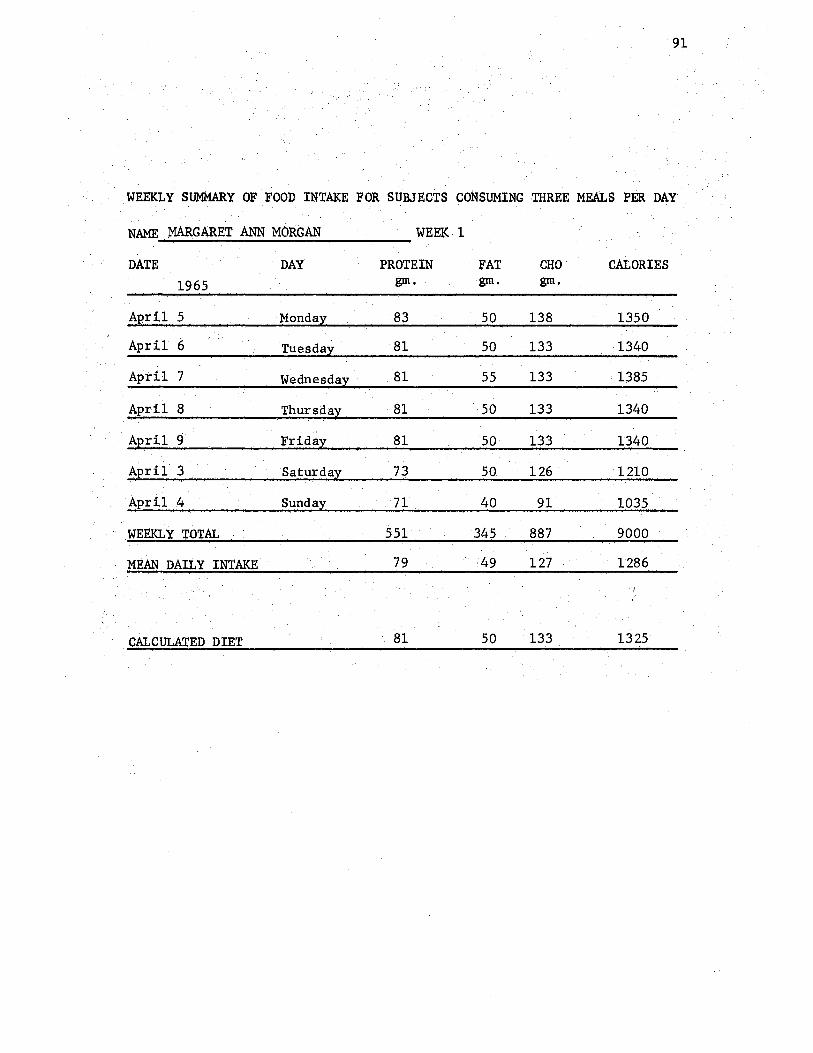
91
WEEKLY SUMMARY OF FOOD INTAKE FOR SUBJECTS CONSUMING THREE MEALS PER DAY . ' ',
,,
NAME ;MARGARET ANN MORGAN WEEK. 1
"
DATE DAY PROTEIN FAT. CHO CALORIES ..
1965 gm. gm. gm.
April· 5 Mondax: 83 50 138. 1350
April 6 .'.Cuesdax ·81 50 ·.133 ·1340
April 7 Wednesdax: . 81 55 133 , 1,385
April 8 '1:hursdax 81 ·50 133 1340 I .
"
·AE_ril 9 81 1340 Fridax: . 50 133
April 3 Saturdax: 73 50 126 ·1210
·· April 4 'sundax. . 71 40 . 91 1035
" .WEEKLY TOTAL 551 345 887 9000
MEAN DAILY INTAKE 79 49 127 1286
I (
. CALCULATED DIET 81 50 133 1325·

92
WEEKLY SUMMARY OF FOOD INTAKE FOR SUBJECTS CONSUMING THREE MEALS PER DAY
NAME JOYCE PHILLIPS WEEK; 1
DATE DAY PROTEIN FAT CHO CALORIES 1965 gm. gm. gm.
Aeril 5 Mondax 83 50 168 1575
AEril 6 Tuesda;2: 83 60 168 · 1660
Apri,1 7 Wednesda;2: 81 60 168 1575
AEril 8 Thursda:2: 83 60 168 1575
AEril 9 Frid ax 83 50 153 1365
April 3 Saturda;2: 77 70 171 1645
April 4 Sunda;2: 83 50 153 1430
WEEKLY TO'IAL 573 400 1149 .10825
MEAN DAILY INT.AKE 82 57 164 1546
CALCULATED DIET 83 60 168 1565
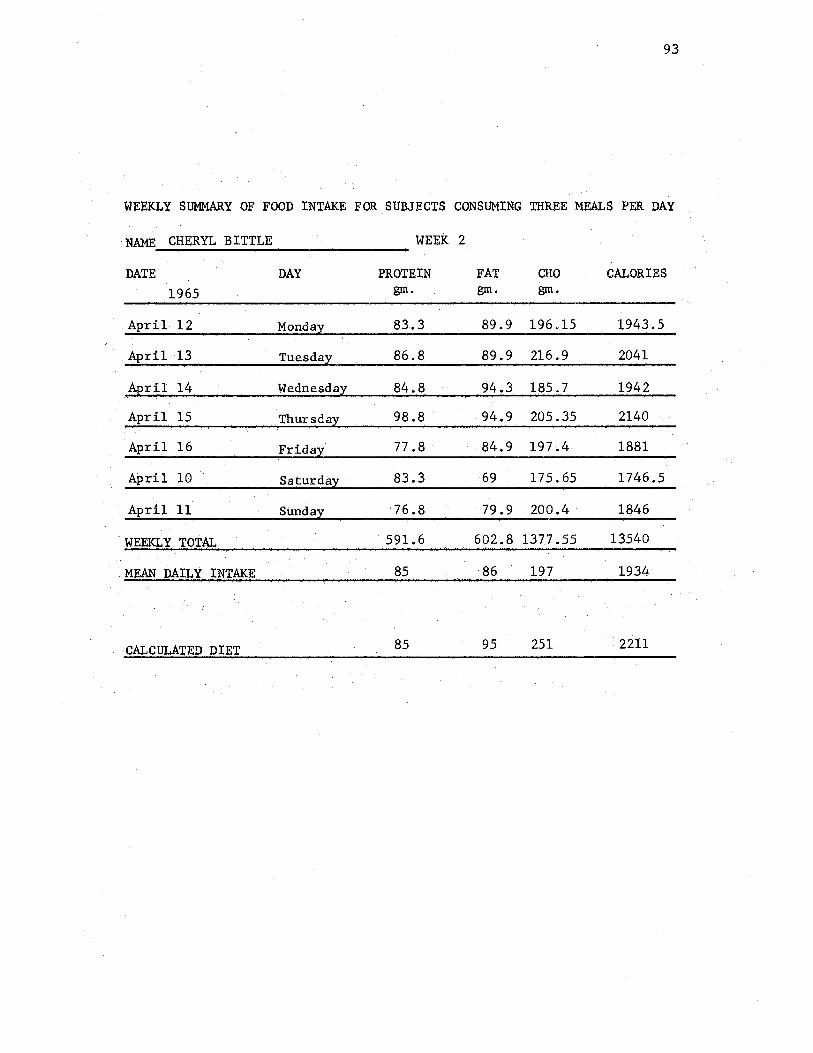
93
WEEKLY SUMMARY OF FOOD INTAKE FOR SUBJECTS CONSUM!NG THREE MEALS PER DAY
·NAME CHERYL BITTLE WEEK 2 '•
DATE DAY PROTEIN FAT CHO CALORIES . 1965 gm. gm. gm •
April 12 Monda! 83.3 89.9 196.15 1943.5
. April 13 Tuesdax '86.8 89.9 216. 9 2041
_AEril 14 Wednesdax 84.8 . 94.3 185.7 1942
April 15 Thursdax 98.8 · 94.9 · 205.35 2140
April 16 Frida! 77 .8 · 84.9 197.4 1881
.. April 10 Saturdax 83.3 69 175.65 1746.5
April 11 Sund ax 76.8 · 79. 9 200.4 1846
• WEEKI.. Y TOTAL 591.6 602.8 1377 .55 13540
MEAN DAILY !NTAKE 85 86 197 1934
.CALCUL.A'l'EDDIET 85 95 251 2211

94
WEEKLY SUMMARY OF FOOD INTAKE FOR SUBJECTS CONSUMING THREE MEALS PER DAY
NAME SHERRY DAVISON WEEK 2
DATE DAY PROTEIN FAT CHO CALORIES
1965 gm. gm. gm.
April 12 ·Mondax: 81 50 123 1300
April 13 T1.1esdax: 75 50 112 1227. 5
April 14 Wednesdax: 73 45 111 1170
April 15 Th1.1rsdax: 81 50 113 1260
April 16 Frid ax: 81 50 118 1280
April 10 Sat1.1rdax: 74 55 113 1195
April 11 S1.1ndax: 81 50 123 1230
WEEKLY TOTAL 546 350 813 86625
MEAN DAILY INTAKE 78 50 116 1238
CALCULATED DIET 81 50 123 1285
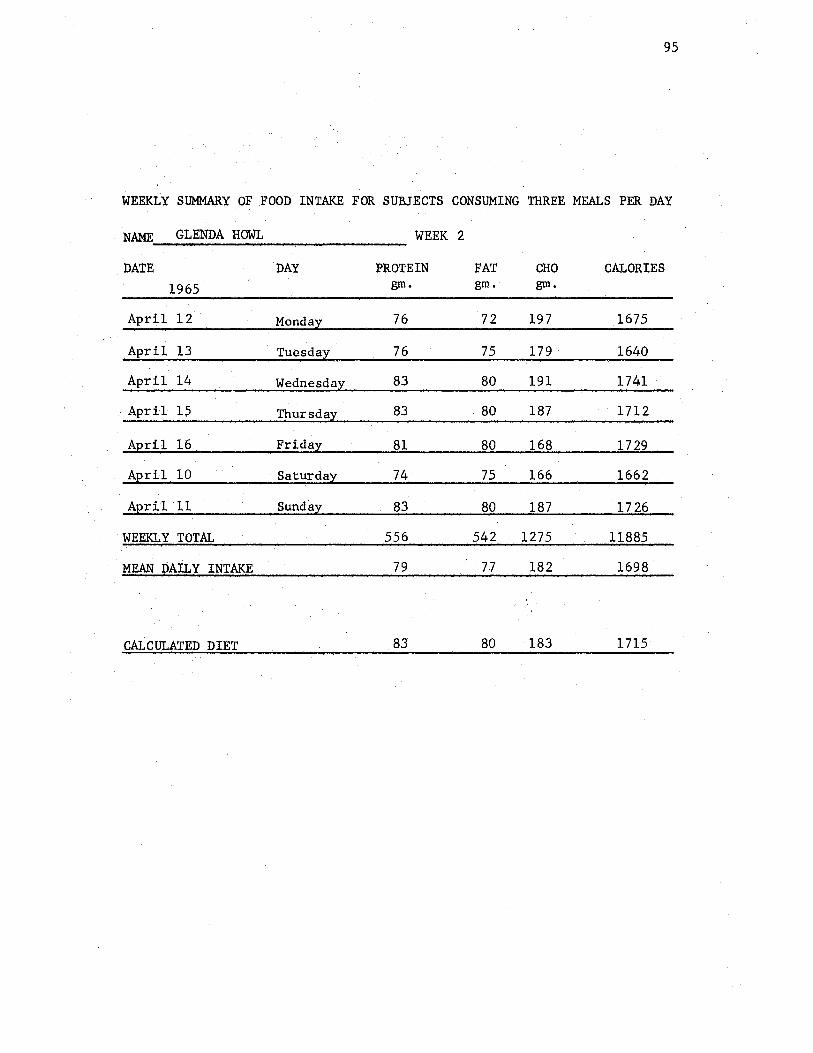
95
WEEKLY SUMMARY OF FOOD INTAKE F.OR SUBJECTS CONSUMING THREE MEALS PER DAY
· NAME GLENDA HOWL WEEK 2
DATE DAY PROTEIN FAT CHO CALORIES 1965 gm. gm. gm.
April 12 Monda;x: 76 72 197 1675
.April 13 Tuesday 76 75 .179 · 1640 ..
April 14 Wednesday 83 80 191 1741 .·
April 15 Thursday 83 . 80 187 1712
AerU 16 Friday 81 80 168 1729
April 10 Saturday 74 75 166 1662
Aeril 11 Sunday 83 80 187 1726
WEEKLY TOTAL 556 542 1275 11885
MEAN QAILY INTAKE 79 77 182 . 1698
CALCULATED DIET .. 83 80 183 1715

96
WEEKLY SUMMARY OF FOOD INTAl<E FOR SUBJECTS CONSUMING THREE MEALS PER DAY
NAME MARGARET ANN.MORGAN WEEK .2
DATE DAY PROTEIN FAT CHO CALOR!E:S 1965 gm. gm. gm.
Ai;iril 12 Monda:z:: Z3 SQ ] 2] l 285
April 13 'l'uesday 81 50 133 1340
Aeril 14 Wedn~sday 81 50 113 1260
April 15·. 1.'hursda:z:: 81 · 50 128 1320
Aeril i6 F;ri<la:z:: 81 50 133 1340·
.. April 10 Saturda:z:: 90 65 140 1535
April 11 Sunda:z:: 81 50 123 1300
WEEI<LY TOTAL 568 . 365 891 9380
M~ DAIL¥ !NTAI<E 81 52 127 1340
CALCULATED .· DIET 81 50 133 1325

97
.• 'WEEKLY SUMMARY O"J! ]?OOD IN'rAKE FOR SlJBJEC'tS CONSUMING THREE MEALS·. PER DAY· ..
. NAME . JOYCE .PHn.LIPS . WEEK 2 ' .. . .
PA'l'E .··. • · DAY PROTEIN 1965 ·gni.
· .. Ae,r~l 12. ~onday .• 83
· April 13 83
83 .. Ag,:ru ·· 14·• Wednesday .. , , .. , . -·
April· 15 .. ··· Thursday• 84.8
April ·16 · · 83
April 10 •·. ~aturd,ay 79
·· ... · April 11 ···. · · Sµnciay · · 83
·. WEEJ<! Y '.COTAL 578.8 ..
' 11~ DA.Il/Y IN'l'Al<E .. · .. 83 ·.
83
FAT CHO gm. gm.
Ir 60 .. 181
.. 60 168
60 168
,64.1 203.8
55 181
65 157
,·so 168
414.1 1226.8
59 .175 .. ··
60 168
CALORIES
. 1625
1575
157~
. 1755
1580
.. I54L2
·. 1490
.. 11141.2
· ... 1.592
.-~ .• 'j
1565
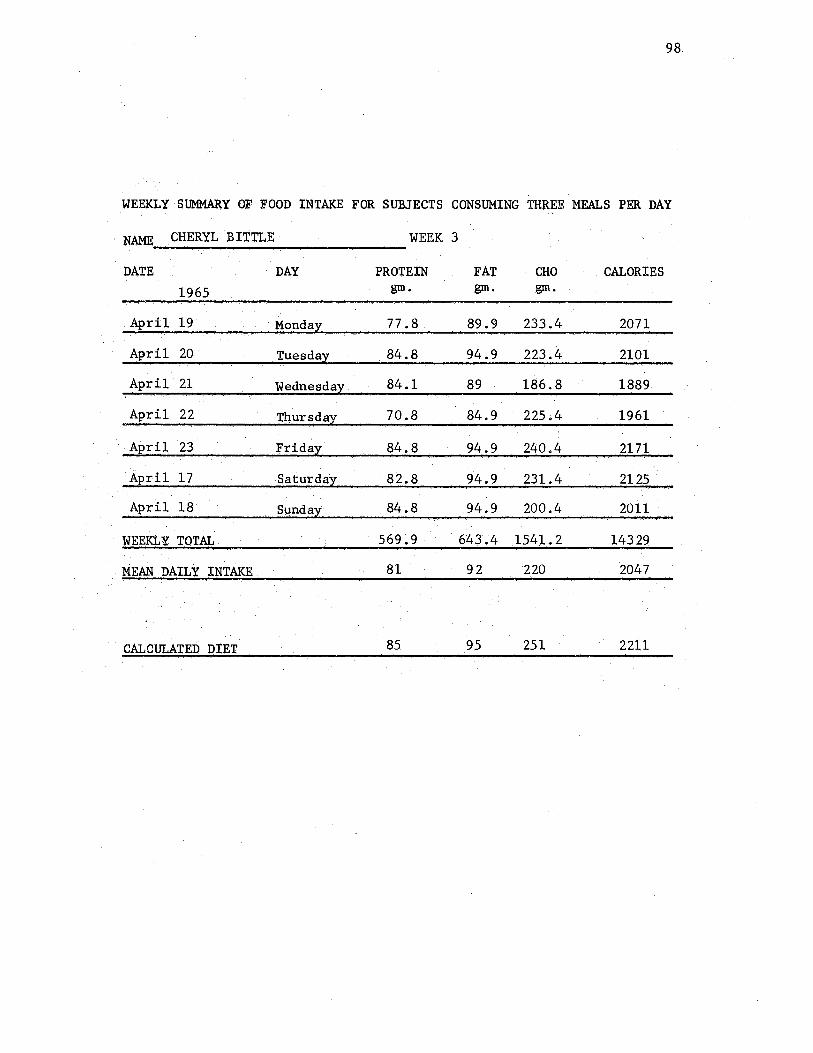
98
WEEKLY SUMMARY OF FOOD INTAKE FOR SUBJECTS CONSUMING THREE MEALS PER DAY
. :NAME . CHERYL BITTLE WEEK 3
DATE DAY PROTEIN FAT CHO CALORIES
1965 gm. gm. gm.
. April 19 · Mondax_· 77 .8. 89.9 233.4 2071
April 20 Tuesda;r; 84.8 94.9 223.4 2101
April 21 .. Wednesdax 84.1 89 186.8 1889
April 22 Tl:lursdax 70.8 84.9 225 .4 1961 ..
A2ril 23 Fridal · 84.8 .94.9 240.4 2171
Aeru 17 Saturdax: · 82.8 94.9 231.4 · 2125.
· April 18 $µndax' . 84,8 9'4.9 200.4 · 2011 ·
WEEl<L Y TOTAL . _ 569~9 643.4 .1541. 2 14~29
.·· :MEAN DAILY INT.AKE 81 92 220 2047
, CALCULATED DIET 85 95 251 22il

99
WEEKLY SUMMARY OF FOOD INTAKE FOR SUBJECTS CONSUMING THREE MEALS PER DAY
. l'IAME SHERRY DAVISON WEEK 3
DATE DAY PROTEIN FAT \ .
CHO CALORIES 1965 gm. gm. gm.
April 19 :Monda;x: 81 50 108 1240
April 20 Tuesda;x: 67 40 108 1090
April 21 Wednesda;t 81 50 123 1300
April. 22 . Thursday 81 · .65 108 1365 ..
April 23 . ~rida;x: 79 50 118 1270
April 17 S1:1turda;x: 81 · 80 · 123 1555
AJ2ri l 18 Sund at 7T 55 117 qoo
WEEKI. Y TOTAL 547 ,390 805 9120
MEAN DAILY INTAKE 78 56 115 1303
. CALCULATED DIET 81 .. 50 · 123 1285

100
WEEKLY SUMMARY OF FOOD INTAKE FOR SUBJECTS CONSUMING THREE MEALS PER DAY
NAME GLENDA HOWL WEEK 3
DATE DAY PROTEIN FAT CHO CALORIES 1965 gm. gm. gm.
April 19 Mondai 83 80 183 1715
April 20 Tuesdai 83 80 165.5 1645
April 21 Wedrtesdai 84.5 82.5 · 148 1692.5
Aeril 22 Thur sci.ax 83 ·80 187 1731
April 23 Frid ax: 83 80 187 1731
April 17 Saturdax: 83 80 183 1715
April 18 $undax: 83 80 179 1715
WEEKLY TOT.AL 582.5 562.5 1232.5 11944.5
MEAN DAILY INTAKE 83 80 176 1706 .
CALCULATED DIET 83 80 183 1715
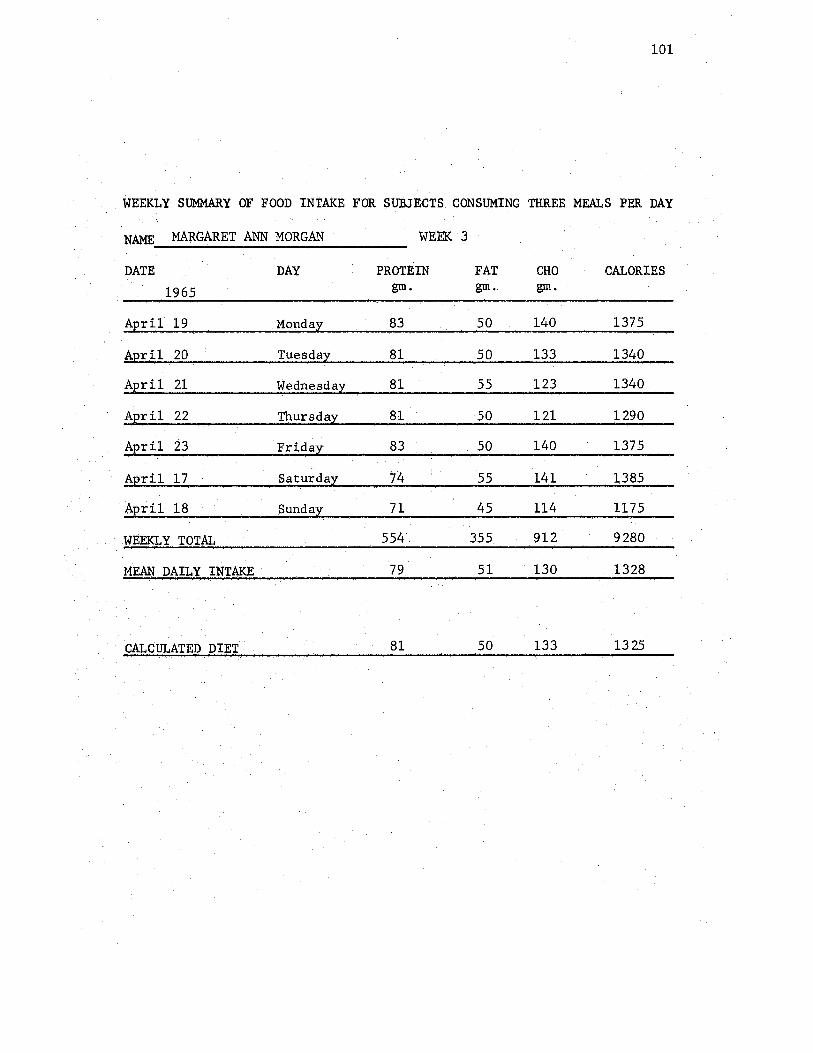
101
. WEEKLY Sl.JMM.ARY OF FOOD INTAKE FOR SUBJECTS CONSUMING THREE MEALS PER DAY
NAME. MARGARET ANN MORGAN WEEK 3
DATE DAY PROTtIN FAT CHO CALORIES
1965 gm. gm .. gm.
April 19 Monday 83 50 140 1375
A:eril 20 Tuesdax 81 50 133 1340
Aeril 21 Wednesdax 81 55 123 1340
Aeril 22 Thursdax 81 ·50 121 1290
Aeril 23 . Fridal 83 50 140 1375
A12ril 17 Saturdax 74 55 141 1385
· Aerit 18 Sundax .. 71 45 114 1175
WEEKLY TOTAL 554 355 912 . 9280
MW DAILY INTAI<,E · 79 .51 130 1328
CALCULATED DIET.· 81 50 133 . 1325
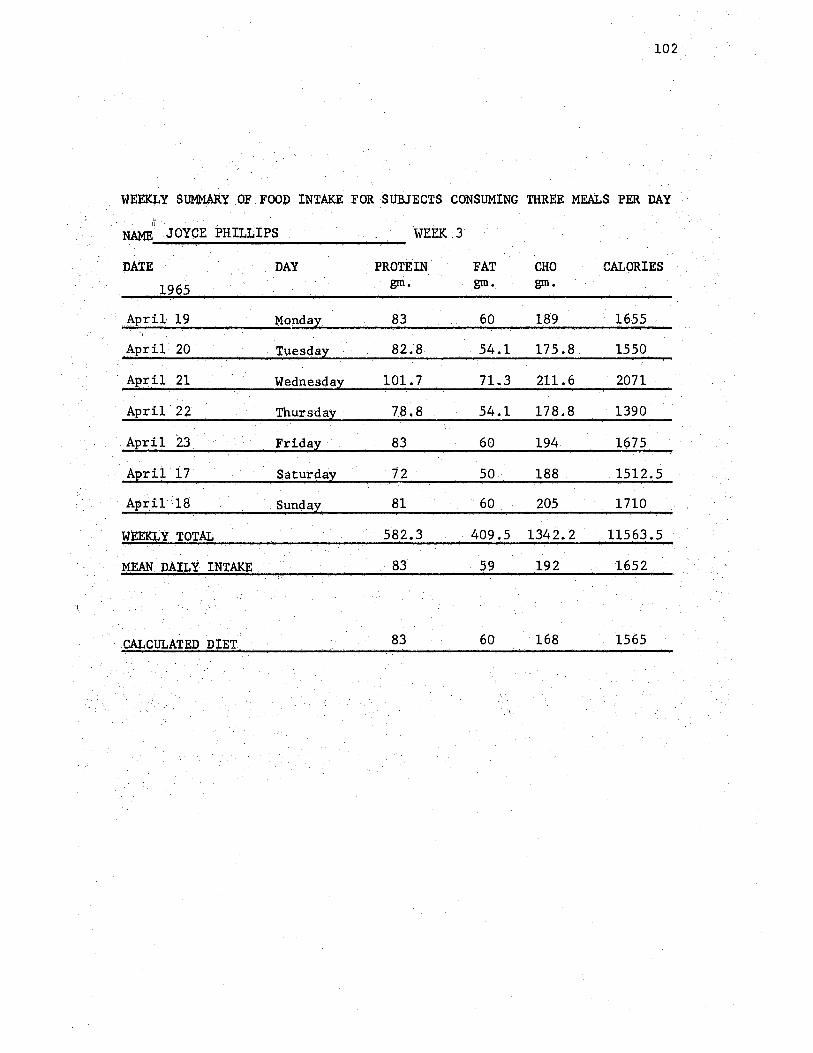
.· 102
WEEKLY SUMMARY OF FOOP INTAKE FOR SUBJECTS CONSUMING THREE MEALS PER DAY ~ ' .
'.NAME JOYCE PHILLIPS · ..
PATE .. ··
1965
< April, 19 . "1 ..
Apri1 20 .·r .. ·. . ..
.• April 21
.• April 22
•· April 23.··.·
· April 17··
April 18 . .
W'.EEl<I.Y TO'!'~
MEAN DAILY INTAKE
. . .
. ··· .. CALCULA'.CED DlET.
DAY
Monday
. Tuesday. ·
Wednesday .
Thursday·
Friday·.·
Saturday
WEEK .3 ..
· PROTEIN gm.
83
82.8
101. 7
78.8
83
12 81
582.3
.· 83
83
FAT CHO CALORIES gm. gm.
60 1.89 · .. 1655
54.l 175.8 . .1550
71.3 211.6 2071
54.l . 178.8 1390 .
60 194 1675
50 188 . 1512.5
· 60 205 1710 ·
409.5 1342.2 11563 .• 5
59 192 165.2.
60 168 1565
.,·

APPENDIX F
103

104
WEEKLY SUMMARY OF FOOD INTAKE FOR SUBJECTS CONSUMING SIX MEALS PER DAY
NAME CHERYL BITTLE WEEK 4
DATE DAY PROT'.EIN FAT CHO CALORIES 1.965 gm. gm. gm. -
April 26 Monday 85.8 - 84~9 211'. 9 2061 April 27 Tuesday 84.8 84.9 203.4 1981
April 28 Wednesday 77 .8 84.9 233.4 2026
_ April. 29 Thursday 81 80 213 1910
April 30 Friday 76.8 84.9 221.4 2011
April 24 Saturday · 84. 2 98.8 - 222 2128
April 25 Sunday 84.8 89.9 219 .4 - 2061 _
WEEKLY. TOTAL _ 575.2 613.3 1524.5 14178
_MEAN DAILY INTAKE 82 88- 218 2025
CALCULATED DIET 85 95 233 - 2146
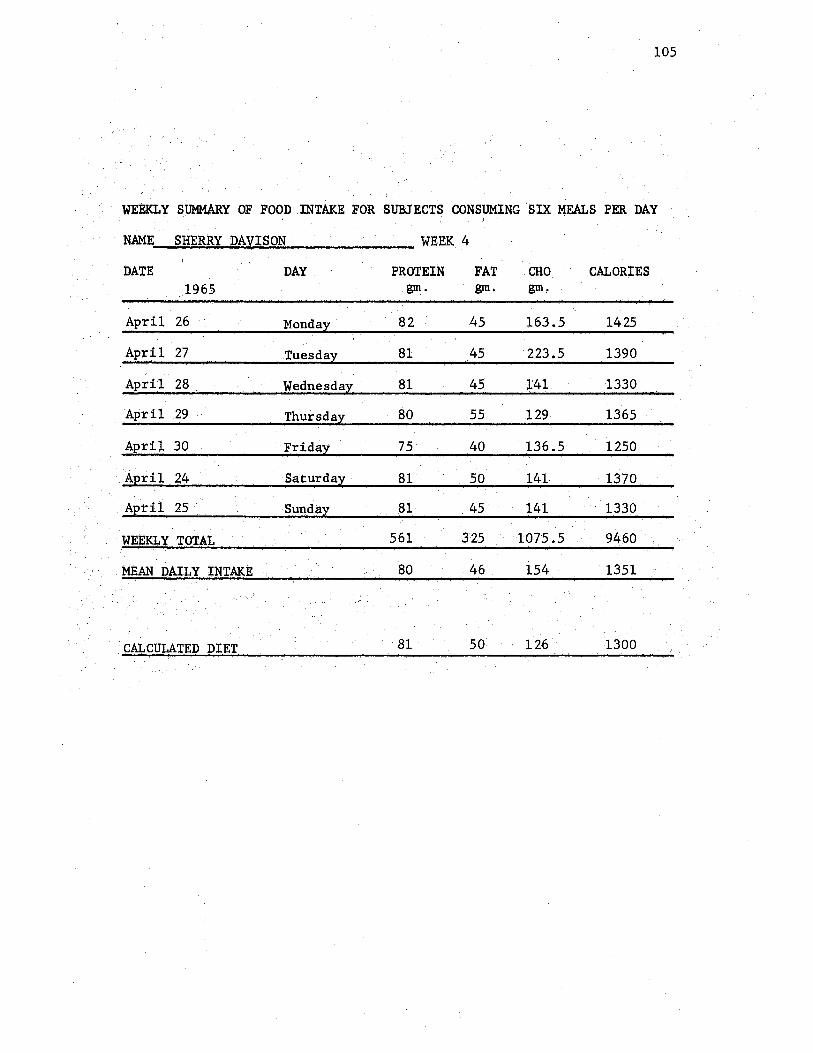
105
WEEKLY SUMMARY OF FOOD INTAKE FOR SUBJECTS CONSUMING 'SIX ~EALS PER DAY
NAME SHERRY DAVISON•
DATE DAY. 1965
April 26 Monday
April 27 Tuesday
April 28 Wednesday·
April .29 ·· Thursday
~pril 30 Friday
April 24 . Saturd~y
· .. April 25 •· ... · .. · Sunday
WEEKLY TO'i'At .
, MEAN DAILY lNTAKE ..•
WEEK 4
PROTEIN. gm.
82
81
81
80
81
,81
561
80
FAT. CHO gm. gm,
. 45 163.5
45 223.5
45 1'41
55 129
. 40 136.5
50. 141
. 45·. 141
325 1075.5
. 46 .. 154
CALORIES
1425
1390
1330
1365
1250
1370
13,30
94.60
'·1351
• .... cAL_ . ...,c_UL_. A,_T_E_D_D_I.....,E_T ___________ .a_1_· . ____ ._5_o_ .. _ ....... 1_26_· ______ 1_3 __ 0_0 __ /·:.

106
.. WEEKLY SUMMARY. OF FOOD lNTAKE FOR SUBJECTS 'CONSUMING SIX MEALS PER DAY
,,
.. NAME GLENDA HOWL· WEEK 4
···DATE DAY PROTEIN FAT CHO CALORI.ES
. 1965 8JD:. gm. gm,
Ap:ril. 26 Mondiay 83 80 187 .1680
April 27 Tuesday. 83 80 187 1735
,April 28. Wednesday 83 80 191 1751
April .29·. Thursday 76 75 '' 187 1660 ·
April 30 :Friday.· 83 80 187 1,735
.April. 24 Saturdaz .. 77 80 . 182 '1685
Aeril 25 Sut1day 83 80 187 1735
WEEKLY. TOTAL. _!,68. 555 " 1308 11981
MEAN DAILY INTAKE .. 81 79 187 .'
1711
' CALCULATED' DIET '' 83 80 186 17.30
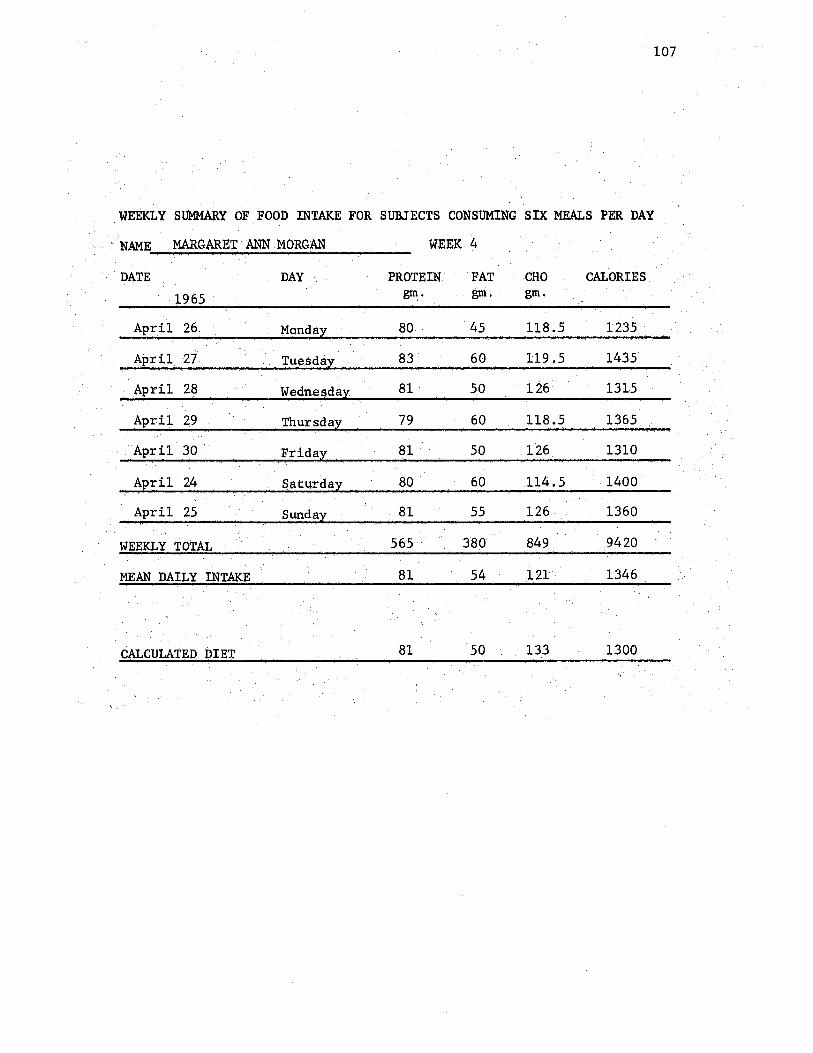
· 107
. WEEKLY S~Y OF FOOD INTAKE FOR SUBJECTS CONSUMING SIX MEALS PER DAY
.. . NAME . .MARGARET•ANN MORGAN WEEK 4
·DATE DAY PROTEIN. ··FAT Clio CALORIES. 1965 · . ~· gm. gm,
. · April 26. Monday_· 80 45 118.5 1235
April 27 Tuesday· 83 60 119 .5 . 1435
·April 28 Wedne1:1da>i; 81 · 50 126 1315
April 29 . Thursday 79 60 118.5 1365
· ·. Apri1 30 ,. '.Frida,: 81 50 .126 1310·
April 24 Saturday 80 60 114.5 ·. -1400
Apr.il 25 ··.Sunday· 81 55 126 1360·
WEEKLY TOTAL 565. 380 849 .. .9420
MEAN.DAILY.INTAKE 81 54 121 1346
CALCULATED DIE! 81 50 . 133 1300·
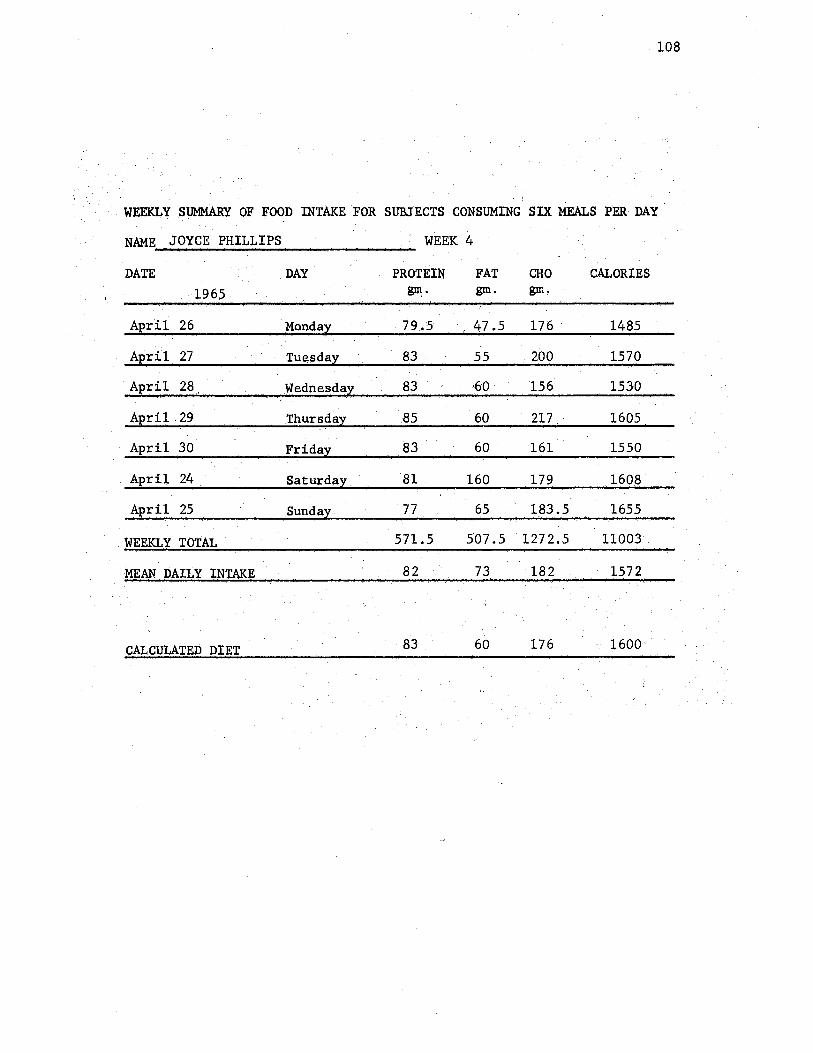
. 108
.. . l
WEEKI.Y SUMMARY OF FO~D INT.AKE FOR SUBJECTS CONSUMING SIX MEALS PER DAY
NAME JOYCE PHILLIPS· WEEK 4
DATE DAY PROTEIN. FAT CHO CALORIES ( .-. . 1965 ~· gm • gm·,
April 26 Monda)' . 79 .• 5 47.5 176 1485
April 27 Tu~sday . 83 55 • 200. 1570
April 28. Wednes~ay. 83 160 156 .1530
April 29 .Thursday 85 60 217 1605
April 30 Fridax:· 83 60 161 1550
April 24 •. Saturday. · 81 . 160 179 160~·
April 25 Sutl.day .. 77 65 183.5 1655
WEEKLY TOTAL 571.5 507.5 · 127 2.5 11003
MEAN DAILY INTAKE 82 73 182 · ·. 1572
CALCULATED DIET 83. 60 176 1600 .
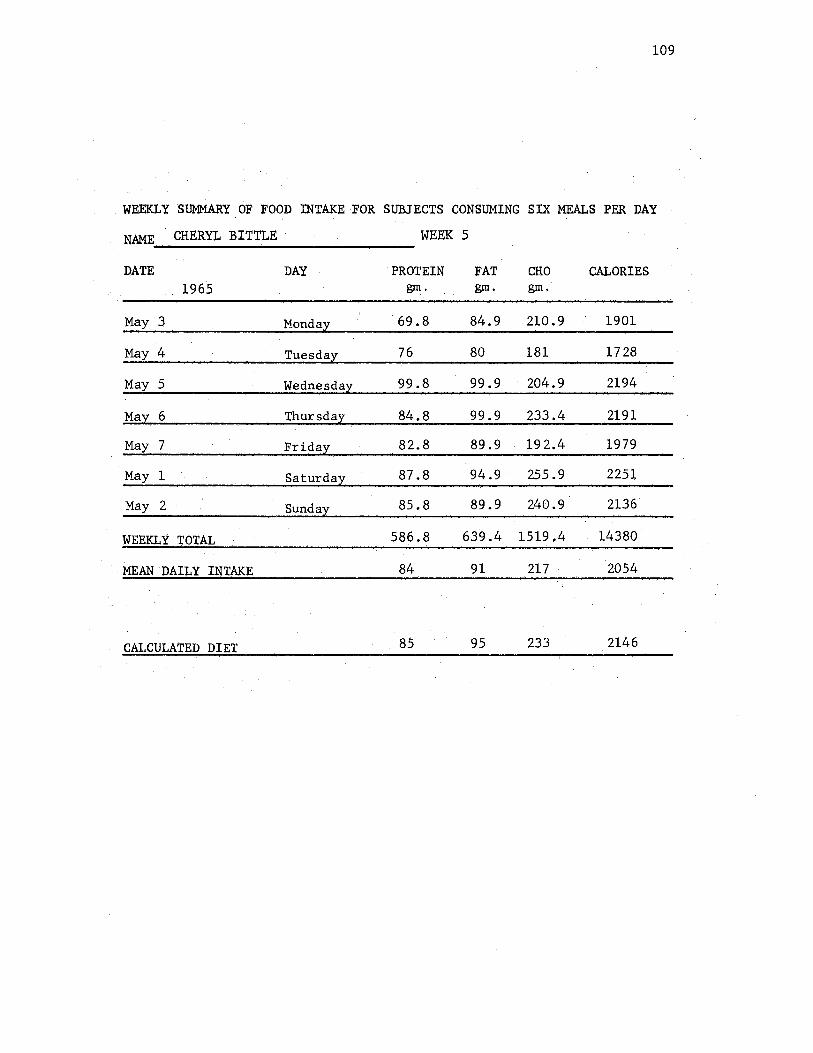
109
WEEKLY SUMMARY OF FOOD INTAKE.FOR SUBJECTS CONSUMING SIX MEALS PER DAY
NAME CHERYL BITTLE · WEEK; 5
DATE DAY PROTEIN FAT CHO CALORIES 196.5 gm. gm. gm.
May ·.3 Monday 69.8 84.9 210.9 1901
May 4. Tuesday 76 80 181 1728
Ma;y 5 Wednesday 99.8 99.9 204.9 2194
May 6· Thursday 84.8 99.9 233.4 2191
May 7 Friday 82.8 89.9 192.4 1979
May 1 Saturday 87.8 94.9• 255 .9 2251
May 2 Sunday 85.8 89.9 240.9 2136
:WEEKLY TOTAL 586.8 639.4 1519.4 14380
MEAN .DAIT.. Y INTAKE . 84 91 217 2054
CALCULATED DIET ·. 85 95 233 2146

llO
WEEKLY SUMMARY OF FO~D INTAKE FOR SUBJECTS CONSUMING SIX MEALS PER DAY
NAME SHERRY DAVISON·. .WEEK 5
DATE DAY PROTEIN 'FAT CHO CALORIES · .. 1965 gm. gm. gm.
May 3 Monday 81 45 156 1390
·May 4 Tuesday 80 50 133.5 1340
May·5 Wednesday 82 · 40 1:63.5 1380
· May 6 Thursday 83 50 156 1445
May 7 Friday 81 45 126 1270 ·
. May 1 Saturday 81 50 126.. 1315
May 2 Sunday 72 45 ·109.5 ll60
WEEl<LY TOTAL 560 325 970.5 9300
MEAN DAILY INTAKE 80 46 139 1328
CALCULATE!) DIET 81 50 126 1300

111
WEEKLY SUMMARY OF FOOD INTAKE FOR SUBJECTS CONSUMING SIX MEALS PER DAY
. ·NAME GLENDA HOWL· WEJ!:K 5
DATE DAY PROTEIN FAT CHO CALORIES 1965 gm. gm. gm,
May 3 Monday 83 . 80 187 1730. ·.
May 4 Tuesday 83 80 182 1710
May 5 Wednesday 83 90 174 1770
May 6. Thursday 83 80 175 1685
May 7 ··. Friday 83 80 177 . 1695.
May 1 Saturday 83. 80 187 1730 · ..
May 2 Sunday 83 80 ·187· 1730·
WEEKLY·. TOTAL . 581 · 570 1269 12050
MEAN DAILY INTAKE 83 81 181 1721
CALCULATEb.DIET 83 80 186 .1730
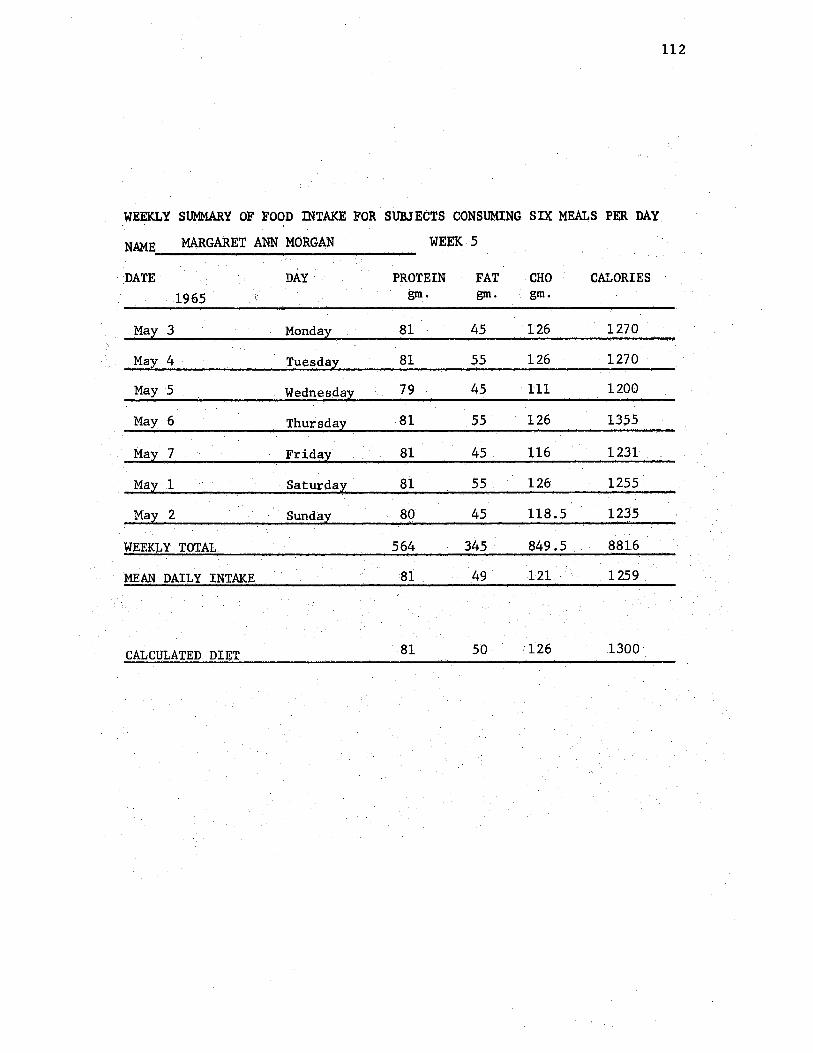
112
WEEKLY SUMMARY OF F.O~D '.mTAKE FOR. SUBJECTS CONSUMING SIX MEALS PER DAY
NAME MARGARET ANN MORGAN WEEK 5
DATE DAY PROTEIN FAT CHO CALORIES 1965 gm. gm. gm.
May 3 Monday 81 45 126 1270
May 4 Tuesday· 81 55 126 1270 ·
May 5 Wedne13day 79 45 111 1200
May 6 Thursday 81 55 126 1355
May 7 Friday 81 45 116 1231
May 1 Saturday 81 55 126. 1255.
May 2 Sunday 80 45 118.5 1235
WEEKLY TOTAL 564 345 849.5 8816
MEAN DAILY INTAKE 81 49 121 1259.
CALCULATED DIET 81 50 126 1300
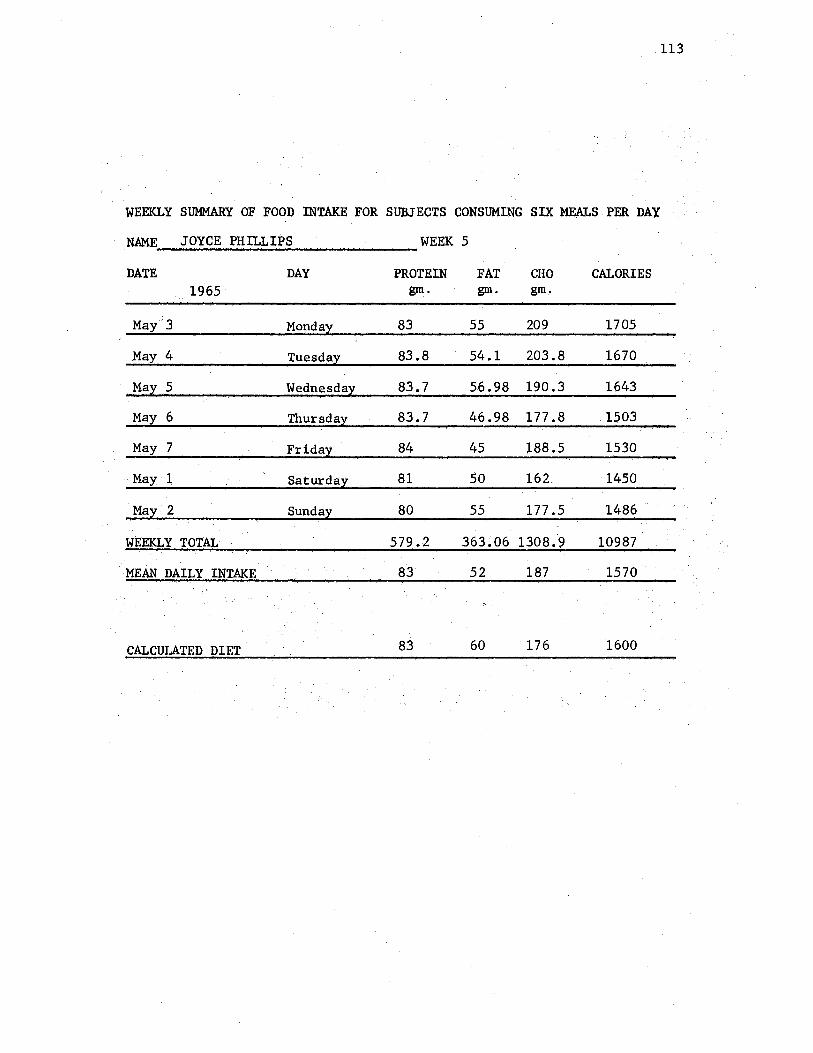
113
WEEKLY SUMMARY OF FOOD INTAKE FOR SUBJECTS CONSUMING SIX MEALS PER DAY
NAME JOYCE PHILLIPS WEEK 5
DATE DAY PROTEIN FAT CHO CALORIES 1965 gm. gm. gm.
May"3 Monday 83 55 209 1705
May 4 Tuesday 83.8 54.1 203.8 1670
May 5 Wednesday 83.7 56.98 190.3 1643
May 6 Thursday 83.7 46.98 177 .8 . 1503
May 7 Friday 84 45 188.5 1530
May 1 Saturday 81 50 162 1450
May 2 Sunday 80 55 177 .5 1486
WEEKLY TOTAL 579.2 363.06 1308.9 10987
MEAN DAILY INTAKE 83 52 187 1570
CALCULATED DIET 83 60 176 1600
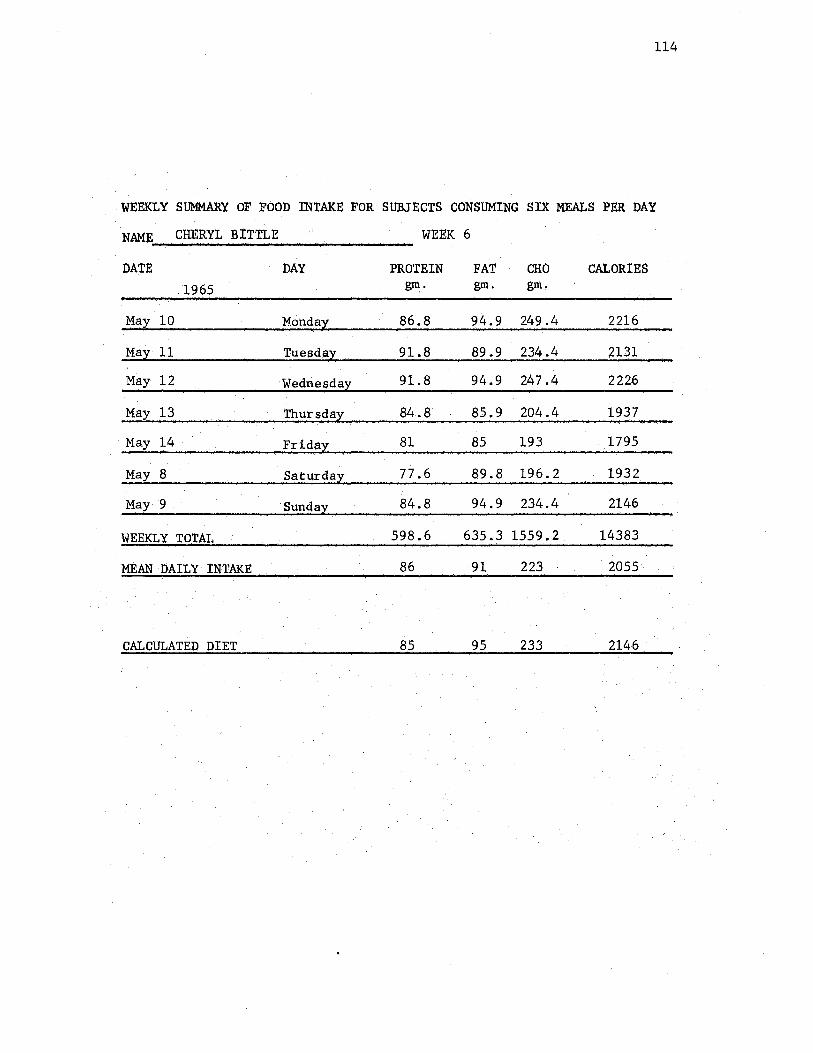
114
• WEEKLY S~Y OF FOOD INTAKE FOR SUBJECTS CONSUMING SIX MEALS PER DAY
NAME CHERlL B!TTLE WEEK 6
DATE DAY PROTEIN FAT. CHO CALORIES . 1965 gm. gm • gm,
May 10 Monday 86.8 94.9 249.4 2216
May 11 Tuesday .. 91.8 89.9 234.4 . 213.1
May 12 Wednesday 91.8 94.9 247 .4 2226
May 13 Thursday·. 84.8 85.9 . 204.4 1937
·· May 14 · · Friday 81 85 193 1795
May 8 Saturday 77.6 89.8 196.2 1932
May 9 ·sunday 84.8 94.9 234.4 2146
WEEKLY TOTAL .. ·· 598.6 635.3 1559.2. 14383
MEAN :DAILY INTAKE 86 91 223 2055
. CALCULATED DIET . ·8.5 95 . 233 2146
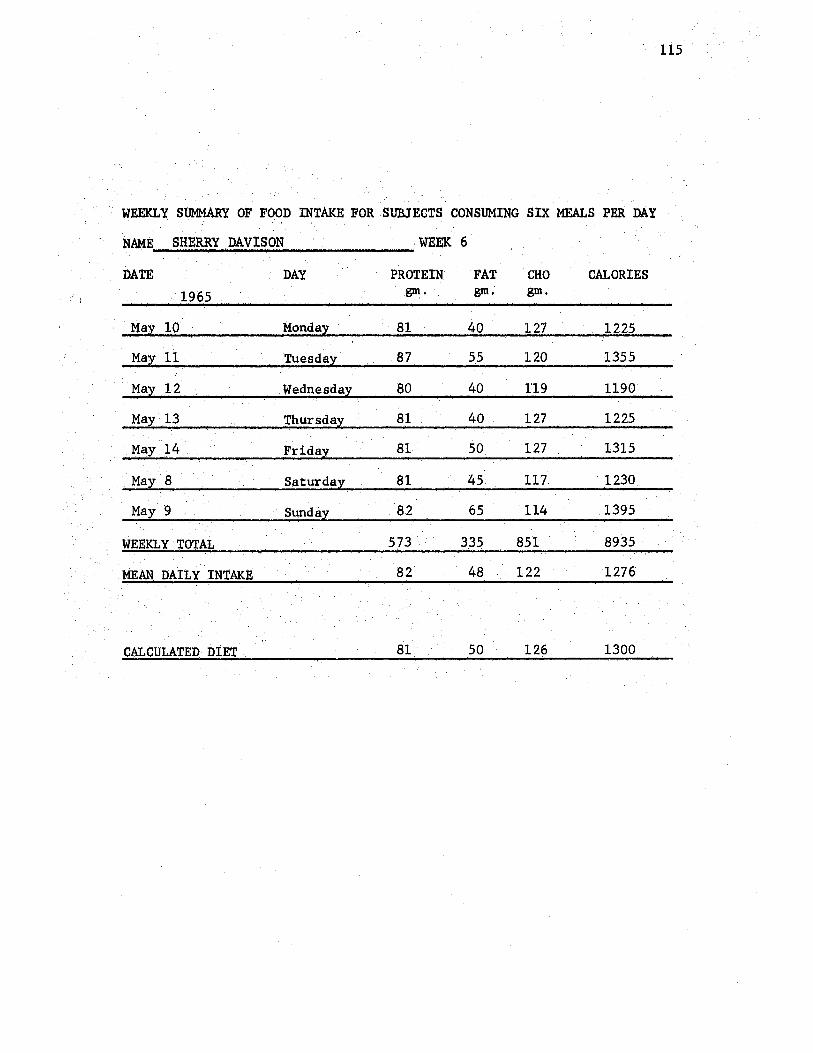
115
. WEEKLY SUMMARY OF FOOD INTAKE FOR SUBJECTS CONSUMING SIX MEALS PER D.AY
NAME SHE:RRY. DAVISON ·WEEK 6
DATE DAY PROTEIN FAT CHO CALORIES
· 1965 gm. gm. gm.
May 10 Monda:z 81 40 127 1225
May 11 Tuesday 87 55 120 1355
May .12 Wednesday 80 40 119 1190
May 13 Thursday 81 40 127 1225
May.14 Friday 81 50 127 1315
May·8 Saturday 81 45 117 . 1230
May 9 Sunday 82 65 114 1395
WEEKLY · 'l'O'l'At 573 3.35 851 8935
.· MEAN. DAILY INTAKE 82 48 122 1276
CALCULATED DIET 81 50 126 1300
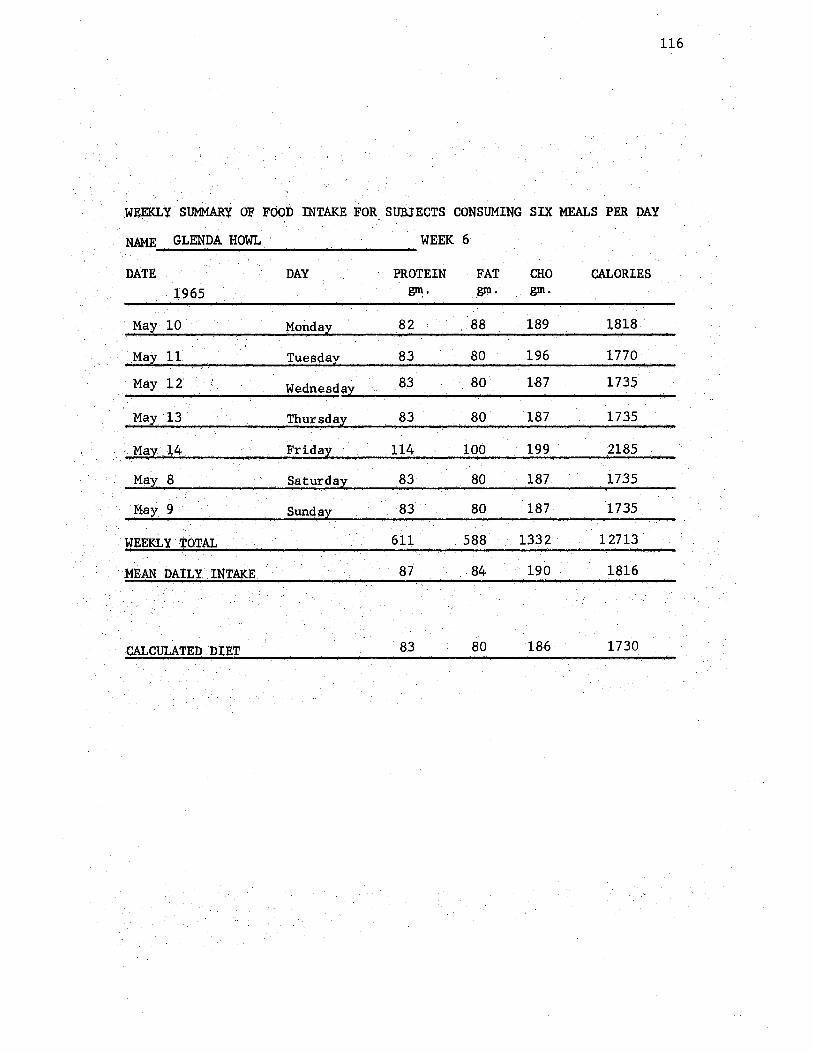
116
WEEKLY SUMMARY OF FOOD INTIJ<E FOR SUBJECTS CONSUMING SIX MEALS PER DAY
NAME GLENDA HOWL WEEK 6
DATE· DAY PROTEIN FAT CHO CALORIES 1,965 gm. . gm. gm.
.. May 10 Monday 82 88 189 1818
May 11 Tuesday 83 80 196 1770
· May 12 Wednesda 83 80 1-87 1735
May 13 Thursday 83 80 187 1735
May 1,4 Friday 114 100 199 2185
May 8 Saturday 83 80 187. 1735
May 9 Sunday 83 80 187 1735
WEEKLY TOTAL 611 ·. 588 1332 12713
:MEAN OAILY . INTAKE 87 84 190 1816
CALCULATED.DIET 83 80 186 1730
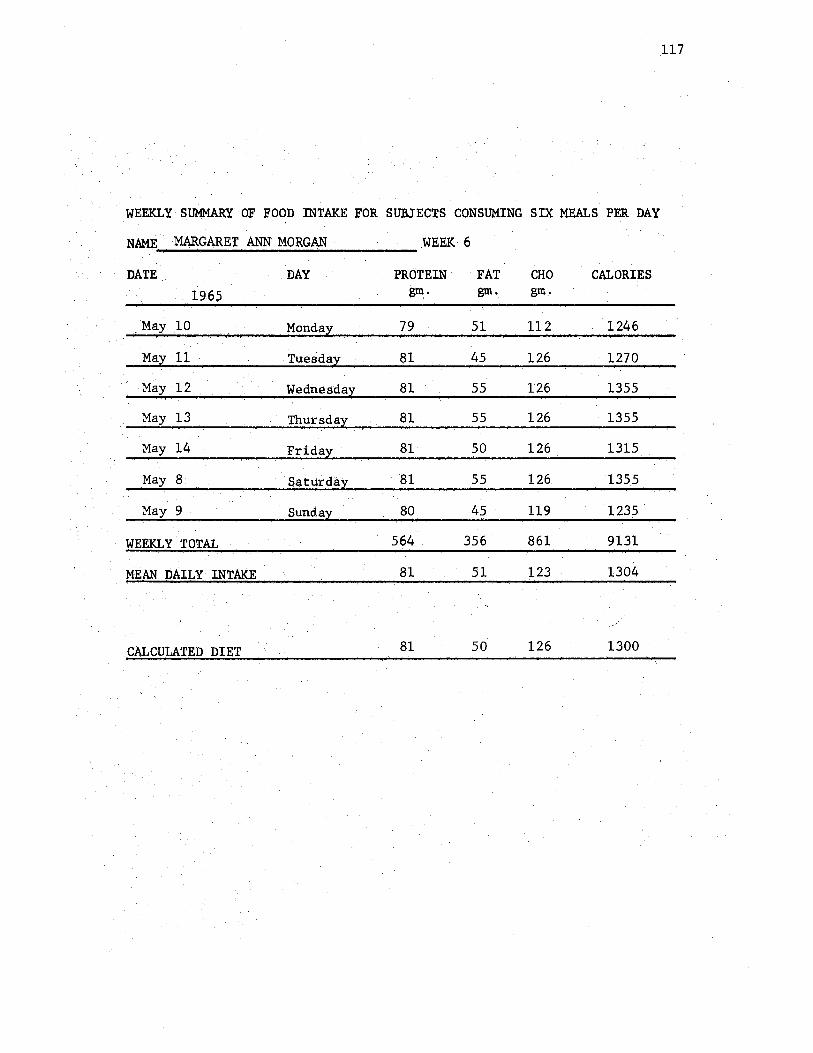
117
WEEKLY· Slno1MARY OF FOOD INTAKE FOR SUBJECTS CONSUMING SIX MEALS PER DAY
NAME MARGARET ANN· MORGAN · WEEK 6
DATE.· DAY PROTEIN FAT CHO CALORIES
. . 196,:5 gm . gm. gin,
... May. 10 Monday 79 51 112 1246
May· 11. · .. Tuesday 81 45 · 126 1270 ·
·May 12 Wednesday 81 55 1'26 1355 . . .
May 13 Thursday_ ... 81. 55 126 1355
May 14 .·Friday 81 50 126 1315
.May 8 . ·saturday 81 55 126 1355
May 9 Sunday 80 45 119 1235 .
WEEKLY.TOTAL 564 356 861 9131
~EAN bAILY INTAKE .. 81 51 123 1304
.CALCULATED DIET 81 50 126 1300
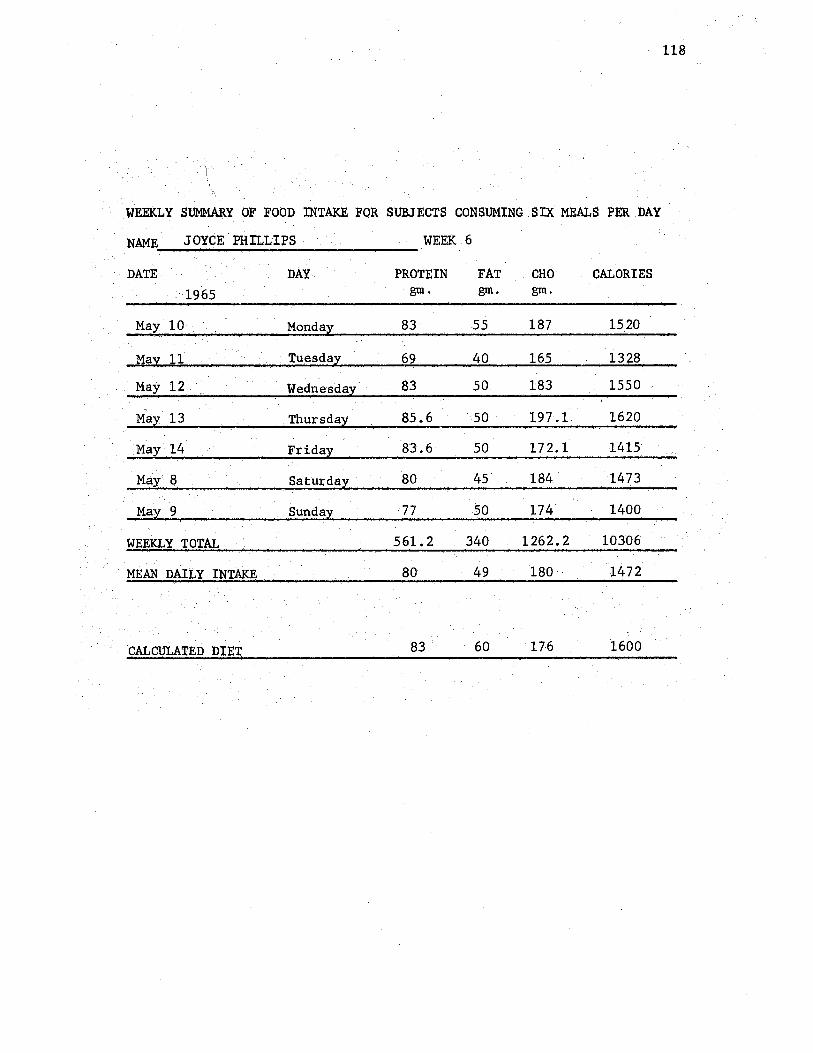
118
) I
WEEKLY Sm@{ARY OF FO~D INTAKE FOR SUBJECTS CONSUMING SIX MEALS PER .DAY
NAME J:OYCE. PHILLIPS WEEK.6
··DATE DAY PROTEIN FAT . CHO CALORIES
. . 1965 gm. gm. gm •
·. May 10 · .. • Monday 83 55 187 1520
May 11 .·· Tu.asday 69 40 165 1328
May 12 · Wednesday 83 50 1'83 1550
' May 13 .thursday 85.6 50 197.1. 1620
•May·· 14 Friday 83.6 50 172.l 1415
May 8 Saturday·· 80 45 184. 1473
May·9 Sunday .·77 50 174 1400
WEEKLY TO'l'AL 561.2 340 1262. 2 10306
. ·. ·. MEAN DA.It. y INTAKE .. 80 49 180 · 1472
CALCULATED DIET 83' 60 176 i600

wEmY smtlARY oF Foo» INTAKE FOR. suruEcTs coNsUMING sIX MEAI.is' PER DAY
·NAME CHER'YL . B l'rTL.E
··. DA.TE DAY .. 1965
·. Ma;x; 1.7 Monday
Wedpesday
Friday
•Saturday. ·
·· )'1ay. 16 . · Sunday . . . . ~ . . . . ·. . . .
. WEEl<L y 'XOTAL
. ''MEAN DAILY: l'.NTAKJii
· .. :CALcUT.,ATEn 012:c ·· . ,· ...... , ...
WEEK 7
PROTEIN .FA'l' . gm. gm.
... 9'i .. 105
90· 94
85 100
266. 299
89 100
85 · 95
CHO gm,
244 .··
185
239
668
223:
··233 ..
CALORIES
2296·
1960
..
2120
6376 ..
2125 ..
119
l
·; ;'-·,.~

120
. WEEKtY · SUMMARY OF FOOD INTAKE F~R SUBJECTS CONSUMING SIX MEALS P.ER DAY
NAME SHERRY DAVISON .· < '· •••
.. . . ·. DATE
·.·· 1965
May 17
May 18 . .
· Ma.· 19 · '·. y
May 20
May 21
·May 15
May ,16 .
. . WEEKLY TOTAL
.DAY
. Tuesday·.
.. Wednesday .
Thursday_ ..
Fridt:1y ..
.. ~aturday
Sund~y
. MEAN DAIL~ ItiTAl<JL : .
CALCULATED l)!ET .·.,
WE:EK 7
PROTEIN . FAT sm: gm.
80, . 45 I . . .
· 74 . 40
.... 81 45
.. 82. 50
· .. 49. . 30
82 .· 50
74 .45.·
CHO gm,
119 ·
127·
·126 ·
127
82 ·
. 149
127
CALORIES >.
1235.
1195.
1270 ·._
1315
815
. 1410
.· J240
522 304 .. 857 . ·, 8480 .. .
• .. 80 . ', 4 7 . 132 · . ,.1305 .. .
. ~1 50 126 . 1300

. 121
. WEEKLY SIHiARY OF fO~D lNTAKE FOR• StJBJECTS CO'.NSUMING SIX MEALS PER DAY
NAME G:LENDA HOWL
DATE
1965 ..
.May 17
May 18 .
. ·· .. •· Ma)7 15 .·
··. M.~Y.}6 .·
··. WEEJ{l. y tOTAL
. ~AN. DAILY·. I'.liTAKE ... ·· ;· ,., ..
CALCQiATEQ DIET.
DAY
Monday
Tuesday
Wednesdaf
Thursday ..
Friday.
Saturday
WEEK 7
PRO'l?EIN gm.
.· 83.
. ··83
68
51
81
83
449 ..
8·2
. 83
..
FAT CHO CALORIES gm. gm,
80 •187 . 1735··
80 187 1735
65 .169 · 1465
40 117 1050 .t.
80· . ·. 206. 1900 . ..
80 187 1735.
425 1053 ~620.
77 191 1749
80 .. 186. 1730

122
WEEKLY SUMMARY OF FOOD mTAKE FOR SUBJECTS CONSUMING SIX MEALS PER DAY
NAME ·MARGARET ANN MORGAN WEEK 7
DATE DAY PROTEIN FAT CHO CALORIES . . 196~ ~· gm. gm_ •
May 17 Monday 81 · 45 126' · 1270
_May. 1.8 Tue$day 74 40 .127 l:1,95
May .19 Wednesday.· 82· 65 119 1350.
.May 20 Thursday 81 65 116 1400
May 21 .. Friday 49 35 72 815
Ma;y 15 Satu;rday 81 '50 126 1315
May 16 Sunday 64 45 110 1125
WEEKLY TOTAL 512 345 796 8470 .· . ..
. • MEAN DAILY .INTAKE · · 79 53 122. .1303.
CALCULATED DIET ·81 50 126 1300
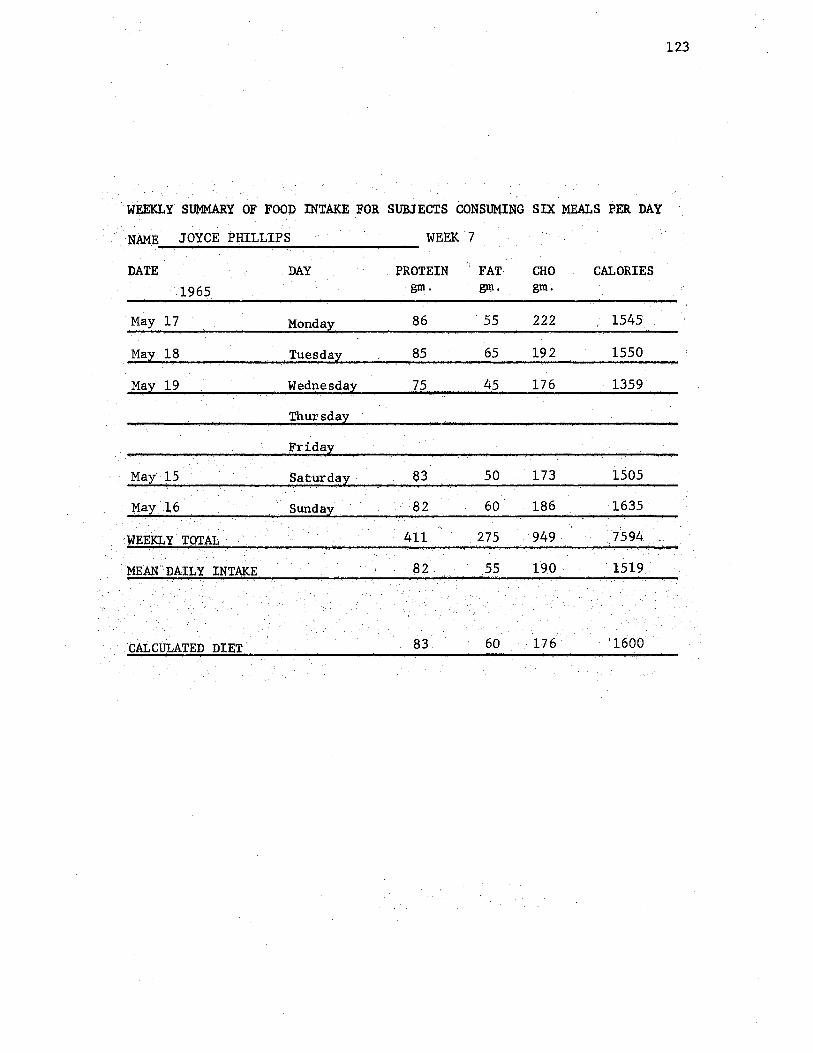
123
WE:EKLY S~Y OF FO~D INTAKF; Ji'OR SUBJECTS CONSUM;ING SIX ~S PER DAY . ·. . ..
. ... NAME JOYCE P}ll:Ll,IPS WEEK ·7
l)ATE . DAY.· . :j:>ROTEIN n
FAT CHO CALORIES
~· gm. gm,
May 17 Mop.d~y . 86 55 222 1545
May 18 Tuesday 85 65 192 1550
*8y 19 · Wednesday 75 45 176 1359'
Thur~day · ..
:Friday ...
·· May 15 .··. Satt1rday •.. 83 50 173 1505
· ~ay 16 ,. £·.
Sunday· .. · 82 60 186 1635
7594 ..
· 4.11 275 949 WEEl<t y TOTAL .·· .. . . . . .
. MEAlf DAti y INTAKE .... ',
82 .55 19.0 ·1519··
·. CALCULATED DIET 83 60 '1600

VITA
Vella Marie B1.1rns
Candidate for the Degree of
Master of Science
Thesis: INFLUENCE OF THREE MEALS VERSUS SIX MEALS PER DAY ON RATE OF BODY METABOLISM
Major Field: Food, Nutrition and Institution Administration
Biographi~al:
Personal Data: Born in Stillwater, Oklahoma, December 27, 1928, the daughter of Delmar Hoyt and Fannie Marie Cummins.
Education: Attended Jefferson Grade School in Stillwater, Oklahoma; graduated from Stillwater High School in 1946; received the Bachelor of Science degree from· the Oklahoma State University, with a major in Food, Nutrition and Institution Administration, in May, 1957; .completed Dietetic Internship at Hines Veteran's Administration Hospital in September, 1958; completed requirements for Master of Science degree, with. a major in Food, Nutrition and Institution Administration, in August, 1965.
Professional Experience; Upon completion of the internship, a position was accepted at the Fort Lyon Veteran's Administration Hospital as Clinic Dietitian unti,1 April, 1960; in June, 1960 accepted the position as Chief Dietitian at the Mennonite Hospital and Nursing Home at La Junta, Colorado; since September, 1964 to June, 1965, worked as Graduate Assistant Nutritionist for the Preschool Laboratories at Oklahoma State University, Stillwater, Oklahoma, Department of Family Relations and Child Development. Since June 1965 to the present have been employed as the Nutritionist for these Preschool Laboratories.