Solid phase microextraction–comprehensive two-dimensional gas chromatography–time-of-flight mass...
13
TomƁÐ C ˇ ajka 1 Jana HajÐlovƁ 1 Jack Cochran 2 Kater ˇina HoladovƁ 1 Eva KlimƁnkovƁ 1 1 Institute of Chemical Technology, Department of Food Chemistry and Analysis, Prague, Czech Republic 2 LECO Corporation, Las Vegas, NV, USA Original Paper Solid phase microextraction–comprehensive two- dimensional gas chromatography–time-of-flight mass spectrometry for the analysis of honey volatiles Head-space solid phase microextration (SPME), followed by comprehensive two- dimensional gas chromatography – time-of-flight mass spectrometry (GC 6 GC– TOFMS), has been implemented for the analysis of honey volatiles, with emphasis on the optimal selection of SPME fibre and the first- and second-dimension GC capil- laries. From seven SPME fibres investigated, a divinylbenzene/Carboxen/polydime- thylsiloxane (DVB/CAR/PDMS) 50/30 lm fibre provided the best sorption capacity and the broadest range of volatiles extracted from the headspace of a mixed honey sample. A combination of DB-5ms 6 SUPELCOWAX 10 columns enabled the best reso- lution of sample components compared to the other two tested column configura- tions. Employing this powerful analytical strategy led to the identification of 164 volatile compounds present in a honey mixture during a 19-min GC run. Combina- tion of this simple and inexpensive SPME-based sampling/concentration technique with the advanced separation/identification approach represented by GC 6 GC– TOFMS allows a rapid and comprehensive examination of the honey volatiles pro- file. In this way, the laboratory sample throughput can be increased significantly and, at the same time, the risk of erroneous identification, which cannot be avoided in one-dimensional GC separation, is minimised. Keywords: Comprehensive two-dimensional gas chromatography (GC 6 GC) / Honey / Solid phase microextration (SPME) / Time-of-flight mass spectrometry (TOFMS) / Volatiles / Received: October 9, 2006; revised: November 30, 2006; accepted: December 6, 2006 DOI 10.1002/jssc.200600413 1 Introduction Traditionally, the botanical and geographical origin of honey is determined by analysis of its pollen [1]. This rather time-consuming strategy, based on the identifica- tion of pollen particles by microscopic examination, requires a skilled analyst. Moisture, content of 5-(hydro- xymethyl)furan-2-carbaldehyde, invertase and diastase activity, sugar composition, electrical conductivity, and proline content are parameters also considered in honey characterisation [1, 2]. In addition to these , classic’ approaches, examination of the volatiles profile might be considered as a strategy enabling honey authentica- tion. Honey composition (including volatiles) is known to vary widely with floral origin and handling [3]. It should be noted that the isolation of volatiles from a complex mixture such as honey is not so straightforward as for other matrices. The commonly used simultaneous distillation-extraction (SDE) procedure is not applicable in this particular case since it may lead to formation of artefacts due to thermal degradation of sugars. Although the extent of these processes can be reduced by conduct- ing the distillation under reduced pressure, the draw- backs such as a use of organic solvents, labour, and time demands are not eliminated [1]. In this context the use of solid phase microextraction (SPME) represents a unique solution. This solvent-free, inexpensive sampling technique enables isolation of a wide range of analytes present in honey by their extrac- tion from its headspace and concentration in the fibre coating. In the next step, thermal desorption of Correspondence: Professor Jana HajÐlovƁ, Institute of Chemical Technology, Prague, Department of Food Chemistry and Anal- ysis, TechnickƁ 3, Prague, 166 28, Czech Republic. E-mail: [email protected] Fax: +420-220 443 185 Abbreviations: 1D-GC, one-dimensional GC; FID, flame-ionisa- tion detector; GC 6 GC, comprehensive two-dimensional GC; MDGC, multidimensional GC; lECD, microelectron capture de- tector; RI, retention index; SDE, simultaneous distillation–ex- traction; SPME, solid phase microextration; TOFMS, time-of- flight mass spectrometry i 2007 WILEY-VCH Verlag GmbH & Co. KGaA, Weinheim www.jss-journal.com 534 T. C ˇ ajka et al. J. Sep. Sci. 2007, 30, 534 – 546
-
Upload
independent -
Category
Documents
-
view
0 -
download
0
Transcript of Solid phase microextraction–comprehensive two-dimensional gas chromatography–time-of-flight mass...
Tom�РCajka1
Jana HajÐlov�1
Jack Cochran2
Katerina Holadov�1
Eva Klim�nkov�1
1Institute of ChemicalTechnology, Department of FoodChemistry and Analysis, Prague,Czech Republic
2LECO Corporation, Las Vegas,NV, USA
Original Paper
Solid phase microextraction–comprehensive two-dimensional gas chromatography–time-of-flightmass spectrometry for the analysis of honeyvolatiles
Head-space solid phase microextration (SPME), followed by comprehensive two-dimensional gas chromatography–time-of-flight mass spectrometry (GC6GC–TOFMS), has been implemented for the analysis of honey volatiles, with emphasison the optimal selection of SPME fibre and the first- and second-dimension GC capil-laries. From seven SPME fibres investigated, a divinylbenzene/Carboxen/polydime-thylsiloxane (DVB/CAR/PDMS) 50/30 lm fibre provided the best sorption capacityand the broadest range of volatiles extracted from the headspace of a mixed honeysample. A combination of DB-5ms6SUPELCOWAX 10 columns enabled the best reso-lution of sample components compared to the other two tested column configura-tions. Employing this powerful analytical strategy led to the identification of 164volatile compounds present in a honey mixture during a 19-min GC run. Combina-tion of this simple and inexpensive SPME-based sampling/concentration techniquewith the advanced separation/identification approach represented by GC6GC–TOFMS allows a rapid and comprehensive examination of the honey volatiles pro-file. In this way, the laboratory sample throughput can be increased significantlyand, at the same time, the risk of erroneous identification, which cannot be avoidedin one-dimensional GC separation, is minimised.
Keywords: Comprehensive two-dimensional gas chromatography (GC6GC) / Honey / Solid phasemicroextration (SPME) / Time-of-flight mass spectrometry (TOFMS) / Volatiles /
Received: October 9, 2006; revised: November 30, 2006; accepted: December 6, 2006
DOI 10.1002/jssc.200600413
1 Introduction
Traditionally, the botanical and geographical origin ofhoney is determined by analysis of its pollen [1]. Thisrather time-consuming strategy, based on the identifica-tion of pollen particles by microscopic examination,requires a skilled analyst. Moisture, content of 5-(hydro-xymethyl)furan-2-carbaldehyde, invertase and diastaseactivity, sugar composition, electrical conductivity, andproline content are parameters also considered in honey
characterisation [1, 2]. In addition to these ,classic’approaches, examination of the volatiles profile mightbe considered as a strategy enabling honey authentica-tion. Honey composition (including volatiles) is knownto vary widely with floral origin and handling [3].
It should be noted that the isolation of volatiles from acomplex mixture such as honey is not so straightforwardas for other matrices. The commonly used simultaneousdistillation-extraction (SDE) procedure is not applicablein this particular case since it may lead to formation ofartefacts due to thermal degradation of sugars. Althoughthe extent of these processes can be reduced by conduct-ing the distillation under reduced pressure, the draw-backs such as a use of organic solvents, labour, and timedemands are not eliminated [1].
In this context the use of solid phase microextraction(SPME) represents a unique solution. This solvent-free,inexpensive sampling technique enables isolation of awide range of analytes present in honey by their extrac-tion from its headspace and concentration in the fibrecoating. In the next step, thermal desorption of
Correspondence: Professor Jana HajÐlov�, Institute of ChemicalTechnology, Prague, Department of Food Chemistry and Anal-ysis, Technick� 3, Prague, 166 28, Czech Republic.E-mail: [email protected]: +420-220 443 185
Abbreviations: 1D-GC, one-dimensional GC; FID, flame-ionisa-tion detector; GC6GC, comprehensive two-dimensional GC;MDGC, multidimensional GC; lECD, microelectron capture de-tector; RI, retention index; SDE, simultaneous distillation–ex-traction; SPME, solid phase microextration; TOFMS, time-of-flight mass spectrometry
i 2007 WILEY-VCH Verlag GmbH & Co. KGaA, Weinheim www.jss-journal.com
534 T. Cajka et al. J. Sep. Sci. 2007, 30, 534 – 546
J. Sep. Sci. 2007, 30, 534 – 546 Gas Chromatography 535
absorbed/adsorbed headspace components in a hot GCinjection port follows [4, 5].
Regarding GC methods for the separation of honeyvolatiles, conventional one-dimensional GC is frequentlyused with separation on long narrow-bore columns. Typi-cally analysis times of 30 –90 min are required to achieveacceptable chromatographic resolution of eluted com-pounds [3, 6–11]. Due to the complexity of honey aroma,co-elution of some volatiles present in the sample mayoccur. Under these conditions, multidimensional GC(MDGC) represents a conceivable solution. While theolder heart-cutting approach allows examination of onlya few narrow fractions of the first column eluate [12, 13],comprehensive two-dimensional gas chromatography(GC6GC) introduced into routine laboratory use onlyrecently permits an efficient separation of the entiresample [14, 15]. In GC6GC, two GC separations, bothwith different separation mechanisms, are applied forcharacterisation of a sample. In most cases, separation ofthe sample components starts on a non-polar (narrow-bore) capillary GC column (typically 15–30 m60.25–0.32 mm internal diameter60.1–1 lm film thickness)where separation of analytes takes place according totheir volatility (i. e. their vapour pressure). Slicing andrefocusing of adjacent fractions of the first-column elu-ate by an interfacing device called a modulator occurscontinuously. These fractions are then released into ashort microbore capillary column (typically 0.5–2 m60.1 mm internal diameter60.1 lm film thickness)employing specific interaction such as hydrogen bond-ing, p-p-interaction, steric effects, etc., for separation [15,16]. On the latter column very fast separation occurs,resulting in extremely narrow peak widths of 50–500 ms. These second dimension peaks therefore requirea detector with acquisition rate in a range of 40–400 Hz,which provides 20 data points across a peak.
This criterion is partially met by, e. g., flame-ionisation(FID) and/or microelectron capture (lECD) detectors butnone of them provides structural information of thekind needed for reliable compound identification [15,17]. Recent progress in instrumentation design as well asthe use of fast recording electronics led to introductionof a high-speed time-of-flight mass spectrometer(HSTOFMS). This detector allows collection of the data atacquisition rates up to 500 spectra/s, which is sufficientfor reconstruction of very narrow peaks typically pro-duced by GC6GC [15, 17, 18].
The objective of this study was to develop a SPME-basedprocedure for the isolation of honey volatiles followed bytheir separation/detection/identification by means of theGC6GC–TOFMS technique. In this way, fast and compre-hensive characterisation of the honey aroma profile canbe obtained. To our knowledge, such an analyticalapproach has not yet been applied in the analysis of this
complex commodity. The paper documents the potentialof this challenging technique for its application in vari-ous follow-up studies including traceability of honey ori-gin and authentication.
2 Experimental
2.1 Materials
The honey samples examined originated from variouslocalities (Austria, Brazil, Czech Republic, France, Italy,Slovakia). For the purpose of the validation study, a mix-ture of honey samples was prepared to obtain test mate-rial with complex aroma.
The SPME fibres tested were: (i) 100 lm polydimethyl-siloxane (PDMS); (ii) 65 lm polydimethylsiloxane/divi-nylbenzene (PDMS/DVB); (iii) 85 lm polyacrylate (PA);(iv) 75 lm Carboxen/polydimethylsiloxane (CAR/PDMS);(v) 65 lm Carbowax/divinylbenzene (CW/DVB), and (vi)50/30 lm divinylbenzene/Carboxen/polydimethylsilox-ane (DVB/CAR/PDMS). All of them were supplied bySupelco (Bellefonte, PA, USA). Prior to use, all fibres wereconditioned following the manufacturer's recommenda-tions.
The columns used for GC6GC experiments compriseda DB-5ms, 5% phenyl polysilphenylenesiloxane (J&WScientific, Folsom, CA, USA) primary column;30 m60.25 mm id60.25 lm film thickness, coupled via acolumn connector (Agilent, Palo Alto, CA, USA) to eithera BPX-50, 50% phenyl polysilphenylenesiloxane (SGE,Austin, TX, USA) or a SUPELCOWAX 10, polyethylene gly-col (Supelco, Bellefonte, PA, USA) second column ofdimensions 1.25 m60.1 mm id60.1 lm film thickness.For further comparison, a GC configuration consisting ofan HP-INNOWax, polyethylene glycol (Agilent, Palo Alto,CA, USA) primary column; 30 m60.25 mm id60.25 lmfilm thickness, coupled via a column connector to a BPX-50, 50% phenyl polysilphenylenesiloxane, 1.25 m60.1 mm id60.1 lm film thickness, was employed.
A mixture of n-alkanes (C8 –C20) dissolved in n-hexanewas supplied by Supelco (Bellefonte, PA, USA) for reten-tion index determinations. The calculation was done forcomponents eluting between n-octane and n-eicosane.For compounds with RIs a800 extrapolation usingn-octane and n-nonane was employed.
2.2 Sample preparation
Honey sample (2 g) was introduced into a 10-mL vial forSPME; after adding 2 mL of distilled water (standardisa-tion of water content), the vial was sealed with a mag-netic cap with PTFE/silicon septum and vortexed untilcomplete homogenisation.
i 2007 WILEY-VCH Verlag GmbH & Co. KGaA, Weinheim www.jss-journal.com

536 T. Cajka et al. J. Sep. Sci. 2007, 30, 534 – 546
2.3 Instrumental conditions
A Pegasus 4D instrument consisting of an Agilent 6890Ngas chromatograph equipped with a split/splitless injec-tor (Agilent Technologies, Palo Alto, CA, USA), an MPS2autosampler for automated SPME (Gerstel, M�lheim ander Ruhr, Germany), and a Pegasus III high-speed time-of-flight mass spectrometer (Leco Corp., St. Joseph, MI, USA)was used. Inside the GC oven a cryogenic modulator (N2
jets-hot air jets technology) and a secondary oven (LecoCorp., St. Joseph, MI, USA) were mounted. Resistivelyheated air was used as a medium for hot jets, while coldjets were supplied by gaseous nitrogen cooled by liquidnitrogen.
The operating conditions of the optimised SPME-GC6GC–TOFMS method were as follows: (i) SPME: DVB/CAR/PDMS (50/30 lm) fibre; incubation time: 5 min; incu-bation temperature: 408C; agitator speed: 500 rpm;extraction time: 20 min; desorption temperature: 2508C;desorption time: 45 s (splitless). After 6 min exposure inthe injector the fibre is automatically withdrawn andincubation and extraction of the next sample ensues.(ii) GC6GC: a 30 m60.25 mm id60.25 lm film thicknessDB-5ms column coupled to a 1.25 m60.10 mmid60.10 lm film thickness SUPELCOWAX 10 column; pri-mary oven temperature program: 458C (0.75 min),108C/min to 2008C, 308C/min to 2458C (1.25 min); second-ary oven temperature: +208C above the primary oven tem-perature; modulator offset: +358C above the primary oventemperature; modulation period: 3 s (hot pulse 0.6 s); car-rier gas: helium (purity 99.9999%); column flow:1.3 mL/min. (iii) TOFMS: electron ionisation mode; ionsource temperature: 2208C; mass range: m/z 25 –300;acquisition rate: 300 spectra/s; detector voltage: –1750 V.
For comparison purposes, 1D-GC separation was car-ried out under the same SPME conditions, but withdifferent GC–TOFMS settings, viz. without modulationand employing an acquisition rate of 10 spectra/s fordata collection.
ChromaTOF (LECO Corp.) software (v. 2.31) was usedfor instrument control, data acquisition, and data pro-cessing. Identification of compounds was based on aNIST 2005 mass spectra library search and was furtherconfirmed by comparing, where possible, linear reten-tion indices available in the same library.
3 Results and discussion
3.1 SPME optimisation
All the key parameters such as type of fibre, extractiontime and temperature, and desorption time that mayaffect the SPME extraction efficiency were considered inour study.
Among the fibres investigated (see Section 2.1), theDVB/CAR/PDMS fibre provided, under optimised condi-tions, the best sorption capacity and the broadest rangeof volatiles extracted from the headspace of honey sam-ples. The superiority of DVB/CAR/PDMS fibre extractionperformance is illustrated in Fig. 1.
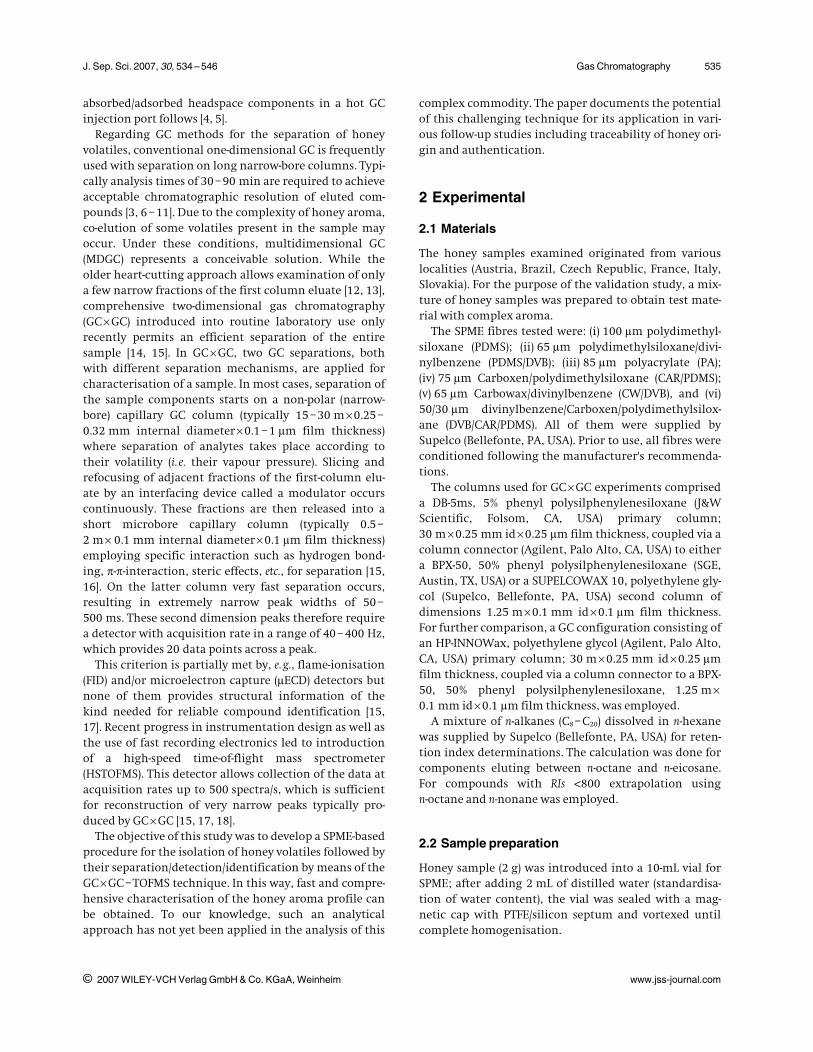
Extraction temperatures between 30 and 908C with a20 min extraction period (+5 min incubation time atselected temperature) were employed to test DVB/CAR/PDMS fibre sorption efficiency. As shown in Fig. 2A, formost of the volatiles selected, an increase in extractiontemperature up to 70–808C led to a growth in signalintensity. However, it is rather difficult (or even impossi-ble) to distinguish whether the increased signal resultsfrom enhanced transfer of analytes into the headspacedue to increased volatility, or whether the formation ofparticular compounds from precursors present in honeysamples is enhanced. To elucidate these phenomena,honey samples were conditioned at temperaturesbetween 30 and 908C for 25 min and, after cooling, vola-tiles were extracted at 308C. Significantly differentGC6GC–TOFMS profiles of volatiles (changes in theirrelative abundances) were observed for those samples
i 2007 WILEY-VCH Verlag GmbH & Co. KGaA, Weinheim www.jss-journal.com
Figure 1. Relative distribution of selected vola-tile compounds (according to their elution) iso-lated by SPME from honey using various fibrecoatings. For each compound the sum of signalintensities obtained using all tested fibres wasused for calculation of their relative response.
J. Sep. Sci. 2007, 30, 534 – 546 Gas Chromatography 537
that were conditioned at temperatures above 608C.Therefore, in the final method, 408C was selected as acompromise to avoid artefact formation and GC columnand detector overflow.
Extraction times of 5, 10, 20, 30, 40, and 60 min weretested at 408C. As Fig. 2B shows, the detector signalincreased with increasing extraction time for most of thevolatile compounds. However, the detection sensitivitydid not appear to be a limiting factor, and for this reasononly 20 minutes' extraction was used in subsequentexperiments to enable reasonable sample throughput.
Desorption times of 15, 30, 45, 60, and 90 s were testedat an injector temperature of 2508C (Fig. 2C). A time of45 s was chosen as an acceptable compromise betweenthe complete desorption of almost all volatiles and avoid-ance of peak distortion of early eluting, low boiling pointanalytes, which may occur at longer desorption times.
The repeatability of the optimised SPME–GC6GC–TOFMS procedure was evaluated by repetitive analyses ofa honey sample. A series of ten consecutive SPME sam-plings gave RSDs ranging from 3.1 to 12% for selectedrepresentative volatile compounds (see Table 1).
3.2 GC6GC optimisation
3.2.1 Selection of first- and second-dimensioncolumn for GC6GC separation
In most of the studies concerned with GC analysis ofhoney volatiles, either polar (polyethylene glycol) or non-polar (5%-phenyl-methylpolysiloxane) columns wereused for their separation [3, 4, 7–11]. As mentioned ear-lier, to overcome coelution problems, an increased GCresolution is a conceivable solution. With regard to a gen-erally good thermal stability (low bleed and hence rela-tively high upper temperature limit), a widely used 5%phenyl polysilphenylenesiloxane (DB-5ms) capillary col-umn was chosen for the first dimension volatility-basedseparation of sample components. Being aware of therequirement for employing a substantially different sep-aration principle in the second dimension to obtain an
,orthogonal’ GC system, (i) medium-polar (50% phenylpolysilphenylenesiloxane, BPX-50), and (ii) polar (poly-ethylene glycol, SUPELCOWAX 10) columns were used.
Since the second dimension separation has to be fastenough to enable rapid introduction of the modulatedfractions from the first-dimension column [15], veryshort microbore capillaries were installed for our experi-ments. As the result of fairly distinct analyte-stationaryphase interactions, widely differing separation patternsof honey volatiles were obtained in the tested GC6GC sys-tems; for sake of comparison, see contour plots in Fig. 3.
For instance, the specific interaction of the polyethy-lene glycol (SUPELCOWAX 10) column resulted in astrong retention of polar volatiles such as furan-2,5-di-
i 2007 WILEY-VCH Verlag GmbH & Co. KGaA, Weinheim www.jss-journal.com
Figure 2. Effect of (A) SPME extraction (sampling) tempera-ture (extraction time 20 min), (B) extraction time (extractiontemperature 408C), and (C) desorption time (extraction time20 min, extraction temperature 408C, and desorption tem-perature 2508C) on the signal of selected honey volatiles.DVB/CAR/PDMS fibre used in all experiments.
538 T. Cajka et al. J. Sep. Sci. 2007, 30, 534 – 546
carbaldehyde, phenylmethanol, 2-phenylethanol, andfuran-2-carbaldehyde with second-dimension retentiontimes (2tR) 2.60, 2.29, 1.88, and 1.59 s, respectively, com-pared to 2tR 1.31, 1.13, 1.13, and 1.08 s, respectively, inthe configuration with the BPX-50 column (Figs. 3A and3B).
In addition to this ,orthogonal’ separation approachusing non-polar6(medium-)polar column set-ups,reversed-type column combination was tested employinga polar narrow-bore column (polyethylene glycol, HP-INNOWax) and a medium-polar microbore column (50%phenyl polysilphenylenesiloxane, BPX-50), see Fig. 3C.While under these conditions, the separation in the firstdimension is mainly based on the polarity of the mole-cules, the additional separation on the 50% phenyl poly-silphenylenesiloxane stationary phase relies on the speci-fic interaction of analytes (i. e. separation in the secondcolumn proceeds according to both polarity and volati-lity). This ,non-orthogonal’ approach provided classes ofcompounds substantially differing from the two pre-vious ( ,orthogonal’) GC6GC systems.
3.2.2 Temperature program and modulationperiod optimisation
In GC6GC, the temperature-programming rate influ-ences the separation in both the first- and the second-dimension columns; thus, the setting of optimal modula-tion time is also affected. Maintenance of the first-col-umn separation in the second dimension is possible onlyif the peak is modulated at least four times [19]. This mod-ulation criterion can be met by using less steep tempera-ture programming (0.5–58C/min) compared to a conven-tional GC separation [15, 20]. However, using a slowertemperature gradient generally results in a GC runexceeding one or even two hours. On the other hand,peaks eluting from the first dimension under fast tem-perature programming conditions are too narrow; thus,a lower number of modulated fractions is obtained. Inmost cases the loss of first-dimension separation is more
than compensated by the separation provided in the sec-ond dimension; thus, peaks eluted from the first columncan be modulated even less than dictated by the modula-tion criterion [20].
Four temperature gradients (5, 10, 20, and 308C/min)were evaluated for the DB-5ms6SUPELCOWAX 10 col-umn combination. The optimum was found at 108C/min(with steeper gradients the loss of resolution was tooextensive). Under these optimised conditions, a 3-secondmodulation period was used, which resulted, in mostcases, in two modulations of the first-dimension peak.
Availability of two independently controlled ovensenabled us to tune the retention power and selectivity ofthe second column. In this context, the key optimisedparameter was the temperature offset between the twoovens during the gradient run. The optimal values oftemperature offset between first and second oven for theDB-5ms6BPX-50, DB-5ms6SUPELCOWAX 10, and HP-INNOWax6BPX-50 were 5, 20, and 58C, respectively. Thissetting avoided so-called ,wrap-around’, i. e. elution ofmore retained compounds at retention times higherthan the modulation period. These ,wrapped around’peaks can be eliminated either by using a longer modula-tion period, or by using a higher second-dimension col-umn temperature offset. In any case, improper param-eters setting can lead to a lower chromatographic resolu-tion and overall distortion of the generated chromato-gram. With optimised values introduced in our study,acceptable 2tR a 3 s were attained for honey volatiles withthe exception of methoxy-phenyl oxime in the DB-5ms6SUPELCOWAX 10 column combination. This com-pound was eluted at 2tR = 0.28 s after finishing a 3-secondmodulation period.
3.3 Comparison of 1D-GC vs. GC6GC
1D-GC–TOFMS analyses were compared with GC6GC–TOFMS analyses with the aim of confirming the expecta-tion of superiority of GC6GC–TOFMS: (i) higher peak capa-
i 2007 WILEY-VCH Verlag GmbH & Co. KGaA, Weinheim www.jss-journal.com
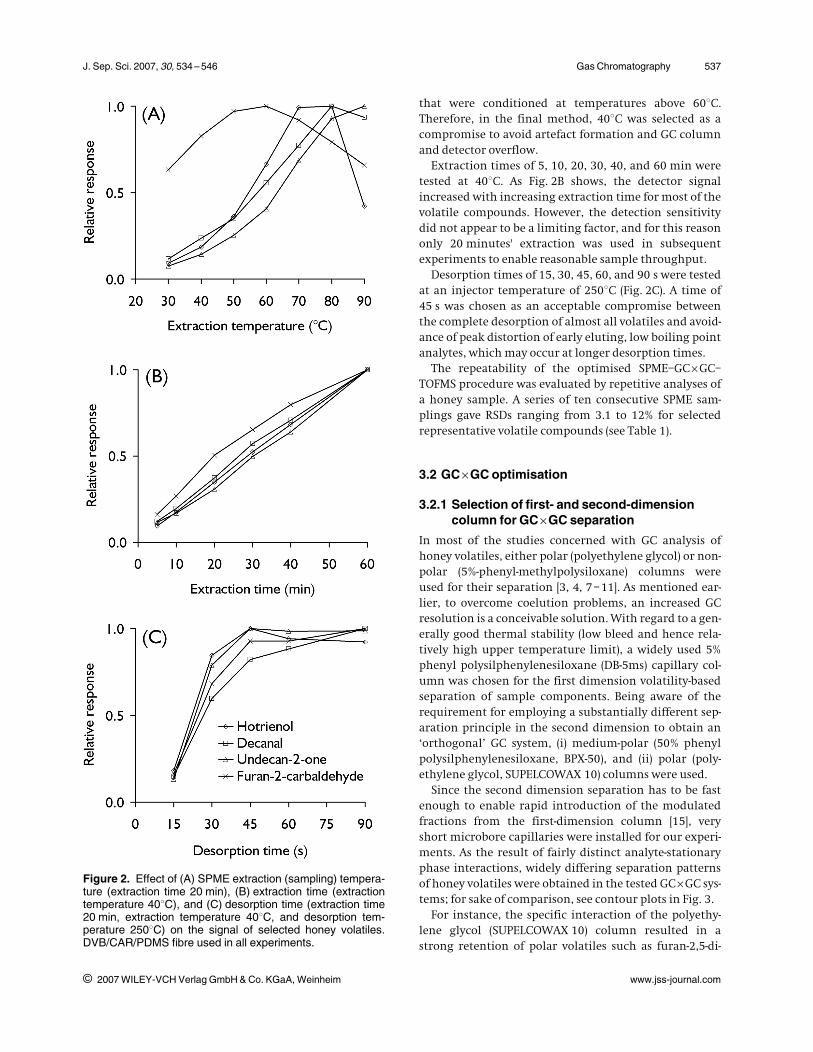
Table 1. Analytical data of selected volatiles isolated from honey.
Compound Unique mass(m/z)
RI 1tR (s) 2tR (s) RSD of peak area,n = 10 (%)
Furan-2-carbaldehyde 95 836 405 1.59 3.9Benzaldehyde 50 972 530 1.43 6.4Oct-1-en-3-ol 57 981 539 1.04 5.2Limonene 93 1038 592 0.76 8.6Ethyl heptanoate 101 1068 620 0.80 12Linalool oxide (isomer I) 111 1077 628 0.93 7.7Linalool 121 1104 653 0.98 9.0Hotrienol 82 1106 655 1.07 3.12-Phenylethanol 92 1123 670 1.88 4.9Isophorone 82 1134 680 1.09 4.8Lilac aldehyde (isomer II) 69 1159 701 0.97 7.6Decanal 57 1208 746 0.84 5.1

J. Sep. Sci. 2007, 30, 534 – 546 Gas Chromatography 539
i 2007 WILEY-VCH Verlag GmbH & Co. KGaA, Weinheim www.jss-journal.com
Figure 3. Separation of honey volatiles indifferent GC6GC–TOFMS systems consistingof following capillary columns: (A) DB-5ms6SUPELCOWAX 10, (B) DB-5ms6BPX-50,and (C) HP-INNOWax6BPX-50.

540 T. Cajka et al. J. Sep. Sci. 2007, 30, 534 – 546
city, which is a result of the combination of two GC col-umns with different independent separation mechan-isms; (ii) improvement of S/N ratio due to re-focusing of theanalyte in the modulator and improved separation ofchemical noise in the GC6GC system; and (iii) formation ofstructured chromatograms thanks to complementary sep-aration mechanisms occurring on both columns [15].
Our experience has shown that a deep understandingof data generated under real life conditions is needed toexploit these theoretical assumptions. For instance, if afaster GC run is used, one should be aware that the first-column separation could be annulled during the modu-lation process, as illustrated in Fig. 4. In 1D-GC, honey
volatiles corresponding to peaks no. 2, 3, and 6 were base-line separated (Fig. 4A). Since the respective peaks elutedfrom the first column were modulated only twice, theyunderwent recombination during the modulation pro-cess and were co-injected onto the second-dimension col-umn. Under these circumstances, the separation accom-plished in the first column was lost. However, because ofdifferent activity coefficients on the second column(polyethylene glycol phase), they were completely sepa-rated (with higher chromatographic resolution than inthe case of 1D-GC) in the second dimension on this typeof column (Fig. 4B). Regarding the peak (X) in Fig. 4A, thiswas identified in the 1D-GC system by a library search as3-methyl-cyclopentanol, but with a low spectral match(764). In GC6GC, two individual compounds (hotrienoland nonanal) were separated and each of them identifiedwith somewhat higher spectral matches of 863 and 893,respectively. This example illustrates the risk of erro-neous identification of compounds with very similarretention times in 1D-GC when the application of spec-tral deconvolution may fail. Nonan-2-ol and linalool,compounds seen in Fig. 4B to be co-eluted (5+6), were suc-cessfully deconvoluted and identified under the experi-mental conditions of GC6GC.
Compared to 1D-GC analysis, the GC6GC systemshowed not only improved separation of volatiles amongeach other but also better detectability, as documentedby the S/N enhancement factors and spectral matches(similarity) for selected honey volatiles (Table 2). The for-mation of structured chromatograms was observed forboth (substantially different) column set-ups tested inour study. While in ,orthogonal’ systems (i. e. DB-5ms6BPX-50 and DB-5ms6SUPELCOWAX 10) the vola-tile compounds were separated in the second dimensionaccording to polarity, honey volatiles in the ,non-ortho-gonal’ system (HP-INNOWax6BPX-50) were separated inreversed order. As discussed in several other studies con-cerned with this area [15–17], these structured chroma-tograms are a useful additional tool for confirmation ofanalyte identity tentatively deduced on the basis of massspectra and RI (the physico-chemical properties typicalfor homologous series of compound classes are consid-ered).
3.4 Identification of honey volatiles
Data collected during the SPME–GC6GC–TOFMS analysisof honey samples were deconvoluted in the first phaseusing ChromaTOF software, which allows separation ofpartially co-eluting peaks. The deconvolution algorithmis based on the fact that there are no changes in the ratiosof analyte ions across the peak during the acquisition ofthe mass spectrum and, consequently, no spectral skewis encountered. The obtained ,pure’ mass spectra of indi-
i 2007 WILEY-VCH Verlag GmbH & Co. KGaA, Weinheim www.jss-journal.com
Figure 4. Comparison of separation of selected honey vola-tiles in two GC systems: (A) 1D-GC–TOFMS, and (B)GC6GC–TOFMS (DB-5ms6SUPELCOWAX 10 columns).Marked compounds: (1) nonan-2-one; (2) linalool oxide;(3) dehydro-p-cymene; (4) undecane; (5) nonan-2-ol;(6) linalool; (7) terpinolen; (8) hotrienol; (9) nonanal; (X) com-plete co-elution of hotrienol and nonanal in 1D-GC system.Compound (7) not identified in 1D-GC. Compounds (5) and(6) partially coeluted in GC6GC.
J. Sep. Sci. 2007, 30, 534 – 546 Gas Chromatography 541
vidual components are then searched against the massspectral database library.
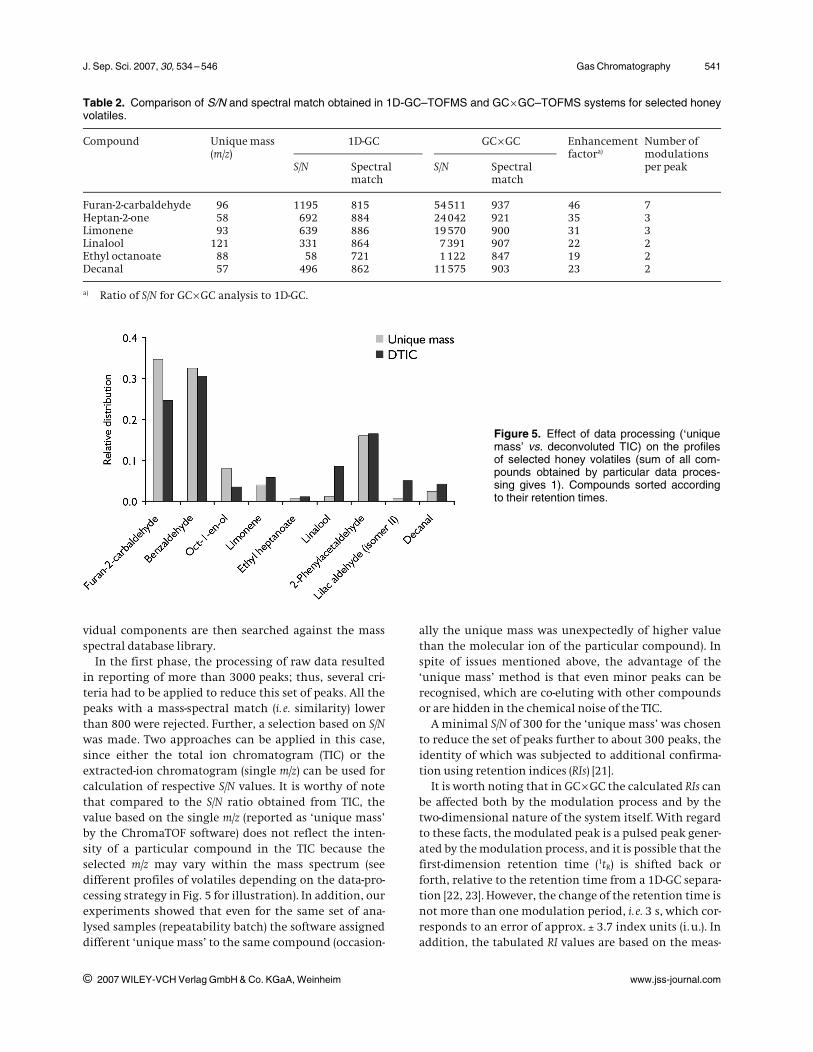
In the first phase, the processing of raw data resultedin reporting of more than 3000 peaks; thus, several cri-teria had to be applied to reduce this set of peaks. All thepeaks with a mass-spectral match (i. e. similarity) lowerthan 800 were rejected. Further, a selection based on S/Nwas made. Two approaches can be applied in this case,since either the total ion chromatogram (TIC) or theextracted-ion chromatogram (single m/z) can be used forcalculation of respective S/N values. It is worthy of notethat compared to the S/N ratio obtained from TIC, thevalue based on the single m/z (reported as ,unique mass’by the ChromaTOF software) does not reflect the inten-sity of a particular compound in the TIC because theselected m/z may vary within the mass spectrum (seedifferent profiles of volatiles depending on the data-pro-cessing strategy in Fig. 5 for illustration). In addition, ourexperiments showed that even for the same set of ana-lysed samples (repeatability batch) the software assigneddifferent ,unique mass’ to the same compound (occasion-
ally the unique mass was unexpectedly of higher valuethan the molecular ion of the particular compound). Inspite of issues mentioned above, the advantage of the
,unique mass’ method is that even minor peaks can berecognised, which are co-eluting with other compoundsor are hidden in the chemical noise of the TIC.
A minimal S/N of 300 for the ,unique mass’ was chosento reduce the set of peaks further to about 300 peaks, theidentity of which was subjected to additional confirma-tion using retention indices (RIs) [21].
It is worth noting that in GC6GC the calculated RIs canbe affected both by the modulation process and by thetwo-dimensional nature of the system itself. With regardto these facts, the modulated peak is a pulsed peak gener-ated by the modulation process, and it is possible that thefirst-dimension retention time (1tR) is shifted back orforth, relative to the retention time from a 1D-GC separa-tion [22, 23]. However, the change of the retention time isnot more than one modulation period, i. e. 3 s, which cor-responds to an error of approx. l 3.7 index units (i.u.). Inaddition, the tabulated RI values are based on the meas-
i 2007 WILEY-VCH Verlag GmbH & Co. KGaA, Weinheim www.jss-journal.com
Table 2. Comparison of S/N and spectral match obtained in 1D-GC–TOFMS and GC6GC–TOFMS systems for selected honeyvolatiles.
Compound Unique mass(m/z)
1D-GC GC6GC Enhancementfactora)
Number ofmodulations
S/N Spectralmatch
S/N Spectralmatch
per peak
Furan-2-carbaldehyde 96 1195 815 54511 937 46 7Heptan-2-one 58 692 884 24042 921 35 3Limonene 93 639 886 19570 900 31 3Linalool 121 331 864 7391 907 22 2Ethyl octanoate 88 58 721 1122 847 19 2Decanal 57 496 862 11575 903 23 2
a) Ratio of S/N for GC6GC analysis to 1D-GC.
Figure 5. Effect of data processing ( ,uniquemass’ vs. deconvoluted TIC) on the profilesof selected honey volatiles (sum of all com-pounds obtained by particular data proces-sing gives 1). Compounds sorted accordingto their retention times.

542 T. Cajka et al. J. Sep. Sci. 2007, 30, 534 – 546
i 2007 WILEY-VCH Verlag GmbH & Co. KGaA, Weinheim www.jss-journal.com
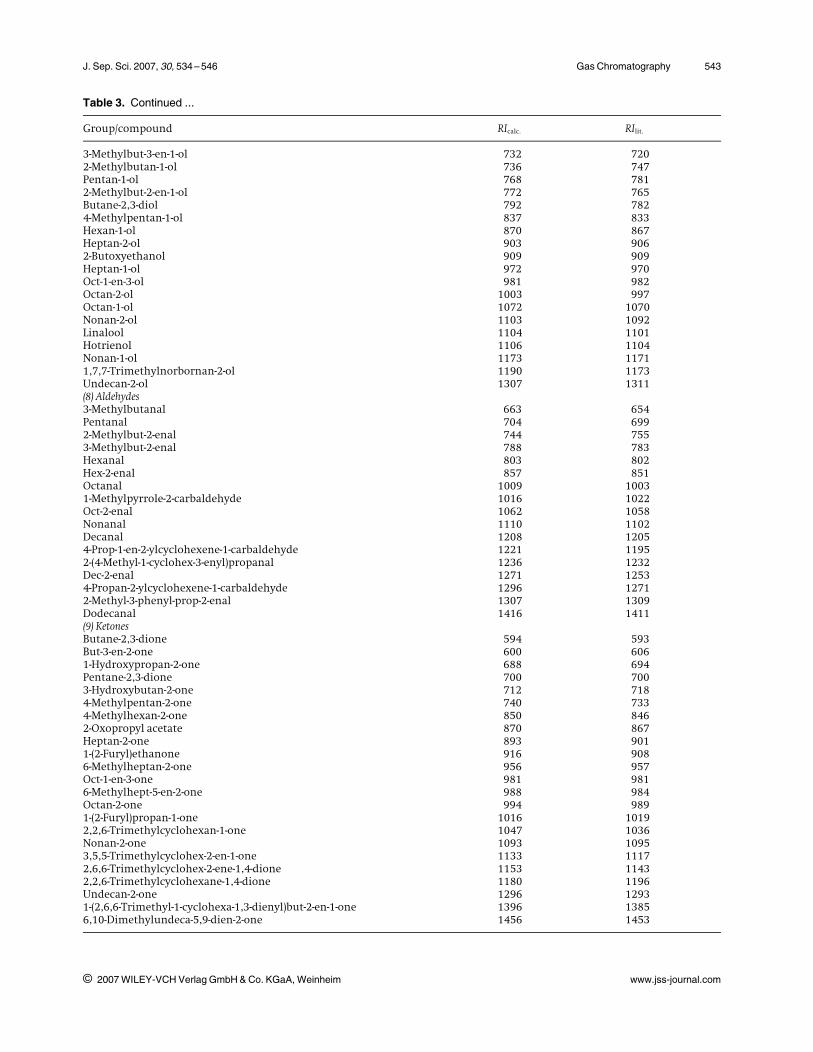
Table 3. Volatile compounds identified by GC6GC–TOFMS, with calculated (RIcalc.) and literature retention data (RIlit.).
Group/compound RIcalc. RIlit.
(1) Acyclic alkanesHexane 600 600Heptane 700 700Octane 800 800Nonane 900 900Decane 1000 1000Undecane 1100 1100Dodecane 1200 1200Tridecane 1300 1300(2) Cyclic alkanesCyclohexane 669 6551-Ethyl-2-methyl-cyclohexane 919 915a-Pinene 994 983(3) Acyclic alkenesOcimene 1050 10402,6-Dimethylocta-1,3,5,7-tetraene 1150 1134Undeca-1,3,5,8-tetraene 1183 11776-But-2-enylidene-1,5,5-trimethyl-cyclohexene (isomer I) 1328 1323a)
6-But-2-enylidene-1,5,5-trimethyl-cyclohexene (isomer II) 1370 1363a)
(4) Cyclic alkenes1-(1-Methylethyl)-4-methylidene-bicyclo[3.1.0]hex-2-ene 966 952a-Phellandrene 1019 1011Limonene 1038 1035Terpinolene 1097 1090Calarene 1460 1460d-Cadinene 1538 1528(5) Aromatic hydrocarbonsEthylbenzene 870 868m-Xylene 880 873Cumene 931 932Propylbenzene 962 9591-Ethyl-2-methyl-benzene 972 9641,2,3-Trimethylbenzene 981 998a-Methylstyrene 994 988p-Cymene 1034 10281-Methyl-3-propyl-benzene 1059 10581,4-Diethylbenzene 1066 1070Dehydro-p-cymene 1100 10911,2,4,5-Tetramethylbenzene 1130 1130Thymol 1293 1290Calamenene 1546 15242,6-Dipropan-2-ylnaphthalene 1752 1728(6) Oxygenated aromaticsMethoxy-phenyl oxime 886 naBenzaldehyde 972 9651-Methoxy-4-methyl-benzene 1031 1020Phenylmethanol 1044 10452-Phenylacetaldehyde 1056 10471-Phenylethanone 1078 10662-Methoxyphenol 1094 10712-Phenylethanol 1123 11131-Ethenyl-4-methoxy-benzene 1163 1159Methyl 2-hydroxybenzoate 1207 11922-Phenylbut-2-enal 1282 12732-Methyl-5-propan-2-yl-phenol 1296 12984-Ethenyl-2-methoxy-phenol 1322 13121,2,3-Trimethoxy-5-methyl-benzene 1400 1408(7) Alcohols2-Methylpropan-1-ol 625 635Butan-1-ol 663 655Pent-1-en-3-ol 681 679Pentan-2-ol 700 710
J. Sep. Sci. 2007, 30, 534 – 546 Gas Chromatography 543
i 2007 WILEY-VCH Verlag GmbH & Co. KGaA, Weinheim www.jss-journal.com
Table 3. Continued ...
Group/compound RIcalc. RIlit.
3-Methylbut-3-en-1-ol 732 7202-Methylbutan-1-ol 736 747Pentan-1-ol 768 7812-Methylbut-2-en-1-ol 772 765Butane-2,3-diol 792 7824-Methylpentan-1-ol 837 833Hexan-1-ol 870 867Heptan-2-ol 903 9062-Butoxyethanol 909 909Heptan-1-ol 972 970Oct-1-en-3-ol 981 982Octan-2-ol 1003 997Octan-1-ol 1072 1070Nonan-2-ol 1103 1092Linalool 1104 1101Hotrienol 1106 1104Nonan-1-ol 1173 11711,7,7-Trimethylnorbornan-2-ol 1190 1173Undecan-2-ol 1307 1311(8) Aldehydes3-Methylbutanal 663 654Pentanal 704 6992-Methylbut-2-enal 744 7553-Methylbut-2-enal 788 783Hexanal 803 802Hex-2-enal 857 851Octanal 1009 10031-Methylpyrrole-2-carbaldehyde 1016 1022Oct-2-enal 1062 1058Nonanal 1110 1102Decanal 1208 12054-Prop-1-en-2-ylcyclohexene-1-carbaldehyde 1221 11952-(4-Methyl-1-cyclohex-3-enyl)propanal 1236 1232Dec-2-enal 1271 12534-Propan-2-ylcyclohexene-1-carbaldehyde 1296 12712-Methyl-3-phenyl-prop-2-enal 1307 1309Dodecanal 1416 1411(9) KetonesButane-2,3-dione 594 593But-3-en-2-one 600 6061-Hydroxypropan-2-one 688 694Pentane-2,3-dione 700 7003-Hydroxybutan-2-one 712 7184-Methylpentan-2-one 740 7334-Methylhexan-2-one 850 8462-Oxopropyl acetate 870 867Heptan-2-one 893 9011-(2-Furyl)ethanone 916 9086-Methylheptan-2-one 956 957Oct-1-en-3-one 981 9816-Methylhept-5-en-2-one 988 984Octan-2-one 994 9891-(2-Furyl)propan-1-one 1016 10192,2,6-Trimethylcyclohexan-1-one 1047 1036Nonan-2-one 1093 10953,5,5-Trimethylcyclohex-2-en-1-one 1133 11172,6,6-Trimethylcyclohex-2-ene-1,4-dione 1153 11432,2,6-Trimethylcyclohexane-1,4-dione 1180 1196Undecan-2-one 1296 12931-(2,6,6-Trimethyl-1-cyclohexa-1,3-dienyl)but-2-en-1-one 1396 13856,10-Dimethylundeca-5,9-dien-2-one 1456 1453

544 T. Cajka et al. J. Sep. Sci. 2007, 30, 534 – 546
i 2007 WILEY-VCH Verlag GmbH & Co. KGaA, Weinheim www.jss-journal.com
Table 3. Continued ...
Group/compound RIcalc. RIlit.
(10) EstersEthyl acetate 613 609Ethyl hexanoate 959 940Ethyl heptanoate 1068 10972-Butoxyethyl acetate 1087 1090Methyl benzoate 1103 1093Ethyl benzoate 1180 1172Ethyl octanoate 1197 1195Ethyl 2-phenylacetate 1250 1243Ethyl 2-hydroxybenzoate 1286 1270Ethyl nonanoate 1296 1296Ethyl decanoate 1396 1391(11) Ethers2,5-Dimethylfuran 708 7012-Methyloxolan-3-one 810 821Furan-2-carbaldehyde 836 8312-Furylmethanol 853 8635-Methyl-3H-furan-2-one 873 8852-Butylfuran 897 892Oxolan-2-one 922 9245-Methyloxolan-2-one 959 9505-Methylfuran-2-carbaldehyde 969 959Eucalyptol 1047 1042Linalool oxide (isomer I) 1077 1076b))Linalool oxide (isomer II) 1091 1091b)
Furan-2,5-dicarbaldehyde 1084 na6-Methyloxan-2-one 1100 10844-Methyl-2-(2-methylprop-1-enyl)oxane 1117 11122-Methylbenzofuran 1123 1109Lilac aldehyde (isomer I) 1148 1146b)
Lilac aldehyde (isomer II) 1159 1154b)
Lilac aldehyde (isomer III) 1172 1169b)
3,5-Dimethyl-4,5,6,7-tetrahydrobenzofuran 1176 1164Lilac alcohol (isomer I) 1210 1211c)
Lilac alcohol (isomer II)d) 1221 1219c)
Lilac alcohol (isomer III)d) 1221 1219c)
Lilac alcohol (isomer IV) 1235 1232c)
5-(Hydroxymethyl)furan-2-carbaldehyde 1266 12565-Butyloxolan-2-one 1268 12622,5,5,8a-Tetramethyl-3,5,6,8a-tetrahydro-2H-chromene 1326 13095-Pentyloxolan-2-one 1370 1360(12) NitrilesBut-3-enenitrile 656 6582-Methylbutanenitrile 717 na3-Methylbutanenitrile 737 731Hexanenitrile 880 8752-Phenylacetonitrile 1150 11423-Phenylpropanenitrile 1250 1246(13) SulphidesMethylsulfanylmethane 565 543Methyldisulfanylmethane 748 747Methylsulfanyldisulfanylmethane 984 984Methyldisulfanyl-methylsulfanyl-methane 1147 1154Methylsulfanylmethylbenzene 1183 1185
Except for a) [27], b) [25], and c) [28] RI data taken from NIST 2005 spectral library.d) Isomers separated in the second dimension.na = data not available.

J. Sep. Sci. 2007, 30, 534 – 546 Gas Chromatography 545
urements on a single column with defined polarity. Inour study, this ,reference’ was 5%-phenyl-methylpolysi-loxane (or its equivalents). The polyethylene glycol-basedsecond column affects the retention of eluted compoundsdepending on their polarity, which unavoidably shiftsthe RIs to the larger values than the literature values.Further, the level of interlaboratory reproducibility ofexperimental RI determination varies by about 10 i.u.[24]. Taking these facts into account, the maximum abso-lute RI difference accepted in this study, compared withthe available literature values, was 30 i.u. Employingthese criteria enabled us to identify a total of 164 com-pounds in a mixture of honey samples (Table 3). Thesechemicals represent various structural classes including:acyclic alkanes, cyclic alkanes, acyclic alkenes, cyclic
alkenes, aromatic hydrocarbons, oxygenated aromatics,alcohols, aldehydes, ketones, esters, ethers, nitriles, andsulphides. Among them, alcohols, aldehydes, ketones,and ethers represented the main groups of honey vola-tiles. The number of compounds identified using theGC6GC system was somewhat higher than found in
,classic’ studies that employed 1D-GC set-ups, in whichcase 35–110 volatiles were reported [3, 7–11, 25, 26]. Anadditional beneficial outcome of this (GC6GC) approachis the possibility of reducing the analysis time. Separationof the sample components is complete within 19 min-utes, which is approx. 1.6–4.6-times less than in pre-viously published conventional GC methods [3, 7–11, 25,26]. It is also worthy of note that a quadrupole mass analy-ser operated in full scan mode was used for detection of
i 2007 WILEY-VCH Verlag GmbH & Co. KGaA, Weinheim www.jss-journal.com
Figure 6. GC6GC chromatograms of vola-tiles isolated by SPME from floral honey ori-ginating from France (A) Carpentras, and (B)Corsica. Major components: (1) 2-methylbut-2-enal, (2) octane, (3) hexanal, (4) furan-2-carbaldehyde, (5) hexan-1-ol, (6) heptanal,(7) heptan-1-ol, (8) benzaldehyde, (9) octa-nal, (10) 2-phenylacetaldehyde, (11) dehy-dro-p-cymene, (12) hotrienol, (13) nonanal,(14) decanal; (15) 3-methylbut-2-enal;(16) oct-1-en-3-ol; (17) lilac aldehyde iso-mers.

546 T. Cajka et al. J. Sep. Sci. 2007, 30, 534 – 546
honey volatiles in those studies on non-target screening.Compared to TOFMS, which allows simultaneous acquisi-tion of full mass spectra even at very low concentration ofparticular compounds (due to the high mass analyser effi-ciency), the quadrupole mass analyser generally suffersfrom insufficient sensitivity when operated in full scanmode [18]. This limitation undoubtedly explains thelower number of detected compounds as compared to aTOF mass analyser.
To demonstrate the potential of the novel approachimplemented in this study, Fig. 6 shows the differencesin chromatographic profiles (2D plots) of volatiles iso-lated by SPME from floral honey samples originatingfrom France. The sample (A) from Carpentras containedmainly such compounds as aldehydes (hexanal, hepta-nal, octanal, and nonanal) and alcohols (hexan-1-ol andheptan-1-ol). The intensity of signals belonging to thosecompounds was significantly lower in the sample (B)from Corsica, which, on the other hand, containedhigher amounts of lilac aldehyde isomers.
4 Concluding remarks
The current paper introduces a challenging SPME–GC6GC–TOFMS technique enabling a comprehensiveanalysis of honey aroma compounds. This approach isapplicable for characterisation of honey botanical/geo-graphical origin as well as fraud identification. Attainingthese objectives requires availability of reliable analyti-cal procedure such as that presented in our study. Notonly the possibility of obtaining a high sample through-put but also a remarkable potential for both chromato-graphic and spectrometric (deconvolution of partiallyoverlapped peaks) separation of honey volatiles, and,consequently, minimisation of the risk of incorrect iden-tifications, are features surpassing conventionalapproaches employing 1D-GC–MS.
This optimised method will be used for examination ofvolatile profiles of a large set of honeys of different bota-nical and geographical origins with the aim of assessingthe feasibility of this strategy for traceability purposes.
The study concerned with honey characterisation was initiatedwith support from the European Commission through the 6th Fra-mework Programme under the Food Quality and Safety Priority(Contract no FP6-FOOD-2004-006942 – TRACE). The implementa-tion of TOFMS technology was funded by the projects MSM 604613 75 05 and FRV� 770/2006 supported by the Ministry of Educa-tion, Youth and Sports of the Czech Republic.
Disclaimer
The information reported reflects the authors' views; theEuropean Commission is not liable for any use of the
information contained therein. Mention of brand orfirm names in this publication is solely for the purposeof providing specific information and does not implyrecommendation or endorsement by the Institute of Che-mical Technology, Prague.
5 References
[1] Anklam, E., Food Chem. 1998, 63, 549 – 562.
[2] Bogdanov, S., Ruoff, K., Oddo, K. P., Apidologie 2004, 35, S4 – S17.
[3] Radovic, B. S., Careri, M., Mangia, A., Musci, M., Gerboles, M.,Anklam, E., Food Chem. 2001, 72, 511 – 520.
[4] Kataoka, H., Lord, H. L., Pawliszyn, J., J. Chromatogr. A 2000, 880,35 – 62.
[5] Vas, G., V�key, K., J. Mass Spec. 2004, 39, 233 – 254.
[6] Pe�a, R. M., Barciela, J., Herrero, C., Garc�a-Mart�n, S., J. Sep. Sci.2004, 27, 1540 – 1544.
[7] Piasenzotto, L., Gracco, L., Conte, L., J. Sci. Food Agric. 2003, 83,1037 – 1044.
[8] Alissandrakis, E., Tarantilis, P. A., Harizanis, P. C., Polissiou, M., J.Sci. Food Agric. 2005, 85, 91 – 97.
[9] de la Fuente, E., Mart�nez-Castro, I., Sanz, J., J. Sep. Sci. 2005, 28,1093 – 1100.
[10] Soria, A. C., Mart�nez-Castro, I., Sanz, J., J. Sep. Sci. 2003, 26, 793 –801.
[11] Bentivenga, G., D'Auria, M., Fegeli, P., Mauriello, G., Racioppi, R.,Inter. J. Food Sci. Technol. 2004, 39, 1079 – 1086.
[12] Mondello, L., Lewis, A. C., Bartle, K. D., Lewis, A. C., in: Mondello,L., Lewis, A. C., Bartle, K. D. (Eds.), Multidimensional Chromatogra-phy, John Wiley & Sons, Chichester 2002, pp. 47 – 75.
[13] Mosandl, A., Fischer, K., Hener, U., Kreis, P., Rettinger, K., Schu-bert, V., Schmarr, H.-G., J. Agric. Food Chem. 1991, 39, 1131 – 1134.
[14] Liu, Z. Y., Phillips, J. B., J. Chromatogr. Sci. 1991, 29, 227 – 231.
[15] Dall�ge, J., Beens, J., Brinkman, U. A. Th., J. Chromatogr. A 2003,1000, 69 – 108.
[16] Adahchour, M., Beens, J., Vreuls, R. J. J., Brinkman, U. A. Th.,TrAC-Trends Anal. Chem. 2006, 25, 438 – 454.
[17] Adahchour, M., Beens, J., Vreuls, R. J. J., Brinkman, U. A. Th.,TrAC-Trends Anal. Chem. 2006, 25, 540 – 553.
[18] Cajka, T., HajÐlov�, J., LC GC Eur. 2007, 20(1), 25 – 26, 28 – 31.
[19] Beens, J., Tijssen, R., Blomberg, J., J. Chromatogr. A 1998, 822, 233 –251.
[20] Dall�ge, J., Vreuls, R. J. J., Beens, J., Brinkman, U. A. Th., J. Sep. Sci.2002, 25, 201 – 214.
[21] Dool, H. V., Kratz, P. D., J. Chromatogr. 1963, 11, 463 – 471.
[22] Xu, X., van Stee, L. L., Williams, J., Beens, J., Adahchpur, M.,Vreuls, R. J. J., Brinkman, U. A. Th., Lelieveld, J., Atmos. Chem. Phys.2003, 3, 665 – 682.
[23] Cardeal, Z. L., Gomes da Silva, M. D. R., Marriott, P. J., Rapid Com-mun. Mass Spectrom. 2006, 20, 2833 – 2836.
[24] Zenkevich, I. G., J. High Resol. Chromatogr. 1998, 21, 565 – 568.
[25] Alissandrakis, E., Tarantilis, P. A., Harizanis, P. C., Polissiou, M.,Food Chem. 2007, 100, 396 – 404.
[26] P�rez, R., S�nchez-Brunete, C., Calvo, R. M., Tadeo, J. L., J. Agric.Food Chem. 2002, 50, 2633 – 2637.
[27] Bergoin, M., These, L’Institut National Polytechnique de Tou-louse, France 2005, p. 32.
[28] D�tterl, S., J�rgens, A., Pl. Syst. Evol. 2005, 255, 99 – 109.
i 2007 WILEY-VCH Verlag GmbH & Co. KGaA, Weinheim www.jss-journal.com