
Bonded ionic liquid polymeric material for solid-phase microextraction GC analysis
14
ORIGINAL PAPER Bonded ionic liquid polymeric material for solid-phase microextraction GC analysis Eranda Wanigasekara & Sirantha Perera & Jeffrey A. Crank & Leonard Sidisky & Robert Shirey & Alain Berthod & Daniel W. Armstrong Received: 3 September 2009 / Revised: 16 October 2009 / Accepted: 18 October 2009 / Published online: 19 November 2009 # Springer-Verlag 2009 Abstract Four new ionic liquids (IL) were prepared and bonded onto 5-μm silica particles for use as adsorbent in solid- phase microextraction (SPME). Two ILs contained styrene units that allowed for polymerization and higher carbon content of the bonded silica particles. Two polymeric ILs differing by their anion were used to prepare two SPME fibers that were used in both headspace and immersion extractions and compared to commercial fibers. In both sets of experi- ments, ethyl acetate was used as an internal standard to take into account adsorbent volume differences between the fibers. The polymeric IL fibers are very efficient in headspace SPME for short-chain alcohols. Immersion SPME also can be used with the IL fibers for short-chain alcohols as well as for polar and basic amines that can be extracted at pH 11 without damage to the IL-bonded silica particles. The sensitivities of the two IL fibers differing by the anion were similar. Their efficacy compares favorably to that of commercial fibers for polar analytes. The mechanical strength and durability of the polymeric IL fibers were excellent. Keywords Solid-phase microextraction . Headspace . Immersion . Ionic liquid . Bonded phase . Beverages . Gas chromatography Introduction Solid-phase microextraction (SPME) was developed by Pawliszyn in the early 1990s as a simple and “green” technique for sample preparation without the use of any solvent [1–4]. SPME is simply performed by exposing a silica fiber covered by an adsorbing agent to the headspace (HS) volume of a vial or directly immersing it into the matrix of the liquid sample. A rapid preconcentration of analytes into the fiber surface is observed if the coating adsorbing agent is appropriate. The extracted agents are analyzed by simply placing the fiber into the injection port of a gas chromatograph (GC). The injector is heated at an elevated temperature that will cause the vaporization of the adsorbed analytes into the GC inlet and a classical GC chromatogram can be developed for full identification and quantitation of all extracted compounds. The chemistry of the sorptive SPME coating layer plays a significant role in enhancing the extraction of specific classes of compounds and discriminating against others [5, 6]. The SPME extractant must primarily be thermally stable so as not to decompose during the GC injection process. Also, it must be mechanically strong to support agitation and manipulation. Finally, it must be able to withstand harsh chemical media when immersed in the sample solution including extreme pHs, high ionic strengths, and various organic solvent concentrations. Bare silica gel, polydimethylsiloxane (PDMS), divinylbenzene Eranda Wanigasekara and Sirantha Perera contributed equally to this paper. Electronic supplementary material The online version of this article (doi:10.1007/s00216-009-3254-2) contains supplementary material, which is available to authorized users. E. Wanigasekara : S. Perera : J. A. Crank : D. W. Armstrong (*) Department of Chemistry, University of Texas at Arlington, Box 19065, Arlington, TX 76019, USA e-mail: [email protected] L. Sidisky : R. Shirey Supelco, Sigma-Aldrich, 595 N Harrison Road, Bellefonte, PA 16823, USA A. Berthod CNRS, Université de Lyon, Bat. CPE, 69622 Villeurbanne, France Anal Bioanal Chem (2010) 396:511–524 DOI 10.1007/s00216-009-3254-2
-
Upload
universite-lyon -
Category
Documents
-
view
2 -
download
0
Transcript of Bonded ionic liquid polymeric material for solid-phase microextraction GC analysis

ORIGINAL PAPER
Bonded ionic liquid polymeric material for solid-phasemicroextraction GC analysis
Eranda Wanigasekara & Sirantha Perera &
Jeffrey A. Crank & Leonard Sidisky & Robert Shirey &
Alain Berthod & Daniel W. Armstrong
Received: 3 September 2009 /Revised: 16 October 2009 /Accepted: 18 October 2009 /Published online: 19 November 2009# Springer-Verlag 2009
Abstract Four new ionic liquids (IL) were prepared andbonded onto 5-µm silica particles for use as adsorbent in solid-phase microextraction (SPME). Two ILs contained styreneunits that allowed for polymerization and higher carboncontent of the bonded silica particles. Two polymeric ILsdiffering by their anion were used to prepare two SPME fibersthat were used in both headspace and immersion extractionsand compared to commercial fibers. In both sets of experi-ments, ethyl acetate was used as an internal standard to takeinto account adsorbent volume differences between the fibers.The polymeric IL fibers are very efficient in headspace SPMEfor short-chain alcohols. Immersion SPME also can be usedwith the IL fibers for short-chain alcohols as well as for polarand basic amines that can be extracted at pH 11 withoutdamage to the IL-bonded silica particles. The sensitivities ofthe two IL fibers differing by the anion were similar. Theirefficacy compares favorably to that of commercial fibers for
polar analytes. The mechanical strength and durability of thepolymeric IL fibers were excellent.
Keywords Solid-phase microextraction . Headspace .
Immersion . Ionic liquid . Bonded phase . Beverages .
Gas chromatography
Introduction
Solid-phase microextraction (SPME) was developed byPawliszyn in the early 1990s as a simple and “green” techniquefor sample preparation without the use of any solvent [1–4].SPME is simply performed by exposing a silica fiber coveredby an adsorbing agent to the headspace (HS) volume of a vialor directly immersing it into the matrix of the liquid sample.A rapid preconcentration of analytes into the fiber surface isobserved if the coating adsorbing agent is appropriate. Theextracted agents are analyzed by simply placing the fiber intothe injection port of a gas chromatograph (GC). The injectoris heated at an elevated temperature that will cause thevaporization of the adsorbed analytes into the GC inlet and aclassical GC chromatogram can be developed for fullidentification and quantitation of all extracted compounds.
The chemistry of the sorptive SPME coating layer playsa significant role in enhancing the extraction of specificclasses of compounds and discriminating against others[5, 6]. The SPME extractant must primarily be thermallystable so as not to decompose during the GC injectionprocess. Also, it must be mechanically strong to supportagitation and manipulation. Finally, it must be able towithstand harsh chemical media when immersed in thesample solution including extreme pHs, high ionicstrengths, and various organic solvent concentrations. Baresilica gel, polydimethylsiloxane (PDMS), divinylbenzene
Eranda Wanigasekara and Sirantha Perera contributed equally to thispaper.
Electronic supplementary material The online version of this article(doi:10.1007/s00216-009-3254-2) contains supplementary material,which is available to authorized users.
E. Wanigasekara : S. Perera : J. A. Crank :D. W. Armstrong (*)Department of Chemistry, University of Texas at Arlington,Box 19065, Arlington, TX 76019, USAe-mail: [email protected]
L. Sidisky : R. ShireySupelco, Sigma-Aldrich,595 N Harrison Road,Bellefonte, PA 16823, USA
A. BerthodCNRS, Université de Lyon,Bat. CPE,69622 Villeurbanne, France
Anal Bioanal Chem (2010) 396:511–524DOI 10.1007/s00216-009-3254-2

(PDMS–DVB), polyacrylate (PA), high-density polyoxy-ethylene (Carbowax) are used in commercially availableSPME fibers [7, 8]. Since higher selectivity, as well ashigher sensitivity, is needed as the technique gainswidespread popularity, the quest for new coating adsorbentsis the goal of numerous research teams [9–11].
Ionic liquids are a new class of non-molecular solventswith unique properties such as a very low volatility, oftengood thermal stability, electrical conductivity, good solvatingproperties, tunable polarity, and water or solvent solubility[12–17]. Ionic liquids are actually salts with a melting pointclose to or below room temperature. Their low volatility andunique solvating properties were soon considered as attrac-tive properties that would make them very useful for use inseparation techniques [18] and especially, possible candi-dates for new adsorbents for SPME fibers.
Considerable insights into solute-IL interactions andaffinities were obtained during the development and evalua-tion of GC stationary phases made with ILs [19–22]. Thisexperience was first used to develop microextractions on asingle ionic liquid drop, i.e., without fiber support [23, 24].Next ionic liquid coated fibers were prepared for a singledetermination of trace amount of polyaromatic hydrocarbonsin water samples [25]. The contamination of the GC injectionliner precluded the widespread use of this method. Poly-merized ionic liquids were used to coat on the silica fiber andobtain thermally stable and reusable SPME fibers for esters[26] and amphetamine metabolite [27] determination.
Thus far, the reports on ionic liquid SPME fibers weresuccessful with mixtures containing mainly hydrophobicand semi-polar compounds. It was found in GC analyses onionic liquid stationary phase [20–22] and in ionic liquid-water liquid–liquid extractions [15] that alcohols had anunusually high affinity for ILs. In this work, attention willbe given to the extraction of hydrophilic and polarcompounds such as short-chain alcohols and amines. Forthis purpose, completely new and different ionic liquidswere prepared and tested as new adsorbents for SPME. Toreduce contamination and/or loss of adsorbent, the differentionic liquid derivatives were covalently bonded to silicamicroparticles that were subsequently used to prepare aporous and mechanically strong fiber coating. Both head-space and immersion techniques were tested to evaluate thecapabilities of the newly developed bonded ionic liquidsorbents with a large variety of polar solutes.
Experimental
Materials and reagents
The reagents, imidazole, 1-methylimidazole, 1-hydroxyethylimidazole, triethylene glycol, phosphorous tribromide, ethyl
acetate, toluene, 4-chloromethyl styrene, tetrahydrofuran(THF), n-butanol, methylene chloride, chloroform, dioxane,butyric acid, phenol, dimethylamine, trimethylamine,pyridine, and aniline, were purchased from Sigma-Aldrich, Milwaukee, WI, USA. The common HPLCsolvents: acetonitrile (ACN), isopropyl alcohol (IPA),ethanol, and methanol were OmniSolvTM solvents obtainedfrom EMD Merck, Darmstadt, Germany. Kromasil sphericalsilica gel with 5 µm particle diameter, 10 nm pore size, and310 m2 surface area was obtained from Supelco, Sigma-Aldrich.
The beverages tested were obtained from differentlocal grocery stores. The standard reference material usedfor calibration was SRM 1828b from the NationalInstitute of Standards and Technology (Gaithersburg,MD, USA).
Synthesis of the ionic liquid derivatives
Bis-hydroxyethyl imidazolium trioxyethylene derivatives
Bis-hydroxyethyl imidazolium trioxyethylene bis-(trifluoro-methylsulfonyl) imide, noted (HeIM)2PEG3, 2 NTf2
− wassynthesized following a method previously reported [28].Trioxyethylene dibromide was reacted with hydroxyethylimidazole, in a one to two mole ratio, in isopropyl alcohol(IPA) at 83 °C under reflux overnight. The bromide ionicliquid obtained was dissolved in methanol with Li NTf2 andmixed for 2 h. The NTf2 ionic liquid was extracted withmethylene chloride, washed with water and ether, and driedin a vacuum oven with P2O5. It was reacted withtriethoxysilane ethylisocyanate in dry ACN in a one toone mole ratio for 4 h. The ethoxysilane derivative wasbonded to half its weight of silica particles to give IL 1(Fig. 1, top). The elemental analyses and coverage are listedin Table 1.
The second ionic liquid polar derivative was performedfollowing the same protocol as for IL 1 but the bromideions were exchanged for trifluoromethyl sulfate or triflateions (TfO−) instead of NTf2
− ions giving IL-2-bondedparticles (Table 1).
1,1′-(1,6-hexanediyl)bisimidazole derivative
A 250-ml round-bottom flask was filled with 100 mLanhydrous dimethylformamide (DMF) and 2.0 g sodiumimidazole (22.2 mmol). Next, 3.8 mL of 1,6-dichlorohex-ane (3.8 mmol) were slowly added into the DMF solutionand stirred overnight at room temperature. After filteringoff remaining solids, the filtrate was concentrated underreduced pressure and the resulting crude product waspurified by column chromatography (SiO2 20 μm, 60 Å;CH2Cl2/methanol 9:1) to yield the desired product 1,1’-
512 E. Wanigasekara et al.

(1,6-hexanediyl) bis imidazole (88 %; Fig. 1, bottom). 1HNMR (300 MHz, DMSO-d6): δ, 7.56 (s, 1H), 7.12 (S, 2H),6.84 (s, 2H), 3.89 (t, J=7.2 Hz, 4H), 1.64 (m, 4H), 1.21 (m,4H). Calculated analytical mass: C12H18N4: C, 66.02; H,8.31; N, 25.67; found: C, 66.21; H, 8.49; N, 25.70.
Styrene dicationic imidazolium monomer
One gram of 1,1′-(1,6-hexanediyl) bisimidazole (4.6 mmol)was dissolved in 20 mL CH3CN in a 100-mL round-bottomflask. 4-chloromethylstyrene (1.5 g; 10.1 mmol) was added
SiO2 OOSi
OEt
NH
O
O
HON N
OO
O
NTf2-
N NOH
SiO2 NCOSi Toluene 80 0C
NTf2-
N NO
OO
NTf2-
N NOH
NTf2-
1
ClCl
N NNa
12 hr, r.t, THFN
N NN
Cl
ACN, r.f, 12 hr
NN N
N
ClCl
SiO2
OOOO
Si
Si
EtO
EtO
NHHN
O
O
CN
CN
N
N
SiO2
OOOO
Si
Si
EtO
EtO
NH
NH
O
O
NC
NC
NN N
N
NN N
N
nn
n
NN N
N
NN N
N
nn
n
NTf2-
NTf2- NTf2
-
NTf2-
NTf2- NTf2
-
NTf2-
NTf2-
1- Toluene 80 0C, 6 hr
2- LiNTf2 metathesis
3
OO
OEt
Fig. 1 top Final chemical step for the attachment of the polar bonded ionic liquid derivative 1 to silica particles. Derivative 2 is identical withtriflate anions instead of N(Tf)2 anions. bottom Synthesis of the polymeric-bonded ionic liquid derivative 3. Derivative 4 has triflate anions
Bonded ionic liquid for headspace SPME 513
with a syringe and the reaction was heated at 65 °Covernight. The reaction was then allowed to cool to roomtemperature and was poured into 100 mL diethyl ether. Aprecipitate formed immediately, and the crude product wascooled to −10 °C in the freezer. Et2O was decanted and theproduct dissolved in 20 mL deionized water. The aqueousphase was washed with ethyl acetate (3×50 mL) and waterwas removed by reduced pressure to obtain the dicationicimidazolium monomer in the chloride form (Figure 1,bottom). 1H NMR (300 MHz, DMSO-d6): δ 9.58 (s, 2H),7.83 (s, 4H), 7.50 (dd, J=8.26 Hz, 8H), 6.71 (dd, J=11.0 Hz,2H), 5.86 (d, J=17.54 Hz, 2 H), 5.41 (s, 4H), 5.41 (s, 4H),5.28 (d, J=12 Hz, 2H), 4.15 (t, J=7.2 Hz, 4H); 1.22 (m, 4 H).Calculated analytical mass: C30H36N4; C, 68.82; H, 6.93; N,13.54; found: C, 68.91; H, 7.02; N, 10.94.
Synthesis of the silica-bonded polymer
To a suspension of 4 g of azobis-isobutyronitrile-derivatizedsilica (Supelco) in Toluene was added 1.0 g of the dicationicmonomer and the mixture was heated to 80 °C for 6 h. Thenit was allowed to cool to room temperature with continuedstirring overnight. Next, the content was filtered throughfine-pore-sintered glass filter. The collected silica-bondedpolymeric product was successively washed with 100 mL oftoluene, ethanol, acetone, methanol, and chloroform. Thefinal product was dried under vacuum at 50 °C.
Metathesis reaction
The bonded silica is in the chloride form. One gram ofsilica-bonded ionic liquid polymer in chloride form wasmixed with 3 g of sodium triflate (NaTfO) and stirredovernight. After filtration, it was washed with deionizedwater until no white precipitate was seen testing the filtratewith dilute silver nitrate. The resulting silica-bondedpolymer was vacuum dried overnight to obtain the bondedsilica in the triflate form. Similar metathesis was carried outto obtain the silica-bonded ionic liquid polymer in its bis-trifluoromethanesulfonimide (NTf2
−) form.The (StyrIM)2C6, 2 TfO− ionic liquid was prepared on a
similar manner exchanging the bromide ions for triflate ions
before polymerization and bonding on silica particles.Table 1 lists the elemental carbon analyses of the bondedsilica particles.
Equipment
Solid-phase microextraction
For all headspace extractions, a Supelco SPME fiberassembly and holder Model 57330 was used with a 57357-U sampling stand, a 57358-U heater block holding eight15-mm vials of 4.0 mL and a Corning PC420-D heat/stirplate, all provided by Supelco (Sigma-Aldrich). Immersionextractions were done using the Supelco fiber assembly anda Varian CX 8200 autosampler (Varian Inc. Palo Alto, CA,USA) using 2 mL mini-vials. The ionic-liquid-derivative-bonded silica particles were sent to Supelco Bellefonte to beglued as a 50-µm layer onto SPME flexible core wire fittingthe holder (Supelco® proprietary protocol). Figure 2 showsscanning electron microphotographs of Fiber 3. A veryporous 50 µm layer is coated on the solid core. At highmagnification (Fig. 2, bottom), it is possible to see thepolymeric IL bonded onto each silica particle.
For comparison, commercial fibers were used in the sameconditions as the newly developed fibers. They were a65-µm polydimethylsiloxane / divinylbenzene fiber (PDMS/DVB) Stableflex 57326-U, a 60-µm polyoxyethylene glycol(PEG) 57354-U, a 100-µm PDMS 57300-U and an 85-µmpolyacrylate fiber (PA) fused silica 57304 (Supelco). Beforeuse, all the fibers were conditioned at 220 °C in the GCinjection port under a flow of helium for 15 min.
Gas chromatography
An Agilent GC 6850 was used with a split injector and FIDdetector both set at 300 °C. A Chemstation software(Agilent, Palo Alto, CA, USA) was used to drive thechromatograph and process the chromatograms. The col-umn for polar compounds and headspace analysis was a30 m, 250 µm i.d., 0.25 µm film thickness Supelcowax™10 capillary column (Supelco). The stationary phase is apolyethylene glycol polymer of about 20 million molecular
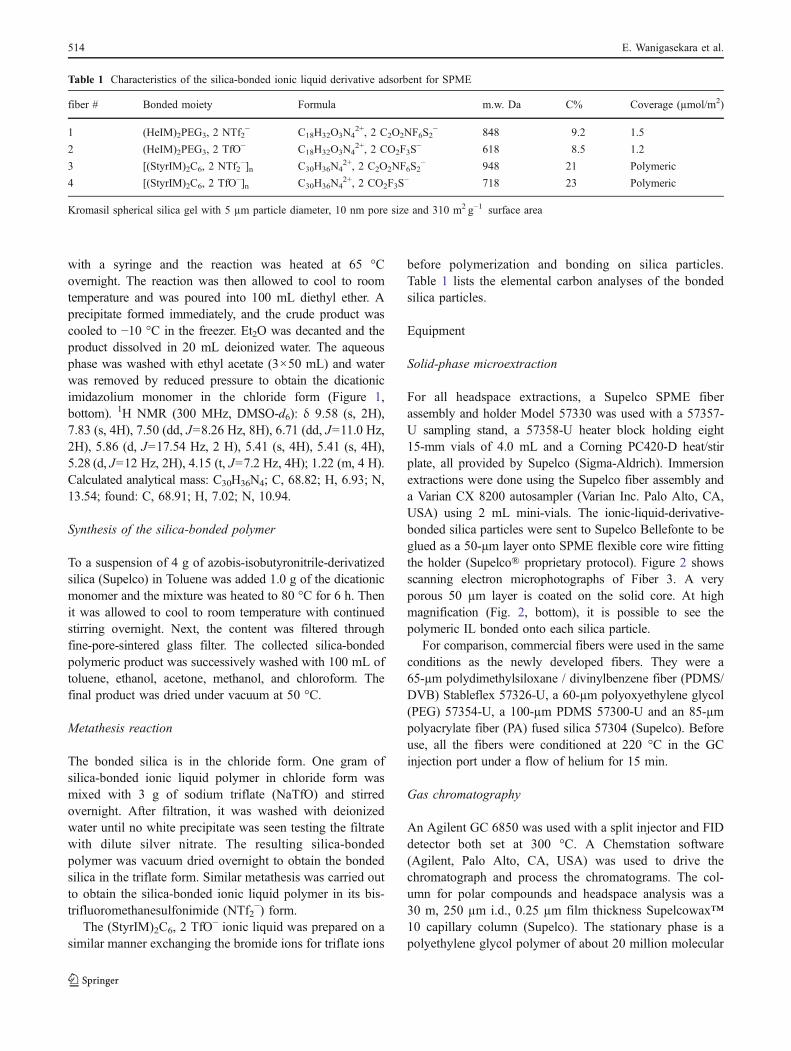
Table 1 Characteristics of the silica-bonded ionic liquid derivative adsorbent for SPME
fiber # Bonded moiety Formula m.w. Da C% Coverage (µmol/m2)
1 (HeIM)2PEG3, 2 NTf2− C18H32O3N4
2+, 2 C2O2NF6S2− 848 9.2 1.5
2 (HeIM)2PEG3, 2 TfO− C18H32O3N42+, 2 CO2F3S
− 618 8.5 1.2
3 [(StyrIM)2C6, 2 NTf2−]n C30H36N4
2+, 2 C2O2NF6S2− 948 21 Polymeric
4 [(StyrIM)2C6, 2 TfO−]n C30H36N42+, 2 CO2F3S
− 718 23 Polymeric
Kromasil spherical silica gel with 5 µm particle diameter, 10 nm pore size and 310 m2 g−1 surface area
514 E. Wanigasekara et al.

weight (Carbowax® 20 M). The column for polar andamine compounds analyzed by immersion was a 30 m,320 µm i.d., 4 µm film thickness SPB-1 Sulfur PDMScapillary column (Supelco). Both columns were operatedwith helium as the carrier gas.
SPME protocol
Headspace analysis
A known amount of the polar test compounds: ACN,methanol, ethanol, n-propanol, IPA, n-butanol, acetone, andethyl acetate, were added to 2.5 mL distilled water in aTeflon®-capped 4 mL vial. Seven hundred fifty milligramsof sodium chloride and a magnetic stir bar were added tothe solution. The fiber holder needle was then inserted in
the vial headspace. The fiber was exposed for 15 min to theheadspace vapors obtained at 50 °C under fast 1,000 rpmstirring. After 15 min, the fiber was retracted inside theneedle and the fiber holder was withdrawn from the vial.The needle containing the fiber was next inserted into theGC split injector set with a low split ratio of 5 to 1. Thefiber was immediately exposed for thermal desorption ofthe adsorbed compounds at 200 °C for 2 min. After 2 min,the fiber was retracted inside the needle, the latter beingsimultaneously withdrawn from the injector. The samplewas analyzed with the 30-m capillary column maintained at50 °C for 4 min followed by a temperature gradient of 15 °C/min for 6 min and 40 s up to 150 °C, with 1 min at 150 °C. The helium carrier gas linear velocity was 35 cm/s (hold-up time 1.45 min) with an average flow rate of 1.0 mL/min.The FID solute peak areas were used for quantitation rather
50 µm 50 µm
10 µm 10 µm
Fig. 2 Scanning electron microphotographs of Fiber 3. Top left Sideview of the fiber. Top right Granular structure of the coating due to thesilica particles. Bottom right Enlargement of the coated layer showingthe porous structure of the Stableflex® layer holding the bonded silica
particles. The left inset is an enlargement of a single silica particleshowing the IL polymeric coating as white spots covering theparticles. bottom right For comparison, the same procedure wasfollowed with bare silica particles. The IL coating is not seen
Bonded ionic liquid for headspace SPME 515

than the peak heights (see a typical GC chromatogram insupplemental information).
Immersion analysis
Stock solutions of the volatile analytes were prepared atconcentration in the g/L range in water. A volume of1.2 mL of buffer at different pH and containing 30% w/vNaCl was introduced in a 2-mL vial. Spiking additionsusing the stock solutions were made to prepare the mixturewith known concentrations of the desired analytes at theselected pH. A total of five to six extractions by fullyimmersing the fiber in the liquid mixture for 10 min withstrong agitation (50 Hz vibration) at room temperature weremade with each sample. In all cases, the first extraction wasexcluded because results from the first extraction wereusually not consistent with the remaining extractions. After10 min, the vibration-agitation is stopped; the fiber isretracted inside the needle and withdrawn for the vial forimmediate GC analysis. The needle is inserted into the GCinjector at 220 °C or 250 °C and the fiber is exposed insplitless condition for 45 s then the split is opened at a ratioof 20 to 1 (total helium flow is ∼30 mL/min) for 1 min 15 sbefore being retracted into the needle and withdrawn fromthe injector. The chromatogram was developed with thecapillary column maintained at 45 °C for 1.5 min followedby a temperature gradient of 8 °C/min for 4 min and 22 sup to 80 °C, followed by a faster gradient of 20 °C per minfor 8 min and 30 s up to 250 °C with a 5-min hold at 250 °C. The helium carrier gas linear velocity was 30 cm/s(hold-up time 1.67 min) with an average flow rate of1.5 mL/min. The FID detector was set at 290 °C. Thesolute peak areas were used for quantitation rather than thepeak heights.
Results and discussion
Ethoxylated and polymeric alkylated ionic liquidderivatives
Polar analytes are hydrophilic. As such, they are moredifficult to extract by the SPME protocol even maximizingthe salting-out effect of adding sodium chloride close to thesaturation concentration (359 g/L or 28% w/v at 25 °C) [2].SPME was used to identify the fuel used in arson cases andwas very effective with gas or petroleum derivatives butwas much less so when alcohols were used as fuel sourceigniters [3, 29]. Thus, enhancing the capabilities of SPMEwith new adsorbents that have a high affinity for polarcompounds is of considerable interest. The specific affinityof ionic liquids for alcohols and polar compounds may beused for this purpose. Considering the problems due to
ionic-liquid-coated fibers (liner contamination in the GCinjector and irreproducibility) [25], bonded IL silicamaterials were tailored for the task. Oxyethylene adductswere also selected to enhance to polarity of the ionic liquidderivative.
The 1 and 2 derivatives were bonded as oxyethyleneadduct monomers onto the silica particle surface (Fig. 1, topand Table 1). The carbon loading and moiety molecularweight (Table 1) allows for an estimate of the bondingdensity as 1.2–1.5 µmol/m2. Such bonding density wouldbe somewhat low for bonded silica particles used as thesorbent in stationary phase HPLC. The 8.5% to 9.2%carbon loading makes it acceptable for SPME extraction.Derivatives 3 and 4 were designed to increase substantiallythe carbon load by polymerizing a styrene bonded di-imidazolium monomer. The significantly higher carbonloads between 21 and 23% cannot be related to a coveragedensity since the additional carbon is strictly the result ofthe chain lengthening polymerization reaction up to thepoint that spots can be seen on the silica particle surface(Fig. 2, bottom).
The specific role of the anion in selectivity was pointedout previously [28, 30–32]. Specifically, linear solvationenergy relationship (LSER) studies found that the triflateanion had less proton acceptor ability than the bis-(trifluoromethylsulfonyl)imide anion (lower b coefficientin the Abraham LSER regression equation) [28, 30, 32].This is not surprising since triflic acid is one of thestrongest acids known. TfO− also had a significantly highera parameter (basicity) than NTf2
− [28, 30, 32]. It is theninteresting to compare the effect of the anion in our ionicliquid sorbent derivatives.
Headspace analyses
Effect of the fiber exposure time
The same trend was observed for all studied new SPMEfiber coated sorbents used in headspace extractions. Theadsorbed amount of all analytes increases up to a plateauvalue reached after about 15 min of headspace exposureat 50 °C. A small decrease may be observed for somecompounds exposed for times greater than 20 min.Figure 3 shows the results obtained with the polymeric ILsorbent 3 using the relative response value: {peak area (p.a.) at time t} over {p.a. at time 15 min}. The trend is thesame for all compounds in this study. The absoluteresponse in concentration depended on the nature of thesolute as shown by the inset of Fig. 3. Similar sorption-time profiles were obtained for polymeric IL-coated fibers(30 min plateau time at 25 °C) [26] or IL-coated fibers foramphetamine detection (20 min plateau time at 50 °C)[27].
516 E. Wanigasekara et al.

Extraction parameter optimization
NaCl salting-out agent Sodium chloride is added to thesolution as a salting-out agent. Previous work showed thatthe maximum amount of added NaCl produced the highestpartial pressure of volatile analytes in the headspace volumeand, consequently, the highest amount of analytes extractedby the fiber [1–4, 23–27]. This result was confirmed withour fibers. A saturated NaCl solution at 20 °C contains316 g/L and has a density of 1.20 g/mL. To avoid anyprecipitation and/or solubility problems, the amount ofNaCl added to all solutions was 30% w/v (750 mg NaCl in2.5 mL water) just below the saturation concentration.
Extraction temperature Temperature is another parameterincreasing the partial vapor pressure of the analytes in theheadspace volume. However, it also increases the vaporpressure of water making the pressure of the headspacevolume higher than atmospheric pressure. If leaks occur,the concentration of the extracted analytes may be biased.The working extraction temperature for all headspaceexperiments was set at 50 °C.
Analytical figures of merit
Table 2 lists the analytical figures of merit of the four fibersmade with silica-coated ionic liquid particles (as listed inTable 1), along with those of two commercial fibers: apolyacrylate (PA) fiber and a polydimethylsiloxane/divinyl-benzene (PDMS/DVB) fiber. The listed sensitivity value isthe slope of the calibration line for the given analyteextracted by the given fiber. It is expressed in {units of GCpeak area} per {analyte ppm (= microgram per milliliter)
concentration}. The limits of detection (LOD) listed aregiven in microgram per liter or parts per billion. They werecomputed as the ratio of three times the baseline noise overanalyte sensitivity. The curves regression coefficient andcalibration ranges are also listed.
The sensitivities obtained with the two monomeric ILfibers (#1 and #2, Tables 1 and 2) are clearly lower than thecorresponding sensitivities obtained with the polymeric ILfibers #3 and #4. The two polymeric-bonded IL fibers havea better absolute sensitivity than the commercial PA andPDMS–DVB fibers for the three lightest polar analytes:acetonitrile, methanol, and ethanol. The commercial fibersPA and especially PDMS–DVB have better sensitivitiesthan the new IL-based fibers for all other tested polarcompounds. Fiber #4 (bonded polymeric [(StyrIM)2C6,2 TfO−]n, Table 1) showed higher absolute sensitivitiesthan its NTf2
–Fiber #3 counterpart for all analytes (Table 2).It should be noted that with the IL-coated fibers, both thebinder and silica used to prepare the adsorbing layer take asignificant percentage of the coating volume having limitedextraction capabilities. Furthermore, the coating volume ofthe IL-based fibers with a coating thickness of around50 µm (Fig. 2) is itself lower than the coating volume of thecommercial PA fiber (85 µm) and the PDMS–DVB fiber(65 µm). To take into account these composition andvolume differences, we used ethyl acetate as an internalstandard to normalize the results.
Figure 4 presents the Table 2 absolute results as relativeresults, i.e., plotting for each analyte the ratios of theanalyte absolute response over the same fiber ethyl acetateresponse. This representation shows that the IL fibers havea better relative response for all selected analytes. For thepolymeric-bonded IL fibers #3 and #4, the short-chain
0.00
0.50
1.00
0 5 10 15 20 25 30
Exposure time (min)
Rel
ativ
e P
eak
Are
a
Acetone
Methanol
IPA
Ethanol
ACN
N-Propanol
n-Butanol 0
5
10
15
20
25
0 5 10 15 20 25 30
Pea
k A
rea
Fig. 3 Profiles of the relativesorption expressed as [p.a. (t)over p.a. (15 min)] versus head-space exposure time for thepolymeric ionic liquid 3 SPMEfiber. The insert shows thecorresponding raw data withpeak areas (p.a.) expressed asFID picoampere time second.All solute concentrations were5 µg/ml (ppm). Exposuretemperature 50 °C, 3 g NaCladded to 10 mL as salting-out agent
Bonded ionic liquid for headspace SPME 517

Table 2 Analytical figures of merit for polar solutes extracted for 15 min at 50 °C by headspace SPME with different fibers
Solute Fiber Sensitivity p.a. per µg/mL LOD (µg/L or ppb) Correlation coefficient Calibration range (µg/mL or ppm)
Acetonitrile 1 0.47 40 0.992 0.5–50
2 0.40 40 0.991 0.5–50
3 1.05 10 0.991 0.5–50
4 1.54 10 0.994 0.5–50
PA 0.99 20 0.993 1–50
PDMS/DVB 1.56 10 0.998 1–50
Methanol 1 0.64 35 0.995 0.5–50
2 0.70 30 0.997 0.5–50
3 0.62 30 0.994 0.5–50
4 1.31 10 0.993 0.5–50
PA 0.71 30 0.998 1–50
PDMS/DVB 0.70 30 0.996 1–50
Ethanol 1 0.92 20 0.993 0.5–50
2 0.91 20 0.991 0.5–50
3 0.95 20 0.993 0.5–50
4 1.76 10 0.995 0.5–50
PA 1.33 15 0.996 1–50
PDMS/DVB 1.17 20 0.993 1–50
n-Propanol 1 1.77 10 0.997 1–100
2 1.62 10 0.992 1–100
3 2.12 10 0.996 1–100
4 3.23 5 0.998 1–100
PA 2.98 5 0.996 1–100
PDMS/DVB 3.05 7 0.997 1–100
i-Propanol 1 1.29 15 0.993 1–100
2 1.31 15 0.991 1–100
3 1.56 15 0.998 1–100
4 2.66 8 0.991 1–100
PA 2.02 10 0.995 1–100
PDMS/DVB 2.34 9 0.999 1–100
n-Butanol 1 4.50 4 0.993 1–100
2 4.21 5 0.992 1–100
3 5.40 3 0.992 1–100
4 6.52 2 0.994 1–100
PA 8.16 1 0.991 1–100
PDMS/DVB 11.5 0.5 0.992 1–100
Acetone 1 0.99 20 0.996 1–100
2 0.82 25 0.993 1–100
3 1.36 15 0.997 1–100
4 1.95 10 1–100
PA 1.25 15 0.995 1–100
PDMS/DVB 2.60 5 0.999 1–100
Ethyl acetate 1 3.12 10 0.992 1–100
2 3.04 10 0.992 1–100
3 3.20 10 0.994 1–100
4 6.59 5 0.995 1–100
PA 8.70 4 0.995 1–100
PDMS/DVB 4.88 3 0.996 1–100
Fibers 1 to 4: see full structures in Table 1
PA polyacrylate fiber 85 µm coating thickness, PDMS/DVB polydimethylsiloxane/divinylbenzene fiber 65 µm coating thickness, p.a. peak area,LOD limit of detection, ppm part per million or milligram per liter, ppb part per billion or microgram per liter
518 E. Wanigasekara et al.
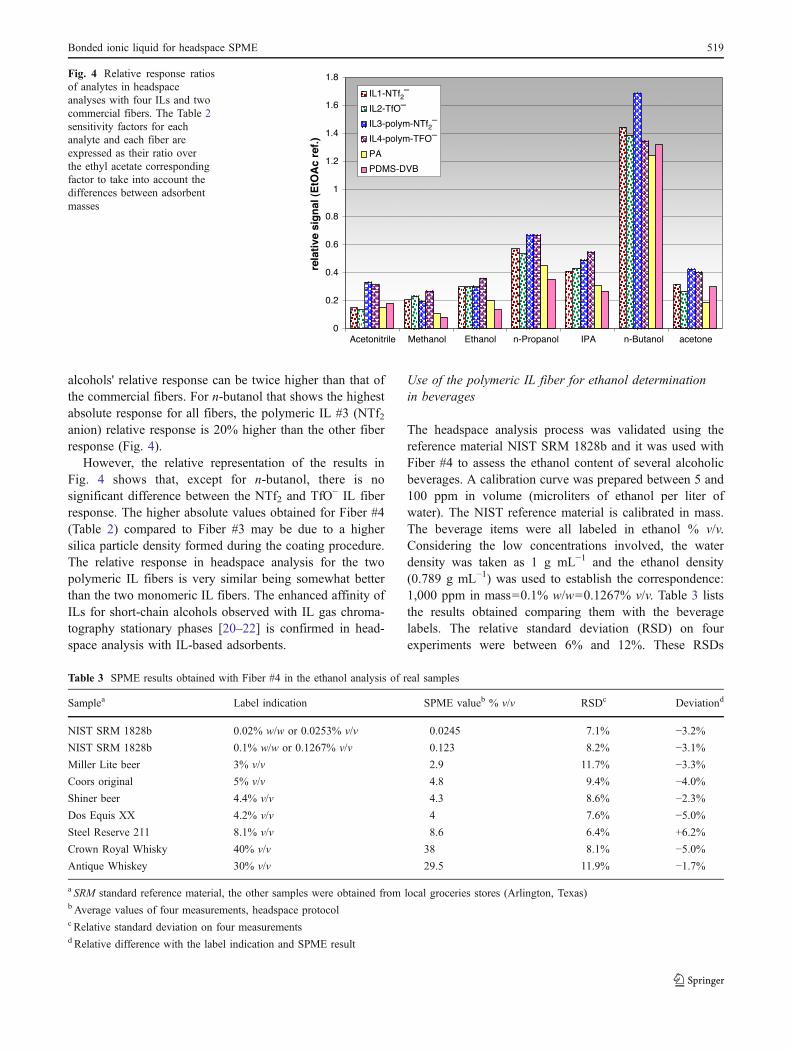
alcohols' relative response can be twice higher than that ofthe commercial fibers. For n-butanol that shows the highestabsolute response for all fibers, the polymeric IL #3 (NTf2anion) relative response is 20% higher than the other fiberresponse (Fig. 4).
However, the relative representation of the results inFig. 4 shows that, except for n-butanol, there is nosignificant difference between the NTf2 and TfO− IL fiberresponse. The higher absolute values obtained for Fiber #4(Table 2) compared to Fiber #3 may be due to a highersilica particle density formed during the coating procedure.The relative response in headspace analysis for the twopolymeric IL fibers is very similar being somewhat betterthan the two monomeric IL fibers. The enhanced affinity ofILs for short-chain alcohols observed with IL gas chroma-tography stationary phases [20–22] is confirmed in head-space analysis with IL-based adsorbents.
Use of the polymeric IL fiber for ethanol determinationin beverages
The headspace analysis process was validated using thereference material NIST SRM 1828b and it was used withFiber #4 to assess the ethanol content of several alcoholicbeverages. A calibration curve was prepared between 5 and100 ppm in volume (microliters of ethanol per liter ofwater). The NIST reference material is calibrated in mass.The beverage items were all labeled in ethanol % v/v.Considering the low concentrations involved, the waterdensity was taken as 1 g mL−1 and the ethanol density(0.789 g mL−1) was used to establish the correspondence:1,000 ppm in mass=0.1% w/w=0.1267% v/v. Table 3 liststhe results obtained comparing them with the beveragelabels. The relative standard deviation (RSD) on fourexperiments were between 6% and 12%. These RSDs
0
0.2
0.4
0.6
0.8
1
1.2
1.4
1.6
1.8
Acetonitrile Methanol Ethanol n-Propanol IPA n-Butanol acetone
rela
tive
sig
nal
(E
tOA
c re
f.)
IL1-NTf2–
IL2-TfO–
IL3-polym-NTf2–
IL4-polym-TFO–
PA
PDMS-DVB
Fig. 4 Relative response ratiosof analytes in headspaceanalyses with four ILs and twocommercial fibers. The Table 2sensitivity factors for eachanalyte and each fiber areexpressed as their ratio overthe ethyl acetate correspondingfactor to take into account thedifferences between adsorbentmasses
Table 3 SPME results obtained with Fiber #4 in the ethanol analysis of real samples
Samplea Label indication SPME valueb % v/v RSDc Deviationd
NIST SRM 1828b 0.02% w/w or 0.0253% v/v 0.0245 7.1% −3.2%NIST SRM 1828b 0.1% w/w or 0.1267% v/v 0.123 8.2% −3.1%Miller Lite beer 3% v/v 2.9 11.7% −3.3%Coors original 5% v/v 4.8 9.4% −4.0%Shiner beer 4.4% v/v 4.3 8.6% −2.3%Dos Equis XX 4.2% v/v 4 7.6% −5.0%Steel Reserve 211 8.1% v/v 8.6 6.4% +6.2%
Crown Royal Whisky 40% v/v 38 8.1% −5.0%Antique Whiskey 30% v/v 29.5 11.9% −1.7%
a SRM standard reference material, the other samples were obtained from local groceries stores (Arlington, Texas)b Average values of four measurements, headspace protocolc Relative standard deviation on four measurementsd Relative difference with the label indication and SPME result
Bonded ionic liquid for headspace SPME 519

may appear high for an analytical technique; they are theusual RSD values obtained in quantitative SPME experi-ments [2–5, 7, 8]. The average values obtained for theSPME ethanol extraction of the two reference materialswith certified 0.02% and 0.1% w/w values, were respec-tively 0.0193±0.0013% w/w and 0.097±0.0079% w/wvalidating the method with an 8% RSD.
Five different beers and two liquors were analyzed fortheir ethanol content. The samples were diluted using thelabel indication in percent v/v so that the ethanol content forSPME analysis was around 50 ppm in volume, a value inthe middle of the calibration curve. With ethanol beingrapidly eluted in gas chromatography, no interferences wereencountered in the sample analyses. Except for the beersample containing the highest ethanol percentage, all SPMEresults, including the two certified samples, were foundslightly below the label values (Table 3). SPME headspaceextraction could be used to estimate the ethanol content ofblood samples in a non-destructive way.
Immersion extractions
The protocol for immersion extractions is necessarilydifferent from the headspace protocol (see “Experimental”section). Only the two polymeric fibers #3 and #4 wereevaluated. Six extractions were performed successively foreach sample at room temperature. The very first extractionof a new sample always gave results that differedsignificantly from the five following extractions, it wasdiscarded. Ion-exchange could be responsible for thisphenomenon. Since the cationic part of the IL is chemicallyattached to the fiber and the anion is bound by electricalinteraction only, the fiber can behave as an anion-exchanger. Ion-exchange can occur between the high ionicstrength solution and the fiber anions. The fiber canexchange its triflate or bis-triflylimide anions for chlorideand/or phosphate anions in the sample.
Extractions at pH 2
Since bonded silica is known to be sensitive to pH,extractions at pH 2 and pH 11 were done with differentanalytes. Table 4 lists the results obtained for nine selectedtypical solutes with the two polymeric IL fibers #3 and #4,two commercial fibers: a 60-µm thick PEG fiber and a100-µm thick PDMS fiber, and the same compounds thatwere used in headspace analyses plus a variety of other lessvolatile compounds. A more complete table listing 19compounds can be found in supplemental material. Thelisted values are the average of five successive experiments.The low percent RSD for most of the extracted analytesindicate that the fibers are quite stable. The relatively higherRSD for methanol was associated to a slowly declining
response with repeated extractions. This may be due to anexperimental artifact (slow evaporation during sampling).The same trend was observed with phenol and butyric acid(see supplemental material).
The IL fibers were compared to a polar 60-µm PEG-coated fiber and to a non-polar 100-µm PDMS coated fiber.Table 4 lists the sensitivity obtained for each fiberexpressed as GC peak area per parts per million (micro-grams per milliliter) of analyte concentration. As observedin the headspace extraction study, the amount of extractingmaterial has a great influence on the experimentallyobserved fiber sensitivity. Therefore, in the immersionextraction study also, ethyl acetate was used as an internalstandard. Figure 5 presents the relative response ratios foreach analyte and each fiber expressed as the absolute valuefor analyte on a given fiber (from Table 4) divided by thecorresponding ethyl acetate value.
In absolute terms, Fiber #3 (polymeric IL with NTf2anion) gave higher sensitivity factors for all studiedanalytes compared to its counterpart Fiber #4 with thetriflate anion (Table 4). The sensitivity factors for the PEGfiber were also higher than these obtained with the two ILfibers for all analytes. The picture is completely differentwhen considering the relative fiber responses. Figure 5shows that the two ILs fibers gave similar results in thisrelative representation. The IL fibers results compare wellwith the polar PEG fiber. Both results are clearly superior tothe PDMS results except for MTBE (Fig. 5). The relativeresults obtained in headspace extraction (Fig. 4) andimmersion extraction (Fig. 5) are quite coherent. Comparedto the two IL fibers, the PEG fiber seems to be slightlymore efficient in immersion extractions than in headspaceextractions in acidic media.
Extractions at pH 11
Phosphate buffer was used to obtain a matrix of pH 11allowing an evaluation of fiber stability. Since the poly-meric ionic liquids are bonded to silica particles, alkalinesolutions could damage the particle and/or deteriorate thebonding. Many of the pH 2 neutral analytes and seven basicanalytes were used as test solutes. Table 4 lists all theresults in the two rightmost columns.
The first observation is that there is ample stability andgood reproducibility of the results at pH 11. The RSDs ofthe experiments were similar to those obtained at pH 2.Experiments at different pHs were repeated with the samefibers over several months to study different mixtures. Thereproducibility of the silica-based fibers was comparable tothat of the polymer-based commercial fibers.
Table 4 also lists the sensitivity factors obtained forseven small amines at pH 11. The two polymeric IL fiberswere able to extract all of the tested amines with sensitivity
520 E. Wanigasekara et al.

Table 4 SPME results obtained with different fibers by immersion in two different pH solutions
Solute Fibera Sensitivity pH 2 p.a. per (µg/mL) RSDb % Sensitivity pH 11 p.a. per (µg/mL) RSDb %
Acetonitrile 3 47.2 0.5% 43.5 0.8%
4 27.4 0.5% 24.3 1.2%
PEG 67.9 2.1%
PDMS 15.8 1.6%
Methanol 3 11.1 13.0% 25.1 1.5%
4 12.6 13.6% 25.4 2.8%
PEG 54.0 49%
PDMS 6.8 17%
Ethanol 3 23.2 0.9% 34.8 1.7%
4 18.5 1.2% 27.8 3.7%
PEG 62.4 2.4%
PDMS 12.2 1.5%
n-Propanol 3 176 0.6% 91.8 1.0%
4 97.0 2.1% 49.3 1.2%
PEG 381 2.2% 185 –
PDMS 123 0.8% 55 –
Acetone 3 78.0 0.5% 75.7 1.2%
4 32.9 1.0% 30.9 1.4%
PEG 65.7 2.3%
PDMS 58.6 0.8%
Ethyl acetate 3 90.3 1.1% 93.1c –
4 44.8 0.9% 75.1c –
PEG 129 2.1% 290c –
PDMS 178 1.5% 1036c –
PDMS/DVB 2704c –
Methylamine 3 Ion. – 105 0.8%
4 Ion. – 34.7 5.6%
PEG Ion. – 191 –
PDMS Ion. – 137 –
PDMS/DVB Ion. – 288 –
Dimethylamine 3 Ion. – 135 1.7%
4 Ion. – 81 1.4%
PEG Ion. – 229 –
PDMS Ion. – 319 –
PDMS/DVB Ion. – 684 –
Trimethylamine 3 Ion. – 115 1.1%
4 Ion. – 200 1.1%
PEG Ion. – 213 –
PDMS Ion. – 2082 –
PDMS/DVB Ion. – 699 –
a Fiber #3 is polymeric [(StirIM)2C6, 2 NTf2− ]n; Fiber #4 is the triflate version of #3 (Table 1); PEG polyethylene glycol, fiber 60 µm coating
thickness, PDMS polydimethylsiloxane, fiber 100 µm coating thickness, PDMS/DVB polydimethylsiloxane divinylbenzene, fiber 65 µm coatingthickness. More compounds are presented in the supporting informationbRSD relative standard deviation on six successive extractions of the same samplec Ethyl acetate decomposes in ethanol and sodium acetate at pH 11. The measurements were especially done at pH 7.
p.a. peak area, ion. the compound ionizes at the measurement pH
Bonded ionic liquid for headspace SPME 521

factors equal or higher to those obtained for short-chainalcohols at both pHs (Table 4). The amine sensitivity factorsare however significantly lower than the correspondingfactors obtained with the three commercial fibers. It mustbe pointed out that the 65-µm PDMS/DVB commercial fiberwas specially designed to extract basic compounds. It didproduce sensitivity factors for amines higher than those of allother fibers except for trimethylamine.
When considering these extractions in relative terms, thepicture is different. Figure 6 (top chart) shows the relativeresponse ratios (ethyl acetate reference compound) of theamines extracted by immersion at pH 11. The IL fibersensitivities for the amine compounds seem significantlybetter than the commercial fibers sensitivities. This figurewill not be commented on any further because it was notobtained with a true internal standard. The internal standard,ethyl acetate, used to prepare Figs. 4 and 5 is not stable at pH11 as it slowly decomposes to ethanol and sodium acetate.So its sensitivity factor was specially measured at pH 7meaning that the standard was not present with the aminecompounds as a true internal standard should be. This couldinduce a bias in Fig. 6 (top chart). Figure 6 (bottom chart)shows the same Table 4 data using n-propanol as an internalstandard. n-Propanol is not the same standard as the one usedin Figs. 4 and 5 but is was present with the aminecompounds since it is stable at pH 11. Figure 6 top andbottom show very similar results for the two IL fiberscompared to one another and also compared to thecommercial PEG fiber. The PDMS and PDMS/DVBcommercial fiber relative responses look very different andmuch higher than those of the two IL fibers when the trueinternal standard n-propanol is the reference compound.
Polar n-propanol is not as good as the less polar ethyl acetateas an internal standard. Since n-propanol adsorbs more onthe polymeric IL fibers and PEG fiber than on the less polarPDMS/DVB fiber (Fig. 5), used as the internal standard, ittends to produce underestimated relative sensitivity factorsfor the IL fibers and/or overestimated values for the PDMS-based fibers. There is no definitive conclusion comparing thenew polymeric IL fibers to the commercial PDMS andPDMS/DVB fibers; however, there is no doubt that the ILfibers are able to extract short amines effectively.
Durability of the IL fibers
The headspace procedure is a very gentle process for thefibers and did not pose any durability problems. Theimmersion procedure put much more mechanical strain onthe fiber itself since the Varian 8200 auto sampler uses astrong vibrator similar to that used in an electrical razor. Itis extremely harsh on the fiber coating vibrating it at about50 Hz. However, a single triflate Fiber #4 was used to doall the more than 50 immersion experiments done in thisstudy. If two Fiber #3 were needed, it is because one brokedue to improper installation into the auto sampler. Thefibers were very durable. The thickness of the fiber coatingremained the same. The fiber coloration did change afterthe initial 220 °C conditioning but remained stable andconsistent after all immersions and GC analyses done forthe study. No indications of visual fiber coating deteriora-tion were noted throughout the study.
Peak tailings were observed on the GC peaks of amines.A 30 °C desorption temperature increase was tried toimprove the peak shape increasing the amine desorption
0
1
2
3
4
5
Aceto
nitrile
Met
hano
l
Ethan
ol
n-PrO
HIP
A
n-BuO
H
Aceto
ne
MTBE
1,4,
Dioxan
e
Butyr
ic Acid
Pheno
l
rela
tive
sig
nal
(E
tOA
c re
f.)
IL3-polym-NTf2–
IL4-polym-TfO–
60 um PEG
100 um PDMS
27.1
24.3 89.6 25.7
Fig. 5 Relative response ratiosof analytes in immersionanalyses at pH 2 with two ILsand two commercial fibers. TheTable 4 sensitivity factors foreach analyte and each fiber areexpressed as their ratio over theethyl acetate correspondingfactor to take into account thedifferences between adsorbentmasses
522 E. Wanigasekara et al.

rate. The GC injector temperature was raised to 250 °C. Nosignificant changes were observed in either the analytesensitivities or the GC peak shapes. However, the IL fiberswithstood this temperature increase without damage furthershowing their durability.
Conclusion
Ionic liquids were found to have an intermediate polarityanalogous to that of ethanol [15]. Upon polymerization andbonding to silica particles, the liquid state of ILs is lost butthe other unique properties, such as low volatility andpolarity associating apolar and charge–charge interactions,
are maintained. It was demonstrated that the polymerizedIL-bonded silica particles could be coated on SPME fibersto be used for the extraction of small and polar molecules.The headspace, as well as the immersion SPME protocols,was used to quantitate short-chain alcohols down to the10 ppb level. The efficacy of the method was tested bychecking the ethanol content of a variety of beverages and aNIST standard material. Small amines were extracted usingthe immersion procedure at pH 11 demonstrating thestability of the polymerized IL-coated silica particles. Thenature of the anion, triflate or bis-triflyl amide, couldinfluence the overall polarity of the IL. However, no cleardifferences were found between the two fibers maderespectively with these two anions.
6.5
0
1
2
3
4
5
6
Met
hylam
ine
Dimet
hylam
ine
Trimet
hylam
ine
Isopr
opyla
mine
Isopr
opyla
lcoho
l
n-Pro
pano
l
Diethy
lamine
Butyla
mine
Trietlh
ylam
ine
rela
tive
sig
nal
(re
f. E
tOA
c) .
IL3-polym-NTf2–
IL4-polym-TfO–
PEG
PDMS
PDMS-DVB
11.2
11.3
0
1
2
3
4
5
6
Met
hylam
ine
Dimet
hylam
ine
Trimet
hylam
ine
Isopr
opyla
mine
Isopr
opyla
lcoho
l
n-Pro
pano
l
Diethy
lamine
Butyla
mine
Trietlh
ylam
ine
rela
tive
sig
nal
(re
f. n
-pro
pan
ol)
.
8.9 7.1 38
12 18 15 22
41
8.4
9.3 8.2 42
Fig. 6 Relative response ratiosof analytes in immersionanalyses at pH 11 with two ILsand three commercial fibers.The Table 4 sensitivity factorsfor each analyte and each fiberare expressed as their ratio over,top figure the ethyl acetatecorresponding factor (obtainedat pH 7) and, bottom n-propanolfactor to take in account thedifferences between adsorbentmasses
Bonded ionic liquid for headspace SPME 523

Acknowledgments Daniel W. Armstrong acknowledges the RobertA. Welch foundation (Y-0026) for support of this work. Alain Berthodthanks the French Centre National de la Recherche Scientifique(UMR5180, Pierre Lanteri) for financial support.
References
1. Arthur CL, Pawliszyn J (1990) Solid-phase microextraction withthermal desorption using fused silica optical fibers. Anal Chem62:2145–2148
2. Pawliszyn J, Pawliszyn B, Pawliszyn M (1997) Solid phasemicroextraction (SPME). The Chemical Educator. doi:10.1333/s00897970137a
3. Pawliszyn J (1997) Solid phase microextraction theory andpractice. Wiley, New York, NY, USA
4. Scheppers Wercinsky SA (1999) Solid phase microextraction. Apractical guide. CRC Press, Boca Raton, FL, USA
5. Hinshaw JV (2003) Solid phase microextraction. LC&GC(Europe) 16:803–807; (North America) 21:1056–1061
6. Majors R (2008) The role of polymers in solid-phase extractionand sample preparation. LC&GC (North America) 26:1074–1090
7. Venkatachalam M. (1999) Properties of Commercial SPMECoatings. In: Pawliszyn J (ed) Applications of SPME. RSCChromatography Monographs, Ch. 5, pp 57–72
8. Anonymous (1998) SPME: theory and optimization of conditions,Supelco bulletin 923. Supelco, Bellefonte, PA, USA
9. Mullett VM, Pawliszyn J (2003) The development of selectiveand biocompatible coatings for SPME. J Sep Sci 26:251–260
10. Jiang G, Huang M, Cai Y, Lv J, Zhao J (2006) Progress of SPMEcoatings and coating techniques. J Chromatogr Sci 44:324–332
11. Dietz C, Sanz J, Cámara C (2006) Recent developments in SPMEcoatings and related techniques. J Chromatogr A 1103:183–192
12. Earle MJ, Seddon KR (2000) Ionic liquids: green solvents for thefuture. Pure Appl Chem 72:1391–1398
13. Olivier-Bourbigou H, Magna L (2002) Ionic liquids: perspectivesfor organic and catalytic reactions. J Mol Catal A: Chem 182–183:419–437
14. Wasserscheid P, Welton T (eds) (2003) Ionic liquids in synthesis.Wiley, Weinheim, Germany
15. Carda-Broch S, Berthod A, Armstrong DW (2003) Solventproperties of the 1-butyl-3-methylimidazolium hexafluorophos-phate ionic liquid. Anal Bioanal Chem 375:191–199
16. Koel M (ed) (2009) Ionic liquids in chemical analysis. CRC, BocaRaton, FL, USA
17. Anderson JL, Armstrong DW, Wei GT (2006) Ionic liquids inanalytical chemistry. Anal Chem 78:2893–2901
18. Berthod A, Ruiz-Angel MJ, Carda-Broch S (2008) Ionic liquids inseparation techniques. J Chromatogr A 1184:6–18
19. Poole CF, Kollie TO (1993) Interpretation of the influence oftemperature on the solvation properties of GC stationary phasesusing Abraham’s solvation parameter model. Anal Chim Acta282:1–17
20. Armstrong DW, He L, Liu YS (1999) Examination of ionicliquids and their interaction with molecules when used asstationary phases in gas chromatography. Anal Chem 71:3873–3876
21. Anderson JL, Armstrong DW (2003) High stability ionic liquids:a new class of stationary phases for gas chromatography. AnalChem 75:4851–4858
22. Anderson JL, Armstrong DW (2005) Immobilized ionic liquids ashigh selectivity/high temperature/high stability gas chromatogra-phy stationary phases. Anal Chem 77:6453–6462
23. Vidal L, Psillakis E, Domini CE, Grane N, Marken F, Canals A(2007) An ionic liquid for headspace single drop microextractionof chlorobenzenes from water samples. Anal Chim Acta 584:18–195
24. Aguilera-Herrador E, Lucena R, Cárdenas S, Valcárcel M (2008)Direct coupling of ionic liquids based single drop microextractionand GC/MS. Anal Chem 80:793–800
25. Hsieh YN, Huang PC, Sun IW, Whang TJ, Hsu CY, Huang HH,Kuei CH (2006) Nafion membrane supported ionic liquid solidphase microextraction for analyzing ultra-trace PAHs in watersamples. Anal Chim Acta 557:321–328
26. Zhao F, Meng Y, Anderson JL (2008) Polymeric ionic liquid asselective coatings for the extraction of esters using solid-phasemicroextraction. J Chromatogr A 1208:1–9
27. He Y, Pohl J, Engel R, Rothman L, Thomas M (2009) Preparationof ionic liquid based solid-phase microextraction fiber and itsapplication to forensic determination of methamphetamine andamphetamine in human urine. J Chromatogr A 1216:4824–4830
28. Huang K, Han X, Zhang X, Armstrong DW (2007) PEG-linkedgeminal ionic liquids as selective, high-stability GC stationaryphase. Anal Bioanal Chem 389:2265–2275
29. Wu CH, Chen CL, Huang CT, Lee MR, Huang CM (2004)Identification of gasoline soot in suspect arson cases by usingheadspace solid phase microextraction-GC/MS. Anal Let37:1373–1384
30. Anderson JL, Ding J, Welton T, Armstrong DW (2002)Characterizing ionic liquids on the basis of multiple solvationinteractions. J Am Chem Soc 124:14247–14254
31. Berthod A, Ruiz-Angel MJ, Huguet S (2005) Nonmolecularsolvents in separation methods: dual nature of room temperatureionic liquids. Anal Chem 77:4071–4080
32. Sprunger LM, Gibbs J, Proctor A, Acree WE, Abraham MH,Meng Y, Yao C, Anderson JL (2009) Linear free energyrelationship correlations for room temperature ionic liquids:revised cation-specific and anion-specific equation coefficientsfor predictive applications covering a much larger area ofchemical space. Ind Eng Chem Res 48:4145–4154
524 E. Wanigasekara et al.