Bioaccumulation study of acrylates in algae ( Chlorella kessleri ) by Py-GC and Py-GC/MS
13
CEJC 3(3) 2005 570–582 Bioaccumulation study of acrylates in algae (Chlorella kessleri ) by Py-GC and Py-GC/MS LadislavHal´as 1∗ , Andrej Oriˇ n´ak 1 , Abubaker Sharif 1 , Monika ´ Ad´amov´a 1 , Juraj Ladomersk´ y 2 1 Institute of Chemistry, Faculty of Sciences, University of P.J. ˇ Saf´ arik, Moyzesova 11, 041 54 Koˇ sice, Slovakia 2 Faculty of Ecology and Environmental Sciences, Technical University, Kolpaˇ ssk´ a 9B, 969 01 Bansk´ a ˇ Stiavnica, Slovakia Received 22 November 2004; accepted 17 May 2005 Abstract: Acrylate monomers methylmethacrylate (MMA) and cyclohexylmethacrylate (CHMA) bioaccumulation has been determined in aquatic organism, algae (Chlorella kessleri ). Algae were collected in amount of 0.4 mg and directly injected to the pyrolytical cell. In algae bodies accumulated monomers were analysed by pyrolysis gas chromatography (Py-GC) and pyrolysis gas chromatography coupled with mass spectrometry (Py-GC/MS). Traces of the accumulated monomers in algae body can be determined after 1-, 2 -, 3-weeks of incubation. Maximum content of MMA was determined after 3-week of experiment, contrariwise in the case of CHMA after 2-week exposition. Relationship with pyrolysis temperature has also been studied. c Central European Science Journals. All rights reserved. Keywords: Pyrolysis gas chromatography (Py-GC), MMA, CHMA, algae (Chlorella kessleri), bioaccumulation 1 Introduction Pyrolysis gas chromatography has been applied to the study of biological materials for more than two decades [1]. Much of the work has been done in an effort to identify and differentiate microorganism [2-3], such as the work by Smith et al. [4] who found a chemical marker for distinguishing Group A and Group B streptococci. Many biological ∗ E-mail: [email protected]
Transcript of Bioaccumulation study of acrylates in algae ( Chlorella kessleri ) by Py-GC and Py-GC/MS
CEJC 3(3) 2005 570–582
Bioaccumulation study of acrylates in algae(Chlorella kessleri) by Py-GC and Py-GC/MS
Ladislav Halas1∗, Andrej Orinak1, Abubaker Sharif1, Monika Adamova1,Juraj Ladomersky2
1 Institute of Chemistry, Faculty of Sciences,
University of P.J. Safarik,Moyzesova 11, 041 54 Kosice, Slovakia
2 Faculty of Ecology and Environmental Sciences,Technical University,
Kolpasska 9B, 969 01 Banska Stiavnica, Slovakia
Received 22 November 2004; accepted 17 May 2005
Abstract: Acrylate monomers methylmethacrylate (MMA) and cyclohexylmethacrylate
(CHMA) bioaccumulation has been determined in aquatic organism, algae (Chlorella kessleri).
Algae were collected in amount of 0.4 mg and directly injected to the pyrolytical cell. In
algae bodies accumulated monomers were analysed by pyrolysis gas chromatography (Py-GC)
and pyrolysis gas chromatography coupled with mass spectrometry (Py-GC/MS). Traces of the
accumulated monomers in algae body can be determined after 1-, 2 -, 3-weeks of incubation.
Maximum content of MMA was determined after 3-week of experiment, contrariwise in the
case of CHMA after 2-week exposition. Relationship with pyrolysis temperature has also been
studied.
c© Central European Science Journals. All rights reserved.
Keywords: Pyrolysis gas chromatography (Py-GC), MMA, CHMA, algae (Chlorella kessleri),
bioaccumulation
1 Introduction
Pyrolysis gas chromatography has been applied to the study of biological materials for
more than two decades [1]. Much of the work has been done in an effort to identify
and differentiate microorganism [2-3], such as the work by Smith et al. [4] who found
a chemical marker for distinguishing Group A and Group B streptococci. Many biological
∗ E-mail: [email protected]
L. Halas et al. / Central European Journal of Chemistry 3(3) 2005 570–582 571
materials including biomass [5], enzymes [6], steroids [7], have been assayed using Py-GC.
Recently a method for analysing small quantities of samples was developed, and is based
on either pyrolysis-GC (Py-GC) or Py-GC/MS [8]. Russell [9] used Py-MS for identifica-
tion and systematisation of brown algae. Cejka [10] analysed by Py-GC/MS fossil organic
matter from sediments, which consists of different type of algae. Derrene [11] used flash
pyrolysis with GC/MS to characterise intractable organic molecules in algae. Kruge [12]
by Py-GC/MS studied aquatic organic matter in the open water sediment samples and he
identified nitrogen compounds in the pyrolyzate including pyrroles, pyridines and indoles.
These compounds are characteristic pyrolysis products of proteins and degraded proteina-
ceous matter, in this case largely from marine algae and bacteria. Ishida [13] applied, the
reactive Py-GC to the determination of the lipid contents and their fatty acid compo-
sition of every zooplankter individual at different algae concentration. Algae (Chlorella
kessleri) present an organism, which are belonging to the best natural detoxifier for heavy
metals and other synthetics. Chlorella has been used extensively as a detoxifying agent
for variety of heavy metals, insecticides and other toxins. The detoxification capability
of Chlorella is due to its unique cell wall and the material associated with it. The cell
walls of Chlorella have been shown to have three layers of which the thicker middle layer
contains a polymerised carotene material. Laboratory studies showed that there were two
active absorbing substances – sporopolenin (a naturally occurring carotene like polymer
which is resistant to degradation) and the algae cell walls [14]. Most studies on chemical
components in aquatic organisms have been made by extraction and transmethylation
followed by using gas chromatography (GC) or liquid chromatography (LC) [15]. Such
conventional methods, however, are not effective for analysis of small organisms such as
phytoplankton (algae), because a large quantity is required for analysis. Furthermore, it
is difficult to evaluate the biological effect of the components on an individual organism
and the accumulation of specific compound, because biological changes in each organism
are affected by the organism’s life history, which includes exposure to many different envi-
ronmental conditions [16]. Sometimes the results of the laboratory and field experiments
are not directly comparable, zooplankton may accumulate more pollutants if incubated
with phytoplankton such as algae [16].
In last years incoming elevated produces of acrylates in paint, textile and paper in-
dustry. Therefore is necessary to identify this type of compound (monomers, polymers)
in waste waters. Methylmethacrylate is used preliminary to make variety of resins and
plastics and is most often polymerised to polymethyl methacrylate, which is used to make
acrylic sheets, acrylic moldings and extrusion powders. Cyclohexylmethacrylate present
base material for coatings and adhesives [17] Two different types of acrylates was used
in this experiment (MMA, which present an aliphatic monomer and CHMA with cyclic
structure).
This paper deals with determination of MMA and CHMA in algae (Chlorella kess-
leri) body. This algae strain has been growth in water solution containing with MMA
and CHMA. Pure algae (Chlorella kessleri) and MMA, CHMA were investigated by Py-
GC/MS. Traces of the accumulated monomers in algae body can be determined after 1-,
572 L. Halas et al. / Central European Journal of Chemistry 3(3) 2005 570–582
2 -, 3-weeks of incubation. Maximum content of MMA was determined after 3-week of
experiment, contrariwise in the case of CHMA after 2-week exposition. Relationship with
pyrolysis temperature has also been studied.
2 Experimental
2.1 Chemicals and material
Algae strain (Chlorella kessleri) was purchased from Botanic Institute, Bratislava (Slo-
vakia) and magnesium sulphate, di-potassium hydrogen phosphate, potassium nitrate,
iron chloride were available from Lachema Brno (Czech Republic). Cyclohexylmethacry-
late (CHMA) and methylmethacrylate (MMA) were purchased from Sigma-Aldrich GmbH
(Germany) with p.a. purity. Special pelletiser syringe has been used for samples intro-
duction into the pyrolyser for Py-GC/MS analysis. Balance AE 240 (Mettler-Toledo,
Switzerland) was used.
2.2 Algae samples
The phytoplankton samples (Ch.kessleri) were cultivated in our laboratory in specific
medium. Cultivation medium consists of: 1l distilled water and 10 ml 1 % potassium
nitrate, 1 ml 1 % magnesium sulphate, 1 ml 1 % di-potassium hydrogen phosphate, 0.2 ml
1 % iron chloride. The original solution was exposed to oxygen and light overnight under
room temperature. The phytoplankton samples (Ch. kessleri) were exposed in a static
renewed system for 1- week to 0.08 ppm of CHMA and 0.4 ppm of MMA solution. After
1-,2- and 3-week exposition the medium was centrifuged, filtered, washed with re-distilled
water and then analysed.
2.3 Pyrolysis-gas chromatography (Py-GC)
Coupled Py-GC system contained a microfurnace pyrolyzer (SGE, Pyrojector II, Aus-
tralia) with GC 9000 Series (Fisons) gas chromatograph. Pyrolysis of treated sample was
performed at 600, 700, 800, 850 ◦C for monomers nonexposed algae. The algae samples
after 1-,2-,3,-week incubation were inserted to the solid sampler and analysed at 850 ◦C.
Separation of pyrolytical products was achieved on a 30 m Sol Gel Wax capillary column:
inner diameter, 0.25 mm, film thickness – 0.25 µm (SGE, Australia). The column tem-
perature was kept at 70 ◦C for 2 minutes and programmed to 170 ◦C at the increments
of 10 ◦C/min. The GC conditions were: injector at 150 ◦C, flame ionization detector
(FID) at 150 ◦C, nitrogen as carrier gas (flow rate, 0.6 ml/min). Split injection mode has
been established with 1/25 splitting ratio. Internal volume of liner in pyrojector was 0.43
cm3 and the nitrogen gas pressure was set to 165 kPa. Flash pyrolysis has been applied.
Py-GC/FID has been used for quantitative MMA and CHMA analysis.
L. Halas et al. / Central European Journal of Chemistry 3(3) 2005 570–582 573
2.4 Pyrolysis-gas chromatography/mass spectrometry (Py-GC/MS)
The pure algae sample was injected into the pyrolyzer and then thermally degraded at
500, 600, 700, 800, 850 ◦C. Py-GC/MS analysis was made by using a combination of
a model microfurnace pyrolyzer (SGE, Australia) and GC/MS (Saturn Varian 2100 T).
The GC was operated at an injector temperature of 150 ◦C, helium as a carrier gas 1
ml/min, and a DB-5 capillary column (30 m × 0,25 mm ID × 0.25 µm thickness) was
used. The column temperature was kept at 70 ◦C for 2 minutes and programmed to 170◦C at the increments of 10 ◦C/min. The mass spectra of compounds were measured at
70 eV. Mass spectra library (NIST 98) was used at spectra interpretation. Py-GC/MS
has been employed at pyrolysate analyte identification.
3 Results and discussion
3.1 Results from MMA, CHMA, algae single standard analysis by Py-GC
Nonexposed strain of Chlorella kessleri was analysed at different pyrolysis temperatures.
The chromatograms showing pyrolysate composition changes at different temperatures are
given at Fig.1 (a-d). At 600 ◦C algae bodies decomposed completely; the most analytes
from pyrolysate were obtained. These compounds have the same retention times as the
analytes from monomers MMA and CHMA analysis and they can to be coeluted. The
simplest pyrograms were obtained at 800-850 ◦C. At these pyrolysis temperatures were
both monomers well separated and detected. In the case of algae, at 850 ◦C we obtained
a simple pyrogram. First two main peaks presented the fingerprints of monomers with
retention time in the interval up to the 6 minutes. Monomers fingerprint was used for
the next identification in bioaccumulation study.
From Py-GC/MS analyses of algae body it was resulted that degradation of algae
started at 500 ◦C. Py-GC/MS analysis was executed in different range of pyrolysis temper-
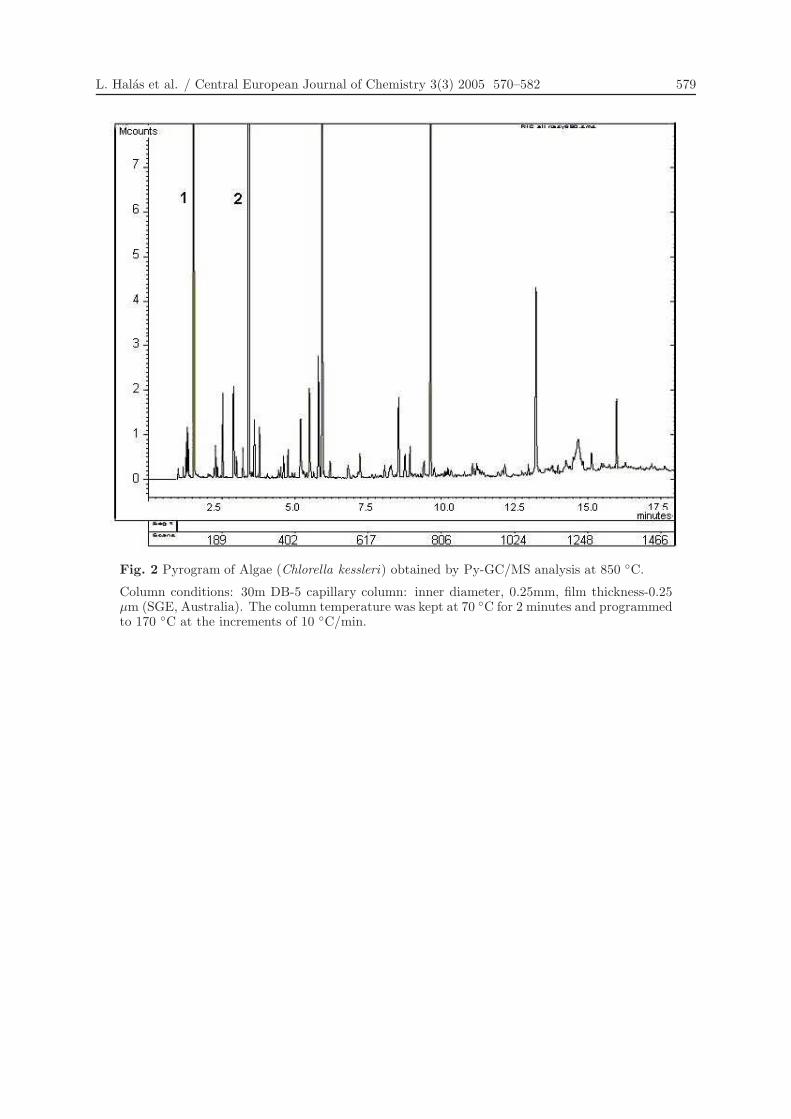
ature (500-900 ◦C). Typical MS spectrum of pure algae at 850 ◦C is presented on Figure 2.
The first two intensive peaks was determined by mass spectra library, the first peak with
tR = 1,58 min. as 7-hydroxy-7,8,9,10-tretramethyl-7,8-dihydrocyclohepta-naphtalene and
the peak with tR = 3,43 min. 1,2,3-triphenyl-3-methyl-cyclopropene (Fig.2). Peaks with
higher retention times have a higher mass with molecular weight about 500 g mol−1.
Optimal degradation temperature to get fingerprints for MMA and CHMA to avoid
simultaneous interference of algae degradation products ranged from 750-850 ◦C. At every
analysis of MMA and CHMA treated algae were samples analysed of monomer untreated
algae strain with the same sample amount. The contribution of algae background was
substracted from real sample for MMA or CHMA when coeluted. From overlaid pyrogram
in Figure 4 it is evident that peaks corresponding to MMA and species from algae strain
pyrolysis.
574 L. Halas et al. / Central European Journal of Chemistry 3(3) 2005 570–582
3.2 Results from algae strain Py-GC analysis after CHMA long-term ex-
position
Simple test of monomers toxicity has been done as the first. Determined lethal concen-
tration of CHMA for algae was 0.1 ppm. CHMA monomer was added to algae samples
under the amount, which presented the lethal concentration (CHMA 0.08 ppm). Analy-
sis of prepared sample was executed at 850 ◦C. CHMA accumulation was identified after
1-week incubation, however the highest amount of CHMA has been determined from
calibration curve and maximum accumulated amount in algae body was 0.2 ppm after
2-week exposition (Fig.3). This amount was two times higher as than the acute toxicity
of CHMA in Chlorella body. Pyrograms declaring CHMA content in algae body after 3
weeks incubation are given in the Fig.3. In the case of CHMA the highest intensity of
peaks (which belong to degradation products of CHMA) and the number of pyrolytical
products we observed after 2-week incubation. The highest amount of CHMA in Chlorella
bodies was detected after 2-week exposition.
3.3 Results from algae after MMA long-term exposition
Fig. 4 shows the pyrograms of algae with MMA (0.4 ppm) after 1-,2-,3-week incuba-
tion. Although the observed accumulation of MMA was negligible during the 1st week
of exposure, a significant change in the concentration was detected after 1-week expo-
sure. During the first week exposure amount of pyrolysates and abundance of detected
peaks was the same as the pyrolysates from original algae strain. A significant change
we observed after 2- and 3-week exposure while the abundance of peaks and the amount
of pyrolysates were gradually increased. After toxicity test of Chlorella by MMA (LC
of MMA for Chlorella was 0.5 ppm). The highest amount of MMA has been identified
after third week exposition from calibration curve as in CHMA case and the maximum
accumulated amount of MMA was 1.2 ppm (Fig.5). In the next step to pure algae was
added 0.5 µl concentrated (99 %) monomer and samples was analysed. Both MMA and
CHMA (internal standard) were detected in the programs at the same retention time.
Intensity of the same peaks was increased as after long term accumulation.
The highest amount of MMA was identified after 3-week exposition but this amount
was three times higher as than the acute toxicity of MMA in algae body. According
to a Finish report of long-term experiments by a model ecosystem in Baltic Sea, the
bioaccumulation of polychlorinated biphenyls and metabolites from water ranged from
50 times for algae to 700 times for invertebrates and fish. It’s very hard to ensure similar
conditions such as in water environment. A remaining question is how complex an exper-
imental system must be given a realistic assessment of the effect of effluents in ecosystem.
Although the results of the laboratory and field experiments are not comparable, for ex-
ample zooplankton accumulated more toxic compounds if incubated with phytoplankton
such as algae, in a model ecosystem [16].

L. Halas et al. / Central European Journal of Chemistry 3(3) 2005 570–582 575
4 Conclusion
Py-GC enables direct sampling of solid sample and also from this reason is appropriate
on analysis of biological samples, which not require pre-treatment of sample; conventional
GC or LC method require pre-extraction from larger amounts of organisms, and require
a total analysis time of 2-3 days.
Pyrolysis of pure algae (Chlorella kessleri) and bioaccumulation of monomers (MMA,
CHMA) was investigated by Py-GC. Optimal degradation temperature to get fingerprints
for MMA and CHMA to avoid simultaneous interference of algae degradation products
ranged from 750-850 ◦C.
The highest accumulation of CHMA was observed after 2-week incubation, contrari-
wise MMA was not detected after 1-week exposition, but bioaccumulation of MMA was
gradually elevated. The highest amount of MMA has been identified after third week ex-
position from calibration curve as in CHMA case and the maximum accumulated amount
of MMA was 1.2ppm. CHMA accumulation was identified after 1-week incubation, how-
ever the highest amount of CHMA has been determined from calibration curve and max-
imum accumulated amount in algae body was 0.2 ppm after 2-week exposition.
Acknowledgment
The authors wish thank for financial support by grant VEGA 1/0445/03.
References
[1] Thomas P. Wampler: ”Introduction to pyrolysis-capillary gas chromatography”, J.Chromatogr. A, Vol. 842, (1999), pp. 207–220.
[2] R. Goodacre, R. Harvey, A.S. Howell, L.W. Greenham and C.W. Noble: ”Anepidemiological study of Staphylococcus intermedius strains isolated from dogs, theirowners and veterinary surgeons”, J. Anal. Appl. Pyrol., Vol. 44, (1997), pp. 49–64.
[3] J.K. Voorhees, F. Basile, B.M. Beverly, Ch. Abbas-Hawks, A. Hendricker, R.B. Codyand L.T. Hadfield: ”The use of biomarker compounds for the identification of bacteriaby pyrolysis-mass spectrometry”, J. Anal. Appl. Pyrol., Vol. 40–41, (1997), pp. 111–134.
[4] C.C. Smith, S.L. Morgan, C.D. Parks, A. Fox and D.G. Pritchard: ”Chemicalmarker for the differentiation of group A and group B streptococci by pyrolysis-gaschromatography-mass spectrometry”, Anal. Chem., Vol. 59, (1987), pp. 1410.
[5] G. Varhegyi, M.J. Antal, M. Jakab and P. Szabo: ”Kinetic modeling of biomasspyrolysis”, J. Anal. Appl. Pyrol., Vol. 42, (1997), pp. 73–87.
[6] N.D. Danielson, J.L. Glajch and L.B. Rogers: ”Pyrolysis gas chromatography ofenzymes”, J. Chromatogr. Sci., Vol. 16, (1978), pp. 455–461.
[7] F.M. Menger, G.A. Epstein, D.A. Goldberg and E. Reiner: ”Computer matchingof pyrolysis chromatograms of pathogenic microorganisms”, Anal. Chem., Vol. 44,(1972), pp. 423–424.
576 L. Halas et al. / Central European Journal of Chemistry 3(3) 2005 570–582
[8] Y. Ishida, H. Yokoi, S. Isomura, H. Ohtani, S. Tsuge, T. Sekino, M. Nakanishi andT. Kimoto: ”Correlation analysis between fatty acid compositions of zooplankterindividuals, fed on different phytoplankton species by means of pyrolysis-gaschromatography combined with on-line methylation”, J. Chromatogr. B, Biomed.Sci. Appl., Vol. 716(1-2), (1998), pp. 39–45.
[9] G. Russell: ”Pyrolysis mass spectrometry: a fresh approach to old problems in brownalgal systematics?”, Mar. Biol., Vol. 123, (1995), pp. 153–157.
[10] J. Cejka and Z. Sobalik: ”Laboratory oxidation of fossil organic matter studied by insitu infrared spectrocopy, rock-eval pyrolysis and pyrolysis gas-chromatography-massspectrometry”, Collect. Czech. Chem. C., Vol. 62, (1997), pp. 364–374.
[11] S. Derrene, C. Largeau and E. Cassadevall: ”Occurrence of tightly bound isoprenoidacids in an algal, resistant biomacromolecule: possible geochemical implications”,Org. Geochem., Vol. 17, (1991), pp. 597–602.
[12] M.A. Kruge, P.K. Mukhopadhyay and C.F.M. Lewis: ”A molecular evaluation ofcontaminants and natural organic matter in bottom sediments from western LakeOntario”, Org. Geochem., Vol. 29, (1998), pp. 1797–1812.
[13] Y. Ishida, H. Ohtani, S. Tsuge, T. Sekino, M. Nakanishi and T. Kimoto: ”Analysis oflipid components in zooplankter individuals by reactive pyrolysis gas chromatographyin the presence of organic alkali”, Biol. Sci. Space, Vol. 12(2), (1998), pp. 131–135.
[14] www.chlorella-europe.com
[15] G. Kattner and H.S.G. Fricke: ”Simple gas-liquid chromatographic method for thesimultaneous determination of fatty acids and alcohols in wax esters of marineorganisms”, J. Chromatogr. A, Vol. 361, (1986), pp. 263.
[16] H. Araki, N. Tatarazako, K. Kishi and K. Kuroda: ”Evaluation of bioaccumulationpotential of 3,4,5-trichloroguaiacol in a zooplankton (Daphnia magna) by pyrolysis-GC/MS in the presence of tetramethylammonium hydroxide (TMAH)”, J. Anal.Appl. Pyrol., Vol. 55, (2000), pp. 69–80.
[17] J.S. Gift: Toxicological Review of Methylmethacrylate, U.S. Protection Agency,Washington, 1998, pp. 3–15.

L. Halas et al. / Central European Journal of Chemistry 3(3) 2005 570–582 577
a)
b)
Fig. 1 Pyrogram of Algae (Chlorella kessleri) obtained by Py-GC analysis:
a) pyrolysis temperature 600 ◦C;b) pyrolysis temperature 700 ◦C.
Column conditions: 30m Sol Gel Wax capillary column: inner diameter, 0.25 mm, film thickness-0.25 µm (SGE, Australia). The column temperature was kept at 70 ◦C for 2 minutes andprogrammed to 170 ◦C at the increments of 10 ◦C/min.

578 L. Halas et al. / Central European Journal of Chemistry 3(3) 2005 570–582
c)
d)
Fig. 1 (continued) Pyrogram of Algae (Chlorella kessleri) obtained by Py-GC analysis:
C = pyrolysis temperature 800 ◦C;D = pyrolysis temperature 850 ◦C.
Column conditions: 30m Sol Gel Wax capillary column: inner diameter, 0.25 mm, film thickness-0.25 µm (SGE, Australia). The column temperature was kept at 70 ◦C for 2 minutes andprogrammed to 170 ◦C at the increments of 10 ◦C/min.
L. Halas et al. / Central European Journal of Chemistry 3(3) 2005 570–582 579
Fig. 2 Pyrogram of Algae (Chlorella kessleri) obtained by Py-GC/MS analysis at 850 ◦C.
Column conditions: 30m DB-5 capillary column: inner diameter, 0.25mm, film thickness-0.25µm (SGE, Australia). The column temperature was kept at 70 ◦C for 2 minutes and programmedto 170 ◦C at the increments of 10 ◦C/min.

580 L. Halas et al. / Central European Journal of Chemistry 3(3) 2005 570–582
Fig. 3 Graph of CHMA accumulation after different time exposition.

L. Halas et al. / Central European Journal of Chemistry 3(3) 2005 570–582 581
Fig. 4 Overlay: Pyrograms of Algae + CHMA at pyrolysis temperature 850◦C.
Colours:Blue = pure algae pyrolysis;Red = algae + CHMA after 1st week;Dark blue = algae + CHMA after 2nd week (the highest amount of CHMA);Light blue = algae + CHMA after 3rd week.
Column conditions: 30 m Sol Gel Wax capillary column: inner diameter, 0.25 mm, film thickness-0.25 µm (SGE, Australia). The column temperature was kept at 70 ◦C for 2 minutes andprogrammed to 170 ◦C at the increments of 10 ◦C/min.

582 L. Halas et al. / Central European Journal of Chemistry 3(3) 2005 570–582
Fig. 5 Graph of MMA accumulation after different time exposition.