Evaluation of GC-APCI/MS and GC-FID as a complementary platform
9
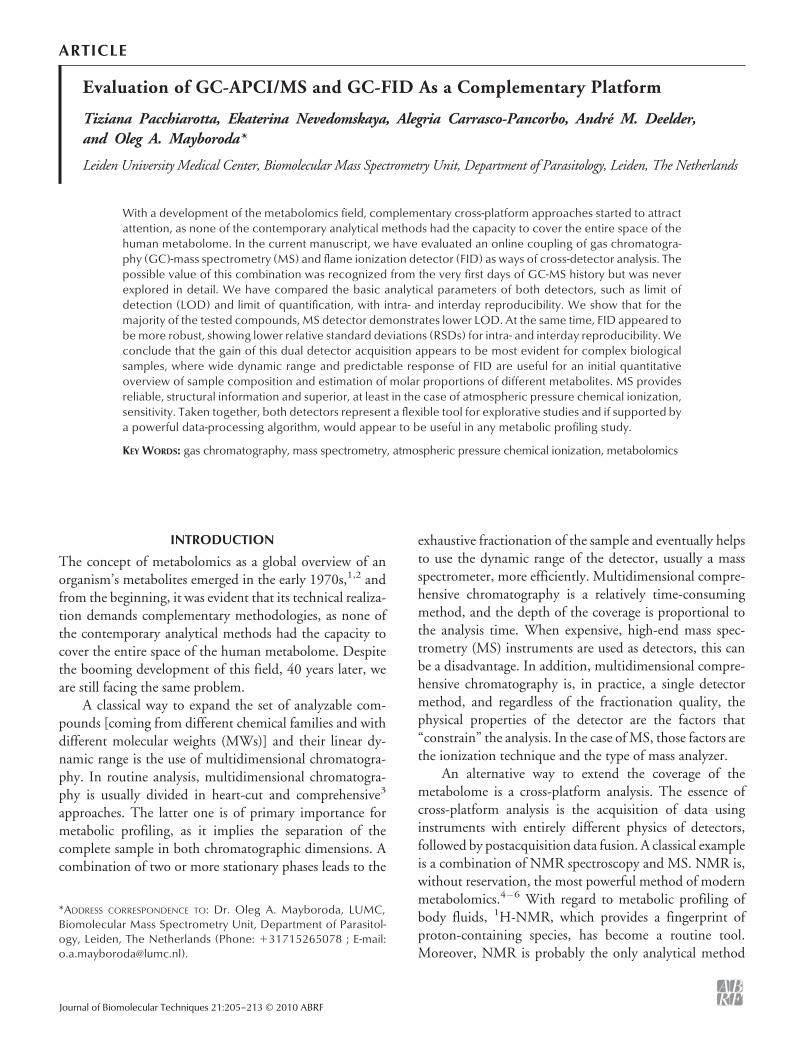
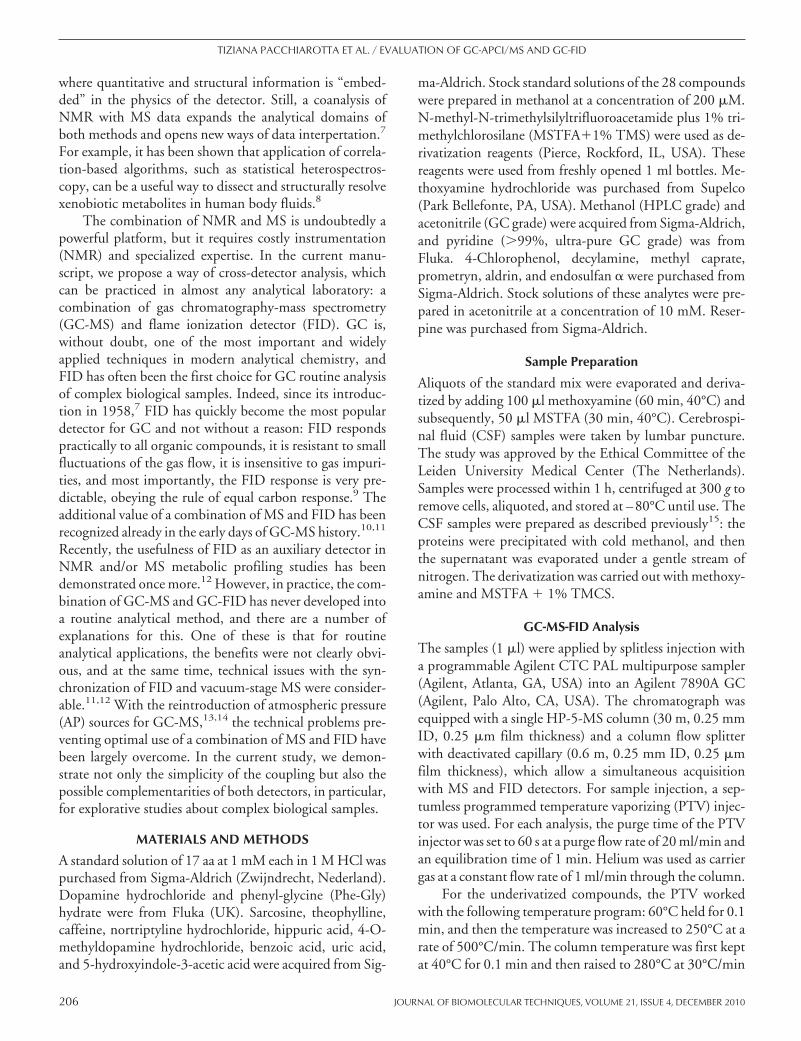
ARTICLE Evaluation of GC-APCI/MS and GC-FID As a Complementary Platform Tiziana Pacchiarotta, Ekaterina Nevedomskaya, Alegria Carrasco-Pancorbo, Andre ´ M. Deelder, and Oleg A. Mayboroda* Leiden University Medical Center, Biomolecular Mass Spectrometry Unit, Department of Parasitology, Leiden, The Netherlands With a development of the metabolomics field, complementary cross-platform approaches started to attract attention, as none of the contemporary analytical methods had the capacity to cover the entire space of the human metabolome. In the current manuscript, we have evaluated an online coupling of gas chromatogra- phy (GC)-mass spectrometry (MS) and flame ionization detector (FID) as ways of cross-detector analysis. The possible value of this combination was recognized from the very first days of GC-MS history but was never explored in detail. We have compared the basic analytical parameters of both detectors, such as limit of detection (LOD) and limit of quantification, with intra- and interday reproducibility. We show that for the majority of the tested compounds, MS detector demonstrates lower LOD. At the same time, FID appeared to be more robust, showing lower relative standard deviations (RSDs) for intra- and interday reproducibility. We conclude that the gain of this dual detector acquisition appears to be most evident for complex biological samples, where wide dynamic range and predictable response of FID are useful for an initial quantitative overview of sample composition and estimation of molar proportions of different metabolites. MS provides reliable, structural information and superior, at least in the case of atmospheric pressure chemical ionization, sensitivity. Taken together, both detectors represent a flexible tool for explorative studies and if supported by a powerful data-processing algorithm, would appear to be useful in any metabolic profiling study. KEY WORDS: gas chromatography, mass spectrometry, atmospheric pressure chemical ionization, metabolomics INTRODUCTION The concept of metabolomics as a global overview of an organism’s metabolites emerged in the early 1970s, 1,2 and from the beginning, it was evident that its technical realiza- tion demands complementary methodologies, as none of the contemporary analytical methods had the capacity to cover the entire space of the human metabolome. Despite the booming development of this field, 40 years later, we are still facing the same problem. A classical way to expand the set of analyzable com- pounds [coming from different chemical families and with different molecular weights (MWs)] and their linear dy- namic range is the use of multidimensional chromatogra- phy. In routine analysis, multidimensional chromatogra- phy is usually divided in heart-cut and comprehensive 3 approaches. The latter one is of primary importance for metabolic profiling, as it implies the separation of the complete sample in both chromatographic dimensions. A combination of two or more stationary phases leads to the exhaustive fractionation of the sample and eventually helps to use the dynamic range of the detector, usually a mass spectrometer, more efficiently. Multidimensional compre- hensive chromatography is a relatively time-consuming method, and the depth of the coverage is proportional to the analysis time. When expensive, high-end mass spec- trometry (MS) instruments are used as detectors, this can be a disadvantage. In addition, multidimensional compre- hensive chromatography is, in practice, a single detector method, and regardless of the fractionation quality, the physical properties of the detector are the factors that “constrain” the analysis. In the case of MS, those factors are the ionization technique and the type of mass analyzer. An alternative way to extend the coverage of the metabolome is a cross-platform analysis. The essence of cross-platform analysis is the acquisition of data using instruments with entirely different physics of detectors, followed by postacquisition data fusion. A classical example is a combination of NMR spectroscopy and MS. NMR is, without reservation, the most powerful method of modern metabolomics. 4–6 With regard to metabolic profiling of body fluids, 1 H-NMR, which provides a fingerprint of proton-containing species, has become a routine tool. Moreover, NMR is probably the only analytical method *ADDRESS CORRESPONDENCE TO: Dr. Oleg A. Mayboroda, LUMC, Biomolecular Mass Spectrometry Unit, Department of Parasitol- ogy, Leiden, The Netherlands (Phone: 31715265078 ; E-mail: [email protected]). Journal of Biomolecular Techniques 21:205–213 © 2010 ABRF
Transcript of Evaluation of GC-APCI/MS and GC-FID as a complementary platform
ARTICLE
Evaluation of GC-APCI/MS and GC-FID As a Complementary Platform
Tiziana Pacchiarotta, Ekaterina Nevedomskaya, Alegria Carrasco-Pancorbo, Andre M. Deelder,and Oleg A. Mayboroda*
Leiden University Medical Center, Biomolecular Mass Spectrometry Unit, Department of Parasitology, Leiden, The Netherlands
With a development of the metabolomics field, complementary cross-platform approaches started to attractattention, as none of the contemporary analytical methods had the capacity to cover the entire space of thehuman metabolome. In the current manuscript, we have evaluated an online coupling of gas chromatogra-phy (GC)-mass spectrometry (MS) and flame ionization detector (FID) as ways of cross-detector analysis. Thepossible value of this combination was recognized from the very first days of GC-MS history but was neverexplored in detail. We have compared the basic analytical parameters of both detectors, such as limit ofdetection (LOD) and limit of quantification, with intra- and interday reproducibility. We show that for themajority of the tested compounds, MS detector demonstrates lower LOD. At the same time, FID appeared tobe more robust, showing lower relative standard deviations (RSDs) for intra- and interday reproducibility. Weconclude that the gain of this dual detector acquisition appears to be most evident for complex biologicalsamples, where wide dynamic range and predictable response of FID are useful for an initial quantitativeoverview of sample composition and estimation of molar proportions of different metabolites. MS providesreliable, structural information and superior, at least in the case of atmospheric pressure chemical ionization,sensitivity. Taken together, both detectors represent a flexible tool for explorative studies and if supported bya powerful data-processing algorithm, would appear to be useful in any metabolic profiling study.
KEY WORDS: gas chromatography, mass spectrometry, atmospheric pressure chemical ionization, metabolomics
INTRODUCTION
The concept of metabolomics as a global overview of anorganism’s metabolites emerged in the early 1970s,1,2 andfrom the beginning, it was evident that its technical realiza-tion demands complementary methodologies, as none ofthe contemporary analytical methods had the capacity tocover the entire space of the human metabolome. Despitethe booming development of this field, 40 years later, weare still facing the same problem.
A classical way to expand the set of analyzable com-pounds [coming from different chemical families and withdifferent molecular weights (MWs)] and their linear dy-namic range is the use of multidimensional chromatogra-phy. In routine analysis, multidimensional chromatogra-phy is usually divided in heart-cut and comprehensive3
approaches. The latter one is of primary importance formetabolic profiling, as it implies the separation of thecomplete sample in both chromatographic dimensions. Acombination of two or more stationary phases leads to the
exhaustive fractionation of the sample and eventually helpsto use the dynamic range of the detector, usually a massspectrometer, more efficiently. Multidimensional compre-hensive chromatography is a relatively time-consumingmethod, and the depth of the coverage is proportional tothe analysis time. When expensive, high-end mass spec-trometry (MS) instruments are used as detectors, this canbe a disadvantage. In addition, multidimensional compre-hensive chromatography is, in practice, a single detectormethod, and regardless of the fractionation quality, thephysical properties of the detector are the factors that“constrain” the analysis. In the case of MS, those factors arethe ionization technique and the type of mass analyzer.
An alternative way to extend the coverage of themetabolome is a cross-platform analysis. The essence ofcross-platform analysis is the acquisition of data usinginstruments with entirely different physics of detectors,followed by postacquisition data fusion. A classical exampleis a combination of NMR spectroscopy and MS. NMR is,without reservation, the most powerful method of modernmetabolomics.4–6 With regard to metabolic profiling ofbody fluids, 1H-NMR, which provides a fingerprint ofproton-containing species, has become a routine tool.Moreover, NMR is probably the only analytical method
*ADDRESS CORRESPONDENCE TO: Dr. Oleg A. Mayboroda, LUMC,Biomolecular Mass Spectrometry Unit, Department of Parasitol-ogy, Leiden, The Netherlands (Phone: �31715265078 ; E-mail:[email protected]).
xxxxxxxxxxxx
Journal of Biomolecular Techniques 21:205–213 © 2010 ABRF
where quantitative and structural information is “embed-ded” in the physics of the detector. Still, a coanalysis ofNMR with MS data expands the analytical domains ofboth methods and opens new ways of data interpertation.7
For example, it has been shown that application of correla-tion-based algorithms, such as statistical heterospectros-copy, can be a useful way to dissect and structurally resolvexenobiotic metabolites in human body fluids.8
The combination of NMR and MS is undoubtedly apowerful platform, but it requires costly instrumentation(NMR) and specialized expertise. In the current manu-script, we propose a way of cross-detector analysis, whichcan be practiced in almost any analytical laboratory: acombination of gas chromatography-mass spectrometry(GC-MS) and flame ionization detector (FID). GC is,without doubt, one of the most important and widelyapplied techniques in modern analytical chemistry, andFID has often been the first choice for GC routine analysisof complex biological samples. Indeed, since its introduc-tion in 1958,7 FID has quickly become the most populardetector for GC and not without a reason: FID respondspractically to all organic compounds, it is resistant to smallfluctuations of the gas flow, it is insensitive to gas impuri-ties, and most importantly, the FID response is very pre-dictable, obeying the rule of equal carbon response.9 Theadditional value of a combination of MS and FID has beenrecognized already in the early days of GC-MS history.10,11
Recently, the usefulness of FID as an auxiliary detector inNMR and/or MS metabolic profiling studies has beendemonstrated once more.12 However, in practice, the com-bination of GC-MS and GC-FID has never developed intoa routine analytical method, and there are a number ofexplanations for this. One of these is that for routineanalytical applications, the benefits were not clearly obvi-ous, and at the same time, technical issues with the syn-chronization of FID and vacuum-stage MS were consider-able.11,12 With the reintroduction of atmospheric pressure(AP) sources for GC-MS,13,14 the technical problems pre-venting optimal use of a combination of MS and FID havebeen largely overcome. In the current study, we demon-strate not only the simplicity of the coupling but also thepossible complementarities of both detectors, in particular,for explorative studies about complex biological samples.
MATERIALS AND METHODS
A standard solution of 17 aa at 1 mM each in 1 M HCl waspurchased from Sigma-Aldrich (Zwijndrecht, Nederland).Dopamine hydrochloride and phenyl-glycine (Phe-Gly)hydrate were from Fluka (UK). Sarcosine, theophylline,caffeine, nortriptyline hydrochloride, hippuric acid, 4-O-methyldopamine hydrochloride, benzoic acid, uric acid,and 5-hydroxyindole-3-acetic acid were acquired from Sig-
ma-Aldrich. Stock standard solutions of the 28 compoundswere prepared in methanol at a concentration of 200 �M.N-methyl-N-trimethylsilyltrifluoroacetamide plus 1% tri-methylchlorosilane (MSTFA�1% TMS) were used as de-rivatization reagents (Pierce, Rockford, IL, USA). Thesereagents were used from freshly opened 1 ml bottles. Me-thoxyamine hydrochloride was purchased from Supelco(Park Bellefonte, PA, USA). Methanol (HPLC grade) andacetonitrile (GC grade) were acquired from Sigma-Aldrich,and pyridine (�99%, ultra-pure GC grade) was fromFluka. 4-Chlorophenol, decylamine, methyl caprate,prometryn, aldrin, and endosulfan � were purchased fromSigma-Aldrich. Stock solutions of these analytes were pre-pared in acetonitrile at a concentration of 10 mM. Reser-pine was purchased from Sigma-Aldrich.
Sample Preparation
Aliquots of the standard mix were evaporated and deriva-tized by adding 100 �l methoxyamine (60 min, 40°C) andsubsequently, 50 �l MSTFA (30 min, 40°C). Cerebrospi-nal fluid (CSF) samples were taken by lumbar puncture.The study was approved by the Ethical Committee of theLeiden University Medical Center (The Netherlands).Samples were processed within 1 h, centrifuged at 300 g toremove cells, aliquoted, and stored at –80°C until use. TheCSF samples were prepared as described previously15: theproteins were precipitated with cold methanol, and thenthe supernatant was evaporated under a gentle stream ofnitrogen. The derivatization was carried out with methoxy-amine and MSTFA � 1% TMCS.
GC-MS-FID Analysis
The samples (1 �l) were applied by splitless injection witha programmable Agilent CTC PAL multipurpose sampler(Agilent, Atlanta, GA, USA) into an Agilent 7890A GC(Agilent, Palo Alto, CA, USA). The chromatograph wasequipped with a single HP-5-MS column (30 m, 0.25 mmID, 0.25 �m film thickness) and a column flow splitterwith deactivated capillary (0.6 m, 0.25 mm ID, 0.25 �mfilm thickness), which allow a simultaneous acquisitionwith MS and FID detectors. For sample injection, a sep-tumless programmed temperature vaporizing (PTV) injec-tor was used. For each analysis, the purge time of the PTVinjector was set to 60 s at a purge flow rate of 20 ml/min andan equilibration time of 1 min. Helium was used as carriergas at a constant flow rate of 1 ml/min through the column.
For the underivatized compounds, the PTV workedwith the following temperature program: 60°C held for 0.1min, and then the temperature was increased to 250°C at arate of 500°C/min. The column temperature was first keptat 40°C for 0.1 min and then raised to 280°C at 30°C/min
TIZIANA PACCHIAROTTA ET AL. / EVALUATION OF GC-APCI/MS AND GC-FID
206 JOURNAL OF BIOMOLECULAR TECHNIQUES, VOLUME 21, ISSUE 4, DECEMBER 2010
and held for 10 min. For the biological samples, the follow-ing temperature program was used: 90°C held for 0.1 min,followed by the temperature increase to 250°C at 500°C/min. The column temperature was first kept at 70°C for 5min and then raised to 280°C at 5°C/min and held for10 min.
The FID was operated at 300°C; hydrogen (H) and airflows were set at 40 ml/min and 370 ml/min, respectively.
The transfer line to the mass spectrometer was kept at300°C. In the AP chemical ionization (APCI) source oper-ating in positive mode, temperature and flow rate of the drygas (nitrogen) were 300°C and 2.00 l/min, respectively.The APCI vaporizer temperature was 300°C; the pressureof the nebulizer gas (nitrogen) was set to 3.5 Bar, and thevoltage of the corona discharge needle was �4000 nA.Capillary voltage was set to –2000 V and the end-plateoffset to –500 V.
The maXis (Bruker Daltonics, Bremen, Germany), anorthogonal-accelerated TOF-MS, was used as a MS detec-tor. The polarity of the APCI interface and all of theparameters of the TOF-MS detector were optimized withinfusion of reserpine. Spectra were acquired in scan modefrom mass-to-charge ratio (m/z) 100 to m/z 1000 with 1Hertz (Hz) frequency.
External Calibration Was Performed Using the Tune Mix
The linear dynamic range for the mix of six underivatizedcompounds was estimated for a concentration range from0.05 to 10,000 �M. For the standard mix, a concentrationrange, 0.5–50 �M was used.
The two calibration lines (APCI-TOF and FID) wereused for calculation of limit of detection (LOD) and limitof quantification (LOQ; Tables 1 and 2 in Supplementary
Data); these were calculated on the basis of a signal-to-noiseratio of 3 for LOD and 10 for LOQ. The background noisewas estimated from the peak baseline close to the analytepeak. Each calibration point is the result of three indepen-dent injections.
The intra- and interday repeatability test was per-formed using standard mix as a reference. Results of the testwere expressed as relative SD (RSD). Four independentinjections were carried out at 25 �M concentration level.The interday repeatability was calculated after 24 and 48 h.
The accurate mass data of the molecular ions wereprocessed with DataAnalysis 4.0 software (Bruker Dalton-ics). A list of possible elemental formulas was generated byusing the SmartFormula module of the DataAnalysis 4.0. Ituses a CHNO algorithm, which provides standard func-tionalities, such as minimum/maximum elemental range,electron configuration, and ring-plus double bond equiva-lents, as well as a sophisticated comparison of the theoret-ical with the measured isotope pattern (� value).
RESULTS
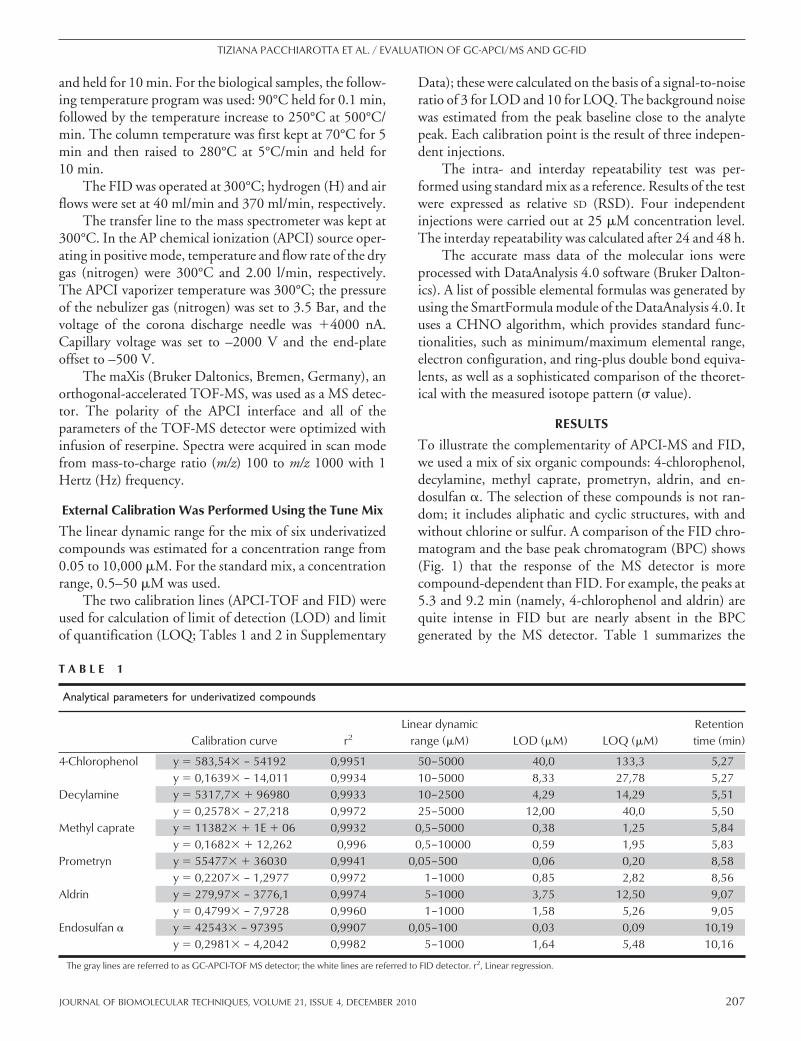
To illustrate the complementarity of APCI-MS and FID,we used a mix of six organic compounds: 4-chlorophenol,decylamine, methyl caprate, prometryn, aldrin, and en-dosulfan �. The selection of these compounds is not ran-dom; it includes aliphatic and cyclic structures, with andwithout chlorine or sulfur. A comparison of the FID chro-matogram and the base peak chromatogram (BPC) shows(Fig. 1) that the response of the MS detector is morecompound-dependent than FID. For example, the peaks at5.3 and 9.2 min (namely, 4-chlorophenol and aldrin) arequite intense in FID but are nearly absent in the BPCgenerated by the MS detector. Table 1 summarizes the
T A B L E 1
Analytical parameters for underivatized compounds
Calibration curve r2Linear dynamic
range (�M) LOD (�M) LOQ (�M)Retentiontime (min)
4-Chlorophenol y � 583,54� – 54192 0,9951 50–5000 40,0 133,3 5,27y � 0,1639� – 14,011 0,9934 10–5000 8,33 27,78 5,27
Decylamine y � 5317,7� � 96980 0,9933 10–2500 4,29 14,29 5,51y � 0,2578� – 27,218 0,9972 25–5000 12,00 40,0 5,50
Methyl caprate y � 11382� � 1E � 06 0,9932 0,5–5000 0,38 1,25 5,84y � 0,1682� � 12,262 0,996 0,5–10000 0,59 1,95 5,83
Prometryn y � 55477� � 36030 0,9941 0,05–500 0,06 0,20 8,58y � 0,2207� – 1,2977 0,9972 1–1000 0,85 2,82 8,56
Aldrin y � 279,97� – 3776,1 0,9974 5–1000 3,75 12,50 9,07y � 0,4799� – 7,9728 0,9960 1–1000 1,58 5,26 9,05
Endosulfan � y � 42543� – 97395 0,9907 0,05–100 0,03 0,09 10,19y � 0,2981� – 4,2042 0,9982 5–1000 1,64 5,48 10,16
The gray lines are referred to as GC-APCI-TOF MS detector; the white lines are referred to FID detector. r2, Linear regression.
TIZIANA PACCHIAROTTA ET AL. / EVALUATION OF GC-APCI/MS AND GC-FID
JOURNAL OF BIOMOLECULAR TECHNIQUES, VOLUME 21, ISSUE 4, DECEMBER 2010 207
analytical parameters for both detectors. Calibration lines,LODs, and LOQs were calculated, plotting peak areas as afunction of concentration [extracted ion chromatograms(EICs) were used for calculations of peak areas in MS].According to the correlation coefficients, each detectordemonstrates a high degree of linearity (r2�0.991 in allcases). LOD and LOQ are significantly lower for GC-APCI/TOF-MS than GC-FID, except for 4-chlorophenoland aldrin. On the other hand, the linear range of detectionis wider in the case of FID. It is important to mention thatthe retention times of a given compound are almost iden-tical for both detectors (FID and APCI-MS). Thus, usingthis relatively simple example, we have shown that there issubstantial differences in response factors and basic analyt-ical parameters (LOD and LOQ) between FID andAPCI-MS detectors.
A combination of six organic compounds, even whenselected specifically with regard to chemical diversity, doesnot reflect the complexity of biological samples. Besides, alarge proportion of body fluid metabolites is nonvolatilepolar compounds and needs a derivatization before GCanalysis. Therefore, as a next step, we analyzed a standard
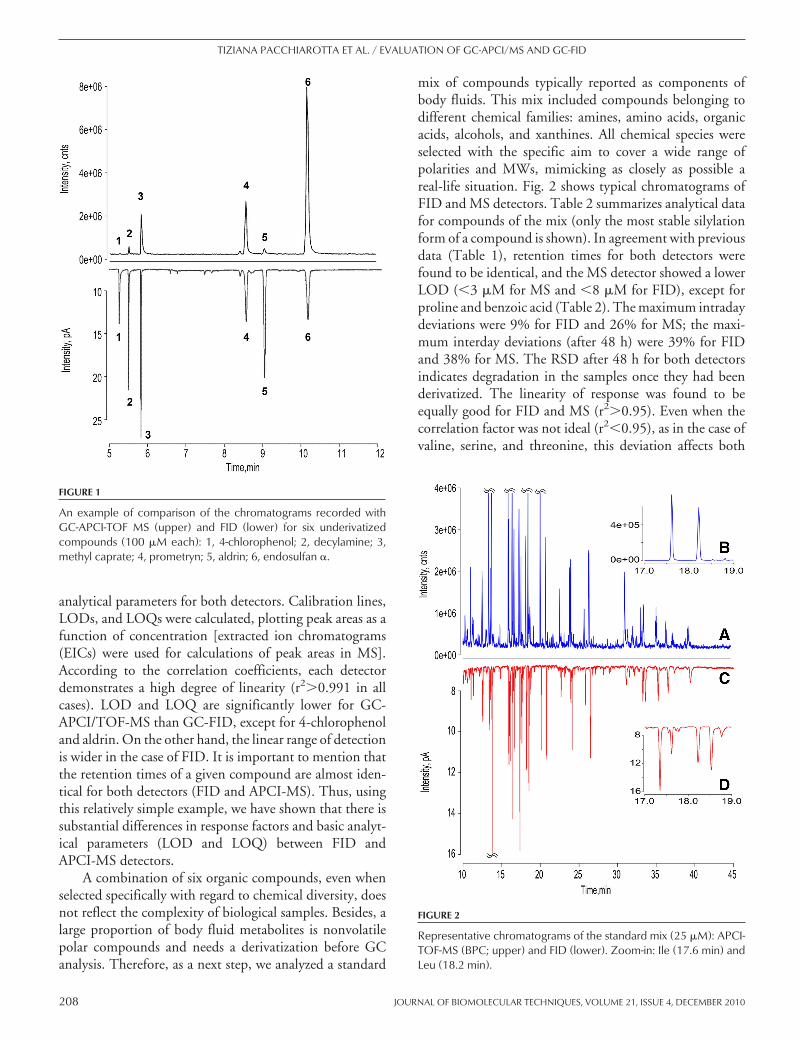
mix of compounds typically reported as components ofbody fluids. This mix included compounds belonging todifferent chemical families: amines, amino acids, organicacids, alcohols, and xanthines. All chemical species wereselected with the specific aim to cover a wide range ofpolarities and MWs, mimicking as closely as possible areal-life situation. Fig. 2 shows typical chromatograms ofFID and MS detectors. Table 2 summarizes analytical datafor compounds of the mix (only the most stable silylationform of a compound is shown). In agreement with previousdata (Table 1), retention times for both detectors werefound to be identical, and the MS detector showed a lowerLOD (�3 �M for MS and �8 �M for FID), except forproline and benzoic acid (Table 2). The maximum intradaydeviations were 9% for FID and 26% for MS; the maxi-mum interday deviations (after 48 h) were 39% for FIDand 38% for MS. The RSD after 48 h for both detectorsindicates degradation in the samples once they had beenderivatized. The linearity of response was found to beequally good for FID and MS (r2�0.95). Even when thecorrelation factor was not ideal (r2�0.95), as in the case ofvaline, serine, and threonine, this deviation affects both
FIGURE 1
An example of comparison of the chromatograms recorded withGC-APCI-TOF MS (upper) and FID (lower) for six underivatizedcompounds (100 �M each): 1, 4-chlorophenol; 2, decylamine; 3,methyl caprate; 4, prometryn; 5, aldrin; 6, endosulfan �.
FIGURE 2
Representative chromatograms of the standard mix (25 �M): APCI-TOF-MS (BPC; upper) and FID (lower). Zoom-in: Ile (17.6 min) andLeu (18.2 min).
TIZIANA PACCHIAROTTA ET AL. / EVALUATION OF GC-APCI/MS AND GC-FID
208 JOURNAL OF BIOMOLECULAR TECHNIQUES, VOLUME 21, ISSUE 4, DECEMBER 2010
T A B L E 2
Standard mix analytical parameters
CompoundsRetentiontime (min) Calibration curve r2
LOD(�M)
LOQ(�M)
Repeatabilityintraday
Repeatabilityinterday (24 h)
Repeatabilityinterday (48 h)
Alanine � 2 TMS � H 12,39 y � 13490� – 45721 0,9686 0,19 0,63 7% 18% 23%
12,40 y � 0,2716� � 2,6521 0,9756 0,24 0,79 5% 14% 14%
Sarcosine � 2 TMS � H 13,41 y � 6145,7� – 32450 0,9665 3,00 6,47 17% 18% 26%
13,41 y � 0,1097� � 0,0803 0,9537 8,00 26,88 6% 7% 11%
Proline � 1 TMS � H 14,53 y � 5473,2� – 59848 0,9943 21,58 71,94 16% 16% 21%
14,55 y � 0,2041� – 0,5898 0,9969 18,29 60,98 3% 6% 8%
Valine �2 TMS � H 15,83 y � 21344� – 73007 0,9199 0,10 0,33 9% 20% 35%
15,83 y � 0,2403� � 0,0935 0,945 0,78 2,60 1% 3% 5%
Benzoic acid � 1 TMS � H 16,51 y � 895,29� – 5812,6 0,9998 10,00 33,33 18% 18% 18%
16,50 y � 0,5802� – 1,3997 0,9887 6,66 22,20 2% 6% 5%
Ile � 2 TMS � H 17,42 y � 23962� – 80202 0,9911 0,34 1,11 19% 24% 25%
17,44 y � 0,3432� – 1,0109 0,9928 5,00 16,60 2% 3% 6%
Leu � 2 TMS � H 18,02 y � 30845� – 120980 0,8989 0,13 0,42 26% 17% 16%
18,03 y � 0,6134� – 2,2667 0,9736 1,71 5,71 2% 4% 10%
Glycine � 3 TMS � H 18,34 y � 3430,7� � 2601,9 0,9747 0,06 0,20 15% 39% 37%
18,34 y � 0,3445� � 1,1661 0,9997 2,70 9,90 14% 30% 27%
Serine � 3 TMS � H 19,92 y � 34064� – 87840 0,9373 0,07 0,22 12% 13% 19%
19,92 y � 0,4867� – 1,18 0,9279 0,67 2,22 3% 3% 9%
Threonine � 3 TMS � H 20,62 y � 33259� – 58986 0,9442 0,05 0,16 13% 11% 20%
20,63 y � 0,5272� – 1,0441 0,9241 1,55 5,15 2% 4% 7%
Methionine � 2 TMS � H 23,75 y � 44225� – 113892 0,9622 0,12 0,40 6% 17% 30%
23,76 y � 0,4499� � 1,2307 0,9839 3,33 11,11 5% 6% 12%
Aspartic acid � 3 TMS � H 23,92 y � 36461� – 15137 0,9972 0,07 0,24 13% 24% 28%
23,91 y � 0,5083� – 0,7629 0,9784 3,00 10,00 4% 6% 19%
Glutamic acid � 3 TMS � H 26,20 y � 29834� – 49222 0,9957 0,12 0,38 12% 21% 32%
26,19 y � 0,4277� – 0,5318 0,9933 3,50 11,68 9% 11% 12%
Phenylalanine � 2 TMS � H 26,26 y � 49218� – 25330 0,9974 0,13 0,44 16% 18% 20%
26,25 y � 0,7029� – 1,1104 0,9924 3,50 11,68 4% 5% 14%
Phenyl-Glycine � H 28,06 y � 119260� – 165927 0,9972 0,06 0,18 13% 22% 34%
28,04 y � 0,8171� – 0,7237 0,9956 0,35 1,18 5% 5% 8%
Hyppuric acid � 1 TMS � H 30,66 y � 11673� – 26449 0,9918 0,26 0,86 16% 15% 16%
30,64 y � 0,3526� – 0,5933 0,9835 4,77 15,92 6% 13% 11%
Caffeine � H 30,78 y � 114348� – 170144 0,9962 0,23 0,77 5% 10% 9%
30,76 y � 0,3152� � 0,0298 0,9934 1,66 5,55 2% 6% 7%
Theophylline � 1 TMS � H 32,12 y � 45565� – 62580 0,9952 0,33 1,11 6% 16% 26%
32,13 y � 0,2126� – 0,3059 0,9875 2,43 8,09 2% 37% 45%
Lysine � 4 TMS � H 32,53 y � 56140� – 14749 0,9948 0,11 0,36 20% 27% 35%
32,53 y � 0,2126� – 0,3059 0,9875 0,75 2,50 7% 11% 11%
Tyrosine � 3 TMS � H 32,86 y � 75274� – 46887 0,9963 0,09 0,83 12% 21% 23%
32,86 y � 0,6914� – 0,0326 0,9974 0,59 1,95 6% 8% 6%
4-Methyldopamine � 3 TMS 34,40 y � 91126� � 94865 0,9816 0,03 0,10 10% 16% 18%
34,38 y � 0,8979� – 0,4778 0,9992 0,70 2,34 2% 6% 5%
Dopamine � 4 TMS � H 35,53 y � 87513� � 30795 0,9786 0,05 0,18 13% 14% 21%
35,50 y � 1,0494� – 1,0955 0,9945 1,20 4,00 1% 4% 4%
Uric acid � 4 TMS � H 36,15 y � 29816� – 35130 0,9984 0,14 0,45 12% 28% 38%
36,15 y � 0,2464� � 0,1531 0,9999 0,94 3,13 6% 10% 34%
5-Hydroxyindole-3-acetic � 3 TMS � H 37,90 y � 67994� – 66186 0,995 0,08 0,25 11% 22% 18%
37,91 y � 0,4126� – 0,1815 0,9981 0,58 1,92 4% 5% 13%
Nortriptyline � H 38,32 y � 8649,4� � 5316,9 0,995 0,57 1,89 10% 16% 25%
38,26 y � 0,0882� � 0,2164 0,9907 3,33 11,11 8% 27% 39%
The gray lines are referred to GC-APCI-TOF MS; the white lines are referred to FID. Ile, Isoleucine; Leu, leucine; Si, silicon.
TIZIANA PACCHIAROTTA ET AL. / EVALUATION OF GC-APCI/MS AND GC-FID
JOURNAL OF BIOMOLECULAR TECHNIQUES, VOLUME 21, ISSUE 4, DECEMBER 2010 209
detectors, which indicates a problem of derivatization, athorny step in the analytical procedure, rather than insta-bility of the detector.
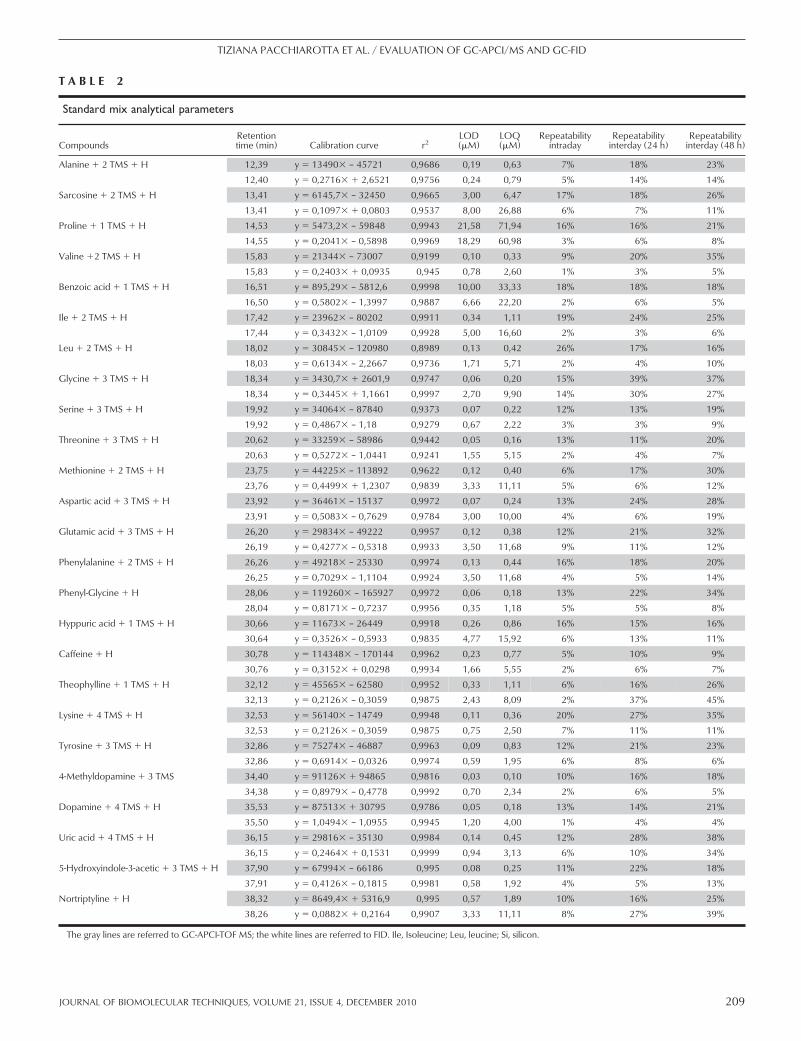
The detailed analysis of the chromatograms presented inFig. 2 shows how differently both detectors respond to certaincompounds despite their superficial similarity. For example,Ile and Leu are “classical” positional isomers, which have thesame atomic composition, number of single and doublebonds, and consequently, the same masses. The peak areasobserved for these compounds give a good approximation ofthe relative detector response. Calculating the peak area ratiosfor FID and MS, we obtain the following numbers:Leu FID/Ile FID � 0.52; Leu MS/Ile MS � 0.69.Thus, there is a significant difference of the ratios in theLeu/Ile peak areas between FID and MS detectors. The effectis also reflected in the angular coefficients of the calibrationlines: Ile has a higher angular coefficient than Leu (Table 2).This increase was found to be larger for FID (�44%) than forAPCI-TOF (�22%). Analysis of the compound mass spectra(Fig. 3) provides a possible explanation of this effect. Leu andIle are represented by doubly silylated forms. In GC-APCIMS, the parent ion is the dominant feature of the spectra,unlike in conventional GC-electronic impact (EI) spectra,where the parent is a minor peak or even absent.15 Mainfragments, for Leu as well as for Ile, are the result of a loss ofneutral groups such as Si(CH3)3OH (m/z 90) or
Si(CH3)3OH � CO (m/z 118), leading to formation of m/z186.1 and m/z 158.1 fragments, respectively. However, Ile hasan additional intense fragment at m/z 260.1. This fragment isthe result of a loss of the methyl group, most probably atposition 5; the remaining tertiary carbon at position 3 stabi-lizes the positive charge with formation of the m/z 260.1fragment. An additional loss of Si(CH3)3OH (m/z 90) leads tothe formation of a fragment with m/z 170.1 (Fig. 3).
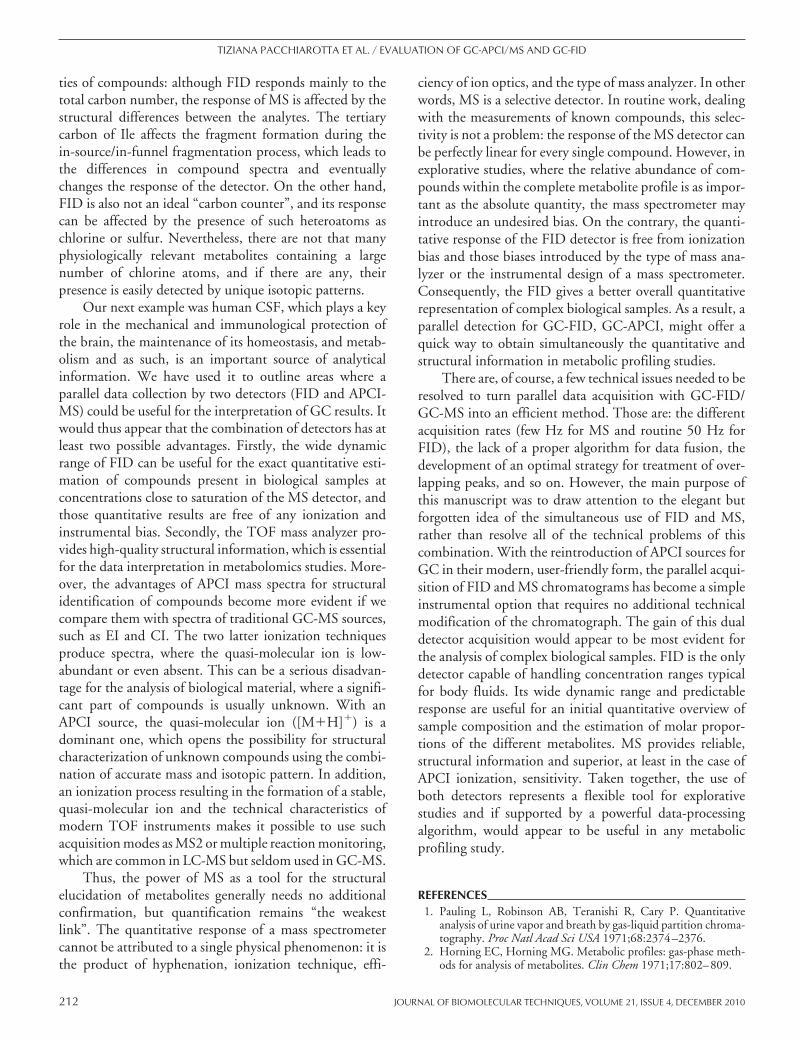
Next, we used human CSF to test the applicability ofour approach for biological material. Fig. 4A shows typicalBPC and FID chromatograms. With both detectors, verycomplex chromatograms were recorded. A number of mo-lecular features extracted from MS data and overview ofcompounds detected in human CSF with GC-APCI-MSwere reported elsewhere.15 At first glance, there is no seri-ous dissimilarity between the chromatograms. However, asthe representative examples (Fig. 4B and C) show, there isa number of differences between FID and APCI-MS. Fig.4B shows a few abundant compounds that saturate the MSdetector. It is a common situation for biological fluids withtheir enormous concentration range. It is evident thatrealistic quantitative estimation based on MS data isimpossible. FID, on the contrary, is still far from itssaturation point within its linear range and therefore,can provide accurate quantitative information. Fig. 4Cillustrates a different situation: in the case of coeluting or
FIGURE 3
APCI-TOF spectra for Leu (upper) and Ile (lower).
TIZIANA PACCHIAROTTA ET AL. / EVALUATION OF GC-APCI/MS AND GC-FID
210 JOURNAL OF BIOMOLECULAR TECHNIQUES, VOLUME 21, ISSUE 4, DECEMBER 2010
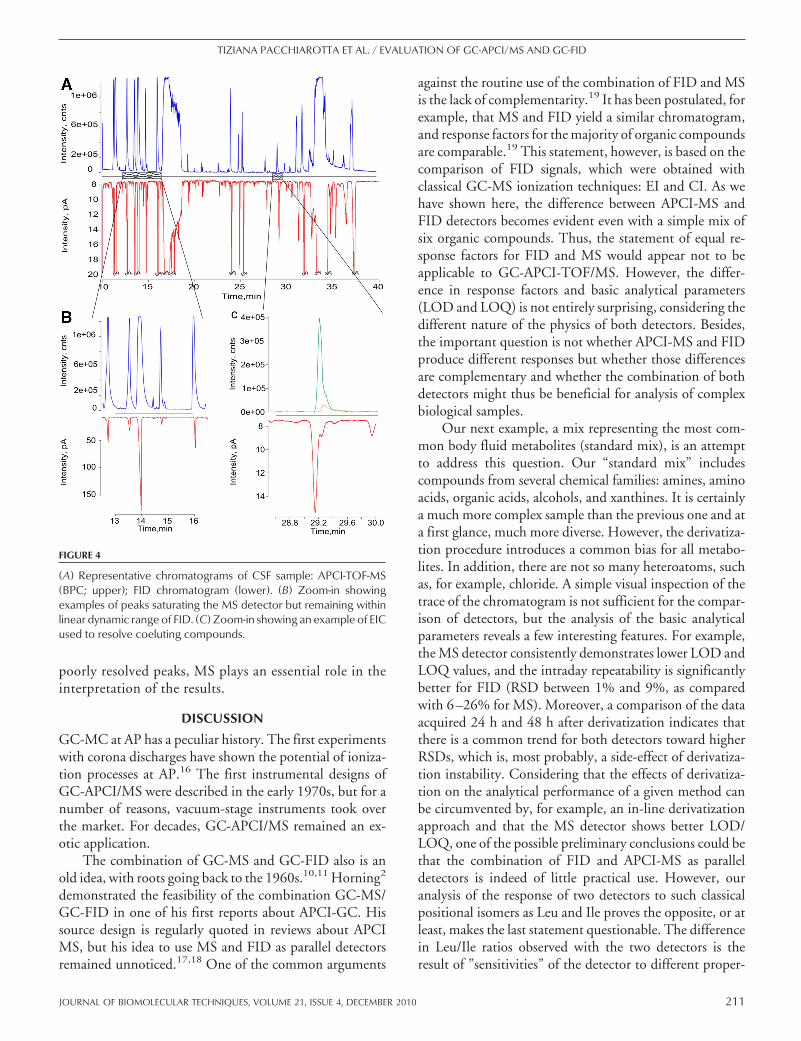
poorly resolved peaks, MS plays an essential role in theinterpretation of the results.
DISCUSSION
GC-MC at AP has a peculiar history. The first experimentswith corona discharges have shown the potential of ioniza-tion processes at AP.16 The first instrumental designs ofGC-APCI/MS were described in the early 1970s, but for anumber of reasons, vacuum-stage instruments took overthe market. For decades, GC-APCI/MS remained an ex-otic application.
The combination of GC-MS and GC-FID also is anold idea, with roots going back to the 1960s.10,11 Horning2
demonstrated the feasibility of the combination GC-MS/GC-FID in one of his first reports about APCI-GC. Hissource design is regularly quoted in reviews about APCIMS, but his idea to use MS and FID as parallel detectorsremained unnoticed.17,18 One of the common arguments
against the routine use of the combination of FID and MSis the lack of complementarity.19 It has been postulated, forexample, that MS and FID yield a similar chromatogram,and response factors for the majority of organic compoundsare comparable.19 This statement, however, is based on thecomparison of FID signals, which were obtained withclassical GC-MS ionization techniques: EI and CI. As wehave shown here, the difference between APCI-MS andFID detectors becomes evident even with a simple mix ofsix organic compounds. Thus, the statement of equal re-sponse factors for FID and MS would appear not to beapplicable to GC-APCI-TOF/MS. However, the differ-ence in response factors and basic analytical parameters(LOD and LOQ) is not entirely surprising, considering thedifferent nature of the physics of both detectors. Besides,the important question is not whether APCI-MS and FIDproduce different responses but whether those differencesare complementary and whether the combination of bothdetectors might thus be beneficial for analysis of complexbiological samples.
Our next example, a mix representing the most com-mon body fluid metabolites (standard mix), is an attemptto address this question. Our “standard mix” includescompounds from several chemical families: amines, aminoacids, organic acids, alcohols, and xanthines. It is certainlya much more complex sample than the previous one and ata first glance, much more diverse. However, the derivatiza-tion procedure introduces a common bias for all metabo-lites. In addition, there are not so many heteroatoms, suchas, for example, chloride. A simple visual inspection of thetrace of the chromatogram is not sufficient for the compar-ison of detectors, but the analysis of the basic analyticalparameters reveals a few interesting features. For example,the MS detector consistently demonstrates lower LOD andLOQ values, and the intraday repeatability is significantlybetter for FID (RSD between 1% and 9%, as comparedwith 6–26% for MS). Moreover, a comparison of the dataacquired 24 h and 48 h after derivatization indicates thatthere is a common trend for both detectors toward higherRSDs, which is, most probably, a side-effect of derivatiza-tion instability. Considering that the effects of derivatiza-tion on the analytical performance of a given method canbe circumvented by, for example, an in-line derivatizationapproach and that the MS detector shows better LOD/LOQ, one of the possible preliminary conclusions could bethat the combination of FID and APCI-MS as paralleldetectors is indeed of little practical use. However, ouranalysis of the response of two detectors to such classicalpositional isomers as Leu and Ile proves the opposite, or atleast, makes the last statement questionable. The differencein Leu/Ile ratios observed with the two detectors is theresult of ”sensitivities” of the detector to different proper-
FIGURE 4
(A) Representative chromatograms of CSF sample: APCI-TOF-MS(BPC; upper); FID chromatogram (lower). (B) Zoom-in showingexamples of peaks saturating the MS detector but remaining withinlinear dynamic range of FID. (C) Zoom-in showing an example of EICused to resolve coeluting compounds.
TIZIANA PACCHIAROTTA ET AL. / EVALUATION OF GC-APCI/MS AND GC-FID
JOURNAL OF BIOMOLECULAR TECHNIQUES, VOLUME 21, ISSUE 4, DECEMBER 2010 211
ties of compounds: although FID responds mainly to thetotal carbon number, the response of MS is affected by thestructural differences between the analytes. The tertiarycarbon of Ile affects the fragment formation during thein-source/in-funnel fragmentation process, which leads tothe differences in compound spectra and eventuallychanges the response of the detector. On the other hand,FID is also not an ideal “carbon counter”, and its responsecan be affected by the presence of such heteroatoms aschlorine or sulfur. Nevertheless, there are not that manyphysiologically relevant metabolites containing a largenumber of chlorine atoms, and if there are any, theirpresence is easily detected by unique isotopic patterns.
Our next example was human CSF, which plays a keyrole in the mechanical and immunological protection ofthe brain, the maintenance of its homeostasis, and metab-olism and as such, is an important source of analyticalinformation. We have used it to outline areas where aparallel data collection by two detectors (FID and APCI-MS) could be useful for the interpretation of GC results. Itwould thus appear that the combination of detectors has atleast two possible advantages. Firstly, the wide dynamicrange of FID can be useful for the exact quantitative esti-mation of compounds present in biological samples atconcentrations close to saturation of the MS detector, andthose quantitative results are free of any ionization andinstrumental bias. Secondly, the TOF mass analyzer pro-vides high-quality structural information, which is essentialfor the data interpretation in metabolomics studies. More-over, the advantages of APCI mass spectra for structuralidentification of compounds become more evident if wecompare them with spectra of traditional GC-MS sources,such as EI and CI. The two latter ionization techniquesproduce spectra, where the quasi-molecular ion is low-abundant or even absent. This can be a serious disadvan-tage for the analysis of biological material, where a signifi-cant part of compounds is usually unknown. With anAPCI source, the quasi-molecular ion ([M�H]�) is adominant one, which opens the possibility for structuralcharacterization of unknown compounds using the combi-nation of accurate mass and isotopic pattern. In addition,an ionization process resulting in the formation of a stable,quasi-molecular ion and the technical characteristics ofmodern TOF instruments makes it possible to use suchacquisition modes as MS2 or multiple reaction monitoring,which are common in LC-MS but seldom used in GC-MS.
Thus, the power of MS as a tool for the structuralelucidation of metabolites generally needs no additionalconfirmation, but quantification remains “the weakestlink”. The quantitative response of a mass spectrometercannot be attributed to a single physical phenomenon: it isthe product of hyphenation, ionization technique, effi-
ciency of ion optics, and the type of mass analyzer. In otherwords, MS is a selective detector. In routine work, dealingwith the measurements of known compounds, this selec-tivity is not a problem: the response of the MS detector canbe perfectly linear for every single compound. However, inexplorative studies, where the relative abundance of com-pounds within the complete metabolite profile is as impor-tant as the absolute quantity, the mass spectrometer mayintroduce an undesired bias. On the contrary, the quanti-tative response of the FID detector is free from ionizationbias and those biases introduced by the type of mass ana-lyzer or the instrumental design of a mass spectrometer.Consequently, the FID gives a better overall quantitativerepresentation of complex biological samples. As a result, aparallel detection for GC-FID, GC-APCI, might offer aquick way to obtain simultaneously the quantitative andstructural information in metabolic profiling studies.
There are, of course, a few technical issues needed to beresolved to turn parallel data acquisition with GC-FID/GC-MS into an efficient method. Those are: the differentacquisition rates (few Hz for MS and routine 50 Hz forFID), the lack of a proper algorithm for data fusion, thedevelopment of an optimal strategy for treatment of over-lapping peaks, and so on. However, the main purpose ofthis manuscript was to draw attention to the elegant butforgotten idea of the simultaneous use of FID and MS,rather than resolve all of the technical problems of thiscombination. With the reintroduction of APCI sources forGC in their modern, user-friendly form, the parallel acqui-sition of FID and MS chromatograms has become a simpleinstrumental option that requires no additional technicalmodification of the chromatograph. The gain of this dualdetector acquisition would appear to be most evident forthe analysis of complex biological samples. FID is the onlydetector capable of handling concentration ranges typicalfor body fluids. Its wide dynamic range and predictableresponse are useful for an initial quantitative overview ofsample composition and the estimation of molar propor-tions of the different metabolites. MS provides reliable,structural information and superior, at least in the case ofAPCI ionization, sensitivity. Taken together, the use ofboth detectors represents a flexible tool for explorativestudies and if supported by a powerful data-processingalgorithm, would appear to be useful in any metabolicprofiling study.
REFERENCES1. Pauling L, Robinson AB, Teranishi R, Cary P. Quantitative
analysis of urine vapor and breath by gas-liquid partition chroma-tography. Proc Natl Acad Sci USA 1971;68:2374–2376.
2. Horning EC, Horning MG. Metabolic profiles: gas-phase meth-ods for analysis of metabolites. Clin Chem 1971;17:802–809.
TIZIANA PACCHIAROTTA ET AL. / EVALUATION OF GC-APCI/MS AND GC-FID
212 JOURNAL OF BIOMOLECULAR TECHNIQUES, VOLUME 21, ISSUE 4, DECEMBER 2010
3. Francois I, Sandra K, Sandra P. Comprehensive liquid chroma-tography: fundamental aspects and practical considerations—areview. Anal Chim Acta 2009;641:14–31.
4. Nicholson JK, Wilson ID. High-resolution proton magnetic-resonance spectroscopy of biological fluids. Prog Nucl Mag Res Sp1989;21:449–501.
5. Lindon JC, Nicholson JK, Holmes E, Everett JR. Metabonomics:metabolic processes studied by NMR spectroscopy of biofluids.Concepts Mag Res 2000;12:289–320.
6. Bollard ME, Stanley EG, Lindon JC, Nicholson JK, Holmes E.NMR-based metabonomic approaches for evaluating physiolog-ical influences on biofluid composition. NMR Biomed 2005;18:143–162.
7. Crockford DJ, Holmes E, Lindon JC, et al. Statistical heterospec-troscopy, an approach to the integrated analysis of NMR andUPLC-MS data sets: application in metabonomic toxicologystudies. Anal Chem 2006;78:363–371.
8. Crockford DJ, Maher AD, Ahmadi KR, et al. H-1 NMR andUPLC-MSE statistical heterospectroscopy: characterization ofdrug metabolites (xenometabolome) in epidemiological studies.Anal Chem 2008;80:6835–6844.
9. Holm T. Aspects of the mechanism of the flame ionizationdetector. J Chromatogr A 1999;842:221–227.
10. Roeraade J, Enzell CR. A combination of mass spectrometer andflame ionization detector for open tubolar coulmn chromatogra-phy. Acta Chemica Scandinavica 1968;22:2380.
11. Bruner F, Ciccioli P, Zelli S. Improved double detection gaschromatography mass spectrometer interface for analysis of com-plex organic mixtures. Anal Chem 1973;45:1002–1006.
12. Fancy SA, Beckonert O, Darbon G, et al. Gas chromatography/flame ionization detection mass spectrometry for the detectionof endogenous urine metabolites for metabonomic studies andits use as a complementary tool to nuclear magnetic resonancespectroscopy. Rapid Commun Mass Spectrom 2006;20:2271–2280.
13. Schiewek R, Lorenz M, Giese R, et al. Development of a multi-purpose ion source for LC-MS and GC-API MS. Anal BioanalytChem 2008;392:87–96.
14. McEwen CN, McKay RG. A combination atmospheric pressureLC/MS:GC/MS ion source: advantages of dual AP-LC/MS:GC/MS instrumentation. J Am Soc Mass Spectrom 2005;16:1730–1738.
15. Carrasco-Pancorbo A, Nevedomskaya E, Arthen-Engeland T, etal. Gas chromatography/atmospheric pressure chemical ioniza-tion-time of flight mass spectrometry: analytical validation andapplicability to metabolic profiling. Anal Chem 2009;81:10071–10079.
16. Hayhurst AN, Sugden TM. Mass spectrometry of flames. ProcRoyal Soc London Series A, Mathematical and Physical Sciences1996;293:36.
17. Byrdwell WC. Atmospheric pressure chemical ionization massspectrometry for analysis of lipids. Lipids 2001;36:327–346.
18. Bruins AP. Mass spectrometry with ion source operating at atmo-spheric-pressure. Mass Spectrom Rev 1991;10:53–77.
19. Hubschmann HJ. Handbook of GC/MS. Fundamentals andApplications, 2nd ed. Weinheim, Germany: Wiley-VCH,2008.
TIZIANA PACCHIAROTTA ET AL. / EVALUATION OF GC-APCI/MS AND GC-FID
JOURNAL OF BIOMOLECULAR TECHNIQUES, VOLUME 21, ISSUE 4, DECEMBER 2010 213