Identifying substitute and complementary relationships ...
88
-
Upload
khangminh22 -
Category
Documents
-
view
0 -
download
0
Transcript of Identifying substitute and complementary relationships ...


ft--
.di«3l^3SV8


OEWgy LIBHAnV
At. I. t-
IDENTIFYING SUBSTITUTE AND COMPLEMENTARY RELATIONSHIPS
REVEALED BY CONSUMER VARIETY SEEKING BEHAVIOR
Leigh McAlister*James M. Lattin**
Working Paper No. 1487-83 September, 1983
THE MARKETING CENTER
Massachusetts Institute of Technology
Alfred P. Sloan School of Management50 Memorial Drive
Cambridge, Massachusetts 02139
(617) 253-6615


IDENTIFYING SUBSTITUTE AND COMPLEMENTARY RELATIONSHIPS
REVEALED BY CONSUMER VARIETY SEEKING BEHAVIOR
Leigh McAlister*James M. Lattin**
Working Paper No. 1487-83 September, 1983
*Assistant Professor of Management Science, Sloan School of
Management, Massachusetts Institute of Technology, Cambridge,
Massachusetts 02139, Phone: 617-253-2861
**Assistant Professor of Marketing, Graduate School of Business,
Stanford University, Stanford, California 94305
The authors wish to thank the Marketing Science Institute for
supporting this research. Thanks also go to Sumantra Ghoshal
for computer programming assistance and to John D.C. Little,
Dudley Ruch, Richard Schmalensee, Lou Stern and Tom Stoker for
helpful comments.
Preliminary Draft: Please do not quote without author's permission.
The order of authors' names does not reflect primary or secondary
authorship.


ABSTRACT
Several different techniques have been proposed for
Inferring competitive Interrelationships. An Important
subset of those techniques Is based on the assumption that
those brands most frequently switched between are the
closest substitutes. In product classes In which variety
seeking Is an Important determinant of consumer behavior,
this assumption Is probably violated. Consumers may switch
from one brand to another precisely because the brands are
not substitutes. The technique we propose reveals not only
which brands substitute for one another, but also which
brands are chosen as complements to jointly satisfy the
consumers' desire for variety. We also suggest a
representation of the results which contrasts substl-
tutablUty and complementarity and preserves the asymmetry
which may occur In competitive Interrelationships, we
apply the proposed and existing techniques to a collection
of consumption histories for a frequently purchased
packaged good. The proposed technique is shown to extend
the range of insights provided by existing techniques.


IDENTIFYING SUBSTITUTE AND COMPLEMENTARY RELATIONSHIPS
REVEALED BY CONSUMER VARIETY SEEKING BEHAVIOR
Product line management requires an understanding of competitive Inter-
relationships in the relevant product class. Such understanding allows
the manager to avoid offering multiple products which largely meet the same
needs of the same consumers and to spot Important niches for which the line
currently has no offering. Managers can further exploit their understanding
of competitive interrelationships in designing advertising copy, selecting
distribution channels and developing cross promotional offers. There is, in
fact, no marketing mix decision which does not require an understanding of
the relevant competitive interrelationships.
The importance of understanding competition among products has given
rise to multiple measurement methodologies. Economists offer cross-price
elasticity as a measure of one brand's competitive impact on another.
Because of the difficulty of estimating cross-price elasticities, marketers
have devised other measurement techniques. An Important subset of those
techniques, characterized by Day, Shocker and Srlvastava (1979) as
"behavioral," infer competitive interrelationships from consumer choice.
Some techniques take the joint occurence of two brands in a consumer's
choice set as an indication of substltutablllty. Other techniques use brand
switching behavior to classify brands as substitutes. Fundamental to most
behavioral techniques is the notion that consumers have a need that can best
be filled by a single product. The brands selected by a particular consumer
^Day and Shocker (1976) point out the Importance of first defining the
relevant product class. The appropriate definition of that class dependslargely upon the particular decision to be made. We assume that thedecision maker has grappled with these issues and has determined the
boundaries of the relevant product class.

- 2 -
substitute for one another in filling that need.
We contend that product classes in which variety seeking is an important
determinant of consumer behavior will pose problems for existing behavioral
techniques. When consumers seek variety they have a composite need that
cannot best be filled by a single product. In selecting magazines, a
consumer might satisfy her or his desire for news, entertainment, and sports
by subscribing to several magazines (McAlister, 1979). In selecting soft
drinks, a consumer might want to experience the different flavors provided
by both colas and non-colas (McAlister, 1982). We suggest that a variety
seeking consumer chooses from the product class to fill a composite need.
Having chosen a brand to fill one component of the composite need, the
consumer is likely to switch to a different brand to fill a different
component of that need.
If a consumer satisfies a composite needs by her or his choices in a
product class we can no longer assume that a switch from one brand to
another indicates substitutes. To understand the interrelationships among
products, we must distinguish between products that are chosen to fill the
same component of the composite need and products chosen to provide largely
different benefits. We will call brands that jointly meet a composite need
"complements" and brands that meet the same component of that composite need
"substitutes." We propose a technique for revealing substitute and
complementary relationships from brand switching data, based upon a model of
consumer variety seeking behavior (McAlister, 1983). We also propose a
means of representation which contrasts substitutability and
complementarity, describes the relationships between products along a
continuum, and allows for asymmetries in competitive effects.
Our proposed representation preserves Important information about
product competition. Unlike a market partition, which reduces the
representation of competition to a dichotomous measure, our representation

- 3 -
preserves the relative competitive Intensity among pairs of products.
Unlike hierarchical structures and perceptual maps, which Impose a symmetric
representation of competition between products, our representation allows
asyametrlc competitive effects. We contend that representing this
additional Information will lead to richer Insights Into competitive
1 nterrelat lonshlps
.
Our model maintains Information on consumer behavior at the Individual
level. The aggregation required by market level analysis frequently masks
Interesting Implications of consumer heterogeneity. Our technique allows
summary measures of competitive Interrelationships to be calculated at any
level of aggregation. Such segment level analyses can enhance the
Information provided by market level analysis*
The purpose of this paper Is to demonstrate the Insights that our
technique can provide beyond those provided by existing techniques. Though
our data Is from a small, non-representative sample, It Is able to
Illustrate this extension. We would expect the analysis of a larger, more
nearly representative sample to confirm this finding.
Complements and Substitutes
Definitions
We appeal to Lancaster's (1971) notion of a product as a bundle of a
"want satisfying characteristics" In order to more precisely define the
terms of substitute and complement. In particular, we will say that two
products are substitutes If they meet largely the same need. Two products
are complements If they meet different components of a composite need, and
If the consumption of one product stimulates the desire for and consumption
of the second product.

- 4 -
The definition above is consistent with the standard notions regarding
substitute and complementary products. For example, Henderson and Quandt
(1958, p. 29) adopt the following definitions:
"Two commodities are substitutes if both can satisfy the same need tothe consumer; they are complements if they are consumed Jointly in orderto satisfy some particular need."
Our notion of complementarity does not require the simultaneous. Joint
consumption of two goods to reveal them as complementary. We suggest that
the consumption of some product at an earlier point in time might ultimately
stimulate or enhance the subsequent desire for a product providing different
characteristics. As an individual in search of variety begins to satiate on
the characteristics provided by a caffelnated cola beverage, for example, a
non-caffelnated, fruit flavored beverage might become relatively more
appealing. Thus, just as the consumption of tea enhances the desirability
of lemon in the same consumption occasion, so too might the consumption of
cola ultimately stimulate the desire for a non-cola on a subsequent
consumption occasion. The consumer wants to experience a wide range of
characteristics that can only be satisfied by a portfolio of brands. In the
context of our definition, both pairs of items (tea and lemon, cola and
non-cola) exhibit complementary relationships.
Existing Measures of Complementarity and Substitutablllty
Of all the proposed approaches for measuring substitutablllty and
complementarity, cross-price elasticity is probably the most well known and
widely accepted. Cross-price elasticity is the percentage change in demand
for one product divided by the percentage change in price of the second
(given that everything else affecting demand remains the same). A positive
cross-price elasticity indicates substitutes. A negative cross-price
elasticity indicates complements. Concurrent usage is not necessary to the
mathematical definition of cross-price elasticity, nor was it a condition

- 5 -
Imposed by Richard Stone (1954) in his empirical study The Measurement of
Consumers' Expenditures and Behavior in the United Kingdom, 1920-1938 , in
which he estimates cross-price elasticities for a wide range of foods and
beverages. In concluding. Stone provides a list of reasons for the
Bubstitutablllty and complementarity among products which he observed.
Complementarity, he suggests, might be driven by individuals* desire for
variety. He states (Stone 1954, p. 408):
"If the price of one kind of fruit rises, the consumption of it,
other things being equal, will fall. So far from leading to a
substltition of other fruits for it, the result may be that less isspent on other fruits. In this way the variety of consumption maybe maintained and the reduced level of fruit consumption may becompensated nutritionally by a greater consumption of vegetables.
Despite the conceptual appeal of cross-price elasticities, Stlgler
(1966, p. 33) points out the difficulty of operatlonallzing such general
concepts. Most pairs of products, he maintains, are difficult to classify
without direct measurement to determine the sign of the cross-price
elasticity.
Since Stone (1954), other empirical Investigations of cross-price
elasticity have been published (see Deaton and Muellbauer, 1980, for an
overview). These studies typically investigate relationships between
product classes. Marketers interested in relationships between brands
within a product class are seldom able to use this measure. Day, Shocker
and Srivastava (1979) attribute this Infrequent usage of cross-price
elasticities to three problems (Day, Shocker and Srivastava 1979, p. 11):
1. The theoretical context of the measure presumes that there is no
response by one firm to the price change of another. This
theoretical condition is seldom satisfied in practice.
2. It is a static measure and breaks down in the face of a market
characterized by changing product composition.

- 6 -
3. In markets where price changes have been infrequent, or all prices
change together, or where factors other than prices have also
changed, there is simply not enough Information contained In the
data to permit valid statistical estimation of the elasticities*
Given the difficulty of directly measuring cross-price elasticities,
marketers have resorted to a wide variety of approaches for characterizing
competitive interrelationships. These approaches can be classified
according to the criterion used to establish the existence of competition
between products. In the following development, we are concerned with only
those techniques based upon behavioral criteria derived in some fashion from
2actual choice*
Bass, Pessemier and Tlgert (1969), and Fraser and Bradford (1983)
investigate purchase timing. Bass, Pessemier and Tlgert (1969) assume that
similarity in purchase rates reveals substltutability. Their technique,
however, leads to some counterintuitive results. Butter and water softener
are classified as substitutes. Beer and bleach are classified as
complements. Fraser and Bradford (1983) assume that the timing of a
household's purchases of one item is Influenced by the timing of prior
purchases of its substitutes. They do not allow for complements at all.
Other approaches scrutinize brand switching in order to infer
competitive Interrelationships; for example, the Hendry method (Butler,
1970, 1971; Kalwanl and Morrison, 1977; Rubinson, Vanhonacker and Bass,
1980; and Vanhonacker 1980), hierarchical clustering (Rao and Sabavala,
^Many studies make use of some subjective criterion; e.g., substitutionin-use (Srivastava, Leone and Shocker, 1981), situational definition (Belk,
1979), and products-by-uses (Stefflre, 1979). These techniques areespecially appropriate for identifying any potential lines of competitionwithin the product category. In our approach, we are primarily interestedin identifying lines of existing substltutability and complementarityrevealed by patterns of actual choice behavior.

- 7 -
31981), and the PRODEGY technique (Urban, Johnson and Hauser, 1983). The
objective of these techniques Is to partition the market Into competitive
submarkets* They assume that relatively high levels of switching between
products Indicates close substitutes. Switching Is treated uniformly as an
indication of competition. The representations drawn by these techniques
are done without regard to any complementary relationships which might exist.
Cross-Consumption Response
We propose to characterize the interrelationships between products using
4a measure of cross-consumption response. Using individuals' past
consumption histories and a model of Variety seeking proposed by McAllster
(1983), we can measure the degree of substltutability or complementarity
between all pairs of products.
The essence of the technique, which we describe briefly in the next
section (see McAllster, 1983, for additional detail), is not unlike the
approach used to estimate cross-price elasticities. Cross-price elasticity
estimation requires measurement at two points in time with an intervening
system shock. One measures demand for product X, changes the price of
product Y, then remeasures demand for product X. The change in the demand
for X is Interpreted via price theory to provide an estimate of Y's
competitive impact on X.
^The PRODEGY technique is based upon a criterion called forced switchingwhich requires manipulation of the availability of certain products. In ourfurther discussion of PRODEGY, we employ a different criterion proposed by
Urban, Johnson and Hauser (1983) when experimental control of the choiceenvironment is not possible.
^Strictly speaking, since the measure we develop is not a ratio of per-centage changes, we choose the term response rather than elasticity.However, the measure is conceptually similar to a cross-elasticity usingchanges in past consumption rather than price changes.

- 8 -
To obtain the cross-consumption response we propose to measure the
unconditional probability of consuming product X, allow the consumption of
product Y, then measure the conditional probability of consuming X given
that Y has been consumed. The difference In the conditional and
unconditional consumption probabilities Is Interpreted via a theory of
variety seeking to provide an estimate of Y's competitive Impact on X.
Notice that this measurement technique Is resistant to the problems Day
and Shocker (1976) Identified In measuring cross-price elasticities.
Regarding their first point, the "shock to the system" is a change in the
internal state of the individual who consumed Y Instead of a change in Y's
price in the marketplace, there will be no competitive reaction clouding the
data.
Regarding their second point, the proposed technique yields, as a
by-product, an estimate of relative preferences for aspects of relevant
brands. Theory relates relative preferences for aspects to competitive
interrelationships (McAllster, 1983, see also the "Modeling Framework"
section of this paper). A change In product composition would imply a
change in the aspect structure of relevant products. To the extent that one
knows or can judgmentally estimate the resulting aspect structure of
relevant brands and the relative preferences for aspects Introduced into the
system, the new competitive interrelationships can be estimated without
resorting to a complete recalibration.
Finally, regarding their third point for frequently consumed products we
have more than enough data to estimate competitive interrelationships at the
individual level. Each consumption occasion provides an observation of the
impact of one selection on the next.

- 9 -
Modeling Framework
The model we use to describe individual variety seeking behavior and
from which we will draw our measure of cross-consumption response is based
on four assumptions.
First, we assume that each brand consists of a bundle of want satisfying
aspects. The preference for a brand Is the sum of the values of its
constituent aspects.
Second, we assume that an Individual's preferences for the available
brands are Influenced by that Individual's consumption history. In earlier
works (McAllster, 1982 and Lattln, 1983) we explored the Impact of the
entire consumptloD history on current choice. In the Interest of parsimony,
we restrict ourselves to consideration of only the most recent previous
choice In this model.
Third, we assume that the consumption of a particular aspect will
depress preference for that aspect on the subsequent choice occasion. The
amount by which consumed aspects are depressed depends upon the individual's
desire for variety. High intensity variety seekers will almost completely
discount recently consumed aspects. Low Intensity variety seekers will
discount recently consumed aspects very little.
Fourth, we assume that the probability that an individual consumes a
particular brand on a particular consumption occasion is proportional to the
Individual's current relative preferences for that brand (see Luce, 1959).
Simply stated, the model holds that the selection on one choice occasion
affects preferences on the next choice occasion. Having Just consumed a
particular "bundle of aspects" (i.e., a brand), variety seekers are less
attracted to those aspects when making their next choice so that brands
composed of different aspects become relatively more attractive. The

- 10 -
consumer chooses among the brands with probabilities proportional to current
relative preferences*
Consider the product class depicted in the Venn diagram in Figure 1.
Each circle (or crescent in the case of brand B^) represents a brand as
viewed by an individual. The size of the circle is proportional to the
individual's total preference for the brand. Regions of overlap indicate
aspects shared by the brands. The size of the overlap indicates the
relative preference contributed by the aspect which those brands share.
(Notice that brands B^, B,, and B^ have Identical composition and that
brand B, consists of only those aspects of B- not possessed by B^.
)
[FIGURE 1 ABOUT HERE]
After the individual consumes a brand, say B^ , preference for the
aspects provided by B^ Is depressed* The particular amount by which
preference is depressed depends on the intensity of the individual's desire
for variety, A very high intensity variety seeker might be completely
uninterested in any aspects recently consumed. In this case, preference for
recently consumed aspects would be depressed to zero. A very low intensity
variety seeker's preferences for these recently consumed aspects, on the
other hand, would be virtually unaffected.
Net Complements and Substitutes
Scaling Figure 1 so that the sum of the areas of the six circles equals
one, we can interpret the size of a brand's circle as the unconditional
probability that the individual will choose that brand* Consider an
individual who is a moderate variety seeker (i*e., who values recently
consumed aspects at only half their original value)* The consumption of
FIGURE 1:
VENN DIAGRAM OF MARKET CAI'^nciTTO"
FOR A HYPOTHETICAL B[^''^^\J.
BRAND
B-,
B.
B.
B,
Be
B,
PREFERENCEFOR BRAND
.25
.25
.125
.125
.125
.125
BRANDS SEENAS SHARINGAN ASPECT
Bj and B2
B2 ond Bg
B7 and B^
B3 and B5
B^ and B^
VALUE OFSHAREDASPECT
.125
.125
.125
.125
.125
We could only approximately represent the tt.'s and S^j's with
circles and crescents. The scale is sometimes slightly inaccurate.
Also we were forced to draw In some regions which do not correspond
to valued aspects. Such regions are shaded. These caveats apply to
all Venn Diagrams of market Composition


- 11 -
^2* ^OT example, would have the following substitution effects within the
category. Conditional preference for B^ would be half the value of Its
unconditional preference. Conditional preference for B, would also be
only half its unconditional preference since all the value provided by B
is provided by By* Finally, conditional preference for B. would be less
than its unconditional preference since the aspect provided by both B and
B^ is reduced in value. Notice that B-, B, and B. - brands that
share no aspects with B2 and hence cannot be substituted for by B- -
would experience no reduction in preference.
The complementary effect of B2 on the other brands is captured in the
rescallng of conditional preferences into probabilities. Unconditional
aspect preferences (aspect preferences before B^ was consumed) were scaled
to sum to one. The substitution effect of B- on B , B. and B led
to a reduction in conditional preference for those brands. These
conditional preferences sum to something less than one. We obtain the
relative conditional preferences (and hence the conditional choice
probabilities) by scaling all conditional preferences so that they sum to
one.
In sum, B^ has a substitution effect on all brands with which it
shares valued aspects. Further, B2 has a complementary effect on all
brands. It is the net of these two effects in which we are interested.
We can say unequivocally that B2 has a complementary effect on brands
chosen by the Individual with which it shares no valued aspects. Those
brands are serving different components of the composite need than B2
serves. No such unequivocal statement can be made for those brands which
share some valued aspect with B2.
Consider B2's net effect on B. . Conditional preference for that
apsect which they share is depressed by B2's substitution effect.

- 12 -
However, the aspect unique to B^ has become relatively more attractive due
to Bj's complementary effect. For this particular example, the two
effects almost exactly cancel. Consumption of B2 has no net effect on the
probability of consuming B.. B^ Is Independent of B..
Bg, on the other hand, experiences a net substitution effect given the
consumption of B2. The dramatic reduction of B^'s conditional
preference due to B-'s substitution effect is somewhat moderated by B^'s
complementary effect. Still, the net effect Is a reduction In the
conditional probability of consuming B .
Figure 2 Illustrates the relative conditional preferences that result
following the consumption of B2 . Not suprlslngly, B^ and B, shrink
noticeably In area. B^, B, and B^ experience no reduction in
conditional preference and their relative conditional preference is inflated
by the rescaling. The area of B, remains virtually unchanged. The
composition of that area, however, does change. The aspect shared with B2
has been depressed and B 's unique aspect has been inflated.
[FIGURE 2 ABOUT HERE]
We cannot say anything about the competitive relationships between
brands not chosen by the consumer. We will assume that all brands outside
the consumer's choice set exhibit competitive independence from those brands
within the consumer's choice set.
Analytical Statement of the Model
To describe the model analytically, we let tt. be the area of the
circle corresponding to brand B. before any choices have been made. Thus,
IT. corresponds to the individual's unconditional preference for brand
j. These tt.'s are scaled so that J . v. " 1. We denote the area
FIGURE 2:
VENN DIAGRAM OF HARKET roMnncjTinM FOR
HYPOTHETICAL EXA.^PLF COnniTIONAL ON HAVING
jnST CONSUnED Bo
(.17)
BRAND
B.2
B;
B,
Bt
B,
CONDITIONAL PREFERENCE
FOR BRAND
.25
.17
.17
.17
.17
.08
BRANDS SEEN AS


- 13 -
of the Intersection of B. and B. by S. .. Thus S. . corresponds to
the Individual's preference for the aspect common to B. and B..
Finally, we denote the discount factor for recent consumption by V. Thus, V
corresponds to the intensity of the individual's desire for variety. V
Indicates no desire for variety. V " 1 Indicates the highest desire.
An individual's conditional preference for B. given that she or he
most recently consumed B. is tt. -VS. ., the unconditional preference
for B. minus some fraction of the value provided by B. and B.. These
conditional preferences must be rescaled following the consumption of B..
Thus, the relative conditional probability of consuming B. given that B.
was Just consumed is
k
To present a Venn diagram of the individual's view of the market, we
need to know the values of tt. and S . . for all brands. We can estimate
these parameters using a linear program to minimize the sum of the absolute
differences between the theoretical values P . . . and the observed
first-order transition probabilities. Within this paradigm, we Impose
the following structural constraints: J], tt. 1 (a scaling constraint),
J S, . < TT. (the value provided by aspects of B shared with other brandskh ^^~ ^
cannot exceed the total value of B.), and ] . ^ 0. S. . >^ (non-negativity
constraints).
^In order to achieve linearity, we specify V a priori and solve theproblem. We then search over values of V In order to find the bestestimates of ttj and Sjj. See McAlister (1983) for details on thestructure of the program.
- 14 -
Cross-Consumption Response
Having estimated the model, we can obtain a measure of the net change In
demand for B Induced by the recent consumption of B . tt.
represents the unconditional preference for B .• P represents the
relative conditional preference for B. following the consumption of B.,
The quantity P^ . . -v , defines our measure of cross-consumption
response. It represents the net change In preference for B. In response
to the consumption of B.* This measure of cross-consumption response
describes a continuum of substitute and complementary relationships* If
P.. . —n. < (the consumption of B. lowers the probability of
choosing B.), then B. Is a net substitute for B.. The more negative
this number, the closer a substitute B Is for B . If P.,. ~tt. >
(the consumption of B. increases the probability of choosing B^)f then
B, is a net complement to B.. The more positive this number, the more
powerful a complement B, is to B..
It is Interesting to examine the conditions under which P^,
. -tt.
achieves a positive or negative sign. In particular, B. will be a net
substitute for B, (i.e., P,, . -tt^ < 0) if and only if tt^ < S^ VV, S, .
1 iiji ilj''kkjThus, if B. shares more than a proportional amount of its want satisfying
value with B . , B. is a net substitute for B^. The greater the
preference for aspect shared by B. and B. relative to the preference for
aspects B. shares with all relevant alternatives, the greater the net
substitutablllty of B. for B . . Similarly, if B. shares less than a
proportional amount of its want satisfying value with B. (I.e., v. >
S. ./£,S, .), then these conditions are equivalent to saying that B
Is a net complement to B..
We can use the cross-consumption response measure to indicate net
substitute and complementary relationships at the aggregate level. In

- 15 -
particular. If the weighted average of f... ~v. across Individuals
Is less than zero, we can say that In the aggregate B. Is viewed as a net
substitute for fi.« With a large enough sample of Individuals it may also
be possible to examine the views of different user segments. Our objective
Is not only to identify those Interrelationships which show at the aggregate
level, but also to bring to light relationships which exist at a segment
level and are masked in aggregation.
Representations
Goals
We seek a representation of cross-consumption response which will
display the competitive interrelationships among products. At the same
time, we wish to preserve all the information provided by the
cross-consumption response measure. In particular, we want a representation
that will preserve the asymmetry Inherent in the relationships between
products, reflect the entire continuum of relationship intensity, and
contrast substitutabillty and complementarity.
Existing representations of competitive interrelationships among
products do not meet these requirements. Simple market partitions reduce
the continuum of competitive intensity to a dichotomy: either two products
are classified in the same partition, (and hence as being substitutes), or
they are not (hence. Independent). Hierarchical structures permit some
gradation of the Intensity of the relationship, but cannot reflect
coBpleaentarity between products. Perceptual maps, embedded in Euclidean
space, imply a symmetric relationship between each pair of products. The
Venn diagrams shown in Figures 1 and 2 display the distribution and value of
want satisfying characteristics among products in the product class.

- 16 -
However, one cannot directly read the net substitution or complementary
effect from such figures.
Ve suggest a separate representation for each brand. In each
brand-specific representation, we picture the cross-consumption response of
the brand to the consumption of each of the other relevant brands. Thus,
the brand specific representation for B. Is simply a continuum In which
net complementary brands (with P -tt > 0) are placed to the
right and net substitutes (with P -tt. < 0) are placed to the
left. The continuum Is a "brand 's-eye-vlew" of the Impact of the other
relevant brands on the brand In question. Our overall representation Is
just the vertical "stacking" of each of the brand-specific contlnua. Though
not as parsimonious as existing representations, these " brand "s-eye-vlews"
satisfy our requirements of preserving asjnmnetry, continuity and contrast
between substltutablllty and complementarity.
[FIGURE 3 ABOUT HERE]
Pigure 3 Illustrates this representation for the hypothetical example
presented in Figures 1 and 2. The upper most bar in this graph represents
B^ 's-eye-vlew of the market. The location of the brands along B,'s
continuum Indicate the cross-consumption response of B^ to each of the
brands. Brands B^, B, and B- are strong net complements to B .
This makes sense when one examines Figure 1. Brands B^, B, and B,
share no aspect with B,. They address a different component in the
consuaer's composite need. B, is also a net complement. Again, this
arises because B^ shares no aspect with B..
FIGURE 3:
BRAND 'S-LYE-VIEWS OF CROSS-CONSUMPTION RESPONSE
FOR HYPOTHETICAL EXAMPLE
IncreasingSubstitutability
IncreasingConplementarity
B-
CQ
B.2
Csl
PQ>—
Be
X-
PC>J
COPC" CQ
PQ CO
^ O
•:3- LOCQ CQ
^ a
^ LTV
PQ CQ
^ o
IDPQ
CSJ
CQ
PO
CO I—CD PQ
i (-
to I—
I
PQ PC,
H h-
l£> .—1
PQ PQH—t-
PQ
r^ PQPQ> TD•—i £=
PQ CH
3-


- 17 -
B. Is neither a net substitute nor a net complement to B.. As was
explained earlier, the consumption of B. depresses relative conditional
preference for the aspect B, shares with B2« This depression is almost
exactly compensated by the enhanced relative conditional preference for
B. *8 unique aspect. On balance, the consumption of B2 doesn't effect
the subsequent probability of consuming B^^.
Finally, we have B^ located on the extreme left end of its own
continuum. Not suprlsingly, B, is its own best substitute. Notice that
this effect holds for all brands. In each brand 's-eye-view, the extreme
left end of the continuum is anchored by that brand itself. (B-, B, and
Be are perfect substitutes - they provide exactly the same aspect - and
hence jointly anchor the left ends of their brand 's-eye-views.) This
phenomenon will be repeated in the empirical example to follow and is a
consequence of the theory.
The second line in the graph in Figure 3 is B- 's-eye-view of the
market. Brands B^, B. and B^ are net complements for B.. They
share no aspect with B2. Brands B. and Bg are net substitutes for
Bj. Through an aspect shared with B^, B^^ or B, provides enough of
what B^ might offer to make B„, on balance, less preferred after the
consumption of B, or Bg. Examining the next three bars in Figure 3, we
see that B. , B2 and Bg complement B^, B, and Br and that B-,
B, and that Be substitute for one another, as mentioned above. The last
The particular assumption of the theory which drives this result is thatV >^ 0. V < would indicate a learning effect: consumption of thebrand at one point in time would increase the probability of subsequentconsumption of that brand. Such behavior would lead to a Markov transitionmatrix with large diagonal entries and small off-diagonal entries. Thedata used in this study did not exhibit this property. See McAlister(1983) for explanation of the degradation in fit when V was allowed to takenegative values.

- 18 -
bar in the graph Indicates that B^, B., B. and B complement B .
B. substitutes for B^ and B^ is a perfect substitute for Itself.
The changes in relative preference between Figure 1 and Figure 2 are
reflected in Figure 3. These changes capture the impact of the consumption
of brand B2 on all other brands. These changes determine 62*8 position
on each of theother brand 's-eye-view continuua. That B. 's total area is
unchanged from Figure 1 to Figure 2 is reflected in B„'s position at on
B,'s brand *s-eye-view. B^'s, B/*s and B^'s noticable growth between
Figure 1 and Figure 2 is reflected in 82*8 position along the net
substitute continuua for those brand 's-eye-views.
One final thing to notice is that a brand is more likely to experience
net complementary effects from other brands than net substitute effects.
Intuitively, this follows from the fact that variety-seekers have several
components to their composite need. The array of brands in their
consumption sets meet, to some extent, these diverse desires. Hence, we
have complementarity. Mathematically total net substitute effects must
balance total net complement effects. Because each brand is a perfect
substitute for Itself, the effect of the remaining brands must be, on
balance, complementary.
Application of the Approach
Data
We demonstrate our approach using data on individuals' consumption of
Here we are simply saying that since unconditional probabilities sum toone and conditional probabilities sum to one, the differences betweenconditional and unconditional probabilities must sum to zero. Positivedifferences between conditional and unconditional probabilities indicatecomplements. Negative differences between conditional and unconditionalprobabilities indicate substitutes.

- 19 -
soft drinks. The data were collected from October through December,
o
1978. The subjects were 36 graduate and undergraduate students enrolled
in the Schools of Business Admlnlstraton at the University of Washington.
Twenty-two percent of the subjects were females.
No economic incentive was offered for participation in the study.
Motivation for accurate reporting was provided by having the professor In a
bi-weekly class begin each period by distributing data collection forms and
requesting that serious thought be given to the task. At each data
collection opportunity subjects were asked to report all soft drinks
consumed since their last report.
Over the 81 days of the study, 29 students provided enough data to
permit estimation of the model described above. These subjects consumed a
collective total of 831 soft drinks yielding the aggregate choice shares
among the 10 soft drinks or soft drink categories displayed in Table 1.
[TABLE 1 ABOUT HERE]
Aggregate Analysis
Examination of the soft drink data suggests that most Individuals
consume either diet or non-diet beverages. Over 60% of the subjects (18 out
of 29) consume only one of the two types of beverage. Thus, it appears that
the different sets of want satisfying characteristics provided by diet and
non-diet drinks are neither net substitutes for nor net complements to one
another.
oThis data was originally collected for a different study reported inMcAlister (1982).

- 20 -
For the majority of subjects, diet and non-diet drinks form separate classes
which are competitively independent of one another.
The data also suggest that an individual is liable to consume both cola
and non-cola beverages. Approximately 70% of the subjects (20 out of 29)
consume beverages from both categories. Individuals may be switching
between categories (cola and non-cola) in order to achieve a suitable
balance in their consumption. To the extent that the consumption of cola
stimulates the subsequent consumption of a non-cola (and vice-versa), the
two groups of brands can be thought of as complementary.
We have argued that identifying and understanding complementarity
between products is a fundamental step in gaining insight about a product
class in which variety seeking behavior is an important determinant of
consumer choice. Few of the existing techniques for examining competitive
interrelationships, as we have said, are equipped to identify and represent
this complementarity. Most employ representations (such as market
partitions and hierarchical structures) that are too simple to reflect
complementarity and substltutablllty simultaneously.
None of the behavioral techniques based upon brand switching explicitly
9addresses the notion of complementarity . While all should be able to
identify diet drinks and non-diet drinks as Independent competitive classes,
none should be able to reveal the hypothesized complementarity between colas
and non-colas. We investigate these conjectures by applying three of the
existing behavioral techniques to the soft drink data: the "empirical"
approach to the Hendry method proposed by Kalwanl and Morrison (1977), a
hierarchical clustering approach proposed by Rao and Sabavala (1981), and
^A possible exception is Zahorlk (1983), who separates switching for thesake of variety from competitive switching. However, Zahorlk *s techniqueonly examines the interrelationships revealed by the competitive switching.

- 21 -
TABLE 1: AGGREGATE CHOICE SHARES
FOR THE 29 SUBJECTS*
Soft Drink Choice Share
Coke .32
Diet Pepsi .10
Dr. Pepper .06
Pepsi .11
7-Up .13
Tab .07
Cola .03
Diet Cola .04
Fruit Flavor .10
Diet Fruit Flavor .03
*The compositions of the last four categories is as follows. COLA: RC,
Cola, Mr. Pibb. DIET COLA: Diet Cherry Cola, Diet Cola, Pepsi Light.FRUIT FLAVOR: Mountain Dew, Sprite, Fresca, Gatorade, Ginger Ale, Grape,
Grapefruit Drink, Orange, Quench, Rootbeer, Squirt, Strawberry. DIET FRUITFLAVOR: Sugar-free 7-Up, Diet Creme Soda, Diet Lemon-Lime, Diet Orange,Diet Raspberry, Diet Rootbeer.

- 22 -
the PRODEGY technique of Urban, Johnson and Hauser (1983). We then present
our "brand 's-eye-vlew" representation of cross-consumption response.
Alternative Techniques
"Empirical" Hendry" • The fundamental assertion of the Hendry market
partitioning methodology Is that switching between competitive products will
be proportional to the product of aggregate choice shares; I.e.,
Ejj - K^m^ m^ for If'j
A Awhere E Is the expected switching between products 1 and j, m and m
are the aggregate choice shares of brands 1 and j, respectively, and K Isw
a switching constant. A brand-primary partition (I.e., no structure)
requires only one switching constant, while a form-primary partition (i.e.,
several groups of brands clustered together according to the form of the
product) requires a switching constant for each form plus a single constant
to describe the switching among forms.
Kalwanl and Morrison (1977, p. 476) suggest the following approach to
Hendry:
"1. Set up a hypothesis about the nature of partitioning in the
market...
.
2, Analyze the actual switching behavior by calculating empirically
the values of the switching constant both across and within
partitions...."
•'^ubinson, Vanhonacker and Bass (1980) present a theoretical approach toHendry which they constrast to the empirical approach proposed by Kalwanland Morrison. They contend that the theoretical approach provides morethan simply a "parsimonous description" of consumer switching, and that Itaffords an assessment of a mixed brand-form structure that the empiricalapproach does not. We choose the empirical approach because we do notconsider the mixed brand-form structure and because the fits given by theempirical approach dominate those provided by the theoretical approach.

- 23 -
The partition that best fits the observed patterns of switching In the data
Is the best Hendry representation of the competitive market structure.
The results of our empirical Hendry analysis of the soft drink data are
shown In Figure 4. We proposed three market partitions: a brand-primary
structure, a form-primary structure of diet and non-diet forms, and another
form-primary structure of diet cola, diet non-cola, cola, and non-cola
forms. We used as a measure of fit the sum of squares of actual minus
fitted switching, i.e.,
SS
-J^(N,j -NX, „J .y
Where N . . Is the aggregate of actual switches from brand I to brand j, N
is the aggregate total number of switches and SS is the total sum of squares.
«
[FIGURE 4 ABOUT HERE]
The form-primary structure for dlet/non-dlet drinks Is the best Hendry
representation of product competition. The fit improves from SS 1901 for
the brand-primary structure to SS 1385. The switching constants indicate
that much more switching occurs within each form (.503, .567) than between
forms (.230). Hendry also suggests that no further distinction can be made
within the diet and non-diet classes. The second form-primary structure, in
which we separate colas from non-colas, has a worse fit than the brand-
primary structure (SS " 2168 vs. SS 1901 for brand-primary).
^rk chi-square measure, traditionally used to assess the fit of proposed parti-tions,does not clearly demonstrate the superiority of the dlet/non-dlet structureover the brand-primary structure. The latter systematically over predictsswitching between diet and non-diet beverages. But because the relatively largepredicted values appear in the denominator of the chi-square measure, the squareddeviations terms are diminished. Thus, the brand-primary and diet/non-diet struc-tures exhibit similar chi-square measures (329.7 and 336.7 respectively) despitevery different sum of squares terms.

- 24 -
Hierarchical Clustering . Rao and Sabavala (1981) contend that a
relatively high level of switching between products is indicative of
competition between the two. They propose a hierarchical technique for
clustering products together according to the "flow" of switching between
12them.
^ii»'^^ flow switching from j to i, is given by
F -hUJ^ A
"l
where R.. . is the observed aggregate probability of choosing brand 1 following
a choice of brand j, and m. is the aggregate choice share of brand 1.
Since F is a ratio of actual switching to expected switching (under an
aggregate zero order model). It is interpretable as an empirical estimate of the
pairwlse switching constant between brands 1 and j. The hierarchical technique
clusters brands so that all pairs of products within a competitive subclass exhibit
high switching constants. Under this criterion, so similar to that of "Empirical"
Hendry, it is not surprising that the tree structure for the soft drink data (shown
In Figure 5) captures the competitive distinction between diet and non-diet
beverages. The low flows of switching across competitive sub subclasses are
attributable to the fact that few subjects consumed both diet and non-diet drinks.
[FIGURE 5 ABOUT HERE]
Figure 5 is the result of a cluster routine. Those brands joined together at
the lowest point in the figure are those between which the flow of switching is
highest. As one proceeds up the figure, links represent successively lower levels
1
2
'Rao and Sabavala suggest the use of either the upper or lower diagonalof the flow matrix. We present results based upon the upper diagonal,although both upper and lower diagonals yield similar clustering structures.
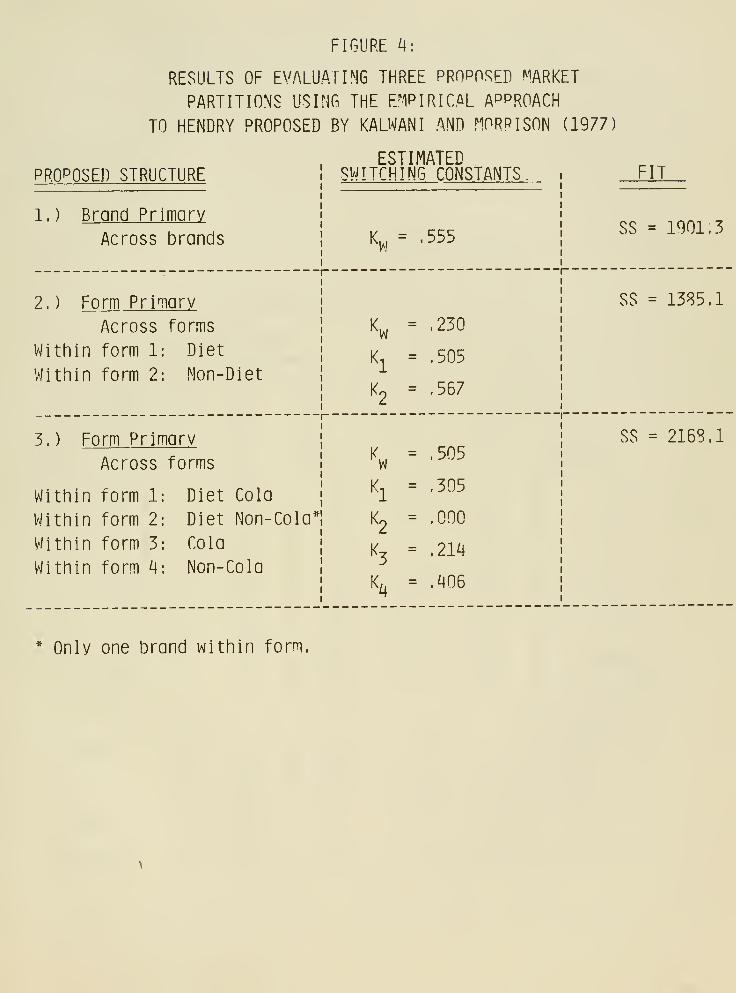
FIGURE a:
RESULTS OF EVALUATING THREE PROPOSED "MARKET
PARTITIONS USIMG THE FjIPIRICAL APPROACH
TO HENDRY PROPOSED BY KALWANI AND MORRISON (1977)
PROPOSED STRUCTURE

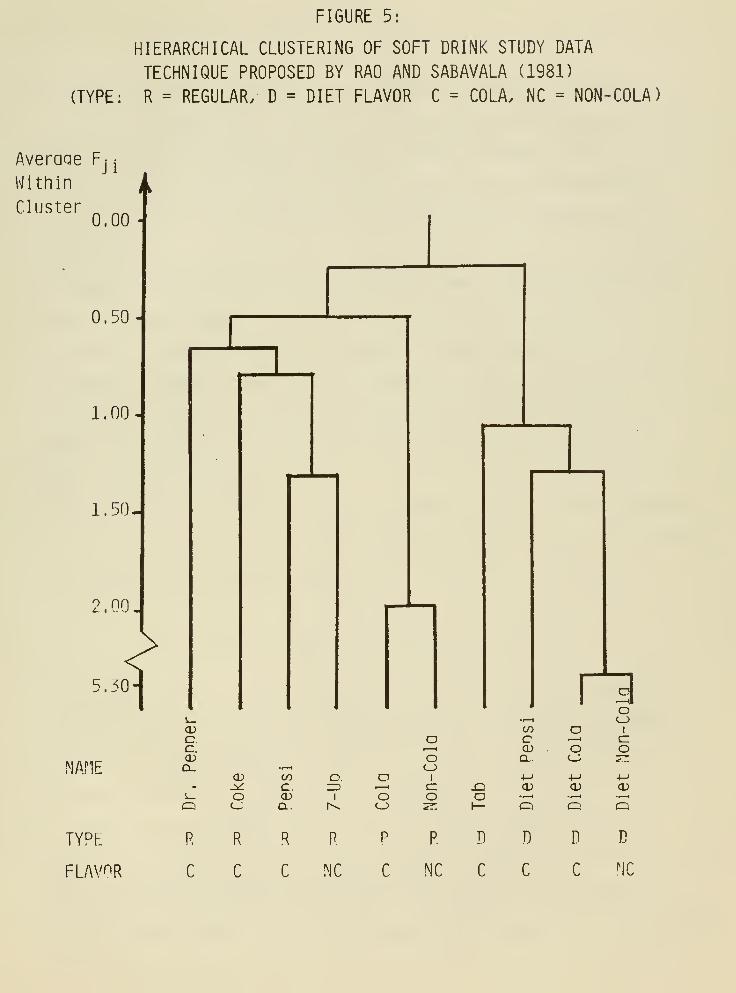
FIGURE 5:
HIERARCHICAL CLUSTERING OF SOFT DRINK STUDY DATA
TECHNIQUE PROPOSED BY RAO AND SABAVALA (1981)
(TYPE: R = REGULAR. D = DIET FLAVOR C = COLA. NC = NON-COLA)
Averaqe F:
Within
Cluster
Ji
0.00
0.50-
1.00-
1.50-
2.00
5.30
NAHE
CCCDa.
CD
oCOcCDa.
oo
I
oc_)
D
COoCDa.
CD•t-H
DO
+->
CD•I—
I
1oI
c:o
CD
TY^E
FLAVOR
R
C
R
C
R
C
P
NC
P
C
R
NC
D
C
D
C
D
C
D
NC

- 25 -
of average flow between clusters* Rao and Sabavala assume that the higher
the level of switching (i.e., the lower In the Figure that two brands are
linked) the greater the degree of substitutability of the brands* This
suggests that the highest levels of substitutability exist between colas and
non-colas: Pepsi and 7-Up, Diet Cola and Diet Fruit Flavor, and Cola and
Fruit Flavor.
PRODEGY . Urban, Johnson and Hauser (1983) propose to identify sets of
competing products using a heuristic of product deletion* In particular,
they define a group of products as a competitive product submarket If,
following the deletion of one product, consumers of the deleted product are
more likely to choose again within the group than would be predicted by the
aggregate choice shares of the remaining products in the group* If we
denote the aggregate probability of
choosing product 1 following the deletion of product j by P (j), and the aggregate
A Achoice share of products 1 and j by m. and m. , respectively, then a set of products
S form a competitive product submarket if
A
I ^\ii> - -iieS ' 1 -m^
is sufficiently large for all products j e S. Urban, Johnson and Hauser (1983,
pp. 8-10) provide a statistical test which can be used to evaluate the adequacy
of a proposed submarket structure* Any partition with an overall z-score of 1.9 6
or above is acceptable at a 95% level of confidence.
When it is not possible to observe P.(J) by direct manipulation of the
availability of product j. Urban, Johnson and Hauser (1983, pp* 15-16) suggest
several alternative estimates. We consider their estimate of Pj(J) based upon
Individual choice shares. To use this estimate, we must assume that individuals obey
- 26 -
a constaDt ratio model; I.e., following the deletion of product J, the Individual's
choice shares for the remaining products Increase proportionately. If we de
note the choice sh£
respectively, then
note the choice shares for Individual h for products 1 and j by m and m ,
h
P*»(1) . L_1-mj
where Pj(j) Is the probability that an Individual chooses product 1 following
the deletion of product j. We can then estimate P^(j) by
I -\ PJCJ) /In.'h J ^ h ^
We applied the PRODEGY technique to the softdrlnk data, suggesting three
different market partitions: {Cola, Non-Cola}, {Diet, Non-diet},
13and {Cola, Non-cola, Diet Cola}. The results are shown below In Figure 6.
[FIGURE 6 ABOUT HERE]
Clearly, the {Cola, Non-cola} partition Is not adequate to represent the
competition among soft drinks. A z-score of -0.31 Indicates that on average, more
competition occurs between submarkets than within them. The {Diet, Non-diet}
partition nicely captures the competition among diet and among non-diet drinks,
with an overall z-score of 2.37 significant at the 95% level. Our effort to
further distinguish relationships between cola and non-cola reduces the overall
z-score for the partition to 1.4, not significant at the 90% level.
Markov Decomposition Analysis
Total Sample Analysis . As Indicted earlier we are able to estimate V , tt., S. .
1 3•'•'Because PRODEGY Is based upon a product deletion heuristic, there Is no way toevaluate a submarket consisting of one product. Therefore, we leave DietNon-cola out of the third proposed partition.

FIGUPF 5:
RESULTS OF EVALi''ATIMG THR.FE PROPOSED ^rARKET PAf^.TlTIONS
USING THE PRODEGY TEfHNIOUE dpodosED
RV URBAN, J^HNSO^I, AN^ H^USFP (1^83)
1, CniA, NON-COLA
COLA (7)*
Z = -0,82
O^'ERALL PARTITION
Z = -0.31
NON-C^LA (3)
Z = 0.83
2, DIET, NON-DIET
NON-DIET (6)
Z = 1.76
3. DIET CHLA. COLA. NON-COLA
DIET COLA (3)
Z = 1.78
OVERALL PARTI TIHN
Z = l./tZ
1 —COLA m)
1 = 0,53
NON-COL^ (2
Z = 0.9^1
'Number in parentheses indicates number of brands in submorket
*"Partition includes only nine brands because the tenth brand. Diet
Fruit Flavor, would be a single brand category. By definition,
there con be no forced switching between brands within a single
brand category.


- 27. -
fcr all brarids i and j for consumer h^ by eauating the theor eti ca i
hconciLionai cor.sua:::! i or. probabiliLv F. '. to the eEplrically observed condi-
tional frequency F,,
^ • As reported in McAlister (1983), Individual choice is
not typically zerc-crder among these subjects. An individual making
consucpticn decisions according to a zerc-crder process voulc be
c narac terized by a V = C. Fcr the 29 subjects in this study, only 6
display -hat value. Values of V for other subjects range froc .2 to .9
vith an average value over the total sample of approjriiLately .A. The values
-h..h, .... . ...of -.. anc S_, ^ shov a smiiar heterogen-.ety across sutjecus.
In order to develop an understanding c: aggregate corpetitive
interre_a:i cnsr.ips , we hue: aggregate the individual level parameters,
iiecause the heaviness of usage of this product class varied ratner
dra-atically across subjects (froz: 12 tc 62 selections vi:n an average of
approximately Zz^ selections by each subject), we decided to take a weighted
average of individual parameters. A.s weights we use the ratio of the nuster
of choices made by a subject to the total number of choices made. If we let
w denote the weight reflecting individual h's relative "heaviness of
consumption, we calculate aggregate parameters as:
20r h h ,) w ". for a
h=l11 brands i
2 9,. A _ r h- h , 1 T •
S = / wS..foralli"Ij -
1
iJbrands i t' j
•'-'^Kotice the superscript in which has been added to denote individual h.

These aggregate paraaeters are used to depict the carket as seen by the total
sample it, tne Veni: ciagraii in Figure 7.
Tc esticate aggregate brand ' s-eye-vievs , we could have combined tnese
aggregate r.
.'''
and S /'. with a similarly calculated aggregate V • Such an
aggregate measure would have lost the inpact of the correlation among the
1- h hT.", S. ., and V . In order to retain the impact of tnat correiation we
firs: calculate the individual level cross-consumption response
k ^ ^
and then take a weighted average of those effects yielding the aggregate
crcsf-consuizrt i or. resnonse
00
( ? . .- -
. ) = / w ( ? , ^.- -n . )
'J ' v.= i^ ' : ^
r-.ecaii t; /; -T . < indicates that brand j is a net substitute for
brand i. ?. --." > indicates that brand i is a net complement for tranc i
1 ! J 1
P./! -r.'" = indicates that the substitute and complement effects of j1 1
-
;n i exactlv cancel if both brands i and j are chosen by h. P. . -t,. ' is alsoilj '-
driven to if the consumer does not choose both brands i and j. The subjects
in this study chose only an average of A of the 10 different brands. Aggre
gate competitive interrelationships will, therefore, be of smaller magnitude
than individual level parameters. Figure 8, the brand ' s-eye-views of
aggregate cross consumption response., bears out this general effect as well
as presenting some very interesting information about the market as a whole.
[FIGLkZ 7 i 8 /3:UT KLP.E]
FIGURE 7:
VENN DIAGRAM OF MARKET COMPOSITION FOR THE TOTAL EXAMPLE
BRANDS SEEN
AS SHARING AN' ASPECT
BY THE TOTAL TAMPLE
Coke and Pepsi
Coke and Fruit Flavor

FIGURE 8:
BRAND'S-EYE-VIEWS OF CROSS-CONSUMPTION RESPONSE BASED UPON THE TOTAL SAMPLE
Increasing
Substitutability
Increasing
Comolementaritv<-
Coke
Diet
Pepsi
oa<vo.
o>crx3— aU- I—
-t-
I
*-> COcu c— cuQ Q-
Dr. Peppercuc
- c!^ CD
4-' O4-..^. ><u z: c:;
QLLLL.
CD
C
PepsicCDa
CD
O
7-Up
t^
-.050A^
' G- >3 O -C,
I
t-JC— >=3 Cil_ —
I
U-U_
<D
oCOcCD
4M"
Tab
Fruit Flavor
Diet
Fruit Flavor CD
O>
CO CU •4-' '-• >C-i.^ CD =3 OCD O—' i—
^
Q (->c;u_Li_
Tz;
oc cu CO
I O CD
scale
%
H
Total Snr^oles
Cross-ConsumptionResponse of .01


- 29 -
The first thing to notice In Figure 8 Is that our measure of cross-
consumption response, like existing techniques, reflects the relative
Independence of diet drinks from non-diet drinks. It Is primarily non-diet
drinks that have substitute or complementary effects on other non-diet
drinks and primarily diet drinks that have substitute or complementary
effects on other diet drinks. Tab, however, is an exception to this rule.
In addition to its role among the diet drinks, it also plays a role within
the non-diet drinks.
Cross-consumption response also reveals the complementarity between cola
drinks and non-cola drinks. Among the diet drinks Tab complements Diet
Fruit Flavor and Diet Fruit Flavor complements Tab and Diet Pepsi. Among
non-diet drinks the relationship is more subtle. There are, apparently,
three classes of non-diet drinks. The first class (call it "major colas")
is made up of Coke and Pepsi. The second class (call it "major change of
pace") is made up of 7-Up and Tab. The third class (call it "minor change
of pace") is made up of the Fruit Flavor and Dr. Pepper. Brands have
substitute effects on other brands within their class and complementary
effects on brands in the other two classes. Note that although some of the
proposed effects are not depicted in Figure 8 none of the documented effects
are inconsistent with this scheme. Furthermore, most of the missing effects
relate to Dr. Pepper, a small share brand that was only chosen by 3 of the
29 subjects. Dr. Pepper's small share and the small constituency tend to
drive its aggregate effect toward zero. Evidence consistent with the
grouping of Fruit Flavor and Dr. Pepper is found in the segmentation
analyses that follow. Finally, notice that the Cola and Diet-Cola
categories do not appear in Figure 8. That is because the only
non-negligible effect for those two categories was that of the category as a
substitute for Itself.

- 30 -
Because we report continuous values for substitute and complementary
effects, we are able to compare the magnitude of the effects. Note that
Pepsi complements 7-Up more strongly than Coke does; furthermore, 7-Up
complements Pepsi more strongly than It does Coke. This more Intense
complementarity of 7-Up and Pepsi could be exploited In joint promotional
efforts. In advertising copy. In shelf pacement of the product, etc. If It
appears In analyses of representative market samples.
Consider now Figure 7, the Venn diagram of market composition aggregated
across the total sample. Note first that Cola and Dr. Pepper do not appear
A AIn the diagram. That Is because neither ti- , nor ti- _ were statist-
Cola Dr. Pepper
Ically greater than zero for p > .10. Similarly notice that there are very
few brands whose similarity Is statistically greater than zero for p > .10.
S can be driven toward zero by subjects who don't consume both 1 and j or by
subjects who consume both 1 and j but do not 1 and j as being similar. Hence,
S statistically greater than zero for p > .10 requires a fairly widespread
perception of nontrlvlal similarity.
That Coke and Pepsi should exhibit such similarity Is not surprising.
It Is surprising, however, to find a significant similarity between Coke and
Fruit Flavor. In the next section we explore that similarity.
Analysis of Segment Perceiving Coke and Fruit Flavor as Similar . For this
analysis we select only those six subjects for whom S„ , - ^^ tm > 0,J -i Cola, Fruit Flavor
The subjects' individual level parameters of the six subjects are aggregated in a
manner analagous to that just described to aggregate the total
,15. Figure 9A in which brands are labeled, shows the Venn Diagram of a
ggregate
^Because each of the segments is so small, we must forego requirement ofstatistical significance. With a larger total sample, segment membershipshould be larger allowing more precise statistical statements.

- 31 -
market composition for this segment. Figure 9B reproduces that structure
labeling aspects Instead of brands. This double representation Is done to
facilitate the following exposition.
[FIGURES 9 & 10 ABOUT HERE]
The first thing to notice Is that members of this segment have much more
homogeneous perceptions of brand similarities than the total sample. (The
homogeniety Is reflected In larger values for S... A smaller proportion of
zeros has been averaged In.) The second thing to notice Is that this is a
Coke dominated segment. We Identify five sources of preference for Coke and
label them a, through Oc. a, is unique to Coke, a^ Is
shared with Non-Cola and. In fact, makes up nearly 80% of Non-Cola* s value.
o^ Is shared with 7-Up. Making up nearly 90% of 7-Up's value, a.
Is shared with Pepsi and make up 100% of Pepsi's value. Qc is shared
with Tab and makes up approximately 40% of Tab's value. Coke provides
virtually everything. Only a small amount of want satisfying value is
provided by the unique aspects of 7-Up, Non-Cola, Tab, etc.
These effects are reflected in the brand 's-eye-views in Figure 10.
Almost all brands complement Coke. The aspects they don't share with Coke
(ag through a, 2^ offer a change of pace to Coke. In particular,
Diet Pepsi and Tab substitute for one another as the diet change of pace and
Fruit Flavor and Dr. Pepper substitute for one another as the non-diet
change of pace.
Notice that Fruit Flavor and Coke both complement Diet Pepsi. This
occurs because Coke and Fruit Flavor are large preference brands that share
no aspects with Diet Pepsi. However, 7-Up is another large preference brand

- 32 -
that shares no aspects with Diet Pepsi and 7-Up doesn't complement Diet
Pepsi. This seeming anomaly Is an artifact of aggregation. No subject In
this segment chose both 7-Up and Diet Pepsi. Some chose 7-Up. Some chose
Diet Pepsi. Hence, both brands are represented on the Venn Diagram. Since
they were never chosen together, however, no Individual level complementary
effects exist to be aggregated. The aggregate Venn diagrams can be
misleading In this way. One cannot be sure whether two brands were ever
chosen together unless an aggregate similarity measure emerges.
Finally, notice that in Figure 9, as in Figure 7, there is no similarity
between 7-Up and Fruit Flavor. A priori, we expected such a similarity to
emerge. To gain insight into the market we next investigate the segment of
subjects for whom ^y.^^^ p^uit Flavor ^ °*
Analysis of Segment Perceiving 7-Up and Fruit Flavor as Similar . We
restrict this analysis to those two subjects for whom S^_yp^Fruit Flavor
> 0. Aggregation is performed as before.
[FIGURES 11 AND 12 ABOUT HERE]
The Venn diagram in Figure 11 depicts an Intuitively appealing
representation of market composition. Coke and Pepsi are very similar.
7-Up and Fruit Flavor are also similar, though less so. The cola drinks
share no aspects with the non-cola drinks.
The competitive interrelationships are drawn out in Figure 12. In
general, they are consistent with intuition. The one surprising result is
the asymmetry of 7-Up and Fruit Flavor's relationship. 7-Up substitutes for
Fruit Flavor while Fruit Flavor complements 7-Up. This occurs because 7-Up
can provide virtually everything that Fruit Flavor can provide but the
FIGURE 9:
VENN DIAGRAM OF flARKET COMPOSITION FOR
THOSF SIX SUBJECTS WHO DRINK BOTH COKE AND
FRUIT FLAVOR AND VIEW THE^1 AS SIMILAR.
Figure 9A: Brands Labelled
Preference


FIGURE 10:
BRAND'S-EYE-VIEWS OF CROSS-CONSUMPTION RESPONSE
FOR THOSE SIX SUBJECTS WHO SEE COKE AND
FRUIT FLAVOR AS SIMILAR
IncreasinqSubstitutability
IncreasingComplementarity
<-
Coke
CD
O
Diet Pepsi
(U c-^ cu
CU-t-' OQ.—' >
- O =3 OGD-Ll-U-
Dr. Pepper H-
COQ.O)
Pepsi
I
oCJ)
7-Up
J3o
Tabo>
4-> CO(U O.•^ CU
CDQ.
-Q.s_CUC3Q-
Frult Flavor I—A/-.042
Os- >(DOQ.—
'
Q.LI_<DQ_4-'
Q. —
'
I s- i_ ar^QLLI—
COQ.a>D_
(U
(=1
MO•—> <u=3 O -i«i
S_—
<
OL1_U_ O
CU
o I
o>o
o>a
CUQ.
- Q.I- CU
oa i-
-M oOJ-— >.i<^ =3 oo i-—C_)L1_LL_
CU
O O
Q.(UD-
CUCOClCU I
scale
Segment Crosb-ConsumptlonRpRnnnse of .01

FIfiURE 11:
¥
»
VENN DIAGRAM OF !"1AP.!<ET COnPOSITION
FOR THOSE TWO SUBJECTS WHO DRINK BOTH
7-UP AND FRUIT FLAVOR AND VIEW THE^^ AS SI-^ILAR
Pepsi(.18)
Brand

FIGURE 12:
BRAND'S-EYE-VIEWS OF CROSS-CONSUMPTION RESPONSE
FOR THOSE TWO SUBJECTS WHO SEE 7-UP AND
FRUIT FLAVOR AS SIMILAR


- 33 -
reverse Is not true. A variety seeker who had just consumed Fruit Flavor
Bight find 7-Up'8 unique aspect very appealing* However, If that variety
seeker had Just consumed 7-Up, there
would be very little unique about Fruit Flavor to attract her or him.
One final observation should be made. The size of the effect that a brand
can have on other brands Is a direct function of Its relative preference (tt.).
A ANotice that Tip , Is slightly larger than v„ , In this segment. Correspondingly,
Pepsi's complementary effect on 7-Up Is slightly larger than Coke's. This also
holds true for Pepsi's and Coke's complementary effects on Fruit Flavor. Notice
A Athat 11-, „ Is significantly larger than ti„ .^ _. . These brand's complementary
7-Up * J e> Fruit Flavor
effects on Coke and Pepsi are similarly scaled. The converse of this effect
can also be noted In Figure 12. The size of the effect that other brands can
have on a particular brand is also a direct function of that brands relative
preference.
We will examine one last segmentation scheme in our attempt to under-
stand the competitive interrelationships among these brands.
Analyses of the Segment Perceiving Coke and Pepsi as Similar and of the
Segment Perceiving Coke and Pepsi as Dissimilar . Figure 7 indicates that
Coke and Pepsi are perceived, in aggregate, as having at last some
similarity. It's Impossible to determine from Figure 7 whether virtually
everyone sees them as slightly similar or whether there is one segment that
sees them as very similar and another that sees them as not similar at all.
We go back to the S„ , p .to answer this question.
It turns out that there are three distinct segments. First, there are
those (24Z of the sample) who see Coke and Pepsi as similar. Second, there
are those (28Z of the sample) who drink both Coke and Pepsi but see them as

- 3A -
offering totally different aspects. Third, there are those (48% of the
sample) who do not drink both Coke and Pepsi.
Coke and Pepsi are most vulnerable to one another among that 24Z of the
arket who see Coke and Pepsi as similar. It is these individuals who are
likely to substitute a Pepsi for a Coke or vice-versa. The 28% of the
sample who choose both Coke and Pepsi, but see them as dissimilar, are
unlikely to substitute one for the other. Their selection of a Pepsi or
Coke will subsequently stimulate the desire for the other drink (for the
sake of variety). We begin, therefore, by considering
those individuals for whom S„ . ^ . > 0,Coke, Pepsi
[FIGURE 13 AND 14 ABOUT HERE]
As expected we see that Coke and Pepsi substitute for one anothei^ in
this segment. Furthermore, Coke and Pepsi each complement 7-Up, Fruit
Flavor and Tab and vice-versa. Tab and 7-Up compete as a change of pace for
these drinks. And the asymmetric relationship between 7-Up and Fruit Flavor
emerges again. There are few surprises here.
Let us now explore competitive interrelationships as perceived by the
segment who drinks both Coke and Pepsi but sees them as dissimilar.
[FIGURES 15 AND 16 ABOUT HERE]
Figures 15 and 16 display the market composition and competitive
Interrelationships for that segment who drink both Coke and Pepsi but view
them as dissimilar. These individuals are basically Coke drinkers. Pepsi
commands very little preference in this segment. Due to a strong negative
FIGURE 13:
VENN DIAGRAM OF flARKET COMPOSITION FOR
THOSE SEVEN SUBJECTS WHO DRINK BOTH
COKE AND PEPSI AND VIEW THEM AS SIMILAR
Brand
Coke
Peosi
7-Un
Tab
Fruit Flavor
Preference forBrand in this
Senment
.39
.29
.22
.07
.04
Brands Seen As Value ofSharino an Asnect Shared
this Segment ^snect
Coke and PeDsi .20
Coke and 7-IJn .03
Coke and Fruit Flavor .02
Pepsi and 7-Un .01
7-Un and Tab .0^
7-Un and Fruit Flavor .03

FK^UP.E 1/4:
BPAND'S-EYE-VIEWS OF CROSS-CONSUMPTION RESPONSE
BASED ON THOSE SEVEN SUBJECTS WH^
SEE COKE AND f^EPSI AS S PILAR
Coke
Pensi
IncreasinnSuDstitutability
IncreosinaConinienentaritv
<-
<D

FIGURE 15:
VENN DIAGRAM OF ^lARKET COMPOSITION FOR
THOSE EIGHT SUBJECTS WHO DRINK BOTH
COKE AND PEPSI AND VIEW THEM AS DISSPIILAP
Brand
CokeDr. PepnerPensi7-UnDiet ColaFruit FlavorDiet Fruit Flavor
(.13)

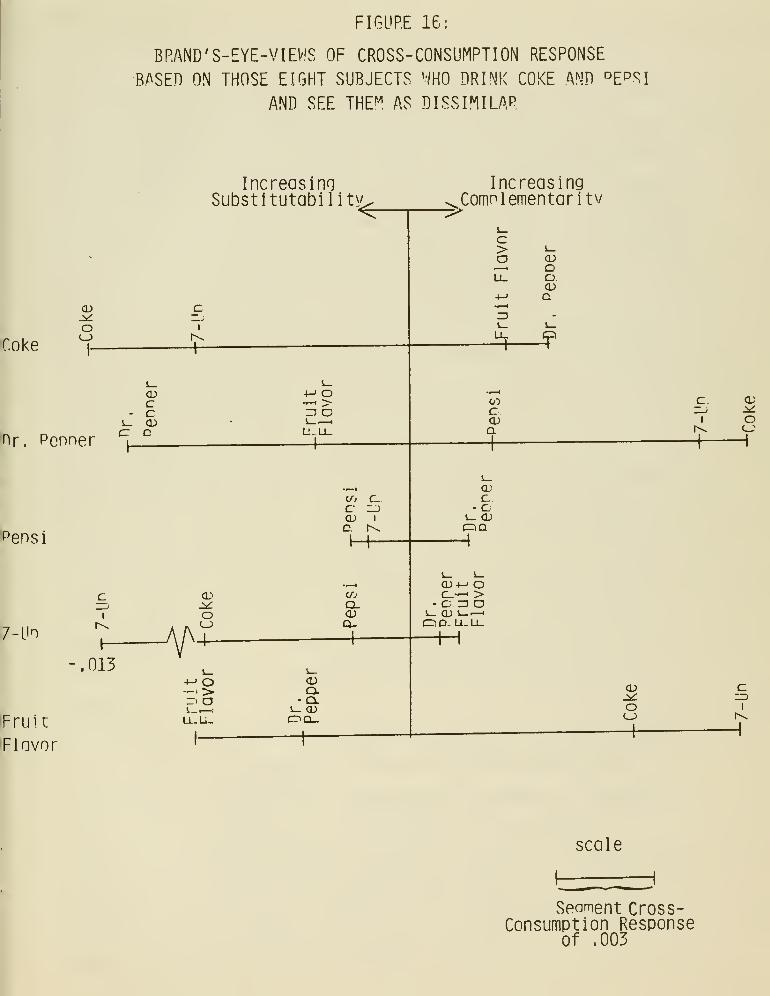
FIGUP.F. 16:
BRAND'S-EYE-VIEV'S OF CROSS-CONSUMPTION RESPONSE
BASEn ON THOSE EIGHT SUBJECTS WHO DRINK COKE AND "^EpSI
AND SEE THE^'^ AS DISSIMILAP


- 35 -
correlation of preference for Coke and Pepsi across members of this segment,
Coke and Pepsi neither substitute nor complement one another. 7-Up, in a
surprising reversal from the previous segment analysis, substitutes for both
Coke and Pepsi and vice-versa. Dr. Pepper and Non-Cola substitute for one
another as they vie for the role of change of pace to Coke, Pepsi and 7-Up.
A very important difference between the Coke and Pepsi drinkers who see
Coke and Pepsi as similar and those who see them as dissimilar is the
relationship of 7-Up to those two drinks. The 242 of the sample who see
Coke and Pepsi as substitutes view 7-Up as a complement to Coke and Pepsi.
That 282 of the sample who see Coke and Pepsi as independent see 7-Up as a
substitute for Coke and Pepsi.
In sum, we have found that, for the sample as a whole, diet drinks are
largely competitively independent from non-diet drinks. Tab, an exception
to this rule, interacts with both diet and non-diet drinks. We also
uncovered the hypothesized complementarity that existing techniques were
unable to Identify. Among diet drinks cola drinks complement non-cola
drinks. Among non-diet drinks there are three classes: "major colas,"
"major change of pace" and "minor change of pace." Brands within each class
substitute for one another. Brands in different classes complement one
another.
Through various segmentation analyses, we were able to recover certain
effects washed out in aggregation. We found that Coke dominates most
segments with other brands offering some measure of variety. An exception
to this rule is segments in which Coke and Pepsi are perceived as
approximately equally attractive and as being very similar. In a surprising
reversal, 7-Up is seen as a complement to Coke and Pepsi by the segment who
see Coke and Pepsi as similar. 7-Up is seen as a substitute for Coke and
Pepsi by the segment who see Coke and Pepsi as dissimilar.

- 36 -
SUMMARY AND CONCLUSIONS
Existing techniques based on consumer choice (Hendry partitioning, Rao
and Savala's hierarchical clustering and PRODEGY) were shown to produce
limited results when used to infer competitive interrelationships among
brands in a class in which variety seeking is an Important determinant of
consumer behavior. When applied to a collection of individual's soft drink
consumption histories, these techniques were able to split the brands Into
two competitive subclasses: diet drinks and non-diet drinks. They were
not, however, able to further split these subclasses into cola drinks and
non-cola drinks. These techniques all assume that individuals switch
between brands which are close substitutes. When consumers seek variety
they are likely to switch between brands which complement one another. In
our data, consumers frequently switched between cola drinks and non-cola
drinks. The existing techniques inferred from those switches that cola
drinks are the closest substitutes for non-cola drinks.
Using a model of variety seeking behavior (McAlister, 1983), we have
developed a technique for revealing substitute and complementary
relationships from brand switching data. We were able, as were existing
techniques, to distinguish the relative competitive independence of diet
soft drinks from non-diet soft drinks. By producing continuous values for
degree of substitutablllty or complementarity rather than simply designating
two products as competitors or not (as is done In a partitioning scheme), we
were able to observe a subtle caveat to the dlet/non-dlet dichotomy. Tab,
as one would expect, had competitive interactions with other diet soft
drinks. It also had competitive interactions with non-diet soft drinks. It
competed with 7-Up to be the "major change of pace" drink among the non-diet
drinks. Partitioning techniques, with their requirement of placing a brand
in one class or another, masked this subtlety.

- 37 -
Our technique, unlike existing techniques, was also able to reveal
complementary relationships between cola drinks and non-cola drinks. Among
diet drinks there was a simple complementary dichotomy* Among non-diet
drinks there was a three-'way complementarity among "major colas," "major
change of pace" and "minor change of pace." Also, because of the continuous
nature of our measure of complementarity we were able to show another subtle
difference. Both Coke and Pepsi complement 7-Up and vice-versa. Pepsi,
however. Is a stronger complement to 7-Up than Is Coke and 7-Up is a
stronger complement to Pepsi than to Coke. Understanding the relative
strength of the complementary relationships should enable managers to select
partners for joint promotional efforts, to devise advertising themes and to
arrange retail displays more effectively.
Our technique also allowed for asymmetric competitive relationships
among brands. Asymmetry appeared in a segment of high intensity variety
seekers who viewed 7-Up as providing everything that Fruit Flavor provided
plus something unique to 7-Up. For these subjects 7-Up substituted for
Fruit Flavor, while Fruit Flavor complemented 7-Up.
A further advantage of our technique follows from Its retention of
individual level information. Competitive interrelationships estimated for
the total sample mask many interesting and managerially useful insights. By
segmenting consumers on various managerially relevant dimensions we were
able to recapture and explore competitive Interrelationships which cancelled
one another out in the total sample statistics. For example, we found that
people who see Coke and Pepsi as similar view 7-Up as a complement to both
Coke and Pepsi. Those people who see Coke and Pepsi as dissimilar view 7-Up
as a conpetltor to both Coke and Pepsi.
In sum, we have proposed that for those product clases in which
consumers seek variety, existing "behavioral" techniques cannot adequately

- 38 -
uncover competitive interrelationships. We have proposed a technique that
goes beyond existing techniques to uncover complementarity among brands.
Our technique also provides a continuum of values for substitute and
complementary relationships. Further, it allows for asymmetries in
competitive Interrelationships. Finally, our technique is based on
individual level Information and can be disaggregated in any way and to any
degree desired.
We claim no generallzablllty for these data. The sample was small and
not representative. The object of this paper was to point out limitation of
existing techniques and to propose a technique that overcomes that
limitation. These data were sufficient for that task. The results are
intuitively appealing and suggest that the estimation of this model on a
large and representative sample might prove useful to managers.

- 39 -
REFERENCES
Bass, Frank M., Edgar A. Pessemler and Douglas J. Tlgert (1969), "Complementaryand Substitute Patterns of Purchasing and Use," Journal of AdvertisingResearch . 9 (June) pp. 19-27.
Belk, Russell W. (1979), "A Free Response Approach to Developing ProductSpecific Consumption Situation Taxonomies," In Analytical Approaches to
Product and Marketing Planning , ed. Allan D. Shocker, Cambridge, MA:
Marketing Science Institute, pp. 177-196.
Butler, Ben Jr., and David H. Butler (1970 and 1971), "Hendrodynamlcs:Fundamental Laws of Consumer Dynamics," Hendry Corp., Croton-on-Hudson
,
New York, Chapter 1 (1970) and Chapter 2 (1971).
Day, George S. and Allan D. Shocker (1976), "Identifying Competitive ProductMarket Boundaries: Strategic and Analytical Issues," Marketing Science
Institute Report No. 76-112 (August), Cambridge, MA.
Day, George, S., Allan D. Shocker and Rajendra K. Srlvastava (1979), "CustomerOriented Approaches to Identifying Product Markets," Journal of Marketing ,
Vol. A3 (Fall) pp. 8-19.
Deaton, Angus and John Muellbauer (1980), Economics and Consumer Behavior ,
Cambridge University Press, Cambridge, MA
Eraser, Cynthia and John W. Bradford (1983), "Competitive Market StructureAnalysis: Principal Partitioning of Revealed Substltutabllltles," Jouma 1
of Consumer Research , 10 (June) pp. 15-30.
Henderson, James M. and Richard E. Quandt (1958), Mlcroeconomlc Theory; A
Mathematical Approach , McGraw-Hill Book Co., Inc., New York.
Kalwanl, Manohar U. and Donald G. Morrison (1977), "A ParsimoniousDescription of the Hendry System," Management Science , 23 (January),
pp. 467-477.
Lattln, James M. (1983), "A Model of Balanced Choice Behavior: Development,Calibration and Testing," unpublished Ph.D. thesis, Sloan School of
Management, MIT.
Lancaster, Kelvin (1971), Consumer Demand: A New Approach , New York: ColumbiaUniversity Press.
Luce, R. Duncan (1959), Individual Choice Behavior: A Theoretical Analysis .
New York: John Wiley.
McAllster, Leigh (1979), "Choosing Multiple Items from a Product Class,"
Journal of Consumer Research , Vol. 6 (December) pp. 213-224.
McAllster, Leigh (1982), "A Dynamic Attribute Satiation Model of VarietySeeking Behavior," Journal of Consumer Research , Vol. 9 (September)pp. 141-150.

- 40 -
REFERENCES (continued)
McAllBter, Leigh (1983), "Markov Decomposition of Brand Switching Matrices^
to Infer Individual Preference Structures When Consumers Seek Variety,
Working Paper, M.I.T.
Rao, Vlthala R. and Darius J. Sabavala (1981), "Influence of Hierarchical
Choice Processes from Panel Data," Journal of Consumer Research. 8 (June),
pp. 85-96.
Rubinson. Joel R., Wilfried R. Vanhonacker and Frank M. Bass (1980), "Note on
•A Parsimonious Description of the Hendry System,'" Management Science. 2b
(2), pp. 215-226.
Srivastava, R.K.. R. P. Leone and A.D. Shocker (1981), "Market Structure
Analysis: Hierarchical Clustering of Products Based on Substitution In
Use." Journal of Marketing , Vol. 45. No. 3 (September), pp. 38-48.
Stefflre, Volney (1979), "New Products: Organization and Technical Problems
and Opportunities." in Analytic Approaches to Product and Market Planning.
ed. Allan D. Shocker. Cambridge. MA: Marketing Science Institute, pp.
79-104, 419-480.
Stlgler. George J. (1966), The Theory of Price (Third Edition), The MacMlllan
Co., New York.
Stone, Richard (1954), The Measurement of Consumer's Expenditures and Behaj^lor
in the United King/'' "m, 1920-1938 .
Urban, Glen L. , Philip L. Johnson and John R. Hauser (1983), "Testing
Competitive Market Structure: A Methodology Based on P^^of^ct deletion
Probabilities." Sloan School of Management Working Paper #1236-81 (May;.
Vanhonacker, W.P. (1980), "The Hendry Partitioning Methodology: Theory and
Applications," Working Paper 288A, Columbia University, New York (January).
Zahorlk. Anthony J. (1983), "A Model of Aggregate Brand Switching for Inferring
Market Structure," unpublished Ph.D. thesis, Cornell University.
422 u2l^

3 ^DfiD DD4 Mfil DM?


Date Due
MAY 1 t 1994'
Lib-26-67