Are Trade Marks and Patents Complementary or Substitute ...
36
-
Upload
khangminh22 -
Category
Documents
-
view
9 -
download
0
Transcript of Are Trade Marks and Patents Complementary or Substitute ...
Are Trade Marks and Patents Complementary or
Substitute Protections for Innovation?
Patrick Llerenaaand Valentine Millot
a,b ^
aBureau d'Economie théorique et Appliquée, Université de Strasbourg, 61 av-enue de la Forêt Noire 67085 Strasbourg, France
bOECD Directorate for Science, Technology and Industry1
^ corresponding author: email: [email protected]
Abstract
The bene�ts of innovations for �rms strongly depend on their ability to de-
velop complementary appropriability means, including intellectual property
(IP) rights. This paper aims at assessing the interrelated e�ects of two types
of IP rights, namely patents and trade marks, considering them in their core
function as legal protection devices. Based on a supermodularity analysis,
we show that the complementary relationship between trade marks and pat-
ents is not straightforward. Depending on the levels of advertising spillovers
and depreciation rate, trade marks are found to be either complementary or
substitute to patents. Based on a data set encompassing the IP activity of a
sample of French publicly traded �rms, we �nd that patents and trade marks
are complementary in chemical and pharmaceutical sectors, but substitute in
high-tech business sectors (computer products and electrical equipment).
JEL classi�cations: O32, O34, L10
1The opinions expressed in this paper are the sole responsibility of the authors
and do not necessarily re�ect those of the OECD or of the governments of its
member countries.
1

1 Introduction
The bene�ts of product innovations for �rms strongly depend on their ability to de-
velop complementary appropriability means (Teece 1986, Levin et al. 1987, Cohen
et al. 2000). Intellectual property (IP) rights are a major factor of �rms' appro-
priability strategies. Patents, which enable the protection of new technologies, are
the most obvious IP rights related to innovation and the most extensively studied
in economics literature (see Griliches 1991 for a survey). But patents alone do not
guarantee that the �rm will bene�t from innovation, which also requires the devel-
opment of market-based assets to ensure the success of the commercialisation of
the innovation (Rogers 1998, Jennewein 2005, Aaker 2007). Trade marks are one of
these market-based assets. Several papers in recent literature mention that trade
marks can be used in relation to innovative activity (Schmoch 2003, Mendonça et
al. 2004, Greenhalgh and Rogers 2007). The creation of a new trade mark may
enhance consumers' perception of innovative products, and may constitute a basis
for advertising. Moreover, if a product is launched on the market under a certain
brand name, consumers are likely to remain loyal to this pioneer brand even after
competitors enter the market (Davis 2009). Trade marks and patents then consti-
tute two distinct means of appropriating the bene�ts of innovation, whose e�ects
are likely to be interrelated.
While there are a number of studies on the complementarity between technolo-
gical investments and advertising or marketing investments (Hirschey 1982, Snyder
and King 2007, Brekke and Straume 2008, Askenazy et al. 2010), the relationship
between patents and trade marks was rarely investigated. A few papers have
empirically tested the complementarity between patents and trade marks at the
�rm-level considering them as proxies for technological and marketing investments
(von Graevenitz and Sandner 2009, Schwiebacher 2009). However those studies do
not disentangle the value of the IP rights (i.e. the patent or trade mark premium)
and of the value of the protected assets: the observed complementarity between
IP rights mirrors the complementarity of their respective underlying investments.
Somaya and Graham (2006), as far as they are concerned, have observed comple-
mentarity e�ects in the joint use of various IP rights (namely copyrights and trade
marks in software industries), which they explain mainly by economies of scales
in organisational resources deployed for IP management. None of those studies
have investigated the interaction e�ects of IP rights in their core function as legal
protection devices. Yet the e�ect of various protection means are likely to be inter-
related. One might consider that the di�erent types of protections tend to overlap
2

each other so that their marginal e�ect would be lower when several types of IP
rights are used. Nevertheless, patent and trade mark protections are also likely to
reinforce each other. Indeed, the monopoly position that is established by a patent
can favour the establishment of a strong trade mark and, in return, trade marks
can be used to extend the bene�ts of the patents. Statman and Tyebjee (1981),
for example, observe that due to brand loyalty, the expiration of patents for ethical
drugs has only a minor e�ect on their market dominance. In their words, �the
patent period is used to transfer the value of the patent into the trade mark�.
Through a formal approach, our paper addresses the interaction e�ects that
occur between trade marks and patents as legal devices that enable the protection
of a certain brand and a certain technology, respectively, disentangling the value of
the IP rights and the value of their underlying investments. We build a basic model
that encompasses the separate and combined e�ects on the pro�ts of an innovating
�rm of using both IP rights and we analyse the conditions in which they can
be considered substitute or complementary. For this we rely on the concept of
supermodularity, which enables complementarities to be addressed in a discrete-
choice model environment (see Milgrom and Roberts 1990, 1995). This implies
modelling beforehand the impact of protecting an innovation by a trade mark.
Such a theoretical approach does not exist to our knowledge in the literature.
The model consists of a duopoly in which one �rm innovates (leader) and an-
other imitates (follower). Each �rm may choose to incur advertising expenditure,
which enable them to build their goodwill stock, in a dynamic framework. Advert-
ising expenditure are not entirely appropriable: competitors can bene�t from the
e�ects of advertising spillovers. Filing a patent grants the right to prevent compet-
itors from using the patented technology. Although patents do not always make
possible to perfectly exclude other �rms from the market, they tend to decrease
competition. Schematically, we assume that if the �rm �les a patent, it bene�ts
from a monopoly power for a limited period. For trade marks, we stick to the legal
de�nition and consider that trade marks grant the right to prevent other parties
from bene�ting from the reputation that has been built by the �rm by creating
confusion on the origin of the product. Without trade mark, advertising has the
characterisitcs of a public good and bene�ts equally all �rms in the market. Filing
a trade mark enables the �rm to appropriate part of its advertising expenditure.
Besides, if the �rm registers a trade mark, the reputation that is built during the
monopoly period entirely bene�ts the monopoly �rm, so that the competitor does
not bene�t from any spillovers of advertising that is launched during the patent
period. The interaction between patents and trade marks is then characterised by
3
two counterbalancing e�ects: a substitution e�ect, as the trade mark has no impact
on the �rm's pro�t during the patent period, and a complementary e�ect, as the
reputation built in the monopoly period has an impact a posteriori on the trade
mark bene�ts after the patent has expired. The main prediction of our theoretical
model is that the predominance of the complementarity or the substitution e�ect is
not straightforward. Depending on the levels of advertising spillovers and depreci-
ation rate, the two IP rights can be found to be either substitutes, or complements.
Using a �rm-level database that encompasses the trade marking and patenting
activity of a sample of publicly traded French �rms, we test the complementary or
substitute relationship between patents and trade marks across various sectors. We
�nd that in chemical and pharmaceutical industries, where the depreciation rate
of advertising is likely to be low and advertising spillovers high, the two IP rights
tend to be complementary, whereas in high-tech business sectors (manufacture of
computer, electronic and optical products and of electrical equipment), which are
likely to be characterized by high advertising depreciation rates and low advert-
ising spillovers, the two IP rights are found to be substitutes, which con�rms our
theoretical predictions.
The remainder of this paper is organised as follows. Section 2 lays out the
theoretical framework that is used to describe the e�ects of trade mark and patent
protections at the �rm-level, from which we analytically derive some predictions on
their complementary or substitute relationship. Section 3 presents our empirical
strategy with which we test the model predictions and our main empirical �ndings.
Section 4 concludes with the implications of the model.
2 Theoretical Model
2.1 General framework
The two-period game
The starting point of the model is a �rm introducing an innovation, leading to the
creation of a new market for a product. The innovating �rm can choose to register
a patent, a trade mark, or both or neither of them. IP rights related choices are
considered binary: the �rm can register at most one of each type of IP rights. If
the innovating �rm �les a patent, the model has 2 distinct periods: a monopoly
period under the patent protection and then a competition period, characterised
4

by a Cournot-type duopoly between the innovating �rm (leader) and an imitating
�rm (follower). We assume the innovation to be instantaneously imitable, so if no
patent is �led by the innovating �rm, the competition starts immediately in the
�rst period, right after the innovation is introduced.
Advertising and goodwill
Firms incur advertising expenditure, which enable them to build a goodwill, which
positively a�ects the demand for the product. Following Nerlove and Arrow (1962),
we assume that advertising expenditure are cumulative: the goodwill of the �rm
is supplied at each period with advertising expenditure, and depreciates at rate
δ. In a two-period framework, this translates into an equation of evolution of the
goodwill stock Gt from �rst period to second period:
G2−G1=a2−δG1, (1)
where a2 is the amount of second period advertising expenditure and δ is the
depreciation rate of advertising between the two periods. The �rms only start
advertising expenditure when they enter the market, so in the �rst period the
amount of goodwill is given by G1 = a1.
Besides, we assume that advertising expenditure are not totally appropriable
by �rms (Friedman 1983), and are subject to spillovers. The interpretation of
those spillovers is that part of the advertising launched by a �rm corresponds
to advertising for the product in general and not for its own brand, so that the
competitor can also bene�t from it. Advertising expenditure incurred by each �rm
therefore divide into two parts, one share bene�ting all �rms in the market and the
other share bene�ting only the �rm that has incurred the advertising expenditure.
E�ect of trade mark
Regarding the function of trade marks, we stick to the legal de�nition and consider
that trade marks prevent other parties from bene�ting from the �rm's reputation
by creating confusion on the origin of the product. We assume that in the absence of
trade mark, competitors can imitate not only the functional features of the product,
but also its appearance and the signs referring to the brand image (e.g. the brand
name). In that case, no part of advertising expenditure can be appropriated by
5

the �rm. Advertising expenditure and goodwill have therefore the characteristics
of a public good: they bene�t equally all the �rms present in the market. The
total amount of second period advertising expenditure bene�ting the follower is
then a2 + sa2 if the leader �les a trade mark, where a2 and a2 are the amount
of advertising expenditure incurred by the leader and the follower in period 2 and
0 < s < 1 is the level of advertising spillovers bene�ting the follower, and a2 + a2
if the leader does not �le a trade mark.
A key assumption of our model is that if the leader �les both a trade mark
and a patent, all the advertising expenditure incurred during the patent period
correspond to advertising for the brand and bene�t only its own goodwill. Indeed,
during the patent period the reputation of the product coincides with the reputation
of the monopoly brand, so that the brand entirely captures the reputation of the
product. This means that the follower will bene�t from no spillover of advertising
expenditure incurred during the monopoly period. To bene�t from spillovers, since
the respective brand images of the leader and the follower are not confusable, the
follower needs �rst to start to advertise its product so that the customers realise
that the products are identical. The advertising spillovers are then only e�ective
in the second period when the follower enters the market. By contrast, if no
trade mark is �led, the competitor can play on confusion on the appearance of the
product and thus bene�t from advertising spillovers of all periods, including the
monopoly period, as customers will mistakenly attribute the goodwill of the leader
to the product sold by the competitor.
Lastly if no patent is �led, in each period the follower bene�ts from a share s
of the leader's advertising expenditure in case a trade mark is �led, and from the
totality of the leader's advertising expenditure if no trade mark is �led.
In summary, the amount of goodwill bene�ting the leader and the follower in
the second period, depending on the IP strategy adopted by the leader, is the
following:
TM No TM
PAT Leader (1− δ) a1 + a2 + sa2
Follower a2 + sa2 a2 + (1− δ) a1 + a2
No PAT Leader a2 + (1− δ) a1 + s (a2 + (1− δ) a1)
Follower a2 + (1− δ) a1 + s (a2 + (1− δ) a1) a2 + (1− δ) a1 + a2 + (1− δ) a1
where a2 and a2 are the advertising expenditure incurred in the second period
by the leader and by the follower, respectively, a1 and a1 are the levels of advertising
6

expenditure in the �rst period, δ is the depreciation rate of advertising over the
two periods, s is the level of advertising spillovers bene�ting the leader, and s is
the level of advertising spillovers bene�ting the follower if the leader �les a trade
mark.
In the �rst period, the amount of goodwill bene�ting the leader and the follower,
depending on the IP strategy adopted is:
TM No TM
PAT Leader a1
Follower -
No PAT Leader a1 + sa1
Follower a1 + sa1 a1 + a1
Inverse demand function
Following Dixit (1979), we assume that the inverse demand function facing each
�rm in the market is negatively related to the total amount of quantities sold.
Assuming a quadratic utility function of customers, the relationship between price
and quantities is linear (Dixit 1979). We then assume that advertising increases
customers' willingness to pay for the product (Brady 2009), so that the goodwill
stock has a positive impact on the price for a given quantity sold. The e�ect of
goodwill stock is assumed to have decreasing marginal returns. The inverse demand
function facing the leader is given by :
Pt=α−β(Qt+Qt)+τ√Gt, (2)
where Qt and Qt are the quantities sold by the �rm and its competitor in t and
Gt represents the goodwill stock of the �rm, with α, β and τ strictly positive
parameters. The inverse demand function facing the follower is symmetrical.
Supermodularity analysis
Based on this framework, we compare the inter-temporal pro�ts resulting from
the various IP strategies to investigate the complementarity relationship between
the various protection means. More speci�cally, we study the complementarity
7

between trade marks and patents based on the concept of supermodularity (Mil-
grom and Roberts 1990 and 1995). This framework makes it possible to analyse
complementarity in the context of discrete choices (in which pay-o�s are not con-
tinuous); this is appropriate here since we focus on a single invention so that the
�rm registers at most one trade mark and one patent. The supermodularity theory
states that two inputs which can be used by the �rm or not are complements only
if using one input while also using the other input has a higher incremental e�ect
on performance than using one input alone (following the intuitive idea that �the
whole is more than the sum of its parts�).
We test the validity of the following fundamental inequality, where V is the
inter-temporal pro�t gained from innovation and the exponents indicate the pres-
ence or not of a trade mark (TM) or a patent (PAT) :
V TM,PAT+V 0,0>V TM,0+V 0,PAT . (3)
If this inequality is veri�ed, the two types of IP rights are complementary, whereas
if the reverse inequality is veri�ed, they are substitutes.
2.2 Outcome of the various intellectual property strategies
Based on the above framework, we derive the outcome of the various IP strategies
on the pro�t of the innovating �rm.
2.2.1 Case of patent protection
If the leader registers a patent, its inter-temporal pro�t is, from (2):
V=[α−βQ1+τ√G1−c]Q1−a1+r[α−β(Q2+Q2)+τ
√G2−c]Q2−ra2−CPAT−(1TM=1)CTM ,
where c is the cost of production, assumed linear, r is the discount rate between the
two periods (with r > 0, decreasing with the duration of the patent), and CPAT
and CTM correspond to the costs of �ling a trade mark and a patent, respectively.
8

If the innovating �rm �les a trade mark:
Replacing G1 and G2 by their expressions, the intertemporal pro�ts of the leader
can be rewritten as:
V=[α−βQ1+τ√a1−c]Q1−a1+r
[α−β(Q2+Q2)+τ
√(1−δ)a1+a2+sa2−c
]Q2−ra2−CPAT−CTM .
(4)
The inter-temporal pro�t of the follower is:
V=r[α−β(Q2+Q2)+τ√a2+sa2−c]Q2−ra2. (5)
The model is solved through backward induction: the �rms �rst determine their
optimal levels of advertising expenditure and quantities sold in the second period
considering the stock of advertising expenditure of the leader in the �rst period
given, then the leader maximises its inter-temporal pro�t on the choice variables
of the �rst period.
1st step: maximisation of the second period pro�ts on Q2, Q2, a2 and a2 considering
a1 given
The respective programs of the leader and the follower are:
maxQ2,G2
(r[α−β(Q2+Q2)+τ
√(1−δ)a1+a2+sa2−c
]Q2−ra2
)and
maxQ2,G2(r[α−β(Q2+Q2)+τ
√a2+sa2−c]Q2−ra2).
The system of �rst order conditions yields the following Nash-Cournot equilibrium:
Q∗2 =
α−βQ2∗+τ
√(1−δ)a1+a∗
2+sa2∗−c
2β√(1− δ) a1 + a∗2 + sa2
∗ = τ2Q
∗2
Q2∗=
α−βQ∗2+τ
√a2
∗+sa∗2−c
2β√a2
∗ + sa∗2 = τ2Q2
∗
⇔
Q∗2 = Q2
∗= 2(α−c)
6β−τ2
a∗2 = 1−s1−ss
(τ(α−c)6β−τ2
)2
− 1−δ1−ssa1
a2∗ = 1−s
1−ss
(τ(α−c)6β−τ2
)2
+ s (1−δ)(1−ss)a1
.
(6)
The optimal quantities in second period are equal for the two �rms. Considering
s = s, the optimal amount of advertising expenditure in period 2 is higher for the
follower. Indeed, since the follower does not bene�t from advertising expenditure
9
incurred in period 1, it has to catch up with the leader in order to sell at the same
price (in a Cournot competition framework1).
From �rst order condition on Q2, and the previous expression of Q∗2 and a∗2 in
(6), (4) becomes:
V=[α−βQ1+τ√a1−c]Q1−a1+rβ
(2(α−c)
6β−τ2
)2−r 1−s
1−ss
(τ(α−c)
6β−τ2
)2+r 1−δ
1−ssa1−CPAT−CTM .
1In other competition frameworks, we might observe that followers do less advertising ex-penditure than leaders, and compensate by a signi�cantly lower selling price of the same product,which corresponds for example to the situation of �rms selling generic drugs.
10

2nd step: maximisation of the leader inter-temporal pro�t on a1, Q1
The system of �rst order conditions on Q1, a1 yields:
Q∗
1 =α+τ
√a∗1−c
2β√a∗1 = τ
2(1−r 1−δ1−ss )
Q∗1
⇔
Q∗
1 =2(1−r 1−δ
1−ss )(α−c)
4β(1−r 1−δ1−ss )−τ2
a∗1 =
(τ(α−c)
4β(1−r 1−δ1−ss )−τ2
)2 .
The model has an interior solution if 4β(1−r 1−δ1−ss )−τ2>0 (garanteeing that Q∗
2,
Q2∗, Q∗
1, a2∗ and a∗1 are positive) and
(4β(1−r 1−δ
1−ss )−τ2
6β−τ2
)2
> 1−δ1−s (garanteeing that
a∗2 is positive), i.e. if β, the negative impact of quantities on demand is large enough
compared to the impact of advertising τ , and the depreciation rate of advertising
δ is large enough.
The �nal pro�t of the innovating �rm in case it �les both a patent and a trade
mark is then equal to:
V TM,PAT=β
(2(1−r 1−δ
1−ss )(α−c)
4β(1−r 1−δ1−ss )−τ2
)2
−(
τ(α−c)
4β(1−r 1−δ1−ss )−τ2
)2
+rβ(
2(α−c)
6β−τ2
)2−r 1−s
1−ss
(τ(α−c)
6β−τ2
)2
+r 1−δ1−ss
(τ(α−c)
4β(1−r 1−δ1−ss )−τ2
)2
−CPAT−CTM .
This expression simpli�es into:
V TM,PAT=(α−c)2
(1−r 1−δ
1−ss
4β(1−r 1−δ1−ss )−τ2
+rβ(
26β−τ2
)2−r 1−s
1−ss
(τ
6β−τ2
)2
)−CPAT−CTM . (7)
If the innovating �rm does not register a trade mark
In that case the intertemporal pro�t expressions of the leader and the follower
write:
V=[α−βQ1+τ√a1−c]Q1−a1+r
[α−β(Q2+Q2)+τ
√(1−δ)a1+a2+sa2−c
]Q2−ra2−CPAT
V=r[α−β(Q2+Q2)+τ
√a2+(1−δ)a1+a2−c
]Q2−ra2.
11

Maximising V on a2, Q2, and V on a2, Q2 considering a1 given yields the
following Nash-equilibrium:
Q∗2 =
α−βQ2∗+τ
√(1−δ)a1+a∗
2+sa2∗−c
2β√(1− δ) a1 + a∗2 + sa2
∗ = τ2Q
∗2
Q2∗=
α−βQ∗2+τ
√a2
∗+(1−δ)a1+a∗2−c
2β√a2
∗ + (1− δ) a1 + a∗2 = τ2Q2
∗
⇔
Q∗
2 = Q2∗= 2(α−c)
6β−τ2
a2∗ = 0
a∗2 =(
τ(α−c)6β−τ2
)2
− (1− δ) a1
.
In the case where the leader �les no trade mark, the follower relies entirely on
the advertising spillovers and does not itself incur any advertising expenditure in
the second period.
The intertemporal pro�t of the leader then writes
V=[α−βQ1+τ√a1−c]Q1−a1+rβ
(2(α−c)
6β−τ2
)2−r(
τ(α−c)
6β−τ2
)2+r(1−δ)a1−CPAT
Maximising V on a1, Q1 yields:
Q∗
1 =α+τ
√a∗1−c
2β√a∗1 = τ
2(1−r(1−δ))Q∗1
⇔
Q∗
1 = 2(1−r(1−δ))(α−c)4β(1−r(1−δ))−τ2
a∗1 =(
τ(α−c)4β(1−r(1−δ))−τ2
)2 .
An solution exists on the condition that 4β (1− r (1− δ))−τ2 > 0 (garanteeing
that Q∗2, Q2
∗, Q∗
1 and a1 are positive) and(
4β(1−r(1−δ))−τ2
6β−τ2
)2
> (1− δ) (garan-
teeing that a∗2 is positive), i.e. if β, is large enough compared to τ , and δ is large
enough.
The pro�t of the innovating �rm in case it �les a patent but no trade mark is
then equal to:
V 0,PAT=β(
2(1−r(1−δ))(α−c)
4β(1−r(1−δ))−τ2
)2−(
τ(α−c)
4β(1−r(1−δ))−τ2
)2+rβ
(2(α−c)
6β−τ2
)2−r(
τ(α−c)
6β−τ2
)2
+r(1−δ)(
τ(α−c)
4β(1−r(1−δ))−τ2
)2−CPAT
.
This expression simpli�es into:
V 0,PAT=(α−c)2(
(1−r(1−δ))
(4β(1−r(1−δ))−τ2)+rβ
(2
6β−τ2
)2−r(
τ6β−τ2
)2)−CPAT . (8)
12

2.2.2 Case without patent protection
If the innovative �rm does not protect its innovation with a patent, the competition
starts in the �rst period. Inter-temporal pro�ts are given by:
V=[α−β(Q1+Q1)+τ√a1+sa1−c]Q1−a1+r
[α−β(Q2+Q2)+τ
√a2+(1−δ)a1+s(a2+(1−δ)a1)−c
]Q2−ra2
−(1TM=1)CTM
and
V=[α−β(Q1+Q1)+τ√a1+sa1−c]Q1−a1+r
[α−β(Q2+Q2)+τ
√a2+(1−δ)a1+s(a2+(1−δ)a1)−c
]Q2−ra2,
with 0 < s < 1 in case a trade mark is �led and s = 1 in case no trade mark is
�led. Maximising V on a2, Q2, and V on a2, Q2 considering a1 and a1 given yields
the following symmetrical Nash-equilibrium:
Q∗2 =
α−βQ2∗+τ
√a∗2+(1−δ)a1+s(a2
∗+(1−δ)a1)−c
2β√a∗2 + (1− δ) a1 + s (a2
∗ + (1− δ) a1) =τ2Q
∗2
Q2∗=
α−βQ∗2+τ
√a2
∗+(1−δ)a1+s(a∗2+(1−δ)a1)−c
2β√a2
∗ + (1− δ) a1 + s (a∗2 + (1− δ) a1) =τ2Q2
∗
⇔
Q∗2 = Q2
∗= 2(α−c)
6β−τ2
a∗2 = 1−s1−ss
(τ(α−c)6β−τ2
)2
− (1− δ) a1
a2∗ = 1−s
1−ss
(τ(α−c)6β−τ2
)2
− (1− δ) a1
.
The intertemporal pro�ts of the leader and the follower then write:
V=[α−β(Q1+Q1)+τ√a1+sa1−c]Q1−a1+rβ
(2(α−c)
6β−τ2
)2−r 1−s
1−ss
(τ(α−c)
6β−τ2
)2+r(1−δ)a1
and
V=[α−β(Q1+Q1)+τ√a1+sa1−c]Q1−a1+rβ
(2(α−c)
6β−τ2
)−r 1−s
1−ss
(τ(α−c)
6β−τ2
)2+r(1−δ)a1.
13

Maximising V on a1, Q1 and V on a1, Q1 yields:
Q∗1 =
α−βQ1∗+τ
√a∗1+sa1
∗−c
2β√a∗1 + sa1
∗ = τ2(1−r(1−δ))Q
∗1
Q1∗=
α−βQ∗1+τ
√a1
∗+sa∗1−c
2β√a1
∗ + sa∗1 = τ2(1−r(1−δ))Q1
∗
⇔
Q∗1 = Q1
∗= 2(1−r(1−δ))(α−c)
6β(1−r(1−δ))−τ2
a∗1 = 1−s1−ss
(τ(α−c)
6β(1−r(1−δ))−τ2
)2
a1∗ = 1−s
1−ss
(τ(α−c)
6β(1−r(1−δ))−τ2
)2
.
An interior solution exists on the condition that 6β (1− r (1− δ)) − τ2 > 0
(garanteeing thatQ∗2, Q2
∗, Q∗
1, Q1∗, a∗1 and a1
∗ are positive) and(
6β(1−r(1−δ))−τ2
6β−τ2
)2
>
(1− δ) (garanteeing that a∗2 and a2∗ are positive), i.e. if β is large enough compared
to τ , and δ is large enough.
The leader's inter-temporal pro�t in case it �les a trade mark but no patent
equals:
V TM,0=β
(2(1−r(1−δ))(α−c)
6β(1−r(1−δ))−τ2
)2− 1−s
1−ss
(τ(α−c)
6β(1−r(1−δ))−τ2
)2+rβ
(2(α−c)
6β−τ2
)2−r 1−s
1−ss
(τ(α−c)
6β−τ2
)2+
r(1−δ) 1−s1−ss
(τ(α−c)
6β(1−r(1−δ))−τ2
)2−CTM
=(α−c)2
((1−r(1−δ))
(4β(1−r(1−δ))− 1−s
1−ssτ2
(6β(1−r(1−δ))−τ2)2
)+rβ
(2
6β−τ2
)2−r 1−s
1−ss
(τ
6β−τ2
)2
)−CTM . (9)
In case neither a patent nor a trade mark is �led, the expression of the inter-
temporal pro�t is the same as above, with s = 1 and no �ling cost:
V 0,0=(α−c)2((1−r(1−δ))
(4β(1−r(1−δ))−τ2
(6β(1−r(1−δ))−τ2)2
)+rβ
(2
6β−τ2
)2−r(
τ6β−τ2
)2). (10)
2.3 Comparison of outcomes and complementarity analysis
2.3.1 Determination of the optimal IP right strategy
Based on the previous results, we seek to determine the optimal IP right strategies
for innovating �rms, by comparing the intertemporal pro�ts resulting from the
di�erent IP right combinations.
14

From (7) and (8), we get:
V TM,PAT−V 0,PAT = (α−c)2
(1−r 1−δ
1−ss
4β(1−r 1−δ1−ss )−τ2
−r 1−s1−ss
(τ
6β−τ2
)2−(
(1−r(1−δ))
(4β(1−r(1−δ))−τ2)−r(
τ6β−τ2
)2))
−CTM
= (α−c)2
(τ2r(1−δ)( ss
1−ss )(4β(1−r 1−δ
1−ss )−τ2)(4β(1−r(1−δ))−τ2)+rs
(τ
6β−τ2
)2 1−s1−ss
)−CTM
= K1−CTM , (11)
with K1 > 0.
From (9) and (10):
V TM,0−V 0,0=(α−c)2
((1−r(1−δ))(4β(1−r(1−δ))− 1−s
1−ssτ2)
(6β(1−r(1−δ))−τ2)2−r 1−s
1−ss
(τ
6β−τ2
)2−
(1−r(1−δ))(4β(1−r(1−δ))−τ2)(6β(1−r(1−δ))−τ2)2
+r(
τ6β−τ2
)2
)−CTM
=(α−c)2
((1−r(1−δ))
(τ2s 1−s
1−ss
(6β(1−r(1−δ))−τ2)2
)+rs
(τ
6β−τ2
)2 1−s1−ss
)−CTM
=K2−CTM , (12)
with K2 > 0. Considering su�ciently low �ling costs, it is always bene�cial for�rms to �le a trade mark.
Besides, from (7) and (9), we get
V TM,PAT−V TM,0 = (α−c)2
(1−r 1−δ
1−ss
4β(1−r 1−δ1−ss )−τ2
−(1−r(1−δ))
(4β(1−r(1−δ))− 1−s
1−ssτ2
(6β(1−r(1−δ))−τ2)2
))−CPAT
= (α−c)2(1−r 1−δ1−ss )
(6β(1−r(1−δ))−τ2)2−(4β(1−r(1−δ))− 1−s
1−ssτ2)(4β(1−r(1−δ))−τ2(1+ ssr(1−δ)
1−ss−r(1−δ) ))(4β(1−r 1−δ
1−ss )−τ2)(6β(1−r(1−δ))−τ2)2−CPAT
= K3−CPAT ,
with K3 > 0.
From (8) and (10):
V 0,PAT−V 0,0 = (α−c)2
((1−r(1−δ))
((6β(1−r(1−δ))−τ2)
2−(4β(1−r(1−δ))−τ2)
2
(4β(1−r(1−δ))−τ2)(6β(1−r(1−δ))−τ2)2
))−CPAT
= K4−CPAT ,
with K4 > 0.
As well as for trade marks, the bene�t of �ling a patent is positive if the �ling
costs are su�ciently low. This may not always be the case as the registration of a
patent - more than a trade mark - is a relatively complex procedure and requires
some human and �nancial resources. Therefore the costs of �ling a patent may
outweigh the bene�ts gained from the patent protection.
15
Considering su�ciently low levels of �ling costs, we have:
V TM,PAT>{V TM,0,V 0,PAT}>V 0,0.
The optimal IP right strategy for the innovating �rm is thus always to register both
a patent and a trade mark when considering negligible �ling costs. Besides, the
trade mark bene�t di�ers depending on whether a patent is also �led or not. We
then seek to analyse this di�erence in order to conclude about the complementary
or susbstitue relationship between the two IP rights.
2.3.2 Complementarity analysis
In the following, we investigate in which conditions the supermodularity in-
equality (3) is veri�ed, i.e. where the di�erence(V TM,PAT − V 0,PAT
)−(V TM,0 − V 0,0
)is positive. This amounts to comparing the bene�t of �ling a trade mark in case
of patent protection and in case of no patent. From (11) and (12) we deduce that:
V TM,PAT−V 0,PAT−(V TM,0−V 0,0)=(α−c)2
(τ2r(1−δ) ss
1−ss
(4β(1−r 1−δ1−ss )−τ2)(4β(1−r(1−δ))−τ2)
−(1−r(1−δ))τ2s 1−s
1−ss
(6β(1−r(1−δ))−τ2)2
).
We have
∂[V TM,PAT −V 0,PAT −(V TM,0−V 0,0)]∂s =(α−c)2
((1−r(1−δ))τ2(1−s)s
(6β(1−r(1−δ))−τ2)2(1−ss)2+
(1−δ)rτ2s
(4β(1−r 1−δ1−ss )−τ2)
2(1−ss)2
).
This expression is always positive if 1 − r (1− δ) > 0, which is always true
under the conditions of existence of an equilibrium. The level of complementarity
between trade marks and patents is thus increasing with the level of advertising
spillovers.
For s approaching 0, we have
(V TM,PAT−V 0,PAT )−(V TM,0−V 0,0)→(α−c)2
(−(1−r(1−δ))
τ2s 1−s1−ss
(6β(1−r(1−δ))−τ2)2
),
which is always negative under the conditions of existence of an equilibrium, so
trade marks and patents are substitute. For s approaching 1, we have
(V TM,PAT−V 0,PAT )−(V TM,0−V 0,0)→(α−c)2
(τ2r(1−δ) s
1−s
(4β(1−r 1−δ1−s )−τ2)(4β(1−r(1−δ))−τ2)
),
16

which is positive under the conditions of existence of an equilibrium. So for high
values of s, trade marks and patents are complementary. Indeed, in the �rst period,
trade marks provide full protection of the goodwill in case of patent protection,
whereas in case of no patent protection, trade marks still allow a non null level of
advertising spillovers s. The higher those advertising spillovers are, the more it is
bene�cial to reinforce the trade mark with a patent.
Besides, we have
∂[V TM,PAT −V 0,PAT −(V TM,0−V 0,0)]∂δ =(α−c)2rτ2
(1
(4β(1−r(1−δ))−τ2)2+s 1−s
1−ss6β(1−r(1−δ))+τ2
(6β(1−r(1−δ))−τ2)3− 1
1−ss1
(4β(1−r 1−δ1−ss )−τ2)
2
).
This expression is negative for su�ciently high values of s, so above a certain
threshold of advertising spillovers, the complementarity tends to decrease with the
depreciation rate of advertising. Indeed with high depreciation rates, only a small
proportion of the goodwill accumulated in the monopoly period is transferred to
the second period, which tends to decrease the complementarity e�ect.
For δ approaching its minimum value, for which(4β (1− r (1− δ))− τ2
)= 0,
we have
V TM,PAT−V 0,PAT−(V TM,0−V 0,0)→+∞
and for δ approaching 1, we have
V TM,PAT−V 0,PAT−(V TM,0−V 0,0)→−(α−c)2τ2s( 1−s
1−ss )(6β−τ2)2
<0
So for high levels of depreciation rate of advertising, patents and trade marks
tend to be substitute.
Without loss of generality, we can consider the parameters of the inverse demand
function β and τ given, as well as s, the amount of spillovers bene�ting the leader.
In the following, we consider β = τ = 1, and s = 12 . We besides attribute a de�nite
value to the discount rate between the two periods r. A reasonable value for r is
0.62. Lastly, we attribute a value of 1 to the common scaling parameter (α− c)2.
We can then represent the level of trade mark bene�ts in case of patent and of no
2Assuming an annual interest rate of r0, and a patent period of T years, the discount rate
between the two periods in the model can be approximated by r ≡∑T
t=0
(1
1+r0
)t∑∞
t=T+1
(1
1+r0
)t = 1 −(1
1+r0
)T. Taking r0 = 0.5 , and considering that the patent period lasts twenty years, we obtain
a value of r ≃ 0.6.
17

Figure 1: Bene�ts of trade mark �ling
β=τ=1, r=0.6, s=12 , (α−c)2=1. Values of s and δ verifying
4β(1−r 1−δ
1−ss
)−τ2
6β−τ2
2
> 1−δ1−s
patent according to s and δ, considering negligible costs of IP rights (Figure 1)3.
The intertemporal pro�ts resulting from each IP rights strategy are represented in
Annex 1.
Under the assumptions of the model, depending on the of level of advertising
spillovers s and on the level of depreciation of advertising expenditure, patents
and trade marks can be found to be either complementary or substitute. The
interpretation of the results is the following. The interaction between patents and
trade marks is characterised by two counterbalancing e�ects. There is on the
one hand a substitution e�ect. The trade mark bene�ts the �rm only when it
faces competition. As we assume that patent leads to a non-competition period,
trade marks are comparatively less advantageous for the pioneer �rm when there
is also a patent �led. In the extreme, if the protection o�ered by patents was
3The conditions of the model require that
(4β(1−r 1−δ
1−ss
)−τ2
6β−τ2
)2
> 1−δ1−s
, so that with β = τ = 1
and s = 12, the model does not admit an equilibrium for δ < 0.85.
18

in�nite in time, the bene�t of trade mark would be null as the �rm would not
need to protect its brand from confusion with other �rms. On the other hand, we
�nd a complementary e�ect: the trade mark makes it possible to capture entirely
the goodwill built during the monopoly period. The trade mark bene�ts in the
second period will be all the more important if the �rm has bene�ted from a
monopoly period, so that trade marks in the second period are comparatively
more advantageous if the �rm had a patent �led in the �rst period.
Depending on the levels of advertising spillovers and advertising depreciation
rate, either the �rst e�ect or the second e�ect can be predominant. For su�ciently
high values of advertising spillovers and low values of advertising depreciation rate,
patents and trade marks are found to be complementary. This is likely to be the
case for example in pharmaceutical industries. Indeed in those sectors the depre-
ciation of advertising tends to be low (as the products tend to have relatively long
life cycles and remain stable over time). In addition in those sectors the technology
is well codi�ed, which implies that innovations can be perfectly duplicated, so that
advertising performed by �rms is very likely to bene�t the product in general. The
level of advertising spillovers in those sectors is then relatively high. In contrast,
in other high-tech sectors such as computer and electronic products, the depreci-
ation rate of advertising tends to be high (as the product life cycle is short) and
advertising spillovers tend to be low (the technology being not well codi�ed, the
characteristics of the product are hardly identi�ed by the customer, so that advert-
ising is above all advertising for the brand). In those sectors the substitution e�ect
tends to outweigh the complementarity e�ect. This does not necessarily imply that
�rms use only one type of IP right, as in the case of negligible registration costs
the optimal strategy is always to �le both a patent and a trade mark. However, in
those cases the incremental bene�t of using both types of IP rights instead of one
is lower.
3 Empirical investigation
3.1 Tested hypotheses and methodology
This section presents some preliminary empirical evidence aiming at illustrating
the theoretical model presented above. The general purpose is to test the comple-
mentarity between the use of trade marks and the use of patents by �rms as tools
to protect their assets. The theoretical model considers the link between patents
and trade marks at the product level. However, this framework is not directly
transferable to empirical analysis, since IP right data are generally not available at
19

the product level. Therefore, in the following, we shift the framework of analysis
from product-level to �rm-level. Although those frameworks are not equivalent (as
�rms are likely to sell several products on the market), we may assume that the IP
strategies observed at the �rm-level are representative of the strategy adopted by
the �rm at each product launch (a number of companies registering systematically
new trade marks, or patents, or both each time they introduce a new product on
the market). Our general empirical strategy then consists in estimating and com-
paring the �rms' performance resulting from various IP right strategies. We use
the market value of the �rm as a measure of �rm performance, which enables an
intertemporal analysis of the e�ects of IP rights: assuming e�cient stock markets,
the �rm's market value is equal to the sum of its discounted future pro�ts, which
is the target variable in our previous theoretical model. Another measure of per-
formance, such as the present pro�t margin in time t, would be inadequate as the
context of the model is dynamic, with inter-temporal e�ects of IP strategy choices.
We follow the market value approach, which combines accounting data with the
valuation on the stock market. This approach has been used in particular to assess
returns to innovation (Griliches 1981, Hall et al. 2000, Greenhalgh and Rogers
2007, Sandner 2009). The general idea of those models is that investors estimate a
�rm's value according to the returns that they expect from its assets (either tangible
or intangible). The purpose of those models is to disentangle the contribution of
tangible and intangible assets, intangible assets being proxied by measures of R&D,
the number of patents or the number of trade marks. In our model, by contrast, the
intangible assets of the �rm are considered as given, and IP rights are considered in
their function to appropriate the bene�ts of those assets. We thus seek to analyse
how the IP strategy a�ects the pro�t of the �rm, considering everything else equal,
notably their levels of R&D and innovative activity, re�ected in intangible assets.
Thus we include both tangible and intangible assets in explanatory variables. We
consider
V = qA, (13)
where A is the amount of �rm's total assets (tangible and intangible). Taking
natural logarithms on both sides of (13), the previous equation can be rewritten
as ln(V ) = ln (q) + ln (A). We assume that the coe�cient q depends on the IP
strategy of the �rm: qTM,PAT , qTM,0, q0,PAT , q0,0.
Following the supermodularity approach (see Mohnen and Röller 2003 and
Guidetti et al. 2009 for deeper methodological explanations on empirical tests
of supermodularity), our estimation strategy is to regress the log of the market
20
value of the �rm on the log of its assets, including the four dummies associated
to the potential IP right strategies in the set of explanatory variables: use of no
patent and no trade mark (10,0), of trade marks but no patents (1TM,0), of patents
but no trade marks (10,PAT ), and of both patents and trade marks (1TM,PAT ). All
dummies are included in the regression, which is thus �without constant�. This is
necessary in order to get all the estimates of coe�cients and variance/covariance.
The �rst model speci�cation is:
ln(V )=β1(10,0)+β2(1TM,0)+β3(10,PAT )+β4(1TM,PAT )+γ ln(A) (14)
Going back to the model equation ln(V ) = ln (q)+ln (A), the coe�cients β cor-
respond to the evaluation of ln(q) corresponding to the various IP right strategies,
and γ allows for non constant returns to scale. From the previous theoretical sec-
tion, we derive that complementarity holds if β1 + β4 > β2 + β3. To investigate
this, we apply a one-sided t-test with null hypothesis H0 : β1 + β4 − β2 − β3 > 0.
The previous speci�cation considers the IP strategies as invariant for the �rms,
which are assumed to always rely on the same combination of IP rights to protect
their innovations. In order to relate more precisely the returns of the �rms' assets
and their IP strategy, we introduce a second speci�cation, focusing on the di�erence
in �rm's market value between two points in time (t = 1 and t = 2). According to
the previous framework, we have:
V2
V1= qA2
A1, (15)
where Vt is the market value in t , and At is the amount of �rm's total assets in
t. Here the coe�cient q varies depending on the IP rights acquired by the �rm
between the two periods t = 1 and t = 2. This means that the growth in market
value depends on the IP strategy speci�cally associated to the assets acquired
between the two periods. Taking the logarithms on both sides of (15), the second
model speci�cation corresponds to:
ln(V2)=ln(V1)+β1(10,0)+β2(1TM,0)+β3(10,PAT )+β4(1TM,PAT )+γ ln(A2)−γ ln(A1), (16)
where the dummy variables correspond to the use of the corresponding IP right
between t = 1 and t = 2.
The IP right strategy is likely to be dependent on the life cycle of the �rm:
�rms tend to �le more IP right applications in their early life time (protecting the
name of the �rm or their core technology). Thus, in the two previous speci�cations
21

we control for the age of the �rm. We besides add controls for sector.
The various hypotheses tested stemming from the theoretical model are :H1a : β2 > β1
H1b : β3 > β1
H1c : β4 > β1
: inter-temporal pro�ts are higher if the �rm uses IP right
protection. H1d : β4 > β3
H1e : β4 > β2
: inter-temporal pro�ts are higher if the �rm chooses to use
both a patent and a trade mark than only one type of IP right.
Those hypotheses are always veri�ed in the framework of the theoretical model
if IP rights registration costs are negligible.
H0 : β1 + β4 > β2 + β3: supermodularity hypothesis.
The above inequality does not depend on IP rights registration costs. According
to the theoretical model prediction, the result should depend on market character-
istics, and is thus likely to vary across sectors.
3.2 Data sources and descriptive statistics
Dataset building
The various tests described in the previous paragraph are performed on a �rm-
level database encompassing the trade marking and patenting activity of a sample
of French �rms listed on the stock exchange, linking several data sources. General
information on �rms, as well as accounting and �nancial variables were retrieved
from the database ORBIS© (April 2011 version), edited by the Bureau Van Dijk,
containing information on more than one million French business entities. Since
market value is used as the dependent variable in the regression, the sample is
restricted to publicly traded �rms. The year considered for the estimation is 2007,
before the worsening of the late 2000's �nancial crisis, in order to avoid the exo-
genous variation of stock market variables.4 A second reason for avoiding the crisis
period is that the model focuses on �rms' IP activity, and the latter is generally
hampered during recession periods. Restricted to French �rms for which �nancial
and accounting data in 2007 are available, the sample contains 785 observations5.
4NB: the market value is considered at the end of 2007, a time at which the sub-prime crisishad already begun, yet with much lower impact on market prices
5To be consistent with the theoretical model, the sample should ideally be restricted to in-novative �rms. Otherwise we cannot know if �rms have no IP right activity because they donot innovate (which would have a negative impact on market value compared to other �rms) orbecause they innovate but do not protect their innovations with IP rights. One possibility tohave information on innovating behaviour would be to match the dataset with innovation surveydata. However, because of the small size of innovation survey samples, this would reduce oursample size drastically (from 785 to 170 osbservations), which would not allow us to achieve sig-
22

The �rm data were matched with data about trade marks and patents applied
for at the national and European level over the period 1998-2007. National and
Community trade mark applications were provided by the INPI and by the OHIM,
respectively, and data on national and EPO patents were retrieved from the EPO
PATSTAT database.
The matching methodology used consists in linking the company name in the
�rm database to the applicant name listed in the various IP databases, using an
automatic computer-based procedure. This procedure �rst harmonises the names
in both �rm and IP datasets, to take into account possible variations in denomin-
ations that �rms may use, based on the algorithm developed by Magerman, Van
Looy, and Xiaoyan (2006). The matching is then done according to exact iden-
tity of the harmonized names. This matching methodology is thus quite careful,
favouring the occurrence of false-negatives over false-positives in the results.6
Variables used and descriptive statistics
The dependent variable used in the regressions is the natural logarithm of the
�rm's market value, V . The market value of a �rm is de�ned as the sum of its
market capitalisation and the market value of its debt. Following Blundell et al.
(1999), Hall and Oriani (2006), and Sandner (2009), we calculated the �rm's market
value as the sum of the nominal value of market capitalisation and outstanding
debt. Finally, outstanding debt was calculated as the sum of long term debt and
current liabilities as reported in ORBIS©.
In the set of explanatory variables we use the �total assets� as directly contained
in ORBIS© database, de�ned as the sum of tangible and intangible assets. Al-
though IP rights are sometimes quali�ed as �intangible assets�, patents and trade
marks applied for by the �rm are not accounted in the intangible assets. The
latter are recorded on balance sheets at cost, so IP rights are only included in
intangible assets if they have been acquired from an external source (see Interna-
tional Accounting Standards Board 2007). For IP rights acquired internally, what
is recorded is their corresponding investments (R&D or brand equity investments),
ni�cant results di�erentiated by sectors. Nevertheless the large majority of publicly traded �rmsare innovating: based on our sample of listed French �rms matched with the French results ofthe Community Innovation Survey 2008, containing in total 170 observations, 113 (66%) haveinnovated in product or in service during the years 2006-2008, which is a much larger proportionthan in the complete CIS sample (26%).
6Recently, a number of other initiatives have aimed at linking �rm-level data and IP data,notably the NBER patent data project, linking USPTO patents to the Standard and Poor'sCompustat database on US �rms (Hall et al. 2001) and the Oxford Firm-Level Intellectual Prop-erty (OFLIP) database, linking UK �rm data from the FAME database and UKIPO patents andtrade marks data (Helmers, Rogers and Schautschick 2011). For an overview of other initiatives,see Helmers, Rogers and Schautschick (2011).
23

and not the IP right itself whose �nancial value is not possible to assess. This
avoids the presence of an endogeneity issue in the joint inclusion of IP rights dum-
mies and intangible assets in the set of explanatory variables in the regressions.
The variable �intangible assets� in ORBIS© contains R&D, advertising and or-
ganisational expenses (see Giannetti 2003). Thus what the model captures is the
respective e�ects of intangible investments and of the use of IP rights to protect
those investments, which is in line with the theoretical framework used in Section
1.
The dummy variables corresponding to the IP strategy relate to the fact that
the �rm applied for at least one patent and/or at least one trade mark during
the period considered. In the �rst speci�cation, the period over which the IP
right behaviour is tracked is 1998-2007, which we assume describes the usual IP
right behaviour of the �rm. In the second speci�cation, the IP right behaviour is
considered only in the years 2006-2007, since the model focuses on the di�erence
in market value before and after this period. Table 1 gives descriptive statistics for
the �nal dataset.
The di�erent IP strategies are not equally represented in the sample. A large
majority of �rms in the sample use IP rights: 78% applied for at least one patent
or one trade mark during 1998-2007, and 57% used IP rights in the only two years
2006-2007 (the proportion might be even higher since the matching methodology
tends to favour false negatives). Those high shares can be explained by the fact
that the sample contains only publicly listed companies, which tend to be more
active in IP than the whole population of �rms. The use of trade marks is much
more frequent than the use of patents (76% of �rms used trade marks, 33% used
patents in 1998-2007). The proportion of �rms using both types of IP rights in
1998-2007 is 21%, so the complementary states correspond to nearly half of the
sample (43%).
3.3 Results
In this section, we estimate the market value equations based on the speci�ca-
tions (14) and (16) presented above.
24
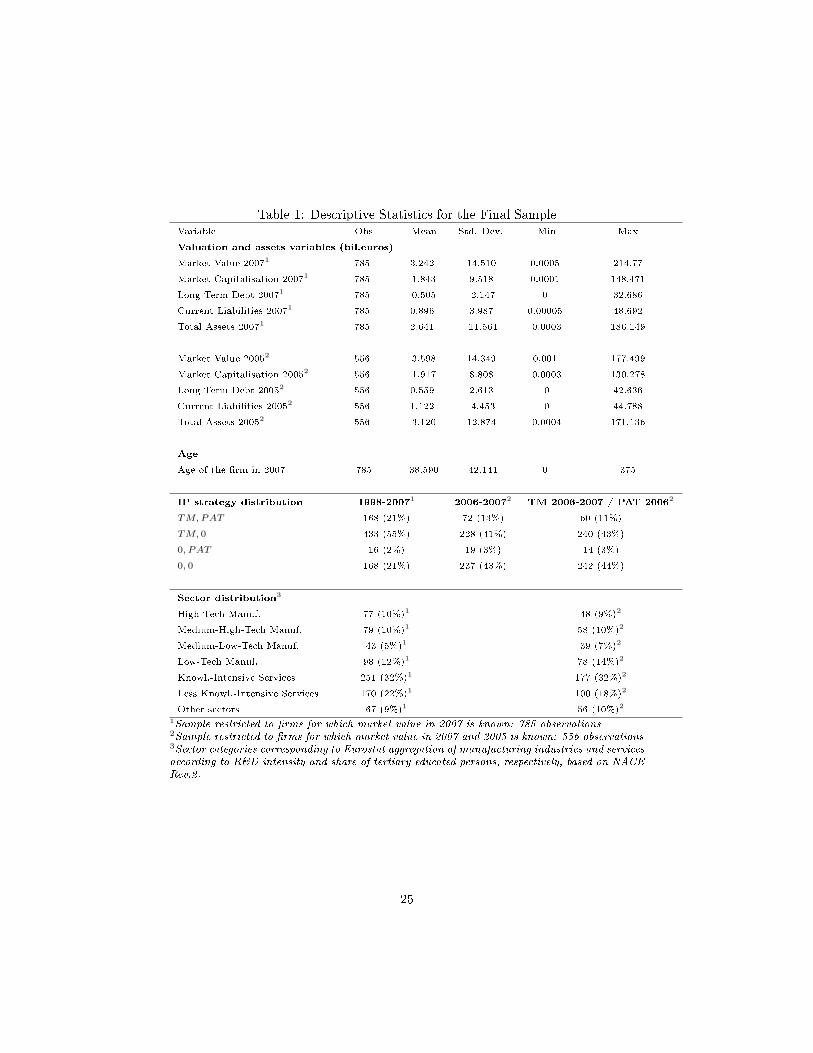
Table 1: Descriptive Statistics for the Final SampleVariable Obs Mean Std. Dev. Min Max
Valuation and assets variables (bil.euros)
Market Value 20071 785 3.242 14.510 0.0005 214.77
Market Capitalisation 20071 785 1.843 9.518 0.0001 148.471
Long Term Debt 20071 785 0.505 2.147 0 32.686
Current Liabilities 20071 785 0.896 3.987 0.00005 48.692
Total Assets 20071 785 2.641 11.561 0.0003 186.149
Market Value 20052 556 3.598 14.349 0.001 177.499
Market Capitalisation 20052 556 1.917 8.808 0.0003 130.278
Long Term Debt 20052 556 0.559 2.613 0 42.636
Current Liabilities 20052 556 1.122 4.453 0 44.788
Total Assets 20052 556 3.120 12.874 0.0004 171.136
Age
Age of the �rm in 2007 785 38.590 42.141 0 375
IP strategy distribution 1998-20071 2006-20072 TM 2006-2007 / PAT 20062
TM,PAT 168 (21%) 72 (13%) 60 (11%)
TM, 0 433 (55%) 228 (41%) 240 (43%)
0, PAT 16 (2%) 19 (3%) 14 (3%)
0, 0 168 (21%) 237 (43%) 242 (44%)
Sector distribution3
High-Tech Manuf. 77 (10%)1 48 (9%)2
Medium-High-Tech Manuf. 79 (10%)1 58 (10%)2
Medium-Low-Tech Manuf. 43 (5%)1 39 (7%)2
Low-Tech Manuf. 98 (12%)1 78 (14%)2
Knowl.-Intensive Services 251 (32%)1 177 (32%)2
Less Knowl.-Intensive Services 170 (22%)1 100 (18%)2
Other sectors 67 (9%)1 56 (10%)2
1Sample restricted to �rms for which market value in 2007 is known: 785 observations2Sample restricted to �rms for which market value in 2007 and 2005 is known: 556 observations3Sector categories corresponding to Eurostat aggregation of manufacturing industries and servicesaccording to R&D intensity and share of tertiary educated persons, respectively, based on NACERev.2.
25

Speci�cation (14) is estimated by :
lnVt=β1(10.0)+β2(1TM,0)+β3(10,PAT )+β4(1TM,PAT )+γ ln(At)+σage+i.sector,
in t = 2007 where V is the �rm's market value, A is the amount of the �rm's total
assets, and i.sector corresponds to the dummy variables of the sectors (NACE Rev.
2, 2-digit level). The dummy variables of trade mark and/or patent use indicate
whether the �rm applied for at least one patent or one trade mark at the national
or European level between 1998 and 2007 (based on the application date). We
also estimated for comparison the same model with constant, omitting the dummy
variable corresponding to no IP right application.
Speci�cation (16) is estimated by:
ln(Vt2)=ln(Vt1 )+β1(10.0)+β2(1TM,0)+β3(10,PAT )+β4(1TM,PAT )+γ1 ln(At2)−γ2 ln(At1)
+σage+i.sector,
in t2 = 2007 and t1 = 2005, and where the dummy variables of trade mark and/or
patent use indicate if the �rm applied for at least one patent or one trade mark at
the national or European level between 2006 and 2007 (application date).
Table 2 presents the results of the regressions on the complete sample. In both
speci�cations coe�cients are all signi�cant at the 1% level, except for age, which
is only signi�cant (at 5% level) in the �rst speci�cation. The global explanatory
power of the model is very high, above 99% in both speci�cations. This is explained
both by the use of without constant speci�cation and by the very high explanatory
power of the variable total asset in market value regressions (as can be seen in
column 1 of the results).
The results regarding the �rst speci�cation (presented in column 4) tend to be in
line with the theoretical model predictions. The order of the coe�cients for IP right
variables are consistent with the expectations: the one-sided t-tests give signi�cant
positive results, except for 10,PAT>10,0 and 1TM,PAT>10,PAT , for which the results
are not signi�cant. This is also supported by the results of the regression without
constant (column 3), where all IP dummies have positive coe�cients, signi�cant
at 1% level except 10,PAT . In the second speci�cation (column 6), the tests also
tend to give positive results, although they are generally not signi�cant (signi�cant
at 10% level only for 1TM,PAT > 10,0). We also estimated the second speci�cation
considering only patent applications in 2006, in order to take into account a possible
delay between patent and trademark applications. The results are stable whether
26

Table 2: Market value regression and one-sided t-tests on the total sample(1) (2) (3) (4) (5) (6)
Dependent variable : ln (Market Value 2007)
ln (Total Assets 2007)0.915**
(0.010)
0.914**
(0.010)
0.914**
(0.010)
0.937**
(0.014)
0.879**
(0.031)
10,0 (98-07)-5.793**
(0.162)
-6.111**
(0.196)
10,PAT (98-07)0.061
(0.449)
0.079
(0.150)
-5.715**
(0.220)
-6.192**
(0.199)
1TM,0 (98-07)0.673**
(0.206)
0.184**
(0.045)
-5.609**
(0.160)
-5.898**
(0.188)
1TM,PAT (98-07)1.488**
(0.263)
0.254**
(0.051)
-5.540**
(0.164)
-5.838**
(0.195)
age-0.001*
(0.000)
-0.001*
(0.000)
-0.001
(0.001)
0.000
(0.000)
ln(MV2005)0.735**
(0.042)
ln (Total Assets 2005)-0.631**
(0.047)
10,0 (06-07)-1.409**
(0.293)
10,PAT (06-07)-1.407**
(0.296)
1TM,0 (06-07)-1.380**
(0.289)
1TM,PAT (06-07)-1.334**
(0.284)
constant-5.712**
(0.138)
4.646**
(0.933)
-5.793**
(0.162)
N 785 785 785 785 556 556
R-sq 0.960 0.220 0.962 0.994 0.995 0.998
1TM,0 > 10,0 4.10** 0.92
10,PAT>10,0 0.53 0.03
1TM,PAT > 10,0 4.96** 1.64+
1TM,PAT > 10,PAT 1.22 1.03
1TM,PAT > 1TM,0 1.64+ 1.04
Complementarity test: one-sided Student test (t statistics): H0 : 1TM,PAT − 10,PAT > 1TM,0 − 10,0
-0.06 0.58
- - -
OLS robust estimates. Standard errors in parentheses** p<0.01, * p<0.05, + p<0.1
All regressions also contain controls for sector at the Nace Rev.2 2-digit level
27

considering patent applications in the two years or only in 2006 (see results in
Annex 2).
To investigate if the complementarity hypothesis holds, we apply a one-sided
t-test on the obtained coe�cients, with null hypothesis: H0 : β1+β4−β2−β3 > 0.
The one-sided t-test rejects the null hypothesis at 5% level if the value of the
t statistic is lower than −1.645 (then substitutability (non strict) holds). If the
value of the t statistic is higher than 1.645, then strict complementarity holds at
5% level (the previous threshold is 1.282 at 10% level, and 2.326 at 1% level).
The complementarity test does not give any signi�cant result on the total sample.
This could be expected since the theoretical model indicates that the results are
likely to vary across sectors. To investigate this hypothesis, we estimated the
previous model on sub-samples corresponding to two di�erent sectors, both highly
innovative: pharmaceutical and chemical products on the one hand and high-tech
business sectors (manufacture of computer, electronic and optical products and of
electrical equipment) on the other hand. The results are presented in Table 37.
We �nd that the results of the supermodularity test vary across sectors. In
pharmaceutical and chemical sectors, the test tends to be in favour of the com-
plementarity hypothesis (at 1% level in the second speci�cation). We �nd that in
those sectors the bene�t of �ling a trade mark alone is not signi�cant, whereas
the e�ect of �ling a trade mark and a patent is signi�cantly higher than the e�ect
of �ling a patent alone. Similarly, �ling a patent alone tends to have a negative
impact on market value, whereas �ling a patent jointly with a trade mark tends
to have a higher impact on performance than �ling a trade mark alone. In phar-
maceutical and chemical sectors indeed, innovation often consists in launching new
drugs or chemical products based on new molecules, and competitors are generally
able to launch perfect substitutes on the market. In this situation, advertising is
for a large part likely to be advertising for the product in general, so that it is not
easily appropriable by the �rm even if the latter registers a trade mark. Besides,
drugs and chemical products tend to have relatively long life cycles, so that the
advertising depreciation rate over time is likely to be relatively low. In those types
of sectors, the theoretical model predicts that the complementarity e�ect tends to
outweigh the substitution e�ect so that it is in the �rms' interest to use patents
jointly with trade marks in order to build goodwill during the monopoly period
7Pharma and Chemicals correspond to �rms in NACE Rev. 2 sectors 20 (manuf. of chemicalsand chemical products), 21 (manuf. of basic pharmaceutical products and pharmaceutical pre-parations), and 86 (human health activities). Computer and electrical equipment correspond to�rms in NACE Rev. 2 sectors 26 (manuf. of computer, electronic and optical products) and 27(manuf. of electrical equipment).
28
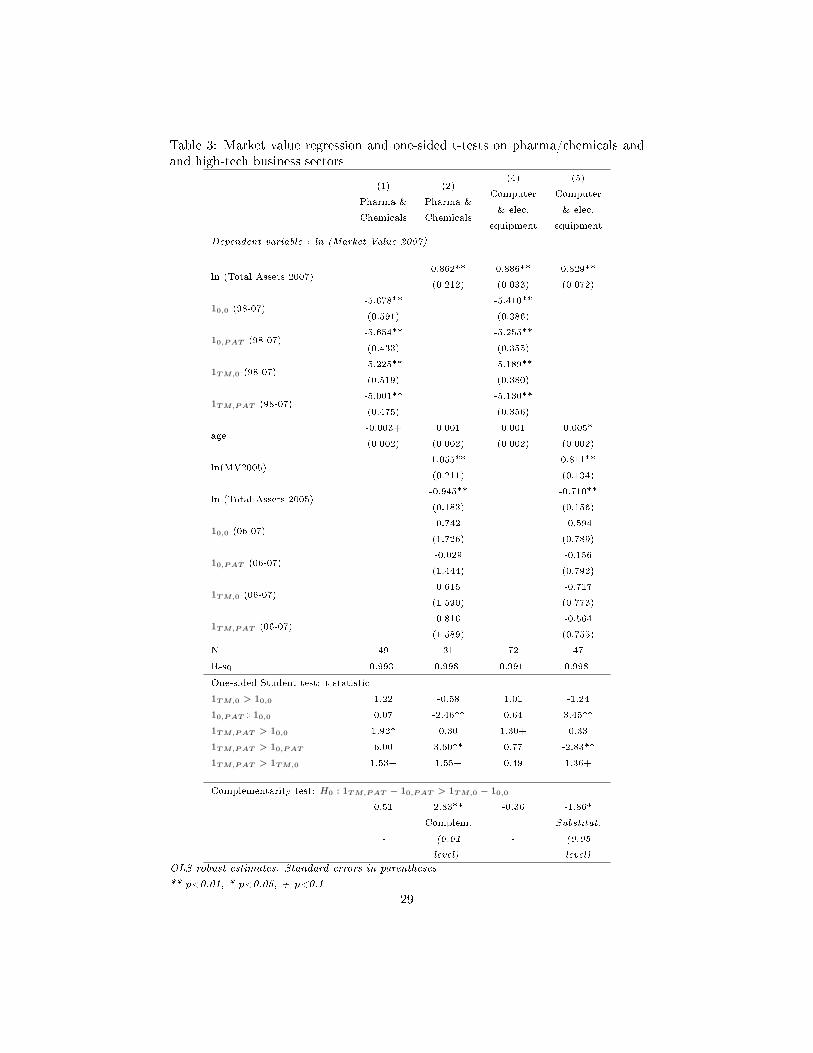
Table 3: Market value regression and one-sided t-tests on pharma/chemicals andand high-tech business sectors
(1)
Pharma &
Chemicals
(2)
Pharma &
Chemicals
(4)
Computer
& elec.
equipment
(5)
Computer
& elec.
equipment
Dependent variable : ln (Market Value 2007)
ln (Total Assets 2007)0.862**
(0.212)
0.886**
(0.033)
0.829**
(0.072)
10,0 (98-07)-5.678**
(0.591)
-5.410**
(0.386)
10,PAT (98-07)-5.654**
(0.433)
-5.255**
(0.355)
1TM,0 (98-07)-5.225**
(0.519)
-5.189**
(0.380)
1TM,PAT (98-07)-5.001**
(0.475)
-5.130**
(0.356)
age-0.003+
(0.002)
0.001
(0.002)
0.001
(0.002)
0.005*
(0.002)
ln(MV2005)1.055**
(0.211)
0.811**
(0.134)
ln (Total Assets 2005)-0.945**
(0.183)
-0.710**
(0.156)
10,0 (06-07)0.742
(1.726)
-0.594
(0.789)
10,PAT (06-07)-0.029
(1.444)
-0.156
(0.792)
1TM,0 (06-07)0.615
(1.590)
-0.717
(0.773)
1TM,PAT (06-07)0.816
(1.589)
-0.564
(0.755)
N 49 31 72 47
R-sq 0.993 0.998 0.991 0.998
One-sided Student test: t statistic
1TM,0 > 10,0 1.22 -0.58 1.01 -1.24
10,PAT>10,0 0.07 -2.46** 0.64 3.45**
1TM,PAT > 10,0 1.92* 0.30 1.30+ 0.33
1TM,PAT > 10,PAT 6.00 3.60** 0.77 -2.83**
1TM,PAT > 1TM,0 1.53+ 1.55+ 0.49 1.36+
Complementarity test: H0 : 1TM,PAT − 10,PAT > 1TM,0 − 10,0
0.51 2.83** -0.36 -1.86*
-
Complem.
(0.01
level)
-
Substitut.
(0.05
level)
OLS robust estimates. Standard errors in parentheses
** p<0.01, * p<0.05, + p<0.1
29

and continue to bene�t from it after the expiration of the patent.
In computer and electrical equipment sectors, by contrast, the supermodularity
test in the second speci�cation tends to be in favour of substitutability. In those
sectors we �nd that �ling a patent alone has a signi�cant positive impact on market
value, whereas �ling trade marks has no positive impact. Filing a patent jointly
with a trade mark besides tends to have a lower impact on market value than �ling
a patent alone. This suggests that in those sectors the crucial asset to be protected
is the technology, and that it is on the contrary not bene�cial to invest in the
protection of goodwill. This might be explained by the fact that in those sectors,
relying on cutting-edge technology, the depreciation rate of products and therefore
of advertising tends to be very high. The patent period is then likely to cover the
major part of the life cycle of the technology, so that products are less likely to be
imitated and trade mark protection is less needed. In that case, the substitution
e�ect tends to outweigh the complementarity e�ect.
4 Conclusion
In the paper by Amara et al. (2008), which shows complementarities between
the use of various IP protection mechanisms for �rms in KIBS sectors the authors
call for future research on the factors that could explain those complementarities.
One of those factors is the interaction of the legal mechanisms themselves. The
main contribution of the present paper is to assess the interrelated e�ects of IP
rights considering them in their core function as legal protection devices instead
of as proxies of other underlying assets. We tackle this question both through a
formal theoretical model and through an empirical analysis. Using a basic model-
ling approach, we compare the outcome of adopting various IP right strategies for
innovating �rms that commercialise their own innovation: patent or not and/or
trade mark or not, and then assess the complementarity or substitutability rela-
tionship between the two IP rights based on the supermodularity approach.
The main �nding of our model is that the complementary or substitute rela-
tionship between trade marks and patents is not straightforward. We �nd that the
interaction between the two IP rights is characterized by two counterbalancing ef-
fects: a temporal substitution e�ect � as the patent period reduces the time during
which the �rm faces competition and needs a trade mark to protect its reputation
against other �rms - and a complementarity e�ect � as the trade mark enables
the �rm to extend the reputational bene�ts of the monopoly period beyond the
30

expiration of the patent. We show that the predominance of one or the other e�ect
depends on exogenous parameters, especially the levels of advertising depreciation
rate and spillovers. If the spillovers are low and the depreciation rate is high, for
example in sectors such as high-tech business sectors, then trade marks are likely
to be substitutes, so the bene�ts of registering a trade mark will be all the more
important if the �rm cannot register a patent. In contrast, if advertising spillovers
are high and the advertising depreciation rate is low, for example in sectors such as
pharmaceutical or chemical products, then trade marks and patents are likely to
be complementary. The optimal IP right strategy of �rms may then vary from one
context to another, from one �rm to another. Following the conclusion of Teece
(1986) that the pro�t gained from innovation depends on the possibility of the �rm
to use complementary assets, our model goes a step further and states that the
relationship between the various assets is itself dependent on the context in which
the �rms operate.
The implications of this model are twofold. First, there are implications for IP
right management within �rms. We show that beyond the question of the eligibility
of the innovation to the various types of IP rights, the pro�tability of a diversi�ed
IP strategy depends on context elements, which need to be taken into account to
determine the bene�ts and costs of the various combinations. Failure to identify
complementarity (resp. substitutability) between some protection mechanisms may
lead to underexploitation (resp. overexploitation) of synergies and underprotection
(resp. overprotection) of innovations. Secondly the model has implications for
economic analyses. Whenever investigating �rms' IP activity, for example as a
proxy for other intangible assets, one should bear in mind the existence of context-
dependent interaction e�ects between the various types of protection.
Acknowledgements
We are grateful to Betrand Koebel, Isabelle Maret, Christian Martinez-Diaz andTim Folta for their helpful comments. All mistakes remain our own.
References
[1] Aaker, D., 2007, �Innovation: Brand it or lose it�, California Management
Review, 50(1):8-24.
[2] Amara, N.L. and N. Traoré, 2008, �Managing the protection of innovations inknowledge-intensive business services�, Research Policy, 37:1530-1547.
[3] Askenazy, P, Breda, T. and D. Irac, 2010, �Innovation and Advertising: Theoryand Evidence� (May 1, 2010). Banque de France Working Paper No. 284.
31

[4] Blundell, R., Gri�th, R. and J. van Reenen, 1999, �Market Share, MarketValue and Innovation in a Panel of British Manufacturing Firms�, Review of
Economic Studies, Wiley Blackwell, 66(3):529-54.
[5] Brady M., 2009, �Advertising e�ectiveness and spillover: simulating strategicinteraction using advertising�, System Dynamics Review, 25(4):281-307.
[6] Brekke, K. and Straume, O.R., 2008, �Pharmaceutical patents: incentives forR&D or marketing?�, CESifo Working Paper Series No. 2433.
[7] Cohen, W., Nelson, R. and J. Walsh, 2000, �Protecting Their Intellectual As-sets: Appropriability Conditions and Why U.S. Manufacturing Firms Patent(or Not)�, NBER Working Papers 7552, National Bureau of Economic Re-search, Inc..
[8] Davis, L., 2009, �Leveraging trade marks to capture innovation returns�, Paperpresented to the DRUID-DIME Academy Summer 2009 Conference, Copen-haguen Denmark, June 17-19.
[9] Dixit, A., 1979, �A Model of Duopoly Suggesting a Theory of Entry Barriers�,Bell Journal of Economics, The RAND Corporation, vol. 10(1):20-32.
[10] Friedman, J.W., 1983, �Advertising and Oligopolistic Equilibrium�, Bell
Journal of Economics, The RAND Corporation, vol. 14(2):464-473.
[11] Giannetti, M. 2003, �Do Better Institutions Mitigate Agency Problems? Evid-ence from Corporate Finance Choices�, Journal of Financial and Quantitative
Analysis, Cambridge University Press, vol. 38(01):185-212.
[12] Greenhalgh, C. and M. Rogers, 2007, �Trade marks and performance in UK�rms: evidence of Schumpetarian competition trhough innovation�, EconomicSeries Working Paper no. 300, University of Oxford, Department of Economics.
[13] Griliches, Z., 1981, �Market value, R&D, and patents�, Economics Letters,Elsevier, vol. 7(2):183-187.
[14] Griliches, Z., 1991, �Patent Statistics as Economic Indicators: A Survey�,NBER Working Papers 3301, National Bureau of Economic Research, Inc.
[15] Guidetti, G., Mancinelli, S. and M. Mazzanti, 2009, �Complementarity inTraining Practices Methodological Notes and Empirical Evidence for a LocalEconomic System�, The IUP Journal of Applied Economics, IUP Publications,vol. 0(1):39-56.
[16] Hall, B., Ja�e, A. and M. Trajtenberg, 2000, �Market Value and Patent Cita-tions: A First Look�, NBER Working Paper 7741, National Bureau of Eco-nomic Research, Inc.
[17] Hall, B., Ja�e, A. and M. Tratjenberg, 2001, �The NBER Patent CitationData File: Lessons, Insights and Methodological Tools�, NBERWorking Paper8498, National Bureau of Economic Research, Inc.
32

[18] Hall, B. and R. Oriani, 2006, �Does the market value R&D investment byEuropean �rms? Evidence from a panel of manufacturing �rms in France,Germany, and Italy�, International Journal of Industrial Organization, El-sevier, vol. 24(5):971-993.
[19] Helmers, C., Rogers, M., and P. Schautschick, 2011, �Intellecutal Propertyat the Firm-Level in the UK: The Oxford Firm-Level Intellectual PropertyDatabase�, Oxfor University, Department of Economics Working Paper No.546.
[20] Hirschey, M., 1982, �Intangible aspects of advertising and R&D expenditures�,Journal of Industrial Economics 30:375-390.
[21] International Accounting Standards Board, 2007, International Financial Re-porting Standards 2007, LexisNexis, ISBN 1-4224-1813-8.
[22] Jennewein, K. , 2005, Intellectual property management: the role of technology-
brands in the appropriation of technological innovation, Heidelberg: Physica-Verlag.
[23] Levin, R., Kevorick, A., Nelson R.R. and S. Winter, 1987, �Appropriatingthe returns from industrial R&D�, Brookings Papers on Economic Activity,Economic Studies Program, The Brookings Institution, 18:783-832.
[24] Magerman, T., Van Looy, B. and S. Xiaoyan, S., 2006, �Data Pro-duction Methods for Harmonized Patent Statistics: Patentee Name Har-monization�, KUL Working Paper No. MSI 0605. Available at SSRN:http://ssrn.com/abstract=944470.
[25] Mendonça, S., Pereira, T.S. and M. Godinho, 2004, �Trade marks as an indic-ator of innovation and industrial change�, Research Policy, 33:1358-1404.
[26] Milgrom, P. and J. Roberts, 1990, �The Economics of Modern Manufacturing:Technology, Strategy, and Organization, American Economic Review, 80:511-528.
[27] Milgrom, P. and J. Roberts, 1995, �Complementarities and �t: Strategy, Struc-ture and Organizational Change in Manufacturing�, Journal of Accounting andEconomics, 19:179-208.
[28] Mohnen, P. and L. Röller, 2003, �Complementarities in Innovation Policy�,CIRANO Working Papers 2003s-60, CIRANO.
[29] Nerlove, M. and K.J. Arrow, 1962, �Optimal advertising policy under dynamicconditions�, Economica, 39:129-142 .
[30] Rogers, M., 1998, �The De�nition and Measurement of Innovation�, MelbourneInstitute Working Paper No. 10/98.
[31] Sandner, P., 2009, �The Market Value of R&D, Patents, and trade marks�,SSRN Working Paper No. 1469705.
33

[32] Schmoch, U., 2003, �Service marks as a novel innovation indicator�, ResearchEvaluation, 12:149-156.
[33] Schwiebacher, F. and E. Müller, 2009, �How companies use di�erent formsof IP right protection: Are patents and trade marks complements or substi-tutes?�, Paper presented to the DRUID-DIME Academy Winter 2010 PhDConference, Aalborg Denmark, January 21-23.
[34] Snyder, S. and A. King, 2007, �Joint Determination of Prices, R&D and Mar-keting Expenditure in the Pharmaceutical Enterprise: A Theoretical Modelof Pro�t Maximizing Behavior, Martindale Center Working Paper, November2007.
[35] Somaya, D. and S. Graham, 2006, �Vermeers and Rembrandts in the sameattic: Complementarity between compyrights and trademakrs leveragingstrategies in Software�, Georgia Institute of Technology TIGER Working Pa-per.
[36] Statman, M and T. Tyebjee, 1981, �trade marks, Patents, and Innovation inthe Ethical Drug Industry�, The Journal of Marketing, 45(3):71-81 .
[37] Teece, D., 1986, �Pro�ting from technological innovation: implications for in-tegration, collaboration, licensing, and public policy�, Research Policy, 15:285-305.
[38] Thoma, G., Torrisi, S., Gambardella, A., Guellec, D., Hall, B. and D. Harhof,2010, �Harmonizing and Combining Large Datasets: An Application to Firm-Level Patent and Accounting Data�, NBER Working Papers 15851, NationalBureau of Economic Research, Inc.
[39] von Graevenitz, G. and P. Sandner, 2009, �Are advertising and R&D Com-plements?�, TIME Kolloquium, Technical University Munich and Ludwig-Maximilians-Universität Munich (Germany), November 2009.
34
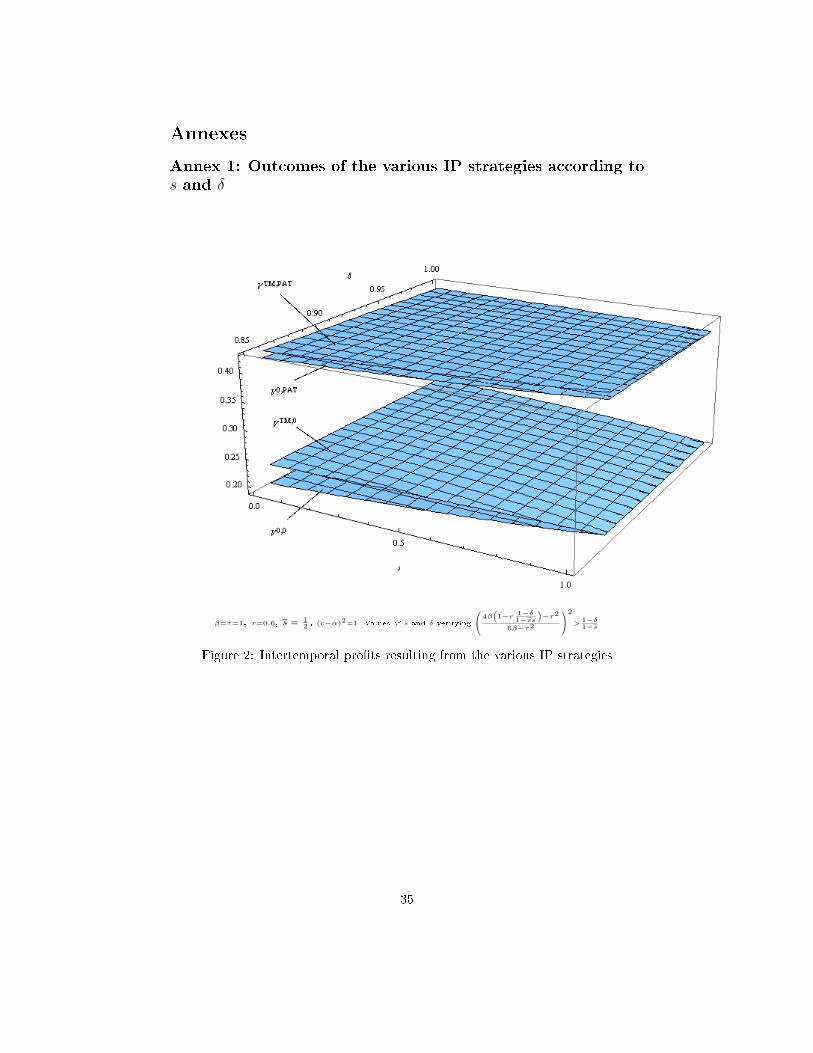
Annexes
Annex 1: Outcomes of the various IP strategies according to
s and δ
β=τ=1, r=0.6, s = 12 , (c−α)2=1. Values of s and δ verifying
4β(1−r 1−δ
1−ss
)−τ2
6β−τ2
2
> 1−δ1−s
Figure 2: Intertemporal pro�ts resulting from the various IP strategies
35
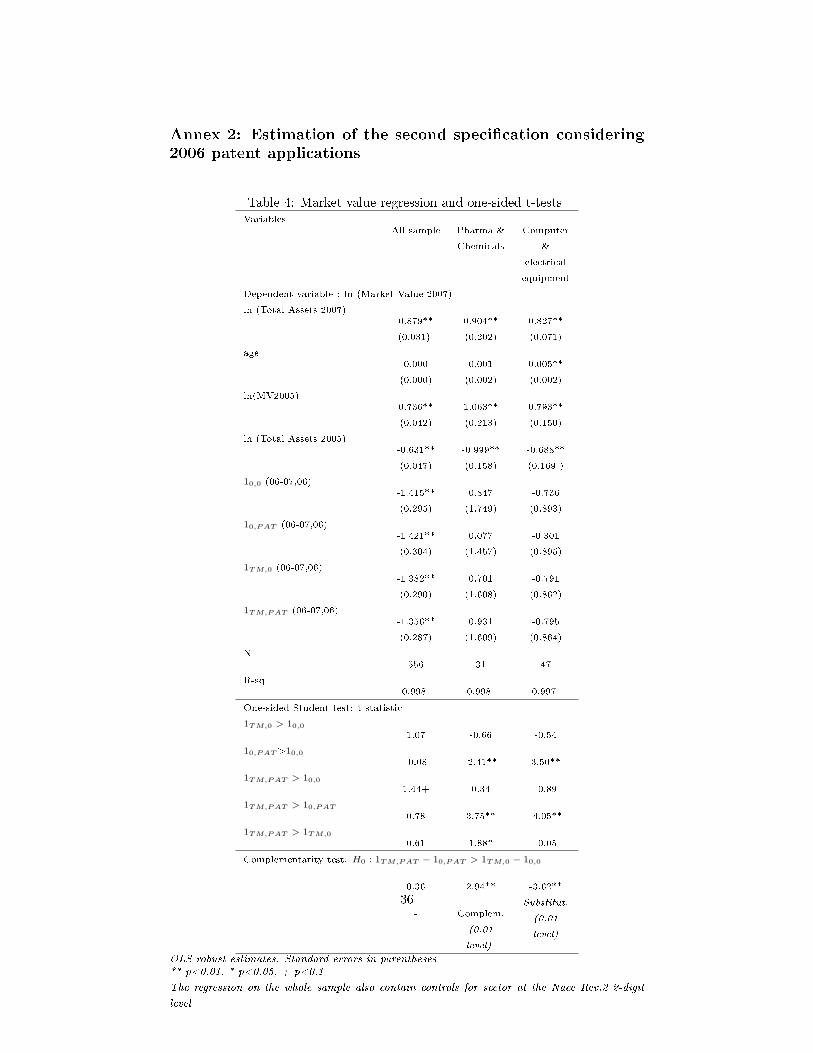
Annex 2: Estimation of the second speci�cation considering
2006 patent applications
Table 4: Market value regression and one-sided t-testsVariables
All sample Pharma &
Chemicals
Computer
&
electrical
equipment
Dependent variable : ln (Market Value 2007)
ln (Total Assets 2007)0.879**
(0.031)
0.904**
(0.202)
0.827**
(0.071)
age0.000
(0.000)
0.001
(0.002)
0.005**
(0.002)
ln(MV2005)0.736**
(0.042)
1.063**
(0.213)
0.793**
(0.150)
ln (Total Assets 2005)-0.631**
(0.047)
-0.999**
(0.158)
-0.688**
(0.169 )
10,0 (06-07,06)-1.415**
(0.295)
0.847
(1.749)
-0.736
(0.893)
10,PAT (06-07,06)-1.421**
(0.304)
0.077
(1.457)
-0.301
(0.895)
1TM,0 (06-07,06)-1.382**
(0.290)
0.701
(1.608)
-0.791
(0.862)
1TM,PAT (06-07,06)-1.356**
(0.287)
0.931
(1.609)
-0.795
(0.864)
N556 31 47
R-sq0.998 0.998 0.997
One-sided Student test: t statistic
1TM,0 > 10,01.07 -0.66 -0.54
10,PAT>10,0-0.08 -2.41** 3.50**
1TM,PAT > 10,01.44+ 0.34 -0.89
1TM,PAT > 10,PAT
0.78 3.75** -4.05**
1TM,PAT > 1TM,0
0.61 1.88* -0.05
Complementarity test: H0 : 1TM,PAT − 10,PAT > 1TM,0 − 10,0
0.36 2.94** -3.62**
- Complem.
(0.01
level)
Substitut.
(0.01
level)
OLS robust estimates. Standard errors in parentheses** p<0.01, * p<0.05, + p<0.1
The regression on the whole sample also contain controls for sector at the Nace Rev.2 2-digit
level
36


![Patente [Patents]](https://static.fdokumen.com/doc/165x107/631d0295665120b3330c2251/patente-patents.jpg)