Two Complementary Dionysiac Festivals in Aristophanes' Acharnians
Upload
khangminh22Category
view
2download
0
Complementary Products and Drug Interactions
Screening for the potential to cause pharmacokinetic interactions
Danielle Sevior
Bachelor of Applied Science, Medical Science
A thesis submitted in fulfilment of the requirement of the degree of
Doctor of Philosophy
RMIT Toxicology
School of Medical Sciences
RMIT University
June, 2012

i
Declaration
I certify that except where due acknowledgement has been made, the work is that
of the author alone; the work has not been submitted previously, in whole or in
part, to qualify for any other academic award. The content of the thesis is the result
of work that has been carried out since the official commencement date of approved
research program.
Danielle Sevior
Date

ii
Acknowledgements
Firstly I need to thank my primary supervisor and one of my biggest supporters and
truest friends Professor Jorma Ahokas. He has taught me so much more than what
is reflected in these pages. He has taught me not only to love toxicology and the
world of research but also about what it takes to be a better scientist and more
importantly a better person. His support in my academic and personal life has
allowed me to grow and without him there certainly would not have been as many
laughs along the way.
To Professor Olavi Pelkonen I owe a huge debt. Not only has he been a constant
source of support in my studies and an inspiration as a scientist, but also he has
opened the door to a wonderful country and amazing group of researchers at Oulu
University, Finland. To those at the Department of Pharmacology and Toxicology
I thank you for your time and friendship, a special mention to Ritva Tauriainen for
her invaluable assistance.
For her constant support and helpful advice I thank the ever calm and insanely wise
Diana Donohue. She has held me together many times when I wanted to fall apart.
Financial support has been greatly appreciated from RMIT University and the
Center for International Student Mobility (CIMO) of Finland.

iii
To my friends and family I could not have done this without your support and
laughter. A very special thank you to Larissa Tursas, Khalad Abass and Dawn
Lonnie who have all provided me with scientific inspiration, honest criticism of my
work, never-ending support and some much needed ‘perspective’. To my family
your patience and laughter have meant more to me than you and know. To my
mother who has been there through all the tears and tantrums, I appreciate all that
you have done for me. And finally to my one partner in everything Paul Kalisz,
none of this would be possible without your love, patience, understanding and
support.

iv
Contents
Declaration i
Acknowledgements ii
Contents iv
Index to Figures vii
Index to Tables xiv
Manuscripts and Conference Presentations xvi
Abbreviations xvii
Summary xx
Chapter 1 - General Introduction: 1
1.1 Introduction 1
1.2 Complementary and Alternative Products 2
1.3 Investigating Complementary Products for Drug Interactions 6
1.4 Current Regulations 7
1.5 Project Rationale 11
Chapter 2 - Protein Binding: 14
2.1 Introduction 14
2.2 Albumin 17
2.3 Clinical Relevance of Displacement Interactions 30
2.4 Determination of Protein Binding 33
2.5 Aims of this project 45
2.6 Materials and Methods 46
2.7 Results 52
2.8 Discussion 63
2.9 Displacement Studies- Alpha-1-Acid Glycoprotein 72
2.10 Displacement Studies with Complementary Products 73
2.11 Conclusions 77
Chapter 3 - P-glycoprotein: 79
3.1 Overview of Drug Transporters 79
3.2 ABC Transporter Family 80
3.3 P-Glycoprotein 82

v
3.4 P-glycoprotein Binding and Efflux 89
3.5 P-Glycoprotein Substrates and Inhibitors 92
3.6 P-Glycoprotein Induction 93
3.7 Methods for studying P-Glycoprotein 94
3.8 Interactions Caused by Herbal Products 99
3.9 Aims of the Present Study 100
3.10 Materials and Methods 101
3.11 Results 109
3.12 Discussion 119
3.13 Conclusions 127
Chapter 4 - Cytochrome P450: 128
4.1 Introduction - Mixed Function Oxidases 128
4.2 Cytochrome P450 Monooxygenases 128
4.3 Cytochrome P450 Superfamily 131
4.4 Function of CYPs 137
4.5 Regulation of CYPs 141
4.6 Genetic Polymorphism 144
4.7 Induction 146
4.8 Inhibition 151
4.9 CYP1 Family 154
4.10 CYP2 Family 157
4.11 CYP3 Family 172
4.12 Species Differences in Cytochrome P450 175
4.13 Methods for Investigating Cytochrome P450 Inhibition 176
4.14 In Vitro – In Vivo Extrapolation for CYP Inhibition 186
4.15 Known Inhibitions by Complementary Products 188
4.16 Aims of the Present Study 189
4.17 Materials and Methods 190
4.18 Results 207
4.19 N-in-one Cocktail Assays 222
4.20 Discussion and Conclusions 237
4.21 Black Cohosh 240
4.22 Dong Quai 242

vi
4.23 Goldenseal 243
4.24 Gotu Kola 244
4.25 Horse Chestnut 246
4.26 Horsetail 248
4.27 Liquorice Root 249
4.28 Milk Thistle 251
4.29 Saw Palmetto 252
4.30 Valerian 253
4.31 Comparison Between the Methods 254
4.32 Conclusions 256
Chapter 5 - Concluding Discussion: 258
5.1 Interaction Potential 258
5.2 Conclusions From the Experimental Work 264
5.3 General Recommendations 266
5.4 Future Directions 269
Chapter 6 - Appendix A: 273
Chapter 7 – References: 313

vii
Index to Figures
Figure 2-1: The crystal structure of human serum albumin (HSA) at 2.5Å resolution. (http://www.rcsb.org/pdb/explore.do?structureId=1AO6) ........ 17
Figure 2-2: The crystal structure of human alpha-1 acid glycoprotein at 1.8Å resolution. (http://www.rcsb.org/pdb/explore.do?structureId=3BX6). ........ 23
Figure 2-3: Flowchart for determining the clinical significance of potential protein binding displacement interactions (Rolan, 1994). ......................................... 32
Figure 2-4: The relative fluorescence of human serum albumin (HSA) when bound
with the site specific probes dansyl amide (DA), site I and dansyl sarcosine (DS), site II. Fluoresce recorded with an excitation wavelength of 370nm and
an excitation of 475nm for DA and 350nm and 450nm for DS. Each point represents the mean of triplicate incubations for 5 replicate runs. .................. 52
Figure 2-5: % Dansyl amide (DA) and dansyl sarcosine (DS) displaced by phenylbutazone and ibuprofen from human serum albumin (HSA). DA is a
specific probe for site I and DS for site II. Fluoresce recorded with an excitation wavelength of 370nm and an emission wavelength of 475nm for DA and 350nm and 450nm for DS. Each point represents the mean of triplicate
incubations for 5 replicate runs ± SEM. ....................................................... 54
Figure 2-6: Displacement of the site I probe dansyl amide (DA) from human serum
albumin (HSA) for each of the products (a) the aqueous extracts, and (b) the methanolic extracts. Fluoresce recorded with an excitation wavelength of
370nm and an emission wavelength of 475nm. Data points represent the mean of triplicate incubations for 5 replicate runs ± SEM. ..................................... 56
Figure 2-7: Displacement of the site II probe dansyl sarcosine (DS) from human
serum albumin (HSA) for each of the products (a) the aqueous extracts, and (b) the methanolic extracts. Fluoresce recorded with an excitation wavelength of
350nm and an emission wavelength of 450nm Data points represent the mean of triplicate incubations for 5 replicate runs ± SEM. ..................................... 57
Figure 2-8: The relative fluorescence (RFU) of alpha-1-acid glycoprotein (AGP) when bound with the probe quinaldine red (QR). Fluorescence recorded with an excitation wavelength of 520nm and an emission wavelength of 610nm.
Data points represent the mean of triplicate incubations for 5 replicate runs ± SEM. .......................................................................................................... 59
Figure 2-9: % Quinaldine red (QR) displaced by imipramine and chlorpromazine from alpha-1-acid glycoprotein (AGP). Fluorescence recorded with an
excitation wavelength of 520nm and an emission wavelength of 610nm. Data points represent the mean of triplicate incubations for 5 replicate runs ± SEM.60

viii
Figure 2-10: Displacement of the probe quinaldine red (QR) bound to alpha-1-acid glycoprotein (AGP) for (a) the aqueous extracts, and (b) the methanolic
extracts. Fluorescence recorded with an excitation wavelength of 520nm and an emission wavelength of 610nm. Data points represent the mean of triplicate
incubations for 5 replicate runs ± SEM. ....................................................... 61
Figure 3-1: Schematic representation of the primary structure of P-gp as embedded in the membrane. The molecule contains 1280 amino acids spanning 28 exons
(each exon sequence shown in a different color). Black dots show the location of some of the identified SNPs. Modified from Ambudkar et al. (Ambudkar et
al., 2003)..................................................................................................... 84
Figure 3-2: Summary of the two models proposed for the translocation process for
P-gp. a) The nucleotide switch model in which dimerization of the nucleotide-binding domains drives the pump. b) Model in which ATP hydrolysis drives the pump. Both models encompass four distinct stages: (i) Loading of P-gp
with drug and nucleotide. (ii) Reorientation of the drug-binding sites from high to low affinity. (iii) Nucleotide hydrolysis. (iv) Resetting phase. Modified from
(Hennessy M and Spiers JP, 2007, Callaghan et al., 2006). ........................... 91
Figure 3-3: Schematic representation of the calcein AM extrusion assay. a) The
lipid soluble calcein AM is able to cross the cell membrane. b) In the presence of esterase’s the calcein AM is hydrolyses to the fluorescent calcein which is also hydrophilic. If inhibition of the P-gp pump occurs then calcein cannot be
extruded and the fluorescence is recorded. ................................................... 97
Figure 3-4: P-glycoprotein levels determined with immunoblot analysis. a) K562
and K652-MDR cells were probed with anti P-glycoprotein monoclonal antibody C219 anti-mdr1. Immunoblots were detected by horseradish
peroxidase-conjugate anti-mouse IgG using chromogen 3,3’-diaminobenzidine tetrahydrochloride (dilution 1:1500). b) Bands were quantitatively measured by scanning densitometry and the density compared to the loading control anti
mouse β-actin antibody. Data points represent the mean protein level ± SEM
for 3 independent assays each run in triplicate. ........................................... 109
Figure 3-5: Inhibition of calcein AM extrusion from K562-MDR cells in the presence of increasing concentrations of verapamil. Cells were pre-incubated with verapamil for 15 minutes prior to the addition of 250 nM calcein.
Fluorescence was recorded for 10 minutes at 485nm excitation and 538nm emission. Data points represent the mean % inhibition ± SEM for 3
independent assays each ran in triplicate. ................................................... 110
Figure 3-6: Inhibition of calcein AM extrusion in the presence of (a) aqueous and
(b) methanolic extracts of complementary products, in K562-MDR cells. Cells were incubated with the extracts for 15 minutes prior to the addition of 250 nM of calcein. Fluorescence was recorded for 10 minutes at 485nm excitation
and 538nm emission. Data points represent the mean % inhibition ± SEM for 5 independent assays ran in triplicate. ........................................................ 112

ix
Figure 3-7: Concentration dependent stimulation of ATPase activity in K562-MDR cells by verapamil. Each point represents the mean of three incubations ±SEM
ran in triplicate.......................................................................................... 115
Figure 3-8: Concentration dependent stimulation of ATPase activity in K562-MDR
cells by DMSO. Each point represents the mean of three incubations ±SEM ran in triplicate.......................................................................................... 115
Figure 3-9: Inhibition of verapamil stimulated ATPase activity in K562-MDR cells
by a) aqueous and b) methanolic extracts of complementary products. ATPase activity determined in the presence and absence of sodium orthovanadate,
fluorescence recorded at 850nm. Data expressed as the mean ±SEM of three
independent experiments ran in triplicate. .................................................. 117
Figure 4-1: Structure of iron protoporphyrin IX, the prosthetic group of cytochrome P450 (Gibson and Skett, 2001). ................................................................. 129
Figure 4-2: Typical absorption spectra for cytochrome P450. Carbon monoxide and
ethyl isocyanide difference spectra of liver microsomes (Omura and Sato, 1962). ....................................................................................................... 130
Figure 4-3: The catalytic cycle, adapted from Gibson and Skett (Gibson and Skett, 2001). Where RH represents the drug substrate and ROH the corresponding
hydroxylated metabolite. ........................................................................... 138
Figure 4-4: Estimated contribution of individual human cytochrome P450 isoforms to the metabolism of the 200 top selling drugs. Adapted from Evans and
Relling (Evans and Relling, 1999). ............................................................. 140
Figure 4-5: Frequency of alleles identified for human cytochrome P450s. The
number of alleles includes haplotypes, normal variants, gene deletions, pseudo gene-derived mutations, combinations of pseudo-derived mutations and rare
mutations and combinations. Additionally many single nucleotide polymorphisms (SNPs) have been identified for which the haplotype has yet to be identified. Information is based on the homepage of the human cytochrome
P450 (CYP) allele nomenclature committee (http://www.cypalleles.ki.se). 145
Figure 4-6: Receptor-mediated mechanism of CYP enzyme induction. Adapted
from Hewitt (Hewitt et al., 2007). AhR- aryl hydrocarbon receptor, Arnt- AhR nuclear translocator, CAR- constitutive androstane receptor, PXR- pregnane X
receptor, RXR- retinoid X receptor, X- xenobiotic/chemical inducer. ......... 149
Figure 4-7: Structures of the substrates utilised in the single substrate (#) and N-in-one cocktail (*) cytochrome P450 inhibition enzyme assays, with the relevant
metabolising CYP. ................................................................................... 201
Figure 4-8: Structures of the metabolites detected in the single substrate (#) and N-
in-one cocktail (*) cytochrome P450 inhibition enzyme assays, with the relevant metabolising CYP. ....................................................................... 202

x
Figure 4-9: Structures of the inhibitors utilised in the single substrate enzyme assays and the internal standard for the N-in-one cocktail cytochrome P450 inhibition
enzymes assays, with the relevant metabolising CYP. ................................ 203
Figure 4-10: % Inhibition of control for the aqueous (Aq) and methanolic (Meth)
extracts of Black Cohosh for the cytochrome P450 isoforms investigated with the single substrate incubations. Results are the average of replicate incubations ran on two separate occasions. ................................................ 210
Figure 4-11: % Inhibition of control for the aqueous (Aq) and methanolic (Meth) extracts of Dong Quai for the cytochrome P450 isoforms investigated with the
single substrate incubations. Results are the average of replicate incubations
ran on two separate occasions. .................................................................. 211
Figure 4-12: % Inhibition of control for aqueous (Aq) and methanolic (Meth) extracts of Goldenseal for each of the cytochrome P450 isoforms investigated with the single substrate incubations. Results are the average of replicate
incubations ran on two separate occasions. ................................................ 212
Figure 4-13: % Inhibition of control for the aqueous (Aq) and methanolic (Meth)
extracts of Gotu Kola for each of the cytochrome P450 isoforms investigated with the single substrate incubations. Results are the average of replicate
incubations ran on two separate occasions. ................................................ 213
Figure 4-14: % Inhibition of control for the aqueous (Aq) and methanolic (Meth) extracts of Horse Chestnut for each of the cytochrome P450 isoforms
investigated with the single substrate incubations. Results are the average of replicate incubations ran on two separate occasions. .................................. 214
Figure 4-15: % Inhibition of control for the aqueous (Aq) and methanolic (Meth) extracts of Horsetail for each of the cytochrome P450 isoforms investigated
with the single substrate incubations. Results are the average of replicate incubations ran on two separate occasions. ................................................ 215
Figure 4-16: % Inhibition of control for the aqueous (Aq) and methanolic (Meth)
extracts of Liquorice Root for each of the cytochrome P450 isoforms investigated with the single substrate incubations. Results are the average of
replicate incubations ran on two separate occasions. .................................. 216
Figure 4-17: % Inhibition of control for the aqueous (Aq) and methanolic (Meth)
extracts of Milk Thistle for each of the cytochrome P450 isoforms investigated with the single substrate incubations. Results are the average of replicate incubations ran on two separate occasions. ................................................ 217
Figure 4-18: % Inhibition of control for the aqueous (Aq) and methanolic (Meth) extracts of Saw Palmetto for each of the cytochrome P450 isoforms
investigated with the single substrate incubations. Results are the average of replicate incubations ran on two separate occasions. .................................. 218

xi
Figure 4-19: % Inhibition of control for the aqueous (Aq) and methanolic (Meth) extracts of Valerian for each of the cytochrome P450 isoforms investigated
with the single substrate incubations. Results are the average of replicate incubations ran on two separate occasions. ................................................ 219
Figure 4-20: % Inhibition of control for the aqueous (Aq) and methanolic (Meth) extracts of Black Cohosh for each of the cytochrome P450 isoforms investigated with the N-in-one cocktail incubation. Results are the average of
replicate incubations ran on two separate occasions. .................................. 225
Figure 4-21: % Inhibition of control for the aqueous (Aq) and methanolic (Meth)
extracts of Dong Quai for each of the cytochrome P450 isoforms investigated
with the N-in-one cocktail incubation. Results are the average of replicate
incubations ran on two separate occasions. ................................................ 226
Figure 4-22: % Inhibition of control for the aqueous (Aq) and methanolic (Meth) extracts of Goldenseal for each of the cytochrome P450 isoforms investigated
with the N-in-one cocktail incubation. Results are the average of replicate incubations ran on two separate occasions. ................................................ 227
Figure 4-23: % Inhibition of control for the aqueous (Aq) and methanolic (Meth) extracts of Gotu Kola for each of the cytochrome P450 isoforms investigated
with the N-in-one cocktail incubation. Results are the average of replicate incubations ran on two separate occasions. ................................................ 228
Figure 4-24: % Inhibition of control for the aqueous (Aq) and methanolic (Meth)
extracts of Horsetail for each of the cytochrome P450 isoforms investigated with the N-in-one cocktail incubation. Results are the average of replicate
incubations ran on two separate occasions. ................................................ 229
Figure 4-25: % Inhibition of control for the aqueous (Aq) and methanolic (Meth)
extracts of Horse Chestnut for each of the CYP isoform assays using the N-in-one cocktail incubation. Results are the average of replicate incubations ran on two separate occasions. ............................................................................. 230
Figure 4-26: % Inhibition of control for the aqueous (Aq) and methanolic (Meth) extracts of Liquorice Root for each of the cytochrome P450 isoforms
investigated with the N-in-one cocktail incubation. Results are the average of replicate incubations ran on two separate occasions. .................................. 231
Figure 4-27: % Inhibition of control for the aqueous (Aq) and methanolic (Meth) extracts of Milk Thistle for each of the cytochrome P450 isoforms investigated with the N-in-one cocktail incubation. Results are the average of replicate
incubations ran on two separate occasions. ................................................ 232
Figure 4-28: % Inhibition of control for the aqueous (Aq) and methanolic (Meth)
extracts of Saw Palmetto at for each of the cytochrome P450 isoforms investigated with the N-in-one cocktail incubation. Results are the average of
replicate incubations ran on two separate occasions. .................................. 233

xii
Figure 4-29: % Inhibition of control for the aqueous (Aq) and methanolic (Meth) extracts of Valerian for each of the cytochrome P450 isoforms investigated
with the N-in-one cocktail incubation. Results are the average of replicate incubations ran on two separate occasions. ................................................ 234
Figure 5-1: Pharmacokinetic interactions based on absorption, protein binding, metabolism and excretion (Baxter, 2010). .................................................. 259
Figure 5-2: Schematic representation of the interrelationship of the pharmacokinetic
processes; absorption, distribution, metabolism and elimination. Adapted from Ionescu and Caira (Ionescu and Caira, 2005). ............................................ 263
Figure 5-3: Schematic representation of the interplay of transporters and enzymes in the hepatocyte. Cytochrome P450 (CYP) and other hepatic enzymes such as
epoxide hydrolase (EH), conjugating enzymes, UDP glucuronyl transferase (UGT), sulphotransferase (SULT) or glutathione S-transferase (GST) are important in metabolic handling of xenobiotics. The enzymes depend on
molecular oxygen and NADPH (CYP), UDPG (UGT), PAPS (SULT) and reduced glutathione (GSH) (GST). The cellular membrane has many
transporters, OATS, ABC transporters and OCTS, which are important for the transmembrane flux of many xenobiotics including the products of the
conjugating enzymes (Sevior et al., 2012)................................................... 270
Figure 6-1: % Inhibition of control for individual incubations for the extracts of
Black Cohosh at 20, 100 and 500 g/ml for each of the CYP isoform assays
using the single substrate incubations. ........................................................ 275
Figure 6-2: % Inhibition of control for individual incubations for the extracts of
Dong Quai at 20, 100 and 500 g/ml for each of the CYP isoform assays using the single substrate incubations. ................................................................. 277
Figure 6-3: % Inhibition of control for individual incubations for the extracts of
Goldenseal at 20, 100 and 500 g/ml for each of the CYP isoform assays using
the single substrate incubations. ................................................................. 279
Figure 6-4: % Inhibition of control for individual incubations for the extracts of
Gotu Kola at 20, 100 and 500 g/ml for each of the CYP isoform assays using
the single substrate incubations. ................................................................. 281
Figure 6-5: % Inhibition of control for individual incubations for the extracts of
Horse Chestnut at 20, 100 and 500 g/ml for each of the CYP isoform assays using the single substrate incubations. ........................................................ 283
Figure 6-6: % Inhibition of control for individual incubations for the extracts of
Horsetail at 20, 100 and 500 g/ml for each of the CYP isoform assays using
the single substrate incubations. ................................................................. 285
Figure 6-7: % Inhibition of control for individual incubations for the extracts of
Liquorice Root at 20, 100 and 500 g/ml for each of the CYP isoform assays using the single substrate incubations. ........................................................ 287

xiii
Figure 6-8: % Inhibition of control for individual incubations for the extracts of
Milk Thistle at 20, 100 and 500 g/ml for each of the CYP isoform assays
using the single substrate incubations. ........................................................ 289
Figure 6-9: % Inhibition of control for individual incubations for the extracts of Saw
Palmetto at 20, 100 and 500 g/ml for each of the CYP isoform assays using the single substrate incubations. ................................................................. 291
Figure 6-10: % Inhibition of control for individual incubations for the extracts of
Valerian at 20, 100 and 500 g/ml for each of the CYP isoform assays using the single substrate incubations. ................................................................. 293
Figure 6-11: % Inhibition of control for individual incubations for the extracts of
Black Cohosh at 20, 100 and 500 g/ml for each of the CYP isoform assays
using the N-in-one cocktail assay. .............................................................. 295
Figure 6-12: % Inhibition of control for individual incubations for the extracts of
Dong Quai at 20, 100 and 500 g/ml for each of the CYP isoform assays using the N-in-one cocktail assay. ....................................................................... 297
Figure 6-13: % Inhibition of control for individual incubations for the extracts of
Goldenseal at 20, 100 and 500 g/ml for each of the CYP isoform assays using the N-in-one cocktail assay. ....................................................................... 299
Figure 6-14: % Inhibition of control for individual incubations for the extracts of
Gotu Kola at 20, 100 and 500 g/ml for each of the CYP isoform assays using
the N-in-one cocktail assay. ....................................................................... 301
Figure 6-15: % Inhibition of control for individual incubations for the extracts of
Horse Chestnut at 20, 100 and 500 g/ml for each of the CYP isoform assays using the N-in-one cocktail assay. .............................................................. 303
Figure 6-16: % Inhibition of control for individual incubations for the extracts of
Horsetail at 20, 100 and 500 g/ml for each of the CYP isoform assays using
the N-in-one cocktail assay. ....................................................................... 305
Figure 6-17: % Inhibition of control for individual incubations for the extracts of
Liquorice Root at 20, 100 and 500 g/ml for each of the CYP isoform assays
using the N-in-one cocktail assay. .............................................................. 307
Figure 6-18: % Inhibition of control for individual incubations for the extracts of
Milk Thistle at 20, 100 and 500 g/ml for each of the CYP isoform assays using the N-in-one cocktail assay. .............................................................. 309
Figure 6-19: % Inhibition of control for individual incubations for the extracts of
Saw Palmetto at 20, 100 and 500 g/ml for each of the CYP isoform assays
using the N-in-one cocktail assay. .............................................................. 310
Figure 6-20: % Inhibition of control for individual incubations for the extracts of
Valerian at 20, 100 and 500 g/ml for each of the CYP isoform assays using
the N-in-one cocktail assay. ....................................................................... 312

xiv
Index to Tables
Table 1-1: The proposed obstacles and objections to safety testing for complementary products and the response to discredit the validity of the claim.13
Table 2-1: The key advantages and disadvantages of the common techniques to determine protein binding. .......................................................................... 43
Table 2-2: Complementary products used to screen for their potential to cause displacement interactions with human serum albumin and alpha1-acid
glycoprotein. ............................................................................................... 51
Table 2-3: Dissociation constant (Kd) µM determined for dansyl amide (DA) and dansyl sarcosine (DS) binding to sites I and II on human serum albumin
(HSA). Kd values were calculated using non-linear regression with one site hyperbolic binding (n = 5). .......................................................................... 53
Table 2-4: Dissociation constant (Kd) µM determined for sites I and II on human serum albumin for phenylbutazone and ibuprofen. Kd values were calculated
using non-linear regression with one site hyperbolic binding (n = 5). ............ 54
Table 2-5: Kd in mg/ml for each of the products investigated as determined by non-linear regression for site I and II on human serum albumin (HSA). Kd values
were calculated using non-linear regression with one site hyperbolic binding from the mean of 5 independent experiments ± SEM. .................................. 58
Table 2-6: Kd in mg/ml for each of the products investigated for alpha-1-acid glycoprotein as determined by non-linear regression. Kd values were calculated
using non-linear regression with one site hyperbolic binding from the mean of 5 independent experiments ± SEM. ............................................................. 62
Table 3-1:The cellular localisation of P-glycoprotein in tissues and the effect on
drug disposition. Material from various resources (Fromm, 2002, Cordon-Cardo C et al., 1990, Thiebaut et al., 1987). ................................................. 89
Table 3-2: The major advantages and disadvantages of the systems used in the investigation of P-glycoprotein interactions. ................................................. 99
Table 3-3: Complementary products screened for their potential to interact with P-glycoprotein. ............................................................................................. 103
Table 3-4: The IC50 (μg/ml) for products with the Calcein AM assay (n = 3). ..... 113
Table 3-5: The IC50 (μg/ml) for products in the verapamil stimulated ATPase assay
with K563-MDR cells (n = 3). ................................................................... 118
Table 3-6: IC50 (μg/ml) for the extracts that showed inhibition in the Calcein AM
and ATPase assays (n = 3). ....................................................................... 121

xv
Table 4-1: Human cytochrome P450 genes. The 57 CYPs isolated in humans are shaded based on catalytic activities. Information collated from various sources:
Number of amino acids, substrates, inducers and inhibitors (Cytochrome P450 Knowledgebase, 2006), tissue sites, subcellular location and typical reactions
(Guengerich, 2005), with additional typical reactions from (Weizmann Institute of Science, 2009) and the classification (Klaassen, 2008). .............. 132
Table 4-2: Comparison of human in vitro enzyme sources used for inhibition
studies with cytochrome P450- modified from (Pelkonen and Turpeinen, 2007). ....................................................................................................... 184
Table 4-3: Complementary products used to screen for the potential inhibition of
cytochrome P450 enzymes in the single substrate and N-in-one cocktail assays.193
Table 4-4: Characteristics of human liver samples used for the cytochrome P450 inhibition studies. ...................................................................................... 194
Table 4-5: Summary of the single substrate in vitro assay parameters for the
cytochrome P450 inhibition studies. .......................................................... 197
Table 4-6: Summary of the N-in-one cocktail in vitro assays parameters for the
cytochrome P450 inhibition studies, adapted from Turpeinen et al. (Turpeinen
et al., 2004). The Km values (Pelkonen et al., 1998), except for amodiaquine,
(Li et al., 2002) bupropion (Hesse et al., 2000) and melatonin (Härtter et al., 2001). ....................................................................................................... 204
Table 4-7: Estimated IC50 (g/ml) for the products investigated for CYP inhibition
using the single substrate assay. IC50 calculated using a non-linear regression analysis program (GraphPad Prism, v5.0). ................................................. 220
Table 4-8: Inhibition of CYP isoenzymes by extracts that produced an IC50 <100
g/ml in the single substrate assay. IC50 values are expressed as litre/dose unit.221
Table 4-9: Estimated IC50 (g/ml) for the products investigated for CYP inhibition using the N-in-one cocktail assay. IC50 calculated using a non-linear regression
analysis program (GraphPad Prism, v5.0). ................................................. 235
Table 4-10: Inhibition of CYP isoenzymes by extracts that produced an IC50 <100
g/ml in the N-in-one cocktail assay. IC50 values are expressed as litre/dose unit. .......................................................................................................... 236
Table 5-1: Summary of the experimental work for the pharmacokinetic parameters
investigated with the extracts of complementary products. ......................... 265
Table 5-2: Parameters recommended for inclusion in the information submitted to
regulators and the basis of the recommendations. ....................................... 267

xvi
Manuscripts and Conference Presentations
Manuscripts
Sevior DK, Pelkonen O, and Ahokas JT. 2012. Hepatocytes: the powerhouse of
biotransformation. International Journal of Cell Biology, 44(2), 257-261.
Sevior DK, Hokkanen J, Tolonen A, Abass K, Tursas L, Pelkonen O, Ahokas J.
2010. Rapid Screening of Commercially Available Herbal Products for the
Inhibition of Major Human Hepatic Cytochrome P450 Enzymes using the N-in-
One Cocktail. Xenobiotica, 40(4), 245-254.
Conference Presentations
Sevior DK, Hokkanen J, Abass K, Tursas L, Pelkonen OP, Ahokas JT. Selective
detection of CYP3A4 inhibition by complementary products. International
Congress of Pharmacology- WorldPharma 16, Copenhagen. Denmark, July 2010.
Sevior DK, Tolonen A, Pelkonen O and Ahokas JT. Screening complex plant
derived products for potential human CYP inhibition. International Conference on
Cytochrome P450. Okinawa, Japan. June 2009.
Sevior DK, Tolonen A, Pelkonen O and Ahokas JT. Inhibition of CYP450 by
Commercially Available Herbal Products. ASCEPT, December 2008.
Sevior DK, Donohue DC and Ahokas JT. Potential Displacement of Protein
Bound Drugs by Commercially Available Complementary Medicines. International
Congress of Toxicology. Montreal, Canada. July 2007.

xvii
Abbreviations
ABC ATP-binding cassette
ADME Absorption, Distribution, Metabolism and Excretion
AGP Alpha-1-acid glycoprotein
AhR Aryl-hydrocarbon receptor
APPs Acute phase proteins
ARNT Aryl-hydrocarbon receptor nuclear translocator
ARTG Australian Register of Therapeutic Goods
ATP Adenosine triphosphate
BSA Bovine serum albumin
CAM Complementary and alternative medicines
CAR Constitutive androstane receptor
CCRP Cytoplasmic CAR retention protein
CD Circular dichroism
CEA Carcinogenic embryonic antigen
Con A Concanavalin A
CYP Cytochrome P450
DA Dansyl amide
DS Dansyl sarcosine
EM Extensive metaboliser
EMA European Medical Agency
ER Endoplasmic reticulum
FDA U.S. Food and Drug Administration
FMO Flavin monooxygenase
FXR Farnesoid X receptor
GC Gas chromatography
GMP Good Manufacturing Practice
GR Glucocorticoid receptor
GST Glutathione-S-transferase
HMPC Committee on Herbal Medicinal Products
HNF Hepatic nuclear factor
HPLC High performance liquid chromatography
HSA Human serum albumin

xviii
HSP Heat shock protein
IM Intermediate metaboliser
IVIVE In vitro-In vivo extrapolation
LXR Liver X receptor
MDR Multi-drug resistance
MFO Mixed function oxidase
Mit Mitochondria
MPPGL Microsomal protein per gram of liver
NADPH Nicotinamide adenine dinucleotide phosphate
NBD Nucleotide-binding domain
NBF Nuclear binding fold
NICCAM National Centre for Complementary and Alternative Medicine
NIH National Institutes of Health
NR Nuclear receptor
ORM Orosomucoid
P-gp Permeability glycoprotein
PAH Polycyclic aromatic hydrocarbon
PAS PER-ARNT-Sim
PM Poor metaboliser
PPAR Peroxisome proliferator-activated receptors
PXR Pregnane X receptor
QR Quinaldine red
QSAR Quantitative structure-activity relationship
RAR Retinoic acid receptors
RXR Retinoid X receptor
SLC Solute carrier transporters
SNP Short nucleotide polymorphism
TCDD 2,3,7,8-tetrachlorodibenzo-p-dioxin
TCA Trichloroacetic acid
TGA Therapeutic Goods Administration
TI Therapeutic Index
TM Transmembrane
TMD Transmembrane binding domain

xix
TNF Tumour necrosis factor
TR Thyroid hormone receptor
UGT Uridine 5’-diphospho-gluuronusyltransferase
UM Ultra-rapid metaboliser

xx
Summary
The use of complementary products has increased dramatically over the last few
decades. These products are not subjected to the same safety and toxicity testing
that we demand of our conventional medicines, yet they are consumed without
medical supervision or advice. The concurrent use of these products with
conventional medicines raises the potential for drug interactions to occur. We
investigated the potential for complementary products to interact with three key
pharmacokinetic parameters. The displacement of drugs bound to plasma proteins;
inhibition of the transporter p-glycoprotein; and inhibition of the quantitative most
important class of drug metabolising enzymes, the cytochrome P450s.
Complementary products selected for investigation are likely to be concurrently
used with a therapeutic drug for which, if an interaction was to occur, the outcome
could be life threatening. This is based on the properties of the drug and the
reported traditional therapeutic indication.
Site-specific fluorescent probes were employed for albumin and alpha-1-acid
glycoprotein to determine the binding and displacement of previously bound
compounds. Of the 5 products investigated significant binding (Kd < 1mg/ml)
occurred at site I on human serum albumin for 1 extract (the methanolic extract of
Goldenseal). A greater level of significant binding was seen at site II with 1 aqueous
extract (CoEnzyme Q10) and 4 methanolic extracts (CoEnzyme Q10, Danshen,
Ginkgo Biloba, Goldenseal) all binding with a dissociation constant less than 1
mg/ml. Investigations into binding to alpha-1-acid glycoprotein revealed that 1
product bund with significance (the methanolic extract of Echinacea).

xxi
Inhibition of the transcellular membrane pump p-glycoprotein was investigated
with 5 products utilizing a rapid fluorescent assay and the data confirmed with the
enzyme based ATPase assay. Significant inhibition (IC50 <100 μg/ml) was seen for
4 extracts (the aqueous extract of Cordyceps, the methanolic extract of Milk Thistle
and both aqueous and methanolic extracts for Slippery Elm).
The inhibition of cytochrome P450 was determined for 9 isoforms of the enzyme.
Two methods were used; HPLC analysis combined with fluorometry with single
substrates and their metabolites, and the N-in-one cocktail, which allows for the
simultaneous monitoring of the 9 enzymes in a single incubation. The N-in-one
assay was a more reliable assay with these complex products. Of the ten
investigated products, Valerian was the most widely inhibitory as it inhibited all 9
of the isoenzymes to some degree. The inhibition of CYP3A4 by the methanolic
extract was the most significant finding (IC50 3.5g/ml). Reliable extrapolation of
in vitro findings to in vivo situation is still an unsurmountable challenge.
Due to the large number of complementary products available, their variability in
chemical composition and the requirement of ongoing monitoring, we have utilised
assays that can provide rapid, cost-effective and reliable information with regards to
the potential of these products to cause drug interaction. We have demonstrated the
ability for rapid, accurate and reproducible assays to provide information on the
potential for complementary products to cause drug interactions and presented a
rationale basis for screening these products.
Chapter 1: General Introduction 1
Chapter 1 - General Introduction:
Complementary products, the risk associated with use,
current regulations and considerations for investigations.
1.1 Introduction
Complementary and alternative products are available to consumers without
evaluation of their efficacy or safety, yet they are a widely used health care product.
With a market value of $1.2 billion per year in Australia alone (Department of
Innovation, 2011), it would reasonable to expect adequate safety evaluations of
these products to be conducted. Our focus here is the potential for these products to
cause drug interactions.
With self-administration of complementary products an increasingly common trend
(Eisenberg et al., 1998, MacLennan et al., 2002), there is concern regarding
simultaneous administration with therapeutic drugs. The concurrent administration
of these products and prescription drugs or over-the-counter medications
significantly increases the risk for clinically serious adverse reactions. Adding
concern to this is the public’s attitude regarding these products. Consumers feel
that these products are natural and therefore safe and often do not report their use
to medical professionals (Eisenberg et al., 1998).
Because of the variable nature of these products, it is not feasible to subject them to
the same safety evaluation criteria as therapeutic drugs.

Chapter 1: General Introduction 2
However, a rational basis can be formulated for essential studies to improve patient
safety. With the large number of products available, prioritising safety studies
becomes essential. The selection criteria for which product is to be investigated is
best started considering the therapeutic drug for which interactions may be of
clinical significance.
These therapeutic drugs have at least one of the following characteristics:
Narrow therapeutic index;
High potential for toxicity; and/or
Life-threatening outcome from therapeutic failure.
The next step is to identify complementary products that are market leaders and on
the basis of volume likely to be concurrently used with drugs that meet the above
criteria. The products for investigation are then selected based on their particular
traditional therapeutic indication.
1.2 Complementary and Alternative Products
The wide acceptance of these products and the advent of internet trading has
contributed to their increase in use, reported to be as high as 18% of the adult
population in the USA (Barnes and Bloom, 2008). Similar figures have been
reported in Australia with 25% reportedly using complementary products (Xue et
al., 2007), this figure rises to two-thirds of the population when therapies such as
chiropractic and energy based modalities are included (NICM., 2009). In England,
use of herbal products has been reported to be as high as 22% (Thomas et al., 2001).

Chapter 1: General Introduction 3
The World Health Organization (WHO) reports that the use of traditional medicine
accounts for 80-95% of primary health care in Africa and Asia, but this figure
includes other forms of traditional medicine such as acupuncture and homeopathy
(World Health Organization, 2008). The global market for these products was
estimated at US$83 billion annually in 2008 (Robinson and Zhang, 2011).
Increasing the need for investigations into drug interactions is the use of
complementary products in patient populations with chronic and/or terminal
illness. There is a higher proportion of use of complementary products, 70-80%, in
this patient group (Lee et al., 2006, Molassiotis et al., 2005). These patients are at a
greater risk of drug interactions as not only do they often consume multiple
therapeutic drugs (or conventional medicines) as part of their treatment, but also
therapeutic failure could be life threatening.
1.2.1 Concerns Relating to Complementary Products
In the framework of safety, reliance on historical use of these products is no longer
valid, as issues such as self-administration, concurrent use with therapeutic agents
and a much more diverse genetic population being exposed all need to be
considered. Traditionally many of these products were administered or prescribed
by healers and physicians in the cultures where they were used but in today’s
society these products are re-packaged into tablets and capsules and sold to
consumers with no consultation.

Chapter 1: General Introduction 4
Misidentification of plant material is also an area of concern. In 1993 over 100
cases of irreversible nephropathy were reported in young women attending a
slimming clinic in Belgium. The nephrotoxicity was traced to the accidental
substitution of Stephania tetrandra with the highly toxic Aristolochia fangchi
(Vanherwghem, 1994). The misidentification of other Aristolochia species has
occurred in the United Kingdom, China and France (Stengel and Jones, 1998,
Cosyns et al., 1999).
Assessment of delayed toxicity including carcinogenesis is difficult, even with the
strict monitoring of conventional medicines. Given the unregulated use of
complementary products, any incidences of delayed toxicity including reproductive
and developmental toxicity, would be extremely difficult to identify.
Deliberate substitution with other herbal and complementary products or illegal
“fortification” with prescription medications is known to occur and may have
serious consequences. The illegal and unlisted addition of corticosteroids in creams
for the treatment of eczema (Kinsunthorn et al., 2011) and prescription medications
such as sildenafil (Low et al., 2009), glibenclamide (Ching et al., 2011), and
alprazolam (Rao et al., 2004) have all been reported in complementary products.
These illegal additions could be responsible for pharmacodynamic interactions in
patients already consuming similar medications, leading to synergistic effects,
which may be toxic. These added medications may also cause allergic reactions in
susceptible patients.

Chapter 1: General Introduction 5
In the modern mass marketing of complementary products quality standards in
manufacturing are important, as poor manufacturing is a health threat to the
consumer. In January 2003, questions into the manufacturing and quality control
processes were raised by the regulatory body in Australia with respect to a very
large Australian manufacturer, Pan Pharmaceuticals. Investigations revealed a
large number of irregular practices including:
Misidentification of raw material, especially herbal materials, which could
lead to severe organ damage, including renal and hepatic damage.
Manipulation of assay results of finished products in order to comply with
specifications.
Fabrication of assay results of a finished vitamin product for export in order
to comply with specifications.
Cross-contamination or substitution of ingredients due to inadequate
operating procedures and poor compliance with existing procedures which
could lead to severe allergic reactions including anaphylaxis.
Microbiological contamination through poor raw material sourcing and
handling, poor cleaning practices, and inadequate operating procedures,
potentially leading to infections.
Substitution of shark cartilage for bovine cartilage, which could cause
serious allergic reactions, in fish-protein sensitive individuals.
Substitution of bovine cartilage for shark cartilage where the bovine cartilage
has been sourced without any assurance that it is TSE-free, and the country
of origin is unknown.

Chapter 1: General Introduction 6
This investigation lead to a large-scale recall of medicines (both generic and
complementary) involving as many as 219 products (Therapeutic Goods
Administration, 2003). The manufacturing license of Pan Pharmaceuticals was
subsequently suspended.
Heavy metal contamination of complementary products has been documented
(Rao et al., 2011). The heavy metal content may rise above a safe level due to
contaminated raw materials, from processing and manufacturing practices or it can
be added deliberately. In the latter case it may be declared as a constituent of a
complementary product. The Chinese Pharmacopoeia lists formulations for nearly
fifty products that include heavy metals such as arsenic and mercury.
1.3 Investigating Complementary Products for Drug Interactions
Studying complementary products in the context of drug interactions presents a
number of challenges, including the fact that these products are complex
preparations of variable composition and multiple therapeutic targets. This
variability in dose, strength and formulation makes the evaluation for safety in
animal and/or clinical models both time and cost prohibitive.
Isolating individual components is one method that can be used to assist in the
determination of the pharmacokinetic profiles of these products, though this is time
consuming and in the end may not provide the answers required as these products
are not taken as isolated components but as complex mixtures.

Chapter 1: General Introduction 7
The many components of complementary products are not considered in isolation,
instead the multiple components present are often considered integral to the action
with “a concerted pharmacological intervention of multiple compounds interacting
with multiple targets and possessing mutually interdependent activities that are
required for an optimal effect” (Chan, 1995).
As variability is known to occur with these products between the manufacturers
and even between the seasons and geographic locations of the raw materials,
ongoing screening for potential drug interactions is required. By using a system that
is rapid and reproducible, monitoring of the products can occur and fluctuations
and variability in product composition can be detected.
Another challenge associated with complementary products is the choice of
extraction method used for assays in the laboratory. Extractions may use a variety
of solvents, heat, time, drying and crushing. Separation techniques may also utilize
HPLC, GCMS and electrospray ionization.
1.4 Current Regulations
The regulation of complementary and alternative products differs from the
regulation of therapeutic agents. Regional variation in the testing and marketing of
these products also exists. It is important to understand how the regulations differ,
as internet trading and unregulated or inconsistent export and import laws mean
that these products are globally available. Consistent regulations would provide
regulators, importers and manufacturers with clear guidelines and a regulated
framework.

Chapter 1: General Introduction 8
1.4.1 Europe
The European Medicines Agency (EMA) has within its body, the Committee on
Herbal Medicinal Products (HMPC). Under EMA there are three classifications for
complementary products:
A herbal medicinal product is any medicinal product, exclusively containing
as active ingredients one or more herbal substances or one or more herbal
preparations, or one or more such herbal substances in combination with
one or more such herbal preparations.
A herbal substances is all mainly whole, fragmented or cut plants, plant
parts, algae, fungi, lichen in an unprocessed, usually dried, form, but
sometimes fresh. Certain exudates that have not been subjected to a specific
treatment are also considered to be herbal substances. Herbal substances are
precisely defined by the plant part used and the botanical name.
Finally, herbal preparations are obtained by subjecting herbal substances to
treatments such as extraction, distillation, expression, fractionation,
purification, concentration or fermentation. These include comminuted or
powdered herbal substances, tinctures, extracts, essential oils, expressed
juices and processed exudates.
Under European medicines legislation (Directive 2004/24/EC), medicinal products
containing herbal substances/preparations must fall within one of the following
three categories to reach the market:
A product can be classified under traditional medicinal use provisions
(‘traditional use’) accepted on the basis of sufficient safety data and plausible
efficacy: the product is granted a traditional use registration.

Chapter 1: General Introduction 9
A product can be classified under well-established medicinal use provisions
(‘well-established use’). This is demonstrated with sufficient safety and
efficacy data. As a result the product is granted a marketing authorization.
A product can be authorized after evaluation of a marketing authorization
application consisting of only product-specific safety and efficacy data (‘full
dossier’). As a result the product is granted a marketing authorization.
1.4.2 United States of America
The National Centre for Complementary and Alternative Medicine (NCCAM), a
centre within the National Institutes of Health (NIH) advises the U.S Food and
Drug Administration (FDA) on issues relating to complementary products. The
regulation of these products is under the control of the FDA.
NCCAM classifies complementary and alternative products and therapies into four
categories:
Biologically-based practices;
Energy therapies;
Manipulative and body-based methods; and
Mind-body medicine.
Many of the complementary products fall under the regulation of the Dietary
Supplement Health and Education Act (DSHEA) of 1994. This act regulates
products that are intended to supplement the diets and include vitamins, minerals,
herbs or other botanicals, amino acids, and substances such as enzymes, organ
tissues, glandular, and metabolites.

Chapter 1: General Introduction 10
Under this act, the manufacturer is responsible for ensuring that the ingredient is
safe before it is marketed, though products do not need to be registered with the
FDA, or gain approval prior to selling.
Manufacturers must make sure that product label information is truthful and not
misleading, and products are manufactured under Good Manufacturing Practices
(GMP). The FDA is responsible for taking action against any unsafe dietary
supplement product after it reaches the market.
1.4.3 Australia
In Australia the regulation of complementary and alternative products is the
responsibility of the Therapeutic Goods Administration (TGA). Complementary
products are often referred to as complementary medicines; this classification
includes vitamins, minerals, herbal, aromatherapy and homeopathic products.
These are all regulated under the Therapeutic Goods Act 1989.
The TGA defines a complementary medicine as a therapeutic good consisting
wholly or principally of one or more designated active ingredients each of which
has a clearly established identity and a traditional use.
Traditional use means use that is well documented, or otherwise established,
according to the accumulated experience of many traditional healthcare
practitioners over an extended period; and accords with well-established procedures
of preparation, application and dosage.
Chapter 1: General Introduction 11
All products imported into, supplied in or exported from Australia, must be listed
on the Australian Register of Therapeutic Goods (ARTG). The legal responsibilities
of sponsors who wish to register a product include the assessment of the product as
low risk-, which means that the product is a Listed product, or higher risk-, which
means that the product becomes a Registered product.
Listed products are restricted to claims relating to health maintenance, health
enhancement or non-serious, self-limiting conditions. Importantly Listed medicines
are not assessed individually for efficacy, though any direct therapeutic claims must
have supporting evidence. Registered complementary medicines are assessed
individually for quality, safety and efficacy.
All products imported and exported must be manufactured under the Good
Manufacturing Practice (GMP). Post-marketing surveillance and reporting of
adverse effects is the responsibility of the product sponsor.
1.5 Project Rationale
The advocates for these products raise obstacles and objections as to why they
should not be subjected to the safety tests that we expect of our health-care
products. We have addressed these claims with the aim of developing a basic
framework for testing that can and should be undertaken. The obstacles raised and
the responses to these obstacles are presented in Table 1-1.

Chapter 1: General Introduction 12
This project approaches the field of drug interactions with complementary products
from the basis of adverse interactions with therapeutic agents. A rational basis for
the selection of products of products is presented and the potential for interactions
assessed. The methods of assessment all allow for rapid screening of the products as
complex mixtures to provide accurate and reproducible data. This data can be used
to prioritise the products that require further investigation and as starting for
monitoring the variation in the products.
Interaction potential based on three mechanisms were addressed:
Protein binding (Chapter 2).
P-glycoprotein inhibition (Chapter 3).
CYP inhibition (Chapter 4).
The specific aims of each of these areas are detailed in each chapter. These
individual areas have been targeted as clinical studies and case reports have
identified these areas as key for interactions with herbs and conventional medicine
(Chen et al., 2011, Shaojun and Ulrich, 2012).
Many attempts have been made to determine the frequency of adverse events that
can be attributed to an interaction involving a complementary product but this is
complicated not only because of self-medication and under-reported use of these
products but also because of the wide variability (Farah et al., 2000). Additionally
there is a lack of consistency in the reporting guidelines for adverse events.

13
Table 1-1: The proposed obstacles and objections to safety testing for complementary products and the response to discredit the validity of the
claim.
Proposed Obstacle Response
High cost of testing- this would cripple the industry. The complementary products industry has an estimated value of US$83 billion annually.
Safety testing could increase the market share as consumers who currently avoid these
products due to concerns, may decide to start using them or be given permission by medical
professionals to use them concurrently with conventional medicine, once the safety has been
confirmed.
Complexity of products does not lend these products to standard
safety testing.
Products do not need to be studied in isolation or as single components; they can be
investigated in their complex form.
Historical use of these products demonstrates safety. The use of these products and the population exposed has changed. More patients are now
exposed, including patients with complex and chronic medical conditions and multiple drug
therapies. Delayed toxicities (cancer and genotoxicity) are very difficult to study in users.
Practitioners are experienced and know which products may be
toxic and how to “personalise” treatment for patients.
Consumers purchase these products off supermarket shelves and from the internet with no
supervision or guidance. Practitioners may not have an understanding of western
therapeutic drugs and the potential for interactions.

Chapter 2- Protein Binding 14
Chapter 2 - Protein Binding:
Displacement of Protein Bound Drugs from Albumin and
Alpha-1-Acid Glycoprotein
2.1 Introduction
Binding to plasma proteins can influence the distribution, metabolism and
excretion behaviour of many endogenous and exogenous compounds. In vivo, drug
molecules are either bound to proteins and lipids in plasma and tissues, or are free.
These free drug molecules diffuse in the aqueous environment of the blood and
tissues (Smith et al., 2010).
Because of their high molecular weights, plasma proteins and the compounds
bound to them cannot cross capillary walls. Consequently, the fraction of the
compound bound to plasma protein is not immediately available for distribution
into the extra-vascular space or for filtration by the kidneys. In most cases, only the
free drug (unbound) molecules interact with the therapeutic target to produce an
effect. The unbound fraction is also important as it will affect the distribution,
steady state concentration, rate of metabolism, and the rate of excretion of a drug
(Noctor et al., 1993, Vallner, 1977).
Protein binding is important when predictions and investigations into the toxicity of
a compound are undertaken, as typically the toxicity is manifested by the unbound
fraction.

Chapter 2- Protein Binding 15
Therefore a compound with a high degree of plasma protein binding may not show
toxicity when compared to one that is less extensively bound to plasma proteins.
Paradoxically a high degree of protein binding increases the risk of adverse effects
resulting from displacement interactions with other compounds and the binding
site. Due to the transient increase in the concentration as a result of one compound
displacing the other (section 2.1.1).
Several key proteins found in human serum are capable of binding drugs; albumin
(HSA) and alpha-1-acid glycoprotein (AGP) are of greatest importance (Fournier T
et al., 2000). As a general rule acidic drugs bind to HSA and basic and neutral drugs
bind to AGP. Protein-ligand interactions occur primarily as a result of hydrophobic
forces, hydrogen bonding, and Van der Waals forces (Casarett L et al., 2008). This
interaction is usually reversible and as unbound drug diffuses out of the capillaries,
bound drug disassociates from the protein until the free fraction reaches equilibrium
with the extra-vascular and the vascular space.
2.1.1 Displacement from Protein
The concentration of a drug or ligand bound to protein can alter significantly due to
co-administered drugs/ligands. Thus the ability to bind to protein and to displace a
previously bound compound from protein is an important consideration in drug
development and in the prediction of drug interactions.
Simultaneous binding of drugs and/or endogenous ligands to protein can give rise
to various potential interactions. The binding of the ligands can be independent;
and therefore not influence the affinity of each other.

Chapter 2- Protein Binding 16
The binding may be cooperative; that is the binding of one ligand increases the
affinity of the other. The binding may be anti-cooperative; where the binding of one
ligand decreases the affinity of the other, and finally the binding may be
competitive; where the two ligands bind to the same site, the competition
determining a decrease of the affinity.
Determination of drug binding to different biomacromolecules, and particularly
with specific plasma and tissue proteins, is mandatory in pharmacological and
toxicological studies for therapeutic drugs. This is in order to predict nonlinear
pharmacokinetic processes (Gillespie, 1993), stereoselective pharmacokinetics
(Brocks, 2006), covalent binding of drug metabolites to different molecular
structures (Nelson, 1982), drug displacement phenomena (MacKichan, 1989,
Rolan, 1994), or inter-individual binding variability due to different physiological or
pathological factors (age, disease, genetic aspects, etc.) (Eap and Baumann, 1989,
Hervé et al., 1993, Zini et al., 1990b, Zini et al., 1990a, Oracová et al., 1996).
Whilst these studies are performed for therapeutic drugs before they enter clinical
trial, let alone the market, in sharp contrast, this is not the case for complementary
products. This is an alarming situation as these products are known to cause drug
interactions involving protein binding and displacement (section 2.2.3.1
and 2.2.8.1).

Chapter 2- Protein Binding 17
2.2 Albumin
Human serum albumin (HSA), at a concentration of 40 mg/ml, is the most
abundant protein in the blood, acting as a transport protein for numerous
endogenous and exogenous compounds. It is synthesised in the liver and exported
as a non-glycosylated protein (Peters T Jr, 1996). HSA has 585 amino acids and a
mass of 66.5 kDa and is composed of three structurally similar -helical domains, I,
II and III (Thorarensen et al., 2007).
These subdomains are further divided; subdomain A containing 6 -helices and
subdomain B containing 4 -helices, connected by flexible loops. The main binding
sites for compounds are Site I, localised within domain II, referred to as the
warfarin binding site, and Site II localised within domain III and referred to as the
benzodiazepine binding site (Fournier T et al., 2000).
Figure 2-1: The crystal structure of human serum albumin (HSA) at 2.5Å
resolution. (http://www.rcsb.org/pdb/explore.do?structureId=1AO6)

Chapter 2- Protein Binding 18
2.2.1 Biological Functions of Human Serum Albumin
The abundance of HSA and its broad binding capabilities make it a key factor in
the pharmacokinetic behaviour of many drugs, affecting their efficacy and rate of
delivery. HSA may act as a reservoir for exogenous or endogenous ligands, or it can
hold some ligands in a strained orientation, facilitating their metabolic modification
and rendering potential toxins harmless.
Protein binding can result in an increased solubility in plasma, decreased toxicity
(as the bound drug cannot cross cell membranes), and/or protection against
oxidation of the bound ligand. However, binding can also have a significant impact
on the pharmacokinetics of drugs in other ways. For example, binding to albumin
can extend the in vivo half-life; bound drugs are unable to cross the renal
epithelium and therefore are not excreted.
In addition to its binding and transport abilities, HSA also provides most of the
acid/base buffering action of the plasma, and contributes to osmotic pressure. HSA
accounts for most of the antioxidant capacity of human serum either directly or by
binding and carrying radical scavengers or sequestering transitional metal ions with
pro-oxidant activity. Additionally HSA acts as a depot and carrier for nitric oxide,
leading to covalent modification of molecules (Fasano et al., 2005).
2.2.2 Binding Properties of Human Serum Albumin
HSA interacts reversibly with a broad group of compounds, though hydrophobic
anionic compounds are most strongly bound. The binding capability of HSA is
diverse; it contains multiple binding sites that vary in structure and polarity.

Chapter 2- Protein Binding 19
Additionally the binding of ligands may induce conformational changes in the HSA
molecule, which alter the binding capabilities of the molecules.
Usually drugs bind to one or few high-affinity sites with typical association
constants in the range of 104-106 M (Kragh-Hansen et al., 2002). At high
concentrations a single compound may populate multiple sites on albumin, binding
at a primary site with high affinity and at secondary and tertiary site with lower
affinity (Day and Myszka, 2002). The binding sites vary in size and polarity and
allow drugs of differing structure and size to bind simultaneously.
Site I is a complex and large binding site. Evidence for this is shown in the binding
of bilirubin, a large molecule with a molecular weight of 548 Daltons, and with
ligands of very different chemical structures binding to the region with high affinity.
This includes ligands as diverse as warfarin, tolbutamide and indomethacin
(Yamasaki et al., 1996, Vallner, 1977, Sudlow et al., 1975).
Site I ligands tend to be dicarboxylic acids and/or bulky heterocyclic molecules
with a negative charge localised in the middle of the molecule (Peters, 1985).
Conformational changes in HSA post ligand binding have been proposed, changes
could be anti-cooperative as in the case with warfarin and salicylate (Kragh-
Hansen, 1985) or allosteric as seen with ibuprofen enantiomers and the stereo-
selective binding of 3-acyloxy-1,4-benzodiazepines (Fitos et al., 1999).
Site II ligands are often aromatic carboxylic acids with a negatively charged acidic
group at one end of the molecule away from a hydrophobic centre (Peters, 1985).

Chapter 2- Protein Binding 20
Due to the size of the ligands that bind at site II, it is likely that this is a smaller
binding site than site I. Binding to this site is also highly stereoselective, indicating
that this region is not as flexible as site I. L-tryptophan which binds with an affinity
100 times greater than the D-isomer (McMenamy and Oncley, 1958), is an example
of the highly stereoselective binding. Whilst binding to this site is more restricted
there are several ligands that bind to site II with high affinity including ibuprofen,
chlorothiazide and diazepam, (Ferrer et al., 2001, Sudlow et al., 1975, Takamura et
al., 1994).
2.2.3 Known Interactions Involving Human Serum Albumin
Competition between two drugs for their binding to plasma protein can strongly
affect the drug disposition of both drugs, with possible serious outcomes. This is of
greater importance with compounds that are highly bound to HSA, i.e. over 90%
(Peters, 1996, Kragh-Hansen et al., 2002).) One well-studied interaction occurs
between warfarin and phenylbutazone. Warfarin is an anti-coagulant that is over
90% bound to HSA. Co-administration with phenylbutazone leads to an increased
bleeding risk in patients as the warfarin is displaced from the albumin, increasing its
free concentration (Harder and Thürmann, 1996).
2.2.3.1 Known Interaction with Complementary Products
Several examples of plant and herbal products binding to HSA are known.
Genistein, a major isoflavone present in soybeans binds at site I (warfarin binding
site). The binding constant has been determined to be 1.00.2x105 M-1 (Mahesha et
al., 2006), using equilibrium dialysis (section 2.4.1.1).

Chapter 2- Protein Binding 21
Using micro-dialysis, two components of the traditional Chinese herb Rhizoma
Chuanxiong: ferulic acid and 3-butylphthalide, were found to bind to HSA with
36.7 and 30.2% free compound detected, respectively (Guo et al., 2006).
Fluorescence spectroscopy (section 2.4.3.2) was used to investigate the binding of
Chinese medicinal herbs to HSA and bovine serum albumin (BSA). The
anthraquinone, emodin, rhein, aloe-emodin and aloin, were all determined to have
greater binding constants for HSA than BSA; 3.18-2.03x10⁵, 2.20-1.16x10⁵,
1.14x10⁵-3.84 x 10⁴, and 2.77-3.10 x 10⁴ l mol-1, respectively (Bi et al., 2005).
Both Ginkgo and Ginger were suspected to alter the kinetics of warfarin by protein
binding interactions but in vivo investigations using healthy human volunteers have
found no alteration of the kinetics of warfarin when these herbal products are co-
administered with warfarin (Jiang et al., 2005).
One of the potentially more significant examples of Chinese herbs binding to HSA
is Danshen, a traditional Chinese medicine prepared from the root of Salvia
miltiorrhiza. Studies have shown that Danshen is 50-70% bound to albumin, and
can displace salicylate from its binding site (Gupta et al., 2002). Danshen is also of
concern as it is suggested for patients with ‘stagnation of blood flow’ indicating that
concurrent use with therapeutic agents such as warfarin are likely.
These studies all indicate that there is a potential for significant protein binding
with complementary and alternative products and that their potential for
displacement interactions involving HSA should be investigated.

Chapter 2- Protein Binding 22
2.2.4 Alpha-1-Acid Glycoprotein
Alpha-1-acid glycoprotein (AGP); also known as orosomucoid (ORM), was first
described in 1950 concurrently by Karl Schmid and Richard J Winzler et al.
(Schmid, 1950, Schmid, 1953, Weimer et al., 1950). It is a 41-43 kDa negatively
charged (pI = 2.7-3.8), glycosylated acute phase protein that is 183 amino acids in
length. AGP consists approximately of 45% carbohydrates (Schmid et al., 1977)
attached in the form of five complex-type N-linked glycans (Yoshima H et al.,
1981), (Figure 2-2). The negative charge of AGP is due to the salicylic acid residues
which may number as many as 16, or 10-14% by weight (Kopecký V et al., 2003).
Five heteropolysaccharide groups are linked via an N-glycosidic bond to
asparaginyl residues of the protein (Schmid et al., 1973a). AGP has a high -sheet
content (40%) and consists of eight anti-parallel – strands which form the -barrel
with a central hydrophobic pocket (Breustedt et al., 2006, Albani, 2006, Kopecký et
al., 2003). This protein also has an unusually high solubility in water and other
polar organic solvents.

Chapter 2- Protein Binding 23
Figure 2-2: The crystal structure of human alpha-1 acid glycoprotein at 1.8Å
resolution. (http://www.rcsb.org/pdb/explore.do?structureId=3BX6).
AGP is a member of the immunocalin family, a lipocalin subfamily. The lipocalin
proteins are part of a larger group, the acute phase proteins (APPs). These APPs
can be divided into two major classes depending on their response to cytokines.
Type 1 APPs, including AGP, complement component 3, serum amyloid A, C-
reactive protein, haptoglobin and hemopexoin, are regulated by interleukin-1,
interleukin-6 and glucocorticoids. Type 2 APPs including fibrinogen and several
protease inhibitors are regulated by interleukin-6 type cytokines and glucocorticoids
(Baumann et al., 1989, Baumann and Gauldie, 1994)

Chapter 2- Protein Binding 24
AGP is predominantly synthesised in the hepatocytes and parenchymal cells of the
liver at a rate of 10 mg/kg (of body weight)/day (Lentner C, 1984), and secreted
into the plasma at a mean concentration of 0.77 mg/ml with a range of 0.36-1.46
mg/ml in healthy volunteers (Blain et al., 1985), though the concentration of 1
mg/ml is most commonly reported (Fournier T et al., 2000, Zsila F, 2007, Schön A
et al., 2003). Extra-hepatic synthesis of AGP also occurs in endothelial cells and
alveolar type II cell macrophages (Sörensson et al., 1999{Fournier T, 1999 #76)}.
Protein synthesis and glycosylation of AGP is regulated by cytokines and
glucocorticoids (MacKiewicz et al., 1987a, van Dijk et al., 1991).
A critically important characteristic of AGP is the change in plasma levels that
occurs with conditions such as inflammation (e.g. arthritis) and chronic disease
(e.g. cancer). In these patients, expression is increased 2-5 fold (Fournier et al.,
2000). An increase in AGP also occurs following myocardial infarction (Johansson
et al., 1972) and surgery (Voulgari et al., 1982), whilst lower levels are seen during
pregnancy (Perucca E and Crema A, 1982), in thyroid disease (Feely J et al., 1981)
and in patients with liver cirrhosis (Serbouce-Hougel et al., 1981). Such wild
fluctuations must be considered when the potential for drug interactions are
investigated with regards to AGP.
60% of AGP is found in the central compartment; the rest is in the extra-vascular
space (Koj A, 1974, Lentner C, 1984). AGP is also distributed to other fluids
including, but not limited to, gastric juice, cerebrospinal fluid, wound exudate,
pleural and peritoneal effusions and synovial fluid (Lentner C, 1984).

Chapter 2- Protein Binding 25
This wide distribution gives AGP the potential to be involved in drug interactions
and protein binding not just within the circulation, but also at the sites of drug
action.
2.2.5 Structure and Variants of Alpha-1-Acid Glycoprotein
Each of the five N-glycosylation sites of AGP can express many different glycans.
Though only 12-20 glycoforms of AGP can be detected in human serum, as site 1
never carries a tetra-antennary glycan, site 2 never carries glycans with fucose, site 4
never carries a di-antennary glycan, and only glycosylation sites 4 and 5 carry tetra-
antennary glycans with more than one fucose (Fournier et al., 2000).
Glycosylation has been shown to differ with various inflammatory diseases, this
micro-heterogeneity of AGP depends on the duration of the inflammatory process
and not the aetiology (Fassbender et al., 1991). The differentiation between acute
and chronic inflammatory states can be determined by crossed immuno-affinity
electrophoresis on the basis of reactivity to concanavalin A (Con A) (Narasimhan et
al., 1986, Bøg-Hansen, 1973, Hansen et al., 1984b).
A rise in reactivity to Con A has been reported in acute sepsis (Nicollet et al., 1981),
pancreatitis (Raynes, 1982), and surgical trauma (Hansen et al., 1984a, Hansen et
al., 1986). By contrast, in rheumatoid arthritis (MacKiewicz et al., 1987b),
ankylosing spondylitis (MacKiewicz et al., 1989) and Crohn’s disease (Raynes,
1982, Hansen et al., 1986), a significantly decreased proportion of AGP reacts with
Con A. Isoform differentiation can also be achieved by capillary electrophoresis
with time-of-flight mass spectrometry (Ongay and Neusüss, 2010).

Chapter 2- Protein Binding 26
Polymorphism with AGP is due to a 22 amino acid difference existing between the
variants. (Eap CB and Baumann P, 1989, Fournier T et al., 2000). The three genes:
responsible AGP-A, AGP-B and AGP-B’ are located on chromosome 9. AGP-A
(also known as ORM1) encodes for the major component of serum AGP, AGP-B
and AGP-B’ (also known as ORM2) are identical and expressed 100-fold less than
AGP-A and code for the variant of AGP (Dente et al., 1988).
Due to multiple allelic forms of the genes, there are 70-80 genetic variants of AGP
in humans (Eap CB and Baumann P, 1989). The three main AGP variants are
designated F1, S and A; based on their electrophoretic migration. In humans there
are three main phenotypes, F1S/A, F1/A and S/A with respective frequencies of
50%, 35% and 15%. Although the majority of AGP ligands are not variant
selective, some drugs exhibit preferential binding to the ‘A’ (e.g. disopyramide,
methadone, amitriptyline) or ‘F1/S’ (e.g. warfarin, dipyridamole) variants (Hervé F
et al., 1998). The relative abundance in commercial pooled AGP is reported to be
≈40, ≈30, and ≈30% for the F1, S and A variants respectively (Hervé et al., 1998).
2.2.6 Biological Functions of Alpha-1-Acid Glycoprotein
The pharmacological role of AGP is still under investigation but it has been
suggested that AGP is probably the only high affinity carrier for basic drugs in the
serum (Kremer et al., 1988). Additionally, AGP is considered as a natural anti-
inflammatory and immunomodulatory agent (Williams et al., 1997). It also
stimulates the secretion of tumour necrosis factor (TNF) from mononuclear cells
and macrophages (Su et al., 1999) and provides protection against the toxic effect of
TNF (Libert C, 1997).

Chapter 2- Protein Binding 27
The anti-neutrophil and anti-complement activity that has been reported is
supported by in vitro and in vivo studies which show that AGP inhibits neutrophil
activation (Vasson et al., 1994), increases the secretion of interleukin-1 inhibitor
from macrophages (Bories et al., 1990) and modulates LPS-induced cytokine
secretion by monocytes-macrophages (Boutten et al., 1992). This
immunomodulation by AGP has been hypothesised to be a major problem in
cancer patients because an impaired immune defence against the tumour may result
in, and predispose to infections, and hinder immunotherapy treatment (Fournier et
al., 2000, Tamura et al., 1981).
In the endothelial cells, AGP is an important component of the capillary barrier,
which is essential for capillary charge selectivity (Sörensson et al., 1999). Other
functions which are more likely to only be important under pathological conditions
include the ability to bind toxic lectins (Frantz M et al., 2000), endotoxins and
bacterial lipopolysaccharides (Moore D et al., 1997).
AGP has also been shown to inhibit the attachment of Mycoplasma pneumonia to
alveolar macrophages (Athamna A et al., 1996), and of human immunodeficiency
virus type-1 envelope glycoprotein in CD4+ monocytic cells and macrophages
(Rabehi L et al., 1995). AGP also inhibits rotavirus replication by directly acting on
the virus due to the negative charge of the AGP (Superti et al., 1993). High levels of
AGP have been associated with the development of gallstones (Thijs et al., 1999).

Chapter 2- Protein Binding 28
2.2.7 Binding Properties of Alpha-1-Acid Glycoprotein
AGP mainly binds basic and neutral compounds. Both from endogenous origins,
including IgG3, heparin, serotonin (Schmid et al., 1973a), platelet activating factor
(McNamara et al., 1986), melatonin (Morin et al., 1997) and histamine (ChachajW
et al., 1980) and exogenous origins, including tamoxifen (Schmid K et al., 1973,
Schmid et al., 1973a) and propranolol (Albani et al., 1984).
Disopyramide was the first drug described to bind to AGP (Kopitar and
Weisenberger, 1971), to date over 300 drugs are known to bind to this protein. For
some drugs, including cocaine and the protease inhibitors for HIV treatment, AGP
is the major binding protein (Israili Z and Dayton P, 2001). AGP is also the major
binding protein for steroids, including synthetic steroids such as RU486 (Grimaldi
et al., 1989).
It is generally assumed that acidic drugs bind to HSA, but with the increase in AGP
levels under certain physiological conditions (section 2.2.4) and/or when the HSA
levels decrease (seen with liver failure), phenobarbital, an acidic drug will bind to
AGP (Schley and Müller-Oerlinghausen, 1983). Additionally warfarin, which
usually binds to HSA, has been shown to bind to AGP (Hervé et al., 1998).
Many groups have investigated the number and nature of binding sites on AGP.
Initially it was proposed that AGP possessed one binding site located in the
hydrophobic area of the protein (Müller, 1989), but seven binding sites with varying
capacities and affinities have been described.

Chapter 2- Protein Binding 29
Whilst several binding sites have been characterised, it has been proposed, based on
fluorescent probe and circular dichroism studies, that the binding sites significantly
overlap and are influenced by each other (Maruyama et al., 1990), hence AGP is
often referred to as having one wide and flexible binding area.
The binding of drugs to AGP has been mostly shown to be hydrophobic, though
electrostatic interactions have also been reported, additionally an increase in the pH
will increase binding (Ponganis and Stanski, 1985). In the case of basic drugs,
stereoselective binding is also important.
2.2.8 Known Interactions Involving Alpha-1-Acid Glycoprotein
A clinically significant drug-interaction can occur with rifampicin which is 80%
bound to AGP (Johnson and Smith, 2006) and used to treat Mycobacterium
tuberculosis. If displaced by a competing ligand the metabolism of rifampicin will be
increased, thus decreasing the therapeutic levels of the antibiotic, leading to
therapeutic failure.
2.2.8.1 Known Interaction with Complementary Products
As the levels of AGP are increased in chronic conditions including cancer, HIV and
chronic inflammation the potential for significant interactions with complementary
products is also increased. Use of complementary products amongst this patient
group is extremely high with over 60% of cancer patients using herbal products
(Richardson et al., 2000).

Chapter 2- Protein Binding 30
This potential for interactions is significant as chemotherapeutic drugs including
tamoxifen (Paterson et al., 2003) and vinblastine (Steele et al., 1982) and the HIV
anti-protease drugs saquinavir, indinavir, ritonavir and nelfinavir (Schön et al.,
2003) all bind predominantly to AGP.
To date there are only very limited studies with complementary products and their
ability to bind to AGP. The need for rapid and reliable testing for the potential of
complementary products to bind and displace previously bound drugs from AGP is
demonstrated by the increased risk of concurrent use with important therapeutic
agents that bind to AGP, in particular those with a narrow therapeutic index.
2.3 Clinical Relevance of Displacement Interactions
Plasma protein binding and its impact on the in vivo efficacy of a drug is an
ongoing area of research in pharmacokinetics. Many of the techniques that
determine protein binding do so in an attempt to measure the amount of free drug.
This is because of the accepted dogma that it is the free drug concentration in the
plasma is responsible for the pharmacological activity. This is because it is the free
drug that is available to passively partition into the site of action and interact with a
molecular target. This concept is reflected by the pair of equilibrium equations
given below:

Chapter 2- Protein Binding 31
Where D is the free drug, PP are plasma proteins, DPP is drug bound to plasma
proteins, R is the molecular target at the site of action, and DR is the drug bound to
the target.
The concept of determining the free drug concentration has been proposed as
misleading as it is the amount of free drug at the therapeutic target that determines
the in vivo efficacy not the free drug in plasma (Smith et al., 2010). But generally
concentrations in plasma and target sites are assumed to be in equilibrium.
The first adverse clinical outcomes attributed to protein-binding displacement
interactions was the observation of an increase in prothrombin time in patients who
were concurrently taking phenylbutazone and warfarin (Rowland and Tozer, 2010,
Eisen, 1964). The hypoglycaemia observed in patients who were concurrently using
sulphonamides and tolbutamide has also been attributed to displacement
interactions (Christensen et al., 1963).
Whilst there are clearly clinically significant displacement interactions, it has been
suggested that the role of displacement interactions have been overstated and a
flowchart proposed to help determine which drugs are more likely to cause adverse
reactions (Figure 2-3) (Rolan, 1994).
D + R
D + PP DPP (in blood)
DR (at the site of action)

Chapter 2- Protein Binding 32
Figure 2-3: Flowchart for determining the clinical significance of potential protein
binding displacement interactions (Rolan, 1994).
The flowchart allows for the various scenarios that may arise when two drugs (A
and B) are concurrently administered. For example, if drug A, is displaced by drug
B, an increase in the free concentration of drug A results, but this increase in free
drug A may not correlate with an increase in drug A at the receptor site because it
will also be available for redistribution to the rest of the body, any increase in free A
following redistribution will also be available for elimination. For low clearance
drugs, where intrinsic clearance of free drug is the only determinant of mean
steady-state free drug concentration, free concentration for A will return to the pre-
B level.

Chapter 2- Protein Binding 33
Thus any increase in the pharmacological effect of A will be transient and cannot
be sustained. This flowchart also indicates that the interaction may become
significant if the transient increase in the free drug is for a drug with a narrow
therapeutic index.
Predicting if a clinically significant interaction will arise from in vitro data is further
complicated by the potential for drug metabolites to bind to plasma proteins and
potentially displace previous bound compounds. Binding of drug intermediates has
been shown for several drugs including zomepirac (Smith et al., 1990) and tolmetin
(Hyneck et al., 1988). These studies indicate that the parent compounds and the
intermediates may be the cause of an adverse interaction and both require
investigation.
2.4 Determination of Protein Binding
Protein binding is increasingly becoming important in the early stages of drug
development. Whilst there are many methods to study the binding of drugs to
proteins, each technique will depend on one of the following (Klotz, 1973):
Separation of free and protein-bound fraction of ligand;
Detection of a change in the physicochemical property of the complexed
ligand;
Detection of a change in a physicochemical behaviour of the binding
protein.

Chapter 2- Protein Binding 34
The techniques used to determine protein binding can be generally divided into
three main types: classical, chromatographic and spectrophotometric. Several of
these techniques are discussed in more detail below and summarised in Table 2-1.
When investigating protein binding, purified proteins or samples of serum and
plasma can be utilised. With the complex and undefined nature of complementary
products, utilising purified proteins allows for a more targeted investigation of the
key transport proteins (HSA and AGP) and specific study of the underlying cause
of a pharmacokinetic interaction. Studies with whole serum can be employed and
may provide additional information of binding to minor and variable proteins such
as gelatin-binding protein, insulin-like growth factor binding protein and retinol-
binding protein.
Assays with whole plasma often employ classical methods for the analysis of the
free or bound drug (section 2.4.1) which require the ability to measure the test
compound, a task which is often not possible with the unknown and variable
composition of complementary products.
2.4.1 Classical Methods
Classical methods including equilibrium dialysis, ultrafiltration and gel separation,
all involve the determination of the free or bound drug using a separation step.
These techniques are all based on the separation of the free drug from the bound
after equilibrium is reached. Therefore the common limitation of these techniques
occurs when the drug is tightly bound to the protein. The concentration of the free
drug should be, in these cases, very low, and therefore difficult to detect.

Chapter 2- Protein Binding 35
Additionally the results obtained differ for each of these methods, and whilst
experimental factors may be the cause of these differing results the technique may
be responsible. For example equilibrium dialysis indicated 23% plasma protein
binding for fleroxacin but 47% by ultra-filtration (Zlotos et al., 1998). This same
study also highlighted inter-laboratory variation with 20-40% for ciprofloxacin, 8-
30% for ofloxacin, norfloxacin, and 30-50% for enoxacin.
Whilst these classical methods may provide information relating to a compounds
ability to bind to albumin, they do not provide information relating to the specific
binding site, which in the case of drug-drug interactions is key. With regards to
complementary products these classical methods are limited in their use as these
complex mixtures are often unknown in their composition with multiple
components, therefore monitoring for “free drug” is not possible.
2.4.1.1 Equilibrium Dialysis
Equilibrium dialysis is based on the establishment of an equilibrium state between a
protein compartment and buffer compartment separated by a membrane, which is
permeable only for low-molecular weight ligands i.e., free or unbound drug.
Equilibrium dialysis is the preferred method to determine the free drug fraction and
is often the reference method where nonspecific binding of drug to the filtration
membrane and other surfaces causes experimental artefact (Lin et al., 1987).
Equilibrium dialysis is also amenable to high throughput screening (Kariv et al.,
2001).

Chapter 2- Protein Binding 36
The major advantage of this technique is that the drug binding to plasma proteins is
analysed at equilibrium, thus eliminating the effect of nonspecific binding. The
disadvantage is the volume shift between the matrix and the buffer can disturb the
equilibrium, though the addition of high molecular weight dextran can eliminate
the difference in osmotic pressure (Lima et al., 1983).
Equilibrium dialysis has many disadvantages including the time required for the
system to reach equilibrium (Kurz et al., 1977, Oracová et al., 1996, Bowers et al.,
1984), volume shifts (Huang, 1983), Donnan effects (which hinder the passage of
free ligand (Mapleson, 1987), nonspecific adsorption to dialysis apparatus (which is
more problematic for highly lipophilic drugs i.e. cyclosporine (Henricsson, 1987,
Fois and Ashley, 1991b, Fois and Ashley, 1991a), and difficulty in the control of
experimental parameters i.e. pH of the medium (Henry et al., 1981, Brørs et al.,
1984). Often the test compounds are radiolabeled, adding potential impurities to the
experimental set-up.
2.4.1.2 Ultrafiltration
Ultrafiltration with semi-permeable membranes produces a separation of the free
drug from macromolecules by employing a pressure gradient, which forces small
molecules through the membrane. The advantages of this technique include that
when compared to equilibrium dialysis the analysis time is shortened, and there is a
lack of dilution effects and volume shifts.

Chapter 2- Protein Binding 37
When ultrafiltration is combined with Raman difference spectroscopy this allows
for the label free detection and quantitation of protein-ligand binding, which yields
both thermodynamic and structural information and requires low amounts of
protein, approximately 10-100 μg (Xie et al., 2008).
Ultrafiltration, whilst quicker than dialysis, still requires the use of a labelled drug
and/or additional analysis steps to determine the actual level of free drug by
techniques such as immunoassay, gas chromatography or high-performance liquid
chromatography. With the unknown composition of complementary products,
ultrafiltration is not a suitable method to investigate protein binding.
2.4.1.3 Ultracentrifugation
This technique eliminates the problems associated with membrane effects seen in
equilibrium dialysis and ultrafiltration and enables the separation of the free and
protein bound fraction. Although there are discrepancies between the results
obtained for ultracentrifugation from equilibrium dialysis and ultrafiltration.
These discrepancies are most likely due to factors including sedimentation,
viscosity and floating lipoprotein fractions (Kurz et al., 1977, Külpmann et al.,
1984, Verbeeck and Cardinal, 1985, Barré et al., 1985).
2.4.1.4 Gel Filtration
Gel filtration is effective when separating bound drugs from unbound drugs when
the molecular mass of the complex is considerably larger than the free drug. The
technique was first used to measure the binding of bilirubin in neonates sera (Schiff
et al., 1972).

Chapter 2- Protein Binding 38
Gel filtration columns are selected so that the protein of interest and the protein-
ligand complex is in the mobile phase and the free ligand remains in the stationary
phase. This technique is time consuming and complex so it is not commonly
employed in laboratories.
However, gel filtration has been combined with radio ligand-binding assays to
allow for a 96-well plate method (Liu et al., 2002). This method can be used to
process a large number of samples but as it requires radiolabeling of the drug can
alter the binding data.
2.4.2 Chromatographic techniques
Chromatographic techniques in general are more sensitive and reproducible than
conventional techniques and are able to detect small differences in binding affinity
(Oracová et al., 1996). The major advantage of these techniques is that the ligand in
questions does not require labelling with fluorescent tags or radioactive material
and does not involve separation steps.
2.4.2.1 Affinity chromatography
Affinity chromatography combined with a protein stationary phase has many
advantages including precision and reproducibility, this method also allows for
enantioselective studies. Affinity chromatography is also useful in the investigation
of drug interactions involving protein binding. Zonal elution with a known
displacer at various concentrations can provide information on the ligand binding,
including if the binding is co-operative, anti-cooperative or non-cooperative (Ascoli
et al., 2006, Hage et al., 2009).
Chapter 2- Protein Binding 39
Unlike with HSA, binding studies with AGP are not reliable using affinity
chromatography. Experiments have shown no correlation between the retention of
compounds known to binds to AGP (Jewell et al., 1989) and the potential to
displace (S)-propranolol which is a high affinity binding marker. It has been
proposed that the high level of salicylic acid (section 2.2.4) is the reason for the lack
of correlation (Schill et al., 1986).
2.4.2.2 Capillary electrophoresis
Capillary electrophoresis including affinity capillary electrophoresis and capillary
affinity gel electrophoresis, have all been utilized for binding studies. Affinity
capillary electrophoresis can be used as a rapid screening method of ligand-protein
interaction and the evaluation of ligand-ligand interactions at the various binding
sites (Birnbaum and Nilsson, 1992, Chu et al., 1993, Li and Lloyd, 1993).
The major disadvantage of capillary electrophoresis in the low sensitivity, with
therapeutic concentration of drugs not being easily detected. Recent advances in
coupling capillary electrophoresis with micro-fluidics has shown promise in
particular with the detection of the binding of bilirubin to albumin in neonates (Sun
et al., 2010) but at this stage this technology is not scaled to a high through put
screening method.
2.4.3 Spectrophotometric Methods
Spectroscopic techniques have been used to study the interaction of drugs with
macromolecules (Chignell, 1973, Chignell, 1969).

Chapter 2- Protein Binding 40
These techniques, including nuclear magnetic and electron spin resonance, optical
rotary dispersion, circular dichroism and fluorescence all have the advantage over
classical methods (see section 2.4.1) as they do not require separation, Instead they
measure a change in the physical property of the drug and/or protein upon binding.
2.4.3.1 Circular dichroism
Circular dichroism (CD) spectroscopy measures the difference in absorbance of
right- and left-circularly polarized light producing characteristic bands- the Cotton
effect. CD is often employed to investigate the secondary and tertiary structure of
proteins but it can also be used in study of ligand-protein binding for both HSA and
AGP as binding of a ligand to the protein will alter the Cotton effect. The spectral
position, sign, shape, number and amplitude of the bands are used to determine the
nature of the binding site and the mechanism of binding (Zsila et al., 2002,
Beuckmann et al., 1999, Zsila et al., 2003).
Spectral data obtained from CD studies can be used to determine the binding
stoichiometry and the association constant as demonstrated with bilirubin (Siligardi
and Hussain, 1998, Knudsen et al., 1986). Competitive binding studies using CD
can only be conducted providing that the ligand being investigated has little or no
measurable CD absorption in the wavelength region of the induced CD spectrum.
The major limitation of CD for investigating protein binding is that UV inactive
compounds cannot be investigated directly by this method and that not all ligand
molecules with suitable chromophores give a measurable Cotton effect following
interactions with proteins (Zsila et al., 2004).

Chapter 2- Protein Binding 41
2.4.3.2 Fluorescent Probes
HSA has two fluorophores, tryptophan (Trp-214) and tyrosine (Tyr) (He and
Carter, 1992), whilst AGP has three (Trp-160, Trp-122 and Trp-25) (Schmid et al.,
1973b, Hof et al., 1986, Schmid et al., 1973a). These residues can act as intrinsic
fluorescence probes. If a ligand binds to the protein, there is a measurable decrease
in the intrinsic fluorescence, known as quenching.
Fluorescence was first used to study the binding of warfarin to HSA, using
enhancement of the warfarin fluorescence and the quenching of protein
fluorescence as measure of bound drug (Chignell, 1970). Whilst fluorescence
quenching is a rapid technique there are limitations that make this technique best
for early stage screening and not for the detection of drug interactions.
The information from these studies does not indicate the specific site of ligand
binding, only that binding occurs. As the binding site and the affinity are key in the
probability for a drug interaction, quenching studies are limited in their application
in drug binding and displacement studies. Additionally, interference from the
compound is also problematic as compounds that absorb light at the excitation
wavelength cause absorptive screening and if their absorption wavelengths are
towards the red spectrum (>300nm) they quench the intrinsic tryptophan
fluorescence (Epps et al., 1999).
By employing fluorescent probes as non-covalent competitive ligands for specific
binding sites on HSA and AGP, information regarding the environment, number
and affinity for each of the binding sites for a particular ligand can be determined.

Chapter 2- Protein Binding 42
Fluorescent probes may respond in nearly identical ways to a number of unrelated
phenomena (Chance and Radda, 1971). A decrease in probe fluorescence may
result from competitive displacement of the probe. Alternatively there may be non-
competitive displacement of the probe or a decrease in the quantum yield of the
bound probe as a result of ligand-induced conformational change in the protein.
Various fluorescent probes can be used in these displacement studies, for HSA:
dansyl amide for site I and, dansyl sarcosine and dansyl glycine for site II (Muller et
al., 1994) and coumarin derivatives (Goya et al., 1982). For AGP, auramine-O
(Sugiyama et al., 1985), 7,chloro-2-(p-diethylaminophenyl)-2H-benzotriazolyl-5-
amine (Narita et al., 1989) and 1-anilino-8-napthalene sulfonate (Johansen et al.,
1992), have all been successfully used.
The main disadvantage for fluorescence studies is that coloured and concentrated
protein solutions may cause difficulties. With probe displacement the main
disadvantage is that several experiments need to run in order to investigate the
ligand and its affinity for each of the binding sites, though this can be overcome
somewhat by using multi-well plate techniques to increase the through-put of the
assay.

43
Table 2-1: The key advantages and disadvantages of the common techniques to determine protein binding.
Classification Method Advantages Disadvantages
Classical
Equilibrium dialysis Amenable to high throughput screening.
Drug binding to plasma proteins is analysed at equilibrium,
eliminating the effect of nonspecific binding.
The volume shift between the matrix and the buffer can disturb the
equilibrium.
The system can take time to reach equilibrium and is affected by
volume shifts, Donnan effects, nonspecific adsorption to dialysis
apparatus.
Difficulty in the control of experimental parameters i.e. pH of the
medium.
Radio-labelling of the drug will also add potential impurities to the
experimental set-up.
Ultrafiltration Shorter analysis time than equilibrium dialysis and lack of
dilution effects and volume shifts.
When combined with Raman difference spectroscopy allows for
the label free detection and quantitation of binding.
Usually requires the use of a labeled drug and/or additional analysis
steps to determine the actual level of free drug.
Ultracentrifugation Eliminates problems associated with membrane effects of other
classical methods.
Discrepancies in data with other methods.
Gel filtration When combined with radio ligand-binding assay a 96-well plate
method can be utilised.
Time consuming and complex.
Radio-ligand labeling may alter binding parameters.

44
Classification Method Advantages Disadvantages
Chromatography
Affinity
chromatography
Precise and reproducible method that allows for enantioselective
studies.
Can indicate if the binding is co-operative, anti-cooperative or
non-cooperative.
Cannot be used to investigate AGP.
Capillary
electrophoresis
Can be used as a rapid screening method.
Can be coupled with micro-fluidics to increase sensitivity.
Low sensitivity.
Spectroscopy
Circular dichroism Can be used to determine the binding stoichiometry and the
association constant.
Cannot be used with ligands that have little or no measurable CD
absorption in the wavelength region of the induced CD spectrum of
the protein.
UV inactive compounds cannot be investigated directly.
Fluorescence Fluorescence quenching is a rapid technique.
Probe displacement can provide information on the environment,
number and affinity for each of the binding sites for a particular
ligand.
Probe displacement is amenable to high-throughput screening.
The main disadvantage for fluorescence studies is that coloured and
concentrated protein solutions cannot be used.
Fluorescence quenching does not indicate the specific site of ligand
binding; only that binding occurs.
Interference from the ligand is often problematic due to absorptive
screening.
With probe displacement several experiments need to run in order
to investigate the ligand and its affinity for each of the binding sites.

Chapter 2- Protein Binding 45
2.5 Aims of this project
The general aim of this study was to determine the potential for complementary
products to bind to albumin and alpha-1-acid glycoprotein, and determine the
potential for these products to displace previously bound drugs from the proteins.
Additionally the aim of this work was to use a rapid fluorometric method that can
be easily adapted to high-throughput screening. The specific aims included:
Establishing a standard extraction method that is easily reproducible.
Determination of the disassociation constants from albumin (binding site I
and II) for selected complementary products.
Determination of the disassociation constants from alpha-1-acid
glycoprotein for selected complementary products.

Chapter 2- Protein Binding 46
2.6 Materials and Methods
2.6.1 Chemicals
Albumin from human serum (HSA), dansyl amide (DA), dansyl sarcosine (DS),
phenylbutazone, ibuprofen, alpha-1-acid glycoprotein (AGP), quinaldine red (QR)
imipramine and chlorpromazine were all purchased from Sigma and were of the
highest quality available. Phosphate buffered saline (PBS) was prepared in house
and maintained at a pH of 7.4. Water was freshly prepared in-house with Milli-Q
equipment and was ultra-pure grade (18.2M). All other chemicals were from
Sigma Chemical Co. (St Louis, MO, USA) and were of the highest purity available.
2.6.2 Herbal Samples
Danshen was a generous gift from Assoc. Prof. Chun Guang Li, Chinese Medicine
Department, RMIT University, Melbourne, Australia. All other herbal products
were purchased from local suppliers in Victoria, Australia and were all of
commercial quality (Table 2-2). The methanolic and aqueous extraction method
was modified from Unger et al., (Unger and Frank, 2004).
In brief, tablets were crushed, the contents of capsules emptied, extractions were
either water or 80% methanol to allow for the aqueous and distinctly lipophilic
components to be separated. Solvent volumes were adjusted so that standardised
extracts at 100 mg of product/ml were obtained. This was based on the
manufacturers’ stated concentration of the active or principal agent. The extracts
were agitated in a shaking water bath at 37°C for 30 minutes then centrifuged at
2500 g for 10 minutes.

Chapter 2- Protein Binding 47
Standard extracts were diluted to final nominal concentrations of 0.1, 1 and 10
mg/ml. Methanol was evaporated to dryness under vacuum, the final volume of
methanol did not exceed 1% (v:v). Extracts were kept in the dark and the shelf life
set at 2 weeks.
2.6.3 Human Serum Albumin
2.6.3.1 Control Experiments
Stock solutions of human serum albumin (HSA) were prepared fresh on the day of
use in PBS. Stock solutions of dansyl amide (DA) and dansyl sarcosine (DS) were
prepared in methanol and PBS respectively. Immediately before use, stock solutions
were dissolved in PBS. To determine the dissociation constant (Kd) of dansyl amide
(DA) and dansyl sarcosine (DS) under our experimental conditions, the probes
were titrated against known concentrations of HSA and the fluorescence recorded
with a Perkin-Elmer Multi-label fluorometer with an excitation wavelength of
370nm and an emission wavelength of 475nm for DA and 350nm and 450nm for
DS. All experiments were conducted in 96-well plates maintained at 37°C. Kd
values were calculated using non-linear regression with one site hyperbolic binding.
Positive controls were run with each experiment, phenylbutazone and ibuprofen
were used as controls for sites I and II respectively. Stock solutions of
phenylbutazone and ibuprofen were prepared in DMSO and immediately before
use were diluted with PBS. The Kd was determined for both binding sites with both
controls. HSA was kept constant at 5 M and the fluorescence recorded with
increasing concentrations of the controls (0-1000 M).

Chapter 2- Protein Binding 48
The fluorescence was recorded with a Perkin-Elmer Multi-label fluorometer with an
excitation wavelength of 370nm and an excitation of 475nm for DA and 350 and
450nm for DS. All experiments were conducted using 96-well plates maintained at
37°C. Kd values were calculated using non-linear regression with one site hyperbolic
binding.
2.6.3.2 Displacement Studies
To ensure that the extracts did not cause significant changes in fluorescence in the
absence of protein, each extract was assayed with the buffer and probes without the
addition of HSA.
Displacement of the fluorescent probes dansyl amide (DA) and dansyl sarcosine
(DS) from site I and II respectively was determined for each of the extracts. The
final concentration of the fluorescent probes and the HSA was kept constant at 5
μM. The extract being investigated was added at various concentrations (0-2.5
mg/ml). Stock solutions were diluted with PBS to the required concentration.
Fluorescence was recorded with a Perkin-Elmer Multi-label fluorometer with an
excitation wavelength of 370nm and an excitation of 475nm for DA and 350nm
and 450nm for DS. All experiments were conducted using 96-well plates
maintained at 37°C. Kd values were calculated using non-linear regression with one
site hyperbolic binding.

Chapter 2- Protein Binding 49
2.6.4 Alpha 1-acid Glycoprotein Studies
2.6.4.1 Control Experiments
Stock solutions of alpha-1-acid glycoprotein (AGP) were prepared fresh on the day
of use in PBS. Stock solutions of quinaldine red (QR) were prepared in methanol
and immediately before use were diluted with PBS. To determine the dissociation
constant (Kd) for QR under our experimental conditions, the probe was titrated
against known concentrations of AGP and the fluorescence recorded with a Perkin-
Elmer Multi-label fluorometer with an excitation wavelength of 520nm and an
emission wavelength of 610nm. All experiments were conducted using 96-well
plates maintained at 37°C. Kd values were calculated using non-linear regression
with one site hyperbolic binding.
Imipramine and chlorpromazine were used as positive controls to investigate the
basic and acidic drug binding to AGP, though these binding pockets are known to
overlap (section 2.2.7). Stock solutions of imipramine and chlorpromazine were
prepared in methanol and immediately before use were diluted with PBS. AGP was
kept constant at 1 M and the fluorescence recorded with increasing concentrations
of the controls (0-1000 M). The fluorescence was recorded with a Perkin-Elmer
Multi-label fluorometer with an excitation wavelength of 520nm and an emission
wavelength of 610nm. All experiments were conducted using 96-well plates
maintained at 37°C. Kd values were determined using non-linear regression with
one site hyperbolic binding.

Chapter 2- Protein Binding 50
2.6.4.2 Displacement Studies
To ensure that the extracts did not cause significant changes in fluorescence in the
absence of protein, each extract was assayed with the buffer and probes without the
addition of AGP.
Displacement of the fluorescent probe quinaldine red (QR) was determined for each
of the extracts. The concentration of the AGP was kept at 1 M and the
concentration of QR was kept at 20 M. The extract being investigated was added
at various concentrations (0-2.5 mg/ml). Stock solutions were diluted with PBS to
the required concentration.
Fluorescence was recorded with a Perkin-Elmer Multi-label fluorometer with an
excitation wavelength of 520nm and emission wavelength 610nm. All experiments
were conducted using 96-well plates maintained at 37°C. Kd values were calculated
using non-linear regression with one site hyperbolic binding.
2.6.5 Data Analysis
All assays were conducted in triplicate on five separate occasions. Analysis was
conducted with Prism version 5.0. The dissociation constant (Kd) was determined
by non-linear regression using one site binding. All Kd vales reported are the
average Kd ± SEM.

51
Table 2-2: Complementary products used to screen for their potential to cause displacement interactions with human serum
albumin and alpha1-acid glycoprotein.
Product Principal/Active
Component
[Principal
component per
tablet/capsule]
Manufacturer Batch
number
Reported benefit/Use
Human serum albumin studies
Co-Enzyme
Q10
Ubidecarenone 50mg Heron 57122 Reduces heart damage caused by free radicals and
improves energy, stamina and endurance.
Danshen Tanshinone IIA 80mg * N/A Invigorates the blood to improve circulation. Treatment of
liver disease including cirrhosis and hepatitis.
Dong Quai Angelica polymorpha 520mg Nature’s
Sunshine
01240714 Enrich the blood to promote circulation, regulate
menstruation, calm nerves and sooth intestines.
Ginkgo Biloba Ginkgo flavonglycosides
Ginkgolides and Bilobalide
10.7mg
2.4mg
Herron 58751 Improve mental clarity and concentration. May also relieve
the symptoms of vertigo and tinnitus.
Goldenseal Hydrastis canadensis 500mg
Nature’s
Sunshine
01220333 Assist in the treatment of respiratory infections.
Alpha 1-acid glycoprotein studies
Astragalus Astragalus membranaceus 450mg Nature’s
Sunshine
0128172 Helps to support the body’s immune system and in used as
a “rejuvenating tonic”
Echinacea Echinacea purpurea 410mg Nature’s
Sunshine
0124471 Supports the immune defenses.
Ginkgo Biloba Ginkgo flavonglycosides
Ginkgolides and Bilobalide
10.7mg
2.4mg
Herron 56311 Helps to improve mental clarity and concentration and
improves long and short term working memory. May also
relieve the symptoms of vertigo and tinnitus.
Gotu Kola Centella asiatica 395mg Nature’s
Sunshine
01223293 Eases anxiety and mood disorders.
Valerian Valeriana officinalis 2250mg Bio-Organics 301338 Antispasmodic and muscle relaxant. Relieve nervous
tension, insomnia and anxiety.
*Product provided by the Chinese Medicine Research Group- RMIT University. Composition determined using HPLC (Li, Sheng et al. 2009).
N/A- not applicable

Chapter 2- Protein Binding 52
2.7 Results
2.7.1 Human Serum Albumin
2.7.1.1 Dissociation of Site Specific Probes
To determine the dissociation constant (Kd) of the site I and site II probes dansyl
amide (DA) and dansyl sarcosine (DS) under our experimental conditions, probes
were titrated against 5 µM of human serum albumin (HSA) and the fluorescence
recorded (Figure 2-4). Kd values were calculated using nonlinear regression with
one site hyperbolic binding (Table 2-3).
Figure 2-4: The relative fluorescence of human serum albumin (HSA) when bound
with the site specific probes dansyl amide (DA), site I and dansyl sarcosine (DS),
site II. Fluoresce recorded with an excitation wavelength of 370nm and an
excitation of 475nm for DA and 350nm and 450nm for DS. Each point represents
the mean of triplicate incubations for 5 replicate runs.
■ Dansyl amide ▲ Dansyl sarcosine

Chapter 2- Protein Binding 53
Table 2-3: Dissociation constant (Kd) µM determined for dansyl amide (DA) and
dansyl sarcosine (DS) binding to sites I and II on human serum albumin (HSA). Kd
values were calculated using non-linear regression with one site hyperbolic binding
(n = 5).
Dansyl amide (DA) Dansyl sarcosine (DS)
Site I 6.84 ±0.42 µM 159.22 ±8.2 µM
Site II 136.91 ±11.36 µM 6.04 ±0.92 µM
2.7.1.2 Disassociation of Site Specific Controls
Phenylbutazone and ibuprofen were used as positive controls for sites I and II
respectively. HSA (5 μM) was titrated against the controls (0-1000 μM)
(Figure 2-5). Kd values were determined using nonlinear regression with one site
hyperbolic binding (Table 2-4). Each incubation was run in triplicate on 5 separate
occasions.

Chapter 2- Protein Binding 54
Figure 2-5: % Dansyl amide (DA) and dansyl sarcosine (DS) displaced by
phenylbutazone and ibuprofen from human serum albumin (HSA). DA is a specific
probe for site I and DS for site II. Fluoresce recorded with an excitation wavelength
of 370nm and an emission wavelength of 475nm for DA and 350nm and 450nm for
DS. Each point represents the mean of triplicate incubations for 5 replicate runs ±
SEM.
■ DA and Phenylbutazone ▲ DS and Phenylbutazone
DA and Ibuprofen ◆ DS and Ibuprofen
Table 2-4: Dissociation constant (Kd) µM determined for sites I and II on human
serum albumin for phenylbutazone and ibuprofen. Kd values were calculated using
non-linear regression with one site hyperbolic binding (n = 5).
Phenylbutazone (µM) Ibuprofen (µM)
Site I 6.06 ±0.36 1222 ±96.2
Site II 102.5 ±11.36 8.35 ±0.41

Chapter 2- Protein Binding 55
2.7.1.3 Displacement Studies with Complementary Products
Displacement of the site-specific probes was investigated in the presence of the
complementary product extracts. The total displacement of the probes is shown in
Figure 2-6 and Figure 2-7. The Kd was determined for each of the investigated
products and is shown in Table 2-5.
No changes in fluorescence were seen when the extracts were incubated with the
buffer and site specific probes in the absence of HSA.

Chapter 2- Protein Binding 56
a)
b)
Figure 2-6: Displacement of the site I probe dansyl amide (DA) from human serum
albumin (HSA) for each of the products (a) the aqueous extracts, and (b) the
methanolic extracts. Fluoresce recorded with an excitation wavelength of 370nm
and an emission wavelength of 475nm. Data points represent the mean of triplicate
incubations for 5 replicate runs ± SEM.
■ CoEnzyme Q10 ▲ Danshen Dong Quai ◆ Ginkgo Biloba ● Goldenseal

Chapter 2- Protein Binding 57
a)
b)
Figure 2-7: Displacement of the site II probe dansyl sarcosine (DS) from human
serum albumin (HSA) for each of the products (a) the aqueous extracts, and (b) the
methanolic extracts. Fluoresce recorded with an excitation wavelength of 350nm
and an emission wavelength of 450nm Data points represent the mean of triplicate
incubations for 5 replicate runs ± SEM.
■ CoEnzyme Q10 ▲ Danshen Dong Quai ◆ Ginkgo Biloba ● Goldenseal

Chapter 2- Protein Binding 58
Table 2-5: Kd in mg/ml for each of the products investigated as determined by non-
linear regression for site I and II on human serum albumin (HSA). Kd values were
calculated using non-linear regression with one site hyperbolic binding from the
mean of 5 independent experiments ± SEM.
Site I Site II
Aq Meth Aq Meth
CoEnzyme Q10 * 4.4 ±0.30# 0.76 ±0.04 0.08 ±0.01
Danshen 1.73 ±0.06 7.39 ±0.42 3.15 ±0.30# 0.28 ±0.02
Dong Quai 21.27 ±2.56# 1.02 ±0.08 33.41 ±4.50# 13.36 ±1.09#
Ginkgo Biloba 14.43 ±1.37# * 1.07 ±0.03 0.35 ±0.02
Goldenseal 5.78 ±0.25# 0.60 ±0.06 1.69 ±0.06 0.31 ±0.02
Aq- Aqueous extract.
Meth- Methanolic extract.
# Kd determined was greater than the concentrations investigated.
* Kd not determined.

Chapter 2- Protein Binding 59
2.7.2 Alpha-1-Acid Glycoprotein
2.7.2.1 Disassociation of Site Specific Probe
To determine the dissociation constant (Kd) of the probe quinaldine red (QR) under
our experimental conditions, QR was titrated against 1µM of alpha-1-acid
glycoprotein (AGP) and the fluorescence recorded (Figure 2-8). The Kd value was
calculated using nonlinear regression with one site hyperbolic binding and
determined to be 3.3 ±0.43 µM.
Figure 2-8: The relative fluorescence (RFU) of alpha-1-acid glycoprotein (AGP)
when bound with the probe quinaldine red (QR). Fluorescence recorded with an
excitation wavelength of 520nm and an emission wavelength of 610nm. Data
points represent the mean of triplicate incubations for 5 replicate runs ± SEM.
2.7.2.2 Disassociation of Site Specific Control
Imipramine and chlorpromazine were used as positive controls to investigate the
basic and acidic drug binding to AGP. AGP (1 μM) was titrated against the
controls (0-1000 μM). Kd values were determined using nonlinear regression with
one site hyperbolic binding.

Chapter 2- Protein Binding 60
Under our experimental conditions the Kd for imipramine and chlorpromazine was
determined to be 10.22 ± 0.78 and 2.7 ± 0.35 µM, respectively. Each incubation
was run in triplicate on 5 separate occasions.
Figure 2-9: % Quinaldine red (QR) displaced by imipramine and chlorpromazine
from alpha-1-acid glycoprotein (AGP). Fluorescence recorded with an excitation
wavelength of 520nm and an emission wavelength of 610nm. Data points represent
the mean of triplicate incubations for 5 replicate runs ± SEM.
■ Imipramine ▲ Chlorpromazine
2.7.2.3 Displacement Studies with CAMs
Displacement of the probe (QR) was investigated in the presence of the
complementary product extracts. The total displacement of the probes is shown in
Figure 2-10. The Kd was determined for each of the investigated products and is
shown in Table 2-6.
No changes in fluorescence were seen when the extracts were incubated with the
buffer and probe in the absence of AGP.

Chapter 2- Protein Binding 61
a)
b)
Figure 2-10: Displacement of the probe quinaldine red (QR) bound to alpha-1-acid
glycoprotein (AGP) for (a) the aqueous extracts, and (b) the methanolic extracts.
Fluorescence recorded with an excitation wavelength of 520nm and an emission
wavelength of 610nm. Data points represent the mean of triplicate incubations for 5
replicate runs ± SEM.
■ Astragalus ◆ Echinacea Ginkgo Biloba ▲ Gotu Kola ● Valerian

Chapter 2- Protein Binding 62
Table 2-6: Kd in mg/ml for each of the products investigated for alpha-1-acid
glycoprotein as determined by non-linear regression. Kd values were calculated
using non-linear regression with one site hyperbolic binding from the mean of 5
independent experiments ± SEM.
Aq Meth
Astragalus 1904 ±671.4# 116.6 ±15.62#
Echinacea 16.92 ±1.2# 1.007 ±0.14
Ginkgo Biloba 12.09 ±0.6# 2.043 ±0.17
Gotu Kola 50.14 ±3.97# 19.22 ±0.72#
Valerian 7.69 ±0.2# 1.35 ±0.21
Aq- Aqueous extract.
Meth- Methanolic extract.
# Kd determined was greater than the concentrations investigated.

Chapter 2- Protein Binding 63
2.8 Discussion
2.8.1 Product Selection
The products selected for these investigations were based on the potential for
concurrent use with therapeutic agents that are known to bind to albumin or alpha-
1-acid glycoprotein, based on the traditional claimed therapeutic benefit.
In addition to the therapeutic claims overlapping with the conventional medicine,
products were selected if the scientific literature indicated that there may be an
interaction, i.e. Dong Quai, which has been suspected of interacting with the highly
protein bound warfarin (Table 2-2).
2.8.2 Selection of Method to Screen CAMs
Each method for determining protein binding has its own advantages and
disadvantages (Table 2-1). With so many products on the market and very little
information regarding these products there is a need for a rapid and reproducible
method to screen for protein binding and potential drug interactions due to
displacement of previously bound drugs. As the composition of complementary
products is often unknown and widely variable traditional methods such as
equilibrium dialysis, are not suitable.
Probe displacement studies can provide information for the key binding sites on
both HSA and AGP and can be scaled to a high-throughput method. These studies
are also rapid and cost efficient.

Chapter 2- Protein Binding 64
The potential for interference by the products at the excitation and emission
wavelengths must be taken into consideration but can be determined by assaying
the products with the buffer and probes without the addition of the protein.
Spectroscopy techniques have been shown to have good correlation with separation
methods (Sugiyama et al., 1985, Baumann and Eap, 1988, Rahman et al., 1993),
though this is mainly for high-affinity binding sites; with low affinity interactions
the sensitivity decreases. Whilst there is a risk that low affinity reactions may not be
identified in these studies, it is far more likely that high affinity binding will be
involved in adverse interactions and therefore are the important to identify
(Figure 2-3).
2.8.3 General Discussion
Previous investigations into the ability for complementary products to displace
bound drugs from human serum albumin (HSA) and alpha-1-acid glycoprotein
(AGP) are very limited. This study utilises a rapid fluorometric method to
investigate the potential for these products to bind to plasma proteins and
potentially displace previously bound drugs.
Investigations into protein binding should be conducted with human protein as
species differences in binding properties are known (Benke et al., 2009, Brown et
al., 1979, Son et al., 1998). Parameters including temperature and pH need to be
controlled as small changes can alter protein binding, increasing the free-fraction of
drugs (Christensen, 1989, Kodama et al., 2001).

Chapter 2- Protein Binding 65
The concentration of the protein used may alter the results obtained in these
studies, in order to relate the in vitro data more closely to the in vivo situation the
concentration of protein was set at physiological levels, 5μM for HSA and 1μM for
AGP.
Studying complementary products provides many challenges including the variable
composition and effect of the extraction method selected. Our choice was made on
the basis of the relevance of the extract to the patient use of the product. As these
products are generally administered as tablets or infusions (‘teas’), aqueous and
alcohol (methanol) extracts were prepared for these studies. Methanol was selected
to extract the distinctly more lipid soluble components.
2.8.4 Displacement Studies- Human Serum Albumin
2.8.4.1 Site Specific Probe Binding
To confirm that the probes, dansyl amide (DA) and dansyl sarcosine (DS) were site
specific they were titrated with HSA under our experimental conditions. Kd values
were determined using non-linear regression with one site hyperbolic binding. For
site I the Kd for DA and DS was 6.84 ± 0.42 and 159.22 ± 8.2 µM respectively, and
for site II 136.91 ± 11.36 and 6.04 ± 0.92 µM respectively (Table 2-3).
This data is in line with previous studies. The Kd for DA at site I was previously
determined to be 5.6-7.5 µM and 6-6.06 µM for DS at site II (Sudlow et al., 1975,
Epps et al., 1995). The specificity of the probe binding is confirmed by the high Kd
for DA at site II (136.91 ±11.36 µM and for DS at site I (159.22 ±8.2 µM).

Chapter 2- Protein Binding 66
2.8.4.2 Site Specific Positive Controls
Phenylbutazone and ibuprofen were used as positive controls for sites I and II
respectively (Figure 2-5). Kd values were determined using non-linear regression
with one site hyperbolic binding. Kd values were determined to be 6.06 ±0.36 µM
and 8.35 ±0.41 µM, for phenylbutazone and ibuprofen respectively (Table 2-4). The
values are in line with previously reported data.
Previous studies of phenylbutazone for site I have reported Kd values of 1.9±0.3 µM
(Epps et al., 1995) and 8.4 ±1.7 µM (Parikh et al., 2000). For ibuprofen the Kd has
been previously determined as 2.7 ±1.2 µM (Epps et al., 1995) and 11.6 µM
(Wanwimolruk et al., 1983). The specificity of the probes is confirmed with the
high Kd values for phenylbutazone at site II and ibuprofen at site I, 102.5 ±11.36
and 1222 ±96.2 µM respectively.
2.8.5 Displacement Studies with Complementary Products
Whilst site I is referred to as the more flexible binding site on HSA, in general,
displacement from site II was more significant in our experiments. For 6 of the
extracts a Kd < 1mg/ml for site II was determined. Whilst only one extract (the
methanolic extract of Goldenseal) had a Kd <1 mg/ml for site I (Table 2-5). The
lowest Kd was for the methanolic extract of CoEnzyme Q10 at site II with a value
of 0.08 ±0.01 mg/ml.
It is known that alkaloids bind to site II (Zhang et al., 2011) and that many plant
and herbal products contain alkaloids, which may account for the more significant
binding at this site.

Chapter 2- Protein Binding 67
In general the methanolic extracts caused more displacement of the bound probes
than the aqueous extracts. The alkaloids that are the most likely cause of the
binding would be present in the methanolic rather than the aqueous extracts.
2.8.5.1 CoEnzyme Q10
CoEnzyme Q10, also known as ubiquinone, is proposed as treatment for heart
failure and to lower blood pressure. CoEnzyme Q10 is the only lipid soluble
antioxidant synthesised endogenously and is present in all cellular membranes. It
plays a role in cellular metabolism, acting as an electron carrier and also protects
membranes and lipoproteins from protein oxidation and lipid peroxidation (Villalba
et al., 2010, Crane, 2001, Stocker et al., 1991).
Plasma CoEnzyme Q10 levels range from 0.40-1.91 µmol/L (Bhagavan and
Chopra, 2006). It is estimated that the daily dietary intake is 3-5 mg per day, and
that diet supplementation does not increase tissue levels above this point of
saturation (Crane, 2001, Beal, 1999, Weber et al., 1997). Despite this, concern for
drug interactions involving CoEnzyme Q10 exist as this product is often consumed
by patients diagnosed with conditions including Parkinson’s and cardiovascular
disease. Entacapone and clofibrate (and other fibrates) used in the treatment of
Parkinson’s and high cholesterol respectively are bound to HSA. Entacapone is
>98% bound to human serum albumin (Casarett et al., 2008) and the fibrates are
>80% bound to albumin (Miller and Spence, 1998).

Chapter 2- Protein Binding 68
Previous in vivo studies have shown no interaction between CoEnzyme Q10 and
warfarin (Gage and Milligan, 2005), whilst binding to site I of albumin (the binding
site of warfarin) was determined, the Kd was high, 4.4 ±0.30 mg/ml, and therefore
not clinically likely to occur. This highlights the importance of correct extrapolation
of in vitro data to the in vivo situation when the potential for drug interactions are
being investigated.
In vitro studies using human blood have shown that quercetin a flavonol found in
Coenzyme Q10 binds to albumin (Kaldas et al., 2005). This binding is thought to be
most likely at site II. These experiments determined, binding to site II was more
significant for the methanolic extract (Kd 0.08 ±0.01 mg/ml) than the aqueous
extract (Kd 0.76 ±0.04) (Table 2-5). This data supports the conclusion that the
flavonols including quercetin are responsible for the binding seen as the flavonols
are best extracted in the methanolic solvent.
2.8.5.2 Danshen
Danshen (Salvia miltiorrhzia) is of concern with regards to herb-drug interactions as
it is used traditionally as a ‘blood thinning’ herb and therefore the potential for
concurrent use of this product with anti-coagulant therapy such as warfarin (a
coumarin derivative that is bound to site I on albumin) is significant, additionally
Danshen is known to be 50-70% bound to albumin (Liu et al., 2008).
Dialysis studies into components of Danshen have demonstrated binding to
albumin, though this work was conducted with bovine albumin which has only a
76% sequenced identity with human albumin (Peters, 1985).

Chapter 2- Protein Binding 69
Using dialysis sampling coupled with high-performance liquid chromatography,
danshensu (a component of Danshen) was shown to have a strong association with
bovine albumin (9.68 ±1.23*103 K/L mol-1) (Wang et al., 2011).
Previous studies have shown that the interaction between Danshen and warfarin is
due to tanshonine II sulfonate, a component of Danshen, displacing warfarin from
its binding site on albumin (Liu et al., 2008). Danshen is also known to displace
salicylate from HSA (Gupta et al., 2002). In this study, the displacement of
salicylate by Danshen was increased at the higher concentrations of salicylate.
Whilst salicylates bind to site I, at the higher concentrations investigated in this
study salicylate would be bound to site I and II on albumin. This displacement of
salicylate being more significant at the higher concentrations can be explained by
the binding of Danshen to site II.
These experiments concluded that Danshen is able to bind to both sites I and II on
albumin, though there was more significant displacement with the site II probe. In
particular the methanolic extract produced significant displacement with a Kd of
0.28 ±0.02 mg/ml. Displacement of dansyl amide, the probe for site I did occur in
our studies with Danshen (Figure 2-7) but the Kd values were high, 1.73 ±0.06 and
7.39 ±0.42 mg/ml for the aqueous and methanolic extracts respectively.
2.8.5.3 Dong Quai
Dong Quai (Angelica sinensis) is reported to be beneficial in the treatment of
menopause, in particular in easing the symptoms of hot flushes.

Chapter 2- Protein Binding 70
It is known to contain coumarin (Zhao et al., 2003) and has been suspected of being
involved in adverse interactions based on pharmacodynamics with warfarin (Hu et
al., 2005).
The methanolic extract of Dong Quai bound to site I on albumin with a Kd of 1.02
±0.08 mg/ml, whilst this is the most significant Kd determined for Dong Quai in
our studies, it may not be at a level to be clinically significant. As can be seen in
Figure 2-6, at the highest investigated concentration of the methanolic extract of
Dong Quai, 65% of the probe was displaced from its binding site, at 1mg/ml 50%
of the probe was still bound to site I.
As with Danshen and Ginkgo Biloba the pharmacodynamic interaction between
Dong Quai and warfarin may be of greater clinical significance than the
pharmacokinetic interaction. That is the coumarins potentiate the effect of the
warfarin.
2.8.5.4 Ginkgo Biloba
Ginkgo Biloba is known to contain flavonoids, glycosides and terpenoids
(ginkgolides, bilobaldides). It has been suspected of clinical interactions with
warfarin due to its anti-platelet activity (Diamond et al., 2000). However, a
randomized, single-dose crossover study found no significant alteration of the
pharmacokinetic or pharmacodynamic profile of ticlopidine (an antiplatelet agent)
with a single administration of Ginkgo Biloba (Kim et al., 2010).

Chapter 2- Protein Binding 71
The Kd determined for the binding at site I for the aqueous extract was above the
range investigated and could not be determined for the methanolic extract. The
displacement that occurred with the site II probe is not likely to cause a clinically
significant interaction. Ginkgo Biloba is claimed to have a therapeutic benefit in the
treatment of dementia and Alzheimer’s disease and as such it may be taken
concurrently with medications for these conditions including galantamine and
rivastigmine which are both alkaloids likely to bind to site II on albumin, but the
binding of these agents to albumin is relatively low therefore reducing the
likelihood of a clinically significant interaction.
2.8.5.5 Goldenseal
Goldenseal (Hydrastis canadensis) contains several isoquinalone alkaloids including
berberine and hydrastine (Douglas et al., 2010). Isoquinalone alkaloids are known
to bind to site II of albumin (Khan et al., 2012, Cheng et al., 2009). Both the
aqueous and methanolic extracts were able to displace dansyl sarcosine, the site II
probe with Kd values of 1.07 ±0.03 and 0.35±0.02 mg/ml respectively (Table 2-5).
Goldenseal is claimed to be useful in the treatment of respiratory infections. A
potential interaction can arise with the concurrent use of penicillin’s, which also
bind to site II. This interaction would increase the plasma concentration of the
penicillin potentially increasing the occurrence and severity of adverse effects
including hypersensitivity, nausea and neurotoxicity in patients susceptible to these
side effects. However, clinically inhibition of renal extraction of penicillin is more
likely to be the cause of adverse drug interactions.

Chapter 2- Protein Binding 72
2.9 Displacement Studies- Alpha-1-Acid Glycoprotein
2.9.1 Site Specific Probe Binding
Quinaldine red (QR) is known to bind to AGP, under our experimental conditions
the Kd, determined using non-linear regression with one site hyperbolic binding,
was 3.3 ±0.43 µM (Figure 2-8). Previous studies have demonstrated variability in
the Kd for QR with AGP with figures ranging from 1.3 µM (Imamura et al., 1994)
to 40 µM (Hazai et al., 2006). The differences in these values can be explained by
the experimental conditions. All experiments were conducted in this study were at
37°C, whilst the other studies were conducted at 23°C and room temperature
respectively, temperature is known to alter the binding properties of proteins
(Kodama et al., 2001, Christensen, 1989).
2.9.2 Site Specific Positive Controls
Imipramine and chlorpromazine were used as positive controls. Imipramine is a
basic tricyclic drug that is known to bind to AGP (Kremer et al., 1988) but with
lower affinity to the F1/S variant (Hervé et al., 1993) whilst chlorpromazine has a
preference for the A variant (Hervé et al., 1996).
In line with previous reported data, Kd for imipramine and chlorpromazine was
determined to be 10.22 ±0.78 and 2.7 ±0.35 µM, respectively, under our
experimental conditions. Imipramine has been reported to have a Kd of 2.23 - 11.4
µM (Zsila and Iwao, 2007, van der Sluijs and Meijer, 1985) and chlorpromazine a
Kd of 2.32, 2.6 and 2.8 µM (Fitos et al., 2010, Berry et al., 2009, Matsumoto et al.,
2002).

Chapter 2- Protein Binding 73
2.10 Displacement Studies with Complementary Products
Investigations into the displacement of previously bound drugs from alpha-1-acid
glycoprotein (AGP) are very limited, even more limited are published reports
involving the interaction between complementary products with AGP. This is the
first study to combine dye displacement method with AGP interactions for
complementary products.
As with the investigations into displacement by complementary products from
albumin, more significant displacement was seen with the methanolic extracts than
the aqueous extracts (Table 2-6).
2.10.1 Astragalus
Astragalus (Astragalus membranaceus) is native to the temperate regions of the
Northern Hemisphere. Previous studies with Astragalus have focused on the
potential for treatment of type II diabetes and its cardio-protective effects.
Astragaloside IV, a saponin isolated from the Astragalus membranaceus plant is
proposed to improve the sarcoplasmic reticulum Ca2+ pump function in myocardial
injury (Xu et al., 2007). Pharmacokinetic studies using rat and dog plasma
demonstrated that astragaloside IV is 83% bound to plasma protein (Zhang et al.,
2006), though the specific plasma protein was not identified.
The experiments conducted have shown no significant binding to AGP for the
aqueous or methanolic extract of Astragalus (Figure 2-10). Therefore the binding to
plasma protein by astragaloside IV is most likely to a different plasma protein,
potentially albumin.

Chapter 2- Protein Binding 74
Though it should be noted that the study that determined binding to protein did so
in animal models and not human.
2.10.2 Echinacea
Echinacea (Echinacea purpurea) is a genus of flowering plants belonging to the
Asteraceae family. There are nine members of the species, all endemic to North
America but Echinacea purpurea is most commonly used in complementary and
alternative products. Echinacea has gained popularity as it is report to support and
boost the immune system. This is of concern as several antibiotics and drugs used
in the treatment of HIV/AIDS also bind to AGP including rifampicin (Johnson
and Smith, 2006) and the protease inhibitors (Schön et al., 2003). Additionally
levels of AGP increase in patients with tuberculosis (Ebersole and Cappelli, 2000)
and HIV/AIDS (Kremer et al., 1988).
Most significantly, interactions with HIV/AIDS medication via displacement of the
bound drug to AGP can reduce the therapeutic efficacy of the treatment,
contributing to the emergence of drug resistant viral strains (Finzi et al., 1997,
Williams and Sinko, 1999).
The most significant displacement of QR for the investigated extracts occurred with
the methanolic extract of Echinacea (Kd = 1.01 ±0.14 mg/ml). The aqueous extract
did not cause significant displacement (Kd = 16.92 ±1.18 mg/ml) (Figure 2-10).
This displacement highlights the need to prioritise further investigations into
Echinacea in the context of drug interactions.

Chapter 2- Protein Binding 75
2.10.3 Ginkgo Biloba
As Ginkgo Biloba is used to aid in the treatment of memory loss it has gained
popularity and is now one of the most commonly used herbal products (Xue et al.,
2007, Eisenberg et al., 1998). Ginkgo has predominantly been investigated for its
interaction with the cytochrome P450 enzymes and for its increased anti-coagulant
effect, most likely due to the coumarin in the product, when combined with
warfarin (Izzo, 2004, Matthews, 1998).
The experiments conducted did not show significant displacement of QR with the
aqueous extract (Kd 12.09 ±0.56 mg/ml) or the methanolic extract (Kd 2.04 ±0.17
mg/ml). Whilst this is the first study to investigate the binding of Ginkgo Biloba to
AGP, Chen et al., determined the binding of ginkgolide B (a major component of
Ginkgo Biloba) to human plasma to be 17.99-21.49% using equilibrium dialysis
(Chen et al., 2007). These limited studies suggest that protein binding is not likely
to be a cause of adverse interactions with Ginkgo Biloba.
2.10.4 Gotu Kola
Gotu Kola (Centella asiatica) is a small plant native to several countries including
India, Sri Lanka, Indonesia and Iran. It is recommended in the treatment of
bacteria and viral infections and also for any inflammatory conditions. As with
Echinacea, there is an increased risk of concurrent use with antibiotics and antiviral
drugs that are known to bind to AGP.

Chapter 2- Protein Binding 76
No significant displacement of QR was detected with the aqueous (Kd = 50.14
±3.97 mg/ml) or methanolic (Kd = 19.22 ±2.73 mg/ml) extracts, therefore these
studies indicate that displacement of drugs bound to AGP is not likely to occur with
Gotu Kola. This negative finding is important as Gotu Kola is used in the treatment
of anxiety and depression and therefore may be concurrently used with anti-anxiety
medication that is known to bind with high affinity to AGP including
chlorpromazine (90% bound with affinity constants (Ka) of 3.4*105-3.9*106)
(Verbeeck and Cardinal, 1985, Piafsky et al., 1978, Wright et al., 1988) and
diazepam (60% bound with affinity constants (Ka) of 4*104-2.5*105) (Schley and
Müller-Oerlinghausen, 1983, Muruyama et al., 1992).
2.10.5 Valerian
Valerian (Valeriana officinalis) is native to Europe and Asia, and is used as a muscle
relaxant and in the treatment of anxiety and insomnia. Valerenic acid and
valerenol, components of Valerian, are known to bind to GABA(A) receptors
(Benke et al., 2009). Valerian binding to plasma proteins to date has not been
reported but the increased use of this product highlights the need for investigations
such as these.
The methanolic extract was determined to have a Kd of 1.35 ±0.20 mg/ml; this was
the second greatest displacement of all the extracts investigated with AGP. The
potential for adverse interactions whilst not significant may warrant further
investigations or caution in patients concurrently taking Valerian and therapeutic
agents with a narrow therapeutic index such as phenobarbital, which is bound to
AGP (Lai et al., 1995).

Chapter 2- Protein Binding 77
2.11 Conclusions
The binding of complementary and alternative products was more significant with
human serum albumin than with alpha-1-acid glycoprotein. Six of the investigated
extracts were determined to have a Kd <1mg/ml with albumin whilst none of the
extracts produced a Kd <1mg/ml with alpha-1-acid glycoprotein.
Specifically with regards to albumin binding, the displacement of the site II bound
probe (dansyl sarcosine) was more significant than the site I probe (dansyl amide).
Site II is known to be the binding site for carboxylic acids which are present in high
levels in complementary and herbal products (Fournier et al., 2000).
The lowest Kd was for the methanolic extract of CoEnzyme Q10 (0.08 ±0.01
mg/ml). The displacement of dansyl amide, the site I probe by Dong Quai is
potentially the most significant interaction as it suggests that there is a
pharmacokinetic interaction between this product and warfarin, which is also
bound to site I.
With alpha-1-acid glycoprotein, the most significant binding was seen with the
methanolic extract of Echinacea (Kd = 1.01 ±0.14 mg/ml). Importantly the plasma
concentration of alpha-1-acid glycoprotein can vary dramatically, up to 2-5 fold
(Huang et al., 2010). This variation may contribute to adverse interactions, and
must be considered when in vitro data is extrapolated to in vivo.

Chapter 2- Protein Binding 78
The displacement of previously bound compounds from proteins in the serum can
be significant in the context of drug interactions, though caution should be used
when placing significance on these interactions (Rolan, 1994). As highlighted in
section 2.3, binding to protein is only one criterion to consider. In these studies not
only does the binding of components to the protein have to be significant but also
there has to be a risk of displacing another significantly bound compound, for
which displacement would cause therapeutic failure or toxicity. The interactions
observed in these experiments are of greatest significance for products that could
potentially displace warfarin due to the narrow therapeutic index and likely
concurrent use of complementary products.
Interactions with protein binding can alter the kinetic profile of a drug which can
lead to adverse interactions or a decrease in the therapeutic effect. We have
proposed a rapid screening method that will allow for the potential displacement
interactions to be identified from both HSA and AGP.

Chapter 3 – P-glycoprotein Inhibition 79
Chapter 3 - P-glycoprotein:
Inhibition of the transmembrane transporter P-glycoprotein
3.1 Overview of Drug Transporters
Transporters are membrane proteins that facilitate the flux of molecules into and
out of cells. They control the intake and efflux of endogenous substrates including
amino acids, sugars and inorganic ions. Many foreign compounds including
complementary products are also recognised by transporters, and as a consequence,
transporters play a role in determining the bioavailability, elimination, and
therapeutic efficacy of many endogenous and exogenous compounds.
Transporters can be induced or inhibited by a wide variety of compounds;
additionally transporters can alter the transport of endogenous substrates by altering
homeostasis. The pharmacokinetic behaviour of drugs that are substrates for
transporters can be influenced by concurrently administered compounds including
conventional medicines, foods and complementary products, that function as
inhibitors or inducers of transporter function.
Advances in the identification of carrier-mediated transport systems for drugs have
been made in recent years. In total, it is estimated that at least 5% of all human
genes are transporter related, indicative of the importance of the transport function
in normal biological and toxicological outcomes (Hediger et al., 2004).

Chapter 3 – P-glycoprotein Inhibition 80
Transporters can be divided into two categories; passive transporters which allow
molecules to move across cell membranes down their electrochemical gradients,
and facilitated transporters which typically move molecules against their
electrochemical gradients, requiring energy.
Transporters are classified based on their molecular structure or their mechanism of
action, as either members of the adenosine triphosphate (ATP) binding cassette
(ABC) family or the solute carrier (SLC) transporter family. ABC transporters are a
family of membrane transport proteins that require ATP hydrolysis for moving the
substrates across membranes. Therefore, ABC transporters are primarily active
transporters. SLC transporters utilize the electrochemical potential difference in the
substance transported and are therefore classified as facilitated transporters. Most
drug transporters belong to the SLC family.
3.2 ABC Transporter Family
The ABC (ATP-binding cassette) proteins form one of the largest protein families,
with members found in all living organisms from microbes to plants and mammals.
The widespread presence of these proteins with a relatively conserved structure and
function suggests a fundamental role. Members of the ABC superfamily are
responsible for the active transport of compounds across biological membranes,
including phospholipids, ions, peptides, steroids, polysaccharides, amino acids,
organic anions, bile acids, drugs and xenobiotics (Klein I et al., 1999).
Chapter 3 – P-glycoprotein Inhibition 81
ABC transporters bind ATP and use the energy from ATP hydrolysis to transport
various compounds across cell membranes as well as intracellular membranes of
the endoplasmic reticulum, peroxisome and mitochondria (Higgins C, 1992). The
functional protein contains two ATP-binding domains or nuclear binding folds
(NBF) and two transmembrane (TM) domains.
ABC genes are organized as either full transporters containing two TM and two
NBF or as half transporters containing one of each domain (Hyde et al., 1990). The
half transporters can form functional transporters by combining as either
heterodimers or homodimers.
In humans, 48 ABC transporters have been identified to date, and classified on the
basis of phylogenetic analysis into 7 subfamilies (A-G) (Dean M and Allikmets R,
2001, Klein I et al., 1999). ABCA (12 members; previously ABC1), ABCB (11
members; previously MDR/TAP), ABCC (12 members; previously MRP/CFTR).
ABCD (4 members; previously ALD), ABCE (1 member; previously OABP),
ABCF (3 members; previously GCN20) and ABCG (5 members; previously White)
(Dean M et al., 2001). The subfamily designation is not based on functionality;
genes in different subfamilies may have more similarity in substrate recognition
than genes in the same subfamily.
Members of three ABC subfamilies have been recognised to play a key role in drug
efflux from cells: the MDR1 P-glycoprotein (ABCB1) of the ABCB subfamily, the
breast cancer resistance protein (BCRP, ABCG2) of the ABCG subfamily and the
multidrug resistance proteins (MRPs) of the ABCC subfamily.

Chapter 3 – P-glycoprotein Inhibition 82
3.3 P-Glycoprotein
Permeability glycoprotein (P-gp) is a 170-180 kDa transmembrane glycoprotein first
described in 1976 (Juliano RL and Ling V, 1976). It is composed of two
homologous and symmetrical cassettes; each contains six transmembrane domains
that are separated by an intracellular flexible linker-polypeptide loop with an ATP
binding motif (Higgins C, 1992, Juliano RL and Ling V, 1976).
P-gp is expressed at low levels in most tissues but is found in higher levels in
epithelial cells with excretory roles. The location of P-gp is tissue-specific, it is
localized on the canalicular surface of hepatocytes, the apical surface of renal
tubular epithelial cells, the apical surface of epithelial cells in the intestine and
placenta and the luminal surface of the capillary endothelial cells in the brain
(Theibaut F et al., 1987, Cordon-Cardo C et al., 1990). P-gp is synthesised in the
endoplasmic reticulum and subsequently modified in the Golgi apparatus (Loo and
Clarke, 1999).
Whilst the physiological function of P-gp is still not fully understood, it is known to
extrude a wide variety of structurally and chemically unrelated compounds out of
cells. Due to its localization on tissues, P-gp is thought to have a protective effect
for organs such as the testes and brain (Fromm M, 2004a). This is because P-gp
extrudes toxic drugs and metabolites. Other functional roles include the secretion of
metabolites into bile, urine and the lumen of the gastrointestinal tract (Leung and
Bendayan, 1999a, Fromm M, 2004b, Kullak-Ublick and Becker, 2003, Leung and
Bendayan, 1999b) and also the transport of hormones from the adrenal gland (van
Kalken et al., 1993) and uterine epithelium (Axiotis et al., 1991).

Chapter 3 – P-glycoprotein Inhibition 83
Surprisingly when the broad range of substrates and diverse roles of P-gp are
considered, P-gp may not be essential to life. This is demonstrated by transgenic
knockout mice being fertile, viable and phenotypically indistinguishable from wild
type mice (Schinkel et al., 1994). Though to date no human null alleles have been
reported (You G and Morris M, 2007).
3.3.1 P-glycoprotein Isoforms
P-gp is the product of several genes. Two members of the P-gp gene family (MDR1
and MDR3) occur in humans, whilst three members of this family (mdr1a, mdr1b
and mdr2) are found in mice (Gottesman and Pastan, 1993). The P-gp encoded by
human MDR1 and mouse mdr1a/1b genes function as a drug efflux transporter,
whilst human MDR3 and mouse mdr2 encoded P-gp are believed to transport
phospholipids (van Helvoort et al., 1996, Ruetz and Gros, 1994). The isoforms
have a 70% sequence homology.
3.3.2 P-Glycoprotein Structure
P-gp consists of two tandem repeats of approximately 1280 amino acids joined by a
linker region of approximately 60 amino acids (Chen et al., 1986). Each repeat
consists of an NH2-transmembrane (TM) domain (TMD) containing six potential
TM segments, followed by a hydrophilic region containing a nucleotide biding
domain (NBD) (Loo et al., 2010) (Figure 3-1).

Chapter 3 – P-glycoprotein Inhibition 84
Figure 3-1: Schematic representation of the primary structure of P-gp as embedded
in the membrane. The molecule contains 1280 amino acids spanning 28 exons
(each exon sequence shown in a different color). Black dots show the location of
some of the identified SNPs. Modified from Ambudkar et al. (Ambudkar et al.,
2003).
The secondary structure of P-gp has been established using Fourier transform
attenuated reflective infrared spectroscopy and circular dichroism. P-gp
approximately consists of 2-43% -helix, 16-26% -sheet, 15-29% -turn and 13-
26% unordered structure (Sonveaux et al., 1996{Dong M, 1998 #259)}. What is
known is that the nucleotide-binding domains are not required for interaction with
substrates or for trafficking of P-gp to the cell surface (Loo and Clark, 1999).

Chapter 3 – P-glycoprotein Inhibition 85
The binding pocket of P-gp has been extensively studied but to date there is no
high-resolution crystal structure. Radio-ligand binding and functional transport
studies indicate that there are anywhere from two (van Veen et al., 1998, Homolya
et al., 1993, Loo and Clark, 1999, Shapiro et al., 1999) to at least four (Martin et al.,
2000) substrate-binding sites, These sites fall into two categories:
Transport: at which translocation of drug across the membrane can occur,
and,
Regulatory sites: which modify P-gp function.
Multiple substrates can bind with P-gp. Using cysteine-scanning mutagenesis of the
TM segments, P-gp was demonstrated to have overlapping binding for colchicine
and calcein, but not verapamil (Loo et al., 2003). Other data indicates that
substrate-binding sites may overlap or be allosterically coupled (Dey et al., 1997,
Ayesh et al., 1996), leading to the possibility that there is only a single common
binding site (Borgnia et al., 1996).
3.3.3 Regulation of Expression of P-Glycoprotein
The human MDR1 promoter region is atypical as it does not contain a TATA
promoter sequence, but it does have multiple response elements (Hennessy and
Spiers, 2007). P-gp is constitutively expressed in a cell and tissue-specific manner
(section 3.3.5), but can be induced by heat shock, cytokines, chemotherapeutic
agents, UV radiation, oxygen free radicals and tumour suppression genes (Miyazaki
et al., 1992a, Chaudhary and Roninson, 1993, Hu et al., 2000, Wartenberg et al.,
2005).

Chapter 3 – P-glycoprotein Inhibition 86
In many cells lines, P-gp expression is increased through the up-regulation of
MDR1 mRNA levels (Thorgeirsson et al., 1987, Abolhoda et al., 1999, van Kalken
et al., 1992). The tumour suppressor protein p53 can either positively or negatively
regulate MDR1 transcription. The p53 gene modulates the expression activity of
MDR1 gene promoter in a promoter-CAT system (Li et al., 1997). The up-
regulation of MDR1 expression has been shown to be a two-step process: mRNA
stabilization and translational initiation (Yague et al., 2003). Post-transcriptional
regulation occurs with heat shock factor 1 (Tchénio et al., 2006).
3.3.4 Genetic Variability of P-Glycoprotein
The MDR1 gene is located on chromosome 7 and consists of 28 exons. Evidence of
structural variability in the MDR1 locus was first described in 1998 (Mickley et al.,
1998) and to date more than 100 mutations have been identified. 15 single
nucleotide polymorphisms (SNPs) were identified when the 28 exons were
investigated (Hoffmeyer et al., 2000). Nine mutations alter the amino acid sequence
of P-gp. Complete P-gp deficiency has not been reported for any of these
polymorphisms, though the SNP at position C3435 in exon 26 does influence the
expression level of intestinal P-gp (Lin J, 2003, Hoffmeyer et al., 2000).
3.3.4.1 Genetic Variability and Drug Disposition
Several other polymorphisms are known to influence drug disposition, including
the disposition of digoxin (Hoffmeyer et al., 2000, Cascorbi et al., 2001, Sakaeda et
al., 2001), phenytoin (Kerb et al., 2001) and cyclosporine (von Ahsen et al., 2001).

Chapter 3 – P-glycoprotein Inhibition 87
3.3.5 Tissue distribution of P-glycoprotein
P-gp is expressed in tumour cells and in cells of many normal tissues. The cellular
localization differs for each tissue. Thus transporter activity changes in any location
can modify drug disposition in the body leading to an increased exposure and
inducing specific tissue toxicity issues. This information is summarised, Table 3-1.
3.3.5.1 Gastrointestinal Tract
P-gp is expressed at the apical surface of the epithelial cells lining the intestine
(Thiebaut et al., 1987, Maliepaard et al., 2001), with levels increasing from the
duodenum to the colon (Dietrich et al., 2003). The role of P-gp in the
gastrointestinal tract is to prevent and/or modulate the passage of certain
xenobiotics or their metabolites from the gut intro circulation. Murine studies have
indicated a second potential role, the prevention of accumulation of inflammation-
inducing bacteria and bacterial products (Panwala et al., 1998).
3.3.5.2 Lung
P-gp is localized on the apical surface of bronchus and bronchiolar epithelium and
at the plasma membrane of alveolar macrophages, it has been suggested that it
removes environmental compounds to the lung lumen (Scheffer et al., 2002).
Though this protective role has not yet been demonstrated in vivo.
3.3.5.3 Central Nervous System
High levels of P-gp are found in the brain, on the apical side of capillary endothelial
cells, taking part in the blood-brain barrier (Cordon-Cardo et al., 1989, Thiebaut et
al., 1987, Thiebaut et al., 1989).

Chapter 3 – P-glycoprotein Inhibition 88
In the brain P-gp is expressed in many cell types including choroid plexus,
astrocytes, microglia and capillary endothelium. P-gp is also located on the luminal
plasma membrane of the capillary endothelium, where it prevents the passage of
drugs and toxins (Fricker and Miller, 2004).
3.3.5.4 Testis
The structure of the blood-testes barrier is similar to the blood-brain barrier and
likewise it provides a protective function. Immunohistochemical studies have
shown that P-gp is observed at the luminal side of the capillary endothelial cells
(Thiebaut et al., 1989, Cordon-Cardo C et al., 1990).
3.3.5.5 Placenta
P-gp is expressed at relatively high levels in the syncytiotrophoblast cells (Atkinson
et al., 2003), the role of this is to protect the foetus (Lankas et al., 1997).
3.3.5.6 Liver
In the liver, several ABC and other transporters are important for the elimination of
drugs and toxins across the canalicular or sinusoidal hepatocyte membrane into bile
or systemic circulation (Leslie E et al., 2005).
3.3.5.7 Kidney
P-gp is found on the apical surface of the epithelial cells of the proximal tubules
(Schaub et al., 1999, Thiebaut et al., 1987). The role of P-gp in the kidney is to
mediate the export of certain drugs (including uncharged and cationic drugs) from,
blood into urine (Fricker et al., 1999, Gutmann et al., 2000, Schaub et al., 1999).

Chapter 3 – P-glycoprotein Inhibition 89
Table 3-1: The cellular localisation of P-glycoprotein in tissues and the effect on
drug disposition. Material from various resources (Fromm, 2002, Cordon-Cardo C
et al., 1990, Thiebaut et al., 1987).
Tissue Localization Function
Gastrointestinal tract Apical membrane of epithelial cells Secretion of drugs into gut lumen
Lung Apical surface of bronchial and
bronchiolar epithelium
Remove environmental compounds/
particulates to the lung lumen
Central nervous
system
Apical side of capillary endothelial
cell
Prevents the passage of drugs and
toxins
Testis Luminal side of the capillary
endothelial cells
Protective function, blood-testis barrier
Placenta Trophobalsts Protection of the foetus from
xenobiotics
Kidney Apical membrane of epithelial cells
of proximal tubules
Secretion of drugs into tubules lumen
Liver Canalicular membrane of
hepatocytes
Secretion of drugs into bile
3.4 P-glycoprotein Binding and Efflux
Two to three molecules of ATP are hydrolysed per molecule of substrate
transported (Eytan et al., 1996, Ambudkar et al., 1997, Shapiro A and Ling V,
1998, Delannoy et al., 2005). In the absence of a substrate, both NBDs are occupied
with either ATP or ADP (Qu et al., 2003). Two potential models have been
proposed in order to explain the sequence of events on the efflux cycle (Figure 3-2):
An ATP-switch driven pump system (Higgins and Linton, 2004, Linton and
Higgins, 2007).
An ATP hydrolysis driven efflux pump (Ambudkar et al., 2006).

Chapter 3 – P-glycoprotein Inhibition 90
a)

Chapter 3 – P-glycoprotein Inhibition 91
b)
Figure 3-2: Summary of the two models proposed for the translocation process for
P-gp. a) The nucleotide switch model in which dimerization of the nucleotide-
binding domains drives the pump. b) Model in which ATP hydrolysis drives the
pump. Both models encompass four distinct stages: (i) Loading of P-gp with drug
and nucleotide. (ii) Reorientation of the drug-binding sites from high to low affinity.
(iii) Nucleotide hydrolysis. (iv) Resetting phase. Modified from (Hennessy M and
Spiers JP, 2007, Callaghan et al., 2006, Hennessy and Spiers, 2007).

Chapter 3 – P-glycoprotein Inhibition 92
In general, transport by P-gp is saturable, osmotically sensitive, requires ATP
hydrolysis, and generates a drug concentration gradient (Sharom, 1997). P-gp
exhibits a high level of basal ATPase activity in the absence of a substrate (Shapiro
and Ling, 1994, Sharom et al., 1995, Hennessy M and Spiers JP, 2007, Hennessy
and Spiers, 2007). Upon substrate binding the level of ATPase activity in increased
3-4 fold (Senior et al., 1995, Martin et al., 1997), though increases of 20-fold have
also been reported (Ambudkar et al., 1992).
3.5 P-Glycoprotein Substrates and Inhibitors
P-gp is a highly promiscuous transporter, able to recognize and transport an
amazing number of diverse substrates that differ in chemical structure and
pharmacological action, this includes many clinically important drugs, for example,
doxorubicin, vinblastine, cortisol, indinavir, colchicine and rifampicin (Hennessy
and Spiers, 2007). A typical substrate is large (Mr >400), hydrophobic,
amphipathic, with a planar ring system, and often carries a positive charge at
physiological pH (Pearce et al., 1989), though this is not always true.
Dissociation constant (Kd) values for P-gp substrates cover a 1000-fold range,
indicating that P-gp is able to discriminate between substrates (Sharom, 1997). Key
physico-chemical properties for substrates and inhibitors have been identified,
including lipid solubility, cationic charge and molecular refractivity, additionally
hydrogen bonding potential, presence of an amine group, molecular weight, size,
surface area and the presence of aromatic ring structures (Wang et al., 2003,
Zamora et al., 1988, Ueda et al., 1997b, Stouch and Gudmundsson, 2002, Ueda et
al., 1997a).

Chapter 3 – P-glycoprotein Inhibition 93
The presence of a hydrogen bond acceptor (or electron donor) moiety with a
defined spatial separation is key (Seelig, 1998, Seelig et al., 2000). This spatial
separation pattern is defined as type I, with two electron donor groups separated by
2.5 ± 0.3Å, or type II, with two electron donor groups separated by 4.6 ±0.6Å. A
prerequisite for substrate binding is either a type I or II pattern (Seelig et al., 2000).
3.6 P-Glycoprotein Induction
The mechanism of transcription of the MDR1 gene is complex and not yet fully
understood. Induction of P-gp/MDR1 expression does not occur via direct drug
binding to P-gp, it is regulated by nuclear factors at the transcriptional level
(Kuwano et al., 2004). As described in section 3.3.5, P-gp is constitutively
expressed in a cell and tissue-specific manner, but it may be induced by
environmental factors such as heat shock, cytokines, chemotherapeutics agents, UV
radiation, oxygen free radicals and tumour suppressor genes (Chin et al., 1990a,
Miyazaki et al., 1992b, Chaudhary and Roninson, 1993, Hu et al., 2000,
Thottassery et al., 1997, Wartenberg et al., 2005, Chin et al., 1990b).
Nuclear receptors (NR) relevant for the expression of the ABC transporters are liver
X receptor (LXR), farnesoid X receptor (FXR), pregnane X receptor (PXR), and
peroxisome proliferator-activated receptors and (PPAR and PPAR) (Borst
and Elferink, 2002). The NRs are also known to be involved in the induction of the
cytochrome P450 enzymes (section 4.7).

Chapter 3 – P-glycoprotein Inhibition 94
The up-regulation of MDR1 mRNA levels, may involve several transcription
factors including GC, HSF1, Sp1, AP-1, NF-Il6, NF-Y, EGR1, YB-1 and MED-1
(Chaudhary and Roninson, 1993, Thorgeirsson et al., 1987, van Kalken et al.,
1992). The tumour suppressor protein p53 can either positively or negatively
regulate the MDR1 transcription (Thottassery et al., 1997, Li et al., 1997).
3.7 Methods for studying P-Glycoprotein
Transporter interactions can be assessed by several methods. These assays can
classify compounds as inhibitors and/or substrates of P-gp (Sharom, 1997, Seelig,
1998). Combinatorial chemistry and advances in synthetic chemistry have led to the
development of many new compounds in the area of drug discovery and this has
driven the development of screening assays for permeability. Ideally screening
assays will have high efficiency, reproducibility, time, cost and space effectiveness
and capability for high throughput.
3.7.1 In vitro Assays
There are many in vitro assays available to investigate the interaction of a test
compound with P-gp, each with advantages and disadvantages.
3.7.1.1 Transcellular Transport
Transport studies can identify P-gp substrates, modulators or inhibitors. With
monolayer efflux assays, where the ratio or basolateral-to-apical (BA)
permeability versus apical-to-basolateral (AB) permeability is regarded as the
standard for identifying P-gp substrates as it measures the efflux of drugs in the
most direct manner (Polli. J et al., 2001a, Rautio et al., 2006).

Chapter 3 – P-glycoprotein Inhibition 95
The major disadvantage of these assays is they are labour intensive due to cell
culture and analytical techniques, limiting throughput.
In brief, cells are seeded on a membrane surface and the test compound is added to
the apical and/or basolateral compartment. At pre-determined time points the
concentration of the compound is determined in each compartment. In the case of
P-gp which is apically located, the basolateral to apical flux will dominate (Szakács
et al., 2001). As this technique requires identification of the compound, it is not
suitable for complementary products as the composition is often unknown and is
highly variable.
In these studies different cell types may be employed including human colonic
adenocarcinoma (Caco-2), Madin-Darby canine kidney (MDCK) and porcine
kidney epithelial (LLC-PK1) cells. Caco-2 cells resemble intestinal epithelium, and
are the most extensively characterized model for examining the permeability of
drugs (Balimane et al., 2006, Elsby et al., 2008b, Elsby et al., 2008a).
Membranes isolated from the cells mentioned above, can be isolated. They contain
high levels of transporters suitable for the characterization. Membrane-based assays
characterization of the transporter may follow (i) the catalytic activity, (ii) the
binding of the compound to the transporter, (iii) the actual substrate transport. An
assay based on inside-out membrane vesicles is a clinically relevant method
(Kharasch et al., 2005).

Chapter 3 – P-glycoprotein Inhibition 96
3.7.1.2 ATPase Expression
As P-gp is ATP dependent (see section 3.3), monitoring ATPase activity is a useful
tool to determine P-gp interactions. In the absence of a test compound, P-gp will
express a basal ATPase activity level. If a test compound binds to P-gp then an
increase in ATPase activity will be detected. Whilst monitoring ATPase activity
can be scaled to a high-throughput assay (Garrigues et al., 2002), these studies can
not determine if the test compound is acting as an inhibitor, inducer or substrate for
the transporter.
One important advantage of ATPase assays that is key when working with
unknown tests compounds such as complementary products is that these assays do
not require analytical techniques to identify the product. ATPase assays have been
developed for a variety of systems including enriched and crude plasma membranes
(Kokubu et al., 1997, Garrigues A et al., 2002, Garrigues et al., 2002), and enriched
microsomal membranes (Litman et al., 1997). Purified P-gp can also be used
(Ambudkar et al., 1997, Lu et al., 2001).
3.7.1.3 Cellular Accumulation
The accumulation of fluorescent dyes within the cell can be used to identify
inhibition of P-gp. These assays are easily adapted for high-throughput screening,
though identification of inhibitor or substrates can be difficult as there are multiple
binding sites on P-gp (Schwab D et al., 2003a).

Chapter 3 – P-glycoprotein Inhibition 97
Measurement of the cellular accumulation of these dyes in the presence of a test
compound may be done via flow cytometry, as in the case of Rhodamine 123 (a
cationic dye) or by standard fluorometric measurements as with Calcein. Calcein
AM is a non-fluorescent, highly lipid soluble dye that rapidly penetrates the plasma
membrane of cells. In addition to this, Calcein AM is a good substrate for the efflux
carriers for both P-gp and multidrug resistance protein (MRP). When Calcein AM
enters the cells it is metabolized by the cytosolic esterase’s into calcein, which is
highly hydrophilic and fluorescent (Figure 3-3).
a) b)
Figure 3-3: Schematic representation of the calcein AM extrusion assay. a) The
lipid soluble calcein AM is able to cross the cell membrane. b) In the presence of
esterase’s the calcein AM is hydrolyses to the fluorescent calcein which is also
hydrophilic. If inhibition of the P-gp pump occurs then calcein cannot be extruded
and the fluorescence is recorded.

Chapter 3 – P-glycoprotein Inhibition 98
3.7.2 In Vivo Assays
In vivo mouse models can be used to evaluate the interaction of compounds with P-
gp. The use of mdr1 knockout mice is useful in the identification of the role of P-gp
in drug absorption and disposition (Bain and LeBlanc, 1996, Schinkel et al., 1994),
though these mice have two members of drug-transporting P-gp (mdr1a (brain and
intestine) and mdr1b (liver and kidney) expressed in a tissue specific manner
(Croop et al., 1989).
The double knockout mdr1a/b mice have more recently been developed and can be
used to study P-gp interactions (Schinkel et al., 1997). These mice display a 100-
fold increase in the sensitivity to the centrally acting neurotoxic pesticide
ivermectin, and to the carcinostatic drug vinblastine (3-fold). In addition to P-gp
alterations, both single and double knockout mice display an increased expression
of hepatic CYP2B and CYP3A proteins (Schinkel et al., 1997), which must be
taken into consideration when pharmacokinetic studies are conducted using these
animals.
3.7.3 In Silico
In silico studies have been utilised to predict the potential interaction of a drug with
P-gp. One such study was used to predict the ability of drugs to form H-bonds,
which as shown in section 3.5 are key for an interaction with the receptor to occur
(Seelig and Landwojtowicz, 2000), lipophilicity and molecular weight have also
been correlated with binding (Bain et al., 1997). A multi-tier approach has been
utilised to classify compounds into three classes, substrates, inhibitors or non-
interaction, with 82, 72 and 89% accuracy (Bain and LeBlanc, 1996).

Chapter 3 – P-glycoprotein Inhibition 99
With complementary products, the composition is often unknown and complex;
this limits the use of in silico techniques with these products. In the future, in silico
modelling may have a role in predicting the fate of these products when more
information is available and potentially classes or family of products are found to
behave in a similar pattern. At this stage the technology cannot provide predictions
on the metabolic outcomes and kinetic behaviour of these products.
Table 3-2: The major advantages and disadvantages of the systems used in the
investigation of P-glycoprotein interactions.
System Advantages Disadvantages
Transcellular
transport
Can identify substrates, modulators
and inhibitors.
Labour intensive with limited through-
put.
ATPase activity Rapid and amenable to high
throughput. Can identify substrates,
modulators and inhibitors.
Cannot distinguish between substrates
modulators and inhibitors.
Cellular
accumulation
Rapid and cost efficient. Indicate inhibition of P-gp, not
induction.
In vivo Knockout mice are available. Not rapid or cost efficient for
screening studies.
In silico No reagents or drug required. Molecular and structural knowledge of
the product being investigated is
required.
3.8 Interactions Caused by Herbal Products
To date several complementary and alternative products have been identified as
substrates, inhibitors and/or inducers of P-gp. One of the most clinically significant
examples is St. John’s Wort (Hypericum perforatum), which is commonly used to
treat mild depression.

Chapter 3 – P-glycoprotein Inhibition 100
Studies have indicated that St. John’s Wort induces intestinal P-gp in vitro and in
vivo (Hennessy et al., 2002, Perloff et al., 2001). These finding have been consistent
in healthy volunteers who consumed the product for 14 days, with a subsequent
1.4-1.5 fold increase in their expression of P-gp (Dürr et al., 2000).
Silymarin, a component of the herb Milk Thistle has been studied due to concerns
of adverse interactions between this herb and indinavir which is a known substrate
for P-gp used in the treatment of AIDS. In healthy volunteers, treatment with Milk
Thistle (175mg) for 3-weeks caused a 9-36% reduction in the AUC of indinavir.
3.9 Aims of the Present Study
The general aim of this study was to investigate complementary products that have
the potential to alter the kinetic behaviour of therapeutic agents via the inhibition of
P-glycoprotein. The specific goals included:
Establishing a standard extraction method that is easily reproducible.
To determine the potential for two assay types, the ATPase activity and
cellular accumulation assay can be used in the context of complex mixtures
such as complementary products.
To determine if these methods produce comparable results when using
complex mixtures.
To determine if these methods can be used as high throughput screening
assays for investigating the interaction of complementary and alternative
products with P-glycoprotein.
Chapter 3 – P-glycoprotein Inhibition 101
3.10 Materials and Methods
3.10.1 Chemicals
Verapamil, calcein, Hank’s balanced salt solution (HBSS), MgATP, peroxidase-
conjugated goat anti-mouse IgG and anti-mouse β-actin antibody were purchased
from Sigma-Aldrich, Australia. Sodium orthovanadate was purchased from Merck.
Advanced RPMI-1640 media from Gibco Technologies. K562 and K562-MDR
cells were a generous donation from Dr Dodie Pouniotis, Cancer and Tissue Repair
Research Group, RMIT University. Human p-glycoprotein membranes were
purchased from BD Gentest. (US). Nitrocellulose membrane (Geneworks, SA,
Australia) and 0.2-μm pore size Clear Blot Membrane-P (Atto Corp., Tokyo,
Japan). Anti-P Glycoprotein antibody (JSB-1) was purchased from Abcam Ltd.
UK.
Water was freshly prepared in-house with Simplicity 185 (Millipore S.A.,
Molsheim, France) water purification system and was ultra pure grade (18.2M).
All other chemicals were from Sigma Chemical Co. (St Louis, MO, USA) and were
of the highest purity available.
3.10.2 Preparation of Herbal Samples
Herbal products were purchased from local suppliers in Victoria, Australia and
were all of commercial quality (Table 3-3). The methanolic and aqueous extraction
method was modified from that previously described (Unger and Frank, 2004).
Tablets were crushed and the contents of capsules emptied, extractions were either
water or 80% methanol to allow for the aqueous and distinctly lipophilic
components to be separated.

Chapter 3 – P-glycoprotein Inhibition 102
Solvent volumes were adjusted so that standardised extracts at 100 mg of
product/ml were obtained. This was based on the manufacturers’ stated
concentration of the active or principle component.
Extracts were agitated in a shaking water bath at 37C for 30 minutes then
centrifuged at 2500 g for 10 minutes. Standard extracts were diluted to final
nominal concentrations of 10, 100 and 1000 g/ml. Methanol was evaporated to
dryness under vacuum and the final volume of methanol did not exceed 1% (v:v).
Extracts were kept in the dark and shelf life set at 2 weeks.
3.10.3 Cell culture
The human erythromyeloblastoid leukaemia cell line K562 and its over expressing
variant K562-MDR cells were maintained in Advanced RPMI 1640 supplemented
with 10% (v:v) heat-inactivated foetal bovine serum, 2mM L-glutamine, 100 μg/ml
penicillin-streptomycin and were grown under standard conditions (5% CO2,
37°C).

103
Table 3-3: Complementary products screened for their potential to interact with P-glycoprotein.
Product Active or Principle
Component
[Active or principle
component] in each
tablet/capsule
Manufacturer Batch Number Reported benefit/Use
Cordyceps Cordyceps sinensis 530mg Nature’s Sunshine 0170794 For general wellbeing and aphrodisiac. Assist in
the treatment of inflammatory conditions and
fatigue.
Echinacea Echinacea purpurea 410mg Nature’s Sunshine 0124471 Supports the body’s own immune defences.
Milk Thistle Silybum marianum 84mg Nature’s Own 302090 Assist the liver in detoxification.
Slippery Elm Ulmus rubra 400mg Nature’s Own 314087 Sooth digestive disturbance and enhance overall
digestive health.
Valerian Valeriana officinalis 2250mg Bio-Organics 301338 Antispasmodic and muscle relaxant. Relieve
nervous tension and anxiety.

Chapter 3 – P-glycoprotein Inhibition 104
3.10.4 Immunoblotting Analysis
Immunoblotting analysis for P-gp was undertaken as previously described with
minor modifications (Auora et al., 2005). K562 and K562-MDR cells were
centrifuged, and suspended in lysis buffer containing 2 mM EDTA, 25 mM Tris-
phosphate, pH 7.8, 1% Triton X-100, and 10% protease inhibitor cocktail. Protein
concentration was determined using the method of Bradford (Bradford, 1976).
Equal amounts of protein lysates were separated on SDS/7% (w/v)-polyacrylamide
gels and then transferred to nitrocellulose in glycine transfer buffer. The blots were
blocked overnight with 3% non-fat dry milk and probed with anti P-glycoprotein
antibody (JSB-1) (0.5 μg/ml). Immunoblots were detected by horseradish
peroxidase-conjugate anti-mouse IgG using chromogen 3,3’-diaminobenzidine
tetrahydrochloride (dilution 1:1500). Anti mouse β-actin antibody was used at a
1:10,000 dilution as an internal load control. Immunoblots were scanned and band
intensities quantitatively measure using Metamorph version 4.01 imaging software
(Universal Imaging Corporation, USA).
3.10.5 Calcein AM Assay
Calcein AM assay was modified from previously described (Liminga G et al., 1994,
Polli. J et al., 2001b, Polli. J et al., 2001a). Calcein AM was dissolved in dimethyl
sulfoxide (DMSO) to a stock solution of 1 mg/ml and kept at -20°C until use.
Accumulation of the calcein AM dye in K562-MDR cells was determined using a
Perkin-Elmer Multi-label fluorometer, with an excitation of 485nm and an emission
of 538nm. 1 x 10⁵ cells were seeded in 100 μl Hank’s balanced salt solution (HBSS),
pH 7.4, in 96-well black plates with clear bottoms.

Chapter 3 – P-glycoprotein Inhibition 105
3.10.5.1 Control Experiments
Increasing concentrations of verapamil, a known P-gp inhibitor was incubated with
K562-MDR cells for 15 minutes before the addition of calcein AM at a final
concentration of 250 nM. Fluorescence intensities were recorded for 10 minutes at
30-second intervals, with an excitation of 485nm and an emission of 538nm in a
Perkin-Elmer Multi-label fluorometer. Experiments were run in triplicate on three
separate occasions.
3.10.5.2 Inhibition Studies
The aqueous and methanolic extracts of the complementary products were added
to cells seeded at a density of 1 x 10⁵ cells HBSS, pH 7.4 and pre-incubated at 37°C
for 15 minutes. Calcein was added at a final concentration of 250 nM. Fluorescence
intensities were recorded for 10 minutes at 30-second intervals with an excitation of
485nm and an emission of 538nm in a Perkin-Elmer Multi-label fluorometer.
Positive control measurements to determine 100% inhibition were carried out in the
presence of 50 μM verapamil. Experiments were run in triplicate on three separate
occasions.
3.10.5.3 Calculations
From the time dependent increase of cellular fluorescence the initial rate of
fluorescence generation (IRF) was determined. Quantification of P-gp inhibition
was determined with the following equation:

Chapter 3 – P-glycoprotein Inhibition 106
Where IRF (control) was the average of three reading with verapamil 50 μM used
as the positive control, and IRF (background) was the IRF in the absence of test
compound. A compound was determined to inhibit P-gp when an inhibition ≥50%
was reached.
The IC50 values for the extracts (concentration causing 50% reduction of control
activity) were determined from the mean of the triplicate incubations run on three
separate occasions by non-linear regression analysis (GraphPad Prism, v5.0).
3.10.6 ATPase Assay
The ATPase activity of human P-gp membranes was determined by measuring the
inorganic phosphate released from ATP. The ATPase activity measured in the
presence of 100 μM sodium orthovanadate represents non P-gp ATPase activity
and was subtracted from the activity generated without sodium orthovanadate to
determine basal ATPase activity.
All incubations were carried out in reaction buffer containing 50 mM MES, 2 mM
EGTA, 2 mM dithiothreitol, 50 mM potassium chloride, 5 mM sodium azide (pH
adjusted to 6.8 with Tris) and 1000 μM ATP magnesium salt. Incubations were
conducted at 37°C for 20 minutes and stopped by the addition of 0.03 ml of 10%
SDS.
At the end of the incubation, detection reagent (7 mM ammonium molybdate, 3
mM zinc acetate, and 16% ascorbic acid, pH 5.0) was added to each well. The
colour reaction was incubated for 20 minutes at 37°C.

Chapter 3 – P-glycoprotein Inhibition 107
The plate was read immediately for endpoint absorbance at 850 nm using a Perkin-
Elmer Multi-label spectrophotometer. A potassium phosphate standard curve was
used to extrapolate nanomoles of phosphate from the absorbance readings.
3.10.6.1 Control Experiments
P-gp membranes (25 μg) were incubated at 37°C for 20 minutes in the presence of
increasing concentrations of verapamil as a positive control, DMSO (1%) was used
as a negative control. Assays were run in 96-wells in triplicate on three separate
occasions.
3.10.6.2 Complementary Products
Aqueous and methanolic extracts of the complementary products were incubated at
increasing concentrations (0-500 μg/ml) with P-gp membranes (25 μg) at 37°C for
20 minutes in the presence of verapamil. Assays were run in 96-wells in triplicate
on three separate occasions.
3.10.6.3 Calculations
The drug stimulated ATPase activity (nmol/min/mg of protein) was determined as
the difference between the amount of inorganic phosphate released from ATP in
the absence and presence of sodium orthovanadate for each of the extracts.
Phosphate standards were prepared in each plate and verapamil was used as a
positive control. The ATPase activity in verapamil stimulated cells was determined
as a % of the control (50 μM verapamil). The results are expressed as the mean
±SEM of triplicate replications run on three separate occasions.

Chapter 3 – P-glycoprotein Inhibition 108
The IC50 values for the extracts (concentration causing 50% reduction of control
activity) were determined from the mean of the triplicate incubations run on three
separate occasions by non-linear regression analysis (GraphPad Prism, v5.0).

Chapter 3 – P-glycoprotein Inhibition 109
3.11 Results
3.11.1 Immunoblotting Analysis
K562 and K562-MDR cells were subjected to immunoblotting to confirm the
presence of P-gp. Anti P-glycoprotein antibody (JSB-1) is specific for the MDR1
isoform of P-gp and does not cross-react with MDR3. K562-MDR but not K562
cells were shown to express P-gp (Figure 3-4).
a) b)
Figure 3-4: P-glycoprotein levels determined with immunoblot analysis. a) K562
and K652-MDR cells were probed with anti P-glycoprotein monoclonal antibody
C219 anti-mdr1. Immunoblots were detected by horseradish peroxidase-conjugate
anti-mouse IgG using chromogen 3,3’-diaminobenzidine tetrahydrochloride
(dilution 1:1500). b) Bands were quantitatively measured by scanning densitometry
and the density compared to the loading control anti mouse β-actin antibody. Data
points represent the mean protein level ± SEM for 3 independent assays each run in
triplicate.
-0.5
0
0.5
1
1.5
2
2.5
3
K562 K562-MDR
P-g
lyco
pro
tein
/β
-act
in
β - Actin
P-gp
K562 K562-MDR

Chapter 3 – P-glycoprotein Inhibition 110
3.11.2 Calcein AM
Calcein AM is a non-fluorescent highly lipid soluble dye that rapidly penetrates the
plasma membrane of cells. It is a substrate for P-gp and multiple resistance protein
(MRP) (Essodaïgui M et al., 1998). Inside the cell, calcein AM is hydrolysed by the
cytosolic esterases into the hydrophilic and fluorescent calcein. In the presence of a
P-gp inhibitor, the fluorescent calcein molecules remain in the cell.
3.11.2.1 Positive Control Experiments
Verapamil, a known inhibitor of P-gp was used as a positive control. Under our
experimental conditions maximum inhibition of P-gp was seen at 50 μM of
verapamil (Figure 3-5).
Figure 3-5: Inhibition of calcein AM extrusion from K562-MDR cells in the
presence of increasing concentrations of verapamil. Cells were pre-incubated with
verapamil for 15 minutes prior to the addition of 250 nM calcein. Fluorescence was
recorded for 10 minutes at 485nm excitation and 538nm emission. Data points
represent the mean % inhibition ± SEM for 3 independent assays each ran in
triplicate.

Chapter 3 – P-glycoprotein Inhibition 111
3.11.2.2 Inhibition of Calcein Extrusion by Complementary Products
K562-MDR cells were incubated with increasing concentrations of the aqueous and
methanolic extracts of the complementary product extracts for 15 minutes. Calcein
AM (250 nM) was added to the incubation and the fluorescence recorded. The %
inhibition of P-gp calcein retention was determined for each of the tested extracts
(Figure 3-6) as per the method previously described (section 3.1.12).

Chapter 3 – P-glycoprotein Inhibition 112
a)
b)
Figure 3-6: Inhibition of calcein AM extrusion in the presence of (a) aqueous and
(b) methanolic extracts of complementary products, in K562-MDR cells. Cells were
incubated with the extracts for 15 minutes prior to the addition of 250 nM of
calcein. Fluorescence was recorded for 10 minutes at 485nm excitation and 538nm
emission. Data points represent the mean % inhibition ± SEM for 5 independent
assays ran in triplicate.
■ Cordyceps ▲ Echinacea Milk Thistle ◆ Slippery Elm ● Valerian

Chapter 3 – P-glycoprotein Inhibition 113
The IC50 for P-gp inhibition was determined from the mean of triplicate
experiments ran on 3 separate occasions by nonlinear regression analysis as per the
method previously described (section 3.1.12).
Table 3-4: The IC50 (μg/ml) for products with the Calcein AM assay (n = 3).
Product Extract IC50 μg/ml
Cordyceps Aq 90.58 ±10.1
Cordyceps Meth #
Echinacea Aq #
Echinacea Meth #
Milk Thistle Aq #
Milk Thistle Meth 96.93 ±13.7
Slippery Elm Aq 69.95 ±8.44
Slippery Elm Meth 45.71 ±5.04
Valerian Aq #
Valerian Meth 353.1 ±27.4
#IC50 was greater than the concentration investigated and could not be determined.
Aq = Aqueous extract
Meth = Methanolic extract

Chapter 3 – P-glycoprotein Inhibition 114
3.11.3 ATPase Assay
ATPase activity is increased above the basal level when compounds bind to P-gp.
Basal ATPase activity is determined by measuring the ATPase activity in the
presence of orthovanadate, this represents non P-gp ATPase activity and can be
subtracted from the activity generated without orthovanadate to yield vanadate-
sensitive ATPase activity.
3.11.3.1 Control Experiments
Verapamil was incubated at increasing concentration with P-gp membranes (25 μg)
(Figure 3-7). The biphasic response seen with verapamil in the assay which is
consistent with previous reports (Sharom et al., 1995, Borgnia et al., 1996). As
DMSO is known to stimulate ATPase activity (Lehotský et al., 1992), increasing
concentrations were added to ensure that the 1% used in the assays did not affect
the incubation. At the 1% level used there is no affect of the DMSO on ATPase
activity (Figure 3-8). For each control experiment, ATPase activity measured in the
presence of sodium orthovanadate was subtracted from the activity generated
without sodium orthovanadate. Reactions were stopped by the addition of SDS
(3%) and were run in triplicate on three separate occasions.

Chapter 3 – P-glycoprotein Inhibition 115
Figure 3-7: Concentration dependent stimulation of ATPase activity in K562-
MDR cells by verapamil. Each point represents the mean of three incubations
±SEM ran in triplicate.
Figure 3-8: Concentration dependent stimulation of ATPase activity in K562-
MDR cells by DMSO. Each point represents the mean of three incubations ±SEM
ran in triplicate.

Chapter 3 – P-glycoprotein Inhibition 116
3.11.3.2 ATPase Activity with Complementary Products
To determine the potential for the complementary products to inhibit the verapamil
stimulated ATPase activity of P-gp, human P-gp membranes (25 μg) were
incubated at 37°C for 20 minutes in the presence of 50 μM verapamil. The ATPase
activity in the presence of verapamil was shown to increase 2 fold above the basal
level at this concentration (Figure 3-7). Increasing concentrations of extracts of the
complementary products (0-500 μg/ml) were added to the incubation and the
ATPase activity determined as described (section 3.11.3).

Chapter 3 – P-glycoprotein Inhibition 117
a)
b)
Figure 3-9: Inhibition of verapamil stimulated ATPase activity in K562-MDR cells
by a) aqueous and b) methanolic extracts of complementary products. ATPase
activity determined in the presence and absence of sodium orthovanadate,
fluorescence recorded at 850nm. Data expressed as the mean ±SEM of three
independent experiments ran in triplicate.
■ Cordyceps ▲ Echinacea Milk Thistle ◆ Slippery Elm ● Valerian

Chapter 3 – P-glycoprotein Inhibition 118
The IC50 for inhibition of the ATPase activity was determined from the mean of
triplicate experiments ran on 3 separate occasions by nonlinear regression analysis
as per the method previously described (section 3.10.6.3).
Table 3-5: The IC50 (μg/ml) for products in the verapamil stimulated ATPase assay
with K563-MDR cells (n = 3).
Product Extract IC50 μg/ml
Cordyceps Aq 138.5 ±14.42
Cordyceps Meth #
Echinacea Aq #
Echinacea Meth #
Milk Thistle Aq #
Milk Thistle Meth 135.55 ±15.13
Slippery Elm Aq 51.17 ±11.81
Slippery Elm Meth 28.48 ±4.55
Valerian Aq #
Valerian Meth 467.1 ±17.31
#IC50 was greater than the concentration investigated and could not be determined.
Aq = Aqueous extract
Meth = Methanolic extract

Chapter 3 – P-glycoprotein Inhibition 119
3.12 Discussion
3.12.1 Product Selection
Products were selected for investigation based on the risk of concurrent use with
therapeutic agents that are known to inhibit P-gp (Table 3-3). As many
conventional medications are substrates, inducers and/or inhibitors of P-gp, the
focus in this project was on products that have a broad therapeutic claim with
particular focus on those that would likely to be concurrently consumed by patients
also taking drugs for which failure would be a critical out come i.e.: the protease
inhibitors for HIV/AIDS treatment.
3.12.2 Method Selection
The inhibition of P-gp can be determined by several assays (Table 3-2). Calcein AM
was selected as this assay is amenable to high-throughput screening and can provide
information relating specifically to the inhibition of P-gp. The ATPase assays have
been used extensively and like the calcein AM assay can be relatively high-
throughout.
The major advantage with these assays in the context of complementary products is
that neither requires the identification of the product for the analysis, both have an
end point that is determined without directly measuring the product being
investigated.

Chapter 3 – P-glycoprotein Inhibition 120
3.12.3 Immunoblotting Assays
To confirm the expression of P-gp, K562-MDR cells were stained with the specific
MDR1 anti P-glycoprotein antibody (JSB-1). K562 cells, which do not express P-
gp, were used as a negative control. Immunoblotting confirmed the presence of P-
gp on the K562-MDR cells but not the K562 cells (Figure 3-4). This data confirms
that the K562-MDR cells were a viable cell line to use in these studies.
3.12.4 Calcein AM Assay
Calcein AM is a non-fluorescent, highly lipid soluble dye that rapidly penetrates the
plasma membrane of cells. In addition to this, Calcein AM is a good substrate for
the efflux carriers for both P-gp and multidrug resistance protein (MRP). When
Calcein AM enters the cells it is metabolized by the cytosolic esterases into calcein,
which is highly hydrophilic and fluorescent product.
In our study 5 of the 10 tested extracts produced and IC50 <100 μg/ml (Table 3-4),
with the methanolic extract of Slippery elm being the most significant (45.71 ±5.04
μg/ml).
3.12.5 ATPase Assay
ATPase activity is increased above the basal level when compounds interact with P-
gp, though these studies cannot determine if the test compound is acting as an
inhibitor, inducer or substrate for the transporter. By investigating the ATPase
activity in the presence of verapamil-stimulated cells, the data indicates which of
the extracts is more likely to be acting as an inhibitor.

Chapter 3 – P-glycoprotein Inhibition 121
Of the 10 extracts investigated, the 5 that were positive in the calcein AM assay
(IC50 <100 μg/ml) also inhibited the release of ATPase from the K5632-MDR
verapamil stimulated cells.
3.12.6 Comparison of the Assays
As shown in Table 3-6, the IC50s determined are comparable between the two
methods. For some of the extracts the Calcein AM assay was more sensitive (the
aqueous extract of Cordyceps and the methanolic extract of Milk Thistle) for the
remaining extracts, the ATPase assay was more sensitive. Significantly no extract
was positive in one assay and not the other.
Table 3-6: IC50 (μg/ml) for the extracts that showed inhibition in the Calcein AM
and ATPase assays (n = 3).
Product Extract Calcein AM Assay ATPase Assay
Cordyceps Aq 90.58 ±10.1 138.5 ±14.42
Milk thistle Meth 96.93 ±13.7 135.55 ±15.13
Slippery elm Aq 69.95 ±8.44 51.17 ±11.81
Slippery elm Meth 45.71 ±5.04 28.48 ±4.55
Valerian Meth 353.1 ±27.4 467.1 ±17.31
Aq = Aqueous extract
Meth = Methanolic extract
Several other studies have concluded that multiple assays should be utilised to
determined interactions of compounds with P-gp including those used in these
studies and additional assays such as transcellular transport assays (Schwab D et
al., 2003b, Seelig et al., 2000).

Chapter 3 – P-glycoprotein Inhibition 122
3.12.7 Herbal Products
3.12.7.1 Cordyceps
Cordyceps (Cordyseps sinensis) is from the genus of ascomycete fungi that originates
in Tibet. Traditional use in Tibetan and Chinese medicine is as an aphrodisiac and
as treatment for fatigue, inflammatory conditions, ageing, anti-viral, anti-fungal,
cancer and to enhance well being (Nogueira Neto et al., 2011). Research to date has
focused on isolating the many active components of this mushroom including,
cordycepin (3'-de-oxyadenosine), ergosterol and peptides including alpha-
aminoisobutyric acid, which have been proposed to be responsible for the
therapeutic claims (Ng and Wang, 2005). This is the first report of investigations
into extracts of Cordyceps and the potential for inhibition of P-gp.
Inhibition of P-gp was determined with the calcein AM assay for the aqueous
extract (IC50 90.58 ±10.1 μg/ml). The ATPase assay also confirmed that the
aqueous but not the methanolic extract of Cordyceps can inhibit P-gp (IC50 138.5
±14.42). This inhibition is of note as Cordyceps is a product with a very broad
therapeutic claim.
Concurrent use of this product with conventional medicines used in the treatment
of infections and chronic inflammatory conditions such as several of the macrolide
antibiotics including clarithromycin and roxithromycin which are also known to
inhibit P-gp (Hughes and Crowe, 2010), could result in a significant inhibition of P-
gp. Protease inhibitors used in the treatment of HIV, including nelfinavir and
ritonavir are also inhibitors of P-gp. With the reported benefits of Cordyceps there
is a likelihood of concurrent use with the protease inhibitors.

Chapter 3 – P-glycoprotein Inhibition 123
3.12.7.2 Echinacea
Echinacea (Echinacea species) is a genus of herbaceous plants that belongs to the
Asteraceae family, endemic to eastern and central North America. Medicinal
species of the Echinacea genus includes E. purpurea, E. angustifolia, and E. pallida,
which vary in their chemical composition (Greene et al., 2007). This is of concern
as products labelled as Echinacea may contain a wide variety of components. These
studies utilised E. purpurea. This product is commonly taken as an immune system
boost, for colds and flu, and to increase immune function. For this reason it is
commonly consumed by patients diagnosed with HIV/AIDS and those receiving
chemotherapeutic treatment.
With the high risk of concurrent use of Echinacea with anti-viral and/or
chemotherapeutic treatment, Echinacea is an important product to study in regards
to its interaction with P-gp. As substrates for P-gp include the protease inhibitors
indinavir and nelfinavir (Kim et al., 1998), and the chemotherapeutics doxorubicin
and vinblastine (Zhou S et al., 2008).
In our experiments, no significant inhibition was detected with any of the assays
conducted. These findings are consistent with previous studies indicating that the
assays used in our experiments do not overestimate the inhibition of P-gp. Studies
with Caco-2 cells and the transcellular transport of radiolabelled digoxin (a known
substrate for P-gp) also determined that there was no inhibition of P-gp with
ethanol extracts of E. purpurea (Hellum and Nilsen, 2008).

Chapter 3 – P-glycoprotein Inhibition 124
This in vitro study is supported further by a human in vivo trial. Echinacea (267mg)
was administered three times a day for two weeks to healthy volunteers, this
supplementation did not alter the pharmacokinetics of digoxin (Gurley B et al.,
2008).
3.12.7.3 Milk Thistle
Milk Thistle (Silybum marianum) is a flowering plant that is native to the
Mediterranean regions of Europe, North Africa and the Middle East. It is
commonly used as a liver tonic.
The aqueous extract showed no inhibition in either assay. This is consistent with a
previous study that determined no interaction with P-gp with the aqueous extract in
the Caco-2 cell transport assay (Budzinski et al., 2007). The methanolic extract
showed inhibition in both assays with an IC50 of 96.93 ± 13.7 μg/ml in the Calcein
assay and 135.55 ± 15.13 μg/ml in the ATPase assay.
In agreement with the experimental data (Table 3-6), studies using 50 μM silymarin
(a lipid soluble component of Milk Thistle) produced a significant accumulation of
digoxin in transport assay with Caco-2 cells (Zhang and Morris, 2003). This
inhibition was most significant for the apical to basal transport, mean transport
ratio Papp B-A/Papp A-B 1.62 and 4.48, respectively. Indicating that silymarin is a
substrate for P-gp and can inhibit the P-gp mediated efflux. As silymarin is lipid
soluble it is possible that this compound is responsible for the inhibition seen.

Chapter 3 – P-glycoprotein Inhibition 125
In vivo studies with healthy human volunteers determined no statistically
significant effect on digoxin pharmacokinetics with Milk Thistle (900mg a day)
(Gurley et al., 2006a). This lack of correlation may be explained as the in vitro
studies conducted by Zhang and Morris (Zhang and Morris, 2003) did not include
investigations with known P-gp inhibitors. As other transporters including MRP2
and BCRP are also present in Caco-2 cells, the more significant transport seen in
this bi-directional assay may have been due to transporters other than P-gp.
Conducting these studies in the presence of selecting P-gp inhibitors can confirm
that the results are due to P-gp based efflux transport.
3.12.7.4 Slippery Elm
Slippery Elm (Ulmus rubra) is native to eastern North America, the bark is
traditionally used to neutralize stomach acids, sooth digestive inflammation and
alleviate digestive pain. To date limited studies have been conducted into slippery
elm, several have investigated its use in the treatment of irritable bowel syndrome
(Zhou S et al., 2004), but to date there are no reports relating to the
pharmacokinetic characteristics of the herb.
With the proposed use of Slippery Elm as aiding in digestive disturbances there is
an increased risk of concurrent use of this product with patients receiving treatment
for cancer and HIV/AIDS as these treatments are known to cause digestive
disturbances and nausea. Slippery elm has also been investigated for its use in the
treatment of neoplasia (Mazzio and Soliman, 2009).

Chapter 3 – P-glycoprotein Inhibition 126
This is of concern as P-gp is an important measurement in determining the dose
and type of chemotherapy prescribed (Gasparini et al., 1993) and any alteration in
the measurement of P-gp activity may lead to incorrect dosage of chemotherapeutic
agents.
These studies demonstrated that both the aqueous and methanolic extracts of
Slippery Elm are inhibitors of P-gp. The methanolic extract of Slippery Elm was a
more potent inhibitor (IC50 45.71 ±5.04 and 28.48 ±4.55 μg/ml in the calcein and
ATPase assay respectively). Though the levels of inhibition by the aqueous extracts
is also significant (IC50 69.95 ±8.44 and 51.17 ±11.81 μg/ml in the calcein and
ATPase assay respectively). This IC50 is comparable to the known inhibitor
fluoxetine (IC50 64.0 ± 16.8 μg/ml) (Weiss et al., 2003), and therefore should be
considered significant and investigated further.
3.12.7.5 Valerian
Valerian (Valeriana officinalis) is a flowering plant that is native to Europe and Asia
and is used in the treatment of insomnia. The use of Valerian is increasing and
therefore the risk of interactions is increasing.
The methanolic extract acted as a weak P-gp inhibitor (IC50 353.1 ±27.4 and 467.1
±17.31 μg/ml in the calcein and ATPase assay respectively). In a previous study
the IC50 could not be determined in the Caco-2 cell transport assay, but the IC25 was
shown to be 1777 μg/ml (Hellum and Nilsen, 2008). The discrepancy in this data
may not only be due to the different assays used but also the extraction technique
for the herbal products.

Chapter 3 – P-glycoprotein Inhibition 127
In the studies conducted by Hellum and Nilsen (Hellum and Nilsen, 2008),
ethanol was used as the extraction solvent, this would extract different components
than the methanol used in these experiments.
3.13 Conclusions
These studies have shown that several products can act as inhibitors of P-
glycoprotein and that this inhibition may be significant for several of the extracts
tested. Significant inhibition (IC50 <100 μg/ml) was determined for the aqueous and
methanolic extracts of Cordyceps and Milk Thistle respectively and all the extracts
of Slippery Elm. The methanolic extract of Slippery Elm was responsible for the
most significant inhibition of P-glycoprotein with an IC50 of 45.71 ±5.04 μg/ml
with the calcein AM assay and 28.48 ±4.55 μg/ml with the ATPase assay.
We have also demonstrated that the data between the two assay methods utilised-
the fluorescent based calcein AM assay and the enzyme based ATPase assay are
comparable when being used with this limited number of complementary products.
Previous studies have shown that these assays are often comparable (Schwab D et
al., 2003), though difference are known to occur. Compounds that have high
esterase activity are known to cause false positives in the calcein assay and several
known sub stares for P-gp do not stimulate ATPase activity (colchicine, vincristine
and methotrexate) (Litman et al., 1997). The potential for false positives or false
negatives at the early screening stage is a risk that can be avoided by employing
both the ATPase and the calcein AM assay simultaneously.

Chapter 4- Cytochrome P450 Inhibition 128
Chapter 4 - Cytochrome P450:
Inhibition of Human Cytochrome P450 Enzymes by
Complementary Products
4.1 Introduction - Mixed Function Oxidases
The mixed function oxidases (MFOs) were initially characterised in 1955
concurrently by two groups (Hayaishi et al., 1955, Mason et al., 1955), and require
both an oxidant and a reductant. Reactions catalysed by the MFOs cause one atom
of molecular oxygen to be reduced to water whilst the other is incorporated into an
enzyme substrate.
4.2 Cytochrome P450 Monooxygenases
The cytochrome P450 (CYP) system is comprised of a family of haeme-containing
(haemoprotein) enzymes with closely related isoforms, belonging to the MFOs.
This enzymatic system is found in almost all organisms, including mammals,
bacteria and plants; being crucial for the oxidative, per-oxidative, and reductive
metabolism of exogenous and endogenous compounds. More than >11,000 CYPs
have been identified, and new CYPS are continuously being added (Nelson, 2009).
The most common reaction catalysed by the CYP system is a monooxygenase
reaction, shown in the equation below:
where RH represents an oxidisable drug substrate and ROH the hydroxylated
metabolite, NADPH-nicotinamide adenine dinucleotide phosphate.

Chapter 4- Cytochrome P450 Inhibition 129
CYPs are composed of approximately 500 amino acids and have an iron
protoporphyrin IX as the prosthetic group, shown in Figure 4-1.
Figure 4-1: Structure of iron protoporphyrin IX, the prosthetic group of
cytochrome P450 (Gibson and Skett, 2001).
Evidence for the existence of CYPs first emerged in the 1950s; studies revealed an
enzyme system in liver that converted drugs and aromatic compounds into more
polar metabolites and required NADPH (Axelrod, 1955, Brodie et al., 1955). An
understanding of the biochemical nature of CYPs was gained from work initially
involving liver pigments. It was observed in liver microsomes that a red-brown
pigment when reduced by NADPH could be detected complexed with carbon
monoxide due to its characteristic absorption peak at 450 nm (Garfinkel, 1958,
Klingenberg, 1958).

Chapter 4- Cytochrome P450 Inhibition 130
This peak, from which CYPs gain their name, is due to the iron contained in the
haeme prosthetic group, which is normally in the oxidized state, this absorbs light
at a maximum wavelength of 418 nm but when reduced produces the peak at 450
nm. With the use of detergent solubilisation of microsomes, and interaction studies
with isocyanide ligands, this pigment was ultimately characterized by Omura and
Sato (Omura and Sato, 1964a, Omura and Sato, 1964b). It was shown that the
pigment was a cytochrome with typical a, b and Soret absorption bands, Figure 4-2.
Figure 4-2: Typical absorption spectra for cytochrome P450. Carbon monoxide
and ethyl isocyanide difference spectra of liver microsomes (Omura and Sato,
1962).

Chapter 4- Cytochrome P450 Inhibition 131
4.3 Cytochrome P450 Superfamily
4.3.1 CYP Families
The CYP enzymes have been subdivided into families and subfamilies based on
similarities in their amino acid sequence. Isoenzymes with 40% similarity are
grouped in families denoted by a number i.e. CYP1 or CYP2. Isoenzymes within a
family that have greater than 55% sequence similarity are grouped in a subfamily
designated by a capital letter i.e. groups of family CYP2 are known as CYP2C,
CYP2D, CYP2E. Individual isoenzymes that have been specifically identified are
given a further number i.e. CYP2E1.
To date there have been 107 genes identified encoding for CYPs in humans, with
18 families and 45 subfamilies. Of the genes identified, 57 have been isolated,
identified and characterised, most appear to be expressed primarily in the
endoplasmic reticulum. Table 4-1 summarises information for the known human
CYP genes.

132
Table 4-1: Human cytochrome P450 genes. The 57 CYPs isolated in humans are shaded based on catalytic activities. Information collated
from various sources: Number of amino acids, substrates, inducers and inhibitors (Cytochrome P450 Knowledgebase, 2006), tissue sites,
subcellular location and typical reactions (Guengerich, 2005), with additional typical reactions from (Weizmann Institute of Science, 2009) and
the classification (Klaassen, 2008).
CYP Amino
acids
Tissue sites Subcellular
locationa
Classification Typical reactionb Substrates Inhibitors Inducers
1A1 512 Lung, extra-hepatic sites.
Peripheral blood cells.
ER Xenobiotics Benzo[]pyrene 3-hydroxylation 141 96 100
1A2 515 Liver ER Xenobiotics Caffeine N3-demethylation 246 208 48
1A8 379
1B1 543 Extra-hepatic sites, lung,
kidney
ER Xenobiotics 17-oestradiol 4-hydroxylation 78 47 35
2A6 494 Liver, lung, extra-hepatic
sites
ER Xenobiotics Coumarin 7-hydroxylation 120 93 9
2A7 494 ER Unknown 2
2A13 494 Nasal tissue ER Xenobiotics Activation of 4-(methylnitrosamino)-1-(3-
pyridyl)-1-butanone (NNK)
15 1
2A18
2B6 491 Liver, lung ER Xenobiotics (S)-Mephenytoin N-demethylation 136 58 27
2B7 377
2C8 490 Liver ER Xenobioticsc Taxol 6-hydroxylation 110 64 11
2C9 490 Liver ER Xenobioticsc Tolbutamide methyl–hydroxylation 215 214 30
2C10 485 9 7
2C17 468
2C18 490 Liver ER Xenobiotics 37 1
2C19 490 Liver ER Xenobiotics (S)-Mephenytoin 4’-hydroxylation 187 137 15
2C56 70
2C57 256

133
CYP Amino
acids
Tissue sites Subcellular
locationa
Classification Typical reactionb Substrates Inhibitors Inducers
2C58 96
2C59 114
2C60 56
2C61 59
2C62 183
2C63 56
2C64 73
2D6 500 Liver ERd Xenobiotics Debrisoquine 4-hydroxylation 302 253 8
2D7
2D8
2D31 43
2E1 493 Liver, lung, other tissues ER Xenobiotics Chlorzoxazone 6-hydroxylation 161 102 28
2F1 491 Lung ER Xenobiotics 3-Methylindole activation 6 1
2G1 44
2G2 501
2J2 502 Lung ER Xenobioticsc Arachidonic acid oxidations 6 2
2R1 506 ER Vitamin D Vitamin D hydroxylation
2S1 504 Lung ER Unknown Benzo[a]pyrene-trans-7,8-dihydrodiol
hydroxylation
2T2 468
2T3 344
2U1 539 ER Unknown Fatty acids hydroxylation. 4
2W1 495 ER Unknown 3
3A3 503 13 2 9
3A4 503 Liver, small intestine ER Xenobioticsc Testosterone 6-hydroxylatione 636 384 129
3A5 502 Liver, lung ER Xenobiotics Testosterone 6-hydroxylation 59 12 15
3A7 503 Foetal liver ER Xenobiotics Testosterone 6-hydroxylation 34 8 8
3A43 524 mRNA in gonads (ER) Unknown Testosterone hydroxylation# 3 2
3A51
3A52 18

134
CYP Amino
acids
Tissue sites Subcellular
locationa
Classification Typical reactionb Substrates Inhibitors Inducers
3A53
3A54 32
3A55 39
4A11 521 Liver ER Fatty acids/
Eicosanoids Fatty acid -hydroxylation 9 3 10
4A20 504
4A22 519 ER Unknown Fatty acid -hydroxylation#
4A26
4A27
4B1 511 Lung ER Fatty acids/
Eicosanoids Lauric acid -hydroxylation 12 2
4F2 520 Liver ER Fatty acids/
Eicosanoids Leukotriene B4 -hydroxylation 14 1 5
4F3 520 Neutrophils ER Xenobioticsc Leukotriene B4 -hydroxylation 14 1 1
4F8 520 Seminal vesicles ER Fatty acids/
Eicosanoids Prostaglandin -2 hydroxylation 6
4F10 125
4F11 523 Liver ER Unknown Arachidonic acid -, -2 hydroxylation 5
4F12 458 Liver ER Fatty acids/
Eicosanoids Arachidonic acid -, -2 hydroxylation (?)# 8
4F22 Unknown 12(R)-lipoxygenase pathway. (?)#
4F24 473
4F25 109
4F26 101
4F27 109
4F29 156
4F30 78
4F31
4F32 152
4F33 76
4F34 46

135
CYP Amino
acids
Tissue sites Subcellular
locationa
Classification Typical reactionb Substrates Inhibitors Inducers
4F35 77
4F36 61
4V2 539 Unknown Fatty acid -hydroxylation#
4X1 506 Unknown 2
4Z1 503 Unknown
4Z2 505
5A1 533 Platelets ER Fatty acids/
Eicosanoidsf
Thromboxane A2 synthase reaction 4 8 2
7A1 504 Liver ER Bile acid Cholesterol 7-hydroxylation 6 12 4
7B1 506 Brain ER Bile acid Dehydroepiandrosterone 7-hydroxylation 6 3
8A1 500 Aorta, others ER Fatty acids/
Eicosanoidsf
Prostacyclin synthase reactiong 3 2
8B1 462 Liver ER Bile acid 7-hydroxyprogesterone 12-hydroxylation (?) 1 6
11A1 521 Adrenals, steroidogenic
tissues
Mit Steroidogenic Cholesterol side chain cleavage 4 4
11B1 503 Adrenals Mit Steroidogenic 11-Deoxycortisol 11-hydroxylation 5 13 1
11B2 503 Adrenals Mit Steroidogenic Corticosterone 18-hydroxylation 7 6
17A1 508 Steroidogenic tissues ER Steroidogenic Steroid 17-hydroxylation
19A1 502 Steroidogenic tissues,
adipose, brain
ER Steroidogenic Androgen aromatization 3 11
20A1 145 Unknown
21A1 495 3
21A2 494 Steroidogenic tissues ER Steroidogenic 17-Hydroxyprogesterone 21-hydroxylation 1
21B0 495 1
24A1 513 Kidney Mit Vitamin D 25-Hydroxyvitamin D3 24-hydroxylation 8 3 1
26A1 497 Several ER Retinoic acid Retinoic acid 4-hydroxylation 4 1 2
26B1 512 Brain ER Retinoic acid Retinoic acid 4-hydroxylation 2 1
26C1 199 (ER?) Vitamin D Retinoic acid 4-hydroxylation# 3 1 1
27A1 531 Liver Mit Bile acidi Sterol 27-hydroxylation 13 4 6
27B1 508 Kidney Mit Vitamin D Vitamin D3 1-hydroxylation 4 1 1
27C1 531 Unknown 3

136
CYP Amino
acids
Tissue sites Subcellular
locationa
Classification Typical reactionb Substrates Inhibitors Inducers
39A1 582 Liver (?) ER Bile acid 24-Hydroxycholesterol 7-hydroxylase 2
46A1 516 Brain ER Bile acid Cholesterol 24-hydroxylation (?) 8
46A4 101
51A1 509 Liver, testes ER Bile acidj Lanosterol 14-demethylation 5 4 2
51P1 513
51P2 516
51P3 514
aER- endoplasmic reticulum (microsomal), Mit = mitochondria
bIf known
cAlso involved in fatty acid and eicosanoid metabolism
dMainly endoplasmic reticulum, some detected in the mitochondria
eAlso involved in bile acid synthesis
fThromboxane A synthase (TBXAS1)
gProstaglandin I2 (prostacyclin) synthase (PTGIS)
hAlso involved in retinoic acid metabolism
iAlso involved in vitamin D metabolism
jAlso involved in cholesterol biosynthesis
#Information from (Weizmann Institute of Science, 2009).

Chapter 4- Cytochrome P450 Inhibition 137
4.4 Function of CYPs
Of the CYPs with known catalytic activities, 14 are involved in steroidogenesis, 4 in
aspects of metabolism of vitamins, 5 in eicosanoid metabolism, 4 have fatty acids as
their substrates and 15 catalyse transformation of xenobiotic chemicals (Table 4-1).
Those classified as xenobiotic transforming are mainly in the families 1-3 and
discussed in greater detail (section 4.9, 4.10 and 4.11 respectively).
The CYP catalytic cycle leading to substrate oxidation is complex and may not
necessarily take place in the linear fashion shown in Figure 4-3. Substrate binding,
which is shown (in this figure) to occur prior to the reduction of the haeme iron
may actually occur at other steps of the catalytic cycle (Yun et al., 2005, Isin and
Guengerich, 2006).
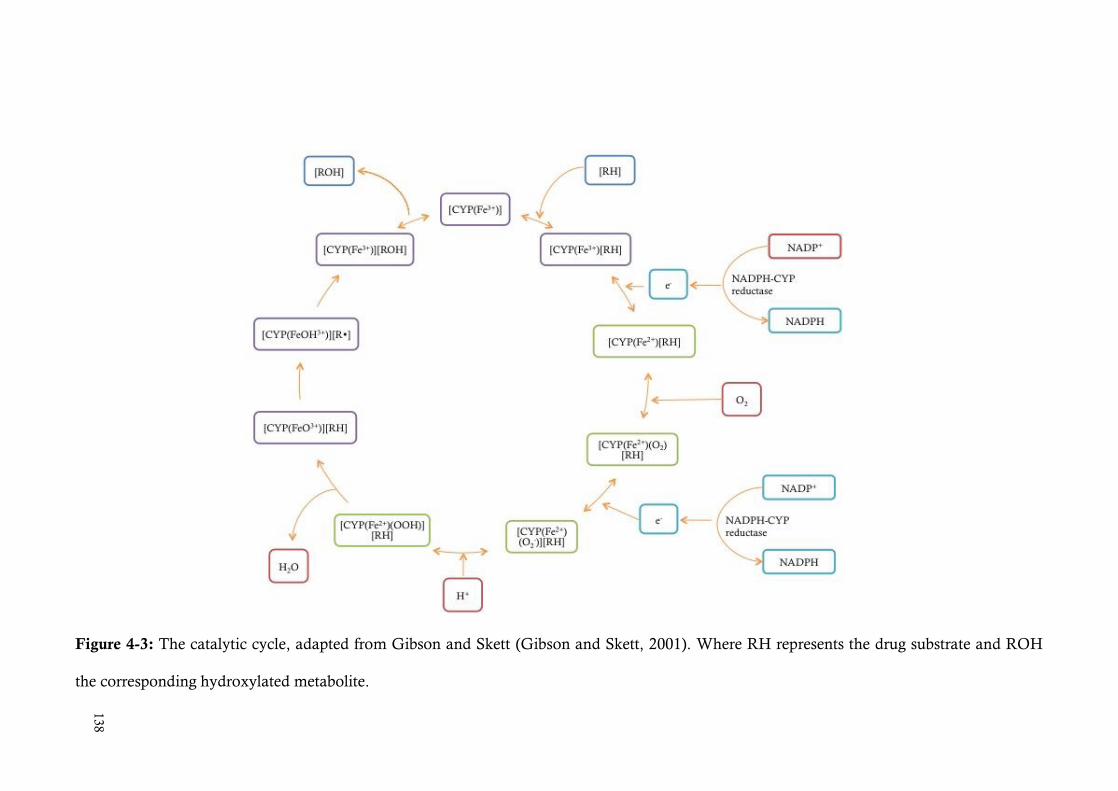
138
Figure 4-3: The catalytic cycle, adapted from Gibson and Skett (Gibson and Skett, 2001). Where RH represents the drug substrate and ROH
the corresponding hydroxylated metabolite.

Chapter 4- Cytochrome P450 Inhibition 139
4.4.1 Drug Metabolism
It has been shown that 75% of all drugs can be metabolised by 3 CYPs (CYP3A4,
CYP2D6 and CYP2C9) (Rendic, 2002), and a set of 6-7 CYPs (CYP1A1,
CYP1A2, CYP1B1, CYP2A6, CYP2B6, CYP2C8, CYP2C9, CYP2C19, CYP2D6
CYP2E1 and CYP3A4) will account for 90-95% of all drug metabolism (Evans and
Relling, 1999) (Figure 4-4). CYPs are involved in the metabolism of 78% of the 200
top selling prescription medications in the United States (Zanger et al., 2008, Evans
and Relling, 1999).
The relative contributions of these xenobiotic-metabolising CYPs are, to some
extent, a function of the relative abundance, although there are some important
exceptions. The patterns reported for human liver do not necessarily apply in other
tissues and/or species.

Chapter 4- Cytochrome P450 Inhibition 140
Figure 4-4: Estimated contribution of individual human cytochrome P450 isoforms
to the metabolism of the 200 top selling drugs. Adapted from Evans and Relling
(Evans and Relling, 1999).
1A1 1A2 1B1
2A6
2B6 2C8
2C9
2C19
2D6
2E1
3A4

Chapter 4- Cytochrome P450 Inhibition 141
4.5 Regulation of CYPs
The regulation of CYP enzymes is controlled by several factors including age,
hormones (sex steroids, growth hormones, thyroid hormones), diet, nutritional and
disease status.
4.5.1 Factors that Regulate CYPs
4.5.1.1 Age
Microsomal protein content changes with age, neonates have an average of 26
mg/g liver (Hines, 2008), the average for a 30 year old is 40 mg/g liver with a
decline by the age of 60 to an average of 31 mg/g liver (Barter et al., 2007b).
4.5.1.2 Hormonal Factors
The hormones of the pituitary, adrenal, testes and ovaries are predominantly
involved in the developmental control and sexual dimorphism of the CYPs. The
differing patterns of growth hormones are known to cause the induction
(section 4.7) or repression of some CYP isoenzymes.
For example continuous low levels of growth hormone in women causes a
reduction in CYP2C1 and an increase in CYP2C12 by altering gene transcription
(Gibson and Skett, 2001). As pregnancy alters the hormone status, in particular the
increase in progesterone (and its metabolites) in the mother’s circulation and the
breast milk may inhibit drug metabolism. During pregnancy, elimination of drugs
metabolised by CYP2A6, CYP3A4, CYP2D6 and CYP2C9 is increased, whilst
elimination of CYP1A2 and CYP2C19 substrates is decreased (Dempsey et al.,
2002, Anderson, 2005, Hodge and Tracy, 2007).

Chapter 4- Cytochrome P450 Inhibition 142
4.5.1.3 Diseases
As the liver contains the greatest concentration of CYPs, diseases affecting the liver
including cirrhosis, alcoholic liver disease, hepatitis and hepatocarcinoma all alter
the level and activities of the CYPs and therefore drug metabolism. CYP activity
may also be decreased due to altered hepatic blood flow and hypoalbuminaemia.
Infection and/or inflammation can alter the activity and expression levels of CYPs
in the liver as well as extra-hepatic tissues such as the kidney and brain (Renton,
2005). Known agents that can alter CYP levels include viruses (Hepatitis A,
Influenza A and B), bacteria (Helicobacter pylori, Listeria monocytogenes) and
inflammatory agents (vaccines and tissue injury) (Devchand et al., 1996).
Generally this infection/inflammation results in an inhibition of activity
(section 4.8) but in some circumstances may lead to induction (section 4.7). The
latter is particularly seen with the CYP4A family. Under inflammatory conditions
this enzyme family which is predominantly involved in fatty acid hydroxylation
(Table 4-1), is induced, it has been proposed that this is an important step in the
termination of the inflammatory eicosanoids (Morgan, 1997).
4.5.1.4 Diet and Nutrition
The CYPs are highly responsive to nutrient (protein, carbohydrates, fat, vitamins
and minerals), and non-nutrient factors (phytochemicals, antioxidants, flavours and
agents including tobacco smoke and pesticides) present in the diet (Gibson and
Skett, 2001, Parke and Ioannides, 1994).

Chapter 4- Cytochrome P450 Inhibition 143
In rodents, the activities of hepatic MFOs are known to increase up to 30% when
the dietary protein content is increased (Kato et al., 1980), conversely rats fed a
low-protein diet are known to have decreased drug metabolism capability (Gibson
and Skett, 2001). Vitamin A and its metabolites are known to affect drug
metabolism, ligands that bind to the retinoid X receptor stimulate CYP2B1,
CYP2C11, CYP3A and CYP4A, but ligands for the retinoic acid receptor decrease
CYP1A2 (Howell et al., 1998, Gibson and Skett, 2001).
4.5.1.5 Environmental Factors
Lead has been shown to decrease CYP1A1 activity in isolated human hepatocytes
(Vakharia et al., 2001a), and mercury is a known potent inhibitor of CYP1A2
(Vakharia et al., 2001b). Inhibition of CYP1A1 by heavy metal contamination
either from diet, environmental exposure and even as components of
complementary products may therefore cause adverse drug interactions with
therapeutic agents that are metabolised by the CYP1 family including the anti-
cancer agents 5-fluorouracil (Yoshisue et al., 2001), and the anti-malarial drug
quinidine and quinine (Granvil et al., 2002). As heavy metals can accumulate over
time, cumulative exposure becomes important to consider.
TCDD (2,3,7,8-tetrachlorodibenzo-p-dioxin) a polycyclic herbicide is known to
affect both phase I and II metabolism, it causes induction of the metabolism of
polycyclic hydrocarbons and the enzymes UDP-glucuronsyltransferase and
glutathione-S-transferase (GST) (Gibson and Skett, 2001). TCDD is known to
induce CYP1A1 via activation of the aryl-hydrocarbon receptor (Nebert et al.,
2000).

Chapter 4- Cytochrome P450 Inhibition 144
4.6 Genetic Polymorphism
Genetic polymorphism is a common phenomenon in the CYP superfamily, and is a
major cause of inter-individual and ethnic differences in the rates (which can vary
by more than 100-fold) at which individuals metabolise drugs. The occurrence of
different gene variants translates into four major phenotypes:
Poor metabolisers (PMs): Carrying two defect alleles and therefore completely
lacking in enzyme activity.
Intermediate metabolisers (IMs): Heterozygous for a defect allele or carrying
two alleles resulting in enzyme with decreased activity.
Extensive metabolisers (EMs): Carrying two functioning alleles.
Ultrarapid metabolisers (UMs): Carrying more than 2 active gene copies.
To date alleles have been described for the CYP1A1, CYP1A2, CYP1B1, CYP2A6,
CYP2A13, CYP2B6, CYP2C8, CYP2C9, CYP2C19, CYP2D6, CYP2E1,
CYP2F1, CYP2J2, CYP2R1, CYP2S1, CYP2W1, CYP3A4, CYP3A5, CYP3A7,
CYP3A43, CYP4A11, CYP4A22, CYP4B1, CYP4F2, CYP5A1, CYP8A1,
CYP19A1, CYP21A2, and CYP26A1 genes (http://www.cypalleles.ki.se). The
different polymorphic variants are designated by the addition of an asterisk
followed by a number for example, CYP2D6*1.
Toxicity can arise depending on the phenotype. With PMs, a xenobiotic may
accumulate, or in the case of a pro-drug, therapeutic efficacy may be compromised
due to a lack of activation. Alternatively toxicity may arise in the UMs due to the
accumulation of an active or reactive metabolite or therapeutic efficacy may be
decreased due to the rapid clearance of a xenobiotic.

Chapter 4- Cytochrome P450 Inhibition 145
The number of alleles varies for each CYPs and is shown in Figure 4-5. CYP2D6
and 21A2 have the greatest level of polymorphism.
Figure 4-5: Frequency of alleles identified for human cytochrome P450s. The
number of alleles includes haplotypes, normal variants, gene deletions, pseudo
gene-derived mutations, combinations of pseudo-derived mutations and rare
mutations and combinations. Additionally many single nucleotide polymorphisms
(SNPs) have been identified for which the haplotype has yet to be identified.
Information is based on the homepage of the human cytochrome P450 (CYP) allele
nomenclature committee (http://www.cypalleles.ki.se).
1A1
1A2
1B1
2A6
2A13
2B6
2C8
2C9
2C19
2D6 2E1
2F1
2J2 2R1
2S1
2W1
3A4
3A5 3A7
3A43 4A11
4A22
4B1 4F2
5A1
8A1
19A1
21A2
26A1

Chapter 4- Cytochrome P450 Inhibition 146
4.7 Induction
The ability for foreign chemicals to induce CYPs was first described in 1954 (Brown
et al., 1954). Subsequent work demonstrated that PAHs and barbiturates increase
enzyme activity by inducing the synthesis of enzyme protein (Conney et al., 1957,
Conney et al., 1961). Many CYPs in humans are susceptible to induction including
CYP1A, CYP2A, CYP2B, CYP2C, CYP2E and CYP3A. To date induction of
CYP2D6 has not been identified.
The induction of CYPs can have a major impact on drug metabolism,
pharmacokinetic properties, and drug-drug interactions, on the toxicity and
carcinogenicity of foreign chemicals, and on the activity and disposition of
endogenous hormones (Conney, 1982). It is now known that a wide range of
chemicals are capable of causing induction including therapeutic agents, pesticides,
food additives, industrial chemicals, diet, natural products and environmental
pollutants (Pelkonen et al., 2008).
Induction can arise as a consequence of increased synthesis, decreased degradation,
activation of pre-existing components or a combination of these processes.
Induction is said to occur when there is an increase in the amount and activity of
enzyme. The time for induction is not only dependent on the half-life of the
inducing agent but also the time course for enzyme degradation production. The
two main mechanisms by which CYP induction occurs are:
1) Nuclear receptor-mediated induction. Transcriptional gene activation is the
most common mechanism for CYP induction (section 4.7.1.1).

Chapter 4- Cytochrome P450 Inhibition 147
2) Stabilization of the mRNA or enzyme. For example, troleandomycin
induces rat CYP3A by decreasing the rate of CYP3A protein degradation
with no increase in the rate of protein synthesis (Watkins et al., 1986).
Though induction of CYPs is highly conserved, species differences are known
(Dickins, 2004, Hewitt et al., 2007). The transcription factors encoded for by the
nuclear receptors are the molecular basis of species differences.
4.7.1 Nuclear-Receptor Family
The nuclear receptor (NR) superfamily codes for transcription factors that
transform extra-cellular and intra-cellular signals into cellular responses by
triggering the transcription of target genes, including the expression of phase I and
II enzymes and transporters.
The NR super-family consists of a large group of transcription factors, including the
aryl hydrocarbon receptor (AhR), constitutive androstane receptor (CAR, NR1l3),
pregnane X receptor (PXR or the human orthologue SXR; NR1l2), bile-activated
farnesoid X receptor (FXR, NR1H4), peroxisome proliferator-activated receptor
(PPAR), cholesterol-sensing liver X receptor (LXR, NR1H2/3), thyroid hormone
receptors (TR), the retinoic acid receptors (RAR), hepatic nuclear factor (HNF)
family members, glucocorticoid receptor (GR), and the CCAAT/enhancer-binding
proteins (C/EBPs) (Tompkins and Wallace, 2007, Pelkonen et al., 2008,
Honkakoski and Negishi, 2000).

Chapter 4- Cytochrome P450 Inhibition 148
CYP genes are able to respond to both endogenous and exogenous signals by
changes in CYP gene expression, and also to modulate the strength and duration of
these signals and even to form new signalling molecules through CYP-mediated
metabolism. These signalling molecules may then exert their function via the
ligand-dependent NRs. (Honkakoski and Negishi, 2000). Not all of the NRs listed
above are involved in CYP induction. AhR, PXR/ SXR, and CAR have been
identified as the xenosensors; the others are not primarily activated by xenobiotics.
4.7.1.1 Nuclear-Receptor Mediated Induction
The NRs, AhR and CAR are localized in the cytoplasm of hepatocytes and once
activated are translocated to the nucleus, whilst PXR has been identified in the
cytoplasm but is mainly located in the nucleus (Richter et al., 2001, Kawana et al.,
2003, Squires et al., 2004, Amacher, 2010). In the absence of a ligand, the NRs are
associated with co-repressor complexes, conferring a basal level of transcription
(Figure 4-6).
With ligand binding to the ligand-binding domain of the NRs, conformational
changes occur leading to the release of co-repressors and recruitment of co-
activators. Recruitment of co-activators and a dimerization partner (retinoid X
receptor, RXR, for CAR/PXR and the AhR nuclear translocator, ARNT, for AhR)
leads to chromatin remodelling and subsequent transcriptional activation.
Regulation of gene transcription is achieved through binding of the nuclear receptor
DNA binding domain to respective DNA response elements present in the
promoter region of the target CYP gene (Amacher, 2010).

Chapter 4- Cytochrome P450 Inhibition 149
Figure 4-6: Receptor-mediated mechanism of CYP enzyme induction. Adapted
from Hewitt (Hewitt et al., 2007). AhR- aryl hydrocarbon receptor, Arnt- AhR
nuclear translocator, CAR- constitutive androstane receptor, PXR- pregnane X
receptor, RXR- retinoid X receptor, X- xenobiotic/chemical inducer.
4.7.1.2 AhR
The aryl hydrocarbon receptor (AhR) is a basic helix-loop-helix protein that belongs
to the family of PAS (PER- Drosophila period clock protein, ARNT-AhR nuclear
translocator, SIM- Drosophila single-minded protein) domain transcription factors
which binds dioxins and aromatic hydrocarbons (Gu et al., 2000, Poland and
Glover, 1976).

Chapter 4- Cytochrome P450 Inhibition 150
The AhR and the AhR nuclear translocator, both present in high levels in placental
tissue, (Hakkola et al., 1997, Manchester et al., 1987), control expression and
activity of the isoenzymes belonging to the CYP1 family.
4.7.1.3 CAR
The constitutive active/androstane receptor (CAR) is located in the cytosol and
when activated by phenobarbital induces CYP2B. It is now known that activated
CAR induces many enzymes and transporters, including those that encode for the
expression of CYP2B, 2C, 3A, NADPH-cytochrome P450 reductase,
sulfotransferases, glucoronsyltransferases and glutathione-S-transferase, and
transporters such as Mrp2 and Mrp4 (Ueda et al., 2002, Kast et al., 2002, Assem et
al., 2004).
4.7.1.4 PXR
The pregnane X receptor (PXR) also known as PAR, SXR and NR1I2 activates
CYP3A genes in response to diverse chemicals including natural and synthetic
steroids (Zhou et al., 2009a, Lehmann et al., 1998, LeCluyse, 2001, Istrate et al.,
2010). Unlike the other nuclear receptors, PXR has more divergence across the
species with the ligand binding domain having only 70-80% homology (LeCluyse,
2001, Lehmann et al., 1998) which accounts for the species differences seen, for
example rifampicin is an inducer of CYP3A in humans and rabbits but not rodents
(Waxman, 1999).

Chapter 4- Cytochrome P450 Inhibition 151
4.7.2 Post-Transcriptional Induction
Post-transcriptional regulation is known to occur, with CYP2E1 being mainly
regulated at this level. Xenobiotics responsible for the regulation of CYP2E1
include ethanol, acetone and isoniazid. It has been proposed that these agents work
by enzyme stabilization and therefore prevention of the degradation of the CYP2E1
enzyme (Song et al., 1989, Carroccio et al., 1994).
4.8 Inhibition
Inhibition of metabolism may in general mean an acute decrease of metabolism of a
particular substrate by another simultaneous present chemical (concurrent
administration) or a time-dependent decrease in the amount of drug metabolizing
enzyme by several factors such as chemical injury or a disease process. Specifically,
inhibition of CYPs can occur at several stages of the catalytic cycle (Figure 4-3),
this may be at the point of substrate binding; the reduction of the ferrous form by
NADPH-cytochrome P450 reductase; the binding of molecular oxygen; the point of
substrate oxidation; interference with the electron supply (from P450 reductase
and/or cytochrome b5); the point of product release.
The inhibition of any CYP isoenzyme may be clinically significant; the degree of
significance and the potential for significance is determined by several factors:
Therapeutic index (TI) of the drug/xenobiotic.
o Drugs with a narrow TI have an increased risk of adverse reactions.
Proportion of metabolism of the drug conducted by the inhibited pathway.
o Many drugs are capable of being metabolised by an alternate and/or
secondary pathway(s).

Chapter 4- Cytochrome P450 Inhibition 152
Affinity constant (Ki) of the inhibitor relative to the affinity constant (Km) of
the drug.
o An inhibitor may have a much greater affinity for a CYP catalytic site than
the drug/xenobiotic of interest.
Whether or not the drug is metabolised to a pharmacologically active or toxic
metabolite by the inhibited enzyme.
Liver damage.
o Whilst this is not truly an inhibition of CYP enzymes, destruction of hepatic
tissue causes a decrease in CYP enzymes available.
As CYPs have broad substrate specificity, competition between substrates for the
same enzyme occurs. Such competition depends on their relative affinities and
inhibitory potencies. Additionally inhibition is dose related; at low concentrations
the inhibitor may be relatively selective for a single CYP, whilst at high
concentrations, the inhibitor may be relatively non-selective and several CYP
enzymes may be inhibited. The inhibition of CYPs can be broadly divided into two
categories; irreversible and reversible. The distinction between these two groups is
relative and can be difficult to determine if the inhibitor binds tightly to the enzyme
and is slowly released (Wienkers and Heath, 2005).
4.8.1 Irreversible Inhibition
Irreversible inhibition occurs with competitive/non-competitive co-substrates.
There are two basic processes that lead to irreversible inhibition:

Chapter 4- Cytochrome P450 Inhibition 153
Autocatalytic inactivation- (or suicide inhibition) occurs when a reactive
drug metabolite binds to CYP and alters the structure of the CYP
irreversibly. The inhibition of CYP1A2 by furafylline is a classical
autocatalytic inactivation reaction. (Ortiz de Montellano et al., 1979, Yin et
al., 2000, Kunze and Trager, 1993). Additionally drugs that contain terminal
olefinic or acetylinic substituent’s are likely to be suicide substrates of CYPs
(Hasler et al., 1999).
Complexation of reactive intermediates occurs when drug metabolites are
formed that bind tightly to the CYP haeme moiety. After formation, the
complex between the CYP and the metabolite intermediate is quite stable.
The insecticide piperonyl butoxide is a classic example of this (Hasler et al.,
1999, Murray and Reidy, 1990). The most significant class of drugs that
form metabolite-intermediates is the alkylamines (Hasler et al., 1999).
The major distinction between autocatalytic inactivation and complexation of
metabolic intermediate, is that in the latter case the haemeprotein is rendered
catalytically inert, but not destroyed. As the CYP must be reactivated or re-
synthesized to restore activity, irreversible inhibition is said to be long lasting
(Pelkonen et al., 2008, Halpert, 1995, Kent et al., 2001).
4.8.2 Reversible Inhibition
Reversible inhibitors (or direct inhibitors) differ from irreversible inhibitors in that
they act fast and do not permanently destroy the enzyme (Lin and Lu, 1998,
Hollenberg, 2002, Pelkonen et al., 2008).

Chapter 4- Cytochrome P450 Inhibition 154
They bind to the active site with varying affinities and compete with substrates
(Pelkonen et al., 2008). This includes agents that bind to the hydrophobic regions of
the active site, or coordinate to the haeme iron atom or, enter into specific
hydrogen bonding or ionic interactions with active-site-residues (Correia and Ortiz
de Montellano, 2005, Lewis and Ito, 2010, Murray and Reidy, 1990).
Reversible inhibition can be further subdivided into the following categories:
Competitive inhibition
- competition between a substrate and the inhibitor to bind to the same
position on the active site of the enzyme.
Non-competitive inhibition
- the active binding site of the substrate and inhibitor is different from
each other.
Uncompetitive inhibition
- the inhibitor binds to the enzyme-substrate complex, but not to the
free enzyme entity.
Mixed type inhibition
- both competitive and non-competitive inhibition is observed. This is
the most frequently observed type of inhibition (Madan et al., 2002).
4.9 CYP1 Family
This family has been identified in 41 species and in humans contains 2 subfamilies
(CYP1A and 1B) and is encoded by 4 genes (Cytochrome P450 Knowledgebase,
2006, Nelson, 2009). The human CYP1 family consists of three enzymes, CYP1A1,
CYP1A2 and CYP1B1, although all three enzymes are not expressed in all tissues.

Chapter 4- Cytochrome P450 Inhibition 155
All mammalian species possess two inducible CYP1A enzymes, CYP1A1 and
CYP1A2, which share approximately 70% amino acid sequence identity. CYP1A1
is readily detectable in the lung (Shimada et al., 1992), intestine and skin (Shimada
et al., 1996), lymphocytes (Vanden Heuvel et al., 1993) and placenta (Fujino et al.,
1984), particularly from cigarette smokers. It is also expressed in foetal liver
(Kitada et al., 1991) but not adult liver. It can be induced in primary human
hepatocyte cultures (Liu et al., 2006).
4.9.1 CYP1A2
CYP1A2 accounts for approximately 5-10% of drug metabolism, (Figure 4-4), and
10-15% of total CYP content, with individual levels varying approximately 40 fold
(Guengerich, 2005). Variation in the elimination of drugs metabolised by CYP1A2
has been attributed to both genetic and environmental factors.
4.9.1.1 Sites of Expression
CYP1A2 is almost exclusively expressed at low levels in the liver. CYP1A2 is not
expressed in extra-hepatic tissues; therefore, in humans, CYP1A2 and CYP1A1 can
be considered hepatic and extra-hepatic enzymes, respectively.
4.9.1.2 Regulation and Polymorphism
The gene for CYP1A2 is located on chromosome 15 at location 15q24.1 and 36
allelic variants are known (Figure 4-5). CYP1A2 is induced through AhR-mediated
transactivation following ligand binding and nuclear translocation, and is induced
by PAHs and TCDD (Nebert et al., 2000). Consumption of charcoal- broiled meat
for 7 days can induce CYP1A2 (Fontana et al., 1999).

Chapter 4- Cytochrome P450 Inhibition 156
In human liver microsomes, a large (10- to 80-fold) inter-individual variability in
the activity of CYP1A2 has been observed using various probes (Gunes and Dahl,
2008). These findings may reflect a genetically determined difference in constitutive
and/or inducible CYP1A2 gene expression. Of the polymorphic alleles showing
variability in the promoter region, only CYP1A2*1K has been associated with
altered enzyme activity, with 40% lower inducibility (Aklillu et al., 2003).
4.9.1.3 Substrates and Reactions
Model substrates and their reactions include caffeine (caffeine N3-demethylation),
theophylline (theophylline N-demethylation) and phenacetin (phenacetin O-
deethylation). The CYP1 family is important in the catalysis of carcinogen
bioactivation reactions, such as PAH epoxidation and aromatic/heterocyclic amine
N-hydroxylation (Nebert et al., 2004). Importantly, all members of the CYP1
family are active in the metabolism of PAHs to intermediates that can bind to
DNA, if the damage is unrepaired, this may produce mutations involved in
neoplasmic transformation (Baird et al., 2005).
4.9.1.4 Inhibitors
Several CYP1A2 inhibitors are known from clinical work, including furafylline
(Ortiz de Montellano et al., 1979, Kunze and Trager, 1993) and isoniazid (Wen et
al., 2002). -Naphthoflavone is a strong inhibitor as are several of the polycyclic
acetylenes (Shimada et al., 1998).

Chapter 4- Cytochrome P450 Inhibition 157
4.9.1.5 Clinical Issues
Drug interactions involving CYP1A2 have been reported. High levels of CYP1A2
activity have been associated with failure of theophylline therapy in the treatment
of asthma (Kappas et al., 1978). Clinical studies have shown that smoking can
increase the clearance and reduce the plasma concentrations of many therapeutic
drugs including, theophylline, melatonin, clozapine, riluzole, lidocaine, verapamil,
erlotinib, fluvoxamine, and ropivacaine (Zhou et al., 2010).
Since CYP1A2 (and CYP1A1) catalyses the metabolic activation of PAHs and
heterocyclic aromatic amines/amides to ultimate carcinogens, it is expected that
induction of the enzyme is detrimental in humans exposed to high levels of PAHs
and heterocyclic aromatic amines/amides such as by cigarette smoking.
4.10 CYP2 Family
This family has been identified in 41 species and in humans contains 13 subfamilies
and is encoded by 36 genes (Cytochrome P450 Knowledgebase, 2006, Nelson,
2009). It is the largest family in terms of the numbers of isoenzymes; and is
represented by five major subfamilies, CYP2A, CYP2B, CYP2C, CYP2D and
CYP2E.
4.10.1 CYP2A6
CYP2A6 represents less than 1% of the total enzyme in the liver (Figure 4-4) but
accounts for approximately 5% of drug metabolism. It was first purified as
coumarin 7-hydroylase and is the major enzyme responsible for the metabolism of
nicotine (Yun et al., 1991, Nakajima et al., 1996).

Chapter 4- Cytochrome P450 Inhibition 158
4.10.1.1 Sites of Expression
CYP2A6 is expressed primarily in the liver, but has also been detected in the nasal
mucosa, trachea, lung (Ding and Kaminsky, 2003) and oesophageal mucosa
(Lechevrel et al., 1999).
4.10.1.2 Regulation and Polymorphism
The CYP2A6 gene spans a region of approximately 6kb pairs consisting of 9 exons
and has been mapped to the long arm of chromosome 19 (between 19q12 and
19q13.2). CYP2A6 is subject to genetic polymorphism, with four allelic variants
having been described and 1% of the population having an inactive variant
(Brockmöller et al., 2000). Polymorphisms are the major factor contributing to the
inter-individual differences in activity and expression, but dietary or environmental
factors as well as endogenous factors such as steroid hormones are also involved.
Studies have suggested that this variation in activity affects smoking behaviour and
cancer susceptibility (Kamataki et al., 2005).
CYP2A6 is regulated by PXR, oestrogen receptors and the glucocorticoid receptors
(Onica et al., 2008). Induction is known to occur with phenobarbitone. CYP2A6 is
responsible for approximately 80% of hepatic metabolism of nicotine (Benowitz et
al., 1994) and as smokers need to maintain levels of nicotine, increased activity of
CYP2A6 has been linked to an increase in smoking. Tobacco is a source of
cadmium, which is an inducer of CYP2A6 and therefore may be one of the
mechanisms that increase smoking behaviour (Satarug et al., 2004).

Chapter 4- Cytochrome P450 Inhibition 159
4.10.1.3 Substrates and Reactions
The most characteristic reaction for CYP2A6 is coumarin 7-hydroxylation (Yun et
al., 2005). In addition to nicotine metabolism, it also metabolically activates
tobacco-specific nitrosamines such as 4-methylnitrosoamino-1-(3-pyridyl)-1-
butanone and N-nitrosonornicotine (Tiano et al., 1993).
4.10.1.4 Inhibitors
A number of potent inhibitors with variable selectivity against CYP2A6 have been
characterised. The most widely used in vitro inhibitors include tranylcypromine
and methoxsalen (8-methoxypsoralen) (Pelkonen et al., 2008).
4.10.1.5 Clinical Issues
Clinical issues are often due to polymorphic variation. This variation alters the
metabolism of substrates including therapeutic agents (halothane, valproic acid),
toxins (nicotine, cotinine) and pro-carcinogens (Raunio et al., 2001).
4.10.2 CYP2B6
Until specific probes were developed, CYP2B6 was thought to be a minor CYP, but
expression levels with 25-250 fold differences are now known (Aleksa et al., 2005,
Hesse et al., 2000, Wang and Tompkins, 2008). CYP2B6 accounts for 2-10% of the
total P450 content in human liver (Figure 4-4) (Wang and Tompkins, 2008,
Shimada et al., 2004, Stresser and Kupfer, 1999) contributes to approximately 2%
of drug metabolism but vales of 8-10% have also been quoted (Turpeinen, 2006).
Importantly 25-30% of CYP3A4 substrates are also substrates for CYP2B6.
(Walsky et al., 2006, Kharasch et al., 2008).

Chapter 4- Cytochrome P450 Inhibition 160
4.10.2.1 Sites of Expression
CYP2B6 is expressed in the liver, though it differs from other CYPs in that it is
located diffusely in the hepatic lobules and not in the centrilobular region (Murray
and Reidy, 1990).
CYP2B6 is also expressed in extra-hepatic sites including the brain, lung, kidney,
intestine, endometrium, bronchoalveolar macrophages, peripheral lymphocytes and
skin (Gervot et al., 1999, Janmohamed et al., 2001, Ding and Kaminsky, 2003).
4.10.2.2 Regulation and Polymorphism
Hepatic CYP2B genes represent the most inducible CYP isoforms by
phenobarbital-type compounds in mammalian species (Wang and Tompkins,
2008). The regulation of CYP2B6 transcription is thought to be one of the major
underlying reasons for the large inter-individual variability seen.
CYP2B6 is highly polymorphic with over 40 alleles identified (Figure 4-5), with
various phenotypes. CYP2B6*6 is a clinically significant variant associated the slow
metabolism of methadone, leading to increased concentrations of the drug and
subsequent fatalities (Bunten et al., 2010).
4.10.2.3 Substrates and Reactions
CYP2B6 acts as an alternate pathway for 25% of CYP3A4 substrates. It is the
predominant isoenzyme for the metabolism of several clinically important drugs
including bupropion, artemisinin, propofol, methadone and pethidine (Hesse et al.,
2000, Faucette et al., 2000, Wang and Tompkins, 2008).

Chapter 4- Cytochrome P450 Inhibition 161
It has also been shown that CYP2B6 is able to metabolise drugs via different
reaction pathways to other CYPs. The antiepileptic agent mephobarbital is
metabolised by the CYP2C’s to the 4-hydroxylated metabolite but CYP2B6
catalyses the N-demethylation of this compound (Kobayashi et al., 1999,
Kobayashi et al., 2001).
4.10.2.4 Inhibitors
Several environmental chemicals are known to be potent inhibitors of CYP2B6,
including the organophosphate chlorpyrifos (Abass et al., 2009). Therapeutic agents
including the anti-platelet agents clopidogrel and ticlopidine are very potent
inhibitors with IC50 values of 0.5 and 0.2 μM, respectively (Walsky et al., 2006).
4.10.2.5 Clinical Issues
As CYP2B6 is the major isoenzyme for the metabolism of several drugs with a
narrow therapeutic index, the antiretroviral efavirenz for example, clinical issues
can be life threatening. Elevated plasma levels of efavirenz can lead to CNS side
effects and therapeutic failure (Rakhmanina and van den Anker, 2010).
The anticancer agent cyclophosphamide requires activation by CYP2B6, increased
activity increases the therapeutic effectiveness of this drug and induction of
CYP2B6 may be used to enhance the effectiveness (Jounaidi and Waxman, 2004).
Conversely it is logical to assume that inhibition or polymorphic variation causing
decreased CYP2B6 activity would decrease therapeutic effectiveness.

Chapter 4- Cytochrome P450 Inhibition 162
4.10.3 CYP2C8
CYP2C8 makes up approximately 7% of total microsomal human hepatic CYP
(Figure 4-4) (Shimada et al., 1994, Rendic, 2002, Lai et al., 2009), and is
responsible for approximately 1% of drug metabolism though values as high as 5%
have been quoted (Totah and Rettie, 2005). Like all members of the CYP2C family,
the gene for CYP2C8 is located on chromosome 10.
4.10.3.1 Sites of Expression
Expression of CYP2C8 is one of the highest in the kidney but it is expressed at low
levels in the liver (Guengerich, 2005) Other extra-hepatic sites of CYP2C8 includes
the adrenal glands, brain, uterus, lung, mammary gland and ovaries (Klose et al.,
1999, Guengerich, 2005).
4.10.3.2 Regulation and Polymorphism
The levels of CYP2C8 can vary 20 fold in human hepatic tissue (Bahadur et al.,
2002), and is induced by rifampicin (Rae et al., 2001). To date 14 different alleles
have been identified (Figure 4-5). The most significant allelic variant is CYP2C8*3
which occurs with high frequency and can account for a decrease in taxol
metabolism. The level of decrease varies from 90% (Dai et al., 2001) to 25%
(Soyama et al., 2001, Bahadur et al., 2002). CYP2C8*5 to CYP2C8*14 have only
been detected in the Japanese population (Jiang et al., 2011).
4.10.3.3 Substrates and Reactions
The active site of CYP2C8 is a large site that can accommodate large substrates
(Schoch et al., 2004). Therapeutic drugs metabolised by CYP2C8 include the

Chapter 4- Cytochrome P450 Inhibition 163
anticancer drugs taxol and paclitaxel (Rahman et al., 1994, Sonnichsen et al.,
1995), amiodarone (an antiarrhythmic drug) (Ohyama et al., 2000), troglitazone (an
anti-diabetes drug) (Yamazaki et al., 1999), and carbamazepine (an antiepileptic
drug) (Kerr et al., 1994). Additionally, CYP2C8 generally has low catalytic activity
towards the known substrates for CYP2C9 and CYP2C19 (Guengerich, 2005).
4.10.3.4 Inhibitors
Inhibition of CYP2C8 is known to occur with high concentrations of
furanocoumarins, which are present in plant products and complementary
products. Gemfibrozil, a lipid lowering drug has also been identified as an inhibitor,
furthermore this inhibition may be the cause for the interaction between gemfibrozil
and the cholesterol lowering drug cerivastatin (Wang et al., 2002).
4.10.3.5 Clinical Issues
The disposition of taxol and paclitaxel may be one of the more significant clinical
issues arising with CYP2C8. A potential interaction between the antimicrobial
agent trimethoprim and the glucose lowering drug repaglinide has also been
identified. Trimethoprim raises the plasma concentrations of repaglinide by
inhibiting its CYP2C8-mediated biotransformation, this interaction increases the
risk of hypoglycaemia (Niemi et al., 2003).
4.10.4 CYP2C9
CYP2C9 accounts for approximately 20% of total hepatic CYP content and
approximately 15% of drug metabolism (Figure 4-4).

Chapter 4- Cytochrome P450 Inhibition 164
4.10.4.1 Sites of Expression
CYP2C9 is considered primarily a hepatic CYP and is second to CYP3A4 in levels
of abundance. This isoenzyme has also been detected in the small intestine, though
variability as high as 18-fold have been reported (Ding and Kaminsky, 2003).
4.10.4.2 Regulation and Polymorphism
CYP2C9 is the only member of the CYP2C family that can be detected at
significant levels in untreated human hepatocytes. Expression is induced by
rifampicin, dexamethasone, phenobarbital (Raucy et al., 2002, Gerbal-Chaloin et
al., 2001) and phenytoin (Miners and Birkett, 1998).
CYP2C9 like other members of the CYP2C family is highly polymorphic, with over
30 alleles identified to date (Figure 4-5). It is so polymorphic that up to 40% of the
Caucasian population are carriers that encode partially defective enzymes (Rettie
and Jones, 2005). The CYP2C9*2 and *3 alleles (Rettie et al., 1994, Sullivan-Klose
et al., 1996) cause reduced drug metabolic capacity. CYP2C9*5 also causes reduced
metabolic activity, this allele has a higher frequency in the African population
(Dickmann et al., 2001).
4.10.4.3 Substrates and Reactions
Many of the drugs metabolised by CYP2C9 have a narrow therapeutic index,
including (S)-warfarin, tolbutamide and phenytoin (Rendic, 2002). Many of the
anti-inflammatory agents including diclofenac and ibuprofen are also substrates for
CYP2C9 (Rettie and Jones, 2005).

Chapter 4- Cytochrome P450 Inhibition 165
Using in vitro studies, CYP2C9 has also been shown to metabolise endogenous
compounds including 5-hydroxytryptamine and linoleic acid (Fradette et al., 2004).
4.10.4.4 Inhibitors
As drugs with a narrow therapeutic index are metabolised by CY2C9, inhibition of
this isoenzyme can cause adverse drug interactions. Many inhibitors are acidic, for
example arylacetic acid. But neutral compounds may also bind with a high affinity
(Miners and Birkett, 1998, Locuson et al., 2004). Sulfaphenazole is recognised as a
highly selective competitive inhibitor of CYP2C9 (Veronese et al., 1990) with poor
affinity for the other members of the CYP2C family (Ha-Duong et al., 2001).
Tienilic acid is a mechanism-based inactivator (Beaune et al., 1987).
4.10.4.5 Clinical Issues
Clinical issues arising from CYP2C9 are common due to the high amount of allelic
variance with this isoenzyme and the many substrates with a narrow therapeutic
index that it is responsible for the metabolism of. Several NSAIDS are metabolised
by CYP2C9, and variant alleles are more frequent in patients with NSAID-induced
acute gastric bleedings (Martínez et al., 2004).
As the (S)-enantiomer of warfarin is metabolised by CYP2C9 and this enantiomer
is predominantly responsible for the anticoagulant effect of the drug, excess
bleeding is of concern. In particular patients with CYP2C9*2 and *3 alleles have a
significant warfarin reduction clearance and are more susceptible to bleeding
(Kirchheiner and Brockmöller, 2005).

Chapter 4- Cytochrome P450 Inhibition 166
4.10.5 CYP2C19
CYP2C19 accounts for approximately 5% of the total hepatic content, and this
isoenzyme accounts for approximately 3-5% of drug metabolism (Figure 4-4).
4.10.5.1 Sites of Expression
Significant expression of CYP2C19 has been found in the liver (Guengerich, 2005)
but low levels have also been detected in the small intestine, with variation up to
17-fold known (Ding and Kaminsky, 2003).
4.10.5.2 Regulation and Polymorphism
CYP2C19 is induced by several drugs including rifampicin, dexamethasone and
phenobarbital (Raucy et al., 2002). To date more than 30 allelic variants have been
described (Figure 4-5) several of which are clinically important. CYP2C19*2 and *3
(De Morais et al., 1994), have a reduced drug metabolic capacity for therapeutics
such as mephenytoin and omeprazole. An increase in enzyme activity is seen with
CYP2C19*17 (Sim et al., 2006).
Attention on CYP2C19 polymorphisms has increased due to the pro-drug
clopidogrel which requires activation by CYP2C19 (Kazui et al., 2010). Patients
with the CYP2C19*17 allele have an improved protective effect of clopidogrel
treatment (Tiroch et al., 2010), but this also increases the risk of bleeding (Sibbing et
al., 2010). Decreased effectiveness of clopidogrel is seen in patients with the
CYP2C19*2 and *3 alleles (Sibbing et al., 2010, Mega et al., 2010).
CYP2C19 is absent in approximately 5% of the Caucasian population and 20% of
the Asian population (Wrighton and Stevens, 1992).

Chapter 4- Cytochrome P450 Inhibition 167
4.10.5.3 Substrates and Reactions
Drugs metabolised by CYP2C19 are usually amides or weak bases (Lewis, 2004).
The classic reaction is hydroxylation of the S-isomer of mephenytoin and
omeprazole 5-hydroxylation, the later commonly employed as a probe substrate.
CYP2C19 is responsible for the metabolism of many drugs including diazepam,
amitriptyline, phenytoin and omeprazole (Pelkonen et al., 2008). CYP2C19 also
oxidizes steroids, including progesterone 21-hydroxylation and testosterone 17-
oxidation (Yamazaki and Shimada, 1997), additionally it inactivates the
organophosphate insecticide diazinon (Kappers et al., 2001).
4.10.5.4 Inhibitors
Potent and selective inhibitors of CYP2C19 are not currently known. Omeprazole
and tranylcypromine are used in the laboratory as inhibitors, but these compounds
also inhibit CYP3A4 and CYP2A6, respectively (Lampen et al., 1995, Draper et
al., 1997). CYP2C19 is also inhibited by isoniazid and ticlopidine resulting in
clinically relevant interactions (Donahue et al., 1997, Tateishi et al., 1999,
Salminen et al., 2011, Venkatakrishnan and Obach, 2007).
4.10.5.5 Clinical Issues
Most clinical issues arise due to the polymorphic variation. In addition to
clopidogrel (section 4.10.5.2), omeprazole a known substrate for CYP2C19 is more
effective for the treatment of ulcers in individuals with low enzyme activity (Chiba
et al., 1993, Karam et al., 1996).
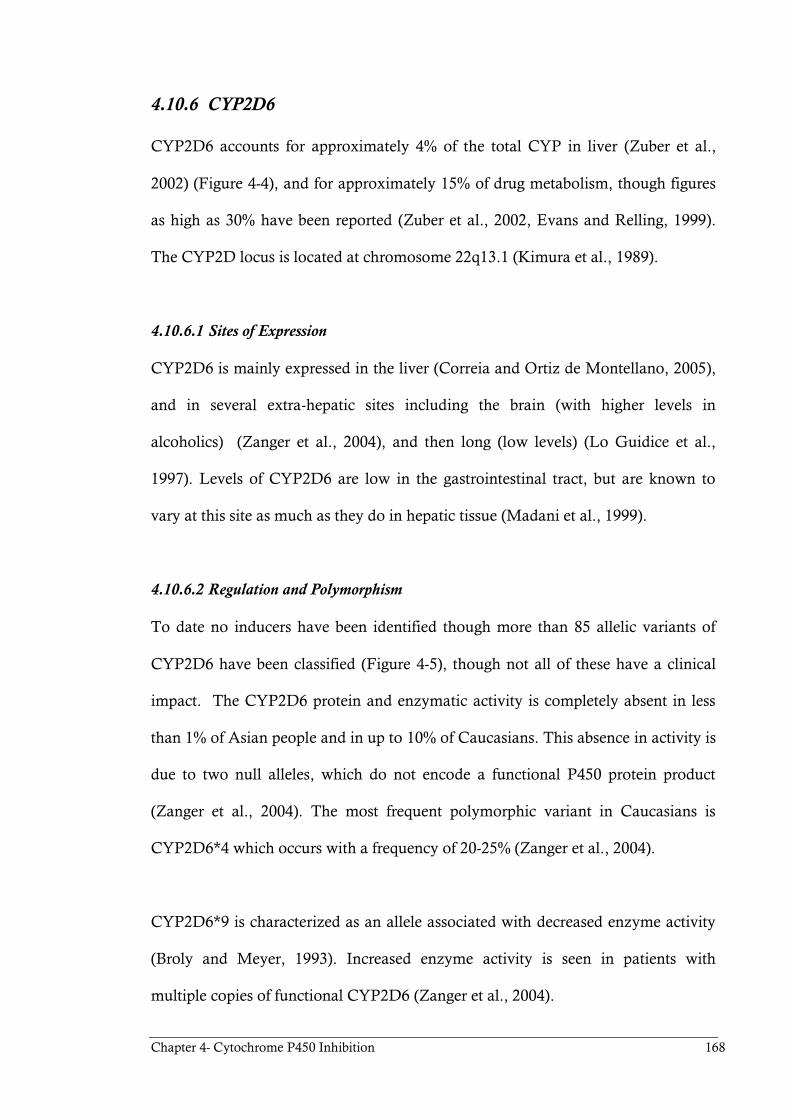
Chapter 4- Cytochrome P450 Inhibition 168
4.10.6 CYP2D6
CYP2D6 accounts for approximately 4% of the total CYP in liver (Zuber et al.,
2002) (Figure 4-4), and for approximately 15% of drug metabolism, though figures
as high as 30% have been reported (Zuber et al., 2002, Evans and Relling, 1999).
The CYP2D locus is located at chromosome 22q13.1 (Kimura et al., 1989).
4.10.6.1 Sites of Expression
CYP2D6 is mainly expressed in the liver (Correia and Ortiz de Montellano, 2005),
and in several extra-hepatic sites including the brain (with higher levels in
alcoholics) (Zanger et al., 2004), and then long (low levels) (Lo Guidice et al.,
1997). Levels of CYP2D6 are low in the gastrointestinal tract, but are known to
vary at this site as much as they do in hepatic tissue (Madani et al., 1999).
4.10.6.2 Regulation and Polymorphism
To date no inducers have been identified though more than 85 allelic variants of
CYP2D6 have been classified (Figure 4-5), though not all of these have a clinical
impact. The CYP2D6 protein and enzymatic activity is completely absent in less
than 1% of Asian people and in up to 10% of Caucasians. This absence in activity is
due to two null alleles, which do not encode a functional P450 protein product
(Zanger et al., 2004). The most frequent polymorphic variant in Caucasians is
CYP2D6*4 which occurs with a frequency of 20-25% (Zanger et al., 2004).
CYP2D6*9 is characterized as an allele associated with decreased enzyme activity
(Broly and Meyer, 1993). Increased enzyme activity is seen in patients with
multiple copies of functional CYP2D6 (Zanger et al., 2004).

Chapter 4- Cytochrome P450 Inhibition 169
The most significant variants of CYP2D6 are CYP2D6*2xn, CYP2D6*4,
CYP2D6*5, CYP2D6*10, CYP2D6*17 (Johansson and Ingelman-Sundberg, 2010).
4.10.6.3 Substrates and Reactions
Substrates for CYP2D6 have a common characteristic, a basic nitrogen at a
distance of 5-7 Å from the site of oxidation (Wolff et al., 1985). CYP2D6
contributes to the metabolism of dextromethorphan, debrisoquine, and bufuralol,
which all have been used as model substrates (Pelkonen et al., 2008).
CYP2D6 metabolises a number of drugs that mainly target the central nervous and
cardiovascular systems (Michalets, 1998, Rendic, 2002, Zhou et al., 2009b),
amongst which are many drugs with a narrow therapeutic index. This includes the
tricyclic antidepressants, antipsychotics, opioids (codeine and tramadol) and
amphetamines (Wang et al., 2009).
4.10.6.4 Inhibitors
Many of the inhibitors for CYP2D6 are also substrates for the isoenzyme.
Traditionally the anti-arrhythmic drug quinidine (which is not a substrate) has been
utilised as a highly selective CYP2D6 inhibitor. Paroxetine and cimetidine are both
mechanism based inhibitors, with the latter also being a reversible inhibitor
(Bertelsen et al., 2003, Madeira et al., 2004). Antipsychotics including
chlorpromazine and haloperidol are metabolised by CYP2D6 and also
competitively inhibit the enzyme (Shin et al., 1999).

Chapter 4- Cytochrome P450 Inhibition 170
4.10.6.5 Clinical Issues
For some drugs, the role of CYP2D6 is dominant and clinical manifestations of
genetic polymorphisms are important and even deadly (Idle et al., 1978, Köhnke et
al., 2002). CYP2D6 was suspected to be involved in the development of
Alzheimer’s and Parkinson’s disease but to date no clear evidence of this link has
been found (Gołab-Janowska et al., 2007).
4.10.7 CYP2E1
CYP2E1 is found predominantly in the liver and accounts for approximately 4% of
drug metabolism (Figure 4-4). CYP2E1 was first discovered in 1965 (Orme-
Johnson and Ziegler, 1965) and the human gene was purified in 1988 (Umeno et
al., 1988).
4.10.7.1 Sites of Expression
In addition to hepatic expression, CYP2E1 is also expressed in the lung (Shimada
et al., 1996) and oesophagus (Huang et al., 1992). It is not present in foetal liver,
but appears within hours of birth (Vieira et al., 1996).
4.10.7.2 Regulation and Polymorphism
The regulation of CYP2E1 expression depends on transcriptional, post-
transcriptional, and post-translational factors. The human CYP2E1 gene has been
fully sequenced and lies on chromosome 10. Several genetic variants have been
described. These variants may account for the enhanced gene transcription that can
lead to an increased metabolic activation of carcinogens and consequent initiation
of malignancies (Hayashi et al., 1991, Uematsu et al., 1991).

Chapter 4- Cytochrome P450 Inhibition 171
CYP2E1 is unlike other CYPs in terms of regulation of protein levels and enzyme
activity. Whilst the main control over CYPs is at the level of transcriptional
activation, CYP2E1 activity appears to be most affected by substrate binding and
stabilisation of the protein or other factors that stabilise its mRNA and decrease
protein degradation (Koop and Tierney, 1990). These post-transcriptional and post-
translational levels of control may explain why polymorphisms shown to modulate
enzyme inducibility in vitro may not have predictable consequences in vivo.
4.10.7.3 Substrates and Reactions
CYP2E1 exhibits very broad substrate specificity, with over 80 substrates known
(Ioannides, 2008). The main function of CYP2E1 is contributing to the metabolism
of those xenobiotics that are metabolised primarily by other CYPs. It acts as an
alternative demethylation pathway for a variety of substrates metabolised by
CYP3A4. The substrates of CYP2E1 usually consist of hydrophobic and low
molecular weight compounds, such as paracetamol, chlorzoxazone, benzene,
ethanol, carbon tetrachloride, chloroform, vinyl chloride and anaesthetics
(enflurane, halothane, methoxyflurane) (Gonzalez, 2005).
This CYP is inducible by several of it own substrates (e.g. ethanol, acetone,
imidazole, benzene and isopropanol). The expression of the enzyme is also altered
in response to many different conditions, including gender, circadian rhythm
(Klingenberg, 1958), nutrition (e.g. starvation and obesity), metabolic and
endocrine disorders (e.g. diabetes), inflammation (in response to cytokines), viral
infections (e.g. hepatitis C) and hepatocellular carcinoma (Ioannides, 2008).

Chapter 4- Cytochrome P450 Inhibition 172
4.10.7.4 Inhibitors
Several substrates for CYP2E1 also act as inhibitors for the isoenzyme, in particular
the low molecular weight solvents (Guengerich, 2005).
The therapeutic drug disulfiram, used in the treatment of alcohol abuse, was found
to inhibit CYP2E1. Inhibition of CYP2E1 is associated with reduced hepatotoxicity
from chloroform, carbon tetrachloride, acetaminophen, and NDMA in rats (Brady
et al., 1991).
4.10.7.5 Clinical Issues
The major clinical issues involve the role of CYP2E1 in the oxidation of certain
drugs, alcoholism, oxidative stress, and risk from cancer (Guengerich, 2005).
Levels of CYP2E1 are highest in the centrilobular zone of the liver (Ingelman-
Sundberg et al., 1998) which is also the region of the liver that is destroyed by
toxins such as ethanol, acetaminophen, nitrosamines and carbon tetrachloride.
Paracetamol overdose is a common cause of poisoning, being the leading cause of
acute liver failure in the United States and the United Kingdom (Chun et al., 2009).
Studies with CYP2E1 knockout mice indicated that CYP2E1 is a major
determinant of acetaminophen toxicity, as the toxicity was considerably attenuated
in null animals (Lee et al., 1996).
4.11 CYP3 Family
This family has been identified in 30 species and in humans contains 1 subfamily
and is encoded by 10 genes (Cytochrome P450 Knowledgebase, 2006, Nelson,
2009). The CYP3 family is represented in the liver by only one subfamily, CYP3A.

Chapter 4- Cytochrome P450 Inhibition 173
CYP3A is the most prominent CYP enzyme in human liver and intestine and is
involved in the metabolism of a large number of therapeutic agents.
4.11.1 CYP3A4
CYP3A4 is the most abundant CYP in humans and as can be seen in Figure 4-4, is
the major CYP involved in drug metabolism, 48%. The gene is located at
chromosome 7q22.1 (Inoue et al., 1992).
4.11.1.1 Sites of Expression
Levels of CYP3A4 are greatest in the liver, but it is also the most abundant CYP in
the small intestine (Guengerich, 2005). Additionally CYP3A4 is also expressed in
the lung, stomach, colon (Ding and Kaminsky, 2003, Raunio et al., 2005) and the
adrenal glands (Koch et al., 2002).
4.11.1.2 Regulation and Polymorphism
CYP3A4 is degraded by a ubiquitin linked pathway (Murray and Correia, 2001)
and regulated by PXR (see section 4.7.1.4). The extent of induction is highly
variable between individuals with reports of more than 10-fold differences in the
induction of CYP3A4 protein and mRNA in liver and intestine (Lin and Lu, 2001).
Polymorphic variations are known for CYP3A4 but to date none have been found
to be clinically important (Johansson and Ingelman-Sundberg, 2010). CYP3A4*1B
has been reported as increasing the risk of prostate cancer (Tayeb et al., 2003),
though other studies have failed to find a statistically significant correlation (Sarma
et al., 2008).

Chapter 4- Cytochrome P450 Inhibition 174
4.11.1.3 Substrates and Reactions
The crystal structure of CYP3A4 reveals a large active site, consistent with the
broad range of substrates and endogenous substances catalysed by this enzyme
(Guengerich, 2005, Rendic, 2002). To date more than 50% of the therapeutic drugs
on the market are metabolised by CYP3A4 (Rendic, 2002). The active site can
accommodate a large variety of molecules based on their size, from metyrapone
(MW- 226 daltons) to cyclosporine (MW- 1203 daltons) (Zhou, 2008).
Importantly due to its size and flexibility, multiple small molecules are able to be
present simultaneously in the active site. CYP3A4 displays a high degree of region-
and stereo-selectivity in may reactions, for example the hydroxylation of
testosterone (Krauser and Guengerich, 2005). One of the classic and fastest
reactions catalysed by CYP3A4 is 6β-testosterone hydroxylation (Guengerich et al.,
1986). Bioactivation of some procarcinogens such as aflatoxin B1 (Aoyama et al.,
1990) and PAHs (Hecht, 1999) are also mediated partially via CYP3A4.
4.11.1.4 Inhibitors
Inhibition of CYP3A4 is a major issue in the pharmaceutical industry. Inhibitors of
CYP3A4 vary widely in structure and can act in a competitive or mechanism-based
way (Zhou, 2008, Pelkonen et al., 2008). Clinically important inhibitors include
azole antifungals (ketoconazole and itraconazole) (Back and Tjia, 1991), macrolide
antibiotics (clarithromycin and erythromycin) (Jones et al., 2007), antidepressants
(fluoxetine) (Mayhew et al., 2000), calcium channel blockers (verapamil and
diltiazem) (Yeo and Yeo, 2001, Ma et al., 2000), and steroids (gestodene and
mifepristone) (Jones et al., 2007).

Chapter 4- Cytochrome P450 Inhibition 175
4.11.1.5 Clinical Issues
Clinical issues involving CYP3A4 arise due to the large number of therapeutic
agents that are metabolised by this isoenzyme. High levels of enzyme activity
toward a drug will reduce bioavailability and variations in levels of CYP3A4 can
cause problems when the therapeutic window is narrow.
A major interaction occurs with cyclosporine, which is used to prevent organ
rejection post-transplant. Cyclosporine is a substrate for CYP3A4 and will not
reach therapeutic levels in patients with increased CYP3A4 activity (Kronbach et
al., 1989).
As CYP3A4 is also present in the small intestine, oral administration of an inhibitor
causes a direct and high level of exposure in the intestine. Therefore, even low
doses of a CYP3A4 inhibitor may cause drug interactions in the intestine rather
than in the liver (Tachibana et al., 2009).
4.12 Species Differences in Cytochrome P450
Differences between species are known not only in the distribution of the various
CYP isoenzymes and substrate specificity, but also in total CYP content.
Importantly a high degree of sequence identity does not automatically mean similar
catalytic activity (Guengerich, 1997), and a single amino acid substitution may give
changes in substrate specificity (Lindberg and Negishi, 1989). Therefore
orthologous enzymes are not always comparable for catalytic specificity (Nelson et
al., 1993). These differences complicate the extrapolation from animal studies to
humans.

Chapter 4- Cytochrome P450 Inhibition 176
With regards to species extrapolation the four points below have been proposed
(Guengerich, 1997); subsequent work has supported these statements (Bogaards et
al., 2000, Guengerich, 1997).
1- CYP subfamilies in which species extrapolation appears to hold well:
2E1.
2- CYP subfamilies in which some caution is required in extrapolation:
1A1, 1A2 and 4A.
3- CYP subfamilies in which more caution is advised in extrapolation:
2D and 3A.
4- CYP subfamilies for which major problems in extrapolation exist:
2A, 2B and 2C.
With these differences in mind, investigations into CYP activity ideally should
utilise human tissue and/or cells to avoid discrepancies with the data due to species
differences.
4.13 Methods for Investigating Cytochrome P450 Inhibition
As shown in Figure 4-3, there are many steps in the CYP catalytic cycle that can be
monitored to give an indication of inhibition, though inhibition of substrate
metabolism is the most common method used. There are several technologies for
measuring the inhibition of substrate metabolism and the generation of metabolites,
which themselves may cause inhibition.
Chapter 4- Cytochrome P450 Inhibition 177
4.13.1 In Vitro Methods
In vitro systems are commonly used to study human drug metabolism to identify
principal metabolites preferably prior to the human ADME studies (Brandon et al.,
2003, Pelkonen and Raunio, 2005, Pelkonen et al., 2005).
Whilst this review focuses on the in vitro methods used in the investigation of CYP
inhibition it is important to note that in vitro investigations may address several
metabolic issues, involving CYP and the other enzymes that may be involved in
metabolism including:
Drug metabolic stability and metabolic profile.
Metabolite identification and structure clarification.
Prediction of in vivo pharmacokinetic parameters from in vitro data.
Identification of the enzymes involved in metabolism.
Species comparison to aid in the selection of species for pre-clinical studies.
Drug interactions due to enzyme induction/inhibition.
Drug toxicity associated with metabolism.
There are many systems that can be used as part of the in vitro screening for CYP
inhibition including cDNA expression systems, microsomes, S9 fraction, cell lines
(including transgenic cell lines) hepatocytes, liver slices, liver perfusions; each with
their own advantages and disadvantages. Several of these systems are discussed
below and summarised in Table 4-2.

Chapter 4- Cytochrome P450 Inhibition 178
4.13.1.1 Expression of recombinant CYPs
Recombinant CYPs or baculovirus-mediated expression of mammalian CYPs
(baculosomes or supersomes) were first produced in 1989 (Asseffa et al., 1989). In
these preparations, cytochrome P450 reductase is also co-expressed, and therefore
does not have to be added exogenously (Ong et al., 1998, Chen et al., 1997). Some
preparations also have cytochrome b5 expressed, providing the full complement of
CYP redox partner proteins.
However, exogenous NADPH or an NADPH regenerating system (e.g., glucose-6-
phosphate dehydrogenase conversion of NADP+ to NADPH in the presence of the
substrate glucose-6-phosphate) must be added if it is not present in the preparation
(Taavitsainen et al., 2000).
A major limitation inherent to recombinant models are that concentrations of CYPs
are far in excess of their relative amount in the human liver and that secondary
metabolism cannot be identified. Additionally only a single isoenzyme is expressed,
therefore the contribution of other involved enzymes (including other CYP
isoenzymes) is not represented.
The metabolic activities of expressed microsomal CYPs and human liver
microsomes using probe substrates have been determined to be a reasonably
accurate model of the in vivo situation with respect to Km values, although
considerable variability was observed with respect to V max values (McGinnity et
al., 1999). IC50 values of reference inhibitors are also comparable between
baculosomes and microsomes (Turpeinen et al., 2006).

Chapter 4- Cytochrome P450 Inhibition 179
Pharmacogenetic variability may contribute greatly to individual variety in drug
metabolism, this genetic variation can be investigated with baculsomes that are
commercially available (i.e. CYP2C9*1, CYP2C9*2, CYP2D6*1 and CYP2D6*2).
4.13.1.2 S9 Fraction
The S9 fraction is obtained as the supernatant from the centrifugation of the liver
homogenate at 9000g, for 20-30 minutes, and contains both microsomal and
cytosolic fractions. Compared to microsomes, human liver S9 fractions offer a
more complete representation of the in vivo situation, as they contain a wide
variety of oxidative (also known as Phase I) and conjugative (also known as Phase
II) enzymes including CYPs, flavin monooxygenases (FMOs), carboxylesterases,
epoxide hydrolase, UDP glucuronosyltransferases (UGTs), sulfotransferases,
methyltransferases, acetyltransferases, glutathione- S -transferases and other drug-
metabolizing enzymes (Brandon et al., 2003).
Although this in vitro system is more complete in terms of the number of
biotransformation enzymes present, some metabolites may remain unnoticed due
to reduced enzyme activity. Compared to either microsome or supersome
preparations, S9 fractions exhibit 20–25% lower enzyme activity (Kramer and
Tracy, 2008).
4.13.1.3 Liver Microsomes
Human liver microsomes are the most popular in vitro model for CYP kinetic
based studies. Microsomes consist of vesicles of the hepatocyte endoplasmic
reticulum and are prepared by differential centrifugation (Pelkonen et al., 1974).

Chapter 4- Cytochrome P450 Inhibition 180
Microsomal preparations contain only enzymes localised to the endoplasmic
reticulum, which include CYPs, FMOs and UGTs.
As with other preparations from human tissue the activity of microsomes can vary
substantially between individuals (Gómez-Lechón et al., 2004). This problem,
however, can be successfully solved by the application of pooled (from multiple
donors) microsomes, which results in a representative enzyme activity (Araya and
Wikvall, 1999). Besides the relatively cheap costs and the ease of use, the major
advantage of microsomes is that they allow the influence of specific isoenzymes to
be studied in the presence of specific inhibitors (Birkett et al., 1993).
The major disadvantage of microsomes is that they cannot be used for quantitative
estimations of in vivo human biotransformation, because CYPs and UGTs are
enriched in the microsomal fraction and there is no competition with other
enzymes.
This results in higher biotransformation rates in microsomes compared to the
human in vivo situation, but also compared to primary hepatocytes and liver slices
(Sidelmann et al., 1996). Additionally, the absence of other enzymes (e.g., NAT,
GST, and ST) and cytosolic cofactors can leave metabolites formed in intact liver
cells unnoticed (Crommentuyn et al., 1998).
4.13.1.4 Primary Hepatocytes
Hepatocytes can be held in suspension, in which case they remain viable for only a
few hours, or maintained in monolayer culture for a maximum of 4 weeks.

Chapter 4- Cytochrome P450 Inhibition 181
Cryopreserved hepatocytes have been shown to retain the activity of most phase I
and phase II enzymes (Annaert et al., 2001, Silva et al., 1999).
Human hepatocytes in culture show active levels of major CYPs that are involved
in drug metabolism (Rodríguez-Antona et al., 2002, Donato et al., 1999), though
differences amongst preparations are found due to different donors (Donato et al.,
1995, Gómez-Lechón et al., 2007, LeCluyse, 2001). As mentioned in section 4.5
there are many factors that can alter the expression and activity of the CYPs but
additional changes occur in cultures of primary hepatocytes due to the
microenvironment that the cells are cultured in. These limitations can be quantified
but not overcome by characterising the cells.
The expression of CYPs declines during culture and cells differentiate and become
more similar to hepatoma cell lines. There is an initial rapid loss in mRNA (20-
40%) at 4-6 hours after culturing, this loss in mRNA precedes the decrease in CYP
protein and activity (Gómez-Lechón et al., 2004, Rodríguez-Antona et al., 2002).
Importantly not all CYPs degrade at the same rate due to stability of the individual
enzymes (Gómez-Lechón et al., 2007). For some CYPs this loss becomes evident
after a few days (CYP2E1 and CYP3A4), whilst others remain unaffected
(CYP1A2 and CYP2C9) (George et al., 1997).
A comparison of cultured hepatocytes and microsomes prepared from the same
donor showed good correlation, although the activity in microsomes was higher
(Gómez-Lechón et al., 2004). A disadvantage in using primary hepatocytes is the
lack of liver non-hepatocyte cells.

Chapter 4- Cytochrome P450 Inhibition 182
Although hepatocytes account for the vast majority of the liver volume (about
80%), other cells such as Kupffer cells are necessary for cofactor supply (Brandon et
al., 2003).
4.13.1.5 Immortalized Cell Lines
Different human and animal cell lines are available (http://www.lgcpromochem-
atcc.com). Because of interspecies differences, animal cell lines cannot accurately
predict human biotransformation (section 4.12). Human liver cell lines can be
isolated from primary tumours of the liver parenchyma, developed after chronic
hepatitis or cirrhosis (Crommelin and Sindelar, 1997). The most common human
cell lines for biotransformation studies are HepG2 (hepatocellular carcinoma)
(Galijatovic et al., 1999, Urani et al., 1998, Walle et al., 2000, Yoshitomi et al.,
2001), BC2 (hepatoma) (Gómez-Lechón et al., 2001) and the lung-derived line
A549 (Hukkanen et al., 2000).
Recently a new human hepatoma cell line, HepaRG, was derived from a
hepatocellular carcinoma. The HepaRG cells express a large panel of liver-specific
genes including several CYP enzymes such as CYP1A2, CYP2B6, CYP2C9,
CYP2E1 and CYP3A4, which is in contrast to the other hepatoma cell lines such as
HepG2. In addition to CYP enzymes, HepaRG cells have a stable expression of
phase II enzymes, transporters and nuclear transcription factors over a time period
of six weeks in culture (Aninat et al., 2006, Anthérieu et al., 2010, Kanebratt and
Andersson, 2008).The major disadvantage of these cell lines is that they are derived
from a single donor and therefore are very limited in the genetic variability.

Chapter 4- Cytochrome P450 Inhibition 183
4.13.1.6 Liver Slices
Liver slices that are prepared as ultrathin sections provide the advantage of intact
cellular interactions and normal spatial arrangements. They are a multicellular
three-dimensional in vitro model. Potassium, protein and ATP-levels are well
maintained for 8-24 hours (de Kanter et al., 2002, Vandenbranden et al., 1998),
indicating the length of time that liver slices may be viable for.
As with hepatocytes, CYP activity decreases by approximately 20% in 4 hours and
by 65% at 24 hours with no detectable activity after 96 hours (Vandenbranden et
al., 1998). This limitation is the biggest disadvantage of using liver slices. Advances
in cryopreservation may prolong the life of the slices enabling them to be used more
extensively.

184
Table 4-2: Comparison of human in vitro enzyme sources used for inhibition studies with cytochrome P450- modified from (Pelkonen and
Turpeinen, 2007).
Enzyme Source Advantages Disadvantages
Recombinant CYP
Enzymes
Can be used in a high-throughput screen.
The role of individual CYPS can be studied.
Data can be normalized (Rodrigues, 1999).
Able to generate useable amounts of metabolic products (Friedberg et al.,
1999, Moody et al., 1999).
Useful for when the enzyme being investigated is not present in high levels.
Polymorphic variants can be studied.
IC50 values are higher than those obtained with microsomes (Ogilvie et al.,
2008).
Single enzyme studies in isolation.
Metabolites need to be tested separately to rule out the reaction
with a second CYP (Parkinson et al., 2010).
S9 fraction Contains basically all hepatic enzymes.
Can be easily prepared, pooled from multiple donors and stored.
Loss of architecture.
Requires co-factor addition.
Microsomes Can be easily prepared, pooled from multiple donors and stored.
Contain levels of cytochrome b5 and cytochrome P450-reductase similar to
in vivo (Foti et al., 2010).
Allows for the investigation of intermediates and metabolites.
Contains only phase I enzymes and UGT.
UGT levels decline over time (Ogilvie et al., 2008)
Requires co-factor addition.
Substrates utilized must be specific or antibodies are required.
Hepatocytes Cellular architecture maintained.
Best in vitro system to determine the generation of metabolites (Dalvie et
al., 2009).
Can detect metabolism by non-CYP enzymes (Parkinson et al., 2010).
Difficult to pool.
Enzyme levels decrease over the time of culture.
Immortalized cell
lines
Cells express a large panel of liver-specific genes including several phase I,
phase II and transporters.
Derived from single source so polymorphic variation is not present.
Liver Slices Contains the whole complement of drug metabolising enzymes.
Cell-to cell architecture maintained.
Allows for the study of induction.
Limited viability.
Requires healthy donors.

Chapter 4- Cytochrome P450 Inhibition 185
4.13.2 Humanized In Vivo Modelling
Transgenic mice with human CYPs have been developed and can be used for CYP
investigations, though these mice usually express only one humanised isoenzyme,
for example CYP2D6 or CYP3A4 (Corchero et al., 2001, Robertson et al., 2003,
Zhang et al., 2003).
Chimeric mice with humanised livers can be used to predict the human in vivo
interaction of a chemical with the CYPs and the metabolites generated. The first
reports of substantial repopulation of a mouse liver with human hepatocytes were
published in 2001 (Dandri et al., 2001, Mercer et al., 2001). Investigations with
these chimeric models have identified expression of human-specific mRNA for
CYP1A1, CYP1A2, CYP2C9, CYP2D6 and CYP3A4 (Katoh et al., 2004).
In vivo studies with probe substrates (debrisoquine and warfarin) have shown
significantly higher concentrations of their human metabolites in chimeric mice
than in control mice, though this finding was not consistent for all investigated
substrates (amosulalol was lower than expected) (Kamimura et al., 2010). Chimeric
mice are also of interest as they express Phase II enzymes and the transporters
(Strom et al., 2010) This would allow for a more detailed metabolic profile and
therefore more realistic extrapolation to human in vivo studies.

Chapter 4- Cytochrome P450 Inhibition 186
4.13.3 In Silico Modelling
In silico modelling is a rapidly growing area in all aspects of ADME predictions.
These approaches can be classified as ligand-based (pharmacophore and
quantitative structure-activity relationship (QSAR)), protein-based (crystallographic
protein and homology models), and ligand-protein interactions models (ligand-
protein docking) (Sun and Scott, 2010, de Graaf et al., 2005).
In silico modelling systems are capable of predicting potential sites of metabolism
in drug molecules and provide metabolic trees and estimate the likelihood of
metabolite production, and potential for inhibition (Turpeinen, 2006, Pelkonen and
Raunio, 2005).
Whilst these techniques are cost efficient, rapid and allow for the exploration of
minor structural changes, they rely on knowledge of the chemical/xenobiotic being
investigated. In the case of complementary products, the composition is often
unknown and complex. In silico modelling may have a role in predicting the fate of
specific constituents of complementary products when more information is
available, but at this stage in silico modelling can not provide predictions on the
metabolic outcomes and kinetic behaviour of these products.
4.14 In Vitro – In Vivo Extrapolation for CYP Inhibition
In vitro studies are often used as the basis for extrapolation for in vivo predictions,
known as in vitro to in vivo extrapolation (IVIVE). IVIVE focuses on two major
areas, the prediction of metabolic clearance and the prediction of drug interactions.

Chapter 4- Cytochrome P450 Inhibition 187
Whilst there are many factors that are involved in IVIVE this section will focus on
those that are relevant to CYP inhibition.
In vitro systems utilised for CYP studies each have their own advantages and
limitations (Table 4-2) with regards to extrapolation of data to the in vivo situation.
In vitro studies are used to determine the metabolism profile of a drug including the
metabolite profile and the time for the drug to be metabolised. From this the
metabolic fate in vivo is predicted.
The extrapolation of in vitro data to in vivo requires scaling. This scaling consists of
several factors, including the intrinsic clearance and the prediction of hepatic
clearance, which is then used to calculate the oral bioavailability, total body
clearance and half-life (Pelkonen and Turpeinen, 2007). Each of the in vitro systems
used require different scaling factors. This requires the assumption of factors
including protein binding, distribution to other tissues, hepatic blood flow and
extra-hepatic routes of clearance.
For investigations using hepatic microsomes, values are usually reported as
millilitres per minute per milligram of microsomal protein and scaling further to a
rate per gram of liver requires a factor known as milligrams of microsomal protein
per gram of liver (MPPGL). A value of 32 mg g-1 (Barter et al., 2007a, Pelkonen
and Turpeinen, 2007) and 40 mg g-1 (Hakooz et al., 2006) for human liver
MPPGL has been proposed.

Chapter 4- Cytochrome P450 Inhibition 188
4.15 Known Inhibitions by Complementary Products
As CYP inhibition is a major cause of adverse drug reactions, it is important to
investigate if complementary products are able to cause inhibition. Studies
investigating complementary products interacting with CYPs are often conflicting
though on further investigation the source of this conflict can usually be found.
Most commonly the products used vary (manufacturer, formulation, composition)
and/or the concentration and preparation of extracts for in vitro tests differs.
As complementary products are often complex they contain many potentially
pharmacologically active components including essential oils, tannins, flavonoids,
anthraquinones, alkaloids and polyphenols (Liu et al., 2006, Zhou et al., 2004,
Zhou et al., 2005, Izzo and Ernst, 2009). Several complementary products have
been proven to interact with CYPs, St John’s Wort (Hypericum perforatum), garlic
(Allium sativum), liquorice (Glycyrrhiza glabra) and ginseng (Panax ginseng), though
not all of these are inhibitors of the CYPs. St John’s Wort is known to induce
CYP3A4 (Henderson et al., 2002)
Furanocoumarins isolated from grapefruit juice are mechanism-based inhibitors of
CYP3A4 (Tassaneeyakul et al., 2000) and resveratrol has been shown to be
mechanism-based inhibitor of CYP1A2 and CYP3A4 (Chan and Delucchi, 2000).
Analysis of 30 herbal plants from Indonesia demonstrated their ability to inhibit
CYP2D6 and CYP3A4 (Subehan et al., 2006). With an increase in the incubation
time, five plants showed more than a 30% increase in CYP3A4 mechanism-based
inhibition, and three showed a 30% increase in CYP2D6 mechanism-based
inhibition.

Chapter 4- Cytochrome P450 Inhibition 189
CYP2E1 inhibitors from natural sources include compounds found in garlic (diallyl
sulfide, diallyl sulfoxide, and diallyl sulfone) that were shown to competitively
inhibit CYP2E1 (Gurley et al., 2005a, Brady et al., 1991). Two clinical trials
implied that garlic oil may selectively inhibit CYP2E1, as revealed by the decreased
6-hydroxychlorzoxazone/chlorzoxazone serum ratios (Gurley et al., 2005a).
Ginseng has been shown to inhibit CYP2D6 (Gurley et al., 2008).
With evidence that complementary products are capable of causing CYP inhibition
there is a need to identify those products that are most likely to cause inhibition and
therefore be responsible for drug interactions. A rapid screening method is required
to investigate the large number of products and the variability of the products, for
this reason and the advantages outline in Table 4-2, microsomes are the ideal
testing system.
4.16 Aims of the Present Study
The general aims of this study was to investigate 10 complementary and herbal
products that have the potential to interact with therapeutic agents in relation to
their ability to inhibit the CYPs involved in drug metabolism. The specific goals
include:
Establishing a standard extraction method that is easily reproducible.
Comparison of two methods for screening for potential CYP inhibition.
To determine if the more rapid N-in-one cocktail method can provide
accurate results with complex mixtures such as extracts of
complementary products.

Chapter 4- Cytochrome P450 Inhibition 190
4.17 Materials and Methods
4.17.1 Chemicals
Bupropion and hydroxybupropion were a generous donation from
GlaxoSmithKline (Research Triangle, NC, USA), midazolam and 1-
hydroxymidazolam were obtained from F. Hoffmann-La Roche (Basle,
Switzerland), and omeprazole, omeprazole sulphone and 5-hydroxyomeprazole
were obtained from Astra Zeneca (Mölndal, Sweden). The metabolite standards 6-
hydroxychlorzoxazone, desethyl amodiaquine, hydroxytolbutamide, 6-hydroxy-
testosterone and dextrorphan were purchased from BD Biosciences Discovery
Labware (Bedford, MA, USA). Formic acid and LichroSol GG acetonitrile were
obtained from Merck KGaA (Darmstadt, Germany). Itraconazole, ticlopidine,
montelukast, amodiaquine, tolbutamide, sulphaphenzole, dextromethorphan,
quinidine, chlorzoxazone, pyridine and fluconazole were all purchased from Sigma
Chemical Co. (St Louis, MO, USA). Water was in-house freshly prepared with
Simplicity 185 (Millipore S.A., Molsheim, France) water purification system and
was ultra pure grade (18.2M). All other chemicals were from Sigma Chemical Co.
(St Louis, MO, USA) and were of the highest purity available.
4.17.2 Preparation of Herbal Samples
Herbal products were purchased from local suppliers in Victoria, Australia and
were all of commercial quality Table 4-3. The methanolic and aqueous extraction
method was modified from that previously described (Unger and Frank, 2004).
Tablets were crushed and the contents of capsules emptied, extractions were either
water or 80% methanol to allow for the aqueous and distinctly lipophilic
components to be separated.

Chapter 4- Cytochrome P450 Inhibition 191
Solvent volumes were adjusted so that standardised extracts at 100 mg of
product/ml were obtained. This was based on the manufacturers’ stated
concentration of the active or principle component.
Extracts were agitated in a shaking water bath at 37C for 30 minutes then
centrifuged at 2500 g for 10 minutes. Standard extracts were diluted to final
nominal concentrations of 20, 100 and 500 g/ml. Methanol was evaporated to
dryness under vacuum and the final volume of methanol did not exceed 1% (v:v).
Extracts were kept in the dark and shelf life set at 2 weeks.
4.17.3 Liver Samples and Microsome Preparation
Human liver samples were obtained from the University Hospital of Oulu as
surplus from cadaver kidney transplantation donors. The collection of surplus tissue
was approved by the Ethics Committee of the Medical Faculty, University of Oulu,
Finland. All donors were Caucasians ranging in age from 21 to 62, four were
female and six were male. Detailed information is shown in
Table 4-4. Samples were transferred to ice immediately after surgical excision,
dissected into pieces of approximately 1cm3 in size, and snap frozen in liquid
nitrogen at -80C.
Microsomes were prepared by standard differential ultra-centrifugation as described
previously (Pelkonen et al., 1974). A microsomal pool of extensively characterised
microsomes was used for all incubations. Previous studies have shown sufficient
model activities, no known polymorphisms, expected effects of model inhibitors
and quantitation of CYPs by Western blotting.

Chapter 4- Cytochrome P450 Inhibition 192
The final pellet was suspended in 0.1M phosphate buffer pH 7.4. Protein content
was determined by the method of Bradford (Bradford, 1976).

193
Table 4-3: Complementary products used to screen for the potential inhibition of cytochrome P450 enzymes in the single substrate and N-in-
one cocktail assays.
Product Active or Principal
Component
Concentration of active or
principal component in
each tablet/capsule
Manufacturer Batch Number Reported benefit/Use
Black Cohosh Cimicifuga racemosa 500mg Nature’s Own 302858 Eases the symptoms of menopause.
Dong Quai Angelica polymorpha 520mg Nature’s Sunshine 00356532 Assist with menstrual cramps and the management of
menstrual irregularity, fatigue and high blood
pressure.
Goldenseal Hydrastis Canadensis 500mg Nature’s Sunshine 01220333 Assist in the treatment of respiratory infections, anti-
inflammatory, and as laxative.
Gotu Kola Centella asiatica 395mg Nature’s Sunshine 01223293 Eases anxiety and mood disorders.
Horse Chestnut Aesculus
hippocastanum
2000mg NutraLife B4159 Treatment for blood stagnation.
Horsetail Equisetum arvense 360mg Nature’s Sunshine 00243503 Used as a diuretic and in the treatment of urinary tract
infections.
Liquorice Root Glycyrrhiza glabra 425mg Nature’s Sunshine 00238614 Used as an expectorant anti-inflammatory agent.
Primary adrenal tonic.
Milk Thistle Silybum marianum 84mg Nature’s Own 302090 Assist the liver in detoxification.
Saw Palmetto Serenoa serrulata 550mg Nature’s Sunshine 00455693 Treatment of prostate hyperplasia.
Valerian Valeriana officinalis 2250mg Bio-Organics 301338 Antispasmodic and muscle relaxant. Relieve nervous
tension and anxiety.

194
Table 4-4: Characteristics of human liver samples used for the cytochrome P450 inhibition studies.
Liver Age Sex Cause of death Drug history Liver pathology
HL20 54 M ICH Diazepama None
HL21 44 M ICH Phenytoina, alcohol abuse Cirrhotic
HL22 40 F ICH Dexamethasonea, nizatidinea, phenytoina None
HL23 43 M ICH Diazepama, smoker None
HL24 47 M ICH No medication, smoker None
HL28 21 M Stroke Dexamethasonea, smoker None
HL29 39 F ICH, SAH Dexamethasonea None
HL30 53 F ICH, SAH No medication Steatosis
HL31 44 F ICH, SAH No medication Steatosis
HL32 62 M ICH, SDH Metformin, alcohol abuse, smoker None
a Drugs were administered only during the 24 hours before death; M = male; F = female; ICH = intracerebral haemorrhage; SAH =
subarachnoid haemorrhage; SDH = subdural haematoma

Chapter 4- Cytochrome P450 Inhibition 195
4.17.4 CYP Inhibition Assays: Single Substrate Incubations
The incubation and analysis conditions used in the single substrate assays are
summarised in Table 4-5. The isoenzymes investigated were: CYP1A1/2
(ethoxyresorufin O-deethylation), CYP2A6 (coumarin 7-hydroxylation), CYP2B6
(bupropion hydroxylation), CYP2C8 (amodiaquine deethylation), CYP2C9
(tolbutamide hydroxylation), CYP2C19 (omeprazole 5-hydroxylation), CYP2D6
(dextromethorphan O-demethylation), CYP2E1 (chlorzoxazone 6-hydroxylation)
and CYP3A4 (midazolam -hydroxylation and omeprazole sulphoxidation).
Detailed information on the methodology can be found in the original papers
(Table 4-5). The probe substrates and their metabolites are shown in
Figure 4-7 and Figure 4-8. Known specific inhibitors were used for each of the
isoenzymes investigated, Figure 4-9. As midazolam hydroxylation and omeprazole
sulphoxidation both monitor CYP3A4 inhibition, the designations of (M)3A4 and
(OS)3A4 (respectively) were used.
For each assay, pooled microsomes were diluted to the required protein
concentration (Table 4-5) with 0.1M phosphate buffer (pH = 7.4), substrate or
inhibitor and test product were all pre-incubated for 2 minutes at 37C. The
reaction was started with the addition of -nicotinamide adenine dinucleotide
phosphate (NADPH) 10mM (CYP2B6, CYP2C8, CYP2C19 and CYP3A4) or
cofactor mixture, containing 10mM MgCl2, 0.2M KCl, NADP (1.25 mM) glucose-
6-phosphate (6 mM), and 100 units of glucose-6-phospahte dehydrogenase,
(CYP1A1/2, CYP2A6, CYP2C9, CYP2D6 and CYP2E1).

Chapter 4- Cytochrome P450 Inhibition 196
Incubations were maintained at 37C for the appropriate time (Table 4-5) in a
shaking incubator block (Eppendorf Thermomixer 5436, Hamburg, Germany), and
stopped with the appropriate stop reagent: methanol (CYP1A1/2, CYP2C9,
CYP2E1, CYP3A4) acetonitrile (CYP2B6, CYP2C8, CYP2C19) hydrochloric acid
(CYP2D6) and trichloroacetic acid (CYP2A6).
Once the reaction was stopped, incubations were kept on ice for a minimum of 5
minutes then centrifuged for 15 minutes at 10,000 g. Supernatants were collected
into clean tubes and stored at -20C until analysis. For analysis, incubations were
thawed at room temperature, shaken and centrifuged for 10 minutes at 10,000 g.
HPLC analysis was with a Shimadzu VP series HPLC system with Waters
Symmetry C18 column (3.9x150mm, 5m, Waters Corp, Milford, MA) and
Lichrospher 100 RP-18 guard column (4.0x4.0 mm, E. Merck, Darmstadt,
Germany). Ethoxyresorufin O-deethylation (EROD) and coumarin 7-hyroxylation
(ECOD) assays were read immediately following the incubations. The metabolites
of ethoxyresorufin and coumarin were determined using a Hitachi F-1040
fluorescence spectrophotometer.

197
Table 4-5: Summary of the single substrate in vitro assay parameters for the cytochrome P450 inhibition studies.
CYP Substrate Reaction Inhibitor [S]/
Km
[Protein]
mg
Cofactor
System
Incubation
time (min)
Assay method
and
Eluent
Reference
1A1/2 7-Ethoxyresorufin Ethoxyresorufin
O-deethylation
2.5 0.2 NADPH
regenerating
5 Fluorometric
(530/585nm) (Burke et al., 1977)
2A6 Coumarin Coumarin
7-hydroxylation
10 0.1 NADPH
regenerating
10 Fluorometric
(365/454nm) (Aitio, 1978)
(Raunio et al., 1988)
2B6 Bupropion Bupropion
hydroxylation
Ticlopidine 0.6 0.4 NADPH 15 UV-HPLC
(204/214nm)
75% 50 mM o-
phosphoric acid-
buffer: 25%
acetonitrile
(Hesse et al., 2000)
(Faucette et al., 2000)
2C8 Amodiaquine Amodiaquine
deethylation
Montelukast 12 0.1 NADPH 20 UV-HPLC
(342nm)
70% 50 mM o-
phosphoric acid-
buffer: 30%
acetonitrile
(Li et al., 2002)
2C9 Tolbutamide Tolbutamide
hydroxylation
Sulfaphenazole 0.5 0.15 NADPH
regenerating
20 UV-HPLC
(236nm)
70% 50 mM o-
phosphoric acid-
buffer: 30%
acetonitrile
(Knodell et al., 1987)
(Sullivan-Klose et
al., 1996)

198
CYP Substrate Reaction Inhibitor [S]/
Km
[Protein]
mg
Cofactor
System
Incubation
time (min)
Assay method
and Eluent
Reference
2C19 Omeprazole Omeprazole
5-hydroxylation
Fluconazole 2 0.1 NADPH 20 UV-HPLC
(204/304nm)
25 mM o-
phosphoric acid-
buffer (A) and
acetonitrile (B)
(Äbelö et al., 2000)
2D6 Dextromethorphan Dextromethorphan
O-demethylation
Quinidine 2 0.1 NADPH
regenerating
20 UV-HPLC
(204/280nm) 75% 50 mM o-
phosphoric acid-
buffer: 25%
acetonitrile
(Park et al., 1984)
(Kronbach et al.,
1987)
2E1 Chlorzoxazone Chlorzoxazone 6-
hydroxylation
Pyridine 2.5 0.1 NADPH
regenerating
20 UV-HPLC
(282nm) 70% 50 mM o-
phosphoric acid-
buffer: 30%
acetonitrile
(Peter et al., 1990)
3A4 Midazolam Midazolam
-hydroxylation
Itraconazole 2 0.1 NADPH
regenerating
5 UV-HPLC
(245nm)
60% water: 40%
acetonitrile
(Kronbach et al.,
1989)
3A4 Omeprazole Omeprazole
sulphoxidation
Ketoconazole 0.4 0.1 NADPH 20 UV-HPLC,
(304/204nm) 25 mM o-
phosphoric acid-
buffer (A) and
acetonitrile (B)
(Äbelö et al., 2000)

Chapter 4- Cytochrome P450 Inhibition 199
4.17.5 CYP Inhibition Assays: N-In-One-Cocktail Incubations
The incubation conditions and instrumentation used for the enzyme inhibition
assays have all been previously described in detail covering the following CYP
isoenzymes: CYP1A1/2 (ethoxyresorufin O-deethylation), CYP2A6 (coumarin 7-
hydroxylation), CYP2C9 (tolbutamide hydroxylation), CYP2D6
(dextromethorphan O-demethylation), CYP2E1 (chlorzoxazone 6-hydroxylation)
CYP3A4/5 (midazolam -hydroxylation) (Taavitsainen et al., 2001). The assays
for CYP2B6 (bupropion hydroxylation), CYP2C8 (amodiaquine N-deethylation)
and CYP2C19 and CYP3A4 (omeprazole 5-hydroxylation and sulphoxidation)
have all been described previously (Turpeinen et al., 2004, Turpeinen et al., 2006).
The N-in one cocktail method was performed as previously described (Tolonen et
al., 2007, Turpeinen et al., 2005) and is summarised in Table 4-6. The probe
substrates and their metabolites are shown in Figures 4-7 and 4-8. As omeprazole-5-
hydroxylation and omeprazole demethylation both monitor CYP2C19 inhibition,
the designations of (5)2C19 and (D)2C19 (respectively) were used. For CYP3A4,
midazolam hydroxylation, omeprazole sulfoxidation, omeprazole-3-hydroxylation
and 6β-testosterone hydroxylation, were monitored: and denoted (M)3A4,
(OS)3A4, (3OH)3A4 and (T)3A4.
Each incubation contained 0.5 mg microsomal protein/ml, 100mM phosphate
buffer (pH7.4), 1mM NADPH and all ten-probe substrates. Substrates and their
final concentrations for the incubations were: melatonin (4 µM), coumarin (2 M),
bupropion (1 M), amodiaquine (2 M), tolbutamide (4 M), omeprazole (2 m),
dextromethorphan (0.2 M), chlorzoxazone (6 M), midazolam (0.4 M) and

Chapter 4- Cytochrome P450 Inhibition 200
testosterone (1 M). Reaction mixture (final volume 200 l) was pre-incubated for 2
minutes at +37ºC in a shaking incubator block (Eppendorf Thermomixer 5436,
Hamburg, Germany) before the addition of NADPH to initiate the reaction.
Each reaction was stopped after 20 minutes by the addition of 100 l of acetonitrile
containing phenacetin (0.5 µM) (Figure 4-9) as an internal standard. Proteins were
precipitated by cooling the samples in an ice bath for a minimum of 5 minutes then
centrifuged for 15 minutes at 10,000 g. The supernatant was collected into clean
tubes and stored at -20C until analysis. All incubations were run in duplicate on
two separate occasions. For analysis, the incubations were thawed at room
temperature, shaken and centrifuged for 10 min at 10,000 g. The supernatants were
transferred to a Waters Total Recovery vial (waters Corporation, Milford,
Massachusetts, USA) for LC/MSMS analysis.

Chapter 4- Cytochrome P450 Inhibition 201
Figure 4-7: Structures of the substrates utilised in the single substrate (#) and N-in-
one cocktail (*) cytochrome P450 inhibition enzyme assays, with the relevant
metabolising CYP.

Chapter 4- Cytochrome P450 Inhibition 202
Figure 4-8: Structures of the metabolites detected in the single substrate (#) and N-
in-one cocktail (*) cytochrome P450 inhibition enzyme assays, with the relevant
metabolising CYP.

Chapter 4- Cytochrome P450 Inhibition 203
Figure 4-9: Structures of the inhibitors utilised in the single substrate enzyme
assays and the internal standard for the N-in-one cocktail cytochrome P450
inhibition enzymes assays, with the relevant metabolising CYP.

204
Table 4-6: Summary of the N-in-one cocktail in vitro assays parameters for the cytochrome P450 inhibition studies, adapted from Turpeinen et
al. (Turpeinen et al., 2004). The Km values (Pelkonen et al., 1998), except for amodiaquine, (Li et al., 2002) bupropion (Hesse et al., 2000) and
melatonin (Härtter et al., 2001).
CYP Substrate Reaction Metabolite [Substrate] (M) Km (μm) Metabolite retention time (min) Extracted ions (m/z)
1A2 Melatonin 6-Hydroxylation 6-OH-MEL 4 6 4.0 271 + 287
2A6 Coumarin 7-Hydroxylation 7-OH-COU 2 2 5.4 163
2B6 Bupropion Hydroxylation OH-BUP 1 90 4.4 238 + 256
2C8 Amodiaquine Deethylation deEt-AMO 2 2.4 1.7 328
2C9 Tolbutamide Methylhydroxylation OH-TOL 4 200 5.7 287 + 309
2C19
2C19
3A4
3A4
Omeprazole 5-Hydroxylation
Demethylation
Sulfoxidation
3-Hydroxylation
5-OH-OME
dem-OME
SO2-OME
3-OH-OME
2 10 5.3
4.3
6.6
5.7
362
332
362
362
2D6 Dextromethorphan O-demethylation O-dem-DEX 0.2 5 4.1 258
2E1 Chlorzoxazone 6-Hydroxylation 6-OH-CLZ 6 40 3.8 186
3A4 Midazolam 1-Hydroxylation -OH-MDZ 0.4 4 6.2 342
3A4 Testosterone 6-Hydroxylation 6-OH-TES 1 47 7.3 305 + 327

Chapter 4- Cytochrome P450 Inhibition 205
4.17.6 Data and Statistical Analysis
4.17.6.1 Enzyme Assays- Single Substrate
The concentration of the metabolite was calculated from peak height ratios of the
UV chromatograms on the basis of standard calibration curves of authentic
metabolites. The enzyme activity in the presence of the extracts was compared with
control incubations into which only solvent was added.
The IC50 values for the extracts (concentration causing 50% reduction of control
activity) were determined from duplicate incubations run on two separate occasions
by non-linear regression analysis (GraphPad Prism, v5.0). In order to interpret the
results, the IC50 values were converted to reflect the volume one dose unit (one
tablet or capsule) should be dissolved in to obtain the corresponding concentration
as per the method described previously (Strandell et al., 2004).
Metabolites of ethoxyresorufin and ethoxycoumarin were analysed fluorometrically
and the inhibition determined from standard calculations:
EROD
ECOD:
Where FU = fluorescence units.
1000pmol ´ FU
S tandard ´ 5min´ 0.2mg(protein)= pmol /min/mg(protein)
1250pmol ´ FU
S tandard ´10min´ 0.1mg(protein)= pmol /min/mg(protein)

Chapter 4- Cytochrome P450 Inhibition 206
4.17.6.2 Enzyme Assays- N-In-One-Cocktail
Data is presented as the % activity of control for each of the products; each point is
the average of duplicate incubations, conducted on two independent occasions
where possible an IC50 was calculated using a non-linear regression analysis
program (GraphPad Prism, v5.0). In order to interpret the results, the IC50 values
were converted to reflect the volume one dose unit (one tablet or capsule) should be
dissolved in to obtain the corresponding concentration as per the method described
previously (Strandell et al., 2004).

Chapter 4- Cytochrome P450 Inhibition 207
4.18 Results
4.18.1 Single Substrate Incubations
4.18.1.1 General Comments
The single substrate assays were all run in duplicate on two separate occasions. The
inhibition for each of the extracts was determined from peak height ratios on the
basis of standard calibrations and compared to control incubations. The variability
between the two runs was negligible but was greater than the variability seen with
the N-in-one cocktail assay (Appendix A). Between the individual incubations the
variability did not exceed 15%.
The inhibition potential for several extracts could not be determined due to
limitations of the method; the metabolite peaks could not be resolved from the
HPLC as the extracts themselves produced a peak adjacent to the metabolite peak.
This interference with the peaks was seen most predominantly with Liquorice Root,
with six of the aqueous extracts (CYP1A2, CYP2A6, CYP2C8, CYP2D6, CYP2E1
and CYP3A4-using midazolam hydroxylation as the probe reaction), and 5 of the
methanolic extracts (CYP2B6, CYP2C9, CYP2C19, and both CYP3A4
incubations) not being able to be determined.
4.18.2 CYP Inhibition
Significant inhibition for at least two of the isoenzymes was seen for each of the
products investigated. Inhibition was dose dependent; with the methanolic extracts
causing more significant inhibition than the aqueous extracts, with higher levels of
inhibition recorded and more isoenzymes being inhibited (Figure 4-10 -
Figure 4-19).

Chapter 4- Cytochrome P450 Inhibition 208
With the aqueous extracts, inhibition >50% of the control did not occur for any of
the isoenzymes investigated for Black Cohosh (Figure 4-10), Dong Quai
(Figure 4-11), and Liquorice Root (Figure 4-16). Though in all cases, inhibition
could not be determined for each of the isoenzymes investigated due to
interference. For CYP2C9 and CYP2C8, inhibition >50% only occurred with
Goldenseal and Saw Palmetto respectively (Figure 4-12, Figure 4-18). CYP3A4 was
not inhibited >50% by any of the aqueous extracts for either of the reactions
monitored. CYP2C8 was the most significantly inhibited isoenzyme for the
aqueous extracts with four of the products causing >50% inhibition, Horsetail, Milk
Thistle, Saw Palmetto and Valerian. Valerian was the most potent aqueous extract
causing the inhibition of five isoenzymes at a level >50%, CYP2A6, CYP2B6,
CYP2C8, CYP2D6 and CYP2E1 (Figure 4-19).
The methanolic extracts all caused inhibition >50% of at least one of the
investigated isoenzymes. As with the aqueous extracts, the most potent methanolic
extract was Valerian, which caused inhibition of all the investigated isoenzymes
except CYP2C9, which due to the problems of interference could not be determined
(Figure 4-19). CYP2C19 was the isoenzyme most inhibited, with all 9 extracts
except for Liquorice Root (which could not be determined due to interference
problems) causing >50% inhibition.

Chapter 4- Cytochrome P450 Inhibition 209
4.18.3 Inhibition Constants (IC50)
The IC50 values were determined by non-linear regression and those that produced
an IC50 <100 µg/ml are shown in
Table 4-7. The most potent inhibition for the aqueous extract was seen with Horse
Chestnut, with an IC50 of 18.23 µg/ml for CYP2E1. The methanolic extracts caused
the most potent inhibition of CYP2C19 with all except Liquorice Root, which
could not be determined, producing an IC50 <100 µg/ml. The most potent was the
methanolic extract of Goldenseal, which was determined to have an IC50 of 5.7
µg/ml with the IC50 for Saw Palmetto being 5.9 µg/ml for CYP2B6.
In order to interpret the results, the IC50 values were converted to reflect the volume
one dose unit (one tablet or capsule) should be dissolved in to obtain the
corresponding concentration as per the method described previously (Strandell et
al., 2004), with results shown in Table 4-8. A converted IC50 value of 5 litres/dose
unit indicates that one dose unit diluted to approximately the blood volume (of an
average person) would result in a concentration of inhibitory substances equivalent
to the recorded IC50 of CYP enzyme inhibition. Whilst this produces a conservative
figure it is useful to identify potentially clinically relevant CYP inhibition. The most
potent aqueous extract using this method was Horse Chestnut, which produced an
inhibition in L/dose units of 109.7. The most potent methanolic extract was
Valerian, which produced an inhibition of 286 L/dose units for CYP2B6 and 232.5
L/dose units for CYP2C19.

210
Figure 4-10: % Inhibition of control for the aqueous (Aq) and methanolic (Meth) extracts of Black Cohosh for the cytochrome P450 isoforms
investigated with the single substrate incubations. Results are the average of replicate incubations ran on two separate occasions.
0
10
20
30
40
50
60
70
80
90
100
1A2 2A6 2B6 2C8 2C9 2C19 2D6 2E1 (M)3A4 (OS)3A4
% I
nh
ibit
ion
of
Co
ntr
ol
CYP Isoenzyme Assay
Aq 20 ug/ml
Aq 100 ug/ml
Aq 500 ug/ml
Meth 20 ug/ml
Meth 100 ug/ml
Meth 500 ug/ml

211
Figure 4-11: % Inhibition of control for the aqueous (Aq) and methanolic (Meth) extracts of Dong Quai for the cytochrome P450 isoforms
investigated with the single substrate incubations. Results are the average of replicate incubations ran on two separate occasions.
0
10
20
30
40
50
60
70
80
90
100
1A2 2A6 2B6 2C8 2C9 2C19 2D6 2E1 (M)3A4 (OS)3A4
% I
nh
ibit
ion
of
Co
ntr
ol
CYP Isoenzyme Assay
Aq 20 ug/ml
Aq 100 ug/ml
Aq 500 ug/ml
Meth 20 ug/ml
Meth 100 ug/ml
Meth 500 ug/ml

212
Figure 4-12: % Inhibition of control for aqueous (Aq) and methanolic (Meth) extracts of Goldenseal for each of the cytochrome P450 isoforms
investigated with the single substrate incubations. Results are the average of replicate incubations ran on two separate occasions.
0
10
20
30
40
50
60
70
80
90
100
1A2 2A6 2B6 2C8 2C9 2C19 2D6 2E1 (M)3A4 (OS)3A4
% I
nh
ibit
ion
of
Co
ntr
ol
CYP Isoenzyme Assay
Aq 20 ug/ml
Aq 100 ug/ml
Aq 500 ug/ml
Meth 20 ug/ml
Meth 100 ug/ml
Meth 500 ug/ml

213
Figure 4-13: % Inhibition of control for the aqueous (Aq) and methanolic (Meth) extracts of Gotu Kola for each of the cytochrome P450
isoforms investigated with the single substrate incubations. Results are the average of replicate incubations ran on two separate occasions.
0
10
20
30
40
50
60
70
80
90
100
1A2 2A6 2B6 2C8 2C9 2C19 2D6 2E1 (M)3A4 (OS)3A4
% I
nh
ibit
ion
of
Co
ntr
ol
CYP Isoenzyme Assay
Aq 20 ug/ml
Aq 100 ug/ml
Aq 500 ug/ml
Meth 20 ug/ml
Meth 100 ug/ml
Meth 500 ug/ml

214
Figure 4-14: % Inhibition of control for the aqueous (Aq) and methanolic (Meth) extracts of Horse Chestnut for each of the cytochrome P450
isoforms investigated with the single substrate incubations. Results are the average of replicate incubations ran on two separate occasions.
0
10
20
30
40
50
60
70
80
90
100
1A2 2A6 2B6 2C8 2C9 2C19 2D6 2E1 (M)3A4 (OS)3A4
% I
nh
ibit
ion
of
Co
ntr
ol
CYP Isoenzyme Assay
Aq 20 ug/ml
Aq 100 ug/ml
Aq 500 ug/ml
Meth 20 ug/ml
Meth 100 ug/ml
Meth 500 ug/ml

215
Figure 4-15: % Inhibition of control for the aqueous (Aq) and methanolic (Meth) extracts of Horsetail for each of the cytochrome P450
isoforms investigated with the single substrate incubations. Results are the average of replicate incubations ran on two separate occasions.
0
10
20
30
40
50
60
70
80
90
100
1A2 2A6 2B6 2C8 2C9 2C19 2D6 2E1 (M)3A4 (OS)3A4
% I
nh
ibit
ion
of
Co
ntr
ol
CYP Isoenzyme Assay
Aq 20 ug/ml
Aq 100 ug/ml
Aq 500 ug/ml
Meth 20 ug/ml
Meth 100 ug/ml
Meth 500 ug/ml

216
Figure 4-16: % Inhibition of control for the aqueous (Aq) and methanolic (Meth) extracts of Liquorice Root for each of the cytochrome P450
isoforms investigated with the single substrate incubations. Results are the average of replicate incubations ran on two separate occasions.
0
10
20
30
40
50
60
70
80
90
100
1A2 2A6 2B6 2C8 2C9 2C19 2D6 2E1 (M)3A4 (OS)3A4
% I
nh
ibit
ion
of
Co
ntr
ol
CYP Isoenzyme Assay
Aq 20 ug/ml
Aq 100 ug/ml
Aq 500 ug/ml
Meth 20 ug/ml
Meth 100 ug/ml
Meth 500 ug/ml

217
Figure 4-17: % Inhibition of control for the aqueous (Aq) and methanolic (Meth) extracts of Milk Thistle for each of the cytochrome P450
isoforms investigated with the single substrate incubations. Results are the average of replicate incubations ran on two separate occasions.
0
10
20
30
40
50
60
70
80
90
100
1A2 2A6 2B6 2C8 2C9 2C19 2D6 2E1 (M)3A4 (OS)3A4
% I
nh
ibit
ion
of
Co
ntr
ol
CYP Isoenzyme Assay
Aq 20 ug/ml
Aq 100 ug/ml
Aq 500 ug/ml
Meth 20 ug/ml
Meth 100 ug/ml
Meth 500 ug/ml

218
Figure 4-18: % Inhibition of control for the aqueous (Aq) and methanolic (Meth) extracts of Saw Palmetto for each of the cytochrome P450
isoforms investigated with the single substrate incubations. Results are the average of replicate incubations ran on two separate occasions.
0
10
20
30
40
50
60
70
80
90
100
1A2 2A6 2B6 2C8 2C9 2C19 2D6 2E1 (M)3A4 (OS)3A4
% I
nh
ibit
ion
of
Co
ntr
ol
CYP Isoenzyme Assay
Aq 20 ug/ml
Aq 100 ug/ml
Aq 500 ug/ml
Meth 20 ug/ml
Meth 100 ug/ml
Meth 500 ug/ml

219
Figure 4-19: % Inhibition of control for the aqueous (Aq) and methanolic (Meth) extracts of Valerian for each of the cytochrome P450 isoforms
investigated with the single substrate incubations. Results are the average of replicate incubations ran on two separate occasions.
0
10
20
30
40
50
60
70
80
90
100
1A2 2A6 2B6 2C8 2C9 2C19 2D6 2E1 (M)3A4 (OS)3A4
% I
nh
ibit
ion
of
Co
ntr
ol
CYP Isoenzyme Assay
Aq 20 ug/ml
Aq 100 ug/ml
Aq 500 ug/ml
Meth 20 ug/ml
Meth 100 ug/ml
Meth 500 ug/ml

220
Table 4-7: Estimated IC50 (g/ml) for the products investigated for CYP inhibition using the single substrate assay. IC50 calculated using a non-
linear regression analysis program (GraphPad Prism, v5.0).
Product Extract 1A2 2A6 2B6 2C8 2C9 2C19 2D6 2E1 (M)3A4 (OS)3A4
Black Cohosh Aq
Black Cohosh Meth 24.5 32.8 11.38
Dong Qui Aq
Dong Quai Meth 93.8 17.74 19.7 87.65
Goldenseal Aq *
Goldenseal Meth 8.75 5.7 10.17 6.22 35.32 12.98
Gotu Kola Aq
Gotu Kola Meth 11.46 12.76 60.91
Horse Chestnut Aq 53.52 18.23
Horse Chestnut Meth * 26.07 9.59
Horsetail Aq 79.97 93.56
Horsetail Meth 14.83 21.18 22.63
Liquorice Root Aq * * * * * *
Liquorice Root Meth 23.4 * 34.45 * * 21.25 16.66 * *
Milk Thistle Aq * 61.7
Milk Thistle Meth 31.1 * 10.5 *
Saw Palmetto Aq
Saw Palmetto Meth 5.9 76.3 * 6.8 15.5
Valerian Aq
Valerian Meth 56.5 7.9 12.0 * 9.7 52.8 17.6 76.6
Aq = aqueous extracts, Meth = methanolic extracts. * Inhibition could not be determined.

221
Table 4-8: Inhibition of CYP isoenzymes by extracts that produced an IC50 <100 g/ml in the single substrate assay. IC50 values are expressed
as litre/dose unit.
Product Extract 1A2 2A6 2B6 2C8 2C9 2C19 2D6 2E1 (M)3A4 (OS)3A4
Black Cohosh Aq
Black Cohosh Meth 20.4 15.2 43.9
Dong Quai Aq *
Dong Quai Meth 5.5 29.3 26.4 5.9
Goldenseal Aq
Goldenseal Meth 57.2 87.7 49.2 80.4 14.2 38.5
Gotu Kola Aq
Gotu Kola Meth 34.5 31.0 6.5
Horse Chestnut Aq 37.4 109.7
Horse Chestnut Meth * 76.7 208.5
Horsetail Aq 4.5 3.9
Horsetail Meth 24.3 17 15.9
Liquorice Root Aq * * * * * *
Liquorice Root Meth 18.2 * 12.3 * * 20 25.5 * *
Milk Thistle Aq * 1.36
Milk Thistle Meth 2.7 * 8.0 *
Saw Palmetto Aq
Saw Palmetto Meth 93.2 7.2 * 80.3 35.4
Valerian Aq
Valerian Meth 39.8 286 187.7 * 232.5 42.7 127.8 29.4
Aq = aqueous extracts, Meth = methanolic extracts. * Inhibition could not be determined.

Chapter 4- Cytochrome P450 Inhibition 222
4.19 N-in-one Cocktail Assays
4.19.1 General Comments
The N-in-one cocktail assays were all run in duplicate on two separate occasions.
The inhibition for each of the extracts was determined against the control and was
shown to be dose dependant for the extracts investigated (Figure 4-20 -
Figure 4-29). The variability between the two runs was negligible and less than the
variability seen in the single substrate assay with the variability between individual
incubations not exceeding 10% (Appendix A).
Unlike the single substrate assays, the N-in-one cocktail assay did not have the
same problems of interference. As the N-in-one cocktail method utilises time of
flight mass spectrometry which is a more sensitive and discriminatory (i.e.
resolution is superior) method than the HPLC the substrates and metabolites could
be determined for all of the investigated extracts, as the detection of ions is based on
the exact mass/charge (m/z) ratio.
4.19.2 CYP Inhibition
As with the single substrate incubations, the methanolic extracts caused more
significant inhibition than the aqueous extracts, with higher levels of inhibition
recorded and more isoenzymes being inhibited. Inhibition was dose dependent for
all of the extracts investigated (Figure 4-20 - Figure 4-29).
With regards to the aqueous extracts, inhibition >50% did not occur for any of the
isoenzymes investigated for Black Cohosh (Figure 4-20) and Dong Quai
(Figure 4-21), this pattern was also seen with the single substrate incubations.

Chapter 4- Cytochrome P450 Inhibition 223
CYP2B6 and CYP2C9 were only significantly inhibited by Valerian (Figure 4-29)
and Milk Thistle (Figure 4-27), respectively. The most potent aqueous extract was
Valerian which caused >50% inhibition at the highest investigated concentration of
6 isoenzymes (Figure 4-29).
CYP2D6 and CYP2E1 were both significantly inhibited by 3 products, whilst
CYP2A6 and CYP2C8 were both significantly inhibited by 4 products. CYP3A4
inhibition varied depending on the reaction being monitored. No significant
inhibition was seen for any of the aqueous extracts using midazolam hydroxylation
((M)3A4) or omeprazole sulfoxidation ((OS)3A4), but significant inhibition was
detected using the omeprazole 3-hydroxylation ((3OH)3A4) and testosterone
hydroxylation ((T)3A4).
The methanolic extract of Valerian significantly inhibited all of the isoenzymes
investigated (Figure 4-29). CYP2C19 was the most significantly inhibited
isoenzyme with all of the methanolic extracts inhibiting this isoenzyme using both
probe reactions (omeprazole 5-hydroxylation and omeprazole demethylation).
CYP2E1 was inhibited by all of the extracts except Milk Thistle. CYP1A2 and
CYP2D6 were both inhibited significantly by 3 of the methanolic extracts. CYP2A6
was only significantly inhibited by 2 of the methanolic extracts, Dong Quai and
Valerian. CYP2C8 and CYP2C9 were significantly inhibited by 4 and 5 of the
methanolic extracts respectively. CYP3A4 inhibition varied as it did with the
aqueous extracts. Goldenseal, Saw Palmetto and Valerian all caused significant
inhibition of CYP3A4 with all 4 probe reactions.

Chapter 4- Cytochrome P450 Inhibition 224
4.19.3 Inhibition Constants (IC50)
Estimated IC50s were determined for the extracts that produced significant
inhibition (<100 g/ml) and are shown in Table 4-9. The most potent aqueous
extract was Goldenseal with an IC50 of 6.7 µg/ml for CYP2D6. Valerian produced
and IC50 <100 µg/ml for all of the isoenzymes except CYP2A6. The most potent
methanolic extract was Milk Thistle, which produced and IC50 of 2.9 µg/ml for
CYP2C9.
In order to interpret the results, the IC50 values were converted to reflect the volume
one dose unit (one tablet or capsule) should be dissolved in to obtain the
corresponding concentration as per the method described previously (Strandell et
al., 2004), Table 4-10. Using this method to represent the data the methanolic
extract of Valerian is the most potent inhibitor of the CYP isoenzymes investigated,
with 5 CYPs (CYP2B6, CYP2C8, CYP2C9, CYP2C19 and CYP2E1) having an
inhibition in L/dose units over 100 L. The methanolic extracts of Goldenseal,
Horse Chestnut, Liquorice Root and Saw Palmetto all produced an inhibition >100
L/dose units for four isoenzymes. With the aqueous extracts, only Horse Chestnut
produced an inhibition >100 L/dose units for both CYP2A6 and CYP2E1 with
values of 112.4 and 119 L/dose units respectively.

225
Figure 4-20: % Inhibition of control for the aqueous (Aq) and methanolic (Meth) extracts of Black Cohosh for each of the cytochrome P450
isoforms investigated with the N-in-one cocktail incubation. Results are the average of replicate incubations ran on two separate occasions.
0
10
20
30
40
50
60
70
80
90
100
1A2
2A6
2B6
2C8
2C9
(5)2
C19
(D)2
C19
2D6
2E1
(M)3
A4
(OS)3
A4
(3O
H)3
A4
(T)3
A4
% I
nh
ibit
ion
of
Co
ntr
ol
CYP Isoenzyme Assay
Aq 20 ug/ml
Aq 100 ug/ml
Aq 500 ug/ml
Meth 20 ug/ml
Meth 100 ug/ml
Meth 500 ug/ml

226
Figure 4-21: % Inhibition of control for the aqueous (Aq) and methanolic (Meth) extracts of Dong Quai for each of the cytochrome P450
isoforms investigated with the N-in-one cocktail incubation. Results are the average of replicate incubations ran on two separate occasions.
0
10
20
30
40
50
60
70
80
90
100
1A2
2A6
2B6
2C8
2C9
(5)2
C19
(D)2
C19
2D6
2E1
(M)3
A4
(OS)3
A4
(3O
H)3
A4
(T)3
A4
% I
nh
ibit
ion
of
Co
ntr
ol
CYP Isoenzyme Assay
Aq 20 ug/ml
Aq 100 ug/ml
Aq 500 ug/ml
Meth 20 ug/ml
Meth 100 ug/ml
Meth 500 ug/ml

227
Figure 4-22: % Inhibition of control for the aqueous (Aq) and methanolic (Meth) extracts of Goldenseal for each of the cytochrome P450
isoforms investigated with the N-in-one cocktail incubation. Results are the average of replicate incubations ran on two separate occasions.
0
10
20
30
40
50
60
70
80
90
100
1A2
2A6
2B6
2C8
2C9
(5)2
C19
(D)2
C19
2D6
2E1
(M)3
A4
(OS)3
A4
(3O
H)3
A4
(T)3
A4
% I
nh
ibit
ion
of
Co
ntr
ol
CYP Isoenzyme Assay
Aq 20 ug/ml
Aq 100 ug/ml
Aq 500 ug/ml
Meth 20 ug/ml
Meth 100 ug/ml
Meth 500 ug/ml

228
Figure 4-23: % Inhibition of control for the aqueous (Aq) and methanolic (Meth) extracts of Gotu Kola for each of the cytochrome P450
isoforms investigated with the N-in-one cocktail incubation. Results are the average of replicate incubations ran on two separate occasions.
0
10
20
30
40
50
60
70
80
90
100
1A2
2A6
2B6
2C8
2C9
(5)2
C19
(D)2
C19
2D6
2E1
(M)3
A4
(OS)3
A4
(3O
H)3
A4
(T)3
A4
% I
nh
ibit
ion
of
Co
ntr
ol
CYP Isoenzyme Assay
Aq 20 ug/ml
Aq 100 ug/ml
Aq 500 ug/ml
Meth 20 ug/ml
Meth 100 ug/ml
Meth 500 ug/ml

229
Figure 4-24: % Inhibition of control for the aqueous (Aq) and methanolic (Meth) extracts of Horsetail for each of the cytochrome P450
isoforms investigated with the N-in-one cocktail incubation. Results are the average of replicate incubations ran on two separate occasions.
0
10
20
30
40
50
60
70
80
90
100
1A2
2A6
2B6
2C8
2C9
(5)2
C19
(D)2
C19
2D6
2E1
(M)3
A4
(OS)3
A4
(3O
H)3
A4
(T)3
A4
% I
nh
ibit
ion
of
Co
ntr
ol
CYP Isoenzyme Assay
Aq 20 ug/ml
Aq 100 ug/ml
Aq 500 ug/ml
Meth 20 ug/ml
Meth 100 ug/ml
Meth 500 ug/ml

230
Figure 4-25: % Inhibition of control for the aqueous (Aq) and methanolic (Meth) extracts of Horse Chestnut for each of the CYP isoform
assays using the N-in-one cocktail incubation. Results are the average of replicate incubations ran on two separate occasions.
0
10
20
30
40
50
60
70
80
90
100
1A2
2A6
2B6
2C8
2C9
(5)2
C19
(D)2
C19
2D6
2E1
(M)3
A4
(OS)3
A4
(3O
H)3
A4
(T)3
A4
% I
nh
ibit
ion
of
Co
ntr
ol
CYP Isoenzyme Assay
Aq 20 ug/ml
Aq 100 ug/ml
Aq 500 ug/ml
Meth 20 ug/ml
Meth 100 ug/ml
Meth 500 ug/ml

231
Figure 4-26: % Inhibition of control for the aqueous (Aq) and methanolic (Meth) extracts of Liquorice Root for each of the cytochrome P450
isoforms investigated with the N-in-one cocktail incubation. Results are the average of replicate incubations ran on two separate occasions.
0
10
20
30
40
50
60
70
80
90
100
1A2
2A6
2B6
2C8
2C9
(5)2
C19
(D)2
C19
2D6
2E1
(M)3
A4
(OS)3
A4
(3O
H)3
A4
(T)3
A4
% I
nh
ibit
ion
of
Co
ntr
ol
CYP Isoenzyme Assay
Aq 20 ug/ml
Aq 100 ug/ml
Aq 500 ug/ml
Meth 20 ug/ml
Meth 100 ug/ml
Meth 500 ug/ml

232
Figure 4-27: % Inhibition of control for the aqueous (Aq) and methanolic (Meth) extracts of Milk Thistle for each of the cytochrome P450
isoforms investigated with the N-in-one cocktail incubation. Results are the average of replicate incubations ran on two separate occasions.
0
10
20
30
40
50
60
70
80
90
100
1A2
2A6
2B6
2C8
2C9
(5)2
C19
(D)2
C19
2D6
2E1
(M)3
A4
(OS)3
A4
(3O
H)3
A4
(T)3
A4
% I
nh
ibit
ion
of
Co
ntr
ol
CYP Isoenzyme Assay
Aq 20 ug/ml
Aq 100 ug/ml
Aq 500 ug/ml
Meth 20 ug/ml
Meth 100 ug/ml
Meth 500 ug/ml

233
Figure 4-28: % Inhibition of control for the aqueous (Aq) and methanolic (Meth) extracts of Saw Palmetto at for each of the cytochrome P450
isoforms investigated with the N-in-one cocktail incubation. Results are the average of replicate incubations ran on two separate occasions.
0
10
20
30
40
50
60
70
80
90
100
1A2
2A6
2B6
2C8
2C9
(5)2
C19
(D)2
C19
2D6
2E1
(M)3
A4
(OS)3
A4
(3O
H)3
A4
(T)3
A4
% I
nh
ibit
ion
of
Co
ntr
ol
CYP Isoenzyme Assay
Aq 20 ug/ml
Aq 100 ug/ml
Aq 500 ug/ml
Meth 20 ug/ml
Meth 100 ug/ml
Meth 500 ug/ml

234
Figure 4-29: % Inhibition of control for the aqueous (Aq) and methanolic (Meth) extracts of Valerian for each of the cytochrome P450 isoforms
investigated with the N-in-one cocktail incubation. Results are the average of replicate incubations ran on two separate occasions.
0
10
20
30
40
50
60
70
80
90
100
1A2
2A6
2B6
2C8
2C9
(5)2
C19
(D)2
C19
2D6
2E1
(M)3
A4
(OS)3
A4
(3O
H)3
A4
(T)3
A4
% I
nh
ibit
ion
of
Co
ntr
ol
CYP Isoenzyme Assay
Aq 20 ug/ml
Aq 100 ug/ml
Aq 500 ug/ml
Meth 20 ug/ml
Meth 100 ug/ml
Meth 500 ug/ml

235
Table 4-9: Estimated IC50 (g/ml) for the products investigated for CYP inhibition using the N-in-one cocktail assay. IC50 calculated using a
non-linear regression analysis program (GraphPad Prism, v5.0).
Product Extract 1A2 2A6 2B6 2C8 2C9 (5)2C19 (D)2C19 2D6 2E1 (M)3A4 (OS)3A4 (3OH)3A4 (T)3A4
Black Cohosh Aq
Black Cohosh Meth 49.2 36.3 23.9 11.5
Dong Quai Aq
Dong Quai Meth 94.7 11.4 13.7 14.3
Goldenseal Aq 6.7
Goldenseal Meth 6.5 4.8 4.9 6.3 3.9 26.7 10.1 3.6 9.7
Gotu Kola Aq
Gotu Kola Meth 14.0 8.3 7.8 9.5 58.4
Horse Chestnut Aq 17.8 16.8 66.1
Horse Chestnut Meth 18.0 21.3 20.0 8.6 4.4
Horsetail Aq 18.3 93.0
Horsetail Meth 12.6 11.3 15.5 7.9
Liquorice Root Aq 41.8 97.2 8.8
Liquorice Root Meth 28.7 4.2 22.6 3.6 5.1 3.7 13.7 6.6 73.0 44.5 3.6
Milk Thistle Aq 64.2
Milk Thistle Meth 7.7 2.9 4.8 4.2 15.5
Saw Palmetto Aq
Saw Palmetto Meth 3.9 68.9 4.1 5 12.3 12.6 3.5
Valerian Aq
Valerian Meth 55.8 5.8 4.3 5.1 5.2 6 54.1 19.7 91 3.6 56.2
Aq = aqueous extracts, Meth = methanolic extracts.

236
Table 4-10: Inhibition of CYP isoenzymes by extracts that produced an IC50 <100 g/ml in the N-in-one cocktail assay. IC50 values are
expressed as litre/dose unit.
Product Extract 1A2 2A6 2B6 2C8 2C9 (5)2C19 (D)2C19 2D6 2E1 (M)3A4 (OS)3A4 (3OH)3A4 (T)3A4
Black Cohosh Aq
Black Cohosh Meth 10 13.8 20.9 43.5
Dong Quai Aq
Dong Quai Meth 5.5 45.6 38 36.4
Goldenseal Aq 74.6
Goldenseal Meth 76.9 104.2 102 79.3 128.2 18.7 49.5 138.9 51.5
Gotu Kola Aq
Gotu Kola Meth 28.2 47.6 50.6 41.6 6.8
Horse Chestnut Aq 112.4 119 30.3
Horse Chestnut Meth 111 93.9 100 232.6 454.5
Horsetail Aq 19.7 3.9
Horsetail Meth 28.6 31.9 23.2 45.6
Liquorice Root Aq 10.2 4.4 48.3
Liquorice Root Meth 14.8 101.2 18.8 118.1 83.3 141.7 31 64.4 5.8 9.6 118.1 4.2
Milk Thistle Aq 10.9
Milk Thistle Meth 91 24.1 145.8 166.7 129.6
Saw Palmetto Aq
Saw Palmetto Meth 141 8 134.1 110 44.7 43.7 157
Valerian Aq
Valerian Meth 40.3 387.9 523.3 441.2 432.7 375 41.6 114.2 24.7 0.6 40
Aq = aqueous extracts, Meth = methanolic extracts.

Chapter 4 – Cytochrome P450 Inhibition 237
4.20 Discussion and Conclusions
4.20.1 Product Selection
The products selected for this study are amongst the top selling products in
Australia (Table 4-3). As the cytochrome P450 enzymes are the main drug
metabolising enzymes in the body and responsible for the metabolism of the
majority of therapeutic drugs then selecting products based on product market share
is a rational starting point.
Several products selected were done so on the basis of interaction potential with
therapeutic drugs based on the traditional reported use of the product (Table 4-3).
Horse chestnut is reported to be useful in the treatment of “blood stagnation” based
on this therapeutic indication there is a risk of concurrent use with anti-coagulant
drugs such as warfarin. As warfarin has a narrow therapeutic index, any drug
interaction resulting in increased or deceased bioavailability of warfarin could be
life threatening.
4.20.2 Selection of Inhibition Assay Method
Using pooled microsomes to investigate CYP inhibition allows for multiple
isoenzymes to be investigated from multiple donors, this gives a better
representation of the in vivo situation.
‘The single substrate assays employs HPLC and fluorescence detection of CYP
specific substrates and their metabolites. These substrates are well characterised and
routinely used to investigate interactions with CYPs. The disadvantage of this
technique is that only CYP can be monitored at once.

Chapter 4 – Cytochrome P450 Inhibition 238
To increase the throughput of these assays and reduce the amount of human tissue
and labour required, the N-in-one cocktail assay can be used. With this assay the
simultaneous monitoring of multiple CYPs in the one reaction can be undertaken.
The substrates are specific for a CYP or multiple CYPs with different metabolites
generated for the different CYP. The assay requires LC/MSMS analysis to identify
the 10 substrates and 13 metabolites.
4.20.3 General Discussion of Results
The fact that CYPs are critical for the disposition of a large percentage of clinically
important drugs is well established and consequently any interference of this
enzyme system can lead to unexpected and adverse events. It has been estimated
that the majority of 200 important drugs are dependent on drug metabolism for
their elimination and CYPs played a dominant role in this metabolism (Williams et
al., 2004, Evans and Relling, 1999, Zanger et al., 2008). Members of the CYP3A
family contributed to the metabolism of 37% of the drugs, followed by CYP2C9
(17%), CYP2D6 (15%), CYP2C19 (10%), CYP1A2 (9%), and CYP2C8 (6%).
CYP2B6 and other CYP isoforms (CYP2A6 and CYP2E1) participated in the
metabolism of 4% and 2% of the drugs, respectively (Zanger et al., 2008). In light of
this, complementary products need to be investigated for their potential to interact
with and inhibit CYP enzymes.
Studying complementary products in this context presents a number of challenges,
including the fact that these products are complex preparations of variable
composition.

Chapter 4 – Cytochrome P450 Inhibition 239
Isolating individual components is one method that can be used to assist in the
determination of the kinetic profiles of these products but this is time consuming
and in the end may not provide the answers required as these products are not
taken as isolated components but as complex mixtures.
As variability is known to occur with these products between the manufacturers
and even between seasons and geographic locations of the raw materials (Song et
al., 2010, Strandell et al., 2004), ongoing screening is required. Screening for CYP
inhibition rather than simply testing for isolated components is more clinically
significant as components often interact to produce an effect and any single
component responsible for CYP inhibition may not be the components being
isolated and quantified.
Representing the IC50 in litres/dose gives some insight into the possibility of
reaching in vivo concentrations that may be significant. For example, an IC50 of 5-
litres/dose units indicates that one recommended dose unit diluted into a volume
equivalent to the approximate blood volume of the average person would result in a
concentration of inhibitory substances equivalent to the IC50 of CYP enzyme
inhibition. Obviously the likelihood of a notable inhibition being associated with a
product that has IC50s reaching into the range of 100 L or more is much greater.
Strandell et al. used litres/dose to present their data and concluded that IC50 of less
than 0.88 L/dose would not be inhibitory (Strandell et al., 2004). This method of
representing the data whilst producing a conservative figure is an attempt to provide
information that will aid in prioritising the products that require more urgent
investigation.

Chapter 4 – Cytochrome P450 Inhibition 240
Another challenge associated with complementary products is the choice of
extraction method. For these studies, the choice was made on the basis of the
relevance of the extract to patient use of these products. The products are generally
administered as tablets or water infusions (‘teas’). Therefore aqueous and alcohol
(methanol) extracts were prepared, methanol was selected to extract distinctly more
lipid soluble components.
4.21 Black Cohosh
Black Cohosh (Cimcifuga racemosa) is a shrub like plant native to the Eastern forests
of North America. Because of reports proposing benefit in alleviating symptoms of
menopause and the subsequent reports of hepatotoxicity, Black Cohosh is one of
the most investigated herbal products. Although several in vitro and in vivo studies
on some CYP activities have been conducted (Gurley et al., 2005b, Gurley et al.,
2006b, Gurley et al., 2008), this is the first report of Black Cohosh being screened
for inhibition potential against a full panel of CYPs and also using an N-in-one
cocktail approach.
Whilst none of the aqueous extracts resulted in an IC50 <100 µg/ml, three
isoenzymes recorded an IC50 below 100 µg/ml with the methanolic extracts,
CYP2B6, CYP2C19 and CYP2E1 with values of 24.5, 32.8 and 11.38 µg/ml
respectively, using the single substrate assay method and 49.2, 23.9-36.3 and 11.5
µg/ml respectively, using the N-in-one cocktail method.
Previous studies with Black Cohosh have highlighted the problems with data
interpretation that arise when these complex and variable products are assessed.

Chapter 4 – Cytochrome P450 Inhibition 241
In vivo studies in humans initially found that Black Cohosh may weakly inhibit
CYP2D6 to the value of 7% (Gurley et al., 2005b), but later studies conducted by
the same group concluded that Black Cohosh had no inhibitory effect (Gurley et
al., 2008). In both these studies the method for determining inhibition is the same
but the product investigated was different. The 2005 study used a Black Cohosh
that was standardized to 0.2% triterpene glycosides per tablet, whilst the 2008 study
used a product that was standardized to 2.5% triterpene glycosides per tablet. This
finding suggests that whilst the triterpene glycosides are often reported as the
principle component of these preparations it may not be this component that causes
CYP inhibition and that other components in these preparations may be capable of
causing inhibition.
Human in vivo studies have also found that there is no inhibition of CYP3A4 with
Black Cohosh (Gurley et al., 2006b, Gurley et al., 2005b) and our data is in
agreement with this. In vitro studies using human liver microsomes also found no
significant inhibition of CYP3A4 but did demonstrate the difference in inhibition
patterns that arises with various manufacturers products (Wanwimolruk et al.,
2009). Induction of CYP3A4 has been investigated, CYP3A11 in mice which is the
homolog of CYP3A4 was shown to be up-regulated specifically in the liver but this
may not be mediated by PXR (Houston and Galetin, 2010).
The inhibition of CYP2B6 may be significant as several important pharmaceutical
drugs including cyclophosphamide and verapamil are substrates for this isoenzyme
(Turpeinen et al., 2006). Polymorphic variation in CYP2B6 has also been shown to
be an important factor in drug metabolism (Xie et al., 2003).

Chapter 4 – Cytochrome P450 Inhibition 242
4.22 Dong Quai
Dong Quai (Angelica sinensis), also known as female ginseng, is indigenous to
China. Traditionally it has been used to treat gynaecological ailments, fatigue,
anaemia and high blood pressure. Previously it has been shown to induce CYP2D6
and CYP2A4 in rodent species (Tang et al., 2006). To date there have been no
reports of inhibition of CYP enzymes with Dong Quai though other species of
Angelica appear to inhibit CYP2A6 (Yoo et al., 2007).
As with Black Cohosh, none of the aqueous extracts resulted in an IC50 <100
µg/ml. The methanolic extracts caused significant inhibition of three isoenzymes:
CYP2A6, CYP2B6 and CYP2C19 with IC50’s of 93.8, 17.7 and 19.7 µg/ml for the
single substrate assays and 94.7, 11.4 and 13.7-14.3 µg/ml respectively for the N-in-
one cocktail assays. Inhibition by Dong Quai may be significant as inhibition by
other CYP2C19 inhibitors including isoniazid (Ki = 25.4 M) are known to cause
adverse clinical interactions when administered concurrently with diazepam or
phenytoin (both are substrates for CYP2C19) (Kay et al., 1985, Ochs et al., 1981).
Inhibition of CYP2B6 with the methanolic extract of Dong Quai was the most
significant, IC50 of 45.6 L/dose units (from the N-in-one cocktail assay), which is
greater than the 5 L/dose unitss that would approximate blood volume of the
average person. This inhibition along with the potential for interaction with
CYP2C19 (36.4 L/dose units from the N-in-one cocktail assay) inhibition helps to
prioritise Dong Quai as a product that requires further investigation.

Chapter 4 – Cytochrome P450 Inhibition 243
Using the formation of 1-OH midazolam as the probe reaction, other species of
Angelica have been shown to inhibit CYP3A4 weakly (unpublished data from our
laboratory). These investigations did not show significant inhibition of CYP3A4.
Using testosterone as the probe substrate, the aqueous 500 µg/ml extract caused
43% inhibition of control (Figure 4-12).
4.23 Goldenseal
Goldenseal (Hydrastis canadensis) is a perennial herb that is native to south-eastern
Canada and north-eastern United States. It is used as an antimicrobial and a
laxative. In vitro studies using human microsomes have shown inhibition of
CYP2D6 with two components of Goldenseal, berberine and hydrastine, IC50 = 45
M and 350M respectively (Chatterjee and Franklin, 2003). In vivo studies
conducted in healthy human subjects also concluded that inhibition of CYP2D6
and CYP3A4 occurs with Goldenseal (Gurley et al., 2008).
In vitro investigations have shown Goldenseal to be an inhibitor of CYP2C9,
CYP2D6 and CYP3A4 with IC50 values of 0.98, 0.66 and 0.18% of control
respectively (Chatterjee and Franklin, 2003). In addition to these isoenzymes,
CYP2C19 has been shown to be inhibited by Goldenseal in vitro up to 80% of
control (Taavitsainen, 2001).
The data indicates that aqueous extracts of Goldenseal causes significant inhibition
of CYP2D6 (IC50 = 6.7 µg/ml, 74.6 L/dose units), though no inhibition was
detected using the single substrate assays.

Chapter 4 – Cytochrome P450 Inhibition 244
Inhibition of CYP2D6 may be clinically significant as dextromethorphan, a
substrate of CYP2D6 and used to treat coughs, may be used concurrently with
Goldenseal.
The methanolic extract caused significant inhibition with 5 of the isoenzymes
CYP2B6, CYP2C19, CYP3A4, CYP2D6 and CYP2E1. This is the first report of
inhibition of CYP2B6 and CYP2E1 with Goldenseal. The most potent inhibition
was seen with CYP3A4 with and IC50 of 35.32 and 26.7 µg/ml for the single
substrate and N-in-one cocktail respectively. This data was obtained using the
midazolam hydroxylation reaction; lower levels of inhibition were detected using
the other probe reactions. This variability in the inhibition of CYP3A4 highlights
the need for multiple probe reactions to be monitored for CYP3A4 investigations in
order to gain a true representation of the inhibition potential of the compound being
investigated.
4.24 Gotu Kola
Gotu Kola (Centella asiatica) is a small plant native to several countries including
India, Sri Lanka, Indonesia and Iran. It is used in the treatment of stress, anxiety
and depression. Previous in vitro studies determined that tea made from Gotu Kola
at a concentration of 25 mg/ml caused a weak to moderate inhibition of CYP2C9
(24.8%), CYP2C19 (42.2%), CYP2D6 (23.9%) and CYP3A4 (51.5%)
(Taavitsainen, 2001).

Chapter 4 – Cytochrome P450 Inhibition 245
No significant inhibition was seen with the aqueous extracts in our studies. Whilst
it did not reach significant levels, inhibition of CYP1A2 with the aqueous extract
was moderate with inhibition reaching 75 and 78% of control, for the single
substrate and the N-in-one cocktail assays respectively, at the highest concentration
(500 µg/ml) investigated (Figure 4-13 and Figure 4-23). This finding is of concern
as many antidepressants including the tricyclics are substrates for CYP1A2. The
potential for herb-drug interactions is therefore possible in patients who are taking
antidepressants and concurrently taking Gotu Kola (which claims to help in the
treatment of anxiety and mood disorders) to aid in their condition.
Using cDNA expressed isoforms, CYP2C9 was shown to be inhibited by the
ethanolic and dichloromethane extracts of Gotu kola with a Ki of 39.1 and 26.6
µg/ml, with S-mephenytoin as the probe substrate (Pan et al., 2010). Whilst in our
studies inhibition of CYP2C9 was not detected (using tolbutamide as the probe
substrate), previous work has shown that the IC50 values of model inhibitors differs
dependent on the models and methods used (Turpeinen et al., 2006). Additionally
CYP2C9 has been reported to be more catalytically active in cDNA expressed
enzymes than human microsomes (Venkatakrishnan et al., 2000).
The methanolic extracts of Gotu Kola caused significant inhibition of CYP2B6,
CYP2C19, CYP2E1 and CYP3A4 with IC50 values of 14, 7.8-8.3, 9.5 and 58.4
µg/ml respectively, with the N-in-one cocktail assays, though CYP2B6 inhibition
was not detected using the single substrate assays.

Chapter 4 – Cytochrome P450 Inhibition 246
Importantly the inhibition of CYP3A4 was detected only with the 6β-testosterone
hydroxylation reaction, which once again demonstrates the importance of using
multiple probe reactions when investigations into this isoenzyme are undertaken.
The IC50 in litre/dose unit indicate that the greatest potential for inhibition and
therefore interactions occurs with CYP2C19 with values of 34.5 and 47.6 -50.6
L/dose units for the single substrate and the N-in-one cocktail respectively.
CYP2C19 is responsible for the metabolism of omeprazole (Äbelö et al., 2000),
phenytoin (Guengerich, 2005) and amitriptyline (Venkatakrishnan et al., 1998),
therefore inhibition of CYP2C19 may cause adverse drug interactions due to
increased concentrations of phenytoin leading to toxicity.
4.25 Horse Chestnut
Horse Chestnut (Aesculus hippocastanum) is a large tree that is native to the Balkans
and temperate regions of Europe. It is used for chronic venous insufficiency and
haemorrhoids. To date very few investigations have been carried out into the
potential for Horse Chestnut to inhibit CYP enzymes with most studies focusing on
its anti-platelet activity (Felixsson et al., 2010, Wu et al., 2012) and the toxicity
associated with the alkaloids present in the plant. The induction potential of Horse
Chestnut has been assessed in cultured human hepatocytes and was found to be
negative for CYP2C19 (Hellum et al., 2009).
In vitro studies using a cDNA baculovirus system concluded that inhibition of
CYP3A4 did occur but a high IC50 was determined (1173 g/ml) using the 6β-
testosterone hydroxylation as the probe reaction (Hellum and Nilsen, 2008).

Chapter 4 – Cytochrome P450 Inhibition 247
These investigations have also shown inhibition of CYP3A4, this was dependent on
the specific probe reaction used with the 3-OH-omeprazole probe reaction being the
most sensitive with the aqueous and methanolic extracts having an IC50 of 66.1 and
4.4 µg/ml, respectively, for the N-in-one cocktail assay. Inhibition was not detected
using the single substrate assays. Not being able to detect inhibition with the single
substrate assays may have been caused by interference from the products with the
analytical method.
CYP2B6 was significantly inhibited by the methanolic extract with IC50 value of
18.0 g/ml, though this was only with the N-in-one cocktail assay as the data from
the single substrate assay could not be obtained due to interference from the
product with the HPLC peak detection (see section 4.18.1.1). The methanolic
extract also caused significant inhibition of CYP2C19 with IC50 of 26.07 g/ml for
the single substrate assay and 20.0-21.3 g/ml for the N-in-one cocktail assay.
The inhibition of CYP2C19 is of concern as there is a potential for concurrent use
of Horse Chestnut which is taken to prevent blood stagnation, and the anti-platelet
drug clopidogrel which is a pro-drug that is converted to its active metabolite by
CYP2C19. This potential for an interaction to occur is not only strengthened by the
potential for concurrent use of these products but also the potential for Horse
Chestnut to reach a concentration that may be significant as demonstrated by the
high IC50 in L/dose units of 111.

Chapter 4 – Cytochrome P450 Inhibition 248
Our results also indicate that the Horse Chestnut can significantly inhibit CYP2E1.
The aqueous and methanolic extracts having IC50 of 18.2 and 9.59 µg/ml for the
single substrate and 16.8 and 8.6 µg/ml for the N-in-one cocktail assays. To date no
clinically significant interactions have been reported with regards to CYP2E1
inhibition, but inhibition of this isoenzyme may alter the disposition of alcohol,
benzene and carcinogens such as azoxymethane, which are all, metabolised by
CYP2E1.
Inhibition of CYP2A6 was seen with aqueous extract, IC50 of 17.8-53.52 g/ml.
Inhibition of CYP2A6 is potentially significant because of the role this isoenzyme
plays in the metabolism of several drugs with a narrow therapeutic index including
valproic acid.
4.26 Horsetail
Horsetail (Equisetum arvense) is a bushy plant that is native to the Northern
hemisphere and is used to aid in the treatment of urinary tract infections, cystitis
and prostate problems. In vitro studies have previously indicated that ethanol
extracts can cause inhibition of CYP3A4 (22% of control) (Scott et al., 2006) using
a fluorescent probe substrate (dibenzylfluorescein). Though our studies did not
detect any inhibition of CYP3A4 this may be either due to differences in the herbal
preparations or the difference is the components isolated with the different
extraction solvents.

Chapter 4 – Cytochrome P450 Inhibition 249
The aqueous extracts significantly inhibited CYP2A6 and CYP2C8 with IC50 values
80.0 and 93.6 g/ml for the single substrate assays, and 18.3 and 93.0 g/ml for the
N-in-one cocktail assays, respectively. The methanolic extracts also caused
significant inhibition of CYP1A2, CYP2B6 and CYP2C19 with IC50’s of 14.8, 21.2
and 22.6 g/ml respectively, for the single substrate assays and 12.6, 11.3 and 7.9-
15.5 µg/ml respectively, for the N-in-one cocktail assays. Inhibition of these
isoenzymes has not been previously reported.
Clinically the inhibition of CYP2C8 may be significant; this is despite the low IC50
litre/dose unit of 3.9 as many of the loop diuretics are substrates for CYP2C8.
Adverse reactions may arise in patients with urinary tract infections and cystitis
who may use Horsetail concurrently with antibiotics such as trimethoprim, which is
also an inhibitor of CYP2C8. This potential interaction may lead to increased
concentrations of trimethoprim in the serum, which can lead to adverse effects such
as rashes, GIT disturbances and folate deficiency.
4.27 Liquorice Root
Liquorice Root (Glycyrrhiza glabra) is a plant that is native to southern Europe and
parts of Asia and is one of the most potent CYP inhibitors investigated in this
study. It is used in the treatment of acute viral hepatitis, to relieve cough and in
autoimmune diseases. It is a known inhibitor of CYP2B6, CYP2C9 and CYP3A4
(Kent et al., 2002). Constituents of liquorice have been well studied and the
furanocoumarins including bergamottin and the isoflavone glabridin are known to
be the major constituents causing CYP inhibition.

Chapter 4 – Cytochrome P450 Inhibition 250
Extracts of Liquorice Root caused the most interference with the single substrate
assays (section 4.18.1.1). The inhibition for the aqueous extracts could not be
determined for CYP1A2, 2A6, 2C8, 2D6, 2E1 and (M)3A4. For the methanolic
extracts CYP2B6, 2C9, 2C19 and both of the 3A4 assays the inhibition could not be
determined.
The aqueous extract caused significant inhibition of CYP2A6, CYP2D6 and
CYP2E1 with IC50’s of 41.8, 97.2 and 8.8 g/ml with the N-in-once cocktail assays.
Due to the interference problems mentioned, inhibition could not be detected with
the single substrate assays for these isoenzymes.
The aqueous extract caused significant inhibition of CYP2A6, CYP2D6 and
CYP2E1 with IC50’s of 41.8, 97.2 and 8.8 μg/ml with the N-in-one cocktail assays.
Due to the interference problems mentioned, inhibition could not be detected with
the single substrate assays for these isoenzymes.
The methanolic extracts significantly inhibited all isoenzymes except CYP2A6. The
inhibition of CYP3A4 varied depending on the probe substrate being used. The
data indicates that the formations of 3-OH-omeprazole and OH-midazolam were
the most and least sensitive assays, respectively. Inhibition was not detected using
the 6β-hydroxylation of testosterone as the probe reaction.
The inhibition caused by Liquorice Root is not only extensive but also potent as
four of the isoenzymes have an IC50 >100 L/dose units, i.e. CYP2B6, CYP2C9,
CYP2C19 and CYP3A4 with values of 101.2, 118.1, 141.7 and 118.1 L/dose units.

Chapter 4 – Cytochrome P450 Inhibition 251
This high value indicates that the potential for one dose unit to cause significant
inhibition is possible. As Liquorice Root is used to treat a wide variety of conditions
as well as a product added to many herbal remedies to “harmonize” the ingredients
in the formula and “regulate the meridians” (Bensky et al., 2004) it is a product that
certainly should be investigated in more detail for its ability to inhibit CYPs.
4.28 Milk Thistle
Milk Thistle (Silybum marianum) is a flowering plant that is native to the
Mediterranean regions of Europe, North Africa and the Middle East. It is
commonly used as a liver tonic. For this reason this product presents a unique
problem in that many of the patients consuming this may have pre-existing liver
damage and therefore a decreased capacity to metabolise xenobiotics. Several in
vivo and in vitro investigations have been conducted with Milk Thistle. No
clinically significant inhibition of CYP1A2, CYP2D6, CYP3A4 and CYP2E1 was
determined in healthy human subjects (Gurley et al., 2004, Gurley et al., 2006b,
Gurley et al., 2008).
Our work indicates that inhibition of CYP2C9 occurs with the aqueous extract,
with an IC50 of 61.7 µg/ml (1.36 L/dose units) and 64.2 µg/ml (1.3 L/dose units)
for the single substrate and the N-in-one cocktail assays respectively (Figure 4-17
and Figure 4-27). Inhibition of CYP2C9 may warrant further consideration and
investigation even though there is a low risk with the IC50 in L/dose units being <5,
as warfarin, a vitamin K antagonist, has a narrow therapeutic index and the S-
enantiomer is metabolised by CYP2C9 (Yamazaki et al., 1998).

Chapter 4 – Cytochrome P450 Inhibition 252
Inhibiting CYP2C9 increases the biological availability of warfarin and may cause
increased risk in bleeding.
The methanolic extract caused significant inhibition of CYP2B6 (IC50 7.7 μg/ml),
CYP2C9 (IC50 2.9 μg/ml), CYP2C19 (IC50 4.2-4.8 μg/ml) and CYP3A4 (with only
the omeprazole-3-hydroxylation reaction, IC50 15.5 μg/ml) in the N-in-one cocktail
assays (Table 4-9). This potential for CYP inhibition should be considered in
patients with decreased liver function who may be taking Milk Thistle to aid in
their condition concurrently with therapeutic agents that are metabolised by these
CYPs including warfarin and phenytoin.
4.29 Saw Palmetto
Saw palmetto (Serenoa repens) is a fruit extract that is used in the treatment of
urinary and reproductive disorders. Investigations into Saw Palmetto are
increasingly urgent as the use of this product is increasing and as reports of benefit
in the treatment of benign prostatic hyperplasia continue to emerge (Tacklind et al.,
2009).
In vitro studies concluded that Saw Palmetto was a potent inhibitor of CYP3A4
with an IC50 of 7.41 µg/ml (Budzinski et al., 2000), though this was not supported
by in vivo studies. In vivo studies have shown no inhibition of CYP1A2, CYP2D6,
CYP2E1 and CYP3A4 using the dose recommended by the manufacturer (Gurley
et al., 2004, Markowitz et al., 2003).

Chapter 4 – Cytochrome P450 Inhibition 253
None of the aqueous extracts caused significant inhibition of any of the isoenzymes
investigated. The methanolic extracts caused significant inhibition of CYP2B6,
CYP2C8, CYP2C9, CYP2C19, CYP3A4 and CYP2E1 with the N-in-one cocktail
assays (Table 4-9). With the single substrate assays, CYP2B6, CYP2C8, CYP2C19
were the only three significantly inhibited isoenzymes (Table 4-7). When the IC50 is
determined in L/dose units, 4 isoenzymes are significantly inhibited. The
isoenzymes inhibited were CYP2B6, CYP2C9, CYP2C19 and CYP3A4 and the
respective IC50 values in L/dose units’ were 141.0, 134.1, 110 and 157 (Table 4-10).
The IC50 for CYP2C9 was 4.1 µg/ml with the N-in-one cocktail assay, but
inhibition was not detected with the single substrate assay. As both of these
methods use the same probe reaction, tolbutamide hydroxylation, the discrepancy
may be due to the greater sensitivity of the N-in-one cocktail method or interference
from the product with the HPLC results.
4.30 Valerian
Valerian (Valeriana officinalis) is a flowering plant that is native to Europe and Asia
and is used in the treatment of insomnia. Previous studies in vitro have reported
that Valerian caused inhibition of CYP3A4 (Lefebvre and Foster, 2004, Hellum
and Nilsen, 2008b) but investigations in vivo did not correlate with these findings
(Gurley et al., 2005b).

Chapter 4 – Cytochrome P450 Inhibition 254
None of the CYP isoenzymes investigated were significantly inhibited by the
aqueous extracts of Valerian with either of the assay methods used. Inhibition of
CYP1A2, CYP2B6, CYP2C9, CYP2C19, CYP3A4, CYP2D6 and CYP2E1 was
seen with the methanolic extracts with both the single substrate and the N-in-one
cocktail assays (Table 4-7 and Table 4-9). This wide variety of CYPs inhibited by
Valerian and the many reported uses of the product including sleep disorders,
anxiety and muscle relaxant has the potential to lead to adverse reactions.
When the IC50 is converted to L/dose units we see that not only does Valerian
inhibit the most isoenzymes, but it is also the most potent inhibitor with CYP2C8
producing an IC50 of 523.3 L/dose units. This is particularly important when the
therapeutic agents metabolised by CYP2C8, including paclitaxel, cerivastatin,
repaglinide, rosiglitazone and pioglitazone (Jaakkola et al., 2006, Wang et al.,
2002, Rahman et al., 1994) are considered. Increases in the plasma level of
paclitaxel which occurs when metabolism is inhibited may lead to hypersensitivity
and hypotension (Panchagnula, 1998).
4.31 Comparison Between the Methods
Whilst these studies have highlighted potential important inhibition of CYPs with
commonly used complementary products, it has also shown that the N-in-one
cocktail method can be used to screen these complex mixtures. By using the N-in-
one cocktail method the problems of interference with peak detection with HPLC
are avoided. Additionally the variability in the estimated inhibition is lower with
the N-in-one cocktail than with the single substrate assay (Appendix A).

Chapter 4 – Cytochrome P450 Inhibition 255
The inhibition of CYP3A4 is of key importance as it is the most abundant CYP in
the liver and accounts for the metabolism of over 50% of therapeutic agents (Evans
and Relling, 1999, Zanger et al., 2008). Inhibition of CYP3A4 can be determined
using a variety of probe substrates. As multiple binding sites are known on the
enzyme, and binding may occur simultaneously at multiple sites, it has been
proposed that inhibition of CYP3A4 should be investigated using multiple probe
substrates (Kenworthy et al., 1999).
Midazolam and testosterone have previously been described as substrates that
belong to two distinct groups, the benzodiazepines and the large molecular weight
groups respectively. These studies highlights that of the 4 probe reaction monitored
these two follow a pattern with similar levels of inhibition, for example the aqueous
extract of Black Cohosh recording an inhibition of 76% and 71% at the highest
tested concentration for midazolam and testosterone respectively (Figure 4-20).
Omeprazole, a pyridine, is a probe substrate for CYP2C19 but can also be used as a
substrate for CYP3A4. Omeprazole hydroxylation was the most sensitive probe
reaction investigated in our studies, though it does not correlate with omeprazole
sulfoxidation. This highlights the importance of using multiple probe substrates
when investigating the potential inhibition of CYP3A4 (
Table 4-7 and Table 4-9).
The IC50’s are comparable between the two methods, though in general the IC50 was
higher with the single substrate assays than with the N-in-one cocktail assay (
Table 4-7 and Table 4-9).

Chapter 4 – Cytochrome P450 Inhibition 256
One of the most significant differences between the methods is with CYP3A4 using
omeprazole sulfoxidation as the probe reaction for the methanolic extract of Horse
Chestnut. The IC50 using the single substrate assay was 69 g/ml but was >100
g/ml for the N-in-one cocktail method (108 g/ml), both assay methods were
negative for inhibition when midazolam was used as the probe substrate.
4.32 Conclusions
There is sufficient reason to be aware of the real possibility of complementary
products inhibiting CYP enzymes. The consequences of adverse clinical reactions
resulting from such inhibition are of concern and should receive adequate attention.
The difficulties of conducting systematic studies of these products with respect to
their potential CYP inhibition are the number of products available and the
inherent variability in these products. Quantitative evaluation of CYP inhibition is
essential to detect clinically significant interactions with herbal products. However,
screening of this nature serves as an alert for clinicians.
The multiple forms of CYPs playing a major role in drug metabolism, is an
additional challenge. However, the N-in-one cocktail method allows for the rapid
screening for CYP inhibition by these products with data comparable to the more
commonly used single substrate method. The N-in-one method also allows for
multiple probe reactions for CYP3A4 inhibition to be run simultaneously.

Chapter 4 – Cytochrome P450 Inhibition 257
Those interactions which are deemed to be significant from a clinical perspective
should be prioritised for further monitoring and study based on the likelihood of
being used concurrently with medications with a narrow therapeutic index and with
those that have a high IC50 in L/dose units (Table 4-8 and Table 4-10).
Extraction efficiency is always a vexing question when dealing with poorly
characterised plant or animal extracts. Until a thorough analysis of the extracts
exists, one needs to rely on rigid adherence to an adopted extraction method. These
studies have shown that the extraction method selected is reproducible as the data
from the incubations is derived from extractions on separate occasions (Appendix
A). One of the important points of this study is that it permits the screening of
unresolved complex mixtures. The next stage of these investigations would be to
fractionate the products showing significant inhibition. The fractionation would
permit detailed study the inhibition potency by the individual components.
The N-in-one cocktail is a rapid and reliable method that can be used as an initial
screen to prioritise which products require further investigation and also can be
applied to monitor the variation that can arise in these products.

Chapter 5 – Concluding Discussion 258
Chapter 5 - Concluding Discussion:
The primary objective of this project was to identify reliable and reproducible
methods that can be employed to detect key pharmacokinetic interactions with
complementary products and conventional medications.
5.1 Interaction Potential
The inescapable reality is that majority of patients resorting to the use of
complementary products are likely to be treated with prescription or over the
counter drugs (MacLennan et al., 2002, Eisenberg et al., 1998).
Additionally these patients see multiple therapists along with medical practitioners.
In combination this is a basis for significant therapeutic problems. The therapeutic
problems are primarily product interactions with prescription and over the counter
medications. The pharmacokinetic interactions can be grouped into four major
areas Figure 5-1.

259
Figure 5-1: Pharmacokinetic interactions based on absorption, protein binding, metabolism and excretion (Baxter, 2010).

Chapter 5 – Concluding Discussion 260
The experimental work presented in this thesis addresses pharmacokinetic
interaction issues that relate to absorption, protein binding and metabolism.
Studying these with pure compounds is relatively uncomplicated however
complementary products presents a number difficult problems which must be
solved in order to conduct any meaningful studies with them. These problems
include:
Product selection.
Extraction method.
Constituent concentration.
We have addressed these for the purposes of the experimental work presented here
and as possible criteria for regulatory studies that we recommend.
5.1.1 Product Selection
Products are initially selected for testing based on the likelihood for concurrent use
with therapeutic agents with a high risk. This high risk may be due to a narrow
therapeutic index (i.e.: digoxin, zidovudine, warfarin and phenytoin) or because of
a potential synergistic effect between the complementary product and the
therapeutic drug (i.e.: the anticoagulant warfarin and the herbal treatment for blood
stagnation Danshen). In the case of a specific investigation i.e.: binding to albumin,
a product may be selected for testing if there is likely to be concurrent use with a
therapeutic agent known to have significant binding to albumin.

Chapter 5 – Concluding Discussion 261
The product selection for the experimental purposes here also serves as a guideline
for practitioners of complementary products in their practice. They need to be
vigilant when products are concurrently used with selected conventional medicines.
5.1.2 Extraction Method
Another challenge associated with complementary products is the choice of
extraction method. For these studies, the choice was made on the basis of the
relevance of the extract to the patient use of the product. As these products are
generally administered as tablets or infusions (‘teas’) an aqueous and alcohol
(methanol) extract was prepared. Methanol was selected to extract the distinctly
more lipid soluble components. There was never an intention to fractionate these
products into their individual constituents as they are consumed as complex
mixtures and therefore should be studied in this form.
5.1.3 Constituent Concentration
In interaction studies with pure substances molar concentrations are easily
calculated. With complementary products, which are complex mixtures this is not
possible. A different approach is needed to achieve meaningful results.
The chemical composition of these products is not always known and even in cases
where it is known, it may be highly variable. A reference point that can be used is
the recommended dose and the manufacturers labelling as it reflects what the
patients will consume. It will be reflective of plasma concentrations of the various
active and inactive constituents.

Chapter 5 – Concluding Discussion 262
As the products used were manufactured in Australia under GMP, the information
contained on the product label was assumed to be accurate. In absence of chemical
profiling, routine studies with these products can be based on this criterion. Whilst
it is possible to determine the concentration of the labelled ingredient this was not
conducted with these studies as the labelled ingredient may not be responsible for
the activity seen in the assays. A better approach would be to determine if a product
requires further investigation and from that point, fractionate and identify the
component responsible for the activity seen.
5.1.4 Metabolites
The absorption, distribution, metabolism and elimination (ADME) of a xenobiotic
are often considered distinct from each other but a series of complex interactions
occurs between these processes and the xenobiotic (Figure 5-2).

Chapter 5 – Concluding Discussion 263
Figure 5-2: Schematic representation of the interrelationship of the
pharmacokinetic processes; absorption, distribution, metabolism and elimination.
Adapted from Ionescu and Caira (Ionescu and Caira, 2005).
As most complementary products are taken orally, the bioavailability is low or
reduced due to incomplete absorption. Orally absorbed products may be subjected
to extensive metabolism, most commonly in the intestine and/or the liver. These
metabolites can be the cause of a pharmacokinetic interactions or responsible for
direct toxicity. The complexity of these products may give rise to multiple
metabolites.
Ginkgo biloba is a herbal product that is known to have key metabolites that have
their own kinetic profile. Several of the parent ginsenosides are converted to
metabolites by gut microbiota. The metabolite Compound K, possess significantly
stronger cancer chemoprevention activity than the parent compounds.

Chapter 5 – Concluding Discussion 264
Pharmacokinetically, the active metabolites of ginseng differ in distribution and
clearance from that of the parent compound (Qi et al., 2011).
The example of Ginkgo biloba highlights the need to investigate the potential for
metabolites of complementary products to cause adverse interactions. These studies
would involve the generation of the product metabolites by incubating the parent
product with the major metabolising systems of the body: the gastrointestinal tract
and the liver.
5.2 Conclusions From the Experimental Work
With the experimental work, 24 of the 34 extracts tested were found to result in
pharmacokinetic interactions (Table 5-1).
The interactions involve protein binding, transport protein and CYP
inhibition. Detailed results for each of the parameters were previously detailed;
protein binding (Table 2-5 and Table 2-6), P-glycoprotein inhibition (Table 3-4 and
Table 3-5) and CYP inhibition (Table 4-7 and Table 4-9).

Chapter 5 – Concluding Discussion 265
Table 5-1: Summary of the experimental work for the pharmacokinetic parameters
investigated with the extracts of complementary products.
Product Extract HSA AGP P-gp CYP450
Site
I
Site
II
Calcein
AM
ATPase Single
substrate
N-in-one
cocktail
Astragalus Aq X
Astragalus Meth X
Black cohosh Aq X X
Black cohosh Meth * *
CoEnzyme Q10 Aq X *
CoEnzyme Q10 Meth X *
Cordyceps Aq *
Cordyceps Meth X
Danshen Aq X X
Danshen Meth X *
Dong quai Aq X X X X
Dong quai Meth X X * *
Echinacea Aq X
Echinacea Meth X X
Ginkgo Biloba Aq X X X X
Ginkgo Biloba Meth X * X
Goldenseal Aq X X X *
Goldenseal Meth * * * *
Gotu Kola Aq X X X
Gotu Kola Meth X * *
Horse Chestnut Aq * *
Horse Chestnut Meth * *
Horsetail Aq * *
Horsetail Meth * *
Liquorice Root Aq X *
Liquorice Root Meth * *
Milk Thistle Aq X * *
Milk Thistle Meth * * *
Saw Palmetto Aq X X
Saw Palmetto Meth * *
Slippery Elm Aq *
Slippery Elm Meth *
Valerian Aq X X X X
Valerian Meth X X * *
Aq -Aqueous extracts Meth -Methanolic extracts
* -Significant interaction X -No significant interaction
HSA -Binding to human serum albumin, site I and II. Significance at Kd <1mg/ml.

Chapter 5 – Concluding Discussion 266
AGP -Binding to alpha-1-acid glycoprotein. Significance at Kd <1mg/ml.
P-gp inhibition -Calcein AM extrusion. Significance at IC50 <100 μg/ml.
P-gp inhibition -ATPase activity. Significance at IC50 <100 μg/ml.
CYP450 inhibition -Single substrate assays. Significance at IC50 <100 μg/ml.
CYP450 inhibition –N-in-one cocktail assays. Significance at IC50 <100 μg/ml.

Chapter 5 – Concluding Discussion 267
5.3 General Recommendations
In addition to recognising the interactions discovered here that deserve vigilance in
clinical use, the following general recommendations to improve the safety of
complementary products are proposed based on the literature.
Due to the complex nature of these products and the specific challenges associated
with them, pharmacovigilance needs to be expanded from the categories that are
currently used with conventional medicines. Additional categories required include
the origin of the product, presence of contaminant and adulterants and the name
attributed to the product (traditional, botanical, common). If this information was
available to regulators worldwide then consistent risk assessments could be carried
out and the risk to patients dramatically decreased.
Table 5.2, summarises the information that should be provided to regulatory
authorities, these parameters have been recommended based on the required
information to decrease patient risk and ensure product consistency for consumers.

268
Table 5-2: Parameters recommended for inclusion in the information submitted to regulators and the basis of the recommendations.
Parameter Basis Recommendation
Positive product identification Misidentification of raw material has lead to toxicity, Aristolochia fangchi, which is nephrotoxic, was mistakenly
identified as the safe Stephania tetrandra.
Identification should be made by a qualified botanist and confirmed
with genetic identification.
Source of the raw material Geographical location can alter the composition of the raw
material.
Confirmation of collection site, location and date of raw material to
be provided.
Plant parts used Chemical composition varies with the part of the plant i.e.:
root, leaves, flowers, to be used.
Correct identification of which part of the plant, or in the case of
multiple parts how much of each part, to be provided.
Constituent composition Composition of the raw material is altered due to many factors
including, geographical location, season, and soil conditions.
Chemical identification to be provided, marker compounds may be
used if well characterized.
Historical use The history of the use of the product may give an indication of
toxicity and will also provide information on the patient group
most likely to consume this product.
Full history from the relevant pharmacopeia to be provided.
Intended use Intended use of the product will give an indication of the
patient group likely to consume this product. The risk of
concurrent use with therapeutic agents can be established.
Therapeutic claims and the condition/disease for which the product
is to be clearly stated. Evidence for therapeutic claims must be
provided.
Quality control in
manufacturing
Lack of good manufacturing practice resulted in widespread
withdrawal of substandard products and eventual closure of
Pan Pharmaceuticals.
Therapeutic agents and foods are all required to manufactured under
GMP. Complementary products to be subjected to the same
manufacturing regulations.
Microbial content Contamination may arise during processing or storage with
bacterial and fungal elements.
Testing for microbial contamination and their toxic secondary
metabolites i.e. mycotoxins.
Heavy metal content Heavy metals including lead and arsenic are known toxic
contaminants of particularly Ayurvedic products.
Testing to ensure that heavy metals are at a safe level for consumers.
Adulterant detection Adulterants particularly therapeutic agents (steroids, analgesics,
sedatives and erectile dysfunction drugs) are frequently found in
herbal products to enhance the therapeutic claims.
Testing to be conducted to ensure adulterants are not present or if
they are added appropriate regulatory approval must be sought.

269
Parameter Basis Recommendation
Toxicological information A number of example of direct toxicity have been reported over
many years including Aristolochia and Danshen.
In absence of unequivocal historical evidence of safety, standard
pre-clinical safety evaluation as well as ADME properties should be
conducted.
Pharmacovigilance Both direct toxicity and interactions of low frequency can be
only detected by observing substantial patient populations
A harmonized reporting system for these products to allow rapid
identification adverse events.

Chapter 5 – Concluding Discussion 270
5.4 Future Directions
This work provides clear directions for investigating pharmacokinetically based
interactions involving complementary products. Specifically, plasma protein
binding and displacement interactions, inhibition of cytochrome P450 and
inhibition of P-glycoprotein. The obvious extension of this work should include
potential drug interactions due to other pharmacokinetic parameters:
CYP induction.
Induction of p-glycoprotein.
Inhibition and induction of other drug transporters including the organic
anion and cation transporters.
Inhibition and induction of phase II metabolism enzymes including
sulfotransferases and glutathione S-transferase.
The interactions caused by the metabolites of the products.
As many of these pharmacokinetic parameters are connected there is also work that
can be conducted on the interplay that is possible in the in vivo situation.
There is adequate justification to extend this line of research to a range of
complementary products.

Chapter 5 – Concluding Discussion 271
Figure 5-3: Schematic representation of the interplay of transporters and enzymes
in the hepatocyte. Cytochrome P450 (CYP) and other hepatic enzymes such as
epoxide hydrolase (EH), conjugating enzymes, UDP glucuronyl transferase (UGT),
sulphotransferase (SULT) or glutathione S-transferase (GST) are important in
metabolic handling of xenobiotics. The enzymes depend on molecular oxygen and
NADPH (CYP), UDPG (UGT), PAPS (SULT) and reduced glutathione (GSH)
(GST). The cellular membrane has many transporters, OATS, ABC transporters
and OCTS, which are important for the transmembrane flux of many xenobiotics
including the products of the conjugating enzymes (Sevior et al., 2012).

Chapter 5 – Concluding Discussion 272
Another approach can be developed based on the plant families. By working with
families of plants, it may be possible to identify broader classifications of raw
material that have similar drug interactions. This should focus the research to the
products most likely to cause adverse drug interactions.
Finally, there are the so-called ‘omics’ technologies that may provide unexpected
advances in the identification and ongoing monitoring of these products. In
particular the NMR and LC-MS based metabonomics can track biomarkers that
could reveal both adverse effects and interactions in vivo (Ouedraogo et al., 2012,
Liang et al., 2010). Additionally these technologies have applications in identifying
the components of these products and chemical variability (Yang et al., 2012,
Sheridan et al., 2012)
Evidence for using gene based ‘omics’ technologies with interesting outcomes has
involved products such as kava-kava. In these studies kava-kava was administered
to rats and subsequent genome wide gene-expression revealed differences in the
expression of drug metabolizing enzymes from the control group, and alterations in
the mitochondrial function and oxidative stress response pathways (Guo et al.,
2010b, Guo et al., 2009). Microarrays have also been used to identify gene
expression changes. Ginkgo Biloba has been shown to alter a number of genes in a
dose dependent manner (Guo et al., 2010a).

Chapter 5 – Concluding Discussion 273
This work has outlined approaches to study complex and variable mixtures such as
complementary products and made recommendations for improving the patient
safety in face of a bewildering array of herbal and other complementary products
which have a total market value of some $83 billion per year. The dollar value
makes it entirely possible to implement most of these recommendations.

Chapter 6 – Appendix A 274
Chapter 6 - Appendix A:
This appendix contains all the data relating to the inhibition of cytochrome P450
for the aqueous and methanolic extracts for the 10 complementary products
(Table 4-3). The raw data is shown for the single substrate and the N-in-one cocktail
incubations.

Chapter 6 – Appendix A 275

Chapter 6 – Appendix A 276
Figure 6-1: % Inhibition of control for individual incubations for the extracts of
Black Cohosh at 20, 100 and 500 g/ml for each of the CYP isoform assays using
the single substrate incubations.
() Aqueous extracts () Methanolic extracts

Chapter 6 – Appendix A 277

Chapter 6 – Appendix A 278
Figure 6-2: % Inhibition of control for individual incubations for the extracts of
Dong Quai at 20, 100 and 500 g/ml for each of the CYP isoform assays using the
single substrate incubations.
() Aqueous extracts () Methanolic extracts

Chapter 6 – Appendix A 279

Chapter 6 – Appendix A 280
Figure 6-3: % Inhibition of control for individual incubations for the extracts of
Goldenseal at 20, 100 and 500 g/ml for each of the CYP isoform assays using the
single substrate incubations.
() Aqueous extracts () Methanolic extracts

Chapter 6 – Appendix A 281

Chapter 6 – Appendix A 282
Figure 6-4: % Inhibition of control for individual incubations for the extracts of
Gotu Kola at 20, 100 and 500 g/ml for each of the CYP isoform assays using the
single substrate incubations.
() Aqueous extracts () Methanolic extracts

Chapter 6 – Appendix A 283

Chapter 6 – Appendix A 284
Figure 6-5: % Inhibition of control for individual incubations for the extracts of
Horse Chestnut at 20, 100 and 500 g/ml for each of the CYP isoform assays using
the single substrate incubations.
() Aqueous extracts () Methanolic extracts

Chapter 6 – Appendix A 285

Chapter 6 – Appendix A 286
Figure 6-6: % Inhibition of control for individual incubations for the extracts of
Horsetail at 20, 100 and 500 g/ml for each of the CYP isoform assays using the
single substrate incubations.
() Aqueous extracts () Methanolic extracts

Chapter 6 – Appendix A 287

Chapter 6 – Appendix A 288
Figure 6-7: % Inhibition of control for individual incubations for the extracts of
Liquorice Root at 20, 100 and 500 g/ml for each of the CYP isoform assays using
the single substrate incubations.
() Aqueous extracts () Methanolic extracts

Chapter 6 – Appendix A 289

Chapter 6 – Appendix A 290
Figure 6-8: % Inhibition of control for individual incubations for the extracts of
Milk Thistle at 20, 100 and 500 g/ml for each of the CYP isoform assays using the
single substrate incubations.
() Aqueous extracts () Methanolic extracts

Chapter 6 – Appendix A 291

Chapter 6 – Appendix A 292
Figure 6-9: % Inhibition of control for individual incubations for the extracts of
Saw Palmetto at 20, 100 and 500 g/ml for each of the CYP isoform assays using
the single substrate incubations.
() Aqueous extracts () Methanolic extracts

Chapter 6 – Appendix A 293

Chapter 6 – Appendix A 294
Figure 6-10: % Inhibition of control for individual incubations for the extracts of
Valerian at 20, 100 and 500 g/ml for each of the CYP isoform assays using the
single substrate incubations.
() Aqueous extracts () Methanolic extracts

Chapter 6 – Appendix A 295

Chapter 6 – Appendix A 296
Figure 6-11: % Inhibition of control for individual incubations for the extracts of
Black Cohosh at 20, 100 and 500 g/ml for each of the CYP isoform assays using
the N-in-one cocktail assay.
() Aqueous extracts () Methanolic extracts

Chapter 6 – Appendix A 297

Chapter 6 – Appendix A 298
Figure 6-12: % Inhibition of control for individual incubations for the extracts of
Dong Quai at 20, 100 and 500 g/ml for each of the CYP isoform assays using the
N-in-one cocktail assay.
() Aqueous extracts () Methanolic extracts

Chapter 6 – Appendix A 299

Chapter 6 – Appendix A 300
Figure 6-13: % Inhibition of control for individual incubations for the extracts of
Goldenseal at 20, 100 and 500 g/ml for each of the CYP isoform assays using the
N-in-one cocktail assay.
() Aqueous extracts () Methanolic extracts

Chapter 6 – Appendix A 301

Chapter 6 – Appendix A 302
Figure 6-14: % Inhibition of control for individual incubations for the extracts of
Gotu Kola at 20, 100 and 500 g/ml for each of the CYP isoform assays using the
N-in-one cocktail assay.
() Aqueous extracts () Methanolic extracts

Chapter 6 – Appendix A 303

Chapter 6 – Appendix A 304
Figure 6-15: % Inhibition of control for individual incubations for the extracts of
Horse Chestnut at 20, 100 and 500 g/ml for each of the CYP isoform assays using
the N-in-one cocktail assay.
() Aqueous extracts () Methanolic extracts

Chapter 6 – Appendix A 305

Chapter 6 – Appendix A 306
Figure 6-16: % Inhibition of control for individual incubations for the extracts of
Horsetail at 20, 100 and 500 g/ml for each of the CYP isoform assays using the N-
in-one cocktail assay.
() Aqueous extracts () Methanolic extracts

Chapter 6 – Appendix A 307

Chapter 6 – Appendix A 308
Figure 6-17: % Inhibition of control for individual incubations for the extracts of
Liquorice Root at 20, 100 and 500 g/ml for each of the CYP isoform assays using
the N-in-one cocktail assay.
() Aqueous extracts () Methanolic extracts

Chapter 6 – Appendix A 309

Chapter 6 – Appendix A 310
Figure 6-18: % Inhibition of control for individual incubations for the extracts of
Milk Thistle at 20, 100 and 500 g/ml for each of the CYP isoform assays using the
N-in-one cocktail assay.
() Aqueous extracts () Methanolic extracts

Chapter 6 – Appendix A 311
Figure 6-19: % Inhibition of control for individual incubations for the extracts of
Saw Palmetto at 20, 100 and 500 g/ml for each of the CYP isoform assays using
the N-in-one cocktail assay.
() Aqueous extracts () Methanolic extracts

Chapter 6 – Appendix A 312

Chapter 6 – Appendix A 313
Figure 6-20: % Inhibition of control for individual incubations for the extracts of
Valerian at 20, 100 and 500 g/ml for each of the CYP isoform assays using the N-
in-one cocktail assay.
() Aqueous extracts () Methanolic extracts

Chapter 7 – References 314
Chapter 7 – References:
Abass, K., Turpeinen, M. & Pelkonen, O. 2009. An evaluation of the cytochrome P450 inhibition potential of slected pesticides in human hepatic microsomes. Journal of Environmental Science and
Health. Part B, 44, 553-563.
Äbelö, A., Andersson, T. B., Antonsson, M., Naudot, A. K., Skånberg, I. & Weidolf, L. 2000. Stereoselective metabolism of omeprazole by human cytochrome P450 enzymes. Drug Metabolism
and Disposition, 28, 966-972.
Abolhoda, A., Wilson, A. E., Ross, H., Danenberg, P. V., Burt, M. & Scotto, K. W. 1999. Rapid
activation of MDR1 gene expression in human metastatic sarcoma after in vivo exposure to
doxorubicin. Clinical Cancer Research, 5, 3352-3356.
Aitio, A. 1978. A simple and sensitive assay of 7-ethoxycoumarin deethylation. Analytical Biochemistry,
85, 488-491.
Aklillu, E., Carrillo, J. A., Makonnen, E., Hellman, K., Pitarque, M., Bertilsson, L. & Ingelman-
Sundberg, M. 2003. Genetic polymorphism of CYP1A2 in Ethiopians affecting induction and
expression: Characterization of novel haplotypes with single-nucleotide polymorphisms in intron 1
Molecular Pharmacology, 64, 659-669.
Albani, F., Riva, R., Contin, M. & Baruzzi, A. 1984. Stereoselective binding of propranolol
enantiomers to human α1-acid glycoprotein and human plasma. British Journal of Clinical
Pharmacology, 18, 244-246.
Albani, J. R. 2006. Progesterone binding to the tryptophan residues of human α1-acid glycoprotein.
Carbohydrate Research, 341, 2557-2564.
Aleksa, K., Matsell, D., Krausz, K. W., Gelboin, H. V., Ito, S. & Koren, G. 2005. Cytochrome P450 3A and 2B6 in the developing kidney: Implications for ifosfamide nephrotoxicity. Peadiatric
Nephrology, 20, 872-885.
Amacher, D. E. 2010. The effetcs of cytochrome P450 induction by xenobiotics on endobiotic
metabolism in pre-clinical safety studies. Toxicology Mechanisms and Methods, 20, 159-166.
Ambudkar, S. V., Cardarelli, C. O., Pashinsky, I. & Stein, W. D. 1997. Relation between the turnover
number for vinbalstine transport and for vinbalstine-stimulated ATP hydrolysis by human P-
glycoprotein. The Journal of Biologial Chemistry, 272, 21160-21166.
Ambudkar, S. V., Kim, I. W. & Sauna, Z. E. 2006. The power of the pump: Mechanisms of action of P-
glycoprotein (ABCB1). European Journal of Pharmaceutical Sciences, 27, 392-400.
Ambudkar, S. V., Kimchi-Sarfaty, C., Sauna, Z. E. & Gottesman, M. M. 2003. P-glycoprotein: From genomics to mechanism. 22, 47.
Ambudkar, S. V., Lelong, I. H., Zhang, J., Cardarelli, C. O., Gottesman, M. M. & Pastan, I. 1992.
Partial purification and reconstitution of the human multidrug-resistance pump: Characterization of
the drug-stimulatable ATP hydrolysis. Proceedings of the National Academy of Sciences of the United States
of America, 89, 8472-8476.
Anderson, G. D. 2005. Pregnancy-induced changes in pharamacokinetics. Clinical Pharmacokinetics, 44,
989-1008.
Aninat, C., Piton, A., Glaise, D., Le Charpentier, T., Langouët, S., Morel, F., Guguen-Guillouzo, C. &
Guillouzo, A. 2006. Expression of cytochromes P450, conjugating enzymes and nuclear receptors in
human hepatoma HepaRG cells. Drug Metabolism and Disposition, 34, 75-83.
Annaert, P. P., Turncliff, R. Z., Booth, C. L., Thakker, D. R. & Brouwer, K. L. R. 2001. P-glycoprotein mediated in vito biliary excretion in sandwich-cultured rat hepatocytes. Drug Metabolism and
Disposition, 29, 1277-1283.
Anthérieu, S., Chesné, C., Li, R., Camus, S., Lahoz, A., Picazo, L., Turpeinen, M., Tolonen, A.,
Uusitalo, J., Guguen-Guillouzo, C. & Guillouzo, A. 2010. Stable expression, activity, and
inducibility of cytochromes P450 in differentiated HepaRG cells. Drug Metabolism and Disposition, 38,
516-525.
Aoyama, T., Yamano, S., Guzelian, P. S., Gelboin, H. V. & Gonzalez, F. J. 1990. Five of 12 forms of
vaccinia virus-expressed human hepatic cytochrome P450 metabolically activate aflatoxin B1.
Proceedings of the National Academy of Sciences of the United States of America, 87, 4790-4793.
Araya, Z. & Wikvall, K. 1999. 6α-hydroxylation of taurochenodeoxycholic acid and lithocholic acid by
CYP3A4 in human liver microsomes. Biochimica et Biophysica Acta- Molecular and Cell Biology of Lipids,
1438, 47-54.

Chapter 7 – References 315
Ascoli, G., Domenici, E. & Bertucci, C. 2006. Drug binding to human serum albumin: Abridged review of results obtained with high-performance liquid chromatography and circular dichroism. Chirality,
18, 667-679.
Asseffa, A., Smith, S. J., Nagata, K., Gillette, J., Gelboin, H. V. & Gonzalez, F. J. 1989. Novel exogenous heme-dependent expression of mammalian cytochrome P450 using baculovirus. Archives
of Biochemistry and Biophysics, 274, 481-490.
Assem, M., Schuetz, E. G., Leggas, M., Sub, D., Yasuda, K., Reid, G., Zelcer, N., Adachi, M., Strom, S., Evans, R. M., Moore, D. D., Borst, P. & Schuetz, J. D. 2004. Interactions between hepatic Mrp4
and Sult2a as revealed by the constitutive androstane receptor and Mrp4 knockout mice. The Journal
of Biological Chemistry, 279, 22250-22257.
Athamna A, Kramer M & Kahane I 1996. Adherence of Mycoplasma pneumoniae to human alveolar
macrophages. Immunology and Medical Microbiology, 15, 135-141.
Atkinson, D. E., Greenwood, S. L., Sibley, C. P., Glazier, J. D. & Fairbairn, L. J. 2003. Role of MDR1 and MRP1 in trophoblast cells, elucidated using retroviral gene transfer. American Journal of Cell
Physiology, 285, C584-C591.
Auora, A., Seth, K., Kalra, N. & Shukla, Y. 2005. Modulation of P-glycoprotein-mediated multidrug
resistance in K562 leukemic cells by indole-3-carbinol. Toxicology and Applied Pharmacology, 202, 237-
243. Axelrod, J. 1955. The enzymatic demethylation of ephedrine. The Journal of Pharmacology and
Experimental Therapeutics, 114, 430-438.
Axiotis, C. A., Guarch, R., Merion, M. J., Laporte, N. & Neumann, R. D. 1991. P-glycoprotein
expression is increased in human secretory and gestational endometrium. Laboratory Investigation, 65,
577-581.
Ayesh, S., Shao, Y. M. & Stein, W. D. 1996. Co-operative, competitive and non-competitive
interactions between modulators of P-glycoprotein. Biochimica et Biophysica Acta, 1316, 8-18.
Back, D. J. & Tjia, J. F. 1991. Comparative effects of the antimycotic drugs ketoconazole, fluconazole, itraconazole and terbinafine on the metabolism of cyclosporin by human liver microsomes. British
Journal of Clinical Pharmacology, 32, 624-626.
Bahadur, N., Leathart, J. B. S., Mutch, E., Steimel-Crespi, D., Dunn, S. A., Gilissen, R., Houdt, J. V.,
Hendrickx, J., Mannens, G., Bohets, H., Williams, F. M., Armstrong, M., Crespi, C. L. & Daly, A.
K. 2002. CYP2C8 polymorphisms in Caucasians and their relationship with paclitaxel 6-alpha-
hydroxylase activity in human liver microsomes. Biochemical Pharmacology, 64, 1579-1589.
Bain, L. J. & Leblanc, G. A. 1996. Interaction of structurally diverse pesticides with the human MDR1
gene product P-glycoprotein. Toxicology and Applied Pharmacology, 141, 288-298.
Bain, L. J., Mclachlan, J. B. & Leblanc, G. A. 1997. Structure-activity relationships for xenobiotic
transport substrates and inhibitory ligands of P-glycoprotein. Environmental Health Perspectives, 105,
812-818.
Baird, W. M., Hooven, L. A. & Mahadevan, B. 2005. Carcinogenic polycyclic aromatic hydrocarbon-
DNA adducts and mechanism of action. Environemental and Molecular Mutagenesis, 45, 106-114.
Balimane, P. V., Han, Y. H. & Chong, S. 2006. Current industrial practices of assessing permeability
and P-glycoprotein interaction. The AAPS Journal, 13, 1-13.
Barnes, P. M. & Bloom, B. 2008. Complementary and alternative medicine use among adults and children: United States, 2007. National Health Statistics Reports, 12.
Barré, J., Chamouard, J. M., Houin, G. & Tillement, J. P. 1985. Equilibrium dialysis, ultrafiltration,
and ultracentrifugation compared for determining the plasma-protein-binding characteristics of
valproic acid. Clinical Chemistry, 31, 60-64.
Barter, Z. E., Bayliss, M. K., Beaune, P. H., Boobis, A. R., Carlile, D. J., Edwards, P. A., Houston, J.
B., Lake, B. G., Lipscomb, J. C., Pelkonen, O., Tucker, G. T. & Rostami-Hodjegan, A. 2007a.
Scaling factors for the extrapolation of in vivo metabolic drug clearance from in vitro data: Reaching
a consensus on values of human microsomal protein and hepatocellularity per gram of liver. Current
Drug Metabolism, 8, 33-45.
Baumann, H. & Gauldie, J. 1994. The acute phase response. Immunology Today, 15, 74-80.
Baumann, H., Prowse, K. R., Marinković, S., Won, K. A. & Jahreis, G. P. 1989. Stimulation of hepatic
acute phase response by cytokines and glucocorticoids. Annals of the New York Academy of Sciences,
557, 280-296.
Baumann, P. & Eap, C. B. Contribution of the variants of α1-acid glycoprotein to its binding of drugs.
In: MÜLLER W & TILLEMENT J, eds. Alpha1-acid glycoprotein: Genetics, biochemisty,
physiological functions and pharamcology, 1988 Switzerland. Alan R Liss, New York, 379-397.
Baxter, K. 2010. Stockley's Drug Interactions.

Chapter 7 – References 316
Beal, M. F. 1999. Coenzyme Q10 administration and its potential for treatment of neurodegenerative
diseases. Biofactors, 9, 261-266.
Beaune, P. H., Dansette, P. M., Mansuy, D., Kiffel, L., Finck, M., Amar, C., Leroux, J. P. &
Homberg, J. C. 1987. Human anti-endoplasmic reticulum autoantibodies appearing in a drug-
induced hepatitis are directed against a human liver cytochrome P-450 that hydroxylates the drug.
Proceedings of the National Academy of Sciences of the United States of America, 84, 551-555.
Benke, D., Barberis, A., Kopp, S., Altmann, K. H., Schubiger, M., Vogt, K. E., Rudolph, U. & Möhler,
H. 2009. GABA(A) receptors as in vivo substrate for the anxiolytic action of valerennic acid, a
major constituent of valerian root extracts. Neuropharmacology, 56, 174-181.
Benowitz, N. L., Jacob, P., Fong, I. & Gupta, S. 1994. Nicotine metabolic profile in man: Comparison of cigarette smoking and transdermal nicotine. The Journal of Pharmacology and Experimental
Therapeutics, 268, 296-303.
Bensky, D., Clavey, S. & Stoger, E. 2004. Chinese herbal medicine: Materia medica, Eastland Press.
Berry, J., Price-Jones, M. & Hughes, K. 2009. A high throughput screening assay for human alpha-1
acid glycoprotein binding using SPA and leadseeker technologies. In: PERKINELMER (ed.) 1st ed.
Bertelsen, K. M., Venkatakrishnan, K., Von Moltke, L. L., Obach, R. S. & Greenblatt, D. J. 2003.
Apparent mechanism-based inhibition of human CYP2D6 in vitro by paroxetine: Comparison with
fluoxetine and quinidne. Drug Metabolism and Disposition, 31, 289-293.
Beuckmann, C. T., Aoyagi, M., Okazaki, I., Hiroike, T., Toh, H., Hayaishi, O. & Urade, Y. 1999.
Binding of biliverdin, bilirubin, and thyroid hormones to lipocalin-type prostaglandin D synthase.
Biochemistry, 38, 8006-8013.
Bhagavan, H. N. & Chopra, R. K. 2006. Coenzyme Q10: Absorption, tissue uptake, metabolism and
pharmacokinetics. Free Radical Research, 40, 445-453.
Bi, S., Song, D., Kan, Y., Xu, D., Tian, Y., Zhou, X. & Zhang, H. 2005. Spectroscopic characterization
of effective components anthraquinones in Chinese medicinal herbs binding with serum albumins.
Spectrochimica Acta Part A, 62, 203-212.
Birkett, D. J., Mackenzie, P. I., Veronese, M. E. & Miners, J. O. 1993. In vitro approaches can predict
human drug metabolism. Trends in Pharmacological Science, 14, 292-294.
Birnbaum, S. & Nilsson, S. 1992. Protein-based capillary affinity gel electrophoresis for the separation
of optical isomers. Analytical Biochemistry, 64, 2872-2874.
Blain, P. G., Mucklow, C., Rawlins, M. D., Roberts, D. F., Routledge, P. A. & Shand, D. G. 1985.
Determinants of plasma α1-acid glycoprotein (AAG) concentrations in health. British Journal of
Clinical Pharmacology, 20, 500-502.
Bøg-Hansen, T. C. 1973. Crossed immuno-affinoelectrophoresis. An analytical method to predict the
result of affinity chromatography. Analytical Biochemistry, 56, 480-488.
Bogaards, J. J. P., Bertrand, M., Jackson, P., Oudshoorn, M. J., Weaver, R. J., P.J., V. B. & Walther,
B. 2000. Determining the best animal model for human cytochrome P450 activities: A comparison
of mouse, rat, rabbit, dog, micropig, monkey and man. Xenobiotica, 30, 1131-1152.
Borgnia, M. J., Eytan, G. D. & Assaraf, Y. G. 1996. Competition of hydrophobic peptides, cytotoxic
drugs, and chemosensitizers on a common P-glycoprotein pharmacophore as revealed by its ATPase
activity. The Journal of Biologial Chemistry, 271, 3163-3171.
Bories, P. N., Fener, J., Benbernou, N., Rouzeau, J. D., Agneray, J. & Durand, G. 1990. Prevalence of
tri- and tetraantennary glycans of human alpha 1-acid glycoprotein in release of macrophage
ingibitor of interleukin-1 activity. Inflammation, 14, 315-323.
Borst, P. & Elferink, R. O. 2002. Mammalian ABC transporters in health and disease. Annual Reviews of
Biochemistry, 71, 537-592.
Boutten, A., Dehoux, M., Deschemes, M., Rouzeau, J. D., Bories, P. N. & Durand, G. 1992. Alpha 1-
acid glycoprotein potentiates lipopolysaccharide-induced secretion of interleukin-1 beta, interleukin-
6 and tumour necrosis factor-alpha by human monocytes and alveolar and peritoneal macrophages.
European Journal of Immunology, 22, 2687-2695.
Bowers, W. F., Fulton, S. & Thompson, J. 1984. Ultrafiltration vs equilibrium dialysis for
determination of free fraction. Clinical Pharmacokinetics, 1, 49-60.
Bradford, M. 1976. A rapid and sensitive method for the quantitation of microgram quantities of
protein utilizing the principle of protein-dye binding. Analytical Biochemistry, 72, 248-254.
Brady, J. F., Xiao, F., Wang, M. H., Li, Y., Ning, S. M., Gapac, J. M. & Yang, C. S. 1991. Effects of disulfiram on hepatic P450IIE1, other microsomal enzymes, and hepatotoxicity in rats. Toxicology
and Applied Phamacology, 108, 366-373.

Chapter 7 – References 317
Brandon, E. F. A., Raap, C. D., Meijerman, I., Beijnen, J. H. & Schellens, J. H. M. 2003. An update
on in vitro test methods in human hepatic drug biotransformation research: Pros and cons.
Toxicology and Applied Phamacology, 189, 233-246.
Breustedt, D. A., Schönfeld, D. L. & Skerra, A. 2006. Comparative ligand-binding analysis of ten
human lipocalins. Biochimica et Biophysica Acta, 1764, 161-173.
Brockmöller, J., Kirchheiner, J., Meisel, C. & Roots, I. 2000. Pharmacogentic diagnostics of
cytochrome P450 polymorphisms in clinical drug development and in drug treatment.
Pharmacogenomics, 1, 125-151.
Brocks, D. R. 2006. Drug disposition in three dimensions: An update on stereoselectivity in
pharmacokinetics. Biopharmaceutics & Drug Disposition, 27, 387-406.
Brodie, B. B., Axelrod, J., Cooper, J. R., Gaudette, L., La, D. B., Mitoma, C. & Udenfriend, S. 1955.
Detoxication of drugs and other foreign compounds by liver miocrosomes. Science, 121, 603-604.
Broly, F. & Meyer, U. A. 1993. Debrisoquine oxidation polymorphism: Phenotypic consequences of a
3-base-pair deletion in exon 5 of the CYP2D6 gene. Pharmacogenetics, 3, 123-130.
Brørs, O., Nilsen, O. G., Sager, G., Sandnes, D. & Jacobsen, S. 1984. Influence of pH and buffer type
on drug binding in human serum. Clinical Pharmacokinetics, 9, 85-86.
Brown, N. A., Jähnchen, E., Müller, W. E., Schmidt, W. & Wollert, U. 1979. Species differences of the
stereoselective binding of phenprocoumon and warfarin enantiomers to serum albumins.
Comparative Biochemistry and Physiology: Comparative Pharmacology, 62, 101-105.
Brown, R. R., Miller, J. A. & Miller, E. C. 1954. The metabolism of methylated aminoazo dyes. IV.
Dietary factors enhancing demthylation in vitro. The Journal of Biological Chemistry, 209, 211-222.
Budzinski, J. W., Foster, B. C., Vandenhoek, S. & Arnason, J. T. 2000. An in vitro evaluation of
huaman cytochrome P450 3A4 inhibition by selected commercial herbal extracts and tinctures.
Phytomedicine, 7, 273-282.
Budzinski, J. W., Trudeau, V. L., Drouin, C. E., Panahi, M., Amason, J. T. & Foster, B. C. 2007.
Modulation of human cytochrome P450 3A4 (CYP3A4) and P-glycoprotein (P-gp) in caco-2 cell monolayers by selected commercial-source milk thistle and goldenseal products. Canadian Journal of
Physiology and Pharmacology, 85, 966-978.
Bunten, H., Liang, W. J., Pounder, D. J., Senevirante, C. & Osselton, D. 2010. OPRM1 and CYP2B6
gene variants as risk factors in methadone-related deaths. Clinical Phamacology and Therapeutics, 88,
383-389.
Burke, M. D., Prough, R. A. & Mayer, R. T. 1977. Characteristics of a microsomal cytochrome P-448-
mediated reaction. Ethoxyresorufin O-de-ethylation. Drug Metabolism and Disposition, 5, 1-8.
Callaghan, R., Ford, R. C. & Kerr, I. D. 2006. The translocation mechanism of P-glycoprotein. FEBS
Letters, 580, 1056-1063.
Carroccio, A., Wu, D. & Cederbaum, A. I. 1994. Ethanol increases content and activity of human cyctochrome P4502E1 in a transduced HepG2 cell line. Biochemical and Biophysical Research
Communications, 203, 727-733.
Casarett L, Doull J & Klaassen C 2008. Casarett and Doull's Toxicology: The basic science of poisons,
McGraw Hill Medical.
Casarett, L., Doull, J. & Klaassen, C. 2008. Casarett and Doull's Toxicology: The basic science of poisons,
McGraw Hill Medical.
Cascorbi, I., Gerloff, T., Johne, A., Meisel, C., Hoffmeyer, S., Schwab, M., Schaeffeler, E.,
Eichelbaum, M., Brinkman, U. & Roots, I. 2001. Frequency of single nucleotide polymorphisms in the P-glycoprotein drug transporter MDR1 gene in white subjects. Clinical Pharmacology and
Therapeutics, 69, 169-174.
Chachajw, Bartecka Z & Małolpszy J 1980. Histamine binding proteins separated from human sera by
the chromatographic method. Archivum Immunologiae et therapiae experimentalis, 28, 947-951.
Chan, K. 1995. Progress in traditional Chinese medicine. Trends in Pharmacology, 16, 182-187.
Chan, W. K. & Delucchi, A. B. 2000. Resveratrol, a red wine constituent, is a mechanism-based
inactivator of cytochrome P450 3A4. Life Sciences, 67, 3103-3112.
Chance, B. & Radda, G. K. 1971. Probes of structure and function of macromolecules and membranes, New
York, Academic Press.
Chatterjee, P. & Franklin, M. R. 2003. Human cytochrome P450 inhibition and metabolic-intermediate complex formation by goldenseal extract and its methylenedioxyphenyl components. Drug
Metabolism and Disposition, 31, 1391-1397.
Chaudhary, P. M. & Roninson, I. B. 1993. Induction of multidrug resistance in human cells by
transient exposure to different chemotherapeutic drugs. Journal of the National Cancer Institute, 85,
632-639.

Chapter 7 – References 318
Chen, C. J., Chin, J. E., Ueda, K., Clark, D. P., Pastan, I., Gottesman, M. M. & Roninson, I. B. 1986.
Internal duplication and homology with bacterial transport proteins in the mdr1 (P-glycoprotein)
gene from multidrug-resistant cells. Cell, 47, 381-389.
Chen, L., Buters, J. T. M., Hardwick, J. P., Tamura, S., Penman, B. W., Gonzalez, F. J. & Crespi, C.
L. 1997. Coexpression of cytochrome P4502A6 and human NADPH-P450 oxidoreductase in the
baculovirus system. Drug Metabolism and Disposition, 25, 399-405.
Chen, W. D., Liang, Y., Xie, L., Lu, T., Liu, X. D. & Wang, G. J. 2007. Pharmacokinetics of the Ginkgo B following intravenous administration of Ginkgo B emulsion in rats. Biological and
Pharmaceutical Bulletin, 30, 1-5.
Chen, X. W., Serag, E. S., Sneed, K. B., Liang, J., Chew, H., Pan, S. Y. & Zhou, S. F. 2011. Clinical herbal interactions with conventional drugs: From molecules to maladies. Current Medicinal
Chemistry, 18, 4836-4850.
Cheng, X. X., Lui, Y., Zhou, B., Xiao, X. H. & Liu, Y. 2009. Probing the binding sites and the effect of berbamine on the structure of bovine serum albumin. Spectrochimica Acta Part A. Molecular and
biomolecular spectroscopy, 72, 922-928.
Chiba, K., Kobayashi, K., Manabe, K., Tani, M., Kamataki, T. & Ishizaki, J. 1993. Oxidative
metabolism of omeprazole in human liver microsomes: Cosegregation with S-mephenytoin 4'-
hydroxylation. The Journal of Pharmacology and Experimental Therapeutics, 266, 52-59.
Chignell, C. F. 1969. Optical studies of drug-protein complexes. II. Interaction of phenylbutazone and
its analogues with human serum albumin. Molecular Pharmacology, 5, 244-252.
Chignell, C. F. 1970. Optical studies of drug-protein complexs. IV. The interaction of warfarin and
dicoumarol with human serum albumin. Molecular Pharmacology, 6, 1-12.
Chignell, C. F. 1973. Drug-protein binding: recent advances in methodology: Spectroscopic techniques.
Annals of the New York Academy of Sciences, 226, 44-59.
Chin, K. V., Tanaka, S., Darlington, G., Pastan, I. & Gottesman, M. M. 1990b. Heat shock and
aresenite increase expression of the multidrug resistance (MDR1) gene in human renal carcinoma
cells. The Journal of Biologial Chemistry, 265, 221-226.
Ching, C. K., Lam, Y. H., Chan, A. Y. & Mak, T. W. 2011. Adulteration of herbal antidiabetic products with undeclared pharmaceuticals. British Journal of Clinical Pharmacology, 28.
Christensen, J. H. 1989. Individual variation in response to thiopentone. Danish Medical Bulletin, 36,
281-298.
Christensen, L. K., Hansen, J. M. & Kristensen, M. 1963. Sulphaphenazole-induced hypoglycaemic
attacks in tolbutamide-treated diabetics. Lancet, 2, 1298-1301.
Chu, Y. H., Chen, J. K. & Whitesides, G. M. 1993. Affinity electrophoresis in multisectional
polyacrylamide slab gels is a useful and convenient technique for measuring binding constants of
aryl sulfonamides to bovine carbonic anhydrase B. Analytical Biochemistry, 65, 1314-1322.
Chun, L. J., Tong, M. J., Busuttil, R. W. & Hiatt, J. R. 2009. Acetaminophen hepatotoxicity and acute
liver failure. Journal of Clinical Gastroenterology, 43, 342-349.
Conney, A. H. 1982. Induction of microsomal enzymes by foreign chemicals and carcinongenesis by
polycyclic aromatic hydrocarbons: G.H.A. Clowes memorial lecture. Cancer Research, 42, 4875-
4917.
Conney, A. H., Michaelson, I. A. & Burns, J. J. 1961. Stimulatory effect of chlorcyclizine on
barbiturate metabolism. The Journal of Pharmacology and Experimental Therapeutics, 132, 202-206.
Conney, A. H., Miller, E. C. & Miller, J. A. 1957. Substrate-induced synthesis and other properties of
benzpyrene hydroxylase in rat liver. The Journal of Biological Chemistry, 228, 753-766.
Corchero, J., Granvil, C. P., Akiyama, T. E., Hayhurst, G. P., Pimprale, S., Feigenbaum, L., Idle, J. R.
& Gonzalez, F. J. 2001. The CYP2D6 humanized mouse: Effect of the human CYP2D6 transgene
and HNF4α on the dispostion of debrisoquine in the mouse. Molecular Pharmacology, 60, 1260-1267.
Cordon-Cardo C, O'brien J, Boccia J, Casals D, Bertino J & Melamed M 1990. Expression of the multidrug resistance gene product (P-glycoprotein) in human normal and tumour tissues. The Journal
of Histochemistry and Cytochemistry, 38, 1277-1287.
Cordon-Cardo, C., O'brien, J. P., Casals, D., Rittman-Grauer, L., Biedler, J. L., Melamed, M. R. &
Bertino, J. R. 1989. Multidrug-resistance gene (P-glycoprotein) is expressed by endothelial cells at blood-brain barrier sites. Proceedings of the National Academy of Sciences of the United States of America,
86, 695-698.
Correia, M. A. & Ortiz De Montellano, P. R. 2005. Inhibition of cytochrome P450 enzymes. In:
ORTIZ DE MONTELLANO, P. R. (ed.) Cytochrome 450. Structure, Mechanism and Biochemistry. 3 ed.
New York: Kluwer Academic/Plenum Publishers.

Chapter 7 – References 319
Cosyns, J. P., Jadoul, M., Squifflet, J. P., Wese, F. X. & Van Ypersele De Strihou, C. 1999. Urothelial
lesions in Chinese-herb nephropathy. American Journal of Kidney Diseases, 33, 1011-1017.
Crane, F. L. 2001. Biochemical Functions of conenzyme Q10. Journal of the American College of Nutrition,
20, 591-598.
Crommelin, D. J. A. & Sindelar, R. D. 1997. Pharmaceutical Biotechnology: An Introduction for Pharmacists
and Pharmaceutical Scientists, London, Taylor & Francis Ltd.
Crommentuyn, K. M., Schellens, J. H. M., Van Den Berg, J. D. & Beijnen, J. H. 1998. In vitro
metabolism of anti-cancer drugs, methods and applications: Paclitaxel, docetaxel, tamoxifen and
ifosfamide. Cancer Treatment Reviews, 25, 345-366.
Croop, J. M., Raymond, M., Haber, D., Devault, A., Arceci, R. J., Gros, P. & Housman, D. E. 1989.
The three mouse multidrug resistance (mdr) genes are expressed in a tissue-specific manner in
normal mouse tissues. Molecular and Cellular Biology, 9, 1346-1350.
Cytochrome P450 Knowledgebase 2006.
Dai, D., Zeldin, D. C., Blaisdell, J. A., Chanas, B., Coulter, S. J., Ghanayem, B. I. & Goldstein, J. A.
2001. Polymorphisms in human CYP2C8 decrease metabolism of the anticancer drug paclitaxel and
arachidonic acid. Pharmacogenetics, 11, 597-607.
Dalvie, D., Obach, R. S., Kang, P., Prakash, C., Loi, C. M., Hurst, S., Nedderman, A., Goulet, L.,
Smith, E., Bu, H. Z. & Smith, D. A. 2009. Assessment of three human in vitro systems in the generation of major human excretory and circulatory metabolites. Chemical Research in Toxicology,
22, 357-368.
Dandri, M., Burda, M. R., Török, E., Pollock, J. M., Iwanska, A., Sommer, G., Rogiers, X., Rogler, C.
E., Gupta, S., Will, H., Greten, H. & Petersen, J. 2001. Repopulation of mouse liver with human
hepatocytes and in vivo infection with hepatitis B virus. Hepatology, 33, 981-988.
Day, Y. & Myszka, D. G. 2002. Characterizing a drug's primary binding site on albumin. Journal of
Pharmaceutical Sciences, 92, 333-343.
De Graaf, C., Vermeulen, N. P. P. & Feenstra, K. A. 2005. Cytochrome P450 in silico: An integrative
modeling approach. Journal of Medicinal Chemistry, 48, 2725-2755.
De Kanter, R., De Jager, M. H., Draaisma, A. L., Jurva, J. U., Olinga, P., Meijer, D. K. F. &
Groothuis, G. M. M. 2002. Drug-metabolizing activity of human and rat liver, lung, kidney and
intestine slices. Xenobiotica, 32, 349-362.
De Morais, S. M., Wilkinson, G. R., Blaisdell, J. A., Meyer, U. A., Nakamura, K. & Goldstein, J. A.
1994. Identification of a new genetic defect responsible for the polymorphism of (S)-mephenytoin
metabolism in Japanese. Molecular Pharmacology, 46, 594-598.
Dean M & Allikmets R 2001. Complete characterization of the human ABC gene family. Journal of
Bioenergetics and Biomembrnaes, 33, 475-479.
Dean M, Hamon Y & Chimini G 2001. The human ATP-binding casette (ABC) transporter
superfamily. Journal of Lipid Research, 42, 1007-1017.
Delannoy, S., Urbatsch, I. L., Tombline, G., Senior, A. E. & Vogel, P. D. 2005. Nucelotide binding to
the multidrug resistance P-glycoprotein as studeid by ESR spectroscopy. Biochemistry, 44, 14010-
14019.
Dempsey, D., Jacob, P. & Benowitz, N. L. 2002. Accelerated metabolism of nicotine and cotinine in
pregnant smokers. The Journal of Pharmacology and Experimental Therapeutics, 301, 594-598.
Dente, L., Rüther, U., Tripodi, M., Wagner, E. F. & Cortese, R. 1988. Expression of human alpha 1-
acid glycoprotein genes in cultured cells and in transgenic mice. Genes & Development, 1988, 259-266.
Department of Innovation, I., Science and Research 2011. Australian Pharmaceuticals Industry Data
Card 2010. In: DDIISR (ed.) DDIISR Fact Sheets. Canbera.
Devchand, P. R., Keller, H., Peters, J. M., Vazquez, M., Gonzalez, F. J. & Wahli, W. 1996. The
PPARα-leokotriene B4 pathway to inflammation control. Nature, 384, 39-43.
Dey, S., Ramachandra, M., Pastan, I., Gottesman, M. M. & Ambudkar, S. V. 1997. Evidence for two
nonidentical drug-interaction sites in the human P-glycoprotein. Biochemistry, 94, 10594-10599.
Diamond, B. J., Shiflett, S. C., Felwel, N., Matheis, R. J., Noskin, O., Richards, J. A. & Schoenberger, N. E. 2000. Ginkgo biloba extract: Mechanisms and clinical indications. Archives of Physical Medicine
and Rehabilitation, 81, 668-678.
Dickins, M. 2004. Induction of cytochromes P450. Current Topics in Medicinal Chemistry, 4, 1745-1766.
Dickmann, L. J., Rettie, A. E., Kneller, M. B., Kim, R. B., Wood, A. J. J., Stein, C. M., Wilkinson, G.
R. & Schwarz, U. I. 2001. Identification and functional characterization of a new CYP2C9 variant
(CYP2C9*51) expressed among African Americans. Molecular Pharmacology, 60, 382-387.
Dietrich, C. G., Geier, A. & Oude Elfernick, R. P. 2003. ABC of oral bioavailability: Transporters as
gatekeepers in the gut. Gut, 52, 1788-1795.

Chapter 7 – References 320
Ding, X. & Kaminsky, L. S. 2003. Human extrahepatic cytochromes P450: Function in xenobioic
metabolism and tissue-selective chemical toxicity in the respiratory and gastrointestinal tracts.
Annual Reviews of Pharmacology and Toxicology, 43, 149-173.
Donahue, S. R., Flockhart, D. A., Abernethy, D. R. & Ko, J. W. 1997. Ticlopidine inhibition of phenytoin metabolism mediated by potent inhibition of CYP2C19. Clinical Phamacology and
Therapeutics, 62, 572-577.
Donato, M. T., Castell, J. V. & Gómez-Lechón, M. J. 1995. Effect of model inducers on cytochrome
P450 activities of human hepatocytes in primary culture. Drug Metabolism and Disposition, 23, 553-
558.
Donato, M. T., Castell, J. V. & Gómez-Lechón, M. J. 1999. Characterization of drug metabolizing
activities in pig hepatocytes for use in bioartificial liver devices: Comparison with other hepatic
cellular models. Journal of Hepatology, 31, 542-549.
Douglas, J. A., Follett, J. M., Parmenter, G. A., Sansom, C. E., Perry, N. B. & Littler, R. A. 2010.
Seasonal variation of biomass and bioactive alkaloid content of goldenseal, Hydrastis canadensis.
Fitoterapia, 81, 925-928.
Draper, A. J., Madan, A. & Parkinson, A. 1997. Inhibition of coumarin 7-hydroxylase activity in
human liver microsomes. Archives of Biochemistry and Biophysics, 34, 47-61.
Dürr, D., Stieger, B., Kullak-Ublick, G. A., Rentsch, K. M., Steinert, H. C., Meier, P. J. & Fattinger,
K. 2000. St John's Wort induces intestinal P-glycoprtoein/MDR1 and intestinal and hepatic
CYP3A4. Clinical Pharmacology and Therapeutics, 68, 598-604.
Eap Cb & Baumann P 1989. The gentic polymorphism of human alpha-1-acid glycoprotein. Progress in
Cliinical and Biological Research, 300, 111-125.
Eap, C. B. & Baumann, P. 1989. The genetic polymorphism of human alpha-1-acid glycoprotein.
Progress in Clinical and Biological Research, 300, 111-125.
Ebersole, J. L. & Cappelli, D. 2000. Acute-phase reactants in infections and inflammatory diseases.
Periodontology, 23, 19-49.
Eisen, M. J. 1964. Combined effect of sodium warfarin and phenylbutazone. The Journal of the American
Medical Association, 189, 64-65.
Eisenberg, D. M., Davis, R. B., Ettner, S. L., Appel, S., Wilkey, S., Van Rompay, M. I. & Kessler, R. C. 1998. Trends in alternative medicine use in the United States, 1990-1997. The Journal of the
American Medical Association, 280, 1569-1575.
Elsby, R., Surry, D., Smith, V. & Gray, A. 2008a. Validation and application of Caco-2 assays for the
in vitro evaluation of development candidate drugs as substrates or inhibitors of P-glycoprotein to
support regulatory submissions. Xenobiotica, 38, 1140-1164.
Epps, D. E., Raub, T. J. & Kézdy, F. J. 1995. A general, wide-range spectrofluorometric method for measuring the site-specific affinities of drugs toward human serum albumin. Analytical Biochemistry,
227, 342-350.
Epps, D. E., Raub, T. S., Caiolfa, V., Chiari, A. & Zamai, M. 1999. Determination of the affinity of
drugs toward serum albumin by measurement of the quenching of the intrinsic tryptophan
fluorescence of the protein. Journal of Pharmacy and Pharmacology, 51, 41-48.
Essodaïgui M, Broxterman H.J. & Garnier-Suillerot A 1998. Kinetic analysis of calcein and calcein-
acetoxymethylester efflux mediated by the multidrug resistance protein and P-glycoprotein.
Biochemistry, 37, 2243-2250.
Evans, W. E. & Relling, M. V. 1999. Pharmacogenomics: Translating functional genomics into rational
therapeutics. Science, 286, 487-491.
Eytan, G. D., Regev, R. & Assaraf, Y. G. 1996. Functional reconstitution of P-glycoprotein reveals an apparent near stoichiometric drug transport to ATP hydrolysis. The Journal of Biologial Chemistry,
271, 3172-3178.
Farah, M. H., Edwards, R., Lindquist, M., Leon, C. & Shaw, D. 2000. International monitoring of
adverse health effetcs associated with herbal medicines. Pharmacoepidemiology and Drug Safety, 9, 105-
112.
Fasano, M., Curry, S., Terreno, E., Galliano, M., Fanali, G., Narciso, P., Notari, S. & Ascenzi, P.
2005. The extraordinary ligand binding properties of human serum albumin. IUBMB Life, 57, 787-
796.
Fassbender, K., Zimmerli, W., Kissling, R., Sobieska, M., Aeschlimann, A., Kellner, M. & Müller, W. 1991. Glycosylation of α1-acid glycoprotein in relation to duration of disease in acute and chronic
infection and inflammation. Clinica Chimica Acta, 203, 315-328.
Chapter 7 – References 321
Faucette, S. R., Hawke, R. L., Lecluyse, E. L., Shord, S. S., Yan, B., R.M., L. & Lindley, C. M. 2000.
Validation of bupropion hydroxylation as a selective marker of human cytochrome P450 2B6
catalytic activity. Drug Metabolism and Disposition, 28, 1222-1230.
Feely J, Stevenson Ih & Crooks J 1981. Plasma protein binding of drugs in thyroid disease. Clinical
Pharmacokinetics, 6, 298-305.
Felixsson, E., Persson, I. A., Eriksson, A. C. & Persson, K. 2010. Horse chestnut extract contracts
bovine vessels and affects human platelet aggregation through 5-HT(2A) receptors: An in vitro
study. Phytotherapy Research, 24, 1297-1301.
Ferrer, M. L., Duchowicz, R., Carrasco, B., De La Torre, J. G. & Acuña, A. U. 2001. The
conformation of serum albumin in solution: A combined phosphorescence depolarization-
hydrodynamic modeling study. Biophysical Journal, 80, 2422-2430.
Finzi, D., Hermankova, M., Pierson, T., Carruth, L. M., Buck, C., Chaisson, R. E., Quinn, T. C.,
Chadwick, K., Margolick, J., Brookmeyer, R., Gallant, J., Markowitz, M., Ho, D. D., Richman, D.
D. & Siliciano, R. F. 1997. Identification of a reservoir for HIV-1 in patients on highly active
antiretroviral therapy. Science, 278, 1295-1300.
Fitos, I., Visy, J., Simonyi, M. & Hermansson, J. 1999. Stereoselective allosteric binding interaction on
human serum albumin between ibuprofen and lorazepam acetate. Chirality, 11, 115-120.
Fitos, I., Visy, J., Simonyi, M., Mády, G. & F, Z. 2010. Selective binding interactions of deramciclane
to the genetic variants of human α1-acid glycoprotein. Biochimica et Biophysica Acta, 1800, 367-372.
Fois, R. A. & Ashley, J. J. 1991a. Drug binding to apparatus: A factor controlling time to equilibrium
in equilibrium dialysis studies. Journal of Pharmaceutical Sciences, 80, 300-302.
Fontana, R. J., Lown, K. S., Paine, M. F., Fortlage, L., Santella, R. M., Felton, J. S., Knize, M. G.,
Greenberg, A. & Watkins, P. B. 1999. Effects of a chargrilled meat diet on expression of CYP3A,
CYP1A, and P-glycoprotein levels in healthy volunteers. Gastroenterology, 117, 89-98.
Foti, R. S., Wienkers, L. C. & Wahlstrom, J. L. 2010. Application of cytochrome P450 drug interaction
screening in drug discovery. Combinatorial Chemistry & High Throughput Screening, 13, 145-158.
Fournier, T., Medjoubi-N, N. & Porquet, D. 2000. Alpha-1- acid glycoprotein. Biochimica et Biophysica
Acta, 1482, 157-171.
Fradette, C., Yamaguchi, N. & Du Souich, P. 2004. 5-Hydroxytryptamide is biotransformed by CYP2C9, 2C19 and 2B6 to hydroxylamine, which is converted into nitric oxide. British Journal of
Clinical Pharmacology, 141, 407-141.
Frantz M, Jung Ml, Ribereau-Gayon G & Anton R 2000. Modulation of mistletoe (Viscum album L.)
lectins cytotoxicty by carbohydrate and serum glycoproteins. Arzneimttelforschung, 50, 471-478.
Fricker, G., Gutmann, H., Droulle, A., Drewe, J. & Miller, D. S. 1999. Epilethial transport of
antihelminthic ivermectin in a novel of isolated proximal kidney tubules. Pharmaceutical Research, 16,
1570-1575.
Fricker, G. & Miller, D. S. 2004. Modulation of drug transporters at the blood-brain barrier.
Pharmacology, 70, 169-176.
Friedberg, T., Henderson, C. J., Pritchard, M. P. & Wolf, C. R. 1999. In vivo and in vitro recombinant
DNA technology as a powerful tool in drug development. In: WOOLF, T. F. (ed.) Handbook of drug
metabolism. New York: Marcel Dekker.
Fromm M 2004a. Importance of P-glycoprotein at blood-tissue barriers. TRENDS in Pharmacological
Sciences, 25, 423-429.
Fromm, M. F. 2002. The influence of MDR1 polymorphisms on P-glycoprotein expression and
function in humans. Advanced Drug Delivery Reviews, 54, 1295-1310.
Fujino, T., Gottlieb, K., Manchester, D. K., Park, S. S., West, D., Gurtoo, H. L., Tarone, R. E. &
Gelboin, H. V. 1984. Monoclonal antibody phenotyping of interindividual differenences in
cytochrome P-450 dependent reactions of single and twin human placenta. Cancer Research, 44,
3619-3923.
Gage, B. F. & Milligan, P. E. 2005. Pharmacology and pharmacogenetics of warfarin and other
coumarins when used with supplements. Thrombosis Research, 117, 55-59.
Galijatovic, A., Otake, Y., Walle, U. K. & Walle, T. 1999. Extensive metabolism of the flavonoid
chrysin by human caco-2 and hep G2 cells. Xenobiotica, 29, 1241-1256.
Garfinkel, D. 1958. Studies on pig liver microsome. I. Enzymatic and pigment composition of different
microsomal fractions. Archives of Biochemistry and Biophysics, 77, 493-509.
Garrigues, A., Nugier, J., Orlowski, S. & Ezan, E. 2002. A high-throughput screening microplate test
for the interaction of drugs with P-glycoprotein. Analytical Biochemistry, 305, 106-114.

Chapter 7 – References 322
Gasparini, G., Bevilacqua, P., Pozza, F., Meil, S. & Weidner, N. 1993. P-glycoprotein expression
predicts response to chemotherapy in previously untreated advanced breast cancer. The Breast, 2, 27-
32.
George, J., Goodwin, B., Liddle, C., Tapner, M. & Farrell, G. C. 1997. Time-dependent expression of cytochrome P450 genes in primary cultures of well-differentiated human hepatocytes. Journal of
Laboratory and Clinical Medicine, 129, 638-648.
Gerbal-Chaloin, S., Pascussi, J. M., Pichard-Garcia, L., Daujat, M., Waechter, F., Fabre, J. M.,
Carrère, N. & Maurel, P. 2001. Induction of CYP2C genes in human hepatocytes in primary
culture. Drug Metabolism and Disposition, 29, 242-251.
Gervot, L., Rochat, B., Gautier, J. C., Bohnenstengel, F., Kroemer, H., De Berardinis, V., Martin, H.,
Beaune, P. H. & De Waziers, I. 1999. Human CYP2B6: Expression, inducibility and catalytic
activities. Pharmacogenetics, 9, 295-306.
Gibson, G. & Skett, P. 2001. Introduction to drug metabolism, London, Blackie Academic & Professional.
Gillespie, W. R. 1993. Generalized pharmacokinetic modelling for drugs with nonlinear binding:
Theoretical framework. Journal of Pharmacokinetics and Biopharmaceuticals, 21, 99-124.
Gołab-Janowska, M., Honczarenko, K., Gawrońska-Szklarz, B. & Potemkowski, A. 2007. CYP2D6
gene polymorphism as a probable risk factor for Alzheimer's disease and Parkinson's disease with
dementia. Neurologica, 41, 113-121.
Gómez-Lechón, M. J., Castell, J. V. & Donato, M. T. 2007. Hepatocytes- The choice to investigate
drug metabolism and toxicity in man: In vitro variability as a reflection of in vivo. Chemico-Biological
Interactions, 168, 30-50.
Gómez-Lechón, M. J., Donato, M. T., Castell, J. V. & Jover, R. 2004. Human hepatocytes in primary
culture: The choice to investigate drug metabolism in man. Current Drug Metabolism, 5, 443-462.
Gómez-Lechón, M. J., Donato, T., Jover, R., Rodriguez, C., Ponsoda, X., Glaise, D., Castell, J. V. &
Guguen-Guillouzo, C. 2001. Expression and induction of a large set of drug-metabolizing enzymes
by the highly differentiated human hepatoma cell line BC2. European Journal of Biochemistry, 268,
1448-1459.
Gonzalez, F. J. 2005. Role of cytochromes P450 in chemical toxicty and oxidative stress: Studies with
CYP2E1. Mutation Research, 569, 101-110.
Gottesman, M. M. & Pastan, I. 1993. Biochemistry of multidrug resistance mediated by the multidrug
transporter. Annual Reviews of Biochemistry, 62, 385-427.
Goya, S., Takadate, A., Fujino, H., Otagiri, M. & Uekama, K. 1982. New flourescence probes for drug-
albumin interaction studies. Chemical & Pharmaceutical Bulletin, 30, 1363-1369.
Granvil, C. P., Krausz, K. W., Gelboin, H. V., Idle, J. R. & Gonzalez, F. J. 2002. 4-Hydroxylation of debrisoquine by human CYP1A1 and its inhibition by quinidine and quinine. The Journal of
Pharmacology and Experimental Therapeutics, 301, 1025-1032.
Greene, L. A., Isaac, I., Gray, D. E. & Schwartz, S. A. 2007. Streamlining plant sample preparation:
The use of high-throughput robotics to process Echinacea samples for biomarker profiling by
MALDI-TOF mass spectrometry. Journal of Biomolecular Techniques, 18, 238-244.
Grimaldi, B., Hamberger, C., Tremblay, D., Barre, J. & Tillement, J. P. 1989. In vitro study of the binding of RU486 and RU42633 to human serum proteins. Progress in Clinical and Biological Research,
300, 445-448.
Gu, Y. Z., Hogenesch, J. B. & Bradfield, C. A. 2000. The PAS superfamily: Sensors of environmental
and developmental signals. Annual Reviews of Pharmacology and Toxicology, 40, 519-561.
Guengerich, F. P. 1997. Comparisons of catalytic selectivity of cytochrome P450 subfamily from
different species. Chemico-Biological Interactions, 106, 161-182.
Guengerich, F. P. 2005. Human Cytochrome P450 Enzymes. In: ORTIZ DE MONTELLANO, P. R.
(ed.) Cytochrome 450. Structure, Mechanism and Biochemistry. 3 ed. New York: Kluwer
Academic/Plenum Publishers.
Guengerich, F. P., Martin, M. V., Beaune, P. H., Kremers, P., Wolff, T. & Waxman, D. J. 1986.
Characterization of rat and human liver microsmal cytochrome P-450 forms involved in nifedipine
oxidation, a prototype for genetic polymorphism in oxidative drug metabolism. The Journal of
Biological Chemistry, 261, 5051-5060.
Gunes, A. & Dahl, M. L. 2008. Variation in CYP1A2 activity and its clinical implications: Influence of
environmental factors and genetic polymorphisms. Pharmacogenomics, 9, 629-637.

Chapter 7 – References 323
Guo, L., Li, Q. Z., Xia, Q., Dial, S., Chan, P. C. & Fu, P. 2009. Analysis of gene experession changes
of drug metabolizing enzymes in the livers of F344 rats following oral treatment with kava extract.
Food and Chemical Toxicology, 47, 433-442.
Guo, L., Mei, N., Lioa, W., Chan, P. C. & Fu, P. P. 2010a. Ginkgo biloba extract induces gene
expression changes in xenobiotics metabolsim and the Myc-centered network. OMICS, 14, 75-90.
Guo, L., Shi, Q., Dial, S., Xia, Q., Mei, N., Li, Q. Z., Chan, P. C. & Fu, P. 2010b. Gene expression
profiling in male B6C3F1 mouse livers exposed to kava identifies changes in drug metabolizing
genes and potential mechanisms linked to kava toxicity. Food and Chemical Toxicology, 48, 686-696.
Guo, M., Su, X., Kong, L., Li, X. & Zou, H. 2006. Characterization of interaction property of multicomponents in Chinese herb with protein by microdialysis combined with HPLC. Analytica
Chimica Acta, 556, 183-188.
Gupta, D., Jalali, M., Wells, A. & Dasgupta, A. 2002. Drug-herb interactions: Unexpected suppression
of free danshen concentrations by salicylate. Journal of Clinical Laboratory Analysis, 16, 293-294.
Gurley B, Swain A, Williams D, Barone G & Battu S 2008. Gauging the clinical significance of P-
glycoprotein-mediated herb-drug interactions: Comparative effects of St. John's wort, echinacea,
clarithromycin, and rifampin on digoxin pharmacokinetics. Molecular Nutirion and Food Research, 52,
772-779.
Gurley, B. J., Barone, G. W., Williams, D. K., Carrier, J., Breen, P., Yates, C. R., Song, P. F.,
Hubbard, M. A., Tong, Y. & Cheboyina, S. 2006a. Effect of milk thistle (Silybum marianum) and
black cohosh (Cimicifugaq racemosa) supplementration on digoxin pharmacokinetics in humans.
Drug Meatbolism and Disposition, 34, 69-74.
Gurley, B. J., Gardner, S. F., Hubbard, M. A., Williams, D. K., Gentry, W. B., Carrier, J., Khan, I. A.,
Edwards, D. J. & Shah, A. 2004. In vivo assessment of botanical supplementation on human
cytochrome P450 phenotypes: Citrus aurantium, Echinacea purpurea, milk thistle, and saw
palmetto. Pharmacokinetics and Drug Disposition, 76, 428-440.
Gurley, B. J., Gardner, S. F., Hubbard, M. A., Williams, D. K., Gentry, W. B., Cui, Y. & Ang, C. Y.
2005a. Clinical assessment of effects of botanical supplementation on cytochrome P450 phenotypes
in the elderly: St John's wort, garlic oil, Panax ginseng and Ginkgo biloba Drugs & Aging, 22, 525-
539.
Gurley, B. J., Gardner, S. F., Hubbard, M. A., Williams, D. K., Gentry, W. B., Khan, I. A. & Shah, A.
2005b. In vivo effects of goldenseal, kava kava, black cohosh and valerian on human cytochrome
P450 1A2, 2D6, 2E1 and 3A4 phenotypes. Clinical Pharmacology and Therapeutics, 77, 415-426.
Gurley, B. J., Hubbard, M. A., Williams, D. K., Thaden, J., Tong, Y., Gentry, W. B., Breen, P.,
Carrier, D. J. & Cheboyina, S. 2006b. Assessing the clinical significance of botanical
supplementation on human cytochrome P450 3A activity: Comparison of a milk thistle and black
cohosh product to rifampin and clarithromycin. Journal of Clinical Pharmacology, 46, 201-213.
Gurley, B. J., Swain, A., Hubbard, M. A., Williams, D. K., Barone, G. W., Hartsfield, F., Tong, Y.,
Carrier, D. J., Cheboyina, S. & Battu, S. K. 2008. Clinical assessment of CYP2D6-mediated herb-
drug interactions in humans: Effects of milk thistle, black cohosh, goldenseal, kava kava, St. John's
wort and Echinacea. Molecular Nutritional Food Research, 52, 1-9.
Gutmann, H., Miller, D. S., Droulle, A., Drewe, J., Fahr, A. & Fricker, G. 2000. P-glycoprotein and
mrp2-mediated octreotide transport in renal proximal tubule. British Journal of Pharmacology, 129,
251-256.
Ha-Duong, N. T., Dijols, S., Marques-Soares, C., Minoletti, C., Dansette, P. M. & Mansuy, D. 2001.
Synthesis of sulfaphenazole derivatives and their use as inhibitors and tools for comparing the active
sites of human liver cytochrome P450 of the 2C family. Journal of Medicinal Chemistry, 44, 3622-3631.
Hage, D. S., Jackson, A., Sobansky, M. R., Schiel, J. E., Yoo, M. J. & Joseph, K. S. 2009.
Characterization of drug-protein interactions in blood using high-performance affinity
chromatography. Journal of Separation Science, 32, 835-853.
Hakkola, J., Pasanen, M., Pelkonen, O., Hukkanen, J., Evisalmi, S., Anttila, S., Rane, A., Mäntylä,
M., Purkunen, R., Saarikoski, S., Tooming, M. & Raunio, H. 1997. Exprssion of CYP1B1 in
human adult and fetal tissues and differential inducibility of CYP1B1 and CYP1A1 by Ah receptor
ligands in human placenta and cultured cells. Carcinogenesis, 18, 391-397.
Hakooz, N., Ito, K., Rawden, H., Gill, H., Lemmers, L., Boobis, A. R., Edwards, R. J., Carlile, D. J.,
Lake, B. G. & Houston, J. B. 2006. Determination of a human hepatic microsomal scaling factor for
predicting in vivo drug clearance. Pharmaceutical Research, 23, 533-539.
Halpert, J. R. 1995. Structural basis of slective cytochrome P450 inhibition. Annual Reviews of
Pharmacology and Toxicology, 35, 29-53.

Chapter 7 – References 324
Hansen, J. E. S., Jensen, S. P., Nørgaard-Pedersen, B. & Bøg-Hansen, T. C. 1986. Electrophoretic
analysis of the glycan micro-heterogeneity of orosomucoid in cancer and inflammation.
Electrophoresis, 7, 180-183.
Hansen, J. E. S., Larsen, V. A. & Bøg-Hansen, T. C. 1984a. The microheterogeneity of alpha 1-acid glycoprotein in inflammatory lung disease, cancer of the lung and normal health. Clinica Chimica
Acta, 138, 41-47.
Hansen, J. E. S., Lihme, A. & Bøg-Hansen, T. C. 1984b. The microheterogeneity components of
orosomucoid and the dissociation constants and metabolites of concanavalin A/orosomucoid
complexes in crossed affinoimmunoelectrophoresis with free concanavalin A. Electrophoresis, 5, 196-
201.
Harder, S. & Thürmann, P. 1996. Clinically important drug interactions with anticoagulants. An
update. Clinical Pharmacokinetics, 30, 416-444.
Härtter, S., Wang, X., Weigmann, H., Friedberg, T., Arand, M., Oesch, F. & Hiemke, C. 2001.
Differential effects of fluvoxamine and other antidepressants on the biotransformation of melatonin.
Journal of Clinical Psychopharmacology, 21, 167-174.
Hasler, J. A., Estabrook, R. W., Murray, M., Pikuleva, I., Waterman, M., Capdevila, J., Holla, V.,
Helvig, C., Falck, J. R., Farrell, G. C., Kaminsky, L. S., Spivack, S. D., Boitier, E. & Beaune, P. H.
1999. Human cytochromes P450. Molecular Aspects of Medicine, 20, 1-137.
Hayaishi, O., Katagiri, M. & Rothberg, S. 1955. Mechanism of the pyrocatechase reaction. Journal of the
American Chemical Society, 77, 5450-5451.
Hayashi, S., Watanabe, J. & Kawajiri, K. 1991. Genetic polymorphisms in the 5'-flanking region change transcriptional regulation of the human cytochrome P450IIE1 gene. Journal of Biochemistry,
110, 559-565.
Hazai, E., Visy, J., Fitos, I., Bikádi, Z. & Simonyi, M. 2006. Selective binding of coumarin enantiomers
to human alpha1-acid glycoprotein genetic varients. Bioorganic & Medicinal Chemistry, 14, 1956-1965.
He, X. M. & Carter, D. C. 1992. Atomic structure and chemistry of human serum albumin. Nature,
358, 209-215.
Hecht, S. S. 1999. DNA adduct formation from tobacco-specific N-nitrosamines. Mutation Research,
424, 127-142.
Hediger, M. A., Romero, M. F., Peng, J. B., Rolfs, A., Takanaga, H. & Bruford, E. A. 2004. The ABCs
of solute carriers: Physiological, pathalogical and therapeutic implications of human membrane
trasport proteins. Pflugers Archives, 447, 465-468.
Hellum, B. H., Hu, Z. & Nilsen, O. G. 2009. Trade herbal products and induction of CYP2C19 and
CYP2E1 in cultured human hepatocytes. Basic & Clinical Pharmacology & Toxicology, 105, 58-63.
Hellum, B. H. & Nilsen, O. G. 2008b. In vitro inhibition of CYP3A4 metabolism and P-glycoprotein
mediated transport by trade herbal products. Basic & Clinical Pharmacology and Toxicology, 102, 466-
475.
Henderson, L., Yue, Q. Y., Bergquist, C., Gerden, B. & Arlett, P. 2002. St John's wort (Hypericum
perforatum): Drug interactions and clinical outcomes. British Journal of Clinical Pharmacology, 54,
349-356.
Hennessy, M., Kelleher, D., Spiers, J. P., Barry, M., Kavanagh, P., Back, D., Mulcahy, F. & Feely, J. 2002. St Johns wort increases expression of P-glycoprotein: Implications for drug interactions. British
Journal of Pharmacology, 53, 75-82.
Hennessy, M. & Spiers, J. P. 2007. A primer on the mechanics of P-glycportein the multidrug
transporter. Pharmacolgical Research, 55, 1-15.
Henricsson, S. 1987. A new method for measuring the free fraction of cyclosporin in plasma by
equilibrium dialysis. The Journal of Pharmacy and Pharmacology, 39, 384-385.
Henry, J. A., Dunlop, A. W., Mitchell, S. N. & Adams, P. 1981. A model for the pH dependence of
drug-protein binding. Journal of Pharmacy and Pharmacology, 33, 179-182.
Hervé F, Caron G, Duché J, Gaillard P, Rahman N, Tsantili-Kakoulidou A, Carrupt P, D'athis P, Tillement J & Testa B 1998. Ligand specificty of the genetic variants of human α1-acid glycoprotein:
Generation of three dimensional quantitative structure-activity relationship model for drug binding
to the A variant. Molecular Pharmacology, 54, 129-138.
Hervé, F., Caron, G., Duché, J. C., Gaillard, P., Rahman, N. A., Tsantili-Kakoulidou, A., Carrupt, P.
A., D'athis, P., Tillement, J. P. & Testa, B. 1998. Ligand specificty of the genetic variants of human α1-acid glycoprotein: Generation of three dimensional quantitative structure-activity relationship
model for drug binding to the A variant. Molecular Pharmacology, 54, 129-138.

Chapter 7 – References 325
Hervé, F., Duché, J. C., D'athis, P., Marché, C., Barré, J. & Tillement, J. P. 1996. Binding of
disopyramide, methadone, dipyridamole, chlorpromazine, lignocaine and progesterone to the two
main genetic varients of human alpha 1-acid glycoprotein: Evidence for drug-binding differences
between the variants and for the presence of two seperate drug-bidning sites on alpha 1-acid
glycoprotein. Pharmacogenetics, 6, 403-415.
Hervé, F., Gomas, E., Duche, J. C. & Tillement, J. P. 1993. Evidence for differences in the binding of
drugs to the two main genetic varients of human α1-acid glycoprotein. British Journal of Clinical
Pharmacology, 36, 241-249.
Hesse, L. M., Venkatakrishnan, K., Court, M. H., Von Moltke, L. L., Duan, S. X., Shader, R. I. &
Greenblatt, D. J. 2000. CYP2B6 mediates the in vitro hydroxylation of bupropion: Potential drug
interactions with other antidepressants. Drug Metabolism and Disposition, 28, 1176-1183.
Hewitt, N. J., Lecluyse, E. L. & Ferguson, S. S. 2007. Induction of hepatic cytochrome P450 enzymes:
Methods, mechanisms, recommendations, and in vitro-in vivo correlations. Xenobiotica, 37, 1196-
1224.
Higgins C 1992. ABC transporters: From microorganisms to man. Annual Reviews- Cell Biology, 8, 67-
113. Higgins, C. F. & Linton, K. J. 2004. The ATP switch model for ABC transporters. Nature Structural &
Molecular Biology, 11, 918-926.
Hines, R. N. 2008. The ontogeny of drug metabolism enzymes and implications for adverse drug
events. Pharmacology & Therapeutics, 118, 250-267.
Hodge, L. S. & Tracy, T. S. 2007. Alterations in drug disposition during pregnancy: Implications for
drug therapy. Expert Opinion in Drug Metabolism and Toxicology, 3, 557-571.
Hof, M., Vajda, S., Fidler, V. & Karpenko, V. 1986. Piosecond tryptophan fluorescence of human
blood serum orosomucoid. Collection of Czechoslovack Chemical Communications, 61, 808-818.
Hoffmeyer, S., Burk, O., Von Richter, O., Arnold, H. P., Brockmöller, J., Johne, A., Cascorbi, I.,
Gerloff, T., Roots, I., Eichelbaum, M. & Brinkman, U. 2000. Functional polymorphisms of the
human multidrug-resistance gene: Multiple sequence variations and correlation of one allele with P-
glycoprotein expression and activity in vivo. Proceedings of the National Academy of Sciences of the United
States of America, 97, 3473-3478.
Hollenberg, P. F. 2002. Characteristics and common properties of inhibitors, inducers, and activators of
CYP enzymes. Drug Metabolism Reviews, 34, 17-35.
Homolya, L., Holló, Z., Germann, U. A., Pastan, I., Gottesman, M. M. & Sarkadi, B. 1993. Fluorescent cellular indicators are extruded by the multidrug resistance protein. The Journal of
Biologial Chemistry, 268, 21493-21496.
Honkakoski, P. & Negishi, M. 2000. Regulation of cytochrome P450 (CYP) genes by nuclear receptors.
Biochemical Journal, 347, 321-337.
Houston, J. B. & Galetin, A. 2010. In vitro techniques to study drug-drug interactions of drug metabolism: Cytochrome P450. In: PANG, K. S., RODRIGUES, A. D. & RAIMUND, P. (eds.)
Enzyme and transporter based drug-drug interactions. 1st ed. New York: Springer.
Howell, S. R., Shirley, M. A. & Ulm, E. H. 1998. Effects of retinoid treatment of rats on heptaic
microsomal metabolism and cytochromes P450. Drug Metabolism and Disposition, 26, 234-239.
Hu, Z., Jin, S. & Scotto, K. W. 2000. Transcriptional activation of the MDR1 gene by UV irradiation.
Role of NF-Y and Sp1. The Journal of Biologial Chemistry, 275, 2979-2985.
Hu, Z., Yang, X., Ho, P. C. L., Chan, S. Y., Heng, P. W. S., Chan, E., Duan, W., Koh, H. L. & Shou,
S. 2005. Herb-drug interactions. A literature review. Drugs, 65, 1239-1282.
Huang, J. D. 1983. Errors in estimating the unbound fraction of drugs due to the volume shift in
equilibrium dialysis. Journal of Pharmaceutical Sciences, 72, 1368-1369.
Huang, Q., Stoner, G., Resau, J., Nickols, J. & Mirvish, S. S. 1992. Metabolism of N-nitrosomethyl-
amyline by microsomes from human and rat esophagus. Cancer Research, 52, 3547-3551.
Huang, W. Y., Cai, Y. Z. & Zhang, Y. 2010. Natural phenolic compounds from medicinal herbs and
dietary plants: Potential use for cancer prevention. Nutrition and Cancer, 62, 1-20.
Hughes, J. & Crowe, A. 2010. Inhibition of P-glycoprotein mediated efflux of digoxin and its
metabolites by macrolide antibiotics. Journal of Pharmacological Sciences, 113, 315-214.
Hukkanen, J., Lassila, A., Päivärinta, K., Valanne, S., Sarpo, S., Hakkola, J., Pelkonen, O. & Raunio,
H. 2000. Induction and regulation of xenobiotic-metabolizing cytochrome P450s in the human
A549 lung adenocarcinoma cell line. American Journal of Respiratory Cell and Molecular Biology, 22,
360-366.

Chapter 7 – References 326
Hyde, S., Emsley, P., Hartshorn, M. J., Mimmack, M. M., Gileadi, U., Pearce, S. R., Gallagher, M. P.,
Gill, D. R., Hubbard, R. E. & Higgins, C. F. 1990. Structural model of ATP-binding proteins
associated with cystic fibrosis, multidrug resistance and bacterial transport. Nature, 346, 362-365.
Hyneck, M. L., Smith, P. C., Munafo, A., Mcdonagh, A. F. & Benet, L. Z. 1988. Disposition and
irreversible plasma protein binding of tolmetin in humans. Clinical Pharmacology and Therapeutics, 44,
107-114.
Idle, J. R., Mahgoub, A., Lancaster, R. & Smith, R. L. 1978. Hypotensive resposne to debrisoquine and
hydroxylation phenotype. Life Sciences, 22, 979-983.
Imamura, H., Maruyama, T., Okabe, H., Shimada, H. & Otagiri, M. 1994. A simple and rapid fluorometric determination method of α1-acid glycoprotein in serum using quinaldine red.
Pharmaceutical Research, 11, 566-570.
Ingelman-Sundberg, M., Johansson, I., Penttllä, K. E., Glaumann, H. & Lindros, K. O. 1998. Centrilobular expression of ethanol-inducible cytochorme P-450 (IIE1) in rat liver. Biochemical and
Biophysical Research Communications, 157, 55-60.
Ingleman-Sundberg, M., Daly, A. K. & Nebert, D. W. Home page of the human cytochorme P450
(CYP) allee nomenclature committee.
Inoue, K., Inazawa, J., Nakagawa, H., Shimada, T., Yamazaki, H., Guengerich, F. P. & Abe, T. 1992.
Assignment of the human cytochrome P-450 nifedipine oxidase gene (CYP3A4) to chromosome 7
at band q22.1 by fluorescence in situ hybridization. The Japanese Journal of Human Genetics, 37, 133-
138. Ioannides, C. 2008. Cytochromes P450. Role in the metabolism and toxicity of drugs and other xenobiotics,
Cambridge, UK, RSC Publishing. Ionescu, C. & Caira, M. R. 2005. Drug metabolism: Current concepts, New York, Springer.
Isin, E. M. & Guengerich, F. P. 2006. Kinetics and thermodynamics of ligand binding by cytochrome
P450 3A4. The Journal of Biological Chemistry, 281, 9127-9136.
Israili Z & Dayton P 2001. Human alpha-1-glycoprotein and its interactions with drugs. Drug
Metabolism Reviews, 33, 161-235.
Istrate, M. A., Nussler, A. K., Eichelbaum, M. & Burk, O. 2010. Regulation of CYP3A4 by pregnane X receptor: The role of nuclear receptors competing for respoense elemenet binding. Biochemical and
Biophysical Research Communications, 393, 688-693.
Izzo, A. A. 2004. Herb-drug interactions: An overview of the clinical evidence. Fundamental & Clinical
Pharmacology, 19, 1-16.
Izzo, A. A. & Ernst, E. 2009. Interactions between herbal medicines and prescribed drugs. An updated
systematic review. Drugs, 69, 1777-1798.
Jaakkola, T., Laitila, J., P.J., N. & Backman, J. T. 2006. Pioglitazone is metabolised by CYP2C8 and CYP3A4 in vitro: Potential for interactions with CYP2C8 inhibitors. Basic & Clinical Pharmacology &
Toxicology, 99, 44-51.
Janmohamed, A., Dolphin, C. T., Phillips, I. R. & Shephard, E. A. 2001. Quantification and cellular
localization of expression in human skin of genes encoding flavin-containing monooxygenases and
cytochromes P450. Biochemical Pharmacology, 62, 777-786.
Jewell, R. C., Brouwer, K. L. & Mcnamara, P. J. 1989. Alpha-1-acid glycoprotein high-performace liquid chromatography column (EnantioPAC) as a screening tool for protein binding. Journal of
Chromatography, 487, 257-264.
Jiang, H., Zhong, F., Sun, L., Feng, W., Huang, Z. X. & Tan, X. 2011. Structural and functional
insights into polymorphic enzymes of cytochrome P450 2C8. Amino Acids, 40, 1195-1204.
Jiang, X., Williams, K. M., Liauw, W. S., Ammit, A. J., Roufogalis, B. O., Duke, C. C., Day, R. O. &
Mclachlan, A. J. 2005. Effect of ginkgo and ginger on the pharmacokientics and pharmacodynamics
of warfarin in healthy subjects. British Journal of Clinical Pharmacology, 59, 425-432.
Johansen, A. K., Willassen, N. P. & Sager, G. 1992. Fluorescence studies of β-adrenergic ligand
binding to α1-acid glycoprotein with 1-anilino-8-naphthalene sulfonate, isoprenaline, adrenaline and
propranolol. Biochemical Pharmacology, 43, 725-729.
Johansson, B. G., Kindmark, C. O., Trell, E. Y. & Wollheim, F. A. 1972. Sequential changes of plasma
proteins after mycardial infarction. Scandinavian journal of clinial and laboratory investigation, 124, 117-
126.
Johansson, I. & Ingelman-Sundberg, M. 2010. Genetic polymorphism and toxicology- with emphasis on cytochrome P450. Toxicological Sciences.
Johnson, D. A. & Smith, K. D. 2006. The efficacy of certain anti-tuberculosis drugs is affected by
binding to α-1-acid glycoprotein. Biomedical Chromatography, 20, 551-560.

Chapter 7 – References 327
Jones, D. R., Ekins, S., Li, L. & Hall, S. D. 2007. Computational approaches that predict metabolic
intermediate complex formation with CYP3A4 (+b5). Drug Metabolism and Disposition, 35, 1466-
1475.
Jounaidi, Y. & Waxman, D. J. 2004. Use of replication-conditional adenovirus as a helper system to
enhance delivery of P450 prodrug-activation genes for cancer therapy. Cancer Research, 64, 292-303.
Juliano Rl & Ling V 1976. A surface glycoprotein modulating drug permiability in Chinese hamster
ovary cell mutants. Biochemisty et Biophyscia Acta, 455, 152-162.
Kaldas, M. I., Walle, U. K., Van Der Woude, H., Mcmillan, J. M. & Walle, T. 2005. Covalent binding
of the flavonoid quercetin to human serum albumin. Journal of Agricultural and Food Chemistry, 53,
4194-4197.
Kamataki, T., Fujieda, M., Kiyotani, K., Iwano, S. & Kunitoh, H. 2005. Genetic polymorphism of
CYP2A6 as one of the potential determinants of tobacco related cancer risk. Biochemical and
Biophysical Research Communications, 338, 306-310.
Kamimura, H., Nakada, N., Suzuki, K., Mera, A., Souda, K., Murakami, Y., Tanaka, K., Iwatsubo,
T., Kawamura, A. & Usui, T. 2010. Assessment of chimeric mice with humanized liver as a tool for
prediciting circulating human metabolites. Drug Metabolism and Pharmacokinetics, 25, 223-235.
Kanebratt, K. P. & Andersson, T. B. 2008. Evaluation of HepaRG cells as an in vitro model for human
drug metabolism studies. Drug Metabolism and Disposition, 36, 1444-1452.
Kappas, A., Alvares, A. P., Anderson, K. E., Pantuck, E. J., Pantuck, C. B., Chang, R. & Conney, A. H. 1978. Effect of charcoal-broiled beef on antipyrine and theophylline metabolism. Clinical
Phamacology and Therapeutics, 23, 445-450.
Kappers, W. A., Edwards, R. J., Murray, S. & Boobis, A. R. 2001. Diazinon is activated by CYP2C19
in human liver. Toxicology and Applied Phamacology, 177, 68-76.
Karam, W. G., Goldstein, J. A., Lasker, J. M. & Ghanayem, B. I. 1996a. Human CYP2C19 is a major omeprazole 5-hydroxylase, as demonstrated with recombinant cytcochrome P450 enzymes. Drug
Metabolism and Disposition, 24, 1081-1087.
Kariv, I., Cao, H. & Oldenburg, K. R. 2001. Development of a high throughput equilibrium dialysis
method. Journal of Pharmaceutical Sciences, 90, 580-587.
Kast, H. R., Goodwin, B., Tarr, P. T., Jones, S. A., Anisfeld, A. M., Stoltz, C. M., Tontonoz, P.,
Kliewer, S., T.M., W. & Edwards, P. A. 2002. Regulation of multidrug resistance-associated protein
2 (ABCC2) by the nuclear receptors pregnane X rceptor, farnesoid X-activated receptor, and
constitutive androstane receptor. The Journal of Biological Chemistry, 277, 2908-2915.
Kato, N., Tani, T. & Yoshida, A. 1980. Effect of dietary level of protein on liver microsomal drug-
metabolizing enzymes, urinary ascorbic acid and lipid metabolism in rats fed PCB-containing diets.
THe Journal of Nutrition, 110, 1686-1694.
Katoh, M., Matsui, T., Nakajima, M., Tateno, C., Kataoka, M., Soeno, Y., Horie, T., Iwasaki, K.,
Yoshizato, K. & Yokoi, T. 2004. Expression of human cytochromes P450 in chimeric mice with
humanized liver. Drug Metabolism and Disposition, 32, 1402-1410.
Kawana, K., Ikuta, T., Kobayashi, Y., Gotoh, O., Takeda, K. & Kawajiri, K. 2003. Molecular
mechanism of nuclear translocation of an orphan nuclear receptor, SXR. Molecular Pharmacology, 63,
524-531.
Kay, L., Kampmann, J. P., Svendsen, T. L., Vergman, B., Hansen, J. E. M., Skovsted, L. & Kristensen, M. 1985. Influence of rifampicin and isoniazid on the kinetics of phenytoin. British
Journal of Clinical Pharmacology, 20, 323-326.
Kazui, M., Nishiya, Y., Ishizuka, T., Hagihara, K., Farid, N. A., Okazaki, O., Ikeda, T. & Kurihara,
A. 2010. Identification of the human cytochrome P450 enzymes involved in the two oxidative steps in the bioactivation of clopidogrel to its pharmacologically active metabolite. Drug Metabolism and
Disposition, 38, 92-99.
Kent, U. M., Aviram, M., Rosenblat, M. & Hollenberg, P. F. 2002. The licorice root derived isoflavan glabridin inhibits the activities of human cytochrome P450s 3A4, 2B6 and 2C9. Drug Metabolism and
Disposition, 30, 709-715.
Kent, U. M., Juschyshyn, M. I. & Hollenberg, P. F. 2001. Mechanism-based inactivators as probes of
cytochrome P450 structure and function. Current Drug Metabolism, 2, 215-243.
Kenworthy, K. E., Bloomer, J. C., Clarke, S. E. & Houston, J. B. 1999. CYP3A4 drug interactions:
Correlation of 10 in vitro probe substrates. British Journal of Clinical Pharmacology, 48, 716-727.
Kerb, R., Aynacioglu, A. S., Brockmöller, J., Schlagenhaufer, R., Bauer, S., Szekeres, T., Hamwi, A.,
Fritzer-Szekeres, M., Baumgartner, C., Ongen, H. Z., Güzelbey, P., Roots, I. & Brinkman, U. 2001.
The predictive value of MDR1, CYP2C9, and CYP2C19 polymorphisms for phenytoin plasma
levels. Pharmacogenomics, 1, 204-210.

Chapter 7 – References 328
Kerr, B. M., Thummel, K. E., Wurden, C. J., Klein, S. M., Kroetz, D. L., Gonzalez, F. J. & Levy, R.
H. 1994. Human liver carbamazepine metabolism. Role of CYP3A4 and CYP2C8 in 10,11-epoxide
formation. Biochemical Pharmacology, 47, 1969-1979.
Khan, A. Y., Hossain, M. & Kumar, G. S. 2012. Binding of plant alkaloids berberine and palmatine to serum albumins: A thermodynamic investigation. Molecular Biology Reports, Epub ahead of print.
Kharasch, E. D., Mitchell, D. & Coles, R. 2008. Stereoselective bupropion hydroxylation as an in vivo
phenotypic probe for cytochrome P4502B6 (CYP2B6) activity. Journal of Clinical Pharmacology, 48,
464-474.
Kharasch, E. D., Walker, A., Hoffer, C. & Sheffels, P. 2005. Evaluation of first-pass cytochrome
P4503A (CYP3A) and P-glycoprotein activities using alfentanil and fexofenadine in combination.
Journal of Clinical Pharmacology, 45, 79-88.
Kim, B. H., Kim, K. P., Lim, K. S., Kim, J. R., Yoon, S. H., Cho, J. Y., Lee, Y. O., Lee, K. H., Jang,
I. J., Shin, S. G. & Yu, K. S. 2010. Influence of Ginkgo biloba extract in the pharmacodynamic
effects and pharmacokinetic properties of ticlopidine: An open-label, randomized, two-period, two-
treatment, two-sequence, single-dose crossover study in healthy Korean male volunteers. Clinical
Therapeutics, 32, 380-390.
Kim, R. B., Fromm, M. F., Wandel, C., Leake, B., Wood, A. J., Roden, D. M. & Wilkinson, G. R.
1998. The drug transporter P-glycoprotein limits oral absorption and brain entry of HIV-1 protease
inhibitors. Journal of Clinical Investigations, 101, 289-294.
Kimura, S., Umeno, M., Skoda, R. C., Meyer, U. A. & Gonzalez, F. J. 1989. The human debrisoquine
4-hydroxylase (CYP2D) locus: Sequence and identification of the polymorphic CYP2D6 gene, a
related gene, and a pseudogene. American Journal of Human Genetics, 45, 889-904.
Kinsunthorn, N., Petsom, A. & Nhujak, T. 2011. Determination of steroids adulterated in liquid herbal
medicines using QuEChERS sample preparation and high-performance liquid chromatography.
Journal of Pharmaceutical and Biomedical Analysis, 55, 1175-1178.
Kirchheiner, J. & Brockmöller, J. 2005. Clinical consequences of cytochrome P450 2C9
polymorphisms. Clinical Phamacology and Therapeutics, 77, 1-16.
Kitada, M., Taneda, M., Itahashi, K. & Kamataki, T. 1991. Four forms of cyochrome P-450 in human fetal liver: Purification and their capacity to activate promutagens. Japanese Journal of Cancer Research,
82, 426-432. Klaassen, C. 2008. Casarett and Doull's Toxicology- The basic science of poisons, McGraw-Hill.
Klein I, Sarkadi B & Váradi A 1999. An inventory of the human ABC proteins. Biochemica et Biophysica
Acta, 1461, 237-262.
Klingenberg, M. 1958. Pigments in rat liver microsomes. Archives of Biochemistry and Biophysics, 75, 376-
386.
Klose, T. S., Blaisdell, J. A. & Goldstein, J. A. 1999. Gene structure of CYP2C8 and extrahepatic
distribution of the human CYP2Cs. Journal of Biochemical and Molecular Toxicology, 13, 289-295.
Klotz, I. M. 1973. Physicochemical aspects of drug-protein interactions: A general perspective. Annals of
the New York Academy of Sciences, 226, 18-35.
Knodell, R. G., Hall, S. D., Wilkinson, G. R. & Guengerich, F. P. 1987. Hepatic metabolism of
tolbutamide: Characterization of the form of cytochrome P-450 involved in methyl hydroxylation
and relationship to in vivo disposition. The Journal of Pharmacology and Experimental Therapeutics, 241,
1112-1119.
Knudsen, A., Pedersen, A. O. & Brodersen, R. 1986. Spectroscopic properties of bilirubin-human
serum albumin complexes: A stoichiometric analysis. Archives of Biochemistry and Biophysics, 244,
273-284.
Kobayashi, K., Abe, S., Nakajima, M., Shimada, N., Tani, M., Chiba, K. & Yamamoto, T. 1999. Role
of human CYP2B6 in S-mephobarbital N-demethylation. Drug Metabolism and Disposition, 27, 1429-
1433.
Kobayashi, K., Kogo, M., Tani, M., Shimada, N., Ishizaki, T., Numazawa, S., Yoshida, T.,
Yamamoto, T., Kuroiwa, Y. & Chiba, K. 2001. Role of CYP2C19 in stereoselective hydroxylation
of mephobarbital by human liver microsomes. Drug Metabolism and Disposition, 29, 36-40.
Koch, I., Weil, R., Wolbold, R., Brockmöller, J., Hustert, E., Burk, O., Nuessler, A., Neuhaus, P.,
Eichelbaum, M., Zanger, U. & Wojnowski, L. 2002. Interindividual variability and tissue-specificity
in the expression of cytochrome P450 3A mRNA. Drug Metabolism and Disposition, 30, 1108-1114.
Kodama, H., Kodama, Y., Itokazu, N., Shinozawa, S., Kanemaru, R. & Sugimoto, T. 2001. Effect of
temperature on serum protein binding characteristics of phenytoin in monotherapy paediatric
patients with epilepsy. Journal of Clinical Pharmacy and Therapeutics, 26, 175-179.

Chapter 7 – References 329
Köhnke, M. D., Griese, E. U., Stösser, D., Gaertner, I. & Barth, G. 2002. Cytochrome P450 2D6
deficiency and its clinical relevance in a patient treated with risperidone. Pharmacopsychiatry, 35, 116-
118.
Koj A 1974. Acute-phase reactants: Their synthesis, turnover and biological significance. Structure and
Function of Plasma Proteins, 1, 73-125.
Kokubu, N., Cohen, D. & Wantanabe, T. 1997. Functional modulation of ATPase of P-glycoprotein by C219, a monoclonal antibody against P-glycoprotein. Biochemical and Biophysical Research
Communications, 230, 398-401.
Koop, D. R. & Tierney, D. J. 1990. Multiple mechanisms in the regulation of ethanol-inducible
cytochrome P450IIE1. Bioessays, 12, 429-435.
Kopecký V, Ettrich R, Hofbauerová K & Baumruk V 2003. Structure of human α1-acid glycoprotein
and its high-affinity binding site. Biochemical and Biophysical Research Communications, 300, 41-46.
Kopecký, V., Jr, Ettrich, R., Hofbauerová, K. & Baumruk, V. 2003. Structure of human α1-acid
glycoprotein and its high-affinity binding site. Biochemical and Biophysical Research Communications,
300, 41-46.
Kopitar, Z. & Weisenberger, H. 1971. Specific binding of dipyridamol on human serum protein.
Isolation, identification and characterization as alpha-1-acidic glycoprotein. Arzneimittelforschung, 21,
859-862.
Kragh-Hansen, U. 1985. Relations between high-affinity binding sites of markers for binding regions on
human serum albumin. The Biochemical Journal, 225, 629-638.
Kragh-Hansen, U., Chuang, V. T. G. & Otagiri, M. 2002. Practical aspects of the ligand-binding and
enzymatic properties of human serum albumin. Biological and Pharmaceutical Bulletin, 6, 695-704.
Kramer, M. A. & Tracy, T. S. 2008. Studying cytochrome P450 kinetics in drug metabolism. Expert
Opinion in Drug Metabolism and Toxicology, 4, 591-603.
Krauser, J. A. & Guengerich, F. P. 2005. Cytochrome P450 3A4-catalysed testosterone 6β-
hydroxylation stereochemistry, kinetic deuterium isotope effects, and rate-limiting steps. The Journal
of Biological Chemistry, 280, 19496-19506.
Kremer, J. M. H., Wilting, J. & Janssen, L. H. M. 1988. Drug binding to human alpha-1-acid
glycoprotein in health and disease. Pharmacological Reviews, 40, 1-47.
Kronbach, T., Mathys, D., Gut, J., Catin, T. & Meyer, U. A. 1987. High-performance liquid
chromatographic assays for bufuralol 1'-hydroxylase, debrisoquine 4-hydroxylase, and
dextromethorphan O-demethylase in microsomes and purified cytochrome P-450 isozymes of
human liver. Analytical Biochemistry, 162, 24-32.
Kronbach, T., Mathys, D., Umeno, M., Gonzalez, F. J. & Meyer, U. A. 1989. Oxidation of midazolam
and triazolam by human liver cytochrome P450IIIA4. Molecular Pharmacology, 36, 89-96.
Kullak-Ublick, G. A. & Becker, M. B. 2003. Regulation of drug and bile salt transporters in liver and
intestine. Drug Metabolism Reviews, 35, 305-317.
Külpmann, W. R., Gey, S., Gbeneking, M., Kohl, B. & Oellerich, M. 1984. Determination of total and free phenytoin in serum by non-isotopic immunoassays and gas chromatography. Journal of Clinical
Chemistry and Clinical Biochemistry, 22, 773-779.
Kunze, K. L. & Trager, W. F. 1993. Isoform-selective mechanism-based inhibition of cytochrome P450
1A2 by furfylline. Chemical Research in Toxicology, 6, 649-656.
Kurz, H., Trunk, H. & Weitz, B. 1977. Evaluation of methods to determine protein-binding of drugs.
Equilibrium dialysis, ultrafiltration, ultracentrifugation, gel filtration. Arzneimittel-Forschung, 27,
1373-1380.
Kuwano, M., Oda, Y., Izumi, H., Yang, S. J., Uchiumi, T., Iwamoto, Y., Toi, M., Fujii, T., Yamana,
H., Kinoshita, H., Kamura, T., Tsuenyoshi, M., Yasumoto, K. & Kohno, K. 2004. The role of nuclear Y-box binding protein 1 as a global marker in drug resistance. Molecular Cancer Therapeutics,
11, 1485-1492.
Lai, C. M., Moore, P. & Quon, C. Y. 1995. Binidng of fosphenytoin, phosphate ester pro drug of
phenytoin, to human serum proteins and competitive binding with carbamazepine, diazepam, phenobarbital, phenylbutazone, phenytoin, valproic acid or warfarin. Reserach Communications in
Molecular Pathology and Pharmacology, 88, 51-62.
Lai, X. S., Yang, L. P., Li, X. T., Liu, J. P., Zhou, Z. W. & Zhou, S. F. 2009. Human CYP2C8:
Structure, substrate specificty, inhibitor selectivity, inducers amd polymorphisms. Current Drug
Metabolism, 10, 1009-1047.

Chapter 7 – References 330
Lampen, A., Christians, U., Guengerich, F. P., Watkins, P. B., Kolars, J. C., Bader, A., Gonschior, A.
K., Dralle, H., Hackbarth, I. & Sewing, K. F. 1995. Metabolism of the immunosuppressant
tacrolimus in the small intestine: Cytochrome P450, drug interactions, and interindividual
variability. Drug Metabolism and Disposition, 23, 1315-1324.
Lankas, G. R., Cartwright, M. E. & Umbenhauer, D. 1997. P-glycoprotein deficiency in a subpopulation of CF-1 mice enhances avermectin-induced neurotoxicity. Toxicology and Applied
Pharmacology, 143, 357-365.
Lechevrel, M., Casson, A. G., Wolf, C. R., Hardie, L. J., Flinterman, M. B., Montesano, R. & Wild,
C. P. 1999. Characterization of cytochrome P450 expression in human oesophagel mucosa.
Carcinogenesis, 20, 243-248.
Lecluyse, E. L. 2001. Human hepatocyte culture systems for the in vitro evaluation of cytochrome P450
expression and regulation. European Journal of Pharmaceutical Sciences, 13, 343-368.
Lee, L. S., Andrade, A. S. A. & Flexner, C. 2006. Interactions between natural health products and
antiretroviral drugs: Pharmacokinetic and pharmacodynamic effects. Clinical Infectious Diseases, 43,
1052-1059.
Lee, S. S. T., Buters, J. T. M., Pineau, T., Fernandez-Salguero, P. & Gonzalez, F. J. 1996. Role of
CYP2E1 in the hepatotoxicity of acetaminophen. The Journal of Biological Chemistry, 271, 12063-
12067.
Lefebvre, T. & Foster, B. C. 2004. In vitro activity of commercial valerian root extracts against human
cytochrome P450 3A4. Journal of Pharmacology and Pharmaceutical Science, 7, 265-273.
Lehmann, J. M., Mckee, D. D., Watson, M. A., Wilson, T. M., J.T., M. & Kliewer, S. A. 1998. The
human orphan nuclear receptor PXR is activated by compounds that regulate CYP3A4 gene
expression and cause drug interactions. The Journal of Clinical Investigations, 102, 1016-1023.
Lehotský, J., Raeymaekers, L. & Casteels, R. 1992. Effects of dimethyl sulfoxide and polycationic
neomycin on stimulation of purified plasma membrane Ca2+-pump by negatively charged
phospholipids. General Physiology and Biophysics, 11, 567-577.
Lentner C 1984. Geigy scientific tables: Physical chemistry, blood haematology, somatometric data CIBA-
GEIGY Corporation.
Leslie E, Deeley R & Cole S 2005. Multidrug resistance proteins: role of P-glycoprotein, MRP1, MRP2,
and BCRP (ABCG2) in tissue defence. Toxicology and Applied Pharmacology, 204, 216-237.
Leung, S. & Bendayan, R. 1999a. Role of P-glycoprotein in the renal transport of dideoxynucleoside
analog drugs. Canadian Journal of Physiology and Pharmacology, 77, 625-630.
Lewis, D. F. V. 2004. 57 varieties: the human cytochromes P450. Pharmacogenomics, 5, 305-318.
Lewis, D. F. V. & Ito, Y. 2010. Human CYPs involved in drug metabolism: Structures, substrates and
binding affinities. Expert Opinion in Drug Metabolism and Toxicology, 6, 661-674.
Li, S. & Lloyd, D. K. 1993. Direct chiral separations by capillary electrophoresis using capillaries
packed with an alpha 1-acid glycoprotein chiral stationary phase. Analytical Biochemistry, 65, 3684-
3690.
Li, X. Q., Björkman, A., Andersson, T. B., Ridderström, M. & Masimirembwa, C. M. 2002.
Amodiaquine clearance and its metabolism to N-desethylamodiaquine is mediated by CYP2C8: A new high affinity and turnover enzyme-specific probe substrate. The Journal of Pharmacology and
Experimental Therapeutics, 300, 339-407.
Li, Z. H., Zhu, Y. J. & Lit, X. T. 1997. Wild-type p53 gene increases MDR1 gene expression but
decreases drug resistance in an MDR cell line KBV200. Cancer Letters, 119, 177-184.
Liang, Q., Ni, C., Yan, X., Xie, M., Zhang, Y., Yang, M., Peng, S. & Zhang, Y. 2010. Comprative
study on metabonomics and on liver and kidney toxicity of Aristolochia fanchi and Stephania
tetandra. Journal of Ethnopharmacology, 35, 2282-2288.
Libert C 1997. Acute phase protein as protective factors against the toxicity of tumour necrosis factor.
Verhandelingen_Konnklijke Academie voor Geneeskunde van België, 59, 515-523.
Lima, J. J., Mackichan, J. J., Libertin, N. & Sabino, J. 1983. Influence of volume shifts on drug binding equilibrium dialysis: Correction and attenuation. Journal of Pharmacokinetics and Biopharmaceuticals,
11, 483-498.
Liminga G, Nygren P & Larsson R 1994. Microfluormetric evaluation of calcein acetoxymethyl ester as
a probe for P-glycoprotein-mediated resistance: Effects of cyclosporin A and its
nonimmunosuppressive analoguw SDZ PSC 833. Experimental Cell Research, 212, 291-296.
Lin J 2003. Drug-drug interaction mediated by inhibition and induction of P-glycoprotein. Advanced
Drug Delivery Reviews, 55, 53-81.

Chapter 7 – References 331
Lin, J. H., Cocchetto, D. M. & Duggan, D. E. 1987. Protein binding as a primary determinant of the clinical pharmacokinetic properties of non-steroidal anti-inflammatory drugs. Clinical
Pharmacokinetics, 12, 402-432.
Lin, J. H. & Lu, A. Y. 1998. Inhibition and induction of cytochrome P450 and the clinical implications.
Clinical Pharmacokinetics, 35, 361-390.
Lin, J. H. & Lu, A. Y. 2001. Interindividual variability in inhibition and induction of cytcochrome
P450 enzymes. Annual Reviews of Pharmacology and Toxicology, 41, 535-567.
Lindberg, R. L. & Negishi, M. 1989. Alteration of mouse cytochrome P450coh substrate specificity by
mutation of a single amino-acid residue. Nature, 6226, 632-634.
Linton, K. J. & Higgins, C. F. 2007. Structure and function of ABC transporters: The ATP switch
provides flexible control. European Journal of Physiology, 453, 555-567.
Litman, T., Zeuthen, T., Skovsgaard, T. & Stein, W. D. 1997. Structure-activity relationships of P-
glycoprotein interacting drugs: Kinetic characterization of their effects on ATPase activity.
Biochimica et Biophysica Acta, 1361, 159-168.
Liu, J., Wang, X., Cai, Z. & Lee, F. S. C. 2008. Effect of tanshinone IIA on the noncovalent interaction
between warfarin and human serum albumin studies by electrospray ionization mass spectrometry.
Journal of the American Society for Mass Spectrometry, 19, 1568-1575.
Liu, J., Zacco, A., Piser, T. M. & Scott, C. W. 2002. Microplate gel-filtration method for radioligand-
binding assays. Analytical Biochemistry, 308, 127-133.
Liu, K. H., Kim, M. J., Jeon, B. H., Shon, J. H., Cha, I. J., Cho, K. H., Lee, S. S. & Shin, J. G. 2006.
Inhibition of human cytochrome P450 isoforms and NADPH-CYP reductase in vitro by 15 herbal
medicines, including Epimedii herba. Journal of Clinical Pharmacy and Therapeutics, 31, 83-91.
Lo Guidice, J. M., Marez, D., Sabbagh, N., Legrand-Andreoletti, M., Spire, C., Alcaide, E., Lafitte, J. J. & Broly, F. 1997. Evidence for CYP2D6 expression in human lung. Biochemical and Biophysical
Reaserach Communications, 241, 79-85.
Locuson, C. W., Rock, D. A. & Jones, J. P. 2004. Quantitative binding models for CYP2C9 based on
benzbromarone analogues. Biochemistry, 43, 6948-6958.
Loo, T. W., Bartlett, M. C. & Clarke, D. M. 2003. Methanethiosulfonate derivatives of rhodamine and
verapamil activate human P-glycoprotein at different sites. The Journal of Biologial Chemistry, 278,
50136-50141.
Loo, T. W., Bartlett, M. C. & Clarke, D. M. 2010. Human P-glycoprotein is active when the two halves are clamped together in the closed conformation. Biochemical and Biophysical Research
Communications, 395, 436-440.
Loo, T. W. & Clark, D. P. 1999. The transmembrane domains of the human multidrug resistance P-glycoprotein are sufficient to mediate drug binidng and trafficking to the cell surface. The Journal of
Biologial Chemistry, 274, 24759-24765.
Loo, T. W. & Clarke, D. M. 1999. Molecular dissection of the human multidrug resistance P-
glycoprotein. Biochemistry and Cell Biology, 77, 11-23.
Low, M. Y., Zeng, Y., Li, L., Ge, X. W., Lee, R., Bloodworth, B. C. & Koh, H. L. 2009. Safety and
quality assessment of 175 illegal sexual enhancement products seized in red-light districts in
Singapore. Drug Safety, 32, 1141-1146.
Lu, P., Liu, R. & Sharom, F. J. 2001. Drug transport by reconstituted P-glycoprotein in
proteoliposomes. Effect of substrates and modulators, and dependence on bilayer phase state.
European Journal of Biochemistry, 268, 1687-1697.
Ma, B., Prueksaritanont, T. & Lin, J. H. 2000. Drug interactions with calcium channel blockers: Possible involvement of metabolite-intermediate complexation with CYP3A. Drug Metabolism and
Disposition, 28, 125-130.
Mackichan, J. J. 1989. Protein binding drug displacement interactions: Fact or fiction? Clinical
Pharmacokinetics, 16, 65-73.
MacKiewicz, A., Ganapathi, M. K., Schultz, D. & Kushner, I. 1987a. Monokines regulate
glycosylation of acute-phase proteins. The Journal of Experimental Medicine, 166, 253-258.
MacKiewicz, A., Khan, M. A., Reynolds, T. L., Van Der Linden, S. & Kushner, I. 1989. Serum IgA,
acute phase proteins, and glycosylation of alpha 1-acid glycoprotein in ankylosing spondylitis.
Annals of the Rheumatic Disease, 48, 99-103.
MacKiewicz, A., Pawłowski, T., Mackiewicz-Pawłowska, A., Wiktorowicz, K. & Mackiewicz, S.
1987b. Microheterogeneity forms of alpha 1-acid glycoprotein as indicators of rheumatoid arthritis
activity. Clinica Chimica Acta, 163, 185-190.
MacLennan, A. H., Wilson, D. H. & Taylor, A. W. 2002. The escalating cost and prevalence of
alternative medicine. Preventative Medicine, 35, 166-173.

Chapter 7 – References 332
Madan, A., Usuki, E., Burton, L. A., Ogilvie, B. W. & Parkinson, A. 2002. In vitro approaches for
studying the inhibition of drug-metabolizing enzymes and identifying the drug-metabolizing enzymes responsible for the metabolism of drugs. In: RODRIGUES, A. D. (ed.) Drug-Drug
Interactions. New York: Marcel Dekker, Inc.
Madani, S., Paine, M. F., Lewis, L., Thummel, K. E. & Shen, D. D. 1999. Comparison of CYP2D6
content and metoprolol oxidation between microsomes isolated from human livers and small
intestines. Pharmaceutical Research, 16, 1199-1205.
Madeira, M., Levine, M., Chang, T. K., Mirfazaelian, A. & Bellward, G. D. 2004. The effect of
cimetidine on dextromethorphan O-demethylase activity of human liver microsomes and
recombinant CYP2D6. Drug Metabolism and Disposition, 32, 460-467.
Mahesha, H. G., Singh, S. A., Srinivasan, N. & Appu Rao, A. G. 2006. A spectroscopic study of the
interaction of isoflavones with human serum albumin. FEBS Journal, 273, 451-467.
Maliepaard, M., Scheffer, G. L., Faneyte, I. F., Van Gastelen, M. A., Pijnenborg, A. C., Schinkel, A.
H., Van De Vijver, M. J., Scheper, R. J. & Schellens, J. H. 2001. Subcellular localization and distribution of the breast cancer resistance protein transporter in normal human tissues. Cancer
Research, 61, 3458-3464.
Manchester, D. K., Gordon, S. K., Golas, C. L., Roberts, E. A. & Okey, A. B. 1987. Ah receptor in
human placenta: Stabilization by molybdate and characterization of binding 2,3,7,8-
Tetrochlorodibenzo-p-dioxin, 3-Methylcholanthrene, and Benzo(a)pyrene. Cancer Research, 47, 4861-
4868.
Mapleson, W. W. 1987. Computation of the effect of Donnan equilibrium on pH in equilibrium
dialysis. Journal of Pharmacological Methods, 17, 231-242.
Markowitz, J. S., Donovan, J. L., Devane, C. L., Taylor, R. M., Ruan, Y., Wang, J. S. & Chavin, K. D. 2003. Multiple doses of saw palmetto (Serona repens) did not alter cytochrome P450 2D6 and 3A4
activity in normal volunteers. Clinical Pharmacology and Therapeutics, 74, 536-542.
Martin, C., Berridge, G., Higgins, C. F. & Callaghan, R. 1997. The multi-drug resistance agent
SR33557 and modulation of vinca alkaloid binding to P-glycoprotein by an allosteric interaction.
British Journal of Pharmacology, 122, 765-771.
Martin, C., Berridge, G., Higgins, C. F., Mistry, P., Charlton, P. & Callaghan, R. 2000.
Communication between multiple drug binding sites on P-glycoprotein. Molecular Pharmacology, 58,
624-632.
Martínez, C., Blanco, G., Ladero, J. M., García-Martín, E., Taxonera, C., Gamito, F. G., Diaz-Rubio,
M. & Agúndez, J. A. 2004. Genetic predisposition to acute gastrointestinal bleeding after NSAIDs
use. British Journal of Clinical Pharmacology, 141, 205-208.
Maruyama, T., Otagiri, M. & Takadate, A. 1990. Characterization of drug binding sites on α1-acid
glycoprotein. Chemical and Pharmaceutical Bulletin, 38, 1688-1691.
Mason, H. S., Fowlks, W. L. & Peterson, E. 1955. Oxygen transfer and electron transport by the
phenolase complex. Journal of the American Chemical Society, 77, 2914-2915.
Matsumoto, K., Sukimoto, K., Nishi, K., Maruyama, T., Suenaga, A. & Otagiri, M. 2002.
Characterization of ligand binidng sites on the alpha-1 acid glycoproteins in human, bovines and
dogs. Drug Metabolism and Pharmacokinetics, 17, 300-306.
Matthews, M. K. 1998. Association of Ginkgo biloba with intracerebral hemorrhage. Neurology, 50,
1933-1934.
Mayhew, B. S., Jones, D. R. & Hall, S. D. 2000. An in vitro model for predicting in vivo inhibition of cytochrome P450 3A4 by metabolic intermediate complex formation. Drug Metabolism and
Disposition, 28, 1031-1037.
Mazzio, E. A. & Soliman, K. F. 2009. In vitro screening for the tunoricidal properties of international
medicinal herbs. Phytotherapy Research, 23, 385-398.
McGinnity, D. F., Griffin, S. J., Moody, G. C., Voice, M., Hanlon, S., Friedberg, T. & Riley, R. J.
1999. Rapid characterization of the major drug-metbaolizing human hepatic cytcochrome P-450
enzymes expressed in Escherichia coli. Drug Metabolism and Disposition, 27, 1017-1023.
McMenamy, R. H. & Oncley, J. L. 1958. The specific binding of L-tryptophan to serum albumin. The
Journal of Biological Chemistry, 233, 1436-1447.
McNamara, P. J., Brouwer, K. R. & Gillespie, M. N. 1986. Autacoid binding to serum proteins.
Interactions of platelet activating factor (PAF) with human serum alpha-1-acid glycoprotein (AAG).
Biochemical Pharmacology, 35, 621-624.

Chapter 7 – References 333
Mega, J. L., Close, S. L., Wiviott, S. D., Shen, L., Walker, J. R., Simon, T., Antman, E. M.,
Braunwald, E. & Sabatine, M. S. 2010. Genetic variants in ABCB1 and CYP2C19 and
cardiovascular outcomes after treatment with clopidogrel and prasugrel in the TRITON-TIMI 38
trial: A pharmacogenetic analysis. Lancet, 376, 1312-1319.
Mercer, D. F., Schiller, D. E., Elliott, J. F., Douglas, D. N., Hao, C., Rinfret, A., Addison, W. R.,
Fischer, K. P., Churchill, T. A., Lakey, J. R., Tyrrell, D. L. & Kneteman, N. M. 2001. Hepatitis C
virus replication in mice with chimeric human livers. Nature Medicine, 7, 927-933.
Michalets, E. L. 1998. Update: Clinically significant cytochrome P450 drug interactions.
Pharmacotherapy, 18, 84-112.
Mickley, L. A., Lee, J. S., Weng, Z., Zhan, Z., Alvarez, M., Wilson, W., Bates, S. E. & Fojo, T. 1998.
Genetic polymorphism in MDR-1: A tool for examining allelic expression in normal cells,
unselected and drug-selected cell lines, and human tumours. Blood, 91, 1749-1756.
Miller, D. B. & Spence, J. D. 1998. Clinical pharmacokinetics of fibric acid derivatives (fibrates).
Clinical Pharmacokinetics, 34, 155-162.
Miners, J. O. & Birkett, D. J. 1998. Cytochrome P4502C9: An enzyme of major importance in human
drug metabolism. British Journal of Clinical Pharmacology, 45, 525-538.
Miyazaki, M., Kohno, K., Uchimui, T., Tanimura, H., Matsuo, K., Nasu, M. & Kuwano, M. 1992a.
Activation of human multidrug resistance-1 gene promoter in response to heat shock stress.
Biochemical and Biophysical Research Communications, 187, 677-684.
Molassiotis, A., Fernadez-Ortega, P., Pud, D., Ozden, G., Scott, J. A., Panteli, V., Margulies, A.,
Browall, M., Magri, M., Selvekerova, S., Madsen, E., Milovics, L., Bruyns, I., Gudmundsottir, G.,
Hummerston, S., Ahmad, A. M., Platin, N., Kearney, N. & Patiraki, E. 2005. Use of complementary and alternative medicine in cancer patients: A European survey. Annals of Oncology,
16, 655-663.
Moody, G. C., Griffin, S. J., Mather, A. N., Mcginnity, D. F. & Riley, R. J. 1999. Fully automated
analysis of activities catalysed by the major human liver cytochrome P450 (CYP) enzymes:
Assessment of human CYP inhibition potential. Xenobiotica, 29, 53-75.
Moore D, Rosenfeld M, Gribbon P, Winlove C & Tsai C 1997. Alpha-1-acid (AAG, orosomucoid)
glycoprotein: Interaction with bacterial lipopolysaccharide and protection from sepsis. Inflammation,
21, 69-82.
Morgan, E. T. 1997. Regulation of cytochromes P450 during inflammation and infection. Drug
Metabolism Reviews, 29, 1129-1188.
Morin, D., Simon, N., Deprés-Brummer, P., Lévi, F., Tillement, J. P. & Urien, S. 1997. Melatonin
high-affinity binding to alpha-1-acid glycoprotein in human serum. Pharmacology, 54, 271-275.
Muller, N., Lapicque, F., Drelon, E. & Netter, P. 1994. Binding sites of flourescent probes on human
serum albumin. The Journal of Pharmacy and Pharmacology, 46, 300-304.
Müller, W. E. 1989. Drug binding sites on human alpha-1-acid glycoprotein. Progress in Clinical and
Biological Research, 300, 363-378.
Murray, B. P. & Correia, M. A. 2001. Ubiquitin-dependent 26S proteasomal pathway: A role in the degradation of native human liver CYP3A4 expressed in Saccharomyces cerevisiae? Archives of
Biochemistry and Biophysics, 393, 106-116.
Murray, M. & Reidy, G. F. 1990a. Selectivity in the inhibition of mammalian cytochromes P-450 by
chemical agents. Pharmacological Reviews, 42, 85-101.
Muruyama, T., Furuie, M. A., Hibino, S. & Otagiri, M. 1992. Comparative study of interaction mode of diazepines with human serum albumin and alpha 1-acid glycoprotein. Journal of Pharmaceutical
Sciences, 81, 16-20.
Nakajima, M., Yamamoto, T., Nunoya, K., Yokoi, T., Nagashima, K., Inoue, K., Funae, Y., Shimada,
N., Kamataki, T. & Kuroiwa, Y. 1996. Role of human cytochrome P4502A6 in C-oxidation of
nicotine. Drug Metabolism and Disposition, 24, 1212-1217.
Narasimhan, S., Freed, J. C. & Schachter, H. 1986. The effect of a "bisecting" N-acetylglucosaminyl
group on the binding of biantennary, complex oligosaccharides to concanavalin A, Phaseolus
vulgaris erythroagglutinin (E-PHA), and Ricinus communis agglutinin (RCA-120) immobilized on
agarose. Carbohydrate Research, 149, 65-83.
Narita, S., Tasaki, T. & Kitagawa, T. 1989. Application of flourescent triazoles of analytical chemistry
IV. Development of a new flouresnce probe of basic drug alpha 1-acid glycoprotein binding
measurement. Chemical & Pharmaceutical Bulletin, 37, 1009-1012.
Nebert, D. W., Dalton, T. P., Okey, A. B. & Gonzalez, F. J. 2004. Role of aryl hydrocarbon receptor-
mediated induction of the CYP1 enzymes in environemental toxicity and cancer. The Journal of
Biological Chemistry, 279, 23847-23850.

Chapter 7 – References 334
Nebert, D. W., Roe, A. L., Dieter, M. Z., Solis, W. A., Yang, Y. & Dalton, T. P. 2000. Role of the
aromatic hydrocarbon receptor an [Ah] gene battery in the oxidative stres response, cell cycle
control, and apoptosis. Biochemical Pharmacology, 59, 65-85.
Nelson, D. R. 2009. The cytochrome P450 homepage.
Nelson, D. R., Kamataki, T., Waxman, D. J., Guengerich, F. P., Estabrrok, R. W., Feyereisen, R.,
Gonzalez, F. J., Coon, M. J., Gunsalus, I. C. & Gotoh, O. 1993. The P450 superfamily: Update on
new sequences, gene mapping, accession numbers, early trivial names of enzymes, and
nomenclature. DNA Cell Biology, 12, 1-51.
Nelson, S. D. 1982. Metabolic activation and drug toxicity. Journal of Medicinal Chemistry, 25, 753-765.
Ng, T. B. & Wang, H. X. 2005. Pharmacological actions of Cordyceps, a prized folk medicine. The
Journal of Pharmacy and Pharmacology, 57, 1509-1519.
NICM. 2009. Facts and Statistics. In: MEDICINE, T. N. I. O. C. (ed.) Understanding CM. Sydney.
Nicollet, I., Lebreton, J. P., Fontaine, M. & Hiron, M. 1981. Evidence for alpha-1-acid glycoprotein
populations of different pI values after concanavalin A affinity chromatography. Study of their
evolution during inflammation in man. Biochimica et Biophysica Acta, 668, 235-245.
Niemi, M., Kojosaari, L. I., Neuvonen, M., Backman, J. T. & Neuvonen, P. J. 2003. The CYP2C8 inhibitor trimethoprim increases the plasma concentrations of repaglinide in healthy subjects. British
Journal of Clinical Pharmacology, 57, 441-447.
Noctor, T. A., Diaz-Perez, M. J. & Wainer, I. W. 1993. Use of human serum albumin-based stationary
phase for high-performance liquid chromatography as a tool for the rapid determination of drug-
plasma protein binding. Journal of Pharmaceutical Sciences, 82, 675-676.
Nogueira Neto, J., Cavalcante, F. L., Carvalho, R. A., Rodrigues, T. G., Xavier, M. S., P.G., F. &
Schor, E. 2011. Contraceptive effect of Uncaria tomentosa (Cat's claw) in rats with experimental
endometriosis. Acta Cirurgica Brasileria, 26, 15-19.
Ochs, H. R., Greenblatt, D. J., Roberts, G. M. & Dengler, H. J. 1981. Diazepam interaction with
antituberculosis drugs. Clinical Pharmacology and Therapeutics, 29, 671-678.
Ogilvie, B. W., Usuki, E., Yerino, P. & Parkinson, A. 2008. In vitro approaches for studying the
inhibition of drug-metabolizing enzymes and identifying the drug-metabolizing enzymes responsible
for the metabolism of drugs (reaction phenotyping) with emphasis on cytochrome P450. In:
RODRIGUES, A. D. (ed.) Drug-drug interactions. 2nd ed.: Informa Healthcare.
Ohyama, K., Nakajima, M., Nakamura, S., Shimada, N., Yamazaki, H. & Yokoi, T. 2000. A
significant role of human cytochrome P450 2C8 in amiodarone N-deethylation: An approach to
predict the contribution with relative activity factor. Drug Metabolism and Disposition, 28, 1303-1310.
Omura, T. & Sato, R. 1962. A new cytochrome in liver microsomes. The Journal of Biological Chemistry,
237, 1375-1376.
Omura, T. & Sato, R. 1964a. The carbon monoxide-binding pigment of liver microsomes. I Evidence
for its hemoprotein nature. The Journal of Biological Chemistry, 239, 2370-2378.
Omura, T. & Sato, R. 1964b. The carbon monoxide-binding pigment of liver microsomes. II
Solubilization, purification, and properties. The Journal of Biological Chemistry, 239, 2379-2385.
Ong, C. E., Miners, J. O., Birkett, D. J. & Bhasker, C. R. 1998. Baculovirus-mediated expression of
cytochrome P4502C8 and human NADPH-cytochrome P450 reductase: Optimization of protein
expression. Xenobiotica, 28, 137-152.
Ongay, S. & Neusüss, C. 2010. Isoform differentiation of intact AGP from human serum by capillary
electrophoresis-mass spectrometry. Analytical and Bioanalytical Chemistry, 39, 845-855.
Onica, T., Nichols, K., Larin, M., Ng, L., Maslen, A., Dvorak, Z., Pascussi, J. M., Vilarem, M. J.,
Maurel, P. & Kirby, G. M. 2008. Dexamethasone-mediated up-regulation of human CYP2A6 involves the glucocorticoid receptor and increased binding of hepatic nuclear factor 4α to the
proximal promoter. Molecular Pharmacology, 72, 451-460.
Oracová, J., Böhs, B. & Linder, W. 1996. Drug-protein binding studies. New trends in analytical and
experimental methodology. Journal of Chromatography B, 677, 1-28.
Orme-Johnson, W. H. & Ziegler, D. M. 1965. Alcohol mixed function oxidase activity of mammalian
liver microsomes. Biochemical and Biophysical Research Communications, 21, 78-82.
Ortiz De Montellano, P. R., Yost, G. S., Mico, B. A., Dinizo, S. E., Correia, M. A. & Kumbara, H.
1979. Destruction of cytochrome P-450 by 2-isopropyl-4-pentenamide and methyl 2-isopropyl-4-
pentnoate: Mass spectrometric characterization of prosthetic heme adducts and nonparticipation of
eoxide metabolites. Archives of Biochemistry and Biophysics, 197, 524-533.

Chapter 7 – References 335
Ouedraogo, M., Baudoux, T., Stévigny, C., Nortier, J., Colet, J. M., Efferth, T., Qu, F., Zhou, J.,
Chan, K., Shaw, D., Pelkonen, O. & Duez, P. 2012. Review of current and "omics" methods for
assessing the toxicity (gentoxicity, teratogenicity and nephrotoxicity) of herbal medicines and
mushrooms. Journal of Ethnopharmacology, 140, 492-512.
Pan, Y., Abd-Rashid, B. A., Ismail, Z., Ismail, R., Mak, J. W., Pook, P. C. K., Er, H. M. & Ong, C. E.
2010. In vitro modulatory effects on three major human cytochrome P450 enzymes by multiple
active constituents and extracts of Centella asiatica. Journal of Ethnopharmacology, 130, 275-283.
Panchagnula, R. 1998. Pharmaceutical aspects of paclitaxel. International Journal of Pharmaceutics, 172,
1-15.
Panwala, C. M., Jones, J. C. & Viney, J. L. 1998. A novel model of inflammatory bowel disease: Mice deficient for the multiple drug resistane gene, mdr1a, spontaneously develop colitis. Journal of
Immunology, 161, 5733-5744.
Parikh, H., Mcelwain, K., Balasubramanian, V., Leung, W., Wong, D., Morris, M. & Ramanathan, M.
2000. A rapid spectrofluorimetric technique for determining drug-serum protein binding suitable for
high-throughput screening. Pharmaceutical Research, 17, 632-637.
Park, Y. H., Kullberg, M. P. & Hinsvark, O. N. 1984. Quantitative determination of dextromethorphan and three metabolites in urine by reverse-phase high-performance liquid chromatography. Journal of
Pharmaceutical Science, 73, 24-29.
Parke, D. V. & Ioannides, C. 1994. The effects of nutrition on chemical toxicity. Drug Metabolism
Reviews, 26, 739-765.
Parkinson, A., Kazmi, F., Buckley, D. B., Yerino, P., Ogilvie, B. W. & Paris, B. L. 2010. System-
dependent outcomes during the evaluation of drug candidates of cytochrome P450 (CYP) and
uridine diphosphate glucuronosyltransferase (UGT) enzymes: Human hepatocytes versus liver
microsomes versus recombinant enzymes. Drug Metabolism and Pharmacokinetics, 25, 16-27.
Paterson, S. C., Lim, C. K. & Smith, K. D. 2003. Analysis of the interaction between alpha-1-acid
glycoprotein and tamoxifen and its metabolites. Biomedical Chromatography, 17, 143-148.
Pearce, H. L., Safa, A. R., Bach, N. J., Winter, M. A., Cirtain, M. C. & Beck, W. T. 1989. Essential
features of the p-glycoprotein pharmacophore as defined by a series of reserpine analogs that
modulate multidrug resistance. Proceedings of the National Academy of Sciences of the United States of
America, 86, 5128-5132.
Pelkonen, O., Kaltiala, E. H., Larmi, T. K. & Kärki, N. T. 1974. Cytochrome P450-linked monooxygenase system and drug-induced spectral interactions in human liver microsomes. Chemico-
Biological Interactions, 9, 205-216.
Pelkonen, O., Mäenpää, J., Taavitsainen, P., Rautio, A. & Raunio, H. 1998. Inhibition and induction
of human cytochrome P450 (CYP) enzymes. Xenobiotica, 28, 1203-1253.
Pelkonen, O. & Raunio, H. 2005. In vitro screening of drug metabolism during drug development: Can
we trust the predictions? Expert Opinion in Drug Metabolism and Toxicology, 1, 49-59.
Pelkonen, O. & Turpeinen, M. 2007. In vitro- in vivo extrapolation of hepatic clearance: Biological
tools, scaling factors, model assumptions and correct concentrations. Xenobiotica, 37, 1066-1089.
Pelkonen, O., Turpeinen, M., Uusitalo, J., Rautio, A. & Raunio, H. 2005. Prediction of drug metabolism and interactions on the basis of in vitro investigations. Basic & Clinical Pharmacology &
Toxicology, 96, 167-175.
Pelkonen, O. P., Turpeinen, M., Hakkola, J., Honkakoski, P., Hukkanen, J. & Raunio, H. 2008.
Inhibition and induction of human cytochrome P450 enzymes: Current status. Archives of Toxicology,
82, 667-715.
Perloff, M. D., Von Moltke, L. L., Störmer, E., Shader, R. I. & Greenblatt, D. J. 2001. St John's wort: An in vitro analysis of P-glycoprotein induction due to extended exposure. British Journal of
Pharmacology, 134, 1601-1608.
Perucca E & Crema A 1982. Plasma protein binding of drugs during pregnancy. Clinical
Pharmacokinetics, 7, 336-352.
Peter, R., Böcker, R., Beaune, P. H., Iwasaki, M., Guengerich, F. P. & Yang, C. S. 1990.
Hydroxylation of chlorzoxazone as a specific probe for human liver cytochrome P-450IIE1.
Chemical Research in Toxciology, 3, 566-573.
Peters, T. 1985. Serum Albumin. Advances in Protein Chemistry, 37, 161-245.
Peters, T. 1996. All about albumin, biochemistry, genetics and medical applications, New York, Academic
Press. Peters T Jr 1996. All about albumin. Biochemistry, genetics and medical applications., San Diego, California,
Academic Press.

Chapter 7 – References 336
Piafsky, K. M., Borgá, O., Odar-Cederlöf, I., Johansson, C. & Sjöqvist, F. 1978. Increased plasma
protein binding of propranolol and chlorpromazine mediated by disease-induced elevations of
plasma alpha1 acid glycoprotein. New England Journal of Medicine, 299, 1435-1439.
Poland, A. & Glover, E. 1976. Stereospecific, high affinity binding of 2,3,7,8-Tetrachlorodibenzo-p-
dioxin by hepatic cytosol. The Journal of Biological Chemistry, 251, 4936-4946.
Polli. J, Wring. S, Humphreys. J, Huang, L., Morgan. J, Webster. L & Serabjit-Singh. C 2001b. Rational use of in vitro P-glycoprtoein assays in drug discovery. The Journal of Pharmacology and
Experimental Therapeutics, 299, 620-628.
Ponganis, K. V. & Stanski, D. R. 1985. Factors affecting the measurement of lidocaine protein binding
by equilibrium dialysis in human serum. Journal of Pharmaceutical Sciences, 74, 57-60.
Qi, L. W., Wang, C. Z., Du, G. J., Zhang, Z. Y., Calway, T. & Yuan, C. S. 2011. Metabolism of
Ginseng and its interactions with drugs. Current Drug Metabolism, 12, 818-822.
Qu, Q., Russell, P. L. & Sharom, F. J. 2003. Stoichiometry and affinity of nucleotide binding to P-
glycoprotein during the catalytic cycle. Biochemistry, 42, 1170-1177.
Rabehi L, Ferriere F, Saffar L & Gattegno L 1995. Alpha-1-acid glycoprotein binds human immunodeficiency virus type 1 (HIV-1) envelope glycoprotein via N-linked glycans. Glycoconjugate
Journal, 12, 7-16.
Rae, J. M., Johnson, M. D., Lippman, M. E. & Flockhart, D. A. 2001. Rifampin is a selective,
pleiotropic inducer of drug metabolism genes in human hepatocytes: Studies with cDNA and
oligonucleotide expression arrays. The Journal of Pharmacology and Experimental Therapeutics, 299,
849-857.
Rahman, A., Korzekwa, K. R., Grogan, J., Gonzalez, F. J. & Harris, J. W. 1994. Selective
biotransformation of taxol to 6α-hydroxytaxol by human cytochrome P450 2C81. Cancer Research,
54, 5543-5546.
Rahman, M. H., Maruyama, T., Okada, T., Yamasaki, K. & Otagiri, M. 1993. Study of interaction of
carprofen and its enantiomers with human serum albumin-1: Mechanism of binding studied by
dialysis and spectroscopic methods. Biochemical Pharmacology, 46, 1721-1731.
Rakhmanina, N. Y. & Van Den Anker, J. N. 2010. Efavirenz in the therapy of HIV infection. Expert
Opinion in Drug Metabolism and Toxicology, 6, 95-103.
Rao, M. M., Kumarmeena, A. & A., G. 2011. Detection of toxic heavy metals and pesticide residue in herbal plants which are commonly used in herbal formulations. Environmental and Monitoring
Assessments, 181, 267-271.
Rao, R. N., Parimala, P., Khalid, S. & Alvi, S. N. 2004. Detection of the adulteration of traditional
alcoholic beverages by the serparation and determination of alprazolam, chloralhydrate and
diazepam using reverse-phase high-performance liquid chromatography. Analytical Sciences, 20, 383-
386.
Raucy, J. L., Mueller, L., Duan, K., Allen, S. W., Strom, S. & Lasker, J. M. 2002. Expression and induction of CYP2C P450 enzymes in primary cultures of human hepatocytes. The Journal of
Pharmacology and Experimental Therapeutics, 302, 475-482.
Raunio, H., Hakkola, J. & Pelkonen, O. 2005. Regulation of CYP3A genes in the human respiratory
tract. Chemico-Biological Interactions, 151, 53-62.
Raunio, H., Rautio, A., Gullstén, H. & Pelkonen, O. 2001. Polymorphisms of CYP2A6 and its
practical consequences British Journal of Clinical Pharmacology, 52, 357-363.
Raunio, H., Syngelmä, T., Pasanen, M., Juvonen, R., Honkakosk, I. P., Kairaluoma, M. A.,
Sotaniemi, E., Lang, M. A. & Pelkonen, O. 1988. Immunochemical and catalytical studies on
hepatic coumarin 7-hydroxylase in man, rat, and mouse. Biochemical Pharmacology, 37, 3889-3895.
Rautio, J., Humphreys, J., Webster, L., Balakrishnan, A., Keogh, J., Kunta, J., Serabjit-Singh, C. &
Poli, J. 2006. In vitro p-glycoprotein inhibition assays for assessment of clinical drug interaction potential of new drug candidates: A recommendation for probe substrates. Drug Metabolism and
Disposition, 34, 786-792.
Raynes, J. 1982. Variations in the relative proportions of microheterogeneous forms of plasma
glycoproteins in pregnancy and disease. Biomedicine & Pharmacotherapy, 36, 77-86.
Rendic, S. 2002. Summary of information on human CYP enzymes: Human P450 metabolism data.
Drug Metabolism Reviews, 34, 83-448.
Renton, K. W. 2005. Regulation of drug metabolism and disposition during inflammation and
infection. Expert Opinion in Drug Metabolism and Toxicology, 1, 629-640.
Rettie, A. E. & Jones, J. P. 2005. Clinical and toxicological relevance of CYP2C9: Drug-drug
interactions and pharmacogenetics. Annual Reviews of Pharmacology and Toxicology, 45, 477-494.

Chapter 7 – References 337
Rettie, A. E., Wienkers, L. C., Gonzalez, F. J., Trager, W. F. & Korzekwa, K. R. 1994. Impaired (S)-
warfarin metabolism catalysed by the R144C allelic variant of CYP2C9. Pharmacogenetics, 4, 39-42.
Richardson, M. A., Sanders, T., Palmer, J. L., Greisinger, A. & Singletary, S. E. 2000.
Complementary/alternative medicine use in a comprehensive cancer center and the implications for
oncology. Journal of Clinical Oncology, 18, 2505-2514.
Richter, C. A., Tillitt, D. E. & Hannink, M. 2001. Regulation of subcellular localization of the aryl
hydrocarbon receptor (AhR). Archives of Biochemistry and Biophysics, 389, 207-221.
Robertson, G. R., Field, J., Goodwin, B., Bierach, S., Tran, M., Lehnert, A. & Liddle, C. 2003.
Transgenic mouse models of human CYP3A4 gene regulation. Molecular Pharmacology, 64, 42-50.
Robinson, M. M. & Zhang, X. 2011. Traditional medicines: Global situation, issues and challenges. In:
WHO/EMP/MIE (ed.) The World Medicines Situation 2011. Geneva: World Health Organization.
Rodrigues, A. D. 1999. Integrated cytochrome P450 reaction phenotyping: Attempting to bridge the gap between cDNA-expressed cytochromes P450 and native human liver microsomes. Biochemical
Pharmacology, 57, 465-480.
Rodríguez-Antona, C., Donato, M. T., Boobis, A. R., Edwards, R. J., Watts, P. S., Castell, J. V. &
Gómez-Lechón, M. J. 2002. Cytcochrome P450 expression in human hepatocytes and hepatoma
cell lines: Molecular mechanisms that determine lower expression in cultured cells. Xenobiotica, 32,
505-520.
Rolan, P. E. 1994. Plasma protein binding displacement interactions- why are they still regarded as
clinically important? British Journal of Clinical Pharmacology, 37, 125-128.
Rowland, M. & Tozer, T. N. 2010. Clinical pharmacokintics and pharmacodynamics: Concepts and
applications, Philadelphia, Lippincott Williams & Wilkins.
Ruetz, S. & Gros, P. 1994. Phosphatidylcholine translocase: A Physiological role of the mdr2 gene.
Cell, 77, 1071-1081.
Sakaeda, T., Nakamura, T., Horinouchi, M., Kakumoto, M., Ohmoto, N., Sakai, T., Morita, Y.,
Tamura, T., Aoyama, N., Hirai, M., Kasuga, M. & Okumura, K. 2001. MDR1 genotype-related
pharmacokinetics of digoxin after single oral administration in healthy Japanese subjects.
Pharmaceutical Research, 10, 1400-1404.
Salminen, K. A., Meyer, A., Jerabkova, L., Korhonen, L. E., Rahnasto, M., Juvonen, R. O., Imming,
P. & Raunio, H. 2011. Inhibition of human drug metabolizing cytochrome P450 enzymes by plant
isoquinoline alkaloids. Phytomedicine, 18, 533-538.
Sarma, A. V., Dunn, R. L., Lange, L. A., Ray, A., Wang, Y., Lange, E. M. & Cooney, K. A. 2008.
Genetic polymorphisms in CYP17, CYP3A4, CYP19A1, SRD5A2, IGF-1, and IGFBP-3 and
prostate cancer risk in African-American men: The Flint men's health study. Prostate, 68, 296-305.
Satarug, S., Ujjin, P., Vanavanitkun, Y., Nishijo, M., Baker, J. R. & Moore, M. R. 2004. Effects of
cigarette smoking and exposure to cadmium and lead on phenotypic variability of hepatic CYP2A6
and renal function biomarkers in men. Toxicology, 204, 161-173.
Schaub, T. P., Kartenbeck, J., König, J., Spring, H., Dörsam, J., Staehler, G., Störkel, S., Thon, W. F.
& Keppler, D. 1999. Expression of the MRP2 gene-encoded conjugate export pump in human
kidney proximal tubules and in renal cell carcinoma. Journal of American Society of Nephrology, 10,
1159-1169.
Scheffer, G. L., Pijnenborg, A. C., Smit, A. C., Müller, M., Postma, D. S., Timens, W., Van Der Valk,
P., De Vries, E. G. & Scheper, R. J. 2002. Multidrug resistance related molecules in human and
murine lung. Journal of Clinical Pathology, 55, 332-339.
Schiff, D., Chan, G. & Stern, L. 1972. Sephadex G-25 quantitative estimation of free bilirubin potential in jaundiced newborn infants sera: A guide to the prevention of kernicterus. The Journal of Laboratory
and Clinical Medicine, 80, 455-462.
Schill, G., Wainer, I. W. & Barkan, S. A. 1986. Chiral separations of cationic and anionic drugs on an
alpha 1-acid glycoprotein-bonded stationary phase (EnantioPac). Influence of mobile phase
additives and pH on chiral resolution and retention. Journal of Chromatography, 365, 73-88.
Schinkel, A. H., Mayer, U., Wagenaar, E., Mol, C. A., Van Deemter, L., Smit, J. J., Van Der Valk, M.
A., Voordouw, A. C., Spits, H., Van Tellingen, O., Zijlmans, J. M., Fibbe, W. E. & Borst, P. 1997.
Normal viability and altered pharmacokinetics in mice lacking mdr1-type (drug-transporting) P-
glycoproteins. Proceedings of the National Academy of Sciences of the United States of America, 94, 4028-
4033.
Schinkel, A. H., Smit, J. J., Van Tellingen, O., Beijnen, J. H., Wagenaar, E., Van Deemter, L., Mol, C.
A., Van Der Valk, M. A., Robanus-Maandag, E. C. & Te Riele, H. P. 1994. Disruption of the
mouse mrd1a P-glycoprotein gene leads to a deficiency in the blood-brain barrier and to increased
sensitivity to drugs. Cell, 77, 491-502.

Chapter 7 – References 338
Schley, J. & Müller-Oerlinghausen, B. 1983. The binding of chemically different psychotropic drugs to
alpha 1-acid glycoprotein. Pharmacopsychiatria, 16, 82-85.
Schmid, K. 1950. Preparation and properties of an acid glycoprotein prepared from human plasma.
Journal of the American Chemical Society, 72, 2816.
Schmid, K. 1953. Preperation and properties of serum and plasma proteins. XXXIX. Seperation from
human plasma of polysaccharides, peptides and proteins of low molecular weight. Crystallization of
an acid glycoprotein. Journal of the American Chemical Society, 75, 60-68.
Schmid, K., Kaufmann, H., Isemura, S., Bauer, F., Emura, J., Motoyama, T., Ishiguro, M. & Nanno, S. 1973a. Structure of α1-acid glycoprotein. The complete amino acid sequence, multiple amino acid
substitutions, and homolgy with the immunoglobulins. Biochemistry, 12, 2711-2724.
Schmid, K., Nimberg, B., Kimura, A., Yamaguchi, H. & Binette, J. P. 1977. The carbohydrate units of
human plasma α1-acid glycoprotein. Biochemica et Biophysica Acta, 492, 291-302.
Schoch, G. A., Yano, J. K., Wester, M. R., Griffin, K. J., Stout, C. D. & Johnson, E. F. 2004. Structure of human microsomal cytochrome P450 2C8. Evidence for a peripheral fatty acid binding site. The
Journal of Biological Chemistry, 279, 9497-9503.
Schön, A., Del Mar Ingaramo, M. & Freire, E. 2003. The binding of HIV-1 protease inhibitors to
human serum proteins. Biophysical Chemistry, 105, 221-230.
Schwab, D., Fischer, H., Poli, S. & Huwyler, J. 2003. Comparison of in vitro P-glycoprotein screening
assays: Recommendations for their use in drug discovery. Journal of Medicinal Chemistry, 46, 1716-
1725.
Scott, I. M., Leduc, R. I., Burt, A. J., Marles, R. J., Arnason, J. T. & Foster, B. C. 2006. The inhibition of human cytochrome P450 by ethanol extracts of North American Botanicals. Pharmaceutical
Biology, 44, 315-327.
Seelig, A. 1998. How does P-glycoprtein recognize its substrates? International Journal of Clinical
Pharmacology and Therapeutics, 36, 50-54.
Seelig, A., Blatter, X. L. & Wohnsland, F. 2000. Substrate recognition by P-glycoprotein and the multidrug resistance-associated protein MRP1: A comparison. International Journal of Clinical
Pharmacology and Therapeutics, 38, 111-121.
Seelig, A. & Landwojtowicz, E. 2000. Structure-activity relationship of P-glycoprotein substrates and
modifiers. European Journal of Pharmaceutical Sciences, 12, 31-40.
Senior, A. E., Al-Shawi, M. K. & Urbatsch, I. L. 1995. The catalytic cycle of P-glycoprotein. FEBS
Letters, 377, 285-289.
Serbouce-Hougel, S., Durand, G., Corbii, M., Agneray, J. & Feger, J. 1981. Alterations in relative proportions of microheterogenous forms of human alpha 1-acid glycoprotein in liver disease. Journal
of Hepatology, 2, 245-252.
Sevior, D. K., Pelkonen, O. & Ahokas, J. A. 2012. Hepatocytes: The powerhouse of biotransformation.
The International Journal of Biochemistry & Cell Biology, 44, 257-261.
Shaojun, S. & Ulrich, K. 2012. Drug interactions with herbal medicines. Clinical Pharmacokinetics, 51,
77-104.
Shapiro A & Ling V 1998. Stoichiometry of coupling of rhodamine 123 transport to ATP hydrolysis by
P-glycoprotein. European Journal of Biochemistry / FEBS, 254, 189-193.
Shapiro, A. B., Fox, K., Lam, P. & Ling, V. 1999. Stimulation of P-glycoprotein-mediated drug transport by prazosin and progesterone. Evidence for a third drug-binding site. European Journal of
Biochemistry, 259, 841-850.
Shapiro, A. B. & Ling, V. 1994. ATPase activity of purified and reconstituted P-glycoprotein from
Chinese hamster ovary cells. Journal of Biological Chemistry, 269, 3745-3754.
Sharom, F. J. 1997. The P-glycoprotein efflux pump: How does it transport drugs? The Journal of
Membrane Biology, 160, 161-175.
Sharom, F. J., Yu, X., Chu, J. W. & Doige, C. A. 1995. Characterization of the ATPase activity of P-
glycoprotein from multidrug-resistant Chinese hamster ovary cells. The Biochemical Journal, 308, 381-
390.
Sheridan, H., Krenn, L., Jiang, R., Sutherland, I., Ignatova, S., Marmann, A., Liang, X. & Sendker, J.
2012. The potential of metabolic fingerprinting as a tool for the modernisation of TCM preparations.
Journal of Ethnopharmacology, 140, 482-491.
Shimada, T., Yamazaki, H., Mimura, M., Inui, Y. & Guengerich, F. P. 1994. Interindividual variations
in human liver cytochrome P-450 enzymes involved in the oxidation of drugs, carcinogens and toxic chemicals: Studies with liver microsomes of 30 Japanese and 30 Caucasians. The Journal of
Pharmacology and Experimental Therapeutics, 270, 414-423.

Chapter 7 – References 339
Shimada, T., Yamazaki, H., Mimura, M., Wakamiya, N., Ueng, Y. F., Guengerich, F. P. & Inui, Y.
1996. Characterization of microsomal cytochrome P450 enzymes invovled in the oxidation of
xenobiotic chemicals in human fetal liver and adult lungs. Drug Metabolism and Disposition, 24, 515-
522.
Shimada, T., Yun, C. H., Yamazaki, H., Gautier, J. C., Beaune, P. H. & Guengerich, F. P. 1992.
Characterization of human lung microsomal cytochrome P-450 1A1 and its role in the oxidation of
chemical carcinogens. Molecular Pharmacology, 41, 856-864.
Shimada, T. H., Yamazaki, H., Foroozesch, M., Hopkins, N. E., Alworth, W. L. & Guengerich, F. P.
1998. Selectivity of polycyclic inhibitors for human cytochromes P450 1A1, 1A2 and 1B1. Chemical
Research in Toxicology, 11, 1048-1056.
Shin, J. G., Soukhova, N. & Flockhart, D. A. 1999. Effect of antipsychotic drugs on human liver cytochrome P-450 (CYP) isoforms in vitro: Preferential inhibition of CYP2D6. Drug Metabolism and
Disposition, 27, 1078-1084.
Sibbing, D., Koch, W., Gebhard, D., Schuster, T., Braun, S., Stegherr, J., Morath, T., Schömig, A.,
Von Beckrath, N. & Kastrati, A. 2010. Cytochrome 2C19*17 allelic variant, platelet aggregation,
bleeding events, and stent thrombosis in clopidogrel-treated patients with coronary stent placement.
Circulation, 121, 512-518.
Sidelmann, U. G., Cornett, C., Tjørnelund, J. & Hansen, S. H. 1996. A comparative study of precision
cut liver slices, hepatocytes, and liver microsomes from the Wistar rat using metronidazole as a
model substance. Xenobiotica, 26, 709-722.
Siligardi, G. & Hussain, R. 1998. Biomolecules interactions and competitions by non-immobilised
ligand interaction assay by circular dichroism. Enantiomer, 3, 77-87.
Silva, J. A., Day, S. H. & Nicoll-Griffith, D. A. 1999. Induction of cytochrome P450 in cryopreserved
rat and human hepatocytes. Chemico-Biological Interactions, 121, 49-63.
Sim, S. C., Risinger, C., Dahl, M. L., Aklillu, E., Christensen, M., Bertilsson, L. & Ingelman-Sundberg,
M. 2006. A common novel CYP2C19 gene varient causes ultrarapid drug metabolism relevant for the drug response to proton pump inhibitors and antidepressants. Clinical Phamacology and
Therapeutics, 79, 103-113.
Smith, D. A., Di, L. & Kerns, E. H. 2010. The effect of plasma protein binding on in vivo efficacy:
Misconceptions in drug discovery. Nature Reviews- Drug Discovery, 9, 929-939.
Smith, P. C., Benet, L. Z. & Mcdonagh, A. F. 1990. Covalent binding of zomepirac glucuronide to
proteins: Evidence for a Schiff base mechanism. Drug Metabolism and Disposition, 18, 639-644.
Son, D. S., Osabe, M., Shimoda, M. & Kokue, E. 1998. Contribution of alpha 1-acid glycoprotein to species difference in lincosamides-plasma protein binding kinetics. Journal of Veterinary Pharmacology
and Therapeutics, 21, 34-40.
Song, B. J., Veech, R. L., Park, S. S., Gelboin, H. V. & Gonzalez, F. J. 1989. Induction of rat hepatic N-nitrosodimethylamine demethylase by acetone is due to protein stabilization. The Journal of
Biological Chemistry, 264, 3568-3572.
Song, Z., Li, X., Wang, H. & Wang, J. S. 2010. Genetic diversity and population structure of Salvia
miltiorrhiza Bge in China revealed by ISSR and SRAP. Genetica, 138, 241-249.
Sonnichsen, D. S., Liu, Q., Schuetz, E. G., Schuetz, J. D., Pappo, A. & Relling, M. V. 1995. Variability in human cytochrome P450 paclitaxel metabolism. The Journal of Pharmacology and Experimental
Therapeutics, 275, 566-575.
Sonveaux, N., Shapiro, A., Goormaghtigh, E., Ling, V. & Ruysschaert, J. 1996. Secondary and tertiary
structure changes of reconstituted P-glycoprotein. The Journal of Biological Chemistry, 271, 24617-
24624.
Sörensson, J., Matejka, G., Ohlson, M. & Haraldsson, B. 1999. Human endothelial cells produce orosomucoid, an important component of the capillary barrier. Americal Jornal of Physiology- Heart
and Circulatroy Physiology, 276, 530-534.
Soyama, A., Saito, Y., Hanioka, N., Murayama, N., Nakajima, O., Katori, N., Ishida, S., Sai, K.,
Ozawa, S. & Sawada, J. 2001. Non-synonymous single nucleotide alterations found in the CYP2C8
gene result in reduced in vitro paclitaxel metabolism. Biological & Pharmaceutical Bulletin, 24, 1427-
1430.
Squires, E. J., Sueyoshi, T. & Negishi, M. 2004. Cytoplasmic localization of pregnane X receptor and
ligand-dependent nuclear translocation in mouse liver. The Journal of Biological Chemistry, 279, 49307-
49314.
Steele, W. H., Haughton, D. J. & Barber, H. E. 1982. Binding of vinblastine to recrystallized human
alpha 1-acid glycoprotein. Cancer Chemotherapy and Pharmacology, 10, 40-42.

Chapter 7 – References 340
Stengel, B. & Jones, E. 1998. End-stage renal insufficiency associated with Chinese herbal consumption
in France. Nephrologie, 19, 15-20.
Stocker, R., Bowry, V. W. & Frei, B. 1991. Ubiquinol-10 protects human low density lipoprotein more
efficiently against lipid peroxidation than does alpha-tocopherol. Proceedings of the National Academy
of Sciences of the United States of America, 88, 1646-1650.
Stouch, T. R. & Gudmundsson, O. 2002. Progress in understanding the structure-activity relationships
of P-glycoprotein. Advanced Drug Delivery Reviews, 54, 315-325.
Strandell, J., Neil, A. & Carlin, G. 2004. An approach to the in vitro evaluation of potential for
cytochrome P450 enzyme inhibition from herbals and other natural remedies. Phytomedicine, 11, 98-
104. Stresser, D. M. & Kupfer, D. 1999. Monospecific antipeptide antibody to cytochrome P-450 2B6. Drug
Metabolism and Disposition, 27, 517-525.
Strom, S. C., Davila, J. & Grompe, M. 2010. Chimeric mice with humanized liver: Tools for the study of drug metabolsm, excretion, and toxicity. In: MAUREL, P. (ed.) Hepatocytes, Methods in Molecular
Biology. 1st ed. New York: Humana Press.
Su, S., Yang, B., Wang, Y. & Yeh, T. 1999. Alpha-1-acid glycoprotein induced tumour necrosis factor-α secretion of human monocytes is enhanced by serum binding proteins and depends on protein
tyrosine kinase activation. Immunopharmacology, 41, 21-29.
Subehan, A., Usia, T., Iwata, H., Kadota, S. & Tezuka, Y. 2006. Mechanism-based inhibition of
CYP3A4 and CYP2D6 by Indonesian medicinal plants. Journal of Ethnopharmacology, 105, 449-455.
Sudlow, G., Birkett, D. J. & Wade, D. N. 1975. The characterization of two specific drug binding sites
on human serum albumin. Molecular Pharmacology, 11, 824-832.
Sugiyama, Y., Suzuki, Y., Sawada, Y., Kawasaki, S., Beppu, T., Iga, T. & Hanano, M. 1985.
Auramide O as a flourescent probe for the binding of basic drugs to human alpha 1-acid
glycoprotein. The development of a simple fluoremetric method for the determination of alpha 1-
AG in human serum. Biochemical Pharmacology, 34, 821-829.
Sullivan-Klose, T. H., Ghanayem, B. I., Bell, D. A., Zhang, Z. Y., Kaminsky, L. S., Shenfield, G. M.,
Miners, J. O., Birkett, D. J. & Goldstein, J. A. 1996. The role of CYP2C9-Leu359 allelic variant in
the tolbutamide polymorphism. Pharmacogenetics, 6, 341-349.
Sun, H., Nie, A. & Fung, Y. S. 2010. Determination of free bilirubin and its binding capacity by HSA
using a microfluidic chip-capillary electrophoresis device with a multi-segement circular-ferrofluid-
driven micromixing injection. Electrophoresis, 31, 3061-3069.
Sun, H. & Scott, D. O. 2010. Structure-based drug metabolism predictions for drug design. Chemical
Biology & Drug Design, 75, 3-17.
Superti, F., Marziano, M., Tinari, A. & Donelli, G. 1993. Effect of polyions on the infectivity of SA-11
rotavirus in LCC-MK2 cells. Comparative Immunology, Microbiology and Infectious Diseases, 16, 55-62.
Szakács, G., Váradi, A., Özvegy-Laczka, C. & Sarkadi, B. 2001. The role of ABC transporters in drug
absorption, distribution, metabolism, excretion and toxicity (ADME-Tox). Drug Discovery Today, 13,
379-393.
Taavitsainen, P. 2001. Cytochrome P450 Isoform-specific in vitro methods to predict drug metabolism and
interactions. PhD, University of Oulu.
Taavitsainen, P., Anttila, M., Nyman, L., Karnani, H., Salonen, J. S. & Pelkonen, O. 2000. Selegiline
metabolism and cytochrome P450 enzymes: In vitro study in human liver microsomes. Pharmacology
& Toxicology, 86, 215-221.
Taavitsainen, P., Juvonen, R. & Pelkonen, O. 2001. In vitro inhibition of cytochrome P450 enzymes in
human liver microsomes by a potent CYP2A6 inhibitor, trans-2-phenylcyclopropylamine
(tranlcypromine), and its nonamine analog, cyclopropylbezene. Drug Metabolism and Disposition, 29,
217-222.
Tachibana, T., Kato, M., Watanabe, T., Mitsui, T. & Sugiyama, Y. 2009. Method for predicitng the
risk of drug-drug interactions involving inhibition of intestinal CYP3A4 and P-glycoprotein.
Xenobiotica, 39, 430-443.
Tacklind, J., Macdonald, R., Rutks, I. & Wilt, T. J. 2009. Serona repens for benign prostatic
hyperplasia. Cochrane Database of Systemic Reviews, 15, CD001423.
Takamura, N., Rahman, M. H., Yamasaki, K., Tsuruoka, M. & Otagiri, M. 1994. Interaction of
benzothiadiazides with human serum albumin studied by dialysis and spectroscopic methods.
Pharmaceutical Research, 11, 1452-1457.

Chapter 7 – References 341
Tamura, K., Shibata, Y., Matsuda, Y. & Ishida, N. 1981. Isolation and characterization of an
immunosuppressive acidic protein from ascitic fluids of cancer patients. Cancer Research, 41, 3244-
3252.
Tang, J. C., Zhang, J. N., Wu, Y. T. & Li, Z. X. 2006. Effect of the water extract and ethanol extract from traditional Chinese medicines Angelica sinensis (oliv) diels, Ligusticum chuanxiong Hort. and
Rheum palmatum L. on rat liver cytochrome P450 activity. Phytotherapy Research, 20, 1046-1051.
Tassaneeyakul, W., Guo, L. Q., Fukuda, K., Ohta, T. & Yamazoe, Y. 2000. Inhibition selectivity of grapefruit juice components on human cytochromes P450. Archives of Biochemistry and Biophysics,
378, 356-363.
Tateishi, T., Kumai, T., Watanabe, M., Nakura, H., Tanaka, M. & Kobayashi, S. 1999. Ticlopidine decreases the in vivo activity of CYP2C19 as measuresd by omeprazole metabolism. British Journal
of Clinical Pharmacology, 47, 454-457.
Tayeb, M. T., Clark, C., Haites, N. E., Sharp, L., Murray, G. I. & Mcleod, H. L. 2003. CYP3A4 and
VDR gene polymorphisms and the risk of prostate cancer in men with benign prostate hyperplasia.
British Journal of Cancer, 24, 928-932.
Tchénio, T., Havard, M., Martinez, L. A. & Dautry, F. 2006. Heat shock independent induction of
multidrug resistance by heat shock factor 1. Molecular and Cellular Biology, 26, 580-591.
Theibaut F, Tsuruo T, Hamada H, Gottesman M, Pastan I & Willingham M 1987. Cellular localization
of the multidrug-resistance gene product P-glycoprotein in normal human tissues. Proceeeding of the
National Acadmey of Sciences of the United States of America, 84, 7735-7738.
Therapeutic Goods Administration 2003. Pan Pharmaceuticals Limited: Regulatory action & product recall information. In: AGEING, D. O. H. A. (ed.). Canbera: Australian Government.
Thiebaut, F., Tsuruo, T., Hamada, H., Gottesman, M. M., Pastan, I. & Willingham, M. C. 1987.
Cellular localization of the multidrug-resistance gene product P-glycoprotein in normal human
tissues. Proceedings of the National Academy of Sciences of the United States of America, 84, 7735-7738.
Thiebaut, F., Tsuruo, T., Hamada, H., Gottesman, M. M., Pastan, I. & Willingham, M. C. 1989.
Immunohistochemical localization in normal tissues of different epitopes in the multidrug transport
protein P170: Evidence for localization in brain capillaries and cress-reactivity of one antibody with
a muscle protein. The Journal of Histochemistry & Cytochemistry, 37, 159-164.
Thijs, C. T., Groen, A. K., Hovens, M. & Mok, K. S. 1999. Risk of gallstone disesase is associated with
serum level of alpha-1-acid glycoprotein. Epidemiology, 10, 764-766.
Thomas, K. J., Nicholl, J. P. & Coleman, P. 2001. Use and expenditure on complementray medicine in
England: A population based survey. Complementary Therapies in Medicine, 9, 2-11.
Thorarensen, A., Sarver, R., Tian, F., Ho, A., Romero, D. & Marotti, K. 2007. Human serum albumin binding assay based on displacement of a non selective fluorescent inhibitor. Bioorganic and Medicinal
Chemistry Letters, 17, 4646-4649.
Thorgeirsson, S. S., Huber, B. E., Sorrell, S., Fojo, A., Pastan, I. & Gottesman, M. M. 1987.
Expression of the multidrug-resistant gene in hepatocarcinogenesis and regeneratong rat liver.
Science, 236, 1120-1122.
Thottassery, J. V., Zambetti, G. P., Arimori, K., Schuetz, E. G. & Schuetz, J. D. 1997. p53-dependent
regulation of MDR1 gene expression causes selective resistance to chemotherapeutic agents.
Proceedings of the National Academy of Sciences of the United States of America, 94, 11034-11042.
Tiano, H. F., Hosokawa, M., Chulada, P. C., Smith, P. B., Wang, R. L., Gonzalez, F. J., Crespi, C. L.
& Langenbach, R. 1993. Retroviral mediated expression of human cytochrome P450 2A6 in
C3H/10T1/2 cells confers transformability by 4-(methylnitrosamino)-1-(3-pyridyl)-1-butanone
(NNK). Carcinogenesis, 14, 1421-1427.
Tiroch, K. A., Sibbing, D., Koch, W., Roosen-Runge, T., Mehilli, J., Schömig, A. & Kastrati, A. 2010.
Protective effect of the CYP2C19*17 polymorphism with increased activation of clopidogrel on
cardiovascular events. American Heart Journal, 160, 506-512.
Tolonen, A., Petsalo, A., Turpeinen, M., Uusitalo, J. & Pelkonen, O. 2007. In vitro interaction cocktail
for nine major cytochrome P450 enzymes with 13 probe reactions and a single LC/MSMS run:
Analytical validation and testing with monoclonal anti-CYP antibodies. Journal of Mass Spectrometry,
42, 960-966.
Tompkins, L. M. & Wallace, A. D. 2007. Mechanisms of cytochrome P450 induction. Journal of
Biochemical and Molecular Toxicology, 21, 176-181.
Totah, R. A. & Rettie, A. E. 2005. Cytochrome P450 2C8: Substrates, inhibitors, pharmacogenetics,
and clinical relevance. Clinical Phamacology and Therapeutics, 77, 341-352.
Turpeinen, M. 2006. Cytochrome P450 enzymes- in vitro, in vivo and in silico studies. PhD, Oulu University.

Chapter 7 – References 342
Turpeinen, M., Jouko, U., Jalonen, J. & Pelkonen, O. 2005. Multiple P450 substrates in a single run:
Rapid and comprehensive in vitro interaction assay. European Journal of Pharmaceutical Sciences, 24,
123-132.
Turpeinen, M., Korhonen, L. E., Tolonen, A., Uusitalo, J., Juvonen, R., Raunio, H. & Pelkonen, O. 2006. Cytochrome P450 (CYP) inhibition screening: Comparison of three tests. European Journal of
Pharmaceutical Sciences, 29, 130-138.
Turpeinen, M., Nieminen, R., Juntunen, T., Taavitsainen, P., Raunio, H. & Pelkonen, O. 2004.
Selective inhibition of CYP2B6-catalyzed bupropion hydroxylation in human liver microsomes in
vitro. Drug Metabolism and Disposition, 32, 623-631.
Ueda, A., Hamdeh, H. K., Webb, H. K., Yamamoto, Y., Sueyoshi, T., Afshari, C. A., Lehmann, J. M.
& Negishi, M. 2002. Diverse roles of the nuclear orphan receptor CAR in regulating hepatic genes
in response to phenobarbital. Molecular Pharmacology, 61, 1-6.
Ueda, K., Taguchi, Y. & Morishima, M. 1997. How does P-glycoprotein recognize its substrates?
Seminars in Cancer Biology, 8, 151-159.
Uematsu, F., Kikuchi, H., Motomiya, M., Abe, T., Sagami, I., Ohmachi, T., Wakui, A., Kanamaru, R.
& Watanabe, M. 1991. Association between restriction fragment length polymorphism of the human cytochrome P450IIE1 gene and susceptibility to lung cancer. Japanese Journal of Cancer
Research, 82, 254-256.
Umeno, M., Mcbride, O. W., Yang, C. S., Gelboin, H. V. & Gonzalez, F. J. 1988. Human ethanol-
inducible P450IIE1: Complete gene sequence, promoter characterization, chromosome mapping
and cDNA-directed expression. Biochemistry, 04, 9006-90013.
Unger, M. & Frank, A. 2004. Simultaneous determination of the inhibitory potency of herbal extracts
on the activity of six major cytochrome P450 enzymes using liquid chromatography/mass
spectrometry and automated online extraction. Rapid Communications in Mass Spectrometry, 18, 2273-
2281.
Urani, C., Doldi, M., Crippa, S. & Camatini, M. 1998. Human-derived cell lines to study xenobiotic
metabolism. Chemosphere, 37, 2785-2795.
Vakharia, D. D., Liu, N., Pause, R., Fasco, M., Bessette, E., Zhang, Q. Z. & Kaminsky, L. S. 2001a.
Polycyclic aromatic hydrocarbon/metal mixtures: Effect on PAH induction of CYP1A1 in human HepG2 cells. Drug Metabolism and Disposition, 29.
Vakharia, D. D., Liu, N. N., Pause, R., Fasco, M., Bessette, E., Zhang, Q. Z. & Kaminsky, L. S.
2001b. Effect of metals on polycyclic aromatic hydrocarbon induction of CYP1A1 and CYP1A2 in
hepatocyte cultures. Toxicology and Applied Phamacology, 170, 93-103.
Vallner, J. J. 1977. Binding of drugs by albumin and plasma protein. Journal of Pharmaceutical Sciences,
66, 447-465.
Van Der Sluijs, P. & Meijer, D. K. F. 1985. Binding of drugs with a quaternary ammonium group to
alpha-1 acid glycoprotein and Asialo alpha-1 acid glycoprotein. The Journal of Pharmacology and
Experimental Therapeutics, 234, 703-707.
Van Dijk, W., Pos, O., Can Der Stelt, M. E., Moshage, H. J., Yap, S. H., Dente, L., Baumann, P. &
Eap, C. B. 1991. Inflammation-induced changes in expression and glycosylation of genetic varients of α1-acid glycoprotein. Studies with human sera, primary cultures of human hepatocytes and
transgenic mice. The Biochemical Journal, 276, 343-347.
Van Helvoort, A., Smith, A. J., Sprong, H., Fritzsche, I., Schinkel, A. H., Borst, P. & Van Meer, G.
1996. MDR1 P-glycoprotein is a lipid translocase of broad specificity, while MDR3 P-glycoprotein
specifically translocates phosphatidylcholine. Cell, 87, 507-517.
Van Kalken, C. K., Broxtermna, H. J., Pinedo, H. M., Feller, N., Dekker, H., Lankelma, J. &
Giaccone, G. 1993. Cortisol is transported by the multidrug resistance gene product P-glycoprotein.
British Journal of Cancer, 67, 284-289.
Van Kalken, C. K., Giaccone, G., Van Der Valk, P., Kuiper, C. M., Hadisaputro, M. M., Bosma, S.
A., Scheper, R. J., Meijer, C. J. & Pinedo, H. M. 1992. Multidrug resistance gene (P-glycoprotein)
expression in the human fetus. The American Journal of Pathology, 141, 1063-1072.
Van Veen, H. W., Callaghan, R., Soceneantu, L., Sardini, A., Konings, W. N. & Higgins, C. F. 1998.
A bacterial antibiotic-resistance gene that complements the human multidrug-resistance P-
glycoprotein gene. Nature, 391, 291-295.
Vanden Heuvel, J. P., Clark, G. C., Thompson, C. L., Mccoy, Z., Miller, C. R., Lucier, G. W. & Bell,
D. A. 1993. CYP1A1 mRNA levels as a human exposure biomarker: Use of quantitative
polymerase chain reaction to measure CYP1A1 expression in human peripheral blood lymphocytes.
Carcinogenesis, 14, 2003-2006.

Chapter 7 – References 343
Vandenbranden, M., Wrighton, S. A., Ekins, S., Gillespie, J. S., Binkley, S. N., Ring, B. J., Gadberry,
M. G., Mullins, D. C., Strom, S. C. & Jensen, C. B. 1998. Alterations of the catalytic activities of
drug-metabolizing enzymes in cultures of human liver slices. Drug Metabolism and Disposition, 26,
1063-1068.
Vanherwghem, J. L. 1994. A new form of nephropathy secondary to the absorption of Chinese herbs.
Bulletin et mémoires de l'Académie royale de médecine de Belgique, 149, 128-135.
Vasson, M., Roch-Arveiller, M., Couderc, R., Baguet, J. & Raichvarg, D. 1994. Effects of alpha-1 acid
glycoprotein on human polymorphonucler neutrophils: influence of glycan microheterogeneity.
Clinica Chimica Acta, 224, 65-71.
Venkatakrishnan, K., Greenblatt, D. J., Von Moltke, L. L., Schmider, J., Harmatz, J. S. & Shader, R. I.
1998. Five distinct human cytochromes mediate amitriptyline N-demethylation in vitro: Dominance
of CYP2C19 and 3A4. Journal of Clinical Pharmacology, 38, 112-121.
Venkatakrishnan, K. & Obach, R. S. 2007. Drug-drug interactions via mechanism-based cytochrome
P450 inactivation: Points to consider for risk assessment from in vitro data and clinical
pharmacologic evaluation. Current Drug Metabolism, 8, 449-462.
Venkatakrishnan, K., Von Moltke, L. L. & Greenblatt, D. J. 2000. Relative quantities of catalytically
active CYP2C9 and 2C19 in human liver microsomes: Application of the relative activity factor
approach. Journal of Pharmaceutical Sciences, 87, 845-853.
Verbeeck, R. K. & Cardinal, J. A. 1985. Plasma protein binding of salicylic acid, phenytoin,
chlorpromazine, propranolol and pethidine using equilibrium and ultracentrifugation.
Arzneimittelforschung, 35, 903-906.
Veronese, M. E., Miners, J. O., Randles, D., Gregov, D. & Birkett, D. J. 1990. Validation of the
tolbutamide metabolic ratio for population screening with use of sulfaphenazole to produce model
phenotypic poor metabolizers. Clinical Phamacology and Therapeutics, 47, 403-411.
Vieira, I., Sonnier, M. & Cresteil, T. 1996. Developmental expression of CYP2E1 in the human liver. Hypermethylation control of gene expression during the neonatal period. European Journal of
Biochemistry, 238, 476-483.
Villalba, J. M., Parrado, C., Santos-Gonzalez, M. & Alcain, F. J. 2010. Therapeutic use of coenzyme Q10 and conenzyme Q10- related compounds and formulations. Expert Opinion on Investigational
Drugs, 19, 535-554.
Von Ahsen, N., Richter, M., Grupp, C., Ringe, B., Oellerich, M. & Armstrong, V. W. 2001. No
influence of the MDR-1 C3435T polymorphism, of a CYP3A4 promoter polymorphism (CYP3A4-
V allele) on dose-adjusted cyclosporin A trough concnetrations or rejection incidence in stable renal
transplant patient. Clinical Chemistry, 47, 1048-1052.
Voulgari, F., Cummins, P., Gardecki, T. I., Beeching, N. J., Stone, P. C. & Stuart, J. 1982. Serum
levels of acute phase and cardiac proteins after myocardial infarction, surgery, and infection. British
Heart Journal 1982, 352-356.
Walle, T., Otake, Y., Galijatovic, A., Ritter, J. K. & Walle, U. K. 2000. Induction of UDP-
glucuronosyltransferase UGT1A1 by the flavonoid chrysin in the human hepatoma cell line hep G2.
Drug Metabolism and Disposition, 28, 1077-1082.
Walsky, R. L., Astuccio, A. V. & Obach, R. S. 2006. Evaluation of 227 drugs for in vitro inhibition of
cytochorme P450 2B6. The Journal of Clinical Pharmacology, 46, 1426-1438.
Wang, B., Yang, L. P., Zhang, X. Z., Huang, S. Q., Bartlam, M. & Zhou, S. F. 2009. New insights into
the structural characteristics and functional relevance of the human cyctochrome P450 2D6 enzyme.
Drug Metabolism Reviews, 41, 573-643.
Wang, H. & Tompkins, L. M. 2008. CYP2B6: New insights into a historically overlooked cytcochrome
P450 isoenzyme. Current Drug Metabolism, 9, 598-610.
Wang, J. S., Neuvonen, M., Wen, X., Backman, J. T. & Neuvonen, P. J. 2002. Gemfibrozil inhibits
CYP2C8-mediated cerivastatin metabolism in human liver microsomes. Drug Metabolism and
Disposition, 30, 1352-1356.
Wang, R. B., Kuo, C. L., Lien, L. L. & Lien, E. J. 2003. Structure-activity relationship: Analyses of P-
glycoprotein substrates and inhibitors. Journal of Clinical Pharmacy and Therapeutics, 28, 203-228.
Wang, Y. L., Yuan, J. F., Shang, W., Zhang, J. & Zhang, Z. Q. 2011. Dialysis sampling on-line
coupled with high-performance liquid chromatography for simultaneous investigation of the
interactions between multi-components in herbs and the albumin. The Analyst, 136, 823-828.
Wanwimolruk, S., Birkett, D. J. & Brooks, P. M. 1983. Structural requirements for drug binding to site
II on human serum albumin. Molecular Pharmacology, 24, 458-463.

Chapter 7 – References 344
Wanwimolruk, S., Wong, K. & Wanwimolruk, P. 2009. Variable inhibitory effect of different brands of commercial herbal supplements on human cytochrome P450 CYP3A4. Drug Metabolism and Drug
Interactions, 24, 17-35.
Wartenberg, M., Hoffmann, E., Schwindt, H., Grünheck, F., Petros, J., Arnold, J. R., Hescheler, J. &
Sauer, H. 2005. Reactive oxygen species-linked regulation of the multidrug resistance transporter P-
glycoprotein in Nox-1 overexpressing prostate tumor spheroids. FEBS Letters, 579, 4541-4549.
Watkins, P. B., Wrighton, S. A., Schuetz, E. G., Maurel, P. & Guzelian, P. S. 1986. Macrolide
antibiotics inhibit the degradation of the glucocorticoid-responsive cytochorme P-450p in rat
hepatocytes in vivo and primary monolayer culture. The Journal of Biological Chemistry, 261, 6264-
6271.
Waxman, D. J. 1999. P450 gene induction by structurally diverse xenochemicals: Central role of
nuclear recpetors CAR, PXR and PPAR. Archives of Biochemistry and Biophysics, 369, 11-23.
Weber, C., Bysted, A. & Hølmer, G. 1997. Coenzyme Q10 in the diet-daily intake and relative
bioavailability. Molecular Aspects of Medicine, 18, S251-254.
Weimer, H., Mehl, J. & Winzler, R. 1950. Studies on the mucoproteins of human plasma V. Isolation
and characterization of a homogenous mucoprotein. Journal of Biological Chemistry, 185, 561-568.
Weiss, J., Gregor Dormann, S. M., Martin-Facklam, M., Jkerpen, C. J., Ketabi-Kiyanvash, N. & Haefeli, W. E. 2003. Inhibition of P-glycoprotein by newer antidepressants. The Journal of
Pharmacology and Experimental Therapeutics, 305, 197-204.
Weizmann Institute of Science. 2009. GeneCards [Online]. Available:
http://www.genecards.org/index.shtml.
Wen, X., Wang, J. S., Neuvonen, P. J. & Backman, J. T. 2002. Isoniazid is a mechanism-based
inhibitor of cytochrome P450 1A2, 2A6, 2C19 and 3A4 isoforms in human liver microsomes.
European Journal of Clinical Pharmacology, 57, 799-804.
Wienkers, L. C. & Heath, T. G. 2005. Prediciting in vivo drug interactions from in vitro drug discovery
data. Nature Reviews: Drug Discovery, 4, 825-833.
Williams, G. C. & Sinko, P. J. 1999. Oral absorption of the HIV protease inhibitors: A current update.
Advanced Drug Delivery Reviews, 39, 211-238.
Williams, J., Weiser, M., Pechet, T., Kobzik, L., Moore, F. & Hechtman, H. 1997. α1-Acid
glycoprotein reduces local and remote injuries after intestinal ischemia in the rat. American Journal of
Physiology- Gastrointestinal and Liver Physiology, 273, 1031-1035.
Williams, J. A., Hyland, R., Jones, B. C., Smith, D. A., Hurst, S., Goosen, T. C., Peterkin, V., Koup,
J. R. & Ball, S. E. 2004. Drug-drug interactions for UDP-glucuronsyltransferase substrates: A pharmacokinetic explanation for typically observed low exposure (AUCl/AUC) ratios. Drug
Metabolism and Disposition, 32, 1201-1208.
Wolff, T., Distlerath, L. M., Worthington, M. T., Groopman, J. D., Hammons, G. J., Kadlubar, F. F.,
Prough, R. A., Martin, M. V. & Guengerich, F. P. 1985. Substrate specificity of human liver
cytochrome P-450 debrisoquine 4-hydroxylase probed using immunochemical inhibition and
chemical modeling. Cancer Research, 45, 2116-2122.
World Health Organization 2008. Traditional Medicine. WHO.
Wright, D. S., Friedman, M. L., Jenkins, S. H., Heineman, W. R. & Halsall, H. B. 1988. Sequestration electrochemistry: The interaction of chlorpromazine and human orosomucoid. Analytical
Biochemistry, 171, 290-293.
Wrighton, S. A. & Stevens, J. C. 1992. The human hepatic cytochorme P450 involved in drug
metabolism. Critical Reviews in Toxicology, 22, 1-21.
Wu, X. J., Zhang, M. L., Cui, X. Y., Gao, F., He, Q., Li, X. J., Zhang, J. W., Fawcett, J. P. & Gu, J.
K. 2012. Comparative pharmacokinetics and bioavailability of escin la and isoescin la after
administration of escin and of pure escin la and isoescin la in rat. Journal of Ethnopharmacology, 139,
201-206.
Xie, H. J., Yasar, Ü., Lundgren, S., Griskevicius, L., Terelius, Y., Hassan, M. & Rane, A. 2003. Role of polymorphic human CYP2B6 in cyclophosphamide bioactivation. The Pharmacogenomics Journal,
3, 53-61.
Xie, Y., Zhang, D. & Ben-Amotz, D. 2008. Protein-ligand binding detected using ultrafiltration and
Raman difference spectroscopy. Analytical Biochemistry, 373, 154-160.
Xu, X. L., Gu, S. Y., Shao, Q., Huang, Q. J. & Cheng, Y. P. 2007. Modification of alterations in
cardiac function and sarcoplasmic reticulum by astragaloside IV in myocardial injury in vivo.
European Journal of Pharmacology, 568, 203-212.

Chapter 7 – References 345
Xue, C. C., Zhang, A., Kin, V., Da Costa, C. & Story, D. 2007. Complementary and alternative medicine use in Australia: A national population-based survey. The Journal of Alternative and
Complementary Medicine, 13, 643-650.
Yague, E., Armesilla, A. L., Harrison, G., Elliott, J., Sardini, A., Higgins, C. F. & Raguz, S. 2003. P-
glycoprotein (MDR1) expression in leukemic cells is regulated at two distinct steps, mRNA
stabilization and translational initiation. The Journal of Biologial Chemistry, 278, 10344-10352.
Yamasaki, K., Maruyama, T., Kragh-Hansen, U. & Otagiri, M. 1996. Characterization of site I on human serum albumin: Concept about the structure of a drug binding site. Biochimica et Biophysica
Acta, 1295, 147-157.
Yamazaki, H., Inoue, K., Chiba, K., Ozawa, N., Kawai, T., Suzuki, Y., Goldstein, J. A., Guengerich,
F. P. & Shimada, T. 1998. Comparative studies on the catalytic roles of cytochrome P450 2C9 and
its cys- and leu- variants in the oxidation of warfain, flurbiprofen, and diclofenac by human liver
microsomes. Biochemical Pharmacology, 56, 243-251.
Yamazaki, H., Shibata, A., Suzuki, M., Nakajima, M., Shimada, N., Guengerich, F. P. & Yokoi, T.
1999. Oxidation of troglitazone to a quinone-type metabolite catalyzed by cytochrome P-450 2C8
and P-450 3A4 in human liver microsomes. Drug Metabolism and Disposition, 27, 1260-1266.
Yamazaki, H. & Shimada, T. 1997. Progesterone and testosterone hydroxylation by cytochromes P450
2C19, 2C9 and 3A4 in human liver microsomes. Archives of Biochemistry and Biophysics, 346, 161-169.
Yang, S. O., Shin, Y. S., Hyun, S., H., Cho, S., Bang, K. H., Lee, D., Choi, S. P. & Choi, H. K. 2012.
NMR-based metabolic profiling and differentiation of ginseng roots according to cultivation ages.
Journal of Pharmaceutical and Biomedical Analysis, 58, 19-26.
Yeo, K. R. & Yeo, W. W. 2001. Inhibitory effects of verapamil and diltiazem on simvastatin
metabolism in human liver microsomes. British Journal of Clinical Pharmacology, 51, 461-470.
Yin, H., Racha, J., Li, S. Y., Olejnik, N., Satoh, H. & Moore, D. 2000. Automated high throughput
human CYP isoform activity assay using SPE-LC/MS method: Application in CYP inhibition evaluation. Xenobiotica, 30.
Yoo, H. H., Lee, M. W., Kim, Y. C., Yun, C. H. & Kim, D. H. 2007. Mechanism-based inactivation of cytochrome P450 2A6 by decursinol angelate isolated from Angelica Gigas. Drug Metabolism and
Disposition, 35, 1759-1765.
Yoshima H, Matsumoto A, Mizuochi T, Kawasaki T & Kobata A 1981. Comparative study of the
carbohydrtae moieties of rat and human plasma α1-acid glycoproteins. The Journal of Biological
Chemistry, 256, 8476-8484.
Yoshisue, K., Nagayama, S., Shindo, T. & Kawaguchi, Y. 2001. Effects of 5-fluorouracil on the drug-
metabolizing enzymes of the small intestine and consequent drug interaction with nifedipine in rats.
The Journal of Pharmacology and Experimental Therapeutics, 297, 1166-1175.
Yoshitomi, S., Ikemoto, K., Takahashi, J., Miki, H., Namba, M. & Asahi, S. 2001. Establishment of
the transformants expressing human cytochrome P450 subtypes in HepG2, and their applications on
drug metabolism and toxicology. Toxicology In Vitro, 15, 245-256.
You G & Morris M 2007. Drug transporters: Molecular characterization and role in drug dsposition, New
York, Wiley.
Yun, C., H., Kim, K. H., Calcutt, M. W. & Guengerich, F. P. 2005. Kinetic analysis of oxidation of
coumarins by human cytochrome P450 2A6. The Journal of Biological Chemistry, 280, 12279-12291.
Yun, C. H., Shimada, T. & Guengerich, F. P. 1991. Purification and characterization of human liver
microsomal cytcochorme P-450 2A6. Molecular Pharmacology, 40, 679-685.
Zamora, J. M., Pearce, H. L. & Beck, W. T. 1988. Physical-chemical properties shared by compunds
that modulate multidrug resistance in human leukemic cells. Molecular Pharmacology, 33, 454-462.
Zanger, U. M., Raimundo, S. & Eichelbaum, M. 2004. Cytochrome P450 2D6: Overview and update
on pharmacology, genetics, biochemistry. Naunyn-Schmiedeberg's Archives of Pharmacology, 369, 23-37.
Zanger, U. M., Turpeinen, M., Klein, K. & Schwab, M. 2008. Functional pharmacogenetics/genomics
of human cytochromes P450 involved in drug biotransformation. Analytical and Bioanalytical
Chemistry, 392, 1093-1108.
Zhang, S. & Morris, M. E. 2003. Effect of the flavonoids biochain A and silymarin on the P-
glycoprotein mediated transport of digoxin and vinblastine in human intetestinal Caco-2 cells.
Pharmaceutical Research, 20, 1184-1191.
Zhang, W., Purchio, A. F., Chen, K., Wu, J., Lu, L., Coffee, R., Contag, P. R. & West, D. B. 2003. A
transgenic mouse model with a luciferase reporter for studying in vivo transcriptional regulation of
the human CYP3A4 gene. Drug Metabolism and Disposition, 31, 1054-1064.

Chapter 7 – References 346
Zhang, W., Zhao, Y., Bai, X., Wang, Y. L. & Zhao, D. 2011. The orientation of protoberberine
alkaloids and their binidng activities to human serum albumin by surface-enhanced Raman
scattering. Spectrochimica Acta, 78, 1105-1109.
Zhang, W. D., Zhang, C., Liu, R. H., Li, H. L., Zhang, J. T., Mao, C., Moran, S. & Chen, C. L. 2006.
Preclinical pharmacokinetics and tissue distribution of a natural cardioprotective agent astragaloside
IV in rats and dogs. Life Sciences, 79, 808-815.
Zhao, K. J., Dong, T. T. X., Tu, P. F., Song, Z. H., Lo, C. K. & Tsim, K. W. K. 2003. Molecular genetic and chemical assessment of Radix Angelica (Danggui) in China. Journal of Agricultural and
Food Chemistry, 51, 2576-2583.
Zhou, C., Verma, S. & Blumber, B. 2009a. The steroid and xenobiotic receptor (SXR), beyond xenobiotic metabolism. Nuclear Receptor Signalling, 7.
Zhou S, Lim L & Chowbray B 2004. Herbal modulation of P-glycoprotein. Drug Metaboolism Reviews,
36, 57-104.
Zhou S, Wang L, Di Y, Xue C, Duan W, Li C & Li Y 2008. Substrates and inhibitors of human
multidrug resistance associated proteins and the implications in drug development. Current Medicinal
Chemistry, 15, 1981-2039.
Zhou, S., Huang, M., Xu, A., Yang, H., Duan, W. & Paxton, J. W. 2005. Prediction of herb-drug
metabolic interactions: A simulation study. Phytotherapy Research, 19, 464-471.
Zhou, S. F. 2008. Drugs behave as substrates, inhibitors and inducers of human cytochrome P450 3A4.
Current Drug Metabolism, 9, 310-322.
Zhou, S. F., Koh, H. L., Gao, Y., Gong, Z. Y. & Lee, E. J. D. 2004. Herbal bioactivation: The good,
the bad and the ugly. Life Sciences, 74, 935-968.
Zhou, S. F., Liu, J. P. & Chowbay, B. 2009b. Polymorphism of human cytochrome P450 enzymes and
its clinical impact. Drug Metabolism Reviews, 41, 89-295.
Zhou, S. F., Wang, B., Yang, L. P. & Liu, J. P. 2010. Structure, function, regulation and polymorphism
and the clinical significance of human cyctochrome P450 1A2. Drug Metabolism Reviews, 42, 268-
354.
Zini, R., Riant, P., Barré, J. & Tillement, J. P. 1990a. Disease-induced variations in plasma protein
levels. Implications for drug dosage regimens (Part II). Clinical Pharmacokinetics, 19, 218-229.
Zini, R., Riant, P., Barré, J. & Tillement, J. P. 1990b. Disease-induced variations in plasma protein
levels. Implications for drug dosing regimens (Part I). Clinical Pharmacokinetics, 19, 147-159.
Zlotos, G., Bücker, A., Kinzig-Schippers, M., Sorgel, F. & Holzgrabe, U. 1998. Plasma protein binding
of gyrase inhibitors. Journal of Pharmaceutical Sciences, 87, 215-220.
Zsila F 2007. Overlapping ligand specificity of p-glycoprotein and serum alpha1-acid glycoprotein:
Evidences and potential implications. Current Drug Metabolism, 8, 563-593.
Zsila, F., Bikádi, Z., Fitos, I. & Simonyi, M. 2004. Probing protein binding sites by circular dichroism
spectroscopy. Current Drug Discovery Technologies, 1, 133-153.
Zsila, F., Bikádi, Z. & Simonyi, M. 2002. Retinoic acid binding properties of the lipocalin member β-
lactoglobulin studied by circular dichroism, electronic adsorption spectroscopy and molecular
modeling methods. Biochemical Pharmacology, 64, 1651-1660.
Zsila, F., Bikádi, Z. & Simonyi, M. 2003. Probing the binding of the flavonoid, quercetin to human
serum albumin by circular dichroism, electronic absorption spectroscopy and molecular modelling
methods. Biochemical Pharmacology, 65, 447-456.
Zsila, F. & Iwao, Y. 2007. The drug binding site on α1-acid glycoprotein: Insight from induced circular
dichroism and electronic absorption spectra. Biochimica et Biophysica Acta, 1770, 797-809.
Zuber, R., Anzenbacherová, P. & Anzenbacher, P. 2002. Cytochromes P450 and experimental models
of drug metabolism. Journal of Cellular and Molecular Medicine, 6, 189-198.
Copyright © 2022 FDOKUMEN