determination of sulfonamides in honey using reversed phase ...
86
REPUBLIC OF TURKEY BİNGÖL UNIVERSITY INSTITUTE OF SCIENCE DETERMINATION OF SULFONAMIDES IN HONEY USING REVERSED PHASE HIGH PERFORMANCE LIQUID CHROMATOGRAPHY (RP-HPLC) FROM BİNGÖL PROVINCE MASTER THESIS ALAA OMAR TAHIR CHEMISTRY SUPERVISOR OF THESIS Prof. Dr. Mehmet ÇİFTCİ BİNGÖL-2018
-
Upload
khangminh22 -
Category
Documents
-
view
2 -
download
0
Transcript of determination of sulfonamides in honey using reversed phase ...
REPUBLIC OF TURKEY
BİNGÖL UNIVERSITY
INSTITUTE OF SCIENCE
DETERMINATION OF SULFONAMIDES IN HONEY USING
REVERSED PHASE HIGH PERFORMANCE LIQUID
CHROMATOGRAPHY (RP-HPLC) FROM BİNGÖL PROVINCE
MASTER THESIS
ALAA OMAR TAHIR
CHEMISTRY
SUPERVISOR OF THESIS
Prof. Dr. Mehmet ÇİFTCİ
BİNGÖL-2018
ii
ACKNOWLEDGEMENT
First of all, I always have to thank (ALLAH) every day that has given me strength and
grant me patiently in finishing this research successfully.
I would like to pay special gratitude, appreciation, and warmness to the persons below who
made my research successful and assisted me at every point to cherish my goal:
Initially to my supervisor, Dr. Mehmet ÇİFTCİ, for his vigorous assistance and support
and also for his encouragement that made it possible to reach the goal.
Then to Dr. Cemil AYDOĞAN, whose kindly attitude and helped me at every point during
my research.
Also to all of the lab staff members of central laboratory especially to Dr. Aydın şükrü
BENGÜ, and to Ertuğ KIRKAN for their heartfelt services in finishing my practice.
To most valuable persons of my life my parent and all my family members, without them
I was nothing; they not only assisted me financially but also expanded their support
emotionally and morally.
Most importantly, I wish to thank my loving and supportive closest person ‘Hogr
PIRDAWOOD’ for his great helping in the continuation of this project.
Finally, I have to say a big thank for my best friend ‘Barzan MIRZA’ who provide unending
inspiration.
Alaa Omar TAHIR
Bingöl University 2018
iii
CONTENTS
ACKNOWLEDGEMENT ............................................................................................ ii
CONTENTS .................................................................................................................. iii
LIST OF ABBREVIATIONS ....................................................................................... vi
LIST OF TABLES ........................................................................................................ ix
LIST OF FIGURES ....................................................................................................... x
ÖZET ............................................................................................................................ xii
ABSTRACT .................................................................................................................. xiii
1. INTRODUCTION ..................................................................................................... 1
1.1. Honey ..................................................................................................................... 1
1.1.1. Honey in Bingöl-Turkey .............................................................................. 3
1.2. Antibiotics .............................................................................................................. 4
1.2.1. Types of Antibiotics ..................................................................................... 5
1.3. Sulfonamies (SAs) ................................................................................................. 6
1.3.1. Structure Activity Relationship ................................................................... 7
1.3.2. History of Sulfonamides .............................................................................. 8
1.3.3. Sulfonamides in Environment ................................................................... 10
1.3.4. Synthesis of Sulfonamides .......................................................................... 11
1.3.5. Application of Sulfonamides ...................................................................... 12
1.3.6. Classification of Sulfonamides ................................................................... 13
1.3.7. Side Effects of Sulfonamides ...................................................................... 14
1.4. Sulfonamides in Honey ........................................................................................ 14

iv
1.5. Analyzing Techniques for Sulfonamides in Honey .............................................. 16
1.6. High Performance Liquid Chromatography (HPLC) ............................................ 18
1.6.1. HPLC Historical Background ..................................................................... 18
1.6.2. Instrumentation ........................................................................................... 19
1.6.3. Types of HPLC ........................................................................................... 22
1.7. Applications of Reversed Phase HPLC ................................................................. 24
1.8. Goals and Objectives ............................................................................................. 24
1.8.1. Goals ........................................................................................................... 24
1.8.2. Objectives ................................................................................................... 24
2. LITERATURE REVIEW ......................................................................................... 26
3. METHODOLOGY ................................................................................................... 33
3.1. Document Review ................................................................................................. 33
3.2. Analytical Method Development and Procedures for the Determination of
Sulfonamides in Honey Using RP-HPLC-UV ............................................................. 34
3.2.1. Chemicals .................................................................................................... 34
3.2.2. Apparatus .................................................................................................... 35
3.2.3. Preparation of Standard Solutions .............................................................. 36
3.2.4. Preparation of Buffer Solution and Mobile Phase ..................................... 37
3.2.5. pH and Flow Rate ....................................................................................... 37
3.2.6. Analytical Condition for HPLC .................................................................. 42
3.2.7. Calibration .................................................................................................. 45
3.2.8. Sample Preparation ..................................................................................... 46
3.3. Peak Study ............................................................................................................. 47
3.4. Peak Resolution and Diagnosis ............................................................................. 50
4. RESULTS AND DISCUSIONS. ............................................................................. 53
4.1. Validation Results ................................................................................................. 53
5. CONCLUSION ........................................................................................................ 63
REFERENCES ............................................................................................................. 64

v
PERSONAL BACKGROUND .................................................................................... 73

vi
LIST OF ABBREVIATIONS
HPLC : High performance liquid chromatography
UPLC : Ultra performance liquid chromatography
HPCE : High performance capillary electrophoresis
LC : Liquid chromatography
RP : Reversed phase
UV : Ultraviolet
FL : Fluorescence
ESI : Electrospray ionization
SPE : Solid phase extraction
LLE : Liquid-liquid extraction
HFRLM : Hollow fiber renewal liquid membrane
MS/MS : Tandem mass spectroscopy
SAs : Sulfonamides
UP : Ultrapure water
mL : Milliliter
g : Gram
kg : Kilogram
mg : Milligram
M : Molar
mM : Milli molar

vii
L : Liter
µg : Microgram
nm : Nanometer
SA : Sulfonamide antibiotics
SNA : Sulfonamide non antibiotics
MRSA : Methicillin-resistant Staphylococcus aureus
AFB : American foulbrood
EFB : European foulbrood
LOQ : Limit of quantification
LOD : Limit of detection
Rs : Resolution
SD : Standard deviation
RSD : Relative standard deviation
N : Theoretical plate number
k’ : Retention factor
Α : Selectivity
TR : Retention time
T0 : Void volume
R2 : Regression coefficient
W : Width at the base of analyte
MRL : Maximum residue level
ODS : Octadecylsilica
MSPD : Solid phase dispersion

viii
SCX : Strong cation exchanger
SDZ : Sulfadiazine
STZ : Sulfathiazole
SFP : Sulfapyridine
SMZ : Sulfamerazine
ATS : α-Toluenesulfonamide
SMT : Sulfamethazine
PNS : p-Nitrobenzenesulfonamide
SDX ; Sulfadoxine
SXZ : Sulfisoxazole
Ppb : Part per billion
CAN : Acetonitrile
TFA : Trifluoroacetic acid
HCl : Hydrochloric acid
KOH : Potassium hydroxide
STD : Standard

ix
LIST OF TABLES
Table 1.1. Classification of antibiotics (according to British National Formulary
(2012) based on molecular structure……….….………………….
6
Table 3.1. List of chemicals that used in this study ….………….………….. 34
Table 3.2. List of instruments and apparatus that used in this study………… 35
Table 3.3. The sequence of SAs standards at pH: 5 flow rate 0.5 mL/min..... 42
Table 3.4. Autosampler section condition…………………………………… 43
Table 3.5. Pump section condition…………………………………………… 43
Table 3.6. Oven section condition…………………………………………… 44
Table 3.7. Detector section condition……………………………………...... 44
Table 3.8. HPLC column specification……………………………………… 45
Table 3.9. List of analytes and standards for calibration…………………..... 45
Table 3.10. List of sample names…………………………………………….. 46
Table 4.1. Validation parameters of the method…………………………….. 54
Table 4.2. Statistical analysis of SAs determination in sample number 1….. 59
Table 4.3. Statistical analysis of SAs determination in sample number 2….. 59
Table 4.4. Statistical analysis of SAs determination in sample number 3….. 60
Table 4.5. Statistical analysis of SAs determination in sample number 4….. 60
Table 4.6. Statistical analysis of SAs determination in sample number 5….. 61
Table 4.7. Statistical analysis of SAs determination in sample number 6….. 61
Table 4.8. Statistical analysis of SAs determination in sample number 7….. 62

x
LIST OF FIGURES
Figure 1.1. Structure of sugars in honey……………………………………… 2
Figure 1.2. General structure of sulfonamides………………………………... 7
Figure 1.3. Structure of some common SAs……………………...…………... 8
Figure 1.4. Separation of the mixture into its components…………...……..... 17
Figure 1.5. Separation of mixture components by LC……………...………… 17
Figure 1.6. Detector signals are shown by chromatograph…………………… 21
Figure 1.7. HPLC instrumentation………...…………………..……………… 21
Figure 1.8. RP-HPLC schematic configuration……………………...………... 23
Figure 3.1. Stages of research: Sulfonamides in honey by RP-HPLC………… 33
Figure 3.2. Chromatographic separation of SAs at pH: 8, flow rate: 0.5
mL/min…………………………………………………………….
38
Figure 3.3. Chromatographic separation of SAs at pH: 7, flow rate: 0.5
mL/min…………………………………………………………….
39
Figure 3.4. Chromatographic separation of SAs at pH: 6, flow rate: 0.5
mL/min…………………………………………………………….
39
Figure 3.5. Chromatographic separation of SAs at pH: 5, flow rate: 0.8
mL/min…………………………………………………………….
40
Figure 3.6. Chromatographic separation of SAs at pH: 5, flow rate: 0.5
mL/min…………………………………………………………….
41
Figure 3.7. Chromatographic separation of SAs at pH: 4, flow rate: 0.5
mL/min…………………………………………………………….
41
Figure 3.8. Calibration curve…………………………...…………………….. 46
Figure 3.9. Void marker…………………………………………………......... 47
Figure 3.10. Theoretical plate parameters……………………………………… 49
xi
Figure 3.11. Determination of resolution between two peaks…………...……. 51
Figure 3.12. Separation results with different resolutions…………………...... 52
Figure 4.1. HPLC chromatogram of the sample number 1…………………... 55
Figure 4.2. HPLC chromatogram of the sample number 2…………………... 56
Figure 4.3. HPLC chromatogram of the sample number 3…………………... 56
Figure 4.4. HPLC chromatogram of the sample number 4…………………... 57
Figure 4.5. HPLC chromatogram of the sample number 5………………....... 57
Figure 4.6. HPLC chromatogram of the sample number 6...……………........ 58
Figure 4.7. HPLC chromatogram of the sample number 7…..…………...….. 58

xii
BİNGÖL İLİNE AİT BALLARDA TERS FAZ-YÜKSEK
PERFORMANSLI SIVI KROMATOGRAFİSİ (RP-HPLC) YÖNTEMİ
İLE SÜLFONAMİDLERİN TAYİNİ
ÖZET
Bal, gıda ve ilaç olarak tüketilen en yaygın kullanılan doğal ürünlerdendir. Arıcılıkta,
arıların bazı bakteriyel hastalık ve enfeksiyonlardan korunması için arıcılar tarafından
birçok antibakteriyel grup kullanılabilir. Sülfonamidler uzun yıllardan beri kullanılan en
etkili antibakteriyel ilaçlardan biridir. Gıda endüstrisinde ve veterinerlikte tedavi ve
koruyucu amaçlı antimikrobiyal ajan olarak yaygın olarak kullanılırlar. Sülfonamidlerin
kalıntıları balda farklı seviyelerde görülebilmektedir. Baldaki yüksek konsantrasyonda
sülfonamidlerin varlığı insan vücudu için potansiyel bir risk oluşturabilir. Hızlı bir metod
olarak, Ultraviyole Spektroskopik Algılamalı Ters Fazlı Yüksek Performanslı Sıvı
Kromotografisi (RP-HPLC-UV) kullanılmıştır. Optimizasyon ve validasyondan sonra,
Bingöl iline ait farklı ballarda 9 Sülfonamid’in (Sulfathiazole, Sulfadiazine,
Sulfamethazine, Sulfamerazine, Sulfadoxine, Sulfisoxazole, Sulfapyridine, α-
Toluenesulfonamide, p-Nitrobenzenesulfonamide) tespit analizleri gerçekleştirilmiştir.
Metot trifloroasetik asit kullanılarak asit hidroliziyle başlayan örnek hazırlamadan
oluşmuştur. Kromatografik ayrışmanın etkileri, örneğin, akış hızı, mobil faz organik
modifiye edici, tampon pH tampon içeriği ve optimum analitik koşullar, kapsamlı bir
şekilde çalışılmıştır. Sülfonamidlerin tespiti, izokratik mod, paslanmaz çelik kolon (150
mm, 4,6 mm I.D.) ve ultraviyole spektrometresi kullanılarak 220 nm dalga boyunda, 0,5
mL / dak. akış hızında yapılmıştır. Sülfonamidlerin Tespit limiti (LOD) 0,72 µg/kg olarak,
kantifikasyon sınırı (LOQ) ise 2,37 µg/kg olarak alınmıştır. Bu metod, çeşitli ballarda
Sülfonamidlerin tespitinde başarılı bir şekilde uygulanmıştır.
Anahtar Kelimeler: Sülfonamidler, Bal, Ters Faz, HPLC.

xiii
DETERMINATION OF SULFONAMIDES IN HONEY USING
REVERSED PHASE HIGH PERFORMANCE LIQUID
CHROMATOGRAPHY (RP-HPLC) FROM BİNGÖL PROVINCE
ABSTRACT
Honey is one of the most widely natural product consumed as food and medicine. Many
antibacterial groups can be used by beekeepers in apiculture to protect bees from some
bacterial diseases and infections. Sulfonamides are one of the most effective antibacterial
medicine that has been used for many years. They commonly used as antimicrobial agents
in food industry and veterinary for therapeutic and protective purposes. Their residue can
appear in honey at different levels. The presence of SAs in honey at the high level of
concentration could have a potential risk for human body. Reversed-phase high-
performance liquid chromatography with ultraviolet spectroscopic detection (RP-HPLC-
UV) was used as a quick method. After optimization and validation, determination of 9
Sulfonamides (Sulfathiazole, Sulfadiazine, Sulfamethazine, Sulfamerazine, Sulfadoxine,
Sulfisoxazole, Sulfapyridine, α-Toluenesulfonamide, p-Nitrobenzenesulfonamide) were
carried out in different samples of honey from Bingol province. The method consisted of
sample preparation that started with acid hydrolysis using trifluoroacetic acid. The
influences of the chromatographic separation such as flow rate, mobile phase organic
modifier, buffer pH, buffer content and optimum analytical condition were extensively
studied. The detection of Sulfonamides carried out by the chromatographic separation
using isocratic mode, stainless steel column (150 mm, 4.6 mm I.D.) and ultraviolet
spectrometry detection with analytical wavelength at 220 nm, flow rate 0.5 mL/min. The
LOD of Sulfonamides was 0.72 µg/kg (LOD of the method) with the limit of quantification
(LOQ) 2.37 µg/kg. The method was applied successfully for Sulfonamides determination
in various honey samples.
Keywords: Sulfonamides, Honey, Reversed Phase, HPLC.

1. INTRODUCTION
1.1. Honey
Honey is one of the most widely used natural, sweet and flavorful product which produced
by Honeybees from plant nectars, secretions of plant and excretions of plant sucking
insects. It is very important because of its medicinal properties and unique nutrition value
which contain more group of useful substances for human health, in which is used as anti-
inflammatory, antioxidant, antimicrobial and bacteriostatic properties, in addition to
sunburn healing and wound effects (Buba et al. 2013 and Alimentarius 2001). Usually
honey is a more concentrated solution which contain 16% of water, large amount of
carbohydrates which around 80-85%, 0.1-0.4% protein, antibiotics, vitamins, antioxidants,
enzymes, amino acids and around 0.2% of ash content (Ajani 2009) and (National Honey
Board 2003). According to the origin, honey can be classified in different categories as
follows: (1) Blossom Honey, which obtained mainly from the nectar of flowers, (2)
Honeydew Honey, produced by bees after they collect ‘honeydew’ (3) Monofloral Honey,
in which the bees feed mainly on one type of plant and it is named according to the plant,
and (4) Multifloral or Polyfloral Honey that has several botanical sources, none of which
is predominant (Alvarez-Suarez et al. 2014). The constituents depend on the honey types
such as; Clover Honey is produced by both New Zealand and Canada, it is lighter than
amber color with a sweet taste and you may feel a little sour aftertaste. Manuka Honey is
produced from New Zealand's Manuka tree and it can be used as medicine to cure wounds,
and it has an antibacterial property which can heal infection such as MRSA, Manuka taste
is a bit like medicinal if compared with other types of honey. Sourwood Honey comes from
sourwood trees in the Appalachian Mountains run from Northern Georgia up to Southern
Pennsylvania, it could cure cancer and has a light color with a taste like a caramel taste.
Buckwheat Honey is produced from New York and has a very dark color and a lingering
aftertaste, this thick honey is rich in iron, and has more antioxidants than its lighter
counterparts. Hence, can be noticed that the physical and chemical properties of honey are
2
Differed from one country from the other countries due to different types of weather and
environmental effects also different types of flowers as a source of nectar which absorbed
by honeybee to produce honey (Ramírez and Montenegro 2004).
Water content is a major component in honey and quantitatively depends on some
environmental factors during production such as weather, amount of water inside of hive
as a humidity and the way of treating bees during of storage time and extraction (Molan
2002). Honey with 18% or less than that amount of water content, can be stored safely for
a long time without going through a fermentation process with the same taste and smell,
but honey in case of above 18% of water content and storing for a long time, the
fermentation will take place when the yeasts grow in both number and size by using honey
sugar as a source of energy and they make a spoil of the honey taste and smell (Bogdanov
et al. 2008).
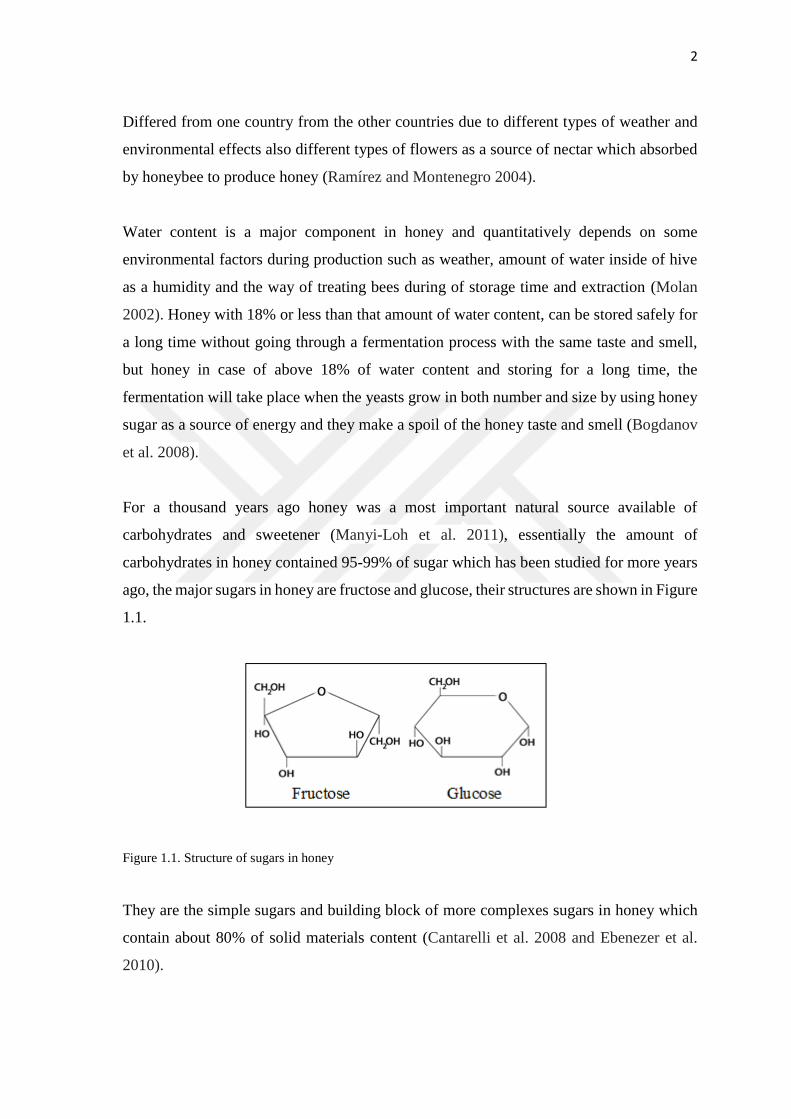
For a thousand years ago honey was a most important natural source available of
carbohydrates and sweetener (Manyi-Loh et al. 2011), essentially the amount of
carbohydrates in honey contained 95-99% of sugar which has been studied for more years
ago, the major sugars in honey are fructose and glucose, their structures are shown in Figure
1.1.
Figure 1.1. Structure of sugars in honey
They are the simple sugars and building block of more complexes sugars in honey which
contain about 80% of solid materials content (Cantarelli et al. 2008 and Ebenezer et al.
2010).

3
Protein investigation is difficult due to a high amount of sugar present and low amount of
protein around 0.1-0.4%, therefore, there is only a limited study of protein available (White
Jr, 1957). Vitamin content present in honey but in trace level such as niacin, pantothenic
acid, ascorbic acid and riboflavin along with minerals like; iron, copper, phosphorus, zinc,
magnesium, manganese and potassium (Ajibola et al. 2007 and Ajibola et al. 2012). Also,
there are several enzymes available in natural honey which is useful for food digestion
process especially starch and carbohydrates (Willson and Crane 1975). The amino acids
are important required by the honeybee for making of tissues, enzymes, etc. This content
contains two amino acids groups such as essential amino acids in which the bee does not
have the ability to produce and need to take them from an external source, and non-essential
amino acids in which the bee can transform metabolically from one to another, the essential
amino acids (e.g. tyrosine from phenylalanine, cysteine from methionine, etc.) (Hrassnigg
and Crailsheim 2005). Honey is acceptable and suitable to use in the medical profession as
a natural source for antibacterial and can use for treating some infectious and diseases
caused burns and wounds, and their effectiveness as an antibiotic is widely reported (Molan
1992 and Al-Jabri 2005).
1.1.1. Honey in Bingöl-Turkey
Turkey is one of the biggest honey and bee wax producers in the world. In recent years, it
has ranked as the fourth largest honey producer only after China, USA, and Argentina. In
fact, Turkey produces 92% of the world’s pine honey, definitely in its South Aegean
regions and West Mediterranean. Nearly in every region of Turkey beekeeping is became
traditional agricultural activity. In Turkey 20% of the world’s 25 bee sub-species could be
found. Due to this diversity, bee farmers are advised to raise native bee species of their
region alternatively of commercial bees. Turkey has strong views in beekeeping in all
regions of Turkey and 75% of beekeepers are migratory. The honey of different regions
within Turkey has different local behaviors. Around 70% of plants in Turkey are floristic
and it is became an extensive place of a variety of honey types, nectar and honeydew, both
unifloral and multifloral.
According to (Bingöl Investment Opportunities November 2011) nearly 1000 different
diversities of wild flowers, 109 of them are prevalent to Turkey, and grow in the Bingöl

4
Mountains that cut through Bingöl province. Honeys in Bingöl are generally obtained from
flowers that naturally grow on the high plains of the province. The honey has abide taste
and translucent appearance, and the aroma of unique flowers. Bingöl is greatly suitable for
apiculture because of its geographic features and Bingöl honey has a great possible to be a
trademark. According to data of (2009), 784.499 tons of honey and 82.384 bee colonies
were produced in Bingöl. The province has four honey packaging abilities. The
establishment of a queen bee production creativity will increase the amount of honey
production in the province. Bingöl can get the competitive advantage with the production
of organic honey in the sector. When the countries that import honey in the world are taken
into consideration, it is so important to develop the product which is already demanded in
high amounts (Saner et al. 2004) and (The Turkish Beekeeping and Honey Sector 2015).
1.2. Antibiotics
The term “antibiotic” is widely defined as a compound that produced by a micro-organism
that selectively inhibits the growth and increase of some other micro-organisms (Directive
2002). Antibiotics are substances that can inhibit fungi and bacteria from increasing and
growing their number by killing them outright. Antibacterial antibiotics play a major role
to heal infections, regrettably; the effectiveness of antibacterial decrease with increasing of
use over time because of a bacteria can make a resistance to those antibacterial due to
excessive use. To found and make a new antibiotic medicine is challenging also need the
high budget cost to make a test experimentation and result and additionally, a carefulness
is necessary to use the antibacterial due to some side effects such as hypersensitivity. As
healers in past years reported that increased infections of strains resistant to some antibiotic
substance mainly due to their excessive and abusive use of these antibacterial compounds.
Therefore scientists searched for a suitable and new antibacterial and among all possible
alternatives, the use of natural compound has been recommended. Among these, the
honeybee products such as honey which is historically known as a non-toxic very effective
antimicrobial (Cooper et al. 2002).
The infection by bacteria is very scary when bacteria can produce some enzyme with the
ability to digest protein, which can destroy the body cells (Church 1954). Also, bacteria
can damage the growth of protein factor when released by the body to arrange healing

5
process for regenerating damaged tissues (Postmes and Vandeputte 1999). In addition,
there are several toxically microbes which can release a toxin that destroy the body cells
(Davis and Arnold 1974). In other hands, bacteria can be a very effective factor to damage
tissue by holding antigens that fluctuate response of prolonged inflammatory immune
which makes an excess preparing of active radicals. The wounds caused by bacteria can
use oxygen, therefore the oxygen level in wounds tissue reached to that point which tissues
growth is damaged (Christopher 2003). The bacterial infection consequences will be;
uncured sore cells and the size will increase, failure of skin grafts, pain, and swelling. The
infection process can be prevented by using natural honey, which can help the immune
system of body by its anti-inflammatory effect, antioxidant activity and cell growth
stimulation (Abuharfeil et al. 1999).
1.2.1. Types of Antibiotics
Many classification ways of antibiotics available but the most used and common ways of
classification depend on their mode of action, chemical structure and activity spectrum
(Calderón and Sabundayo 2007), others include route of administration (injectable, oral
and topical). Some antibiotics can kill bacteria and some are only able to inhibit them from
growing and increasing size. Antibiotics having similar molecular structure will always
show a similar action and affectivity, toxicity, and similar side effects. Some classes of
antibiotics according to their molecular arrangement structures included of
Macrolides, Beta-lactams, Glycopeptides, Sulfonamides, Oxazolidinones, Quinolones,
Aminoglycosides and Tetracyclines (Van Hoek et al. 2011), (Frank and Tacconelli 2012)
and (Adzitey 2015). From table 1.1. the classification of some groups of antibacterial can
be seen based on chemical or molecular structure.

6
Table 1.1. Classification of antibiotics (according to British national formulary 2012) based on molecular
structure
1.3. Sulfonamides (SAs)
Sulfonamide also called sulfa drug is an organic sulfur compounds consists of p-
aminobenzoyl ring group with an amino group at the N4 position and the different
functional group at the N1 position (Tilles 2001). In chemistry, the functional group
of sulfonamide (also spelled sulphonamide) is -S (=O)-NH, a sulfonyl group connected to
an amine group. Relatively this group is unreactive. The center of amine is no longer basic.
Difficulty the S-N bond is cleaved. Because of the rigidity of the functional group,
sulfonamides are normally crystalline. Because of this reason, the formation of a
sulfonamide is a classic method to change an amine into a crystalline derivative which can
be recognized by its melting point. Sulfonamides can be used to preparing many other
important drugs (Actor et al. 2005).
RSONH2 is the general formula of a sulfonamide compound, in which R maybe alkyl, aryl
or hetero aryl etc. R1 and R2 maybe hydrogen, alkyl, aryl or hetero aryl groups. As an example;
(methanesulfonamide CH3SO2NH2). Many of sulfonamides can be prepared from the
reaction of a sulfonic acid by using amine group instead of the hydroxyl group (Ainsa
2002), Representation of general structure of sulfonamides can be shown in Figure 1.2.
Antibiotics Classes Drug Names
β-lactams Cephalosporacin, Penicillin
Quinolones Ciprofoxacin, Nalidixic Acid
Tertracyclines Doxycyline, Tertracycline
Sulfonamides Sulfadiazine, Sulfamerazine
Aminoglycosides Gentamycin
Macrolides Erythromycin, Roxithromycin, Azithromycin

7
Figure 1.2. General structure of sulfonamides
Chemically sulfa drugs are amphoteric. They act as the weak organic acid with pKa (4.79-
8.56). However, they are weakly soluble in water, at alkaline pH their solubility is
increased. SAs are polar compounds its solubility ranged (0.1 to 8 g/L) relying on the
compound within the group (Sarmah 2006). Their occurrence is in the neutral form in
which between pH (2.5 – 6), and negatively charged in alkaline conditions. Sulfonamides
are described as having a low chelating ability, and low binding constants (Sukul and
Spiteller 2006). They also have a low sorption coefficient and they are expressed to be the
majority mobile antibiotics (Tolls 2001 and Boxall 2002).
Most of the sulfonamide derivatives are prepared from exchanging of (H) atom on the N
atom of sulfonamides group at the position of N1, and others obtained from the exchanging
of the (H) atom on the nitrogen of aromatic group at the position N4. By substitution at
N1 and N4 positions, about 5000 compounds are produced. Among them, 30 are of clinical
importance. Sulfanilamide and its derivatives are prevalently known as sulfonamide or
sulfa drug. The introduction of numerous substituents ensued in the products with various
pharmacodynamics, pharmacokinetic and physicochemical properties. In Figure 1.3. the
structure of some common sulfonamide drugs are shown (Anand 1975).
1.3.1. Structure Activity Relationship
The activity of sulfonamides is extremely structure dependence, it can be detailed as
follows; (i) Free para-amino group is important for antibacterial activity. (ii) More potent
sulfa drugs were produced by the substitution of heterocyclic aromatic components at the
N4 position. (iii) In any substitution of benzene ring causes loss of activity. (iv)

8
SO2 NH2 group is not important as such sulfur atom is straight linked with the benzene ring.
(v) The further negative SO2 group at N1 exhibits larger antibacterial activity. (vi)
Substitutions prepared in the amide NH2 (N1) which have variable antibacterial activity.
(vii) The para NH2 group (N4) can be exchanged or substituted by such chemical groups
that can be changed into the free NH2 group in the body (Tačić et al. 2017).
Figure 1.3. Structure of some common SAs
1.3.2. History of Sulfonamides
Sulfonamide is one of a group of antibiotics, commonly referred to as “Sulfa drugs” which
were discovered in the 1930's. Exactly in 1935, by Gerhard Domagk, he was made a
breakthrough discovery by finding that a red dye, 4'-sulfamyl-2, 4- diaminoazo-benzene,
which was later named Prontosil. It was inactive in vitro, but it was active to inhibit
streptococcal infection in vivo (Bendjeddou et al. 2016). The lack of correlation between
in vitro and in vivo antibacterial tests prompted Domagk to resort to in vivo testing, a
very fortunate decision, since otherwise the fate of sulfonamides might have been
different. Gerhard Domagk had explained that the Prontosil dye behaved as an
antimicrobial when injected into an infected mouse but not when tested against bacteria

9
growing in a test tube. After that, the reason for that strange action was understood
(Bhattacharjee 2016). Domagk’s discovery led to the other serious discovery of antibiotics,
and he gained the noble price award at 1939, one year after Domagk’s discovery of the
anti-streptococcus activity of the dye Prontosil, in 1936 from the Pasteur Institute in Paris,
Ernest Fourneau revealed that Prontosil breaks down in the human body to produce
sulfanilamide as shown from the equation 1.1., which is the active agent that kills
streptococcus bacteria. By Fourneau’s discovery, a flurry of research on structural
derivatives of sulfanilamide generated which led to in the development of a group of greatly
successful antibiotics that have protected millions of lives (Nicolaou et al. 2017).
Prontosil Sulfanilamide
Domagk's discovery rapidly resulted in the development of a multiplicity of sulfonamides,
all of which were principally substituted from sulfanilamides. In the meantime, there have
been many correspondents of sulfanilamide developed as pharmacological agents that
show an extensive range of biological activities. For instance, Amprenavir is used in HIV
therapy, Glibenclamide was used as a hypoglycaemic agent, Sulfathiazole for an
antibacterial agent. Acetazolamide was used as a carbonic anhydrase inhibitor, E7070 for
an anticancer agent, and Furosemide as a diuretic. Also in 1938, the effective antibiotic
Sulfapyridine was shown against pneumonia. While in 1941 Sulfacetamide was found
greatly which successfully used in fighting urinary tract infections starting. And the
Succinoyl-sulfathiazole since 1942 has been used against gastrointestinal tract infections.
During World War II Sulfathiazole was used very efficiently to cure the infection in
fighters with weapon wounds. Sulfa drug, is an effective antibiotic which never gained
widespread use due to its greater human toxicity against its various derivatives (Supuran et
al. 2004).

10
1.3.3. Sulfonamides in Environment
The usage of antibiotic has benefited the animal industry and facilitated providing
reasonable animal proteins to the developing human population. Though, the wide use of
antibiotic outcomes in the inhibition of sensitive organisms whereas selecting for the
resistant ones, agricultural use is contributing significantly to the spread and appearance of
antibiotic resistance in the environment. Up to now, predominantly the scientists are
focused on the spread and appearance of bacteria resistant and genes into the environment
as an effect of veterinary treatment, particularly through manure, direct animal contact, and
food products. However, environmental pollution with the residues of antibiotic might also
be a significant factor in the variety and distribution of antibiotic resistant bacteria. The
persistence of antibiotics in the environment depends on climate, soil type, and also on
physical and chemical characteristics of the diverse types of antibiotics. Observing studies
were showed that considerable concentrations of the residues of antibiotic can occur in
water and soil, and in locations close to animal farming.
Because of using huge amounts of sulfonamides in animal husbandry mainly as veterinary
medicine cause to the harmful effects on popular health and environment, and also they are
commonly known as most contaminant antibiotic in honey. However, they are generally
used in the treatment of humans and animals but also they have a risk as environmental
impurities. They clearly have the potential to enter waters, sediments, soils, animal waste,
surface waters, and groundwater, and have been perceived in environmental samples, for
instance, sulfamethazine’s detectable concentration was found in soil agricultural seven
months after the manure application. In another study, the concentration of
sulfachloropyridazine above to 590 µg/L was detected in drainage waters seven days after
application of manure on clay loam soil. SAs are expected to occur in the environment in
a bioavailable form fixed on their relative stability and physiochemical properties, therefore
they may carriage a risk with detail to antimicrobial resistance expansion (Pikkemaat et al.
2016).

11
1.3.4. Synthesis of Sulfonamides
Because of the widely used of sulfonamides, it is required to find the effective and general
way for their preparation and synthesis. Therefore the interest in the synthesis of these
compounds is continuing. Up to now, many synthetic methods have been developed. The
most common method for sulfonamides preparation is by the reaction of proper sulfonyl
halide, either aromatic or aliphatic, with amines or ammonia. Thus, similarly, heterocyclic
sulfonamides were prepared through the reaction of heterocyclic sulfonyl halide with
amines or ammonia.
(1.2)
Sulfonyl chloride Ammonia Sulfonamide Ammonium chloride
The equation 1.2. represented the synthesis of sulfonamides using an aromatic sulfonyl
halide with ammonia as a reactant to produce aromatic sulfonamides, and the equation 1.3.
represents the synthesis of sulfonamides from the reaction of aromatic sulfonyl halide with
amines.
(1.3)
Sulfonyl chloride Amine Sulfonamide Hydrogen chloride
Typically the reaction between amines and sulfonyl halide is catalyzed by a basic catalyst
such as potassium carbonate, sodium carbonate, triethylamine or pyridine.
The method of sulfonyl chloride denotes the most direct and simple route for the
preparation of sulfonamides. This is because of the ease with which the necessary sulfonyl
chlorides in high yields are obtained (Kołaczek et al. 2014).

12
1.3.5. Application of Sulfonamides
SAs derivatives can be used in biological applications, they are widely used as
antimicrobial, anti-cancer, anti-inflammatory anti-diabetic, anti-epileptic, antifungal
(Asker et al. 2017), antiviral, antineoplastic, antithyroid agents as well as HIV protease
inhibitors. Also, some derivatives are well recognized as an antimetabolite considering this
type of compounds a “privileged structure” in medicinal chemistry (Camargo-Ordoñez et
al. 2011). And in another study new sulfonamides have shown good cytotoxic effects
against breast cancer cells. Sulfonamides are the first effective chemotherapeutic agent that
used cure the bacterial infection in human beings (Saeedi et al. 2014).
SAs are commonly used as a microbial agent to treat the infections by bacteria and inhibit
the growth of gram negative and gram positive bacteria, some fungi, and protozoa. They
are also used in the clinic to treat several infections such as; gastrointestinal infections
and urinary tract infections, eye infections and as a prophylaxis of rheumatic fever.
Sulfonamides that are aromatic or hetero-aromatic can inhibit the growth of cancer. They
are also used as an anti-tumor by preventing the carbonic anhydrase. SAs antibiotics are
used as veterinary medicines to treat infections in livestock herds (Afroz et al. 2012). In
other hand, sulfonamides can be used to inhibit many enzymes such as Serine protease,
cyclooxygenase, matrix metalloproteinase and carbonic anhydrase (Rehman et al. 2017).
Inhibition of carbonic anhydrases has been done by the drugs containing sulfonamide
functional group and these carbonic anhydrase inhibitors are also reported as potential
anticancer, antiglaucoma (as substituted heterocyclic and aromatic sulfonamides),
diuretics, and anti-obesity agents. Therapeutically sulfonamides are being widely used in
human (especially where other antibiotics are non-tolerable to patients) and veterinary
practice (Abdul Qadir et al. 2015).
For agricultural purposes, many derivatives of sulfonamide have been reported due to their
antifungal and herbicidal properties. The new developed sulfa drugs with different
mechanism of action have become an emerging demand to overcome existing drugs
resistant pathogens. As the pathogenic organisms (bacteria, fungi, and mold) are exposed
or treated medically with routine antibiotic drug molecules, they become considerably
resistant with the emergence of new species as permutation, conjugation, transduction,

13
or transformation (Abdul Qadir et al.2015). SAs are classified into two groups;
sulfonylartylamine, non sulfonylartylamine and sulfonamide moiety-containing drugs and
the other is based on cross reactivity theory i.e., Sulfonamides Antibiotics (SA) and
Sulfonamides Non-Antibiotics (SNA) (Shakoor 2013).
1.3.6. Classification of Sulfonamides
Classifications of sulfonamides are based on chemical structure, duration of action, the
spectrum of activity and therapeutic applications. Common classification of sulfonamides
is based on their therapeutic applications. There are three groups of sulfonamides according
to their duration of action:
1.3.6.1. Short Acting Sulfonamides
These are preferred for systemic infections as they are rapidly absorbed and
rapidly excreted. For example, sulfadiazine, sulfadimidine or sulfamethazine, and
sulfamethoxazole have been used for the treatment of the infection of the urinary tract
(Locuson et al. 2007).
1.3.6.2. Intermediate or Moderate Acting Sulfonamides
These are used for infections requiring prolonged treatment. For example, sulfacetamide,
sulfadoxine. The sulfadoxine is an ultralong-lasting sulfonamide can be used to treat
malaria when combined with pyrimethamine. It is also used, usually when it is combined
with other drugs can be used to treat or prevent several livestock infections (Boison et al.
1996).
1.3.6.3. Long Acting Sulfonamides
These are rapidly absorbed and slowly excreted. For example, sulfametopyrazine,
sulfasalazine, which is marketed as azulfidine in the U.S. and salazopyrin & sulazine in
Europe and Hong Kong, was developed over 70 years ago specifically to treat rheumatoid
arthritis. Sulfapyridine can be reacted with salicylate with an azo bond to produce
mesalazine and its derivatives such as sulfasalazine. It may be abbreviated SSZ. In addition

14
to these, there are different types of sulfonamides which have been used in various types
of infections. For example, sulfabenzamide used in mucous membrane, sulfacetamide
sodium used for superficial ocular, sulfadiazine used in urinary tract infection and
sulfamethizole used in bacterial infections (O’Shea and Moser 2008).
1.3.7. Side Effects of Sulfonamides
Sulfonamides are potential hazard compounds if they used in high dosage, they may cause
a hypersensitivity reaction, urinary tract disorder, and intense allergic reaction. Around 3%
of the population when treated with sulfonamides as an antibacterial agent, they have
adverse reactions. It observed that 60% of HIV patients have more prevalence (Tilles
2001). Reactions of hypersensitivity are rarely happening with nonantibiotic sulfonamides,
and it has been noted that those patients with hypersensitivity reaction by antibiotic
sulfonamides, do not have increased hypersensitivity with nonantibiotic agent
sulfonamides (Slatore CG and Tilles 2004). The arylamine group at the position of N4 is
responsible to make allergic side effect of sulfonamide antibiotics, it present in
sulfasalazine, sulfadiazine, antiretroviral, sulfamethoxazole, fosamprenavir and
amprenavir. Thus, it recommended to those patients with the allergic reaction of arylamine
sulfonamides to use those antibiotics with lack of arylamine group or non-aryl sulfonamide
(Knowles et al. 2001).
Chemical structure of two regions of the sulfonamide antibiotic is involved in the
hypersensitivity reactions related with the N1 heterocyclic ring, which causes a type
I hypersensitivity reaction, and with the N4 amino nitrogen which forms reactive
metabolites that cause either direct cytotoxicity or immunologic response in a
stereospecific process.
1.4. Sulfonamides in Honey
Honey is the most important healthy and consumable natural product in whole
of the worlds, however many antibiotics used by beekeepers in apiculture, including
sulfonamides to prevent some bacterial disease known as American and European
foulbrood (AFB and EFB) they reported that a strong and destructive disease that can affect

15
honeybees, caused by Paentibacillus and Melissoccuus pluton (Bacillus larvae) the
outcome of treating bee with makes honey contamination by trace amount of sulfonamides
and it can be detected and measured quantitatively, sulfonamides commonly used as an
antibacterial agent in the food industry and veterinary for therapeutic and prophylactic
purposes, therefore sulfonamides residue can be found and detect in more animal and
harvest food products such as egg, meat, milk, fish and honey. And also used as food
additives (Gunes et al. 2009).
Therefore, determination of sulfonamides in food products is the main concern for
preventing those side effects that mentioned before caused by high dosage of sulfonamides
and monitoring of sulfonamides content, therefore honeybee treating with sulfa drugs
forbids by European Union. Regulatory agencies are responsible for declaring that harmful
residues of these drugs are not present in honey. The amount of sulfonamides in honey is
different from one country to another country and generally, the LOQ range between 20-
50 ng/g. Currently, the actual detection of sulfonamides refers that in Europe no maximum
residue level (MRL) for sulfonamides in honey exist. Based on the initially concerned
compounds (sulfa drugs and metabolites) and the residue level of these compounds
recommended being below the (limit of quantitation LOQ) using most precise and accurate
analytical method, Switzerland concerned of LOQ approximately 50 µg/kg for honey.
(Maudens et al. 2004). Many countries are prohibited use of sulfa drugs for treating bees,
but due to importing honey from other countries by some EU countries, therefore the action
limits were established by many EU countries such as Switzerland, UK, and Belgium,
which amounts sulfonamides residue allowed between 0.01 to 0.05 mg/kg, and (EU
Commission Regulation) (EU) No.37/2010 established 100 μg/kg, the Brazilian honey
sulfonamides content arranged to be below of 100 g/kg (da Presidência et al. 2007). France
was at 50 and 15 g/kg respectively. In some country such as turkey, using sulfa drugs or
antibiotics has been prohibited and illegal by the authorized ministry and according to
Turkish Food Codex Honey Communique harmonized with European Commission Honey
Directive, therefore, there is no MRL established for total sulfonamides residue in honey
(Gunes et al. 2009). Sulfathiazole was first recommended to control AFB, but now, for
many months Sulfathiazole residue in honey was founded and remained, therefore, it is
banned to use anymore, and this fact caused a major concern due to the possible appearance
of resistance phenomena in consumer’s health. However, it is well-known that in various

16
honey samples these compounds can be found according to the origin of the sample
(Kujawski et al. 2008). In addition; the aromatic group of SAs can react with reducing
sugar to produce different sugar bonded compound with different chromatographic
behavior. Due to many problems coming from the excess level of SAs, therefore the sulfa
drugs residue analysis and the quantification of them in honey must be strongly concerned,
their MRLs values should be regulated and the use of them must be monitored under the
control limit in the food products mainly honey to detect the presence and amount of SAs
and class of level in order to prevent the side effects and for ensuring of safely used (Sheth
and Sporns 1991) and (Tashakkori et al. 2014).
1.5. Analyzing Techniques for Sulfonamides in Honey
Many techniques and methods are available for detecting and determination of
sulfonamides in honey such as Colorimetric technique (Schwartz and Sherma 1986), Thin
layer chromatography (Zotou and Vasiliadou 2006), Enzymes immunoassay (Thomson
and Sporns 1995), LC, LC-MS and GC, GC- MS, Radioreceptor assay (Schwaiger et al.
2000), Biosensor immunoassay (BIA), High performance capillary electrophoresis
(HPCE) (Shao et al. 2005), Capillary electrophoresis (Bateman et al. 1997), and RP-HPLC.
Among those techniques, HPLC is one of the best ways of analyzing sulfonamides in
biological and water matrices. Because it is more precise and accurate for both quantitative
and qualitative analysis with a capability of separate components so; by using this
technique all the components can obtain separately with high purity as from Figure 1.4.
can be seen. During the past 5 years, multiple analytical methods based on RP-HPLC for
the determination of sulfonamides in honey have been published. Some of them use UV-
VIS detection, others use pre-column derivatization with fluorescence detection (Martel
and Zeggane 2003).

17
Figure 1.4. Separation of the mixture into its components
The liquid chromatographic technique is one of the best analytical technique that based on
the separation of components due to differences in their molecular structure and/or
composition. Generally, the chromatographic technique involves sample passing through
a column that contains stationary phase and the sample moved and held by a liquid mobile
phase, the separation based on the difference of molecular affinity to the stationary phase
finally all components will separate with different elution or retention time. Consequently,
a molecule with high affinity to the stationary phase displays a slow moving through a
column with a high retention time and a component that has a weak interaction with
stationary phase elutes quickly and faster with law retention time as shown from the Figure
1.5., therefore, a separation by LC depends on the variety of moving speed through a
column (Sundaram et al. 2009).
Figure 1.5. Separation of mixture components by LC

18
1.6. High Performance Liquid Chromatography (HPLC)
HPLC expression was developed by Horváth et al. in 1967 during his experimentation at
his lab with a material that contains a special porous and was needed a pressure over 1000
psi so; Horvath said, “this is not LC anymore, this is high-pressure LC (HPLC)” (Horvath
et al. 1967) and then another Hungarian, Halasz thirty five years ago changed the
fundamental for the fine particles that packed inside column as a stationary phase with that
new condition he separated 15 compounds (Halász et al. 1975).
HPLC comes from a high improvement of column liquid chromatography based on a pump
that flows down of mobile phase through a column instead of by gravity, for this reason, it
necessary to use a pump to generate a pressure up to 42000 kpa that makes analyzing by
HPLC is much faster than column liquid chromatography, as a reminder that all
chromatographic separation techniques even HPLC are based on the same principle; the
basis of sample components separation depends on the difference of analyte constituents
affinities for the mobile phase and the stationary phase inside of the column used in the
separation (Snyder et al. 2011). Since the development date of HPLC up today there are
continuous improvements especially in the stationary phase, here some variations of
HPLC, according to physical properties of (stationary phase) of the process in the system.
1.6.1. HPLC Historical Background
The Russian botanist Mikhail Tswett in 1906 that described the separation phenomena
when the mixture of natural colors (plant pigment) was passed through a tube of CaCO3 or
alumina and using petroleum ether, just after Tswett discovery, a modern Liquid
Chromatography (LC) was used a liquid materials as a mobile phase for holding the analyte
constituents through a column packed that contained a solid material called the stationary
phase (phase of separation), there are two main modern chromatographic techniques that
are very widely used in chemical analysis as a separation technique which are: Gas
Chromatography (GC) and High-Performance Liquid Chromatography (HPLC).
HPLC is the most widely used analytical technique for separation and analyzing purpose
in drug synthesis manufacture for controlling the quality and purity and researches. HPLC

19
can be used for qualitative and quantitative analysis of the unknown sample and determine
the types and amount of constituents and separation of mixtures for later analysis
preparative HPLC. To analyze a mixture to by chromatography technique a trace amount
of sample mixture is injected into the system by manual injection or autosampler then
passed through a column that contain a large amount of micro size particle as stationary
phase using a liquid material or solvent and different molecules exist the column at
different times this is named separation. The separation of mixture components based on
the different interaction force between the analyte constituents with a stationary phase. A
stationary phase included in a stainless steel tube (column) the most common stationary
phase that used in this technique is silica gel (surface-modified silica particles) and a mobile
phase (solvent) is moved through the system and carrying the analytes through a column
that contains a stationary phase. In HPLC, the stationary phase contains a very small with
a standard particle size in the unit of micro for column chromatography is 60 microns and
for HPLC is generally 5 microns , this is to maximize the interaction area between analyte
constituents with stationary phase which makes the excellent separation, the solvent, and
mobile phase flow and passing through such a dense and small particle phase is difficult
and needs for pumping to generate pressurized flow by several thousand pounds per square
inch (psi) which makes flow of ml/min. Therefore, HPLC during analyzing called high-
performance liquid chromatography and according to base on working called high-pressure
liquid chromatography (Fekete et al. 2009).
1.6.2. Instrumentation
Every HPLC instrument have these main components: solvent reservoir, pump, injector,
column, detector, integrator, and display system.
1.6.2.1. Solvent Reservoir
The solvent reservoir is a glass that contains a mobile phase, in HPLC the mobile phase
maybe polar or nonpolar liquid depending on the type of analyte that presents in a sample.

20
1.6.2.2. Pump
HPLC pump section duty is to receive the mobile phase from a solvent reservoir and forced
it down into a column then to the detector, this section can generate a pressure over 42000
kpa and the operation pressure depends on the column dimension, particle size flow rate
and mobile phase content.
1.6.2.3. Sample Injector
The injection section of HPLC can be automatized in an autosampler, it should give the
infusion of the sample fluid inside the scope of 0.1 mL to 100 mL of volume using
microsyringe, and it should have a great repeatability and work at the high pressure greater
than 4000 psi.
1.6.2.4. Column
Columns are typically made of cleaned metal commonly stainless steel with 50 - 300 mm
length, the diameter ranged between 2 and 5 mm. A column internally contains with a
particle size around 3–10 µm, always the oven temperature and mobile phase temperature
should be constant during a period of analyzing because the viscosity of mobile phase can
get decreased and the result of separation will fluctuate. The column is always used to
separate sample constituents according to the difference between their molecular
structures.
1.6.2.5. Detector
The HPLC detector designed to a place and installed just after the column distinguishes the
analytes as they elute from the chromatographic column. The most common detectors are
UV-spectroscopy, mass-spectrometric, fluorescence and electrochemical detectors.
1.6.2.6. Data Collection Device or Integrator
After the detection of each separated components, the detector can send a signal and
gathered on the chart recorders or electronic integrators that vary in complexity and in their

21
ability to process, save and calculation reprocess chromatographic data as shown from the
Figure 1.6.
Figure 1.6. Detector signals are shown by chromatograph
The chromatograph is easy to read, that shows the recorded output of detector as a series
of peaks, each peak representing an individual component in the mixture passing through
the detector. The amount of each analyte can be seen by calculating the area of each peak
and using in the automatized mathematical calculation with computerized calculation
software the amount of each analyte can be determined (Thammana 2016). All of HPLC
sections are connected together by stainless steel tubing in a series way by a stainless steel
tube as shown in the Figure 1.7.
Figure 1.7. HPLC instrumentation

22
1.6.3. Types of HPLC
1.6.3.1. Normal Phase HPLC
Separation by this type of HPLC is based on the polarity. Normal phase uses nonpolar
mobile phase such as methylene chloride, chloroform, hexane and diethyl ether, with a
column that contains polar stationery phase commonly used silica, and this method can be
used to separate a mixture of polar analytes when more polar constituent remains more
times at the surface of stationary phase than less polar parts (Majors and Hopper 1974).
1.6.3.2. Size-Exclusion HPLC
The separation of sample constituents based on the size of molecules when a column is
filled with controlled pore size substance. The bigger molecule size elutes first while
smaller molecules retain later (Lues et al. 1998).
1.6.3.3. Ion Exchange-HPLC
This technique can be used to analyzing a sample that contains an ionizable constituent and
the surface of stationary phase has an opposite ionically charged against the sample ions
using the aqueous buffer as a mobile phase for elution, the separation by this technique
depends on both pH and ionic strength. Therefore, the stronger charged analyte remain
more time than weaker to the elution process (Bhattacharyya and Rohrer 2012).
1.6.3.4. Reverse Phase HPLC
This type of HPLC contains nonpolar stationary phase (hydrophobic) with polar mobile
phase (hydrophilic) , the solution of water with methanol or acetonitrile or a mix of both
used as a common mobile phase. The separation by this technique depends on the
hydrophobicity interaction between the solute molecule in the mobile phase and the
hydrophobic stationary phase, thus, more polar analyte remains for shorter time inside of
the column and elutes firstly (Aguilar and Hearn 1996) and (Dorsey and Cooper 1994).
The mixture of analytes is initially applied to the sorbent (separation phase) with aqueous

23
buffer solution. Then, the solute elutes by using the mixture of mobile phase with the
organic modifier. The elution process can be done by either isocratic pump mode or
gradient, if isocratic used, the flow of organic solvent will be constant if gradient mode
used, the flow of organic solvent changes and increases during a period of analysis (Aguilar
and Hearn 1996). The organic modifier used for increase molecular hydrophobicity
(Aguilar 2004). RP-HPLC is a most powerful technique for the analysis and separation
because of the following factors:
More conditions can be used to achieve excellent resolution.
Easy to use and selectivity can be optimized through changes in mobile phase
characteristics and composition.
Generally has high recoveries.
Good reproducibility separation over a period of time.
Because of these factors, RP-HPLC is one of the best ways of analyzing and quantification
of sulfonamides in honey. Figure 1.8. represents the schematic configuration of RP_HPLC.
Figure 1.8. RP-HPLC schematic configuration
There are many detectors can be used with HPLC to see the presence of the analyte which
has different components from the mobile phase composition then can convert the signal
and information into the electrical signal (Thammana 2016). Here some common detector
used with HPLC such as
Diode Array
UV-Visible
Refractive Index

24
Fluorescence
Light Scattering
Conductivity
Mass Spectrometer
High performance liquid chromatography coupled with UV detector is one of the best ways
that can be used to study of sulfonamides in honey.
1.7. Applications of Reversed Phase HPLC
RP-HPLC is typically used applicable for when the analytes molecule weight is very small
(M.Wt. < 2000 Da). The method with this technique can be developed using C18 or
Octadecylsilane (ODS) column initially. RP can also is applicable when extended to
analyses and separation of weak electrolytes such as weak acid and weak bases with
extreme control of mobile phase composition especially the organic modifier and buffer to
control the analytes ionization process during the elution time, another application of RP
is to analyze of amino acids, peptides and protein using the column of short chain alkyl
stationary phases. Other compounds with M.Wt above 2000 can be also analyzed with RP
technique but needs to use of additives, pH control and may need special column treatment
(Aguilar 2004)
1.8. Goals and Objectives
1.8.1. Goal
The main goal of this master thesis is to develop an optimized method for measuring of
sulfonamides residue in different honey samples by RP-HPLC-UV with isocratic elution
mode.
1.8.2. Objectives
1. The explanation of the theoretical background and types of Honey and its
importance.

25
2. Discuss basic theory behind antibiotics, types of antibiotics, and sulfonamides with
advantage and side effects.
3. Discuss the basic theory of chromatography.
4. In order to understand HPLC and to utilize its practical applications effectively,
some basic concepts of instrumentation and components of high performance liquid
chromatography are mentioned.
5. Checking suitable chromatographic condition for analyzing.
6. Preparation of mobile phases with some different pH to make a good peak diagnosis
in order to reach a good peak resolution condition.
7. Preparation of sulfonamides standards and making HPLC calibration then
Validation.
8. Appling a procedure for sample preparation before injecting and analyzing.
9. Injecting prepared samples and calculation.
10. Determination of the amount of sulfonamides in honey samples.

2. LITERATURE REVIEW
Due to the importance of sulfonamides and health care of the human body, there are
many scientific articles and research published about analyzing of sulfonamides and
determination quantitatively in a different matrix of food products by HPLC as mentioned
from the researches below.
Bernal et al. showed an analytical method for detecting a trace amount of sulfonamides
residue in honey by HPLC, the sample was prepared and treated with methanol to prevent
emulsion, turbidity and to breakdown sulfonamide-sugar bond as mentioned before that
honey contains around 80% of sugar, the limit of quantification founded between the range
of 4-15 ng/g and the percentage of recoveries ranged between 56%-96% (Bernal et al.
2009). In 2008 some researchers developed another method for sulfonamides in honey
using an internal standard technique with sulfapyridine, this experiment managed and
validated by Granja et al. also there are some changes with proposed method for the
determination and analysis of sulfonamides using Brazilian honey sample. The limit of
detection was calculated as 3 ppb for sulfathiazole, 5 ppb for sulfadimethoxine and 4 ppb
for sulfamethazine, also the average recovery percentage was 61% for sulfathiazole, 86%
for sulfadimethoxine and 94.5% for sulfamethazine at a level of 100 µg/kg (Granja et al.
2008).
The fast method Salting-out liquid-liquid extraction (LLE) used water-miscible organic
solvents as the extractants was improved by Liu et al. for the determination of sulfa drugs
residue in different matrix and honey in 2010, this method mentioned liquid-liquid
extraction during sample preparation step and 1mL microsyringe as a separation phase tool,
acetonitrile used as an extraction solvent in very low volume. The calculation showed that
the average recovery percentage valued between the range of 31.97% to 66.54% and this
developed method was more accurate with law RSD, therefore, it was accepted for a real
application (Liu et al. 2010).

27
Tsai with his collaborators in 2010, are another researchers that they used a simple
sugaring-out assisted liquid-liquid extraction method combined with high-performance
liquid chromatography with fluorescence detection (HPLC-FL) for the extraction and
determination of sulfonamides in honey., acid hydrolysis was used to breakdown
sulfonamides-sugar bond then sugar separated and released, the sulfonamides residue
derivatized with fluorescamine, they were partitioned into the organic layer below the
honey/mobile phase system. The recoveries were 80.9-99.6 % for honey at three levels (5,
20 and 100 ng/g) and the linearity was obtained from (2 to 200 ng/ml) and Limits of
detection for the sulfonamides studied were found to range from 0.6 to 0.9 ng/g. (Tsai et
al. 2010).
Bedendo and his collaborators were described a precise and sensitive analysis using hollow
fiber renewal liquid membrane (HFRLM) extraction followed by high performance liquid
chromatography–tandem mass spectrometry (LC–MS/MS) for determination of five SAs
in honey samples. In this method, the organic solvent presented directly into the sample
matrix extracts the SAs and carries them over the polypropylene porous membrane. The
most important parameters affecting the extraction efficiency were optimized by
multivariable designs (sample mass and pH, a buffer for stripping phase and pH, time and
temperature of extraction, volume and type of extractor solvent and use of salt to saturate
the sample). Limit of detection in the range of 5.1–27.4 μg kg−1 and linearity coefficient of
correlation higher than 0.987 were obtained for the target analytes. The results obtained for
the proposed method show that HFRLM–LC–MS/MS can be carried out for determination
of the five SAs studied in honey samples with excellent precision, accuracy, practicality
and short analysis time (Bedendo et al. 2010).
A fast and selective method was developed by Chen et al. for the determination of
sulfonamides (SAs) in the honey based on the magnetic molecularly imprinted polymer.
The sample was blending and stirring for the extraction solvent and polymers. After
completing the extraction, the polymers, along with the captured analytes, were definitely
separated by an adscititious magnet from the sample matrix. The analytes eluted from the
polymers were determined by liquid chromatography-tandem mass spectrometry. Under
the optimal conditions, the detection limits of SAs are in the range of 1.5−4.3 ng g−1. The
relative standard deviations of intra- and interday ranging from 3.7% to 7.9% and from

28
4.3% to 9.9% are obtained, respectively. The proposed method was successfully applied to
determine sulfonamides including sulfadiazine, sulfamerazine, sulfamethoxydiazine,
sulfamonomethoxine, sulfadimethoxine, sulfamethoxazole and sulfaquinoxaline in
different honey samples. The recoveries of SAs in these samples from 67.1% to 93.6%
were obtained (Chen et al. 2009).
In 2002 liquid chromatography (LC) method in combination with tandem mass
spectrometry (MS–MS) has been developed by Verzegnassi et al, and applied to the
separation and detection of 10 different sulfonamides in honey. In the method, a simple
hydrolysis of the honey sample was used to release sugar-bound sulfonamides followed by
liquid–liquid extraction of the 10 analytes, filtration, and analysis by LC–MS–MS.
Conditions for RP-LC and electrospray ionization (ESI) MS–MS in the positive ion mode
were optimized for the 10 compounds, monitoring two characteristic mass transitions
simultaneously for each analyte. The procedure is a qualitative confirmatory method for 10
sulfonamides at the low μg/kg level in honey. The recoveries of the analytes in honey
ranged from 44 to 73% at a fortification level of 50 μg/kg (Verzegnassi et al. 2002).
A solid phase extraction (SPE) for sample preparation step using acetate buffer (pH 5.0)
was settled in 2002 by Posyniak et al. liquid chromatography analysis for SAs residues in
honey was used, The liquid chromatography (LC) separation was carried out on the
reversed phase C18 column, the mobile phase contains acetic acid and acetonitrile, with
gradient pump mode and fluorescence detection, after pre-column derivatization.
Recoveries were above 80%, and LOQ was 0.1 mg/kg for sulfacetamide and 0.2 mg/g of
sulfamethazine and sulfathiazole (Posyniak et al. 2002).
Separation and quantification of six sulfonamides (sulfamethoxazole, sulfacetamide,
sulfamethazine, sulfadiazine, sulfathiazole, and sulfanilamide) using HPLC-fluorescence
detection method was developed by Bonta and his co-workers in 2009, the analytes were
extracted from honey with extraction mixture (acetonitrile and dichloromethane) after
hydrolysis by acid then cleaned by a C18 SPE and pre-column derivatization with
fluorescamine. RP-HPLC with gradient pump mode performed, 30 min time of analysis.
LOD for sulfadiazine and sulfamethazine was at 2μg/kg, and 3μg/kg for sulfanilamide,
sulfacetamide and sulfathiazole and 5μg/kg for sulfamethoxazole. The sample preparation

29
step was efficient and the recoveries of the analytes in spiked honey ranged between 47 to
79% (Bonta et al. 2009).
In 2013 a new RP liquid chromatography method (HPLC-FLD and LC-MS/MS) developed
by Tolgyesi and his co-workers. Their method used for determining the amount of sulfa
drugs residue in incurred and spiked honey sample. The optimization of sample preparation
carried out using Qasis (hydrophilic-lipophilic balance) and SPE cartridge used for sample
preparation step procedure. They used three different medium for sulfonamides elution
(Acidic, Basic and neutral). the average recovery founded that is ranged between 66.8 -90
%, which is higher than the other conditions by 10% .the strata-XL used to test for sample
clean-up. Mobile phase contains ternary (methanol-acetonitrile and phosphate buffer
solution pH 5) and Varian C18 column. This condition of analysis showed a good
selectivity for determination of sulfonamides, a computer simulation used to control ternary
gradient pump mode, using Dry-lab software LC-MS/MS analysis and separation of
analytes was carried out on a kinetex-XB core-shell type. LOQ (0.01-0.05 µg/kg) and the
time of analysis faster and shorter (6 min), this developed method validated based on
European Union Commission Decision 2002/657/EC and it was successful for
quantification of more than four hundred of honey samples. The result of sulfonamides
concentration was 0.03 up to 686 µg/kg (Tölgyesi et al. 2013).
Another validated procedure of sulfonamides residue in honey was developed by Szczesna
et.al in 2009. they used RP-HPLC for separation and fluorescence detector to detection,
identification, and quantification of sulfonamides after pre-column derivatization by
fluorescamine, after calculation of quantification limit with LOD of each analyte the
developed method was validated, the hydrolysis parameters (Temperature and mixing
condition) sulfonamides-sugar bond was carried out and determined to control the
repeatability and recovery of sulfonamides. To achieve a good separation of 4-
aminobenzoic acid which occurred in some types of honey from sulfamethazine and
analysis of other sulfonamides such as sulfacetamide, sulfadimethoxine, sulfamerazine,
sulfachlor pyridazine, sulfathiazole, sulfamethoxy pyridazine, sulfamethoxazole,
sulfanilamide, sulfamethazine. The calculation of LOQ and LOD of each sulfonamide
showed that LOQ=0.3 and LOD=0.2 µg/kg. In the normal analysis, the recovery percentage

30
was 37% for sulfacetamide and 93% for sulfanilamide. The repeatability coefficient ranged
between 1.8 for sulfadimethoxine and 1.4 for sulfadimethoxine (Szczêsna et al. 2009).
In 2016, Kivrak et al. were developed a more accurate method for detection of antibiotics
in honey including of sulfonamides using UPLC with tandem mass spectroscopy detection
(UPLC-MS/MS), and the method validation successfully applied for 23 analytes of
antibiotics. The developed method consists of sonication for ultrasonic extraction and
filtration followed the analysis by UPLC–ESI–MS/MS, the method was involved of the
study of the optimum condition of analysis for the weight sample and temperature of
extraction in term of recovery percentage. Determination of antibiotics included
sulfonamides was fulfilled by UPLC separation with a column specification of BEH C18
(100 mm x 2.1 mm, 1.7 µm) and gradient pump mode for elution of mobile phase the mass
spectrophotometry detection. This method was applied to detecting the antibiotic residue
in the honey sample which found in some turkey markets at Muğla city (Kivrak et al. 2016).
In 2014, Tashakkori et al. were developed a cheap, fast, simple and selective analytical
method by HPLC using cetyltrimethylammonium bromide-silica gel for preconcentration
for sulfamerazine, sulfadiazine, sulphamethoxazole, sulfamethazine and antibiotics
detection and quantification by RP-HPLC. The investigation parameters such as pH value,
class and amount of surfactant, mobile phase flow rate and the eluting volume agent was
studied. The limit of detection of sulfonamides was 3-13µg L-1 (LOD of the method) with
the linearity of 0.010-2.0 µg/mL. The method was applied successfully for sulfonamides
determination in various honey samples (Tashakkori et al. 2014).
The first automated flow injection system combined with re-generable antigen microarrays
was developed in 2011 by Wutz and his collaborators for determination of antibiotics
residue in honey samples. The scheme depends on the indirect competitive immunoassay
format by monoclonal antibodies attached to the surface of the microarray. The slide was
coated by epoxy-activated poly (ethylene glycol) at the surface. This method has a fast
analysis result for 4 analytes without extraction and purification technique. The quality
control parameters of this method were studied, the recoveries of sulfadiazine (89%±20%),
enrofloxacin (92%±6%), sulfamethazine (130%±21%), and streptomycin (93%±4%)
(Wutz et al. 2011).

31
In 2005 Krivohlavek again was talked about that the sulfonamides are stable
chemotherapeutics and can be used as an antibacterial drug to avoid bacterial disease
affecting bees, therefore the sulfonamides residue could be available in honey after bees
treatment with antibacterial agents, and the concentration must be monitored in the range
of desired value. For this reason, they developed a reliable, simple and fast analyzing
method for quantification of 11 sulfonamides after the method was optimized. The sample
was prepared by solid phase extraction after homogenization using a Chroma bond C18
end‐capped cartridge followed by LC/MS analyses. The specification parameters of the
method were studied, the limit of detection was 25 μg/kg was achieved for all
sulfonamides. Other important parameters also investigated and approved such as buffer
pH of mobile phase and temperature (acetic acid buffer) (Krivohlavek et al. 2005).
Sheridan et al. in 2008 were developed a new method for determination of 14 sulfa drugs
and chloramphenicol in the honey sample. These antibacterial agents have been avoided to
use in production by animals. However the residue of them have been found in many
samples, therefore the multiresidues analysis technique and method is needed in honey.
The sample was prepared by following acid hydrolysis to cleavage sugar-sulfonamides
bong, solid phase extraction carried out to remove and release other interferences. The
chromatographic separation used with LC-electrospray ionization coupled with tandem
mass spectroscopic detection in negative mode for all antibiotics residue with includes 15
analytes. This method was designed to confirm the food and drug quality control in the
U.S. it is can be used to provide 4-EU identification points. In 25 different countries, 116
samples have been taken, 38% of samples contain at least one analyte of antimicrobial, and
13 samples contains 5 different target compounds (Sheridan et al. 2008).
In the year 2017, Korkmaz and his collaborators have developed a new method for
determination of sulfonamides residue and tetracycline in pine honey from Aegean Region
of Turkey, which Turkey is one of the world’s largest pine honey producer around 95%
export share. Due to the importance of antibiotics residue in honey around the worldwide,
therefore a good quality control is required. For this reason, 59 samples of natural pine
honey were collected and quantified the number of sulfonamides and antibiotic residue in
the carried out through a competitive enzyme-linked immunoassay method, 35 samples
consisting tetracycline group of antibiotics with the range of concentration 6-42 ppb,

32
whereas in 24 samples of honey the ratio of antibiotics residue was bellowed the value of
the detection limit 4 ppb. the sulfonamides were found and observed in 31 honey samples
with the range of the concentration of 3-31 ppb and 28 sample of them contains the
sulfonamides with the concentration below the detection limit value 2ppb in conclusion;
there no maximum residue limit of sulfonamides in honey samples (Korkmaz et al. 2017).
Thompson and Noot in 2005, developed a new simple and fast analytical method for
quantification of 7 sulfonamides in the honey sample, the sample was prepared for acid
hydrolysis to break-down sugar-sulfonamides bond, then filtered the sample, and the
acidified honey sample was injected directly into HPLC-MS/MS system. Using gradient
pump mode for sample analyte elution, the sulfonamides extraction carried out by an
automated system. The mobile phases flow arranged using the six-port valve. The bulk
honey sulfonamides matrix has been removed. The contamination of MS chamber can be
observed in a minimum quantity with injection over 600 honey samples. The internal
standard technique has been used, with excellent accuracy and good precision was
obtained. The LOD for sulfonamides were calculated and ranged between 0.5-2 g/kg
(Thompson and Noot 2005).
A selective and sensitive method was described by Maudens and Lambert for the
simultaneous quantitative analysis and determination of 14 sulfonamides in honey. After
acidic hydrolysis of the honey sample to release and break-down the sugar-sulfonamides
bonds with adjustment of the pH, the sulfonamides are extracted into acetonitrile. This
fraction is dried and evaporated. The residue is reconstituted in an acetic acid solution and
loaded onto a strong cation exchanger (SCX). The eluate is evaporated, re-dissolved into
an acetic acid solution and an aliquot is injected. Separation is achieved on RP C18 column,
running a gradient program with an acetate buffer and acetonitrile. A post-column
derivatization with fluorescamine allows fluorescence detection at the analytical
wavelength of 420 nm and the emission wavelength of 485 nm. The method has a limit of
quantification between 2 and 5 μg/kg for all compounds. From the limit of quantification
up to 100 μg/kg, the method showed good linearity for every compound (r² > 0.995)
(Maudens and Lambert 2004).

3. METHODOLOGY
Honey contents with sulfonamides resulted from honey bee treatment with antibiotics to
protect their life from some bee diseases, but because of the serious side effects of
antibiotics if present in high level, a good quality control method for analyzing and
calculating sulfonamides in honey is necessary, in this study, for honey qualification, a new
method developed according to the method development which explained from the Figure
3.1.
Figure 3.1. Stages of research: Sulfonamides in honey by RP-HPLC
This section will be explained how objectives will be achieved, in relation way, first of all,
beginning with document review.
3.1. Document Review
The aim of document review is to conduct a review of the topic under study concerning
technical information such as selection of information based on the level of relevance,
content analysis of selected bibliography, using scientific articles and reference books
about types of sulfonamides and determination the quantity of them and finally methods
for evaluating of determination of sulfonamides in honey using HPLC.

34
3.2. Analytical Method Development and Procedures for the Determination of
Sulfonamides in Honey Using RP-HPLC-UV
3.2.1. Chemicals
Chemicals were used in this method are shown in the table below:
Table 3.1. List of chemicals that used in this study
Reagent CAS Number Company
Thioeurea 62-56-6 Sigma-Aldrich
Sulfadiazine 68-35-9 Sigma
Sulfamerazine 127-79-7 Sigma-Aldrich
Sulfapyridine 144-83-2 Sigma-Aldrich
Alpha-toluene sulfonamide 4563-33-1 Alfa-Aesar
Sulfamethazine 57-68-1 Sigma
p-Nitrobenzenesulfonamide 121-52-8 Sigma-Aldrich
Sulfadoxine 144-83-2 Fluka
Sulfisoxazole 119K1308V Sigma
Sulfathiazole 72-14-0 Fluka
Acetonitrile SZBA175S Sigma-Aldrich
Methanol SZBB12CV Sigma-Aldrich
Trifluoroacetic acid 1695585 Fisher Scientific Uk
Hydrochloric acid 7647-01-0 Sigma-Aldrich
Sodium phosphate monobasic 13472-35-0 Sigma-Aldrich
Sodium phosphate dibasic K41462580035 Merck
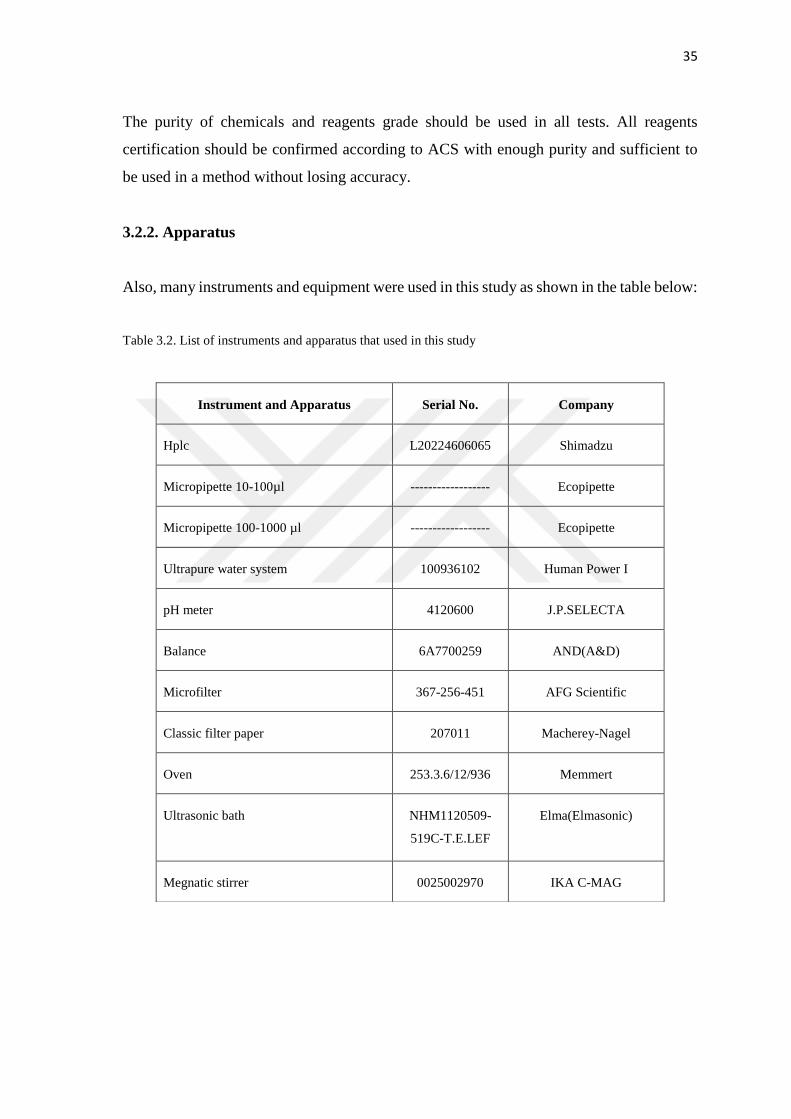
35
The purity of chemicals and reagents grade should be used in all tests. All reagents
certification should be confirmed according to ACS with enough purity and sufficient to
be used in a method without losing accuracy.
3.2.2. Apparatus
Also, many instruments and equipment were used in this study as shown in the table below:
Table 3.2. List of instruments and apparatus that used in this study
Instrument and Apparatus Serial No. Company
Hplc L20224606065 Shimadzu
Micropipette 10-100µl ------------------ Ecopipette
Micropipette 100-1000 µl ------------------ Ecopipette
Ultrapure water system 100936102 Human Power I
pH meter 4120600 J.P.SELECTA
Balance 6A7700259 AND(A&D)
Microfilter 367-256-451 AFG Scientific
Classic filter paper 207011 Macherey-Nagel
Oven 253.3.6/12/936 Memmert
Ultrasonic bath NHM1120509-
519C-T.E.LEF
Elma(Elmasonic)
Megnatic stirrer 0025002970 IKA C-MAG

36
3.2.3. Preparation of the Standard Solutions
The standard solution of these sulfonamides (Sulfadiazine, Sulfamerazine, Sulfadoxine,
Sulfathiazole, Sulfamethazine, Sulfapyridine, Sulfisoxazole, α-Toluenesulfonamide, and
p-Nitrobenzenesulfonamide) with Thiourea in different concentration have been prepared
according to the rule 3.1.
𝑝𝑝𝑏𝑠𝑜𝑙𝑢𝑡𝑒 =𝑚𝑎𝑠𝑠 𝑜𝑓 𝑠𝑜𝑙𝑢𝑡𝑒
𝑚𝑎𝑠𝑠 𝑜𝑓 𝑠𝑜𝑙𝑢𝑡𝑖𝑜𝑛∗ 109 (3.1)
The scientific bases used to prepare the standards to determine sulfonamides in honey by
the following points: (1) The greatest possible weight of reagent with more than 99%
assay to avoid systematics analytical errors. (2) The use of a mother solution maintaining
the same proportion of a natural mixture of the sulfonamides in the original honey. (3) Use
no more than two dilutions of mother solution, to prevent the increasing of error when
measuring the volumes of the standards.
In this sense, 0.0200 grams of each reagent (9 in total) were taken, which were weighed
successively in the same flask, then diluted in 100 mL methanol. This mother solution (A)
is equivalent to 200 ppb (0.2 ppm) of a mixture of 9 different sulfonamides.
Firstly, 1 ml of this stock solution (A) was taken and completed with mobile phase in order
to the volume become 10 mL to obtain 20 ppb. (Mother solution B). Secondly, 5 mL of
mother solution B was taken and completed to a 10 mL volumetric flask with mobile phase
to achieve 10 ppb. Finally, the standard solution of 1 ppb and 0.1 ppb were prepared from
the stock solution B (20 ppb) by dilution way when 0.5 taken from stock solution B for
preparing 1 ppb, and 0.05 taken for preparing 0.1 ppb.
Using this procedure it is guaranteed that no more than two dilutions exist and no more
than one weighing to avoid major errors in the preparation of the calibration standards.

37
3.2.4. Preparation of Buffer Solution and Mobile Phase
5Mm of the phosphate buffer solution was prepared from the mixed solutes of sodium
phosphate dibasic 𝑁𝑎2𝐻𝑃𝑂4. 2𝐻2𝑂 and sodium phosphate monobasic𝑁𝑎𝐻𝑃𝑂4. 𝐻2𝑂, the
mixed solutes diluted in ultra-pure water (UP), the pH of the solution adjusted by adding
of a diluted solution of (hydrochloric acid HCl) to decreasing the pH value and diluted
(potassium hydroxide KOH) for raising, the pH adjusted at 5.
Because of the buffer prepared with ultrapure water, and water is highly polar solvent,
therefore, the organic modifier must be used to reduce the polarity of the mobile phase and
arranging the analytes elution. A mixture of acetonitrile with methanol 1:1 used as an
organic modifier. So the mobile phase in RP-HPLC is polar mobile phase contains 80%
buffer solution with 20% of organic modifier (acetonitrile: methanol 1:1).
3.2.5. pH and Flow Rate
The pH value always used to arrange and detection the acidity or alkalinity of the mobile
phase in HPLC, it can be explained and calculated as the negative logarithm of hydrogen
ions concentration in aqueous solution, the mobile phase pH must be kept constant and
controlled carefully because it has a strong effect on the peak separation and resolution
especially when the analyte is polar as in reversed phase HPLC.
The buffer solution is used to control pH stability in the mobile phase. In this study, the
peaks separation diagnosed when different mobile phase prepared with different pH using
phosphate buffer solution.
At the first time a mobile phase prepared with 5 mM buffer solution at pH: 8, the standard
solution of thiourea and each sulfonamide injected individually, then the mixture of them
(thiourea, sulfadiazine, sulfathiazole, sulfapyridine, sulfamerazine, α-toluenesulfonamide,
sulfamethazine, p-nitrobenzene sulfonamide, sulfadoxine, sulfisoxazole) were injected at
a flow rate: 0.5 ml/min, from the Figure 3.2, the chromatographic separation can be seen:

38
0.0 5.0 10.0 15.0 20.0 25.0 30.0 35.0 min
0
50
100
150
200
mVDetector A Ch1:220nm
Figure 3.2. Chromatographic separation of SAs at pH: 8, flow rate: 0.5 mL/min
From the Figure 3.2., a poor peak separation chromatograph can be seen due to the absence
of two peaks of (sulfamerazine and sulfadoxine), and overlap of another two peaks
(sulfadiazine with sulfisoxazole) at minute 8. In this condition, the missing peak was
Sulfamerazine peak due to ionization effect when the pKa value of sulfamerazine is equal
to 8 which is fairly close to the pH of mobile phase and also another reason due to the
column stationary phase is also affected by pH, it means that at high pH (equal or greater
than 8) the column silica itself will be damaged by dissolution when even after the bonding
and end-capping process is completed on high purity silica, there are still free (unbounded)
silanols (Si-O-H) present on the silica surface. These silanols has a weakly acidic property
which can react with basic materials such as at pH: 8 and then can has effect on the
chromatographic resolution, therefore, the separation capacity will decrease, for this
reason, preparing for another buffer pH was suggested, buffer solution with pH: 7 prepared
and the mixture of standards injected at a flow rate 0.5 ml/min, the chromatographic
separation can be seen from the Figure 3.3.

39
0.0 2.5 5.0 7.5 10.0 12.5 15.0 17.5 20.0 22.5 min
0
5
10
15
20
mVDetector A Ch1:220nm
Figure 3.3. Chromatographic separation of SAs at pH: 7, flow rate: 0.5 mL/min
From the Figure 3.3. can be noticed that a very poor peak separation, at min: 10 the peaks
of (sulfadoxine and sulfathiazole) are mixed by a big overlap and at min: 15 peaks of a-
toluene sulfonamide and sulfamethazine separated with insufficient peak resolution and
much more overlap. And also in this condition a poor chromatographic separation can be
seen with law peak resolution, sulfamerazine peak has disappeared due to the same effect
as in condition at pH 8. When the ionization state of ionizable functional groups on
sulfamerazine molecule will depend primarily on the pH of the mobile phase and will result
in a shift in retention, selectivity and will be difficult to decipher from the baseline for
sulfamerazine peak. It means that still at this pH the column separation is insufficient., then
another mobile phase prepared with pH: 6 By lowering buffer pH, the separation capacity
increased when pH: 6 prepared and the overlap problem was solved as from the Figure 3.4.
.
Figure 3.4. Chromatographic separation of SAs at pH: 6, flow rate: 0.5 mL/min
0.0 2.5 5.0 7.5 10.0 12.5 15.0 17.5 20.0 22.5 25.0 27.5min
0
5
10
15
20
25
mVDetector A Ch1:220nm
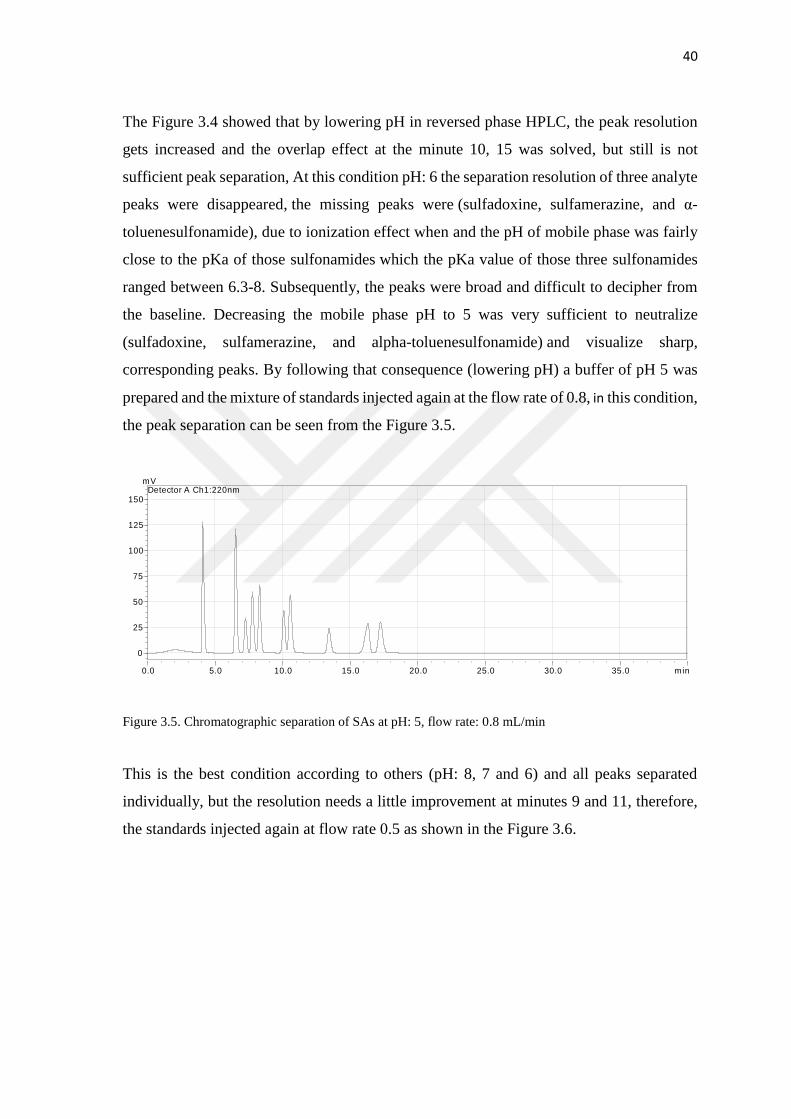
40
0.0 5.0 10.0 15.0 20.0 25.0 30.0 35.0 min
0
25
50
75
100
125
150
mVDetector A Ch1:220nm
The Figure 3.4 showed that by lowering pH in reversed phase HPLC, the peak resolution
gets increased and the overlap effect at the minute 10, 15 was solved, but still is not
sufficient peak separation, At this condition pH: 6 the separation resolution of three analyte
peaks were disappeared, the missing peaks were (sulfadoxine, sulfamerazine, and α-
toluenesulfonamide), due to ionization effect when and the pH of mobile phase was fairly
close to the pKa of those sulfonamides which the pKa value of those three sulfonamides
ranged between 6.3-8. Subsequently, the peaks were broad and difficult to decipher from
the baseline. Decreasing the mobile phase pH to 5 was very sufficient to neutralize
(sulfadoxine, sulfamerazine, and alpha-toluenesulfonamide) and visualize sharp,
corresponding peaks. By following that consequence (lowering pH) a buffer of pH 5 was
prepared and the mixture of standards injected again at the flow rate of 0.8, in this condition,
the peak separation can be seen from the Figure 3.5.
Figure 3.5. Chromatographic separation of SAs at pH: 5, flow rate: 0.8 mL/min
This is the best condition according to others (pH: 8, 7 and 6) and all peaks separated
individually, but the resolution needs a little improvement at minutes 9 and 11, therefore,
the standards injected again at flow rate 0.5 as shown in the Figure 3.6.

41
0.0 2.5 5.0 7.5 10.0 12.5 15.0 17.5 20.0 22.5 25.0 27.5 30.0 32.5 35.0min
0
5
10
15
mVDetector A Ch1:220nm
0.0 5.0 10.0 15.0 20.0 25.0 30.0 35.0 min
0
25
50
75
100
125
150
mVDetector A Ch1:220nm
Figure 3.6. Chromatographic separation of SAs at pH: 5, flow rate: 0.5 mL/min
Now all peaks separated individually with no overlap of any peak, and the column
separation efficiency is in better condition with sufficient peak resolution. It is clear to
understand that the peak resolution is extremely pH dependable and however time of
analysis gets shorter with increase of mobile phase flow rate but the peak resolution is
decreased means there is a reverse relationship between them according to increasing and
decreasing, when the sample injected at flow rate of 0.5 the peaks separated with more
distance between them and maximum time of analysis is 26 min , but when the flow rate
increased to 0.8, the distance between them decreased and the last peak separated at min:17
due to increasing rate of analyte elution from the column. According to literature the
optimum condition of analysis is required so; a new buffer with pH: 4 prepared for a new
mobile phase and the standard injected again as shown in the Figure 3.7.
Figure 3.7. Chromatographic separation of SAs at pH: 4, flow rate 0.5 mL/min
In this condition again the separation fluctuated and insufficient at min: 11 and 15, with
longer time 27 min for analyzing.

42
The separation and resolution of all standards obtained at pH: 5 and flow rate: 0.5 as the
best condition, therefore, in this study, this condition selected as an analytical condition
and the concatenation of each peak of SAs standards with their retention times were
mentioned in the table below:
Table 3.3. The sequence of SAs standards at pH: 5 flow rate 0.5 mL/min
ID# Names of SAs Ret. Time
1 Thiourea 6.418
2 Sulfadiazine 10.154
3 Sulfathiazole 11.168
4 Sulfapyridine 12.046
5 Sulfamerazine 12.873
6 Alpha-toluenesulfonamide 15.592
7 Sulfamethazine 16.428
8 P-nitrobenzenesulfonamide 20.495
9 Sulfadoxine 24.540
10 Sulfisoxazole 26.410
3.2.6. Analytical Condition for HPLC Method
The optimum condition of sulfonamides analysis to obtain all analyte peaks individually
with a sufficient peak separation and resolution by RP-HPLC with isocratic elution mode
obtained when the phosphate buffer prepared at pH 5, this condition reaches after a long
investigation of peak separation and resolution by many trails of injection and various
buffer pH, to protecting GC precision and repeatability of analysis, the condition of all
sections must be maintained constant as shown from the next tables:

43
Autosampler: SIL 20A (Shimadzu Brand)
Table 3.4. Autosampler section condition
Parameter Value Optimized
Rack capacity 200 vials
Vial capacity 1,5 Ml
Rinsing volume 200 mL
Purge time 15 min
Rising mode Before and after each injection.
Injection volume 5µL
Pump LC-20AT
Table 3.5. Pump section condition
Parameter Value Optimized
Working mode Isocratic Flow
Controlled by: Constant flow thru column.
Analytical flow 0.5 mL/min
Pressure 63 bar

44
Oven CTG-10ASvp.
Table 3.6. Oven section condition
Parameter Value Optimized
Working mode Isothermal
type: Isolated/Lichrosphere columns
Temperature 35o C
Detector SPD-20A
Table 3.7. Detector section condition
Parameter Value Optimized
Lamp Deuterium D2
Cell temp 40oC
Wavelength setup 220 nm and 265 nm
Ratio change 10
Runtime 40 min

45
HPLC -Column.
Table 3.8. HPLC column specification
Parameter Value Optimized
Column brand Kromasil
Specification 150 mm × 4.6 mm I.D.
Mobile Phase Phosphate buffer + Acetonitrile+ methanol 1:1
3.2.7. Calibration
The system calibrated with four points of analyte concentrations applied to this study was
a linear calibration listed in the table below:
Table 3.9. List of analytes and standards for calibration
Calibration Point # Analytes Prepared Concentration (ppb)
1 SDZ, STZ, SFP,
SMZ, ΑTS,
SMT, PNS,
SDX, SXZ
0.1
2 1
3 10
4 20
Protocol of calibration:
1. Measure each standard
2. Execute regression analysis.
3. Validate results of calibration based on criteria of:
a) Positive response factor magnitude: > 103
b) Regression coefficient (R2): minimum: 0.9500
c) External calibration.

46
4. Determine conformity, recovery factor, precision and accuracy, lower detection limit
(LOD) and lower quantification limit (LOQ).
Figure 3.8. Calibration curve
3.2.8. Sample Preparation
Seven honey samples were obtained in different places in and around Bingol province as
shown in the table below:
Table 3.10. List of sample names
Sample Names Sample name abbreviations
Kıractepe köyü S1
Karliova I S2
Hazarshah köyü solhan S3
Karliova II S4
Togs yaylası genç S5
Tanrıverdı köyü genç S6
Bingol market S7
The samples were stored in the refrigerator at 4 oC (to preventing photodegradation of
sulfonamides). In this investigation the matrix of sulfonamides was very viscose, the
sample preparation is necessary to reducing matrix effect.

47
An aliquot of honey sample (1 g) was weighed into a small volumetric flask 10 mL capacity
using the high accuracy electronic analytical balance. The sample dissolved with 20 ml of
1% trifluoroacetic (TFA) acid mixed with acetonitrile 1:1.
The sample solution was shaken for 3 min continuously and after that was sonicated for 30
min in ultrasonic bath system ULTRASONIC BATH (37 kHz, 1000 W, Elmasonic
S120H), with raising temperature up to 50 oC. After the sample completely dissolved in
TFA and ACN, and homogenized with sonication to break down sugar-analyte bond
completely, then filtered with a classical technique of filtration (MACHEREY-NAGEL,)
slow filter paper to remove the bulk sulfonamide matrix (honey residue except of
sulfonamides) as a solid and precipitate phase. After removing the solid residue, the liquid
was passed through a highly small porous membrane (0.20 µm) (AFG Scientific) into the
autosampler vials and injected into the system (RP-HPLC-UV SHIMADZU BRAND).
3.3. Peak Study
In this study, thiourea used as a void marker to calculate To, To is a more important
parameter in RP-HPLC when the mobile phase consists of a methanol-water-acetonitrile
mixture, the use of it is important to calculate parameters that required for optimization
processes such as the capacity factor or retention factor which is necessary to measure other
chromatographic relationships like selectivity (α) as shown from the Figure 3.9.
Figure 3.9. Void marker

48
Where:
To: Void volume marker retention (min).
TR1: Retention time of the first analyte (min).
TR2: Retention time of the second analyte (min).
TR′
1= TR1
− To
TR′
2= TR2
− To
The retention factor or capacity factor represented by k’ is used to explain and calculation
of analytes movement through the column as defined by the equation below:
𝑘′ =𝑇𝑅−𝑇𝑜
𝑇𝑜 (3.2)
When the retention factor of some analytes is smaller than one, means that very fast elution
and will be very difficult to calculate retention time accurately. High retention factor value
(Greater than 20) means very difficult elution, the ideal range of retention factor is (1 to 5).
The division of the retention factor between two peaks called selectivity factor which
expressed by (α).
α =k2
′
k1′ (3.3)
Where:
α: Selectivity.
k’1: Retention factor of analyte 1.
k’2: Retention factor of analyte 2.
The selectivity indicates the separation power
Where:
α ≥ 2 Easy Separation.

49
α = 1.5-2 Possible separation.
α= 1.2 -1.5 Difficult separation.
α ≤ 2 Very difficult separation.
The efficiency of the column is usually expressed by theoretical plate number (N), the
theoretical plate is a measurement of column effectiveness and efficiency by mathematical
calculation, as shown in the next figure and equations.
Figure 3.10. Theoretical plate parameter
According to the United States Pharmacopeia
𝑁 = 16 ∗ [𝑡𝑅
𝑊]
2
(3.4)
And according to the German Pharmacopeia
𝑁 = 5.54 ∗ [𝑡𝑅
𝑊0.5]
2
(3.5)
Where:

50
N: Theoretical plats number.
tR: Retention time of the analyte.
W: width at the base of the analyte.
W0.5: width at half-height of the analyte.
The N value has a directly proportional relationship with a column efficiency when the
column theoretical plate is high means it has high efficient separation with a sharper peak
shape than a column with a lower theoretical plate, the value of N ranged between 2000-
1200, and it depends on the mobile phase flow rate, viscosity, molecular weight of the
analyte and temperature.
The relationship between those three important parameters (N, k’ and α) can be explained
as peak resolutions shown from the equation 3.6.
Rs =1
4√N[
(α−1)
α][
K
K+1] (3.6)
3.4. Peak Resolution and Diagnosis
The compounds with ionizable functional groups such as carboxylic, amino or pyridinyl
group, are the most common ionizable groups in pharmaceutical compounds. as mentioned
before; in reverse phase HPLC the polar mobile phase is used therefore controlling of
mobile phase pH and composition is one of the most critical and main parameters that can
be used to control and adjust HPLC chromatographic separation, retention and peak
resolution, another important criterion that can affect resolution in RP-HPLC is selectivity
and efficiency of the column.
For HPLC it is most important to reach the value of peak resolution of 1.5 in minimum
time, it means that the optimum peak resolution. If the resolution value between two peaks
is equal or greater than 1.5 will ensure that the sample constituents are separated very good
and the concentration of each analyte can be calculated accurately based on peak area. The
peak resolution calculation explained in the Figure 3.11.

51
Figure 3.11. Determination of resolution between two peaks
Figure 3.11. represents the separation of two peaks, the resolution between them explained
below:
𝑅𝑠 =𝑡𝑅2−𝑡𝑅1
(𝑡𝑤1+𝑡𝑤2)∗0.5 (3.7)
According to the above equation, resolution in HPLC expressed as the distance between
two peaks represents by retention time divided by their width.
Where: Rs: Resolution
tR1 and tR2: the retention times of peaks, tW1 and tW2: the widths of the peaks taken at their
bases.
As an example, the peak resolution calculated between sulfadiazine with sulfathiazole
where: sulfathiazole peak exhibits a retention time of 11.168 min and a width of 0.75 min
and the Sulfadiazine peak exhibited a retention time of 10.154 min with a width of 0.75
min:
𝑅𝑠 =11.168−10.154
(0.75+0.75)∗0.5
𝑅𝑠1.736
0.75 → 𝑅𝑠 = 1.352 ≈ RS=1.3

52
According to that value, both peaks separated sufficiently, Rs = 1.3 means more than 98%
purity has been achieved at 98% of peak recovery, to achieve 100% recovery, the value
of Rs should be 1.5 Figure 3.12. represents the separation results with different resolutions.
Figure 3.12. Separation results with different resolutions

4. RESULTS AND DISCUSIONS
Honey is contained of several classes of compounds that include carbohydrates, carboxylic
acids, amino acids, proteins, minerals and antibiotics including sulfonamides. Sulfa drugs
carry aromatic amino groups, which can react with the sugars forming bases. Therefore
acidic hydrolysis conditions are needed to break-down such interactions, and in the case of
this research, the optimum pH was found at 5. The main problem faced in this application
was to reduce as much it can the matrix interferences, some researches recommend to use
cation exchange for eliminating such matrix effects but this resource was not available at
the moment of developing this study.
The way of controlling that matrix effect comes from the strong ionic bond which formed
between sulfonamides and sulfonic acid moieties on this sorbent, therefore the strong wash
by an organic solvent is necessary to wash out organic impurities and eluting sulfa drugs
separately.
In order to present results, the most convenient way is to show validations results firstly
and, then results related to the determination of sulfa drugs in honey done by this research.
4.1. Validation Results
The method was developed and applied to analysis of different honey samples, therefore
the study of some important parameters for that technique is quite important such as the
validations which can establish the documentary evidence showing that procedure or
method carried out in testing with the desired level of compliance at all stages. In the
pharmaceutical industry, it is very important parameters that make assured that the process
will consistently produce the expected results. Validation results are related to recovery,
precision, and accuracy.

54
To improve the application of sulfonamides analysis response at desired wavelengths, all
standard solutions of sulfa drugs were injected into the system individually, the standards
were prepared at 4 different concentrations 0.1-20 ppb, all standard solution was prepared
in a methanol HPLC grade, and also methanol used as an organic modifier for preparation
of mobile phase, the results of all injections have been seen in a good shape of peaks and
steady detector baseline response. The quantification limit (LOQ) and detection limit
(LOD) was calculated according to:
𝐿𝑂𝐷 = 3 ∗𝑆.𝐷.
𝑆𝑙𝑜𝑝𝑒 (4.1)
𝐿𝑂𝑄 = 10 ∗𝑆.𝐷.
𝑆𝑙𝑜𝑝𝑒 (4.2)
Table 4.1. showed the validation results of this specific application in details, the
calibration curve can be used for determination of nine different types of sulfa drugs with
a scope from 0.1 ppb up to 20 ppb.
Table 4.1. Validation parameters of the method
Analytes STD
0.1ppb
STD
1ppb
STD
10
ppb
STD
20
ppb
Validation
parameter
Validation
result
Criteria of
acceptance Evaluation
SDZ
0.135
0.987
10.188
22.631 Standard
1.51 ≤ 5% Conform
STZ 0.109
0.821 11.603
20.921 Variation
coefficient (CV) 0.13 ≤ 5% Conform
SFP 0.395 1.098 12.388 20.45 Precision 98.49 ≥95% Conform
SMZ 0.152 2.297 13.448 18.755 Accuracy 99.87 ≥95% Conform
ΑTS 0.195 1.301 12.407 22.13 Recovery 84.80 ≥80% Conform
SMT 0.103 1.065 13.621 20.322 LOD 0.72 ppb
PNS 0.302 3.003 10.090 19.857 LOQ 2.37 ppb
SDX 0.089 0.958 9.917 22.986
SXZ 0.206 1.936 10.020 21.369
�̅� 0.19 1.5 11.52 21.05 100%

55
Additionally, taking about validation, indicated that precision and accuracy are totally in
control, for example, the acceptance criteria for both are less than 5% but results are bellow
of this specification, therefore, application have enough accuracy and precision to report
detailed sulfa drugs.
The prepared honey samples applied to the method, and the result of peak separation can
be seen from the following figures:
Sample one
Figure 4.1. HPLC chromatogram of the sample number 1
In Figure 4.1. was able to calculate the concentration of four different SAs (SDZ, STZ,
ATS, and SXZ) at obtained optimum condition in which polar mobile phase with pH 5,
flow rate 0.5 mL/min at pressure of 63 bar, with 350C oven temperature and 220 nm
analytical wavelength, the first peak couldn't recognize due to the lack of standards, thus,
the first peak was unknown.

56
Sample two
Figure 4.2. HPLC chromatogram of the sample number 2
Sample two contained four SAs (SDZ, STZ, SDX, and SXZ) at the same optimized system
condition. Their separation peaks can be seen from the Figure 4.2.
Sample three
Figure 4.3. HPLC chromatogram of the sample number 3
Figure 4.3 represents the separation of seven sulfonamides in sample three (SDZ, STZ,
SFP, ATS, PNS, SDX, and SXZ) also in the same system condition. The analysis
chromatographic separation of sample number 4,5,6,7 can be seen from the next figures:

57
Sample four
Figure 4.4. HPLC chromatogram of the sample number 4
In S4 four SAs peaks separated which contain (SDZ, STZ, SMT, and SDX) at same
optimized condition of the HPLC system.
Sample five
Figure 4.5. HPLC chromatogram of the sample number 5
When S5 at the same analytical condition was analyzed, five peaks of SAs recognized
such as (SDZ, STZ, SMZ, ATS, and SDX).
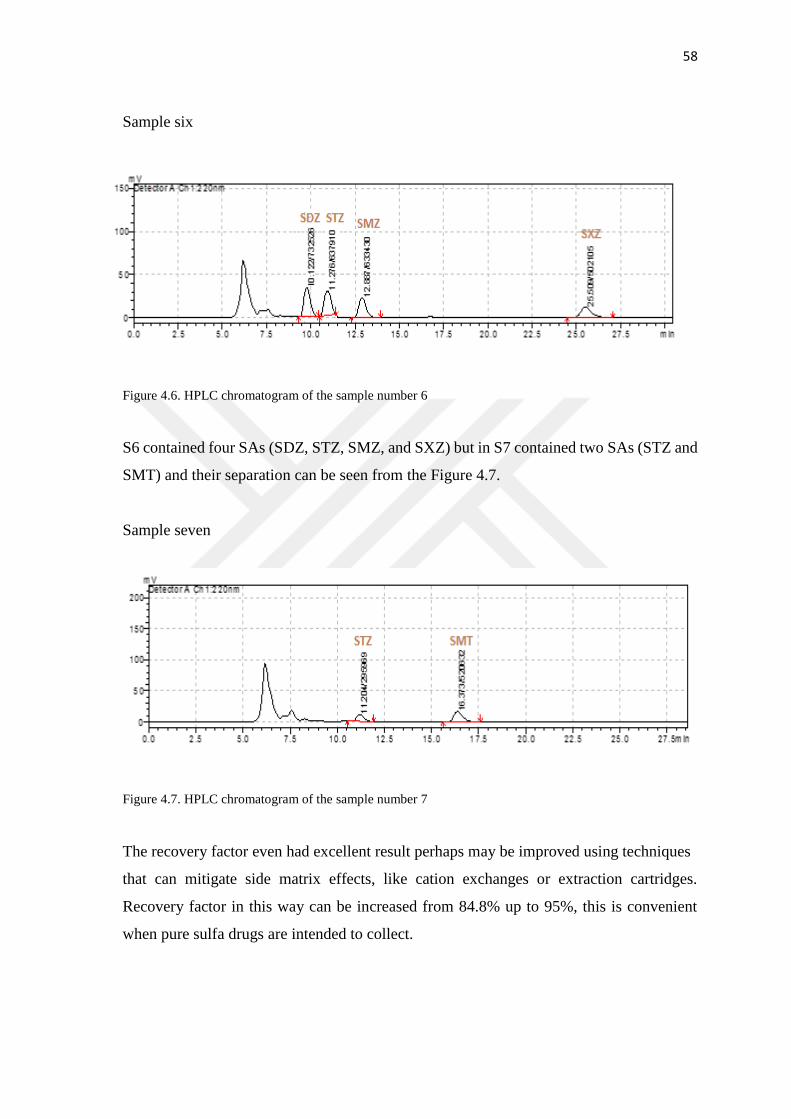
58
Sample six
Figure 4.6. HPLC chromatogram of the sample number 6
S6 contained four SAs (SDZ, STZ, SMZ, and SXZ) but in S7 contained two SAs (STZ and
SMT) and their separation can be seen from the Figure 4.7.
Sample seven
Figure 4.7. HPLC chromatogram of the sample number 7
The recovery factor even had excellent result perhaps may be improved using techniques
that can mitigate side matrix effects, like cation exchanges or extraction cartridges.
Recovery factor in this way can be increased from 84.8% up to 95%, this is convenient
when pure sulfa drugs are intended to collect.

59
Related to LOD and LOQ can be said this method is adequate to determine sulfa drugs at
routine levels, when concentrations of analytes are over 2.4 ppb can be reported with 95%
of confidence and also this method will be useful for identify contamination of honey at
lower concentrations like 0.72 ppb, lower concentration cannot be detected, will be only
for presumptive tests. The result of all analyzed samples with their level of SAs can be seen
from the tables below:
Table 4.2. Statistical analysis of SAs determination in sample number 1
First
Sample
Result
µg/kg
LOD
µg/kg
LOQ
µg/kg
RSD%
RC%
SDZ 0.547 0.33 2.0 7.3 90.9
STZ 0.475 0.2 2.3 6.8 85.35
SFP ……. 2.7 2.9 5.8 66.3
SMZ ……. 0.40 2.0 6.2 109
ΑTS 1.241 0.37 2.1 7.5 88.84
SMT …… 0.37 2.1 9.9 95.2
PNS …… 1.15 1.3 7.5 99.06
SDX ….. 1.20 1.21 4.5 99.17
SXZ 0.607 0.2 2.24 7.3 100.02
Table 4.3. Statistical analysis of SAs determination in sample number 2
Second
Sample
Result
µg/kg
LOD
µg/kg
LOQ
µg/kg
RSD%
RC%
SDZ 0.400 0.33 2.0 7.3 90.9
STZ 0.132 0.2 2.3 6.8 85.35
SFP --- 2.7 2.9 5.8 66.3
SMZ --- 0.40 2.0 6.2 109
ΑTS --- 0.37 2.1 7.5 88.84
SMT --- 0.37 2.1 9.9 95.2
PNS --- 1.15 1.3 7.5 99.06
SDX 1.244 1.20 1.21 4.5 99.17
SXZ 0.033 0.2 2.24 7.3 100.02

60
Table 4.4. Statistical analysis of SAs determination in sample number 3
Third
Sample
Result
µg/kg
LOD
µg/kg
LOQ
µg/kg
RSD%
RC%
SDZ 1.344 0.33 2.0 7.3 90.9
STZ 1.536 0.2 2.3 6.8 85.35
SFP 2.812 2.7 2.9 5.8 66.3
SMZ --- 0.40 2.0 6.2 109
ΑTS 0.442 0.37 2.1 7.5 88.84
SMT --- 0.37 2.1 9.9 95.2
PNS 1.222 1.15 1.3 7.5 99.06
SDX 1.490 1.20 1.21 4.5 99.17
SXZ 0.131 0.2 2.24 7.3 100.02
Table 4.5. Statistical analysis of SAs determination in sample number 4
Fourth
Sample
Result
µg/kg
LOD
µg/kg
LOQ
µg/kg
RSD%
RC%
SDZ 1.035 0.33 2.0 7.3 90.9
STZ 0.529 0.2 2.3 6.8 85.35
SFP --- 2.7 2.9 5.8 66.3
SMZ --- 0.40 2.0 6.2 109
ΑTS --- 0.37 2.1 7.5 88.84
SMT 0.456 0.37 2.1 9.9 95.2
PNS --- 1.15 1.3 7.5 99.06
SDX 2.753 1.20 1.21 4.5 99.17
SXZ --- 0.2 2.24 7.3 100.02

61
Table 4.6. Statistical analysis of SAs determination in sample number 5
Fifth
Sample
Result
µg/kg
LOD
µg/kg
LOQ
µg/kg
RSD%
RC%
SDZ 0.865 0.33 2.0 7.3 90.9
STZ 0.105 0.2 2.3 6.8 85.35
SFP --- 2.7 2.9 5.8 66.3
SMZ 1.064 0.40 2.0 6.2 109
ΑTS 1.239 0.37 2.1 7.5 88.84
SMT --- 0.37 2.1 9.9 95.2
PNS --- 1.15 1.3 7.5 99.06
SDX 1.999 1.20 1.21 4.5 99.17
SXZ --- 0.2 2.24 7.3 100.02
Table 4.7. Statistical analysis of SAs determination in sample number 6
Sixth
Sample
Result
µg/kg
LOD
µg/kg
LOQ
µg/kg
RSD%
RC%
SDZ 0.656 0.33 2.0 7.3 90.9
STZ 0.982 0.2 2.3 6.8 85.35
SFP --- 2.7 2.9 5.8 66.3
SMZ 0.448 0.40 2.0 6.2 109
ΑTS 0.37 2.1 7.5 88.84
SMT --- 0.37 2.1 9.9 95.2
PNS --- 1.15 1.3 7.5 99.06
SDX --- 1.20 1.21 4.5 99.17
SXZ 0.841 0.2 2.24 7.3 100.02

62
Table 4.8. Statistical analysis of SAs determination in sample number 7
The concentration of sulfonamides calculated in each honey samples in unit of μg/kg, and
according to those standards which established by many EU countries, therefore our
samples are sufficient to use, in which the total sulfonamides residue in sample 1 (Kıractepe
köyü) was equal to 2.8 μg/kg, in sample 2 (Karliova I) can be determined that the total
sulfonamides residue was 1.8 μg/kg. The third sample (Hazarshah köyü solhan) after
pretreatment, the calculation showed that the total sulfonamides were equal to 9 μg/kg.
While total SAs residue in sample 4 (Karliova II) was 4.8 μg/kg, sample 5 (Togs yaylası
genç) contained 5.3 μg/kg of SAs residue, the sixth sample (Tanrıverdı köyü genç)
contained 3 μg/ kg of sulfonamides residue, the last sample which obtained from Bingol
market was lighter and less viscose than others and contained 1.2 μg/kg residue of
sulfonamides.
Seventh
Sample
Result
µg/kg
LOD
µg/kg
LOQ
µg/kg
RSD%
RC%
SDZ --- 0.33 2.0 7.3 90.9
STZ 0.094 0.2 2.3 6.8 85.35
SFP --- 2.7 2.9 5.8 66.3
SMZ --- 0.40 2.0 6.2 109
ΑTS --- 0.37 2.1 7.5 88.84
SMT 1.119 0.37 2.1 9.9 95.2
PNS --- 1.15 1.3 7.5 99.06
SDX --- 1.20 1.21 4.5 99.17
SXZ --- 0.2 2.24 7.3 100.02

5. CONCLUSION
Determination of sulfa drugs using RP-HPLC by the configuration of this study is capable
to determine 9 individual sulfa drugs (SDZ, STZ, SFP, SMZ, ΑTS, SMT, PNS, SDX and
SXZ) from 0.1 ppb up to 20 ppb. Accuracy and precision of method using analytical and
instrumentation setup were, precision: 98.5% and accuracy 99.87%, that’s means RP-
HPLC is a suitable technique to quantify this antibiotics family as well as the top of art.
The separation technique optimized after a long investigation of buffer pH and flow rate of
the mobile phase that prepared from the mixture of phosphate buffer solution with
methanol: acetonitrile as an organic modifier. The peak resolution increased with
increasing mobile phase buffer pH until pH: 5 which detected as an optimum pH to have
the highest peak resolution at flow rate 0.5 mL/min. It is recommended to improve recovery
of this method including a preparation sample step that can be able to isolate matrix effects
like cation exchange cartridges. Due to the lack of sulfonamide standards, some peaks
couldn't identified as appears at the minute of 5-7. Isocratic method is suitable for
separation using reverse phase and longer column for improving separation and selectivity
at high concentrations levels. Seven different honey samples were analyzed, which
obtained from Bingol province. After pretreatment and acid hydrolysis to break-down
sugar-sulfonamides bond and to reducing matrix effect. Results indicated that honey is in
quality control specification, and according to the EU COMMISSION REGULATION
(EU) No 37/2010 established 100 μg/kg as MRLs of SAs in honey, means that the samples
are good and total sulfonamides residue are under the control when Sample 1 contains 2.8
μg/kg, Sample 2: 1.8 μg/kg, Sample 3: 9 μg/kg, Sample 4: 4.8μg/kg, Sample 5: 5.3 μg/kg,
Sample 6: 3 μg/kg and Sample 7: 1.2 μg/kg.

REFERENCES
Abdul Qadir M, Ahmed M, & Iqbal M (2015) Synthesis, characterization, and antibacterial
activities of novel sulfonamides derived through condensation of amino group containing
drugs, amino acids, and their analogs. Biomed research international
Abuharfeil N, Al-Oran R, & Abo-Shehada M (1999) The effect of bee honey on the
proliferative activity of human B-and T-lymphocytes and the activity of phagocytes. Food
and Agricultural Immunology 11(2): 169-177
Actor P, Chow AW, Dutko F J, & McKinley MA (2005) Chemotherapeutics. Ullman’s
Encyclopedia of Industrial Chemistry
Adzitey F (2015) Antibiotic classes and antibiotic susceptibility of bacterial isolates from
selected poultry; a mini review
Afroz S, Abbasi MA, Tanveer W, Khan KM, Ashraf M, Ahmad I & Ambreen N (2012)
Synthesis, characterization and biological screening of sulfonamides derived form 2-
phenylethylamine. Pakistan journal of pharmaceutical sciences 25(4)
Aguilar MI (2004) Reversed-phase high-performance liquid chromatography. In HPLC of
Peptides and Proteins (pp. 9-22). Springer, Totowa, NJ
Aguilar MI, & Hearn MT (1996) [1] High-resolution reversed-phase high-performance
liquid chromatography of peptides and proteins. In Methods in enzymology (Vol. 270, pp.
3-26). Academic Press
Ainsa J (2002) Stuart B. Levy: The antibiotic paradox. How the misuse of antibiotics
destroys their curative powers, 2nd edn. International Microbiology 5(3): 155-156
Ajani OO (2009) Physical characterization of some honey samples from North-Central
Nigeria. International Journal of Physical Sciences 4(9): 464-470
Ajibola A, Chamunorwa JP, & Erlwanger KH (2012) Nutraceutical values of natural honey
and its contribution to human health and wealth. Nutrition & metabolism 9(1)

65
Ajibola A, Idowu GO, Amballi AA, Oyefuga OH, & Iquot IS (2007) Improvement of some
haematological parameters in albino rats with pure natural honey. J Biol Sci Res 2(1): 67-
69
Alimentarius C (2001) Revised codex standard for honey. Codex stan 12: 1982
Al-Jabri AA (2005) Honey, milk and antibiotics. African Journal of Biotechnology 4(13)
Alvarez-Suarez JM, Gasparrini M, Forbes-Hernández TY, Mazzoni L, & Giampieri F
(2014) The composition and biological activity of honey: a focus on Manuka
honey. Foods 3(3): 420-432
Anand N (1975) Sulfonamides and sulfones. In Mechanism of Action of Antimicrobial and
Antitumor Agents (pp. 668-698). Springer, Berlin, Heidelberg
Asker FW, Mahamad ZZ, Eliwei AG, & Nief OA (2017) Synthesis and characterization of
some sulfonamide dervatives. International Journal of Applied Chemistry 13(2): 169-177
Bateman KP, Locke SJ, & Volmer DA (1997) Characterization of isomeric sulfonamides
using capillary zone electrophoresis coupled with nano‐electrospray quasi‐MS/MS/MS. Journal of mass spectrometry 32(3): 297-304
Bedendo GC, Jardim IC,SF, & Carasek E (2010) A simple hollow fiber renewal liquid
membrane extraction method for analysis of sulfonamides in honey samples with
determination by liquid chromatography–tandem mass spectrometry. Journal of
Chromatography A 1217(42): 6449-6454
Bernal J, Nozal MJ, Jiménez, JJ, Martín MT, & Sanz E (2009).A new and simple method
to determine trace levels of sulfonamides in honey by high performance liquid
chromatography with fluorescence detection. Journal of Chromatography A 1216(43):
7275-7280
Bhattacharjee MK (2016) Chemistry of Antibiotics and Related Drugs. Springer
Bhattacharyya L, & Rohrer JS (Eds.) (2012) Applications of ion chromatography in the
analysis of pharmaceutical and biological products. John Wiley & Sons
Bogdanov S, Jurendic T, Sieber R, & Gallmann P (2008) Honey for nutrition and health: a
review. Journal of the American College of Nutrition 27(6): 677-689

66
Boison JO, Nachilobe P, Cassidy R, Keng L, Thacker PA, Peacock A & Bulmer WS (1996)
Determination of trimethoprim and sulphadoxine residues in porcine tissues and
plasma. Canadian journal of veterinary research 60(4): 281
Bonta V, MARGHITAS LA, Dezmirean D, & BOBIS O (2009) Determination of six
sulfonamide residues in honey by HPLC with fluorescence detection. Bulletin of
University of Agricultural Sciences and Veterinary Medicine Cluj-Napoca. Animal
Science and Biotechnologies 66(1-2)
Boxall AB, Blackwell P, Cavallo R, Kay P, & Tolls J (2002) The sorption and transport of
a sulphonamide antibiotic in soil systems. Toxicology letters 131(1-2): 19-28
Buba F, Gidado A, & Shugaba A (2013) Analysis of biochemical composition of honey
samples from North-East Nigeria. Biochem Anal Biochem 2(3): 139
Calderón CB, & Sabundayo BP (2007) 2 Antimicrobial Classifications. Antimicrobial
Susceptibility Testing Protocols, 7
Camargo-Ordoñez A, Moreno-Reyes C, Olazarán-Santibáñez F, Martínez-Hernández S,
Bocanegra-García V, & Rivera G (2011) Efficient synthesis of sulfonamide derivatives on
solid supports catalyzed using solvent-free and microwave-assisted methods. Química
Nova 34(5): 787-791
Cantarelli MA, Pellerano RG, Marchevsky EJ, & Camiña JM (2008) Quality of honey from
Argentina: Study of chemical composittion and trace elements. The Journal of Argentine
Chemical Society 96(1-2): 33-41
Chen L, Zhang X, Sun L, Xu Y, Zeng Q, Wang H, & Ding L (2009) Fast and selective
extraction of sulfonamides from honey based on magnetic molecularly imprinted
polymer. Journal of agricultural and food chemistry 57(21): 10073-10080
Christopher W (2003) Antibiotics Actions, Origins, Resistance.1st Edition, ASM Press,
Washington, USA. pp. 3-18
Church J (1954 March) Honey as a source of the anti-stiffness factor. In Fed Proc Am
Physiol Soc (Vol. 13, No. 1, p. 26)
Cooper RA, Halas E, & Molan PC (2002) The efficacy of honey in inhibiting strains of
Pseudomonas aeruginosa from infected burns. The Journal of burn care &
rehabilitation 23(6): 366-370

67
Da Presidência GP, & de Administração de Pessoal SR, AP (2007) Ato n. 134/SRAP.
SERH. GDGCA. GP, de 30 de março de 2007. Ato n. 134/SRAP. SERH. GDGCA. GP, de
30 de março de 2007: (134)
Davis C, Arnold K (1974) Role of meningococcal purpura. Journal of Experimental
Med.140: 159-171
Directive EC (2002) 657/EC of 12 August, 1990 on implementing Council Directive
96/23/EC concerning the performance of analytical methods and the interpretation of
results. Off. J. Eur. Communities, L221
Dorsey JG, & Cooper WT (1994) Retention mechanisms of bonded-phase liquid
chromatography. Analytical chemistry 66(17): 857A-867A
Ebenezer IO, & Olugbenga MT (2010) Pollen characterisation of honey samples from
north central Nigeria. Journal of Biological Sciences 10(1): 43-47
Fekete S, Fekete J, Molnár I, & Ganzler K (2009) Rapid high performance liquid
chromatography method development with high prediction accuracy, using 5 cm long
narrow bore columns packed with sub-2 μm particles and Design Space computer
modeling. Journal of Chromatography A 1216(45): 7816-7823
Frank U, & Tacconelli E (2012) The Daschner Guide to In-Hospital Antibiotic Therapy:
European Standards. Springer Science & Business Media
Granja RH, Niño AMM, Rabone F, & Salerno AG (2008) A reliable high-performance
liquid chromatography with ultraviolet detection for the determination of sulfonamides in
honey. Analytica chimica acta 613(1): 116-11
Gunes ME, Gunes N, & Cibik R (2009) Oxytetracycline and sulphonamide residues
analysis of honey samples from Southern Marmara Region in Turkey. Bulgarian Journal
of Agricultural Science 15(2): 163-167
Halász I, Endele R, & Asshauer J (1975) Ultimate limits in high-pressure liquid
chromatography. Journal of Chromatography A 112: 37-60
Horvath CG, Preiss BA, & Lipsky SR (1967) Fast liquid chromatography. Investigation of
operating parameters and the separation of nucleotides on pellicular ion
exchangers. Analytical chemistry 39(12): 1422-1428

68
Hrassnigg N, & Crailsheim K (2005) Differences in drone and worker physiology in
honeybees (Apis mellifera). Apidologie 36(2): 255-277
Kivrak I, KIVRAK Ş, & Harmandar M (2016) Development of a rapid method for the
determination of antibiotic residues in honey using UPLC-ESI-MS/MS. Food Science and
Technology (Campinas) 36(1): 90-96
Knowles S, Shapiro L, Shear NH (2001) "Should Celecoxib Be Contraindicated in Patients
Who Are Allergic to Sulfonamides?".Drug Safety. 24 (4): 239–247
Korkmaz SD, Kuplulu O, Cil GI, & Akyuz E (2017) Detection of sulfonamide and
tetracycline antibiotic residues in Turkish pine honey. International Journal of Food
Properties 20(sup1): S50-S55
Krivohlavek A, Šmit Z, Baštinac M, Žuntar I, & Plavšc‐Plavšic F (2005) The determination
of sulfonamides in honey by high performance liquid chromatography–mass spectrometry
method (LC/MS). Journal of separation science 28(13): 1434-1439
Kujawski MW, & Namieśnik J (2008) Challenges in preparing honey samples for
chromatographic determination of contaminants and trace residues. TrAC Trends in
Analytical Chemistry 27(9): 785-793
Liu J, Jiang M, Li G, Xu L, & Xie M (2010) Miniaturized salting-out liquid–liquid
extraction of sulfonamides from different matrices. Analytica chimica acta 679(1-2): 74-
80
Locuson CW, Gannett PM, Ayscue R, & Tracy TS (2007) Use of simple docking methods
to screen a virtual library for heteroactivators of cytochrome P450 2C9. Journal of
medicinal chemistry 50(6): 1158-1165
Lues JFR, Botha WC, & Smit EJ (1998) Ion-exchange HPLC analysis of a broad spectrum
of organic acids from matured Cheddar cheese and assessment of extraction methods. Food
research international 31(6-7): 441-447
Majors RE, & Hopper MJ (1974) Studies of siloxane phases bonded to silica gel for use in
high performance liquid chromatography. Journal of Chromatographic Science 12(12):
767-778
Manyi-Loh CE, Clarke AM, & Ndip N (2011) An overview of honey: therapeutic
properties and contribution in nutrition and human health. African Journal of Microbiology
Research 5(8): 844-852

69
Martel AC, & Zeggane S (2003) HPLC determination of sulfathiazole in French
honeys. Journal of liquid chromatography & related Technologies 26(6): 953-961
Maudens KE, & Lambert WE (2004) Quantitative analysis of 14 sulfonamides in honey
after acidic hydrolysis by HPLC with post-column derivatisation and fluorescence
detection. J. Chromatography A 1047: 85
Molan PC (1992). The antibacterial activity of honey: 1. the nature of the antibacterial
activity. Bee world 73(1): 5-28
Molan PC (2002) Re-introducing honey in the management of wounds and ulcers-theory
and practice
National Honey Board (2003) Honey Health and Therapeutic Qualities. National Honey
Board, Longman 28
Nicolaou KC, & Rigol S (2017) A brief history of antibiotics and select advances in their
synthesis. The Journal of Antibiotics
O’Shea R, & Moser HE (2008) Physicochemical properties of antibacterial compounds:
implications for drug discovery. Journal of medicinal chemistry 51(10): 2871-2878
Postmes T, & Vandeputte J (1999) Recombinant growth factors or honey? Burns: journal
of the International Society for Burn Injuries 25(7): 676
Pikkemaat MG, Yassin H, Fels-Klerkx HJ, & Berendsen BJA (2016) Antibiotic residues
and resistance in the environment (No. 2016.009). RIKILT Wageningen UR
Posyniak ANDRZEJ, Sniegocki T, & Zmudzki J (2002) Solid phase extraction and liquid
chromatography analysis of sulfonamide residues in honey. Bulletin-Veterinary Institute
in Pulawy 46(1): 111-118
Posyniak A, Zmudzki J, Niedzielska J, Sniegocki T, & Grzebalska A (2003) Sulfonamide
residues in honey. Control and development of analytical procedure. Apiacta 38: 249-256
Ramírez R, & Montenegro G (2004) Certification of the botanical origin of honey and
corbicular pollen from VI Region of Chile (Litueche). Ciencia e Investigación
Agraria 31(3): 197-211

70
Rehman H, Abdul Qadir M, Shad HA, Khan ZI (2017) One Pot Synthesis of Some Novel
Sulfonamide Derivatives Containing -NH2 Group: Spectral Characterization and
Biological Evaluation. Med Chem (Los Angeles) 7: 252-256.doi: 10.4172/2161-
0444.1000465
Saeedi M, Goli F, Mahdavi M, Dehghan G, Faramarzi MA, Foroumadi A, & Shafiee A
(2014) Synthesis and biological investigation of some novel sulfonamide and amide
derivatives containing coumarin moieties. Iranian journal of pharmaceutical research:
IJPR 13(3): 881
Saner G, Engindeniz S, Tolon B, & Cukur F (2004) The economic analysis of beekeeping
enterprise in sustainable development: A case study of Turkey. Apiacta 38(4): 342-351
Sarmah AK, Meyer MT, & Boxall AB (2006) A global perspective on the use, sales,
exposure pathways, occurrence, fate and effects of veterinary antibiotics (VAs) in the
environment. Chemosphere 65(5): 725-759
Schwaiger I, & Schuch R (2000) Bound sulfathiazole residues in honey-need of a
hydrolysis step for the analytical determination of total sulfathiazole content in
honey. Deutsche Lebensmittel-Rundschau 96(3): 93-98
Schwartz DP, & Sherma J (1986) Practical screening procedure for sulfathiazole in
honey. Journal-Association of Official Analytical Chemists 69(1): 72-74
Shakoor MD (2013) Sulfa allergy: Cross-reactivity versus multiple concurrent allergies
Shao B, Dong D, Wu Y, Hu J, Meng J, Tu X., & Xu S (2005) Simultaneous determination
of 17 sulfonamide residues in porcine meat, kidney and liver by solid-phase extraction and
liquid chromatography–tandem mass spectrometry. Analytica Chimica Acta 546(2): 174-
181.
Sheridan R, Policastro B, Thomas S, & Rice D (2008) Analysis and occurrence of 14
sulfonamide antibacterials and chloramphenicol in honey by solid-phase extraction
followed by LC/MS/MS analysis. Journal of agricultural and food chemistry 56(10): 3509-
3516.181
Slatore CG, Tilles SA (2004) "Sulfonamide hypersensitivity". Immunology and Allergy
Clinics of North America 24(3): 477–49
Snyder LR, Kirkland JJ, & Dolan JW (2011) Introduction to modern liquid
chromatography. John Wiley & Sons

71
Sukul P, & Spiteller M (2006) Sulfonamides in the environment as veterinary drugs.
In Reviews of environmental contamination and toxicology (pp. 67-101). Springer, New
York, NY
Sundaram H, Vijayalakshmi N, & Srilatha K (2009) High Performance Liquid
Chromatography and its role in identification of Mycobacteriae: An Overview. NTI
Bulletin 45: 1-4
Supuran CT, Innocenti A, Mastrolorenzo A, & Scozzafava A (2004) Antiviral sulfonamide
derivatives. Mini reviews in medicinal chemistry 4(2): 189-200
Szczêsna T, Rybak-Chmielewska H, Waœ E, & Pohorecka K (2009) Study on
sulphonamide residues in honey. Journal of Apicultural Science 53(2)
Tačić A, Nikolić V, Nikolić L, & Savić I (2017) Antimicrobial sulfonamide
drugs. Advanced Technologies 6(1): 58-71
Tashakkori P, Bozkurt SS, & Merdivan M (2014) Extraction and preconcentration of
sulfonamides in honey samples by cetyltrimethylammonium bromide coated silica gel and
their determination by HPLC 42(2): 175-182
Thammana M (2016) A Review on High Performance Liquid Chromatography
(HPLC). Department of Pharmacy, Vignan Institute of Pharmaceutical Technology,
Duvvada, India: 25
Thompson TS, & Noot DK (2005) Determination of sulfonamides in honey by liquid
chromatography–tandem mass spectrometry. Analytica Chimica Acta 551(1-2): 168-176
Tilles SA (2001) Practical issues in the management of hypersensitivity reactions:
sulfonamides. Southern medical journal 94(8): 817-817
Tölgyesi Á, Berky R, Békési K, Fekete S, Fekete J, & Sharma VK (2013) Analysis of
sulfonamide residues in real honey samples using liquid chromatography with fluorescence
and tandem mass spectrometry detection. Journal of Liquid Chromatography & Related
Technologies 36(8): 1105-1125
Tolls J (2001) Sorption of veterinary pharmaceuticals in soils: a review. Environmental
science & technology 35(17): 3397-3406
Tsai WH, Chuang HY, Chen HH, Wu YW, Cheng SH, & Huang TC (2010) Application
of sugaring-out extraction for the determination of sulfonamides in honey by high-

72
performance liquid chromatography with fluorescence detection. Journal of
Chromatography A 1217(49): 7812-7815
Van Hoek AH, Mevius D, Guerra B, Mullany P, Roberts AP, & Aarts HJ (2011) Acquired
antibiotic resistance genes: an overview. Frontiers in microbiology 2: 203
Verzegnassi L, Savoy-Perroud MC, & Stadler RH (2002) Application of liquid
chromatography–electrospray ionization tandem mass spectrometry to the detection of 10
sulfonamides in honey. Journal of Chromatography A 977(1): 77-87
White Jr JW (1957) The composition of honey. Bee World 38(3): 57-66
Willson RB, & Crane E (1975) Uses and products of honey. Honey: A Comprehensive
Survey. E. Crane, ed
Wutz K, Niessner R, & Seidel M (2011) Simultaneous determination of four different
antibiotic residues in honey by chemiluminescence multianalyte chip
immunoassays. Microchimica Acta 173(1-2): 1-9
Zotou A, & Vasiliadou C (2006) Selective determination of sulfonamide residues in honey
by SPE-RP-LC with UV detection. Chromatographia 64(5-6): 307-311

PERSONAL BACKGROUND
My name is Alaa Omar Tahir and I was born on the 19th of May, 1990 in Erbil city,
Kurdistan Region-Iraq, I have finished primary, secondary, and high school from Erbil. I
have graduated from SALAHADDIN University/college of science/Environmental
sciences department successfully in 2012. In addition, after four years, I hold the bachelor
certification in that field. I started to work at high food Pack Company (2013) as an
employee sales, and from (2014-2016) as a science teacher at Balla typical secondary
school, In 12th of October of 2016, I started to study of my master degree in biochemistry
at Bingöl University in Turkey, then I got master degree in 2018.
Alaa Omar Tahir
Email: [email protected]