detailed project report honey processing business ... - NIFTEM
25
PM FME- Detailed Project Report of Honey Processing Business 1 DETAILED PROJECT REPORT HONEY PROCESSING BUSINESS UNDER PMFME SCHEME National Institute of Food Technology Entrepreneurship and Management Ministry of Food Processing Industries Plot No.97, Sector-56, HSIIDC, Industrial Estate, Kundli, Sonipat, Haryana-131028 Website: http://www.niftem.ac.in Email: [email protected] Call: 0130-2281089
-
Upload
khangminh22 -
Category
Documents
-
view
1 -
download
0
Transcript of detailed project report honey processing business ... - NIFTEM

PM FME- Detailed Project Report of Honey Processing Business
1
DETAILED PROJECT REPORT
HONEY PROCESSING BUSINESS
UNDER PMFME SCHEME
National Institute of Food Technology Entrepreneurship and Management
Ministry of Food Processing Industries
Plot No.97, Sector-56, HSIIDC, Industrial Estate, Kundli, Sonipat, Haryana-131028
Website: http://www.niftem.ac.in
Email: [email protected]
Call: 0130-2281089

PM FME- Detailed Project Report of Honey Processing Business
2
TABLE OF CONTENTS
S No. Topic Page Number
1. Project Summary 3
2. About the Product 4-5
3. Process Flow Chart 6-7
4. Economics of the Project 8-25
4.1. Basis & Presumptions 8
4.2. Capacity , Utilisation, Production & Output 9-10
4.3. Premises/Infrastructure 10
4.4. Machinery & Equipments 11-13
4.5. Misc. Fixed Assets 13
4.6. Total Cost of Project 14
4.7. Means of Finance 14
4.8 Term Loan 14
4.9. Term Loan repayment & interest schedule 15-18
4.10. Working Capital Calculations 18
4.11. Salaries/Wages 19
4.12. Power Requirement 19
4.13. Depreciation Calculation 20
4.14. Repairs & Maintenance 20
4.15. Projections of Profitability Analysis 21
4.16. Break Even Point Analysis 22
4.17. Projected Balance Sheet 23
4.18. Cash- Flow Statement 24
4.19. Debt-Service Coverage Ratio 25

PM FME- Detailed Project Report of Honey Processing Business
3
1. PROJECT SUMMARY
1. Name of the proposed project : Honey Processing Business
2. Nature of proposed project : Proprietorship/Company/Partnership
3. Proposed project capacity : 176640 Kg/annum(55,58,60,60,&62% capacity utilization in 1st to 5th Year respectively)
4. Raw materials : Honey
5. Major product outputs : Honey
6. Total project cost : Rs.20.56 Lakh
• Land development, building & Civil Construction
: Nil
• Machinery and equipment’s : Rs.8.36 Lakh
• Miscellaneous Fixed Assets : Rs.2.20 Lakh
• Working capital : Rs.10.00 Lakh
8. Means of Finance • Subsidy (max 10lakhs) : Rs.3.70 Lakh
• Promoter’s contribution (min10%) : Rs.2.05 Lakh
• Term loan : Rs.5.81 Lakh
• Working Capital Requirement : Rs.9.00 Lakh
9. Profit after Depreciation, Interest & Tax
• 1styear : Rs.1.07 Lakh
• 2ndyear : Rs.2.73 Lakh
• 3rd year : Rs.4.33 Lakh
• 4th year : Rs.5.04 Lakh
• 5th year : Rs.5.82 Lakh
11. Average DSCR : 3.51
12. Term loan repayment : 5 Years with 6 months grace period

PM FME- Detailed Project Report of Honey Processing Business
4
2. ABOUT THE PRODUCT
2.1. PRODUCT INTRODUCTION:
Honey means the natural sweet substance produced by honey bees from the nectar of blossoms
or from secretions of plants which honey bees collect, transform store in honey combs for
ripening. It shall be free from any foreign matter such as mould, dirt, scum, pieces of beeswax,
the fragments of bees and other insects and from any other extraneous matter.
Honey is among the most popular and widely used sweetener with enormous health benefits. It is
used by several cultures around the world serving as a base for many traditional medicines,
especially in Ayurveda. It is used in strengthens immune system, preparing cosmetic products,
health tonic and food processing industries for preparing different types of drinks, bakery
products, sweets etc. Beekeeping is an ideal activity for development as a subsidiary occupation
providing supplementary income. Beekeeping is feasible in areas where adequate bee flora
available for a minimum period of 6 months.
Honey produced by Indian hive bees is collected by modern extractor. The extracted honey
contains hemophilic yeasts, which causes fermentation and destroy the quality of honey. To
maintain the qualitative and quantitative value of honey the processing in modern Honey
Processing plant is essential
PM FME- Detailed Project Report of Honey Processing Business
5
2.2 MARKET POTENTIAL:
Honey is a major consumable in the international market both as a food item as well as in industries
such as Pharmaceuticals, Cosmetics and Confectionary. The demand is especially high for refined,
high quality honey free pesticides, insecticides and other agrochemicals.
In the domestic market very little amount of honey is use for personal consumption, while majority
is utilized by the pharmaceutical and confectionary industry. With changing life style and
increasing health consciousness, honey is been increasing consumes as health food. This is likely
to drive the domestic demand in future.
As per the information available from Agricultural & Processed Food Products Export
Development Authority, India has exported 51547.31 MT of Natural Honey to the world for the
worth of Rs. 653.58 crore/ 101.32 USD Million during the year of 2017-18 and the Major Export
Destinations (2017-18) are USA, Saudi Arab, U Arab Emts, Canada and Qatar.
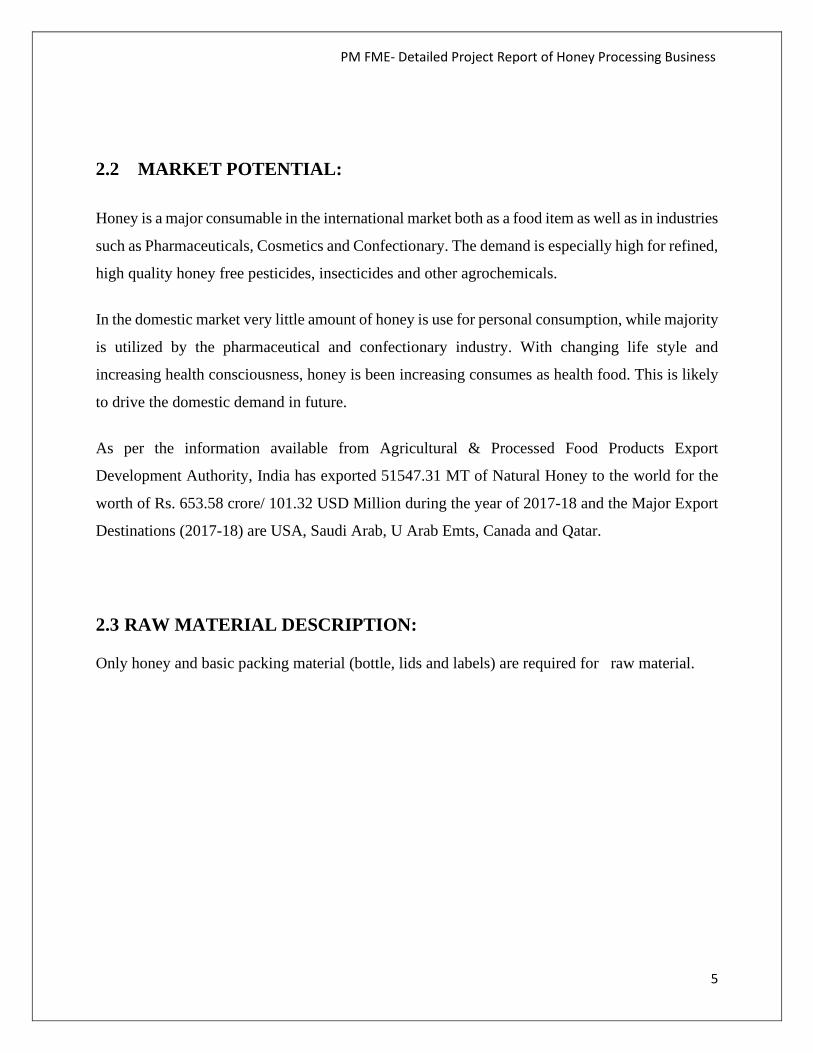
2.3 RAW MATERIAL DESCRIPTION:
Only honey and basic packing material (bottle, lids and labels) are required for raw material.

PM FME- Detailed Project Report of Honey Processing Business
6
3. PROCESS FLOW CHART
The industry of honey is not a simple sequential chain of processing operations, although the
normal consumer may consider it in this way, at first sight. It should be noted that each processing
step, from the initial extraction to the packaging of the final food product, is the answer to peculiar
problems concerning the physicochemical and biological features of different honeys.
In general, the following integrated steps are given below:
After the initial harvest, the material (e.g. honeycombs, frames) is introduced into the so-called
honey extractor: a container able to remove honey by means of the centrifugal force. The
operation has to be carried out into special rooms, with possibility of heating. At the exit from
the extractor, the honey is (a) collected by gravity in tanks placed often on the floor (wax is
separated from honey) and (b) sent to the decanters with the aid of pumps from the same floor.
The extraction must be performed by a desired degree of purification with the aim of eliminating
wax particles and air bubbles, which are possibly mixed with honey during extraction.
Initial Extraction
Dehumidification
Liquefaction and mixture
Heating
Pasteurization
Crystallization
Final packaging

PM FME- Detailed Project Report of Honey Processing Business
7
The purification is carried out with two different techniques: decanting and filtration. By the
safety viewpoint, it should also be considered that extraction procedure (with the collection and
other processing steps) may affect negatively the quality of produced honeys, with special
reference to honey for medical purposes. Consequently, physicochemical and microbiological
features of the final product can be assured on condition that a certain number of precautionary
measures are taken before the final commercialization.
The processed honey is immediately bottled in clean wide mouthed bottles. It is then sealed by
PP Caps. Bottles are wiped dry and labelled. Filled, sealed & labeled bottles are then packed in
labeled cardboard boxes.
FLOW CHART OF GROUNDNUT OIL MANUFACTURING PROCESS
4. ECONOMICS OF THE PROJECT

PM FME- Detailed Project Report of Honey Processing Business
8
4. ECONOMICS OF THE PROJECT
4.1. BASIS & PRESUMPTIONS
1. Production Capacity of Honey is 80 Kg per hour. First year, Capacity has been taken @
55%.
2. Working shift of 8 hours per day has been considered.
3. Raw Material stock is for 07 days and Finished goods Closing Stock has
been taken for 10 days.
4. Credit period to Sundry Debtors has been given for 06 days.
5. Credit period by the Sundry Creditors has been provided for 10 days.
6. Depreciation and Income tax has been taken as per the Income tax Act,
1961.
7. Interest on working Capital Loan and Term loan has been taken at 11%.
8. Salary and wages rates are taken as per the Current Market Scenario.
9. Power Consumption has been taken at 25 KW.
10. Increase in sales and raw material costing has been taken @ 5% on a yearly basis.

PM FME- Detailed Project Report of Honey Processing Business
9
4.2. CAPACITY, UTILIZATION, PRODUCTION & OUTPUT
COMPUTATION OF PRODUCTION OF HONEY Items to be Manufactured Honey
Machine capacity Per hour 80 Kg Total working Hours 8 Machine capacity Per Day 640 Kg
Working days in a month 25
Days Working days per annum 300 Wastage Considered 8% Raw material requirement 192000 Kg Final Output per annum after wastage 176640 Kg Final Product to be packed in 1 kg Packet Number of Packets per annum 176640 Kg
Production of Honey
Production Capacity KG
1st year 55%
97,152
2nd year 58%
1,02,451
3rd year 60%
1,05,984
4th year 60%
1,05,984
5th year 62%
1,09,517
PM FME- Detailed Project Report of Honey Processing Business
10
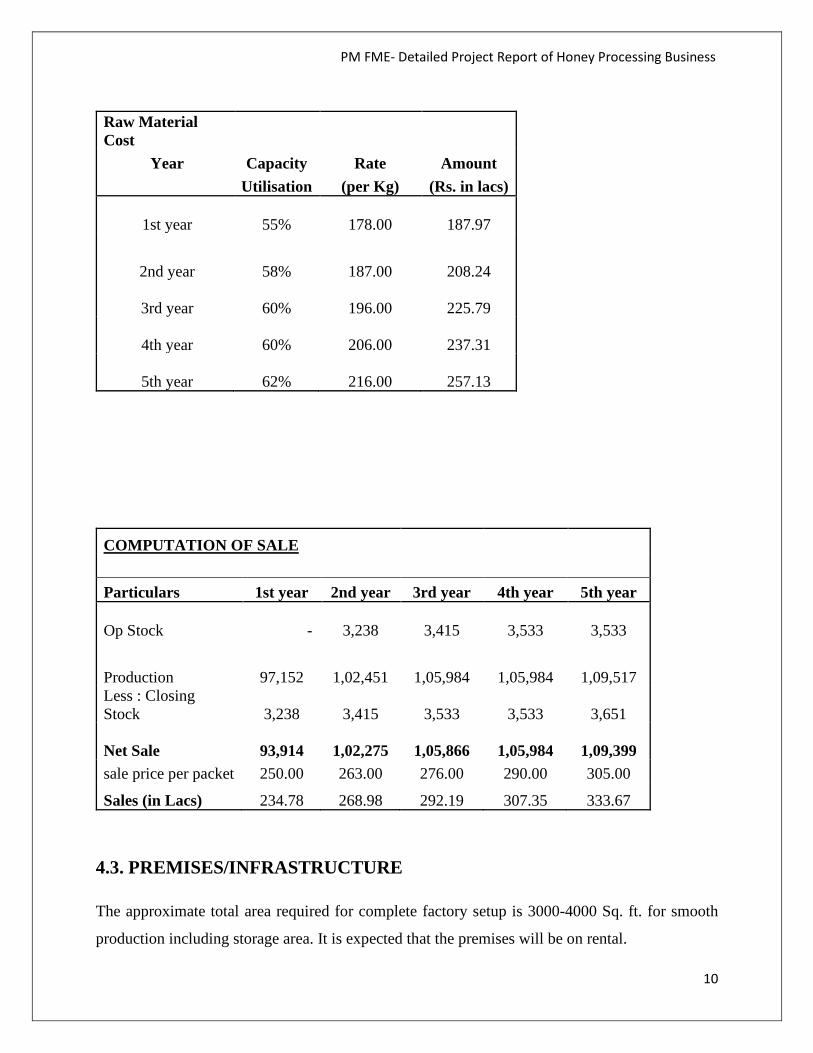
Raw Material Cost
Year Capacity Rate Amount Utilisation (per Kg) (Rs. in lacs)
1st year 55%
178.00 187.97
2nd year 58%
187.00 208.24
3rd year 60%
196.00 225.79
4th year 60%
206.00 237.31
5th year 62%
216.00 257.13
COMPUTATION OF SALE Particulars 1st year 2nd year 3rd year 4th year 5th year
Op Stock -
3,238
3,415
3,533
3,533
Production
97,152
1,02,451
1,05,984
1,05,984
1,09,517 Less : Closing Stock
3,238
3,415
3,533
3,533
3,651
Net Sale
93,914
1,02,275
1,05,866
1,05,984
1,09,399 sale price per packet 250.00 263.00 276.00 290.00 305.00
Sales (in Lacs) 234.78 268.98 292.19 307.35 333.67
4.3. PREMISES/INFRASTRUCTURE
The approximate total area required for complete factory setup is 3000-4000 Sq. ft. for smooth
production including storage area. It is expected that the premises will be on rental.

PM FME- Detailed Project Report of Honey Processing Business
11
4.4. MACHINERY & EQUIPMENTS
Water
Treatment
unit
Water treatment plant and system operators run the equipment, control the processes, and monitor the plants that treat water to make it safe to drink.
Boiler It’s a steam generating equipment which
along with its accompanying systems generates & delivers steam at required temperature & pressure.
S.S. Tank It’s a stainless-steel tank used to store
given liquid & particulate solid.
Jacketed
Storage Tank
Inner
a jacketed vessel is a container that is
designed for controlling temperature of its
contents, by using a cooling or heating
"jacket" around the vessel through which a
cooling or heating fluid is circulated.

PM FME- Detailed Project Report of Honey Processing Business
12
Semi-
Automatic
Single Head
Machine
To fill viscous products, I Premade Pouches/Jars/Containers with piston operated filling system. Model able single filling station machine with adjustable tray. Feeding System: Volumetric Piston Operated filling system Production Speed: 8 to 20 fill/min (depends on materials) Filling Range: +/- 2-3 gms No. of filling counter: Adjustable screw system AirCompressor-3.0 HP
Bottling plant (including bottle washer, filter, crown corking m/c & sterilizer
This is an entire system of machines used to wash, dry, fill, cap, sterilize & package bottles.
Testing equipment
There are different equipment’s used to test quality of final product like lactometer, gravity meter etc.
Weighing balance
It’s a simple weight measuring device use to determine weight of given object using standard weights.
Machine Unit Rate Price
Water Treatment unit (inlet 60 LPH)
1 1,50,000 1,50,000

PM FME- Detailed Project Report of Honey Processing Business
13
Boiler (80 kg/hr) 1 80,000 80,000
S.S. Tank (Capacity -250 Liters)
1 10,000 10,000
Jacketed Storage Tank Inner (250 Liters)
1 45,600 45,600
Semi-Automatic Single Head Machine (20 Bottles per Minute)
1 1,20,000 1,20,000
Bottling plant (including bottle washer, filter, crown corking m/c & sterilizer (40 Bottles per Minute)
1 3,00,000 3,00,000
Testing equipment 2 60,000 120,000
Weighing balance (100 kg)
1 10,000 10,000
Note: Cost of the machinery is approx. Rs.8.36 Lakhs excluding GST and other transportation cost.
4.5. MISCELLANEOUS FIXED ASSETS
• Electricity connection • Other equipment’s & fixture

PM FME- Detailed Project Report of Honey Processing Business
14
4.6. TOTAL COST OF PROJECT
COST OF PROJECT (in Lacs)
PARTICULARS Amount Land & Building Owned/Rented Plant & Machinery 8.36
Miscellaneous Assets 2.20 Working capital 10.00 Total 20.56
4.7. MEANS OF FINANCE
MEANS OF FINANCE
PARTICULARS AMOUNT Own Contribution (min 10%) 2.05 Subsidy @35%(Max. Rs 10 Lac) 3.70
Term Loan @ 55% 5.81
Working Capital (Bank Finance) 9.00
Total 20.56
4.8. TERM LOAN: Term loan of Rs.5.81 Lakh is required for project cost of Rs.20.56 Lakh.

PM FME- Detailed Project Report of Honey Processing Business
15
4.9. TERM LOAN REPAYMENT & INTEREST SCHEDULE
REPAYMENT SCHEDULE OF TERM LOAN Interest 11.00%
Year Particulars Amount Addition Total Interest
Repayment Closing Balance
1st Opening Balance
1st month - 5.81
5.81 - - 5.81
2nd month 5.81 -
5.81 0.05 - 5.81
3rd month 5.81 -
5.81 0.05 - 5.81
4th month 5.81 -
5.81 0.05 5.81
5th month 5.81 -
5.81 0.05 5.81
6th month 5.81 -
5.81 0.05 5.81
7th month 5.81 -
5.81 0.05 0.11 5.70
8th month 5.70 -
5.70 0.05 0.11 5.59
9th month 5.59 -
5.59 0.05 0.11 5.49
10th month 5.49 -
5.49 0.05 0.11 5.38
11th month 5.38 -
5.38 0.05 0.11 5.27
12th month 5.27 -
5.27 0.05 0.11 5.16 0.57 0.65 2nd Opening Balance
1st month 5.16 -
5.16 0.05 0.11 5.06
2nd month 5.06 -
5.06 0.05 0.11 4.95
3rd month 4.95 -
4.95 0.05 0.11 4.84
4th month 4.84 -
4.84 0.04 0.11 4.73
5th month 4.73 -
4.73 0.04 0.11 4.62

PM FME- Detailed Project Report of Honey Processing Business
16
6th month 4.62 -
4.62 0.04 0.11 4.52
7th month 4.52 -
4.52 0.04 0.11 4.41
8th month 4.41 -
4.41 0.04 0.11 4.30
9th month 4.30 -
4.30 0.04 0.11 4.19
10th month 4.19 -
4.19 0.04 0.11 4.09
11th month 4.09 -
4.09 0.04 0.11 3.98
12th month 3.98 -
3.98 0.04 0.11 3.87 0.50 1.29 3rd Opening Balance
1st month 3.87 -
3.87 0.04 0.11 3.76
2nd month 3.76 -
3.76 0.03 0.11 3.66
3rd month 3.66 -
3.66 0.03 0.11 3.55
4th month 3.55 -
3.55 0.03 0.11 3.44
5th month 3.44 -
3.44 0.03 0.11 3.33
6th month 3.33 -
3.33 0.03 0.11 3.23
7th month 3.23 -
3.23 0.03 0.11 3.12
8th month 3.12 -
3.12 0.03 0.11 3.01
9th month 3.01 -
3.01 0.03 0.11 2.90
10th month 2.90 -
2.90 0.03 0.11 2.80
11th month 2.80 -
2.80 0.03 0.11 2.69
12th month 2.69 -
2.69 0.02 0.11 2.58 0.36 1.29 4th Opening Balance
1st month 2.58 -
2.58 0.02 0.11 2.47
2nd month 2.47 -
2.47 0.02 0.11 2.37

PM FME- Detailed Project Report of Honey Processing Business
17
3rd month 2.37 -
2.37 0.02 0.11 2.26
4th month 2.26 -
2.26 0.02 0.11 2.15
5th month 2.15 -
2.15 0.02 0.11 2.04
6th month 2.04 -
2.04 0.02 0.11 1.94
7th month 1.94 -
1.94 0.02 0.11 1.83
8th month 1.83 -
1.83 0.02 0.11 1.72
9th month 1.72 -
1.72 0.02 0.11 1.61
10th month 1.61 -
1.61 0.01 0.11 1.51
11th month 1.51 -
1.51 0.01 0.11 1.40
12th month 1.40 -
1.40 0.01 0.11 1.29 0.22 1.29 5th Opening Balance
1st month 1.29 -
1.29 0.01 0.11 1.18
2nd month 1.18 -
1.18 0.01 0.11 1.08
3rd month 1.08 -
1.08 0.01 0.11 0.97
4th month 0.97 -
0.97 0.01 0.11 0.86
5th month 0.86 -
0.86 0.01 0.11 0.75
6th month 0.75 -
0.75 0.01 0.11 0.65
7th month 0.65 -
0.65 0.01 0.11 0.54
8th month 0.54 -
0.54 0.00 0.11 0.43
9th month 0.43 -
0.43 0.00 0.11 0.32
10th month 0.32 -
0.32 0.00 0.11 0.22
11th month 0.22 -
0.22 0.00 0.11 0.11
12th month 0.11 -
0.11 0.00 0.11 - 0.08 1.29

PM FME- Detailed Project Report of Honey Processing Business
18
DOOR TO DOOR 60 MONTHS MORATORIUM
PERIOD 6 MONTHS REPAYMENT PERIOD 54 MONTHS
4.10. WORKING CAPITAL CALCULATIONS
COMPUTATION OF CLOSING STOCK & WORKING CAPITAL (in Lacs)
PARTICULARS 1st year 2nd year 3rd year 4th year 5th year Finished Goods
7.45 8.27 8.94 9.38 10.19
Raw Material 4.39 4.86 5.27 5.54 6.00 Closing Stock 11.84 13.13 14.21 14.92 16.19
COMPUTATION OF WORKING CAPITAL REQUIREMENT TRADITIONAL METHOD (in Lacs) Particulars Amount Own Margin Bank Finance Finished Goods & Raw Material 11.84 Less : Creditors 6.27
Paid stock 5.57 10% 0.56 90% 5.01
Sundry Debtors 4.70 10% 0.47 90% 4.23
10.27 1.03 9.24
MPBF 9.24 WORKING CAPITAL LIMIT DEMAND ( from Bank) 9.00 Working Capital Margin 1.00

PM FME- Detailed Project Report of Honey Processing Business
19
4.11. SALARY & WAGES
BREAK UP OF LABOUR CHARGES Particulars Wages No of Total Rs. per Month Employees Salary
Plant Operator 10,000 1 10,000 Skilled (in thousand rupees) 12,000 3 36,000 Unskilled (in thousand rupees) 6,000 2 12,000
Total salary per month 58,000 Total annual labour charges (in lacs) 6.96
BREAK UP OF STAFF SALARY CHARGES Particulars Salary No of Total Rs. per Month Employees Salary Helper 7,500 1 7,500
Manger 20,000 1 20,000 Accountant 15,000 1 15,000
Total salary per month 42,500
Total annual Staff charges (in lacs) 5.10
4.12 POWER REQUIREMENT
Utility Charges (per month) Particulars value Description Power connection required 25 KWH consumption per day 200 units
Consumption per month
5,000 units Rate per Unit 10 Rs.
power Bill per month
50,000 Rs.

PM FME- Detailed Project Report of Honey Processing Business
20
4.13. DEPRECIATION CALCULATION
COMPUTATION OF DEPRECIATION (in Lacs)
Description Plant & Machinery Miss. Assets
TOTAL
Rate of Depreciation 15.00% 10.00% Opening Balance - - -
Addition 8.36 2.20 10.56 Total 8.36 2.20 10.56 Less : Depreciation 1.25 0.22 1.47 WDV at end of Year 7.11 1.98 9.09
Additions During The Year - - - Total 7.11 1.98 9.09 Less : Depreciation 1.07 0.20 1.26 WDV at end of Year 6.04 1.78 7.82 Additions During The Year - - - Total 6.04 1.78 7.82 Less : Depreciation 0.91 0.18 1.08 WDV at end of Year 5.13 1.60 6.74
Additions During The Year - - - Total 5.13 1.60 6.74
Less : Depreciation 0.77 0.16 0.93
WDV at end of Year 4.36 1.44 5.81 Additions During The Year - - - Total 4.36 1.44 5.81 Less : Depreciation 0.65 0.14 0.80
WDV at end of Year 3.71 1.30 5.01
4.14. REPAIR & MAINTENANCE: Repair & Maintenance is 2.5% of Gross Sale.

PM FME- Detailed Project Report of Honey Processing Business
21
4.15. PROJECTIONS OF PROFITABILITY ANALYSIS
PROJECTED PROFITABILITY STATEMENT (in Lacs)
PARTICULARS 1st year 2nd year
3rd year
4th year 5th year
Capacity Utilisation % 55% 58% 60% 60% 62%
SALES Gross Sale Honey 234.78 268.98 292.19 307.35 333.67 Total 234.78 268.98 292.19 307.35 333.67 COST OF SALES Raw Material Consumed 187.97 208.24 225.79 237.31 257.13 Electricity Expenses 6.00 6.90 7.94 9.13 10.04 Depreciation 1.47 1.26 1.08 0.93 0.80 Wages & labour 6.96 8.35 10.02 12.03 13.83 Repair & maintenance 5.87 6.72 7.30 7.68 8.34 Packaging 15.26 16.68 16.07 14.45 15.68
Cost of Production 223.53 248.16 268.21 281.52 305.82 Add: Opening Stock /WIP - 7.45 8.27 8.94 9.38
Less: Closing Stock /WIP 7.45 8.27 8.94 9.38 10.19
Cost of Sales 216.08 247.34 267.54 281.08 305.01 GROSS PROFIT 18.70 21.64 24.65 26.27 28.66 7.97% 8.05% 8.44% 8.55% 8.59% Salary to Staff 5.10 5.92 7.22 8.30 9.13 Interest on Term Loan 0.57 0.50 0.36 0.22 0.08 Interest on working Capital 0.99 0.99 0.99 0.99 0.99 Rent 3.60 3.96 4.36 4.79 5.27 selling & adm exp 7.37 7.53 7.30 6.76 7.01 TOTAL 17.63 18.90 20.23 21.06 22.47 NET PROFIT 1.07 2.74 4.42 5.21 6.18 0.46% 1.02% 1.51% 1.70% 1.85% Taxation - 0.01 0.10 0.17 0.36 PROFIT (After Tax) 1.07 2.73 4.33 5.04 5.82

PM FME- Detailed Project Report of Honey Processing Business
22
4.16. BREAK EVEN POINT ANALYSIS
BREAK EVEN POINT ANALYSIS Year I II III IV V Net Sales & Other Income 234.78 268.98 292.19 307.35 333.67 Less : Op. WIP Goods - 7.45 8.27 8.94 9.38 Add : Cl. WIP Goods 7.45 8.27 8.94 9.38 10.19 Total Sales 242.24 269.80 292.86 307.80 334.48 Variable & Semi Variable Exp. Raw Material Consumed 187.97 208.24 225.79 237.31 257.13 Electricity Exp/Coal Consumption at 85% 5.10 5.87 6.74 7.76 8.53 Wages & Salary at 60% 7.24 8.56 10.34 12.20 13.78 Selling & adminstrative Expenses 80% 5.90 6.03 5.84 5.41 5.61 Interest on working Capital 0.99 0.99 0.99 0.99 0.99 Repair & maintenance 5.87 6.72 7.30 7.68 8.34 Packaging 15.26 16.68 16.07 14.45 15.68 Total Variable & Semi Variable Exp 228.32 253.09 273.09 285.79 310.05 Contribution 13.91 16.72 19.77 22.00 24.42 Fixed & Semi Fixed Expenses Electricity Exp/Coal Consumption at 15% 0.90 1.04 1.19 1.37 1.51 Wages & Salary at 40% 4.82 5.71 6.90 8.13 9.18 Interest on Term Loan 0.57 0.50 0.36 0.22 0.08 Depreciation 1.47 1.26 1.08 0.93 0.80 Selling & adminstrative Expenses 20% 1.47 1.51 1.46 1.35 1.40 Rent 3.60 3.96 4.36 4.79 5.27 Total Fixed Expenses 12.84 13.98 15.35 16.79 18.24 Capacity Utilization 55% 58% 60% 60% 62% OPERATING PROFIT 1.07 2.74 4.42 5.21 6.18 BREAK EVEN POINT 51% 48% 47% 46% 46% BREAK EVEN SALES 223.61 225.55 227.37 234.90 249.78
PM FME- Detailed Project Report of Honey Processing Business
23
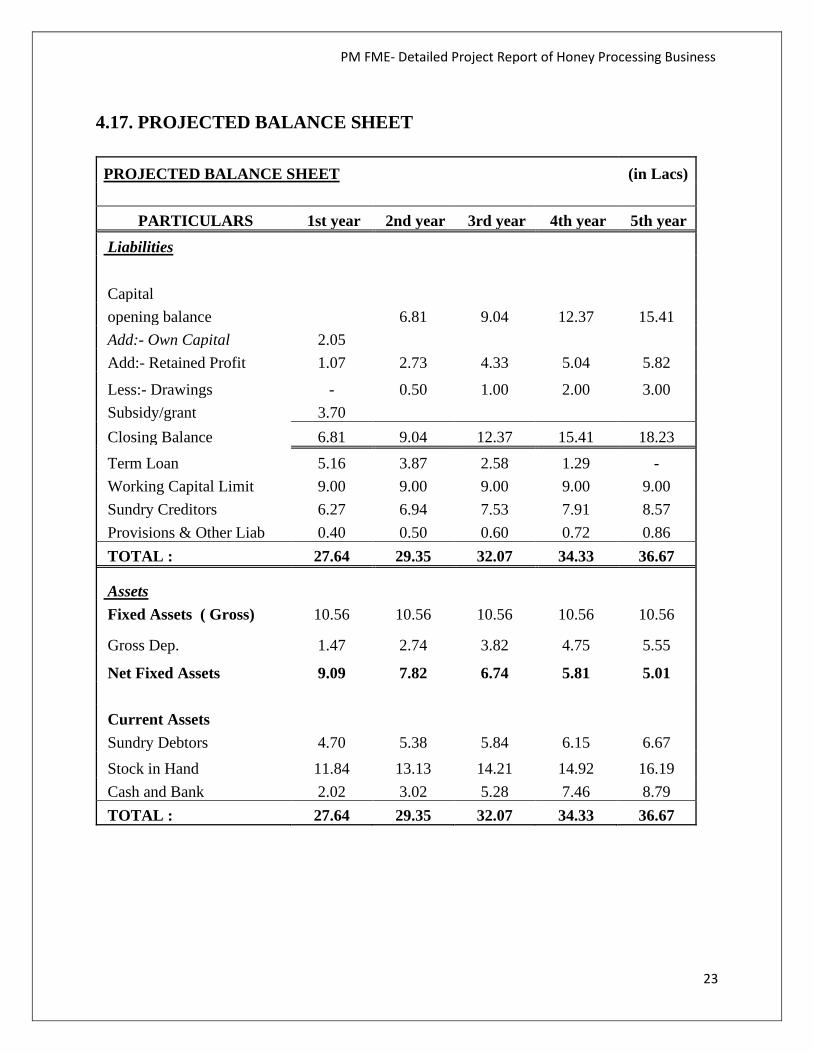
4.17. PROJECTED BALANCE SHEET
PROJECTED BALANCE SHEET (in Lacs)
PARTICULARS 1st year 2nd year 3rd year 4th year 5th year Liabilities
Capital opening balance 6.81 9.04 12.37 15.41 Add:- Own Capital 2.05 Add:- Retained Profit 1.07 2.73 4.33 5.04 5.82
Less:- Drawings - 0.50 1.00 2.00 3.00 Subsidy/grant 3.70 Closing Balance 6.81 9.04 12.37 15.41 18.23 Term Loan 5.16 3.87 2.58 1.29 - Working Capital Limit 9.00 9.00 9.00 9.00 9.00 Sundry Creditors 6.27 6.94 7.53 7.91 8.57 Provisions & Other Liab 0.40 0.50 0.60 0.72 0.86 TOTAL : 27.64 29.35 32.07 34.33 36.67
Assets Fixed Assets ( Gross) 10.56 10.56 10.56 10.56 10.56
Gross Dep. 1.47 2.74 3.82 4.75 5.55
Net Fixed Assets 9.09 7.82 6.74 5.81 5.01 Current Assets Sundry Debtors 4.70 5.38 5.84 6.15 6.67 Stock in Hand 11.84 13.13 14.21 14.92 16.19 Cash and Bank 2.02 3.02 5.28 7.46 8.79 TOTAL : 27.64 29.35 32.07 34.33 36.67

PM FME- Detailed Project Report of Honey Processing Business
24
4.18. CASH FLOW STATEMENT
PROJECTED CASH FLOW STATEMENT (in Lacs)
PARTICULARS 1st year
2nd year
3rd year
4th year 5th year
SOURCES OF FUND
Own Margin 2.05 Net Profit 1.07 2.74 4.42 5.21 6.18 Depriciation & Exp. W/off 1.47 1.26 1.08 0.93 0.80 Increase in Cash Credit 9.00 - - - -
Increase In Term Loan 5.81 - - - - Increase in Creditors 6.27 0.68 0.58 0.38 0.66 Increase in Provisions & Oth lib 0.40 0.10 0.10 0.12 0.14 Sunsidy/grant 3.70 TOTAL : 29.76 4.78 6.19 6.65 7.79 APPLICATION OF FUND Increase in Fixed Assets 10.56 Increase in Stock 11.84 1.29 1.08 0.71 1.27
Increase in Debtors 4.70 0.68 0.46 0.30 0.53 Repayment of Term Loan 0.65 1.29 1.29 1.29 1.29
Drawings - 0.50 1.00 2.00 3.00 Taxation - 0.01 0.10 0.17 0.36 TOTAL : 27.74 3.78 3.93 4.47 6.45 Opening Cash & Bank Balance - 2.02 3.02 5.28 7.46 Add : Surplus 2.02 1.00 2.26 2.17 1.34 Closing Cash & Bank Balance 2.02 3.02 5.28 7.46 8.79
PM FME- Detailed Project Report of Honey Processing Business
25
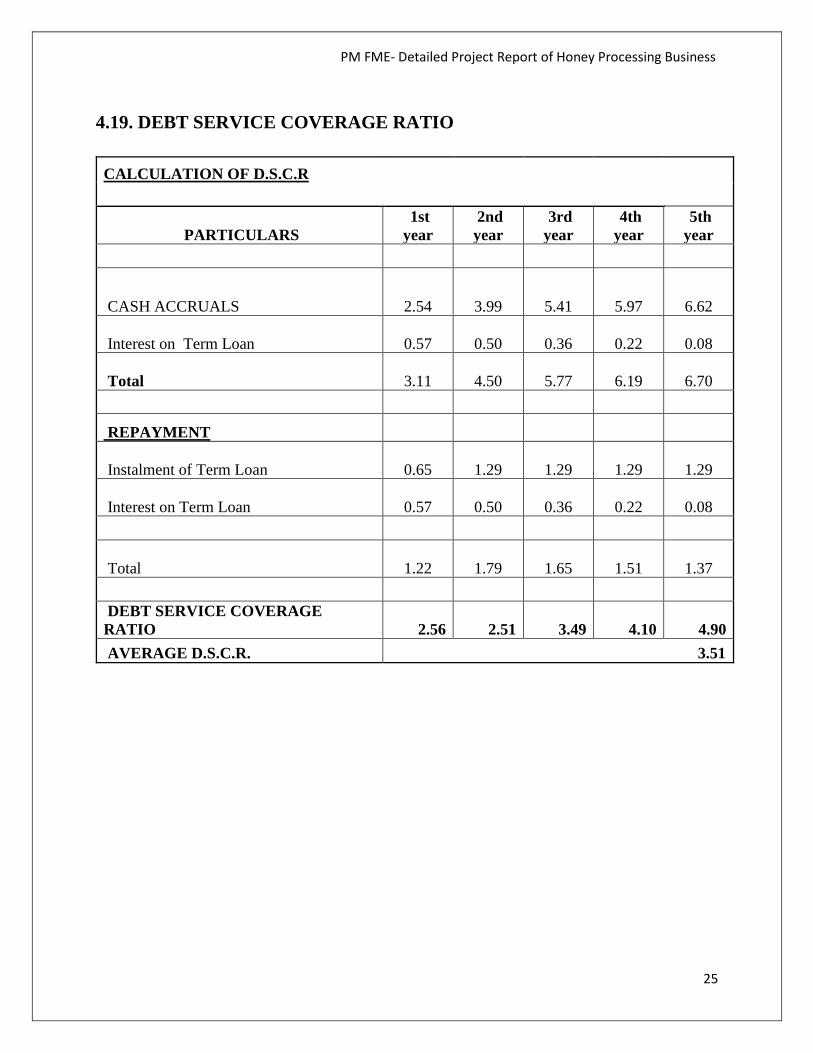
4.19. DEBT SERVICE COVERAGE RATIO
CALCULATION OF D.S.C.R
PARTICULARS 1st year
2nd year
3rd year
4th year
5th year
CASH ACCRUALS
2.54
3.99
5.41
5.97
6.62
Interest on Term Loan
0.57
0.50
0.36
0.22
0.08
Total
3.11
4.50
5.77
6.19
6.70
REPAYMENT
Instalment of Term Loan
0.65
1.29
1.29
1.29
1.29
Interest on Term Loan
0.57
0.50
0.36
0.22
0.08
Total
1.22
1.79
1.65
1.51
1.37 DEBT SERVICE COVERAGE RATIO 2.56 2.51 3.49 4.10 4.90 AVERAGE D.S.C.R. 3.51