
detailed project report (dpr)
173
------------------------------------------------------------------------------- IWMP-II nd MAU (UP):DoLR 1 DETAILED PROJECT REPORT (D.P.R.) (I.W.M.P. 2 nd – MAU ) INTEGRATED WATERSHED MANAGEMENT PROGRAMME, BLOCK- KOPAGANJ, GHOSI & BADARAON DISTRICT - MAU (UTTAR PRADESH) Submitted to: - Prepared By:- Department of Land Development & Bhoomi Sanrakshan Adhikari Water Resources. Lucknow (U.P.) Department of Land Development & Water Resources, Mau Land Development & Water Resources Government of U. P. Lucknow
-
Upload
khangminh22 -
Category
Documents
-
view
2 -
download
0
Transcript of detailed project report (dpr)

-------------------------------------------------------------------------------IWMP-IInd MAU (UP):DoLR
1
DETAILED PROJECT REPORT (D.P.R.)
(I.W.M.P. 2nd – MAU ) INTEGRATED WATERSHED MANAGEMENT PROGRAMME, BLOCK- KOPAGANJ, GHOSI & BADARAON
DISTRICT - MAU (UTTAR PRADESH)
Submitted to: - Prepared By:- Department of Land Development & Bhoomi Sanrakshan Adhikari Water Resources. Lucknow (U.P.) Department of Land
Development & Water Resources, Mau Land Development & Water Resources Government of U. P. Lucknow

-------------------------------------------------------------------------------IWMP-IInd MAU (UP):DoLR
2
TABLE OF CONTENT
Executive Summary PROJECT AT GLANCE CHAPTER 1 PROJECT INTRODUCTION AND BACKGROUND 1.1 Project Background................................................................................................................................................................. 4
Table No.1 : Basic project information................................................................................................................................... 4 1.2 Need and Scop for Watershed Development .......................................................................................................................... 4
Table No.2 : Weightage of the Project .................................................................................................................................. 4 Table No.2.1 : Criteria and Weightage for Selection of Watershed ...................................................................................... 5
1.3 Objective and Scope of project.............................................................................................................................................. 5 1.4 Watershed Information .......................................................................................................................................................... 6 1.5 Status of previous watershed programmes and other development project scheme on the watershed area ......................... 6
Table No. 4 Development programmes running in the project area:………………………………………………..... 6 CHAPTER 2 GENREAL DISCRIPTION OF THE WATERSHED 2.1 location.................................... ………………………………………………………………………………………......... 7 2.2 Aria.. land use pattern ............................................................... …………………………………………….....…….......... 8
Table No. 5 Aria Under major land uses, irrigated and rain fed aria etc. 2.3 Physiographiy ....................................... .......................………………………………………............................................. 9
Table No 6 : Elevation range Longitude latitude relief height defiance etc. ................................................................... 9 2.3.1 Major stream ....................................................................................................................................................................... 10
Table No.7 : Stream characteristics of watershed 2.4: Climate :………………………………………………................................................................................................... 10
2.4.1 : Climatic Condition ……………………………………………….................................................................................... 10 Table No. 8: Climatic Condition ...................................................................................................................................... 10
2.5: Watershed Characteristics ………………………………………………............................................................................. 11 2.5.1: Shape and size ………………………………………………........................................................................................... 11
Table No. 9: Shape and size of watershed ........................................................................................................................ 11 2.5.2. : Length of main stream drainage density, average slope, watershed relief etc. ……………………………………….. 11
Table No. 10 : Length of main stream drainage density, average slope, watershed relief etc. ........................................ 11 2.6.: Geomorphology and soils………………………………………………..... ........................................................................ 11 2.6.1 : Geomorphology ………………………………………………......................................................................................... 11

-------------------------------------------------------------------------------IWMP-IInd MAU (UP):DoLR
3
2.6.2: Sloppy land. sandy loam ………………………………………………............................................................................. 11 2.6.3: Fine Textured alluvial soils ………………………………………………....................................................................... 12 2.6.4: Coarse textured alluvial soils ……………………………………………….................................................................... 12 2.6.5: Drainage ……………………………………………….................................................................................................... 12 CHAPTER 3 BASELINE SURVEY 3.1: Socio Economic condition :....................................... .......................……………………………………… ...................... 13 3.1.1: Demographic patterm :............................................................. .......................……………………………………….... 13
Table No 11 : Demographic patterm Detail ............................................................................................................ ….. 13 3.1.2 Literacy Rate ..................................................................................................................................................................... 14
Table No. 12 Literacy Rate Detail .................................................................................................................................. 13 3.1.3 : Migration pattern ………………………………………………..................................................................................... 15
Table No. 13 : Migration Detail………………………………………………..... ........................................................ 15 3.1.4: Infrastructure social features ……………………………………………….................................................................... 16
Table No. 14 Details of Infrastructure In the project aria ………………………………………………..................... 16 3.1.5 : Venn Diagram ……………………………………………….......................................................................................... 18 3.1.6 : Historical timeline………………………………………………..... ............................................................................... 20 3.2.: Soil And land use ………………………………………………........................................................................................ 22 3.2.1. : Soil Morphology ………………………………………………..................................................................................... 22 3.2.2.: Morphology of a typical soil profile of micro watershed (dominant soil) …………………………………………… 23 3.2.3: Soil characteristics and firtility status ………………………………………………...................................................... 23
Table no. 15 soil characteristics and firtility status up to 6………………………………………………................... 23 3.2.4: land capability classification (L.C.C.) ………………………………………………...................................................... 24
Table No. 16 aira under different land capability class under micro watershed …………………………………….. 24 3.2.4.1.: Land capability class I (white ) ………………………………………………............................................................. 24 3.2.4.2: land capability class II whitish, yellow………………………………………………................................................... 25 3.2.4.4.: land capability class III/IV (Greysh yellow) ………………………………………………......................................... 25 3.2.4.5.: Mapping units symbol ………………………………………………........................................................................... 25 3.2.4.6 Detail of soil erosion in project area................................................................................................................................. 25 Table no 16a Detail of soil erosion 3.3. : land use pattern ………………………………………………........................................................................................... 26 3.3.1: Land holding ……………………………………………….............................................................................................. 26
Table No. 17 Distribution of farm families according to their size of landings ……………………………………… 26 3.3.2.: Land use………………………………………………..... ............................................................................................... 27

-------------------------------------------------------------------------------IWMP-IInd MAU (UP):DoLR
4
Table No. 18 : Land use pattern ………………………………………………............................................................... 27 3.3.2.1 : Agriculture ………………………………………………............................................................................................... 27 3.3.2.2 : Crop Productivity ……………………………………………….................................................................................... 29
Table No. 19 : Production and Productivities of important commodities in IWMP IInd Mau …………………………. 29 3.3.2.3: Indigenous technological knowledge (ITK………………………………………………............................................... 30 3.4. Horticulture ………………………………………………..................................................................................................... 30 3.5: live Stock Population ………………………………………………...................................................................................... 31
Table No. 20 : Live Stock Population………………………………………………..... ................................................... 31 3.6.: Fisheries ………………………………………………......................................................................................................... 32 3.7: Forest and other vegetation ………………………………………………............................................................................. 32 3.7.1. : Forests ………………………………………………........................................................................................................ 32 3.7.2.: Horticulture and agro-forestry ……………………………………………….................................................................... 32 3.7.3: Agro. Forestry ……………………………………………….............................................................................................. 32 3.7.: Livelihood Pattern ……………………………………………….......................................................................................... 33
Table No. 21: Livelihood Pattern (Occupational Distribution) ………………………………………………................ 33 3.7.1.: Per Capita income ………………………………………………....................................................................................... 33
Table no. 22: Per capita income and IWMP Ist Mau………………………………………………..... ............................. 33 3.8.: Hydrology and water resource ………………………………………………....................................................................... 34 3.8.1. : Table No. 23 : Hydrology Status ………………………………………………................................................................ 34 3.8.2: Water resource ……………………………………………….............................................................................................. 34
Table No. 24: Information about water resource………………………………………………..... ................................... 34 3.9.: PROBLEMS AND NEEDS OF THE AREA………………………………………………..... ............................................ 35 3.9.1 : Problems identification and prioritization ……………………………………………….................................................. 35
Table No. 25. : Problems identification and prioritization for Micro Watersheds …………………………………….. 35 Table No. 26: SWOT analysis of the Micro Watersheds………………………………………………............................ 36
CHAPTER 4 : INSTITUTION BULDING AND PROJECT MANAGEMENT . 4.1 : Participatory Rural Appraisal (PRA) ……………………………………………….............................................................. 37 4.2. : Social Mobilization and community Organization………………………………………………......................................... 37
Table No. 27 : Physical Outlays of PIA,U.G. SHG , W.D.T. and W.C……………………………………………….... 37 4.2.1: Watershed Committee ……………………………………………….................................................................................. 37
Table No. 28 : Details of watershed Committee (WC) ……………………………………………….............................. 38 4.2.2. : Watershed Development Team………………………………………………..... .............................................................. 42
Table NO. 29 : Details of watershed development teams (WDTs) in the project area ………………………………… 42 4.2.3: Self help group ……………………………………………….............................................................................................. 42

-------------------------------------------------------------------------------IWMP-IInd MAU (UP):DoLR
5
Table No. 30 SHG Detail ………………………………………………............................................................................ 43 4.2.4: User Group ………………………………………………..................................................................................................... 45
Table No. 31: UGS Detail ………………………………………………............................................................................ 45 4.3.: Project Implementing agencies ………………………………………………........................................................................ 48
Table No. 32 : Project Implementing agency (PIA) ………………………………………………................................... 48 4.4: Project Implementation Strategy………………………………………………..... .................................................................. 50 4.4.1 : Scientific Planning ………………………………………………....................................................................................... 50 I. Cluster Approach ……………………………………………….......................................................................................... 50 II. Base Line Survey ……………………………………………….......................................................................................... 50 III. Participatory Rural Appraisal (PRA) ………………………………………………............................................................ 50 IV. Use Of GIS and Remote sensing for planning ……………………………………………….............................................. 51
A. Prioritization ………………………………………………........................................................................................... 51 B. Planning ……………………………………………….................................................................................................. 51 C. Hydrological modeling………………………………………………............................................................................ 51 Table no. 34 : Details of Scientific Planning and inputs in IWMP project ………………………………………………...... 54
4.5. : Convergence of watershed programs ………………………………………………............................................................... 53 Table No. 35: Details Of Convergence Other Schemes in the project Area with IWMP Project ……………………….
CHAPTER 5 MANAGEMENT AND ACTION PLAN 5.1. Preparatory Phase ……………………………………………….............................................................................................. 56 5.1.1 : Entry Point Activities ……………………………………………….................................................................................... 56
Table no. 36 : Entry Point Activities (EPA) ………………………………………………................................................ 56 Table No. 37 : Other activities of Preparatory Phase ……………………………………………….................................. 58
5.1.2: Institution and capacity Building ………………………………………………................................................................... 58 5.1.2.1: Institution ……………………………………………….................................................................................................... 58
Table No. 38; List of approved Training institutes @ for capacity Building in the project area ……………………….. 58 5.1.2.2: Capacity Building ………………………………………………....................................................................................... 59
Table No. 39 : Capacity Building activities in the project ……………………………………………….......................... 59 Table no. 40 : Detail of activities undertaken ………………………………………………............................................... 60 Table No. 41: Information Education & Communication (IEC) activities in the project area ………………………….. 60
5.1.3: Detail Project Report ………………………………………………...................................................................................... 60 5.2. WORK PHASE ……………………………………………….................................................................................................. 61 5.2.1: Soil and moisture conservation ………………………………………………....................................................................... 61 1. Ridge Area Treatment Plans: ……………………………………………….........................................................................61

-------------------------------------------------------------------------------IWMP-IInd MAU (UP):DoLR
6
A. Contour Bunding………………………………………………..... .......................................................................................61 B. Marginal and Peripheral Bund………………………………………………........................................................................62 C. Submergence Bundhies and gully Plug ……………………………………………….........................................................62 2. Water Harvesting Budhies ……………………………………………….............................................................................62 3. Pucca Structure : ………………………………………………............................................................................................62 4. Aroforestry : ………………………………………………...................................................................................................62 5. Dry Land horticulture ………………………………………………....................................................................................62
Table No. 42 : Activities related to surface water resources in the project areas@………………………………………63 Table no. 43: Technical detail of Farm Ponds and Injection Well ………………………………………………...............63 Table no. 44: Activities related to recharging ground water resources in the project area @……………………………64 Table No. 45: Activities executed by user groups in the Project@………………………………………………............... 64 Table no 46 : Details of engineering structures in watershed works………………………………………………...........65
Table no 47: Total Treatment of Micro Watershed of IWMP 1st ………………………………………………............ Table no 48: Technical detail of engineering works in project area………………………………………………..........66 5.2.2 PROPOSED LAND USE
Table no. 50: Present and proposed land use plan of the IWMP-Ist watershed………………………………………..67 5.2.3 WATER RESOURCE DEVELOPMENT AND SOIL CONSERVATION MEASURES
Table no. 51 : Details of activities connected with vegetative cover in watershed works…………………………………72 Table no. 52: Technical Details of Afforestation and Agro forestry Activities in 1ha……………………………………..74 Table no. 53: Cost Estimation for afforestation and Agro forestry activity in 1ha…………………………………………74 Table no. 54: Technical Details of Horticultural Activities in 1ha………………………………………………..................75 Table no. 55 : Cost Estimation for Horticultural Activities in 1ha………………………………………………..................75
5.2.4 PRODUCTION SYSTEM AND MICRO ENTERPRIZES (Financial out lays 13% i.e., Rs. 92.04 lacs) Table no. 56 : Agriculture Production………………………………………………...............................................................76 Table no. 57: Horticultural Production :- ………………………………………………..........................................................78 Table no. 58:ANIMAL HUSBANDRY……………………………………………….............................................................79 Table no. 59: Fish Production………………………………………………...........................................................................80 Table no. 60 : Details of allied/ other activities (Total of the production system and micro enterprises intervention)…….80 Table no. 61: Item wise total for the project……………………………………………….....................................................83 Table no 62: Activities related production system and micro enterprizes intervention by Self Help Groups (SHGs) in the Project areas………………………………………………....................................................................................................................83
5.2.5 LIVELIHOOD ACTIVITIES Table no. 63 : Details of allied/ other activities (Total of livelihood intervention) ………………………………………..84 Table no. 64: Item wise total for the project………………………………………………...................................................86 Table no. 65: Activities related to livelihoods by Self Help Groups (SHGs) in the Project areas……………………….....87

-------------------------------------------------------------------------------IWMP-IInd MAU (UP):DoLR
7
Table no 66 : (A) Details of livelihoods created for landless people*- including micro enterprises…………………..87 Table no. 67: (B) Details of other livelihoods created for farmers ………………………………………………........87
5.2.6 Marketing linkage Table no. 68: Backward and Forward Linkage………………………………………………................................................88
5.3 Convergence Planning for various activities 5.3.1 Convergence with MNREGS...................................................................................................................................................88 5.3.2 Soil health card, crop demonstration, kisan gosthi, kisan mela, farmer’s school also organized in watershed area under many
scheme of department of Agriculture. ………………………………………………..............................................................................88
5.3.3 Composite fish farming or mixed fish farming popularized in this area with Department of fisheries. ……...……….88 5.3.4 Animal health camp, fodder development, vaccination work also made through Veterinary Department…………..88 5.3.5 Aforestation in project area also done with Forest Department. ………………………………………………...............88 5.3.6 Dry land horticulture also convergence with department of horticulture. …………………………………..…………..88 Table no. 69: Details of Convergence of other Schemes in the Project area with IWMP Project……….………...........89 CHAPTER 6 CAPACITY BUILDING PLAN
Table no 70 : Capacity Building activities in the project………………………………………………...............................92 Table no 71: Detail of activities undertaken ……………………………………………….................................................92 CHAPTER 7 PHASING OF PROGRAMMES AND BUDGETING
7.1 FUNDING OF THE PROJECT………………………………………………...................................................................................93 Table no. 72 : Funding for the IWMP Project * (All financial figures in lakh Rs.) ………………………………….......................93
7.2 YEAR WISE PHASING OF WORK (Physical and Financial) ………………………………………………..................................93 Table no. 73: COMPONENT WISE AND YEAR WISE PHASING OF PHYSICAL AND FINANCIAL OUTLAY.....................93
Table no. 74:ABSTARACT OF COMPONENT WISE WORK AND FINANCIAL OUTLAY OF WATERSHED........................94 CHAPTER 8 CONSOLIDATION/EXIT STRATEGY 8.1 Quality and Sustainability Issues………………………………………………............................................................................96 8.1.1 Plans for Monitoring and Evaluation ………………………………………………...............................................................................................96 8.1.2 Plans for Project management: ………………………………………………..... ................................................................96 8.1.3 Watershed Development Fund: ……………………………………………….......................................................................96 8.1.4 User Charges: ………………………………………………..................................................................................................97 8.2 Activities in the CPRs in the project area………………………………………………...............................................................97
Table no. 75: Details of activities in the CPRs in the Project areas ………………………………………………..............97 8.3 Sustainability and environment security………………………………………………..........................................................98 8.4 Economic Analysis………………………………………………............................................................................................98 8.4.1 Agriculture……………………………………………….........................................................................................................99
Table no. 76: Economics of agriculture sector………………………………………………................................................99

-------------------------------------------------------------------------------IWMP-IInd MAU (UP):DoLR
8
8.4.2 Horticulture………………………………………………........................................................................................................99 Table no. 77: Economics of Horticulture sector………………………………………………..............................................99
8.4.3 Forest/ Fuel wood plantation……………………………………………….............................................................................100 Table no. 78: Economics of aforestation sector………………………………………………............................................100
8.4.4 Food sufficiency ………………………………………………...............................................................................................100 Table no 79: Status of food requirement and availability per annum in IWMP-II watershed……………………….........100
CHAPTER 9 EXPECTED OUTCOMES 9.1 Employment ……………………………………………….....................................................................................................101
Table no. 80: Employment in Project area ………………………………………………....................................................101 9.2. Migration ………………………………………………..........................................................................................................101
Table no. 81: Details of seasonal migration from Project area ………………………………………………..................101 9.3 Drinking water ……………………………………………….................................................................................................102 Table no. 82: Status of Drinking water ………………………………………………............................................................102 9.4 Vegetative cover ………………………………………………...............................................................................................102 Table no. 83: Forest/vegetative cover ………………………………………………..............................................................102 9.5 Livestock ………………………………………………..........................................................................................................102
Table no. 84: Details of livestock in the project areas (for fluids please mention in litres, for solids please mention in kgs. and income in Rs.) ………………………………………………................................................................................................................103
9.6 Vegetation/ crop related outcomes: ……………………………………………….................................................................103 Table no. 85: Details of karif drop area and yield in the project areas ……………………………………………….....103 Table no. 86: Details of Rabi drop area and yield in the project areas *…………………………………………...…....104
Expected/Estimated Outcomes (IWMP-II)-Mau……………………………………………….........................................................
CHAPTER 10 DETAILS ESTIMATE OF WATERSHED DEVELOPMENT WORK PHASE- (ANNEXURE-1).....105-136 CHAPTER 11 DRAWING AND DETAILS ESTIMATE OF LIVELIHOOD PROGRAMME- (ANNEXURE-2)......136-141 CHAPTER 12 DRAWING AND DETAILS ESTIMATE OF PRODUCTION SYSTEM AND MICRO ENTERPRISES - (ANNEXURE-3)............................................................................................................................................142-157 CHAPTER 13 MAPS Mapping..............................................................................................................................................................................

-------------------------------------------------------------------------------IWMP-IInd MAU (UP):DoLR
9
EXCUTIVE SUMMARY
The Watershed comprises of Sevnty two villages in Ghosi, Badrao, Kopaganj Block of Mau District of Utter Pradesh. All these
watersheds has been identified by the Land development and water resources by IWMP-II scheme proper prioritization of different parameter for watershed selection criteria Mau. The watershed is located in the south west of Mau District. Its lives between 25.63 N Latitude and 83.75E (2B2A4e1g, 2B2A4c1e, 2B2A4c1b, 2B2A4c1c, 2B2A4c2a, 2B2A4c2b ) Its altitude 63.50 M above the mean sea Level (MSL) The total area of watershed is 7575.00 ha., All these watershed are surrounded by the 33 grampanchayat. A watershed is the entire land areas which drain into a stream from its mouth. The watershed of a steam has not only area, but also depth extending from the top of the vegetation to the confining geologic strata beneath. It is a hydrologic unit. There is an infinite relationship between land & water. In simple words it can be refused to the divide separating one drainage basin from other. It is also used a synonym for catchments over or a drainage basin.
The intensification of land use in to traditional agricultural sifting is self depting because it is exploitive the present agricultures practice greatly increase runoff is soil erosion, reduce ground water recharge, cause flood & sedimentation of reservoirs etc. As a result, the cultivated land resource base is shirking and its productive co capacity is diminishing.
The climate of the region is characterized as arid to semi arid with average annual rainfall ranges 780 mm annually with an average of 62 rainy days. Out of which above 85% is received during the monsoon season from July to September. The area received very less rainfall in the winter season. How ever temperature ranges from as high as 43ºc in the May- June to as low as 5ºc during December January the pattern of rainfall is highly erratic & maximum water goes as run off.
Run off, erosion & drainage represent serious problems in may areas of semiarid tropics. These problems can be solved by evolving developmental programmers which take into consideration natural topography and drainage pattern of the land. The collection of excess water and its utilization to provide greater stability to rainfed agriculture appears to be a variable developmental alternative. The watershed is the natural frame work for resource development in relation to crop production.
The most soils of targeted area are sodic in nature, where productivity is very low. PH of these soils ranges from 8.5 to 10. These soils are deficient in organic matter, water holding capacity & micronutrients. Improved greed’s of animal & high yielding varieties of different crops, which have sodieness tolerance capacity like Usar Dhan 1 & 3 Daincha, Wheat, Barley, Beer, Bal & Anola, Guava have need to introduce, In spite of that 33% area of sandy clay loam in nature, which have good soil characteristics along with productivity.
Farming is the main occupation of the dwellers of the watershed. The major crops over Rice Wheat Bajra, Archer, Mustard, Sugarcane etc. raised most of the lands kept fallow during khariff because of irregular & uncertain rainfall during the rainy season; Rice & Wheat are the most pre dominant cropping system in the area. A tune off 42 % area under agricultural crop is covered during khariff season in the watershed. Among them various crops like race. Shares maximum area (28%) followed by Arhar (5%) Jowar (4%), Maize (3%) & sugarcane (2%).
Natural vegetation of watershed is not very scientific way. The Forest vegetation is far-dominant with shisham (Dalbergia sissoo) Karanj (Dongamain global), Mango (Manjifera indica) Babul (Acacia lilotica) Golar, Neem (Azadirchta indica) etc. There is no proper pasture in the watershed. Grass patches are seen only on the bunds, road side & other such palaces, the principal grasses are serpat, dub (Cynolon ducty bin) Kans.

-------------------------------------------------------------------------------IWMP-IInd MAU (UP):DoLR
10
The erosion is main problem of the watersheds is to be locked by harvesting additional water is existing water harvesting structure, which have lost most of their capacity due to siltation & creating new water bodies. Water stored in the water harvesting structures shall be properly recycled to provide supplemental irrigation of critical growth stages of crops & for the establishment of fruit orchards and forest trees.
In agricultural land will treated with bunding alongwith minor leveling. Waste land will be treated with the engineering measures
like staggered trenchs and a forestation etc. Budget for the various components is given as below – S.No. Budge Component Percentage Total (Lakhs)
1 Management Cost
a) Administration Cost 10% 66.90
b) Monitoring Cost 1% 06.69
c) Evaluation 1% 06.69
Sub Total
12% 80.28
2 Preparatory Phase
a) Entry Point Activities 4% 26.76
b) Capacity building 5% 33.45
c) Preparation of DPR 1% 06.69
Sub Total
10% 66.90
3 Watershed Works 50% 334.50
4 Livelihood Activities 10% 66.90
5 Production System and Micro-enterprises 13% 86.97
6 Consolidation Phase 5% 33.45
Total
- 581.82

-------------------------------------------------------------------------------IWMP-IInd MAU (UP):DoLR
11
Grand Total
669.00
PROJECT AT GLANCE 1 Name of Project IWMP-II-, Mau
2 Name of Block Ghosi, Badrao, Kopaganj
3 Name of District Mau
4 Name of State Utter Pradesh
5 Name of Gram Panchayat
1. Rajpura, Bhira, Mishrauli Kuchahra, Sarayasadi, Dhraki, Madia Rampur, Mairjapur Jamalpur, Sarhara, Karissath, Lakhipur, Pyraepur, Masina, Bhawarkol, Hilasakorar, Machikla.
6 Name of village under micro- watershed
Chamarhi, Devakol, Rajpura, bhupaura, Bhira, Saraiganga Palli, Nadwa Khas, Nadwa Patti, Kheri Deeh, Bhikhari pur, Tajpur, Dera Ghat, Mishrauli, Harbanshpur,, Pakari Khurd, Chak Khurd, Chak Kanheli, Zamin Pakaripurg, Ojhi Pur, Bhairopur, Faridpur, Chandpur, Kanheli, Bhatauli Bhaisa, Fatehpur, Kuchahara, Beezpura, Vikrampur, Sarai Sadi, Chak Siwar Mo., Moonzdad, Miyanpur, Dharauli, Sodhanpur, Somwari Deeh, Kathauli Zamin, Gauri Deeh, Baraipur Dawarika, Makdumpur Samastpur, Kasba Khas, Pahadpur, Zamialpur Mirzapur, Chak payag, Chak Babban, Chak Vishwnath, Chak Chakarpan, Sarsaha Zamin, Kalafanpur, Kapoorpur, Karishath, Khaspur Kirk., Lakhipur, Bhairopur, Tighara, Bibipur, Pyarepur, Padami Dand, Singhpur, Nokhat, Maseena, Bhawarkol, Abupur, Kodar, Hilsa, Chisti, Tikma, Garha, Kachhi Kalan, Kopaganj, Rajpur, Murarpur, Saidpur
7 Micro watershed code selected
2B2A4e1g, 2B2A4c1e, 2B2A4c1b, 2B2A4c1c, 2B2A4c2a, 2B2A4c2b Note- Micro watershed Code No. 2B2A4e1g area have 0.56 ha. so, it is not workable.
8 Total area of project 5790.00 ha.
9 Proposed area for treatment
5575.00 ha.
10 Cost per Hectare 12000.00 per ha.
11 Project period 2010-11 to 2014-15 1st
-------------------------------------------------------------------------------IWMP-IInd MAU (UP):DoLR
12
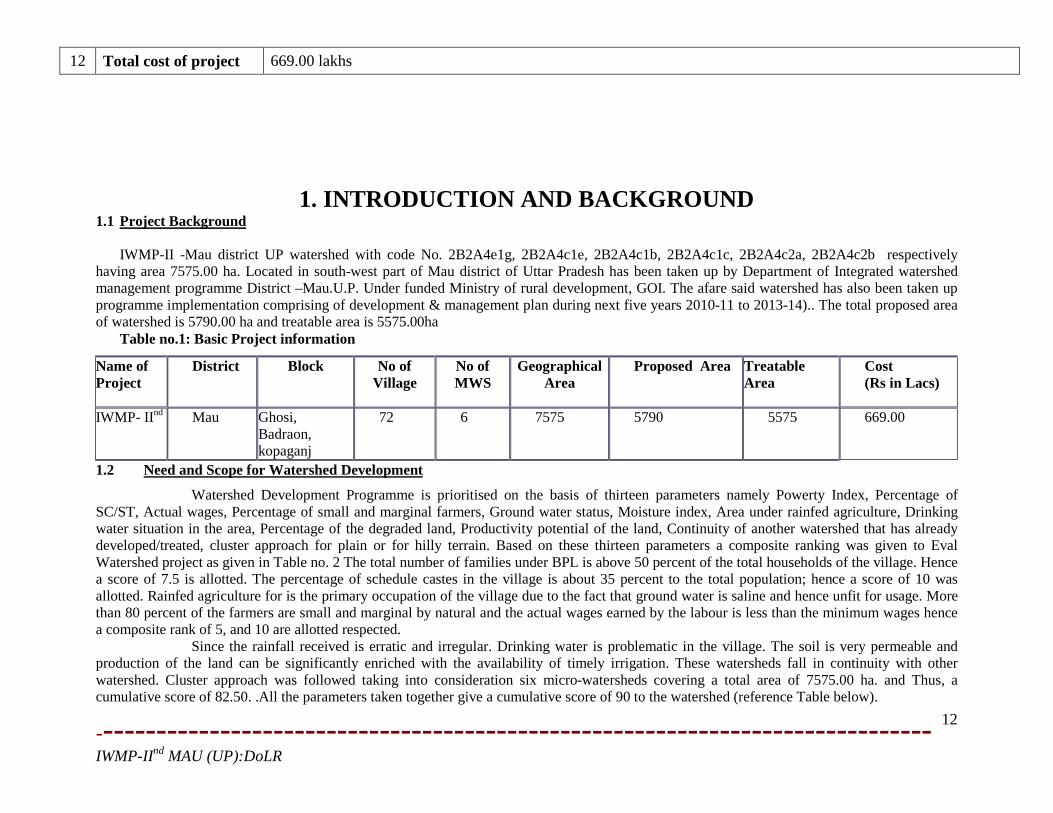
12 Total cost of project 669.00 lakhs
1. INTRODUCTION AND BACKGROUND 1.1 Project Background
IWMP-II -Mau district UP watershed with code No. 2B2A4e1g, 2B2A4c1e, 2B2A4c1b, 2B2A4c1c, 2B2A4c2a, 2B2A4c2b respectively having area 7575.00 ha. Located in south-west part of Mau district of Uttar Pradesh has been taken up by Department of Integrated watershed management programme District –Mau.U.P. Under funded Ministry of rural development, GOI. The afare said watershed has also been taken up programme implementation comprising of development & management plan during next five years 2010-11 to 2013-14).. The total proposed area of watershed is 5790.00 ha and treatable area is 5575.00ha
Table no.1: Basic Project information
Name of Project
District Block No of Village
No of MWS
Geographical Area
Proposed Area Treatable Area
Cost (Rs in Lacs)
IWMP- IInd Mau Ghosi, Badraon, kopaganj
72 6 7575 5790 5575 669.00
1.2 Need and Scope for Watershed Development
Watershed Development Programme is prioritised on the basis of thirteen parameters namely Powerty Index, Percentage of SC/ST, Actual wages, Percentage of small and marginal farmers, Ground water status, Moisture index, Area under rainfed agriculture, Drinking water situation in the area, Percentage of the degraded land, Productivity potential of the land, Continuity of another watershed that has already developed/treated, cluster approach for plain or for hilly terrain. Based on these thirteen parameters a composite ranking was given to Eval Watershed project as given in Table no. 2 The total number of families under BPL is above 50 percent of the total households of the village. Hence a score of 7.5 is allotted. The percentage of schedule castes in the village is about 35 percent to the total population; hence a score of 10 was allotted. Rainfed agriculture for is the primary occupation of the village due to the fact that ground water is saline and hence unfit for usage. More than 80 percent of the farmers are small and marginal by natural and the actual wages earned by the labour is less than the minimum wages hence a composite rank of 5, and 10 are allotted respected.
Since the rainfall received is erratic and irregular. Drinking water is problematic in the village. The soil is very permeable and production of the land can be significantly enriched with the availability of timely irrigation. These watersheds fall in continuity with other watershed. Cluster approach was followed taking into consideration six micro-watersheds covering a total area of 7575.00 ha. and Thus, a cumulative score of 82.50. .All the parameters taken together give a cumulative score of 90 to the watershed (reference Table below).

-------------------------------------------------------------------------------IWMP-IInd MAU (UP):DoLR
13
Table no. 2: Weightage of the project
Project Name Project Type Weightage Total
IWMP-II- Eastern
plain i ii iii iv v vi vii viii ix x xi xii xiii
82.5
7.5 5 5 10 5 0 10 5 5 10 5 15 0
Table no 2.1: Criteria and weight age for selection of watershed S.
No. Criteria Maxim
um score
Ranges & scores
i Poverty index (% of poor to population)
10 Above 80 % (10) 80 to 50 % (7.5) 50 to 20 % (5) Below 20 % (2.5)
ii % of SC/ ST population 10 More than 40 % (10) 20 to 40 % (5) Less than 20 % (3) iii Actual wages 5 Actual wages are
significantly lower than minimum wages (5)
Actual wages are equal to or higher than minimum wages (0)
iv % of small and marginal farmers
10 More than 80 % (10) 50 to 80 % (5) Less than 50 % (3)
v Ground water status 5 Over exploited (5) Critical (3) Sub critical (2) Safe (0)
vi Moisture index/ DPAP/ DDP Block
15 -66.7 & below (15) DDP Block
-33.3 to -66.6 (10) DPAP Block
0 to -33.2 (0) Non DPAP/ DDP Block
vii Area under rain-fed agriculture 15 More than 90 % (15) 80 to 90 % (10) 70 to 80% (5) Above 70 % (Reject)
viii Drinking water 10 No source (10) Problematic village (7.5) Partially covered (5) Fully covered (0)
ix Degraded land 15 High – above 20 % (15) Medium – 10 to 20 % (10) Low- less than 10 % of TGA (5)

-------------------------------------------------------------------------------IWMP-IInd MAU (UP):DoLR
14
x Productivity potential of the land
15 Lands with low production & where productivity can be significantly enhanced with reasonable efforts (15)
Lands with moderate production & where productivity can be enhanced with reasonable efforts (10)
Lands with high production & where productivity can be marginally enhanced with reasonable efforts (5)
xi Contiguity to another watershed that has already been developed/ treated
10 Contiguous to previously treated watershed & contiguity within the microwatersheds in the project (10)
Contiguity within the microwatersheds in the project but non contiguous to previously treated watershed (5)
Neither contiguous to previously treated watershed nor contiguity within the microwatersheds in the project (0)
xii Cluster approach in the plains (more than one contiguous micro-watersheds in the project)
15 Above 6 micro-watersheds in cluster (15)
4 to 6 microwatersheds in cluster (10) 2 to 4 microwatersheds in cluster (5)
xiii Cluster approach in the hills (more than one contiguous micro-watersheds in the project)
15 Above 5 micro-watersheds in cluster (15)
3 to 5 microwatersheds in cluster (10) 2 to 3 microwatersheds in cluster (5)
Total 150 150 90 41 2.5 1.3 Objectives and Scope of Project
a. Conservation, development and sustainable management of natural resources including their use b. Enhancement of agriculture production and productivity in a sustainable manner. c. Restoration of ecological balance in the degraded and fragile rain-fed ecosystem. d. Reduction in regional disparity between rain-fed and irrigated areas. e. Creation of sustainable employment opportunities for the rural community for livelihood security.
1.4 Watershed Information
S. No. Name of the Project Type of watershed Micro watershed Name Code Area (ha)
1 IWMP-II - MAU Micro watershed Karisath 2B2A4c1e 1680.00 2 Micro watershed Vijpura 2B2A4c2c 780.00 3 Micro watershed Rawridih 2B2A4c1g 335.00 4 Micro watershed Maidapur Samastipur 2B2A4c2b 625.00 5 Micro watershed Jamalpur Mirzapur 2B2A4c1c 950.00 6 Micro watershed Hazipur 2B2A4c1b 1205.00 Total 5575.00 Source: secondary data

-------------------------------------------------------------------------------IWMP-IInd MAU (UP):DoLR
15
1.5 Status of previous watershed programmes & other development project/scheme in the watershed area
The IWMP-II -watershed area being very backword, has been on top priority of a number of development project. These programmes are mahatma Gandhi National Rural Employment Guarantee Scheme (MGNREGS), Swarnjayanti Gram Swarojgar Yojna (SGSY), Indra Awas Yojna etc.
Table no. 4 Developmental Programmes running in the project area S. No. Name of Programmes/Scheme Sponsored Agencies Objectives Commencement
(year)
Village Covered
1 MGNREGS Rural Development Dept. Employment 2009 65
2 IAY Rural Development Dept. Housing 2005 58
3 SGSY Rural Development Dept. Self employment 1999 52
Source: Primary data

-------------------------------------------------------------------------------IWMP-IInd MAU (UP):DoLR
16
2. GENERAL DISCRIPTION OF THE WATERSHED 2.1 Location
The eight watersheds in Mohammdabad Gohna and Badraon block of Mau District (U.P.) is located 20 to 25 Km away from District headquarters and 10 Km away from block headquarter situated between 25.63 N Latitude and 83.75E longitude

-------------------------------------------------------------------------------IWMP-IInd MAU (UP):DoLR
17
2.2 Area: Land use Pattern
The IWMP-II -watersheds has diversified land uses namely agriculture, waste land (open scrub), seasonal water
bodies etc. The varied present land use and area under different categories in watershed is shown in Table 5. The mixed land use
followed in the watershed is almost similar in other parts of the U.P. During PRA exercise, the villagers prepared land use. One such
map of village of IWMP-II -watershed is shown in table5.
Table 5. Area under major land uses, irrigated and rain fed area, etc
Area in hectare S.N. Name of
Project
No of Micro
Watershed
Geographical
area
Forest
Area
Agriculture
land
Rain fed
Area
Pasture
land
Wastelands Treatable
Area Cultivated Uncultivable
1 IWMP-II 6 7575 1.50 7315.00 5790.00 2.50 2150 256.00 5575.00
Source: Primary data
Various agricultural land uses in the watershed are extended to diversified land capabilities starting fro marginal to good class
II lands. The watershed distinctly has three types of lands i.e. leveled, sloping and degraded and undulating. The agriculture is

-------------------------------------------------------------------------------IWMP-IInd MAU (UP):DoLR
18
practiced on all these soil types though the productivity considerably varies. The total area under agriculture in the watershed is about
7315.00 ha out of which 1525.00 ha is irrigated while 5790.00 ha is under rain-fed agriculture. The water (both irrigated and drinking)
is most scarce natural resource in the watershed. The problem of tube wells for irrigation of agricultural crops frequently leads to the
drinking water problem to the farmers of watershed forcing them to carry drinking water from out side the watershed area. The
agricultural field bunds are common in the watershed, however, they frequently breach on heavy rains adversely affecting the in situ
percolation of rain water in the soils.
2.3 Physiography
Total area of the IWMP- IInd MAU is 5790.00 ha with treatable area 5575.00 ha. Elevation range and location of altogether five
micro watershed shed are given below above
Table no. 6: Elevation range, longitude latitude, relief height difference etc
Location of watershed Elevation of watershed from MSL District Mandal Micro
watershed Habitation Longitude Latitudes Highest Lowest Relief height
difference Mau Azamgrh Karisath
2B2A4c1e Rajpura, Bhikharipura, Tajpur, Deraghat, Mishrauli Bhauropur,
8375’ 15” to 8375’10” East
2563’10” to 2563’20” North
61 57 5
Mau Azamgrh Vijpura 2B2A4c2c
Bijpura, Fatehpur, Kuchahara, Bikarampur, Bhatauli Baishya,
8375’ 30” to 8375’15” East
2563’35” to 2563’45” North
66 58 8
Mau Azamgrh Rewaridih 2B2A4c1g
Reuridih, Nadwapatti, Chakmir,
8375’ 45” to 8375’20” East
2563’25” to 2563’35” North
65 52 13
Mau Azamgrh Maidapur Samastipur 2B2A4c2b
Pakarikhurd, Ojipur, Harbanshpur,
8375’ 10” to 8375’20” East
2563’10” to 2563’20” North
62 56 6

-------------------------------------------------------------------------------IWMP-IInd MAU (UP):DoLR
19
Chak Kanheli, Gauri, Kaithauli
Mau Azamgrh Jamalpur Mirzapur 2B2A4c1c
Zamalpur Mirzapur, Chak Payag, Chak Bishwanath, Chak Ghughwl Rampur
8375’ 55” to 8375’40” East
2563’40” to 2563’30” North
65 50 15
Mau Azamgrh Hazipur 2B2A4c1b
Hazipur, Sinhpur, Khunsekhpur, Takiya Shahbatala,
8375’ 25” to 8375’20” East
2563’10” to 2563’25” North
63 57 6
Source : Remote sensing Lknow.& GPS
2.3.1 Major stream
The watershed is in the mid of IWMP-II IInd Mau in the form of tauns river having precipitous slop and drained in gully of Tauns river near Bara village. About 4 % of watershed area has slop more than 1% upright ridges. The top of the watershed exhibit extremely precipitous and manifesting moderate to severe erosion class. The lower portion of the watershed has moderate slope (less than 1 %). At the outlet of water shed small gullied are notice , covered with sparse vegetation. In Total (1st order -42numbers, 2nd order-4 numbers and 3rd order-2 numbers) numbers of streams of different order are found in the watershed, with total stream length of 44100 m. Stream characteristics of watershed are presented in the table
Table No.7: Stream characteristics of watershed (IWMP-II -Mau) Stream order Stream number Main stream length
1st order 2 20250.00 2nd order 4 20400.00 3rd order 2 3450.00
Total 8 44100.00 2.4 Climate
The watershed falls under the semi-arid region of tropical climate. The average annual precipitation is 680 mm spreading over 62 rainy days. Most of the rainfall (about 85 %) is received during July to September. The rainfall is of moderate to high intensity. The area receives on or scanty rainfall in the winter season. The temperature variation ranges from as high as 43oC in the month of May- June to as low as 5oC in December- January. 2.4.1 Climatic Condition
Table no. 8: Climatic Condition S. Name of Project Name of the No. of Micro No. of Information

-------------------------------------------------------------------------------IWMP-IInd MAU (UP):DoLR
20
No.
block/
Watershed revenue villages
Average Rainfall and rainy days (in mm) Temperature (c ) Relative humidity (%)
2008 2009 2010 2008 2009 2010 2008 2009 2010
Avg. in
Mm
No. Of
Days
Avg. in
Mm
No. Of
Days
Avg. in
Mm
No. Of
Days
Min- Max
Min- Max
Min- Max
Min- Max
Min- Max
Min- Max
1 IWMP-II IInd - MAU
Ghosi 3 24 400.00 90 432.00 119 199.00 85.00 38.00 37.9 35 85 85 82
2 Badraon 2 24 484.00 81 542.00 118 185.00 77.00 37.50 37.6 35 86 85 83
Kopaganj 2 24 484.00 81 542.00 118 185.00 77.00 37.50 37.6 35 86 85 83

-------------------------------------------------------------------------------IWMP-IInd MAU (UP):DoLR
21
2.5 Watershed Characteristics
2.5.1 Shape and Size
The watershed shape (IWMP-II -Mau) is elongate type. The maximum length and width of IWMP-II -Mau the watershed are
23550 m and 20300 m, respectively with the length: width ratio 1.16:1
Table no. 9: Shape and Size of watershade
S. N. Micro watershed Name
Code Area (ha) Shape Approximate size in meter
Ratio Length: width
Length Width 1 Karisath 2B2A4c1e 1680.00 Pentagonal 3650 2400 1.52:1 2 Vijpura 2B2A4c2c 780.00 Rectangle 2300 2100 1.09:1 3 Rawridih 2B2A4c1g 335.00 L shape 10100 2750 3.67:1 4 Maidapur Samastipur 2B2A4c2b 625.00 Rectangle 8200 1250 6.56:1 5 Jamalpur Mirzapur 2B2A4c1c 950.00 Cubical 3750 2300 1.63:1 6 Hazipur 2B2A4c1b 1205.00 3450 3300 1.04:1
2.5.2 Length of main stream, drainage density, average slope, watershed relief etc. Table no. 10: Length of main stream, drainage density, average slope, watershed relief etc
S.No. Project Name Main stream Drainage Density Average Slope Watershed Relief 1 IWMP-II - MAU I-2050 meter
II- 20400 meter III- 3450 meter
0.90-1.20 meter/second
0-4% 6-13 meter
2.6 Geomorphology and Soils 2.6.1 Geomorphology The IWMP-II, Mau watershed is located South-west side of the Mau district. The entire watershed is topographically divided
into two major landforms. Accordingly, the soils of watershed can be grouped into two major categories. Such as
• Plain land • Ravinous land

-------------------------------------------------------------------------------IWMP-IInd MAU (UP):DoLR
22
2.6.2 Sloppy Land-Sandy Loam The topmost portion (western & northwest part) of the watershed is Sloppy land with occasional depressions of flat land. These
soils are derived from the Sandy loam and are located at some height of around 10 feet. They have developed from typical alluvial soil
slightly alkaline in nature with occasional thin layers of silt in small patches. Near the high level, the soils are coarse and underlying
with hard sandstones. The soils of the upper level and very nearby adjoining areas are loamy sand to sand in texture. Depth is the
major limitations of these soil groups. As move away upper level, the soil depth gradually increases along with clay content thereby
improving the fertility. The soils are alluvial in colour with ferruginous concretions with slightly alkaline in reaction.
2.6.3 Fine textured alluvial soils
These soils are the most extensive soil group found in the IWMP-II -Mau watershed. The middle portion of watershed is
relatively flat land with fine soil texture. These soils are grey in colour and are inherently high in fertility status. These grey soils are
sticky with high pH and on drying develop numerous cracks and fissures. Soil texture is silty clay loam particularly in depressions and
loam in the elevated portion. The soils of the lower horizon are invariably heavier than the surface, being a zone of compaction and
invariably a zone of calcium carbonate accumulation in the form of Kankar nodules. A subsurface indurate pan of kankar of clay or
mixtures of both locally called as Potni soils are prevalent, which impede the downward movement of water thereby creating problems
of high runoff.
2.6.4 Coarse textured alluvial soils
These soils are lying mostly near the adjoining areas of Tamsa River near the outlet and around the lower portion of foot hill of
watershed. These soils are coarser in texture and are relatively poor in fertility status. The soils are loamy sand in texture. These soils
also occupy significant area of the watershed. The soils are derived from the alluvial deposit and also from residual soils of the hill
region. Rill and gully formation in some parts particularly near the outlet of watershed can be seen.
2.6.5 Drainage
Due to prevalence of mild to steep slopes and presence of a number of drainage lines in the watershed, the drainage system is
adequate. The watershed forms part of Ghagra basin.

-------------------------------------------------------------------------------IWMP-IInd MAU (UP):DoLR
23
3. BASELINE SURVEY
3.1. Socio Economic Condition 3.1.1 Demographic pattern The total population of six micro watershed are 34064 and 9460 house holds is with average family size is 3.60 person s.
Table no. 11: Demographic pattern detail
S. No. Name of Micro Watershed
Name of Villages Total No of House Hold
Population Population of SC/ST Male Female Total Male Female Total
1 Karisath 2B2A4c1e
Rajpura, Bhikharipura, Tajpur, Deraghat, Mishrauli Bhauropur, Tighara, Bibipur, Sarai Sadi, Sarhasa Zamin Sarhasa, Kalatanpur, Kapoorpoor, Karishath, Muzadand, Fatehpur, Naukhar, Masina,
3643 13121 13241 26362 1323 1366 2689
2 Vijpura 2B2A4c2c
Bijpura, Fatehpur, Kuchahara, Bikarampur, Bhatauli Baishya, Bhairopur, Kanheli, Paharpur, Chandpur, Faridpur, Devakol
1339 4614 4675 9289 348 371 719
3 Rewaridih 2B2A4c1g
Reuridih, Nadwapatti, Chakmir, Dadachawar, Khawajapur
460 1677 1759 3436 253 253 506
4 Maidapur Samastipur 2B2A4c2b
Pakarikhurd, Ojipur, Harbanshpur, Chak Kanheli, Gauri, Kaithauli Zamin Kaithauli, Baraipar Dwarika, Makhdumpur Malik, Maidapur, Samastpur, Rasulpur Taluka Kasim Khan, Sarai Kakulat, Milzumala Mubarakpur Asan
797 2857 2939 5796 741 722 1463
5 Jamalpur Mirzapur 2B2A4c1c
Zamalpur Mirzapur, Chak Payag, Chak Bishwanath, Chak Chakarpan, Mustafabad, Ariyaso, Tilai Buzurg, Lakhipur, Tilai Khurd, Khanpur Khurd, Chaupur, Hasapur Kirkitpur, Ghughwl Rampur
1364 5224 4889 5224 1601 1562 3163
6 Hazipur 2B2A4c1b
Hazipur, Sinhpur, Khunsekhpur, Takiya Shahbatala, Manikpur Zamin Hazipur, Kol Motalika Kalyanpur, Baniyapar Chak Muztaba Chak Saiyad Asaraf, Mizumala Abarana, Padamidand, Bishunpur Pyarepur Slamuddin Pur, Ladpur, Kalayanpur
1857 6596 6561 13157 1320 1343 2663
Total 9460 34089 34064 63264 5586 5617 11203 Source: District statistic magazine

-------------------------------------------------------------------------------IWMP-IInd MAU (UP):DoLR
24
3.1.2. Literacy rate Table no. 12: Literacy rate detail
S. No. Name of Micro Watershed
Name of Villages Total population % of Literacy Male Female Average
1 Karisath
2B2A4c1e
Rajpura, Bhikharipura, Tajpur, Deraghat, Mishrauli
Bhauropur, Tighara, Bibipur, Sarai Sadi, Sarhasa Zamin
Sarhasa, Kalatanpur, Kapoorpoor, Karishath, Muzadand,
Fatehpur, Naukhar, Masina,
26362 65 41 53
2 Vijpura
2B2A4c2c
Bijpura, Fatehpur, Kuchahara, Bikarampur, Bhatauli
Baishya, Bhairopur, Kanheli, Paharpur, Chandpur, Faridpur,
Devakol
9289 67 49 58
3 Rewaridih
2B2A4c1g
Reuridih, Nadwapatti, Chakmir, Dadachawar, Khawajapur 3436 66 42 54
4 Maidapur
Samastipur
2B2A4c2b
Pakarikhurd, Ojipur, Harbanshpur, Chak Kanheli, Gauri,
Kaithauli Zamin Kaithauli, Baraipar Dwarika, Makhdumpur
Malik, Maidapur, Samastpur, Rasulpur Taluka Kasim Khan,
Sarai Kakulat, Milzumala Mubarakpur Asan
5796 68 46 57
5 Jamalpur
Mirzapur
2B2A4c1c
Zamalpur Mirzapur, Chak Payag, Chak Bishwanath, Chak
Chakarpan, Mustafabad, Ariyaso, Tilai Buzurg, Lakhipur,
Tilai Khurd, Khanpur Khurd, Chaupur, Hasapur Kirkitpur,
Ghughwl Rampur
5224 47 58
6 Hazipur
2B2A4c1b
Hazipur, Sinhpur, Khunsekhpur, Takiya Shahbatala,
Manikpur Zamin Hazipur, Kol Motalika Kalyanpur,
Baniyapar Chak Muztaba Chak Saiyad Asaraf, Mizumala
Abarana, Padamidand, Bishunpur Pyarepur Slamuddin Pur,
Ladpur, Kalayanpur
13157 48 59
Total 63264 66.71 56.01 55.28

-------------------------------------------------------------------------------IWMP-IInd MAU (UP):DoLR
25
3.1.3. Migration pattern Table no. 13: Migration detail S.
No.
Name of Micro
Watershed
No. of
Villages
Total
population
Migration Migration by Month Main
reason for
migration
Income
during
migration
Total Male Female <3Month 3-6 Month >6
month
1 Karisath
2B2A4c1e
17 26362 18000 16125 1121 15318 1256 22 Employment Rs 3500/ month
2 Vijpura
2B2A4c2c
11 9289 9000 8275 725 7025 975 14 Employment Rs 4500/ month
3 Rewaridih
2B2A4c1g
5 3436 3000 2522 426 2436 563 13 Employment Rs 3500/ month
4 Maidapur
Samastipur
2B2A4c2b
13 5796 5426 3652 1254 4562 975 15 Employment Rs4000/ month
5 Jamalpur
Mirzapur
2B2A4c1c
15 5224 5001 4561 875 4189 785 12 Employment Rs 4500/ month
6 Hazipur
2B2A4c1b
14 13157 13000 12475 985 10254 978 16 Employment Rs 4500/ month
Source: District statistic magazine and Secondary data

-------------------------------------------------------------------------------IWMP-IInd MAU (UP):DoLR
26
3.14 Infrastructure social features Table no.14: Details of infrastructure in the project area
S.No. Parameters Status (I) No. of Villages connected to the main road by an all-weather road 72 (ii) No. of villages provided with electricity 72 (iii) No. of households without access to drinking water 9460 (iv) No. of educational institutions:
Primary (p)/Secondary(S)/ Higher secondary(HS)/ vocational Institution (VI)
(P)
42
(S)
12
(HS) 6
(VI) -
(v) No. of villages with access to primary Health Center 4 (vi) No. of villages with access to Veterinary Dispensary 10 (vii) No. of villages with access to Post office 14 (viii) No. of villages with access to Banks 4 (ix) No. of villages with access to Markets/mandis 11 (x) No. of villages with access to Agro-industries - (xi) Total quantity of surplus milk 2642 liter (xii) No. of milk collection centers (e.g. Union(U)/Society(S)/ Private agency
(PA)/ others (O) (U) No
(S) No
(PA) 32
(O)
(xiii) No. of villages with access to anganwadi Center 48 (xiv) Any other facilities with no. of villages (please specify) -
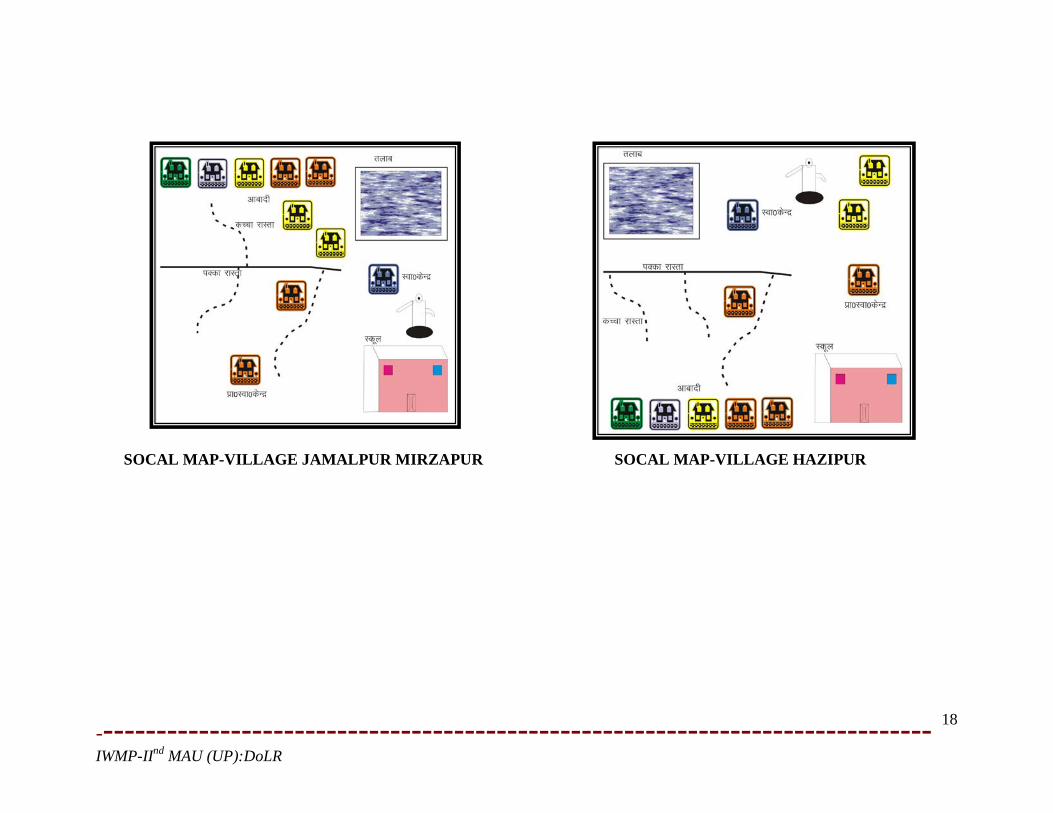
The IWMP-II -watersheds has moderate communication facilities and all 64 villages are approachable through motorable road.
Literacy rate in the watershed is very low because all villages are having education upto junior high school. All the villages are electrified and have TV & telephonic connection. Nearest small market is at Thekma and Lalganj 10, 15 km and nearest big market Mau is about 35 km from the watershed. Religious and ritual features are almost common as in other part of the U.P. Small land holding (average less than 2 ha) with large family size (average 7 person) and more than 45% of the labour force of the total population living below poverty line indicate poor socio economic status of the watershed community. However, strong community spirit among the villager’s show positive indication for the success of any programmed to be implemented in participatory mode. Traditionally the entire village community participates in the individual works. Various village features is shown in fig

-------------------------------------------------------------------------------IWMP-IInd MAU (UP):DoLR
27
SOCAL MAP-VILLAGE KARISATH SOCAL MAP-VILLAGE VIJPURA
SOCAL MAP-VILLAGE REWARIDIH SOCAL MAP-VILLAGE MAIDAPUR SAMASTIPUR
-------------------------------------------------------------------------------IWMP-IInd MAU (UP):DoLR
18
SOCAL MAP-VILLAGE JAMALPUR MIRZAPUR SOCAL MAP-VILLAGE HAZIPUR

-------------------------------------------------------------------------------IWMP-IInd MAU (UP):DoLR
19
3.15 Venn diagram
In the Venn diagram , farmers perceptions was recorded for importance and role of different development institution is relation
to infrastructure development in the villages, importance has been depicted with size of circle and role with distance from the village
circle. The Venn diagram of the IWMP-II -watershed villages are being attach here with
VENN DIGRAM OF VILAAGE KARISATH VENN DIGRAM OF VILAAGE VIJPURA
Electricity
Drinking water
Pr. School 2.5 km
Junior High School 2.3km
PHC 2.5km
Post office 1.5km
Block 3km
KARISATH
Electricity
Drinking water
Pr. School 1.9 km
Junior High
School 1 km
PHC 2km
Post office 2.5km
Block 4km
VIJPURA

-------------------------------------------------------------------------------IWMP-IInd MAU (UP):DoLR
20
VENN DIGRAM OF VILAAGE REWARIDIH VENN DIGRAM OF VILAAGE MAIDAPUR SAMASTIPUR
VENN DIGRAM OF VILAAGE JAMALPUR MIRZAPUR VENN DIGRAM OF VILAAGE HAZIPUR
Electricity
Drinking water
Pr. School 2.5 km
Junior High School 1 5 km
PHC 15km
Post office 2.5km
7lock 4km
JAMALPUR MIRZAPUR
Electricity
Drinking water
Pr. School 1.5 km
Junior High
PHC 2km
Post office
Block 4.5km
REWARIDIH
Electricity
Drinking water
Pr. School 1.5 km
Junior High School
PHC 3km
Post office 1.5km
Block 4km
MAIDAPUR SAMSATIPU
R
Electricity
Drinking water
Pr. School 2 km
Junior High School 1 5 km
PHC 2.5km
Post office 2.5km
7lock 4km
HAZIPUR

-------------------------------------------------------------------------------IWMP-IInd MAU (UP):DoLR
21
3.1.6. Historical timeline
An historical timeline is the chronological record of important events in the history of the village which is useful in understanding its background in the context of five watersheds of Mau district. Historical timeline depicting important events in respect of different villages of the IWMP-II -watershed was prepared through PRA. Historical timeline for important villages are given in table .
Village- KARISATH-2B2A4c1e Village-VIJPURA-2B2a4c2a Year Activities Year Activities
1701 Established 1710 Established 1965 Construction Bandhi (water harvesting structure) 1964 Construction Bandhi (water harvesting structure) 1967 Opening up Primary School 1985 Opening up Primary School 1977 Introduction of Tractor 1980 Introduction of Tractor 1979 Establishment of Gobar gas plant 1978 Establishment of Gobar gas plant 1981 Kacha road 1985 Kacha road 1985 Introduction of thresher 1987 Introduction of thresher 1986 First Tube well 1988 First Tube well 1990 First motorcycle 1995 First motorcycle 1993 TV and DVD player 1997 TV and DVD player 2002 Electricity in the village 2005 Electricity in the village 2003 Bituminous road 2007 Bituminous road 2005 Temple renovation 2009 Temple renovation 2009-10 Planning for watershed project 2009-10 Planning for watershed project
Village- REWARIDIH- 2B2A4c1g Village-MAIDAPUR SAMASTIPUR-2B2A4c2b Year Activities Year Activities
1702 Established 1707 Established 1960 Construction Bandhi (water harvesting structure) 1965 Construction Bandhi (water harvesting structure) 1985 Opening up Primary School 1986 Opening up Primary School 1980 Introduction of Tractor 1985 Introduction of Tractor 1978 Establishment of Gobar gas plant 1982 Establishment of Gobar gas plant 1983 Kacha road 1984 Kacha road 1985 Introduction of thresher 1986 Introduction of thresher 1987 First Tube well 1988 First Tube well 1991 First motorcycle 1992 First motorcycle 1995 TV and DVD player 1996 TV and DVD player 2003 Electricity in the village 2000 Electricity in the village 2005 Bituminous road 2003 Bituminous road 2007 Temple renovation 2007 Planning for watershed project 2009-10 Planning for watershed project 2009-10 Established

-------------------------------------------------------------------------------IWMP-IInd MAU (UP):DoLR
22
Village- JAMALPUR MIRZAPUR-2B2A4c1c Village-HAZIPUR-2B2A4c1b
Year Activities Year Activities
1810 Established 1712 Established
1964 Construction Bandhi (water harvesting structure) 1963 Construction Bandhi (water harvesting structure)
1984 Opening up Primary School 1987 Opening up Primary School
1983 Introduction of Tractor 1980 Introduction of Tractor
1989 Establishment of Gobar gas plant 1978 Establishment of Gobar gas plant
1982 Kacha road 1983 Kacha road
1986 Introduction of thresher 1987 Introduction of thresher
1989 First Tube well 1989 First Tube well
1993 First motorcycle 1992 First motorcycle
1999 TV and DVD player 1997 TV and DVD player
2002 Electricity in the village 2002 Electricity in the village
2006 Bituminous road 2003 Bituminous road
2009-10 Planning for watershed project 2007 Temple renovation
1810 Established 2009-10 Planning for watershed project
Source : Secondary data

-------------------------------------------------------------------------------IWMP-IInd MAU (UP):DoLR
23
3.2. SOIL AND LAND USE 3.2.1 Soil morphology
The IWMP-II-, Mau watershed is located south-west corner of the Mau district. The entire watershed is
topographically divided into two major land forms. Accordingly, the soils of watershed have been grouped in two major
categories.
(i) Plain land
(ii) Sloppy land
(iii)
Soil profile-A representative soil profile (Dominant soil-Table 8)
1-1.5 m (heavy texture soil-black in colour)
5-6m (Locally called Pathrili soil- clay mixed with CaCo3)
Parent material/Regolith/bed rock (sand stone)

-------------------------------------------------------------------------------IWMP-IInd MAU (UP):DoLR
24
3.2.2 Morphology of a typical soil profile of micro watershed (dominant soil)
Table no. 15: Morphology of a typical soil profile of micro watershed (dominant soil)
Horizon Depth (cm) Morphology
A 0-150 Black in colour, clay content 28%, with free CaCO3, sticky when moist, hard when dry, high
elasticity, fissures and cracks, occasional occurrence of tree calcium carbonate granules pH 8.3-
8.7.
B 150-600 Whitish-yellow in colour, high effervescence with dilute HCl, very fine mixed with tree CaCO3
and granules, very hard when dry, compact & indurate land pan, restricting development of root
and downward water transmission (locally called as pathrili soil)
C >600 Red & While sand stone, Regolith (Parent material)
3.2.3. Soil characteristics and fertility status Table no. 15.1: Soil characteristics and Fertility Status up to 6”
Soil properties LCC II LCC IV LCC VII/VIII Sand (%) 45.5 74.30 74.14 Silt (%) 25.03 19.40 19.20 Clay (%) 29.5 6.52 6.53 Texture Sandy Clay loam Loamy sand Loamy sand pH (1 : 2) 8.01 8.52 6.96 EC (DSm−1) 0.47 0.11 0.15 Organic carbon (%) 0.36 0.13 0.18 Available N (Kgha−1) 322 175 222 Available P (Kgha−1) 28 16 6-7 Available K (Kgha−1) 180 318 232 Values correspond to soil fraction

-------------------------------------------------------------------------------IWMP-IInd MAU (UP):DoLR
25
3.2.4. Land Capability Classification (LCC) Land capability classification was done to classify the soils in different groups based upon the capabilities & limitation and to emphasize the hazards prevailing in the watershed under different kinds of soils. Initially reconnaissance survey was carried out for entire watershed in order to find out the different topo-sequences, land forms, soil depth and erosion hazards. This was followed by the detailed investigation of selected land forms to bring out the LCC classes of the IWMP-II-, Mau watershed. Three classes of land capabilities namely II, IV & VII were demarcated in the watershed. The areas under different classes are shown in table 16. Table no. 16: Area under different land capability class under micro watersheds.
Land capability class Area (ha)
II 4375.00
IV 1531.00
VII 1135.00
VIII 274.00
Total 7315.00
3.2.4.1. Land capability class I (White)
This group is one of the most extensive LCC class of the IWMP-II-, Mau watershed. This group of soil is occupying
around 4375.00 ha of the watershed area. The soil are clay loam or silly clay loan in texture. The land under this class is nearly level to
wild sloping (1-3%). The soils are deep and erosion hazard in slight. Most of the production agriculture land comes under class II. A
considerable area of watershed is seasonally water logged comes under this LCC class, primarily found near the earthen check. These
areas are subject to water logging in most part of the year. The lands are almost flat, silty clay or clay loam, in texture,
deep and very mild slopping. These lands have no major limitations other than occasional water logging. During rabi seasons, the
water is drained out and cultivation is carried out. These lands potentially very productive but due to water logging during the rainy
season, it could not be brought out under cultivation during the kharif season. The mapping unit for this class is given as under-
Land capability class IV = Scl-d5/B-e1

-------------------------------------------------------------------------------IWMP-IInd MAU (UP):DoLR
26
3.2.4.2 Land capability class II (whitish yellow)
A considerable area of watershed i.e. 1531 ha is under class IV. This class is found in lower portion i.e. near the outlet
of watershed. The soils are coarser in texture (loamy sand/sand), deep, susceptible to erosion hazard and undertaking in topography.
Limiting factors in this class and steep slopes, severe past erosion, severe credibility, shallow soils, lower water holding capacity,
severe alkalinity and salinity with poor drainage are common features. Rill & initiation of gully can be seen near the outlet of the
watershed. In some part of calcarious soils particularly near the foot hill, where soils are coarser in texture and shallow in depth, is
also coming under this class. The mapping unit for their class is as follows.
Land capability class IVe = 1s-d5/C-e3, IVes=1s-d3/D-e3 (calcarious soils)
3.2.4.4. Land capability class III/IV (Greysh yellow)
These lands are occupying an area of 1135 ha of the watershed. This class of land is mostly found in pathrili area of
watershed. The soils are very shallow underlying hard rock, steep slope (>22%) and coarser in texture. Mostly brown soils are found
under this class. Class VII and VIII one intermixed in top of the foot trill of watershed. Mostly class VIII (274 ha) lands are located on
moderately trill topes (Bhita), where soil depth is almost negligible. Soils with admixture of gravels/rock fragments one found in these
classes of lands. The mapping unit for this class of land is as follows.
Land capability class VIIe=gls-d1/H/I-e4
3.2.4.5. Mapping units symbol
Soils depth (cm) d5 - > 90 cm; d3-22.5-45.0; d1, < 7.5 cm. Texture cl-clay loan; IS-loamy sand; gls-gravelly loamy
sand, slop %) B-1-3; C-3-5; D-5-10%, H-25-33; I-33-50
Erosion e1-25% of A horizon lost; e2 = 50-75% of a horizon lost; e4=50-75% B horizon lost.

-------------------------------------------------------------------------------IWMP-IInd MAU (UP):DoLR
27
3.2.4.6 Detail of soil Erosion in the Project Area Table no. 16 a
1 2 3 4 5 Cause Type Of erosion Area affected (h) Run Off (mm/year) Average soil loss
(Tonnes/ha/year) Water erosion IWMP-II
a Sheet 4000 725 MM 16.55 b Rill 1500 c Gully 75
Sub-Total 5575 725MM Wind erosion NA Total 6372 475MM 16.05
CONCLUSION
The land capability classification of IWMP-II, Mau Watershed provides reasonable good information with regard to capability of soil. That could be used for agriculture, agri-horticulture, silviculture & pasture development. The majority of land from is coming under class II, which give an insight of good agriculture production potential of this watershed. The productivity of these land could be further enhanced by adoption of simple soil & water conservation measures like mild leveling, bunding, diversion drain and in site moisture conservation practices. The reasonable area is under class VII indicating greater potential of this watershed for forestry and pasture development. The major physical limitation in case of agriculture soils are the sub soil hardness, low limitations in case of agriculture soils are the sub soilds hardness, low water in filterability and slope. In case of area under calcarious soils, pronounced limitations of soils depth was noticed following by severe erosion hazard and coarse soil texture. A small portion watershed is under seasonally water logged. The soils under waterlogged are could be used for some other beneficial farming activities during the kharif and season also.

-------------------------------------------------------------------------------IWMP-IInd MAU (UP):DoLR
28
3.3. Land Use Pattern 3.3.1 Land holding Majority of the farmers are in the category of marginal (< 1 ha) and small (1-2 ha) with average land holding of about 2.2 ha.
These small land holding are further scattered at different places, which makes cultivation very difficult. Distribution of farm families
according to the size of the land holdings are given in the table.
Table no. 17: Distribution of farm families according to their size of landings. S.N. Name of Micro
Watershed Name of Villages Land holding
Marginal (<1 ha)
Small (1-2 ha)
Large (>2 ha)
Total
1 Karisath 2B2A4c1e
Rajpura, Bhikharipura, Tajpur, Deraghat, Mishrauli Bhauropur, Tighara, Bibipur, Sarai Sadi, Sarhasa Zamin Sarhasa, Kalatanpur, Kapoorpoor, Karishath, Muzadand, Fatehpur, Naukhar, Masina,
498 395 147 1040
2 Vijpura 2B2A4c2c
Bijpura, Fatehpur, Kuchahara, Bikarampur, Bhatauli Baishya, Bhairopur, Kanheli, Paharpur, Chandpur, Faridpur, Devakol
369 296 137 802
3 Rewaridih 2B2A4c1g
Reuridih, Nadwapatti, Chakmir, Dadachawar, Khawajapur 429 358 235 1022
4 Maidapur Samastipur 2B2A4c2b
Pakarikhurd, Ojipur, Harbanshpur, Chak Kanheli, Gauri, Kaithauli Zamin Kaithauli, Baraipar Dwarika, Makhdumpur Malik, Maidapur, Samastpur, Rasulpur Taluka Kasim Khan, Sarai Kakulat, Milzumala Mubarakpur Asan
551 429 245 1225
5 Jamalpur Mirzapur 2B2A4c1c
Zamalpur Mirzapur, Chak Payag, Chak Bishwanath, Chak Chakarpan, Mustafabad, Ariyaso, Tilai Buzurg, Lakhipur, Tilai Khurd, Khanpur Khurd, Chaupur, Hasapur Kirkitpur, Ghughwl Rampur
1340 1043 437 2820
6 Hazipur 2B2A4c1b
Hazipur, Sinhpur, Khunsekhpur, Takiya Shahbatala, Manikpur Zamin Hazipur, Kol Motalika Kalyanpur, Baniyapar Chak Muztaba Chak Saiyad Asaraf, Mizumala Abarana, Padamidand, Bishunpur Pyarepur Slamuddin Pur, Ladpur, Kalayanpur
493 390 265 1148
Total 3680 2911 1466 8057 Source: District statistic magazine and Secondary data

-------------------------------------------------------------------------------IWMP-IInd MAU (UP):DoLR
29
3.3.2. Land Use The IWMP-II -watersheds has diversified land uses namely agriculture, waste land (open scrub), seasonal water bodies etc.
The varied present land use and area under different categories in watershed is shown in Table 18. The mixed land use followed in the watershed
is almost similar in other parts of the U.P. During PRA exercise, the villagers prepared land use. One such map of village of IWMP-II -watershed
is shown in table
Table no 18: Land use pattern
Area in hectare S.N. Name of
Project No of Micro Watershed
Geographical area
Forest Area
Agriculture land
Rain fed Area
Pasture land
Wastelands Treatable Area Cultivated Uncultivable
1 IWMP-II 6 7575.00 1.50 7315.00 5790.00 2.50 2150 256.00 5575.00
3.3.2.1 Agriculture
Various agricultural land use in the watershed are extended to diversified land capabilities starting from marginal to good class-II land. The watershed distinctly has three types of land i.e. leveled, sloping & degraded and undulating. The agriculture is practiced on all these soil types through the productivity considerably vary. The total area under agriculture in the watershed is about 7315.00 ha out of which 1556.00 ha is irrigated while 5790.00 ha is under rainfed agriculture. The water (both irrigated and drinking) is most scarce natural resource in the watershed. The operation of tube wells for irrigation of agricultural crops frequently leads to the drinking water problem to the formers of watershed & occasionally forcing them to carry drinking water from another side of the watershed area. The agricultural field bund are common in the watershed, however, they have poor thickness & usually water flow feely from top of bunds as well as frequently breach on heavy rains adversely affecting the in site percolator of rain water in the soils.
The agriculture soils are in the watershed have diversified texture i.e. clay loam, sandy clay loam and Kankar mixed textures which are located in patches throughout the watershed. The heavy soils and almost used by paddy crop during rainy season. The sodic soils also have hard calcium pan at variable depths. The irrigation water is conveyed either by earthen channels or plastic pipes and surface irrigation methods following mainly border method or flood method of irrigation by the farmers in the watershed. These factors substantially reduce the water use efficiency of limited available & valuable irrigation water in the watershed. The quality of irrigation water needs to be tested for assessing fitness of the quality for irrigation & other purposes. Rehabilitation of waste lands with appropriate drought hardy species like Karanj (Pongamia glabra), introduction of suitable malti-purpose trees, promoting agro-forestry on agricultural lands with appropriate fruits & forest species, suitable vegetative barriers on sloping lands can of high future value in meeting out not only fire wood & fodder demands in the watershed but also for soil & water conservation, eco-friendly environment, rehabilitation of watershed and substantial income generation for socio-economic upliftment of resource poor farmers in the watershed.

-------------------------------------------------------------------------------IWMP-IInd MAU (UP):DoLR
30
One year rotation
Single cropping : Fallow-mustard/wheat/gram/pea/lentil/winter vegetables (In watershed area rabi crops are mostly raised on fallow fields of rabi season while kharif crops are grown on fallow of zaid season).
Double cropping : Bajra/Jowar/sesame/black gram/green gram-mustard/wheat/gram/lentil/winter vegetables. growing of two or more than two crops simultaneously in the same field at the same time with an objective to mitigate the risk factors as well as enhancement in the productivity & profitability in the per unit area e.g. wheat mustard, lentil+ line seed, Sugarce + mustard Gram + Line seed , Maize + Arhar etc.
Irrigated Agriculture
One Year Rotation : Growing of number of crops in such a way that must complete their life cycle within agricultural year in a strict rotation without deteorating soil fertility is called one year crop rotation. Examples Rice-wheat, Rice- mustard, maiz-potato, maize-gram/pea/lentil, rice-barley-zaid maize, maize-potato-urd/mung etc. 3.3.2.2. Crop Productivity
Table no. 19 Production and productivities of important commodities in IWMP-II, MAU
Sl. Name of
Crop
2005 2006 2007 2008 2009
A
(Ha.)
P
(Tons)
Y
(Qt
./Ha)
A
(Ha.)
P
(Tons)
Y
(Qt
Ha)
A
(Ha.)
P
(Tons)
Y
(Qt
Ha)
A
(Ha.)
P
(Tons)
Y
(Qt.
/Ha)
A
(Ha.)
P
(Tons)
Y
(Qt.
/Ha)
1 Paddy 5462 164187.72 30.06 5462 169322.00 31 5462 180246.00 33 5462 191170.00 35 5462 196632.00 36
2. Wheat 6125 177625.00 29 6125 183750.00 30 6125 196000.00 32 6125 183750.00 30 6125 202125.00 33
3. Mustard 200 1600.00 8 200 1900.00 9.5 200 1800.00 9 200 1600.00 8 200 1800.00 9
4. Lentil 98 784.00 8 98 931.00 9.5 98 784.00 8 98 735.00 7.5 98 833.00 8.5
5. Pea 50 250.00 5 50 400.00 8 50 425.00 8.5 50 450.00 9 50 450.00 9
6. Potato 80 11360.00 142 80 11840.00 148 80 12400.00 155 80 12960.00 162 80 11840.00 148
8. Banana 5 885.00 177 5 885.00 177 5 910.00 182 5 950.00 190 5 1025.00 205
Source: District statistic magazine and Secondary data

-------------------------------------------------------------------------------IWMP-IInd MAU (UP):DoLR
31
Crop productivity : The agricultural productivity is primarily driven by the amount and distribution of rain water specifically during two cropping seasons i.e. rabi & kharif. Productivity of kharif crops is also affected by the late onset or early withdrawal of monsoon as well as intermittent droughts of variable duration & intensity. The farmers also do not have suitable cropping systems to deal aberrant weather, weeds impose considerable constraint in productivity of both kharif and rabi crops under irrigated as well as rainfed production system. Farmers undertake normally one manual weeding in paddy & other valuable crops, however, practice is energy and time consuming. Use of we divided is rare in the watershed. The mixed cropping is in practice in limited area with kharif crops like Arher, maize, mung, urd, bajra & jowar but it is not only irrational but also unscientific and be set with low productivity. Subsequent rabi crops in general and mustard, gram pea, barley crops, in particular are raised on residual soil moisture under rainfed production system during post monsoon season. Imbalanced use of fertilizers is common is not only rabi & kharif crops but also in rainfed and irrigated production system. The recommended deep ploughing for enhanced in sites residual soil moisture conservation and higher production is also not followed in the watershed. The shallow ploughing through tractor drawn till age implements are available with the farmers in the watershed but deep ploughing implements are available with the farmers in the watershed but deep ploughing implements yet need to be introduced. The soil fertility/health restoration practices like green manuring, crop rotations and intercropping specifically with legumes, use of FYM/compost, vermi-compost, bio fertilizers, soils & water conservation measures use of brought up or in sites mulches are widely lacking in the watershed. The soil and water conservation measures are limited to mechanical/earthen measures created by the state Govt. agencies. Conservation agronomical measures like seeding and ploughing across the slope, weed mulching, agro-forestry, vegetative barriers etc also completely lack in watershed. 3.3.2.3. Indigenous technological knowledge (ITK) The agriculture is an old traditional practice of farmers in the watershed who have improved themselves with passage of the time according to their domestic need and technological reforms in the nearby areas. The villagers have their traditional village ponds, practice of field bunding which typically constitute agriculture related ITKs in the watershed. The mustard being a cash/fire wood crop of the watershed is being cultivated in self designed manner by the farmers. However, limited fertilizer application specifically the DAP came in to practice since about 20 years. 3.4 Horticulture The subtropical fruits and vegetables have very good potential in the watershed. The fruit trees has limited in number like mango, guava, papaya, lemon, lime, ber, aonal, bael as vegetables like cucurbits, okra, radish, tomato,cauliflower cabbage, garlic, onion, brinjal, chilly, but they are found surviving well in the watershed villages. Organized orchards, commercial vegetable cultivation, horti-agri and other systems of agro-forestry etc are lacking but have good potential in the water shed. 3.5 Live Stock Population
Total livestock population of the IWMP-II -watersheds is 12108 bufallow is preferred as milch animal compared to cow, but milk yield is very low. Goats are also kept for milk as well as for meat purpose. The detail of live stock population is given in table below

-------------------------------------------------------------------------------IWMP-IInd MAU (UP):DoLR
32
Table no. 20: Live stock population
S. N.
Name of Micro
Watershed
Name of Villages Cows Buffaloes Sheep Goat Cock Pig Fish Total
1 Karisath 2B2A4c1e
Rajpura, Bhikharipura, Tajpur, Deraghat, Mishrauli Bhauropur, Tighara, Bibipur, Sarai Sadi, Sarhasa Zamin Sarhasa, Kalatanpur, Kapoorpoor, Karishath, Muzadand, Fatehpur, Naukhar, Masina,
1687 2698 260 4655 3290 512 Yes 13102
2 Vijpura 2B2A4c2c
Bijpura, Fatehpur, Kuchahara, Bikarampur, Bhatauli Baishya, Bhairopur, Kanheli, Paharpur, Chandpur, Faridpur, Devakol
1895 2450 370 3480 2035 300 Yes 10530
3 Rewaridih 2B2A4c1g
Reuridih, Nadwapatti, Chakmir, Dadachawar, Khawajapur
1130 1550 650 2060 950 100 Yes 6440
4 Maidapur Samastipur 2B2A4c2b
Pakarikhurd, Ojipur, Harbanshpur, Chak Kanheli, Gauri, Kaithauli Zamin Kaithauli, Baraipar Dwarika, Makhdumpur Malik, Maidapur, Samastpur, Rasulpur Taluka Kasim Khan, Sarai Kakulat, Milzumala Mubarakpur Asan
2575 3110 220 3535 1915 370 Yes 11725
5 Jamalpur Mirzapur 2B2A4c1c
Zamalpur Mirzapur, Chak Payag, Chak Bishwanath, Chak Chakarpan, Mustafabad, Ariyaso, Tilai Buzurg, Lakhipur, Tilai Khurd, Khanpur Khurd, Chaupur, Hasapur Kirkitpur, Ghughwl Rampur
630 775 80 740 230 30 Yes 2485
6 Hazipur 2B2A4c1b
Hazipur, Sinhpur, Khunsekhpur, Takiya Shahbatala, Manikpur Zamin Hazipur, Kol Motalika Kalyanpur, Baniyapar Chak Muztaba Chak Saiyad Asaraf, Mizumala Abarana, Padamidand, Bishunpur Pyarepur Slamuddin Pur, Ladpur, Kalayanpur
650 340 79 2365 2563 60 Yes 6057
Total 10157 12108 1846 24623 14395 1692 64821 Source: District statistic magazine and Secondary data

-------------------------------------------------------------------------------IWMP-IInd MAU (UP):DoLR
33
3.6 Fisheries
Commercial fish farming was not done by the farmers of in IWMP-II , but there is a big scope for fish farming in these area. Aware farmers gated 25.00q/ha production, it was very low. 3.7. Forest and other Vegetation
3.7.1. Forests
The watershed has no forest area only some wild trees are found in scattered manner.
3.7.2. Horticulture/ Agro-forestry
No horticulture and Agro forestry practices were observed in the watershed.
3.7.3. Agro-forestry
The agro-forestry practices are highly lacking in the watershed though it has good potential under existing dispositions and may play a vital role particularly with respect to minimization of cropping risk, build up soil fertility and productivity, soil conservation, partly meeting out the fire wood demand of rural community and moreover, optimizing the economical return from system as a whole under typical semi arid climate in the watershed. The other agro-forestry systems like agri-silvi, silvi-pastoral, bund and boundary plantations also have good potential to cater the fire wood and fodder demands of the rural community in the watershed. The existing area under agro-forestry is almost negligible. Prosopis juliflora may be planted as block or sole plantation specifically on marginal and degraded lands in the watershed. The agro-forestry interventions comprising of ber, bail, aonla, guava, popular etc may be applied to benefit of the farmers under rain-fed to irrigated production systems on leveled to sloping and marginal agricultural using proper planting techniques and termite control measures. The multipurpose trees may also help in supplementing fire wood and fodder demands of the rural community in the watershed and may be planted as hedge rows on rain-fed, marginal and degraded lands. Conclusions The land capability classification of IWMP-II -watershed provides reasonable good information with regard to capability of soil, that could be used for agriculture, agri-horticulture, silviculture and pasture development. The majority of land form is coming under class II, which give an insight of good agriculture production potential of this watershed. The productivity of these lands could be further enhanced by adoption of simple soil & water conservation measures like mild leveling, bunding, diversion drain and in-situ moisture conservation practices. The reasonable area is under class III indicating greater potential of this watershed for forestry and pasture development. The major physical limitations in case of agriculture soils are the sub soil hardness, low water infiltrability and slope. In case of area under topes of watershed, the most pronounced limitation of soil depth was noticed followed by severe erosion hazard and coarse soil texture. A small portion of watershed is under seasonally waterlogged. The soils under waterlogged area could be used for some other beneficial farming activities during the kharif season also.
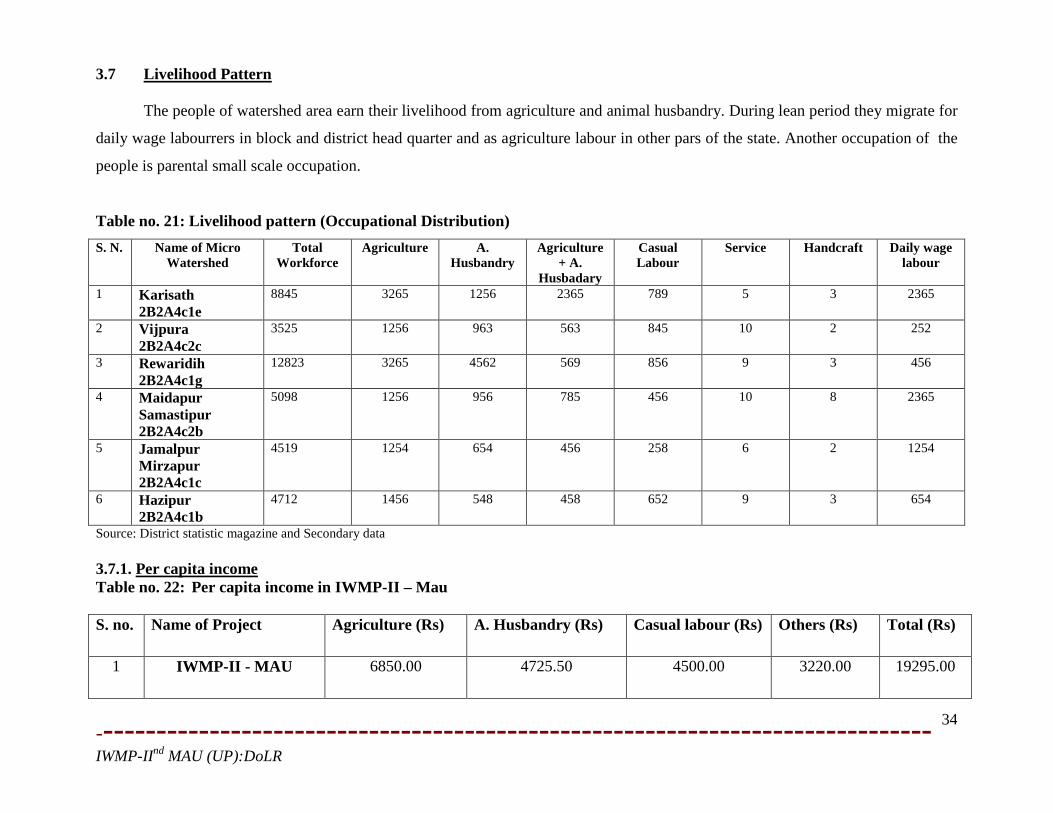
-------------------------------------------------------------------------------IWMP-IInd MAU (UP):DoLR
34
3.7 Livelihood Pattern
The people of watershed area earn their livelihood from agriculture and animal husbandry. During lean period they migrate for
daily wage labourrers in block and district head quarter and as agriculture labour in other pars of the state. Another occupation of the
people is parental small scale occupation.
Table no. 21: Livelihood pattern (Occupational Distribution) S. N. Name of Micro
Watershed Total
Workforce Agriculture A.
Husbandry Agriculture
+ A. Husbadary
Casual Labour
Service Handcraft Daily wage labour
1 Karisath 2B2A4c1e
8845 3265 1256 2365 789 5 3 2365
2 Vijpura 2B2A4c2c
3525 1256 963 563 845 10 2 252
3 Rewaridih 2B2A4c1g
12823 3265 4562 569 856 9 3 456
4 Maidapur Samastipur 2B2A4c2b
5098 1256 956 785 456 10 8 2365
5 Jamalpur Mirzapur 2B2A4c1c
4519 1254 654 456 258 6 2 1254
6 Hazipur 2B2A4c1b
4712 1456 548 458 652 9 3 654
Source: District statistic magazine and Secondary data 3.7.1. Per capita income Table no. 22: Per capita income in IWMP-II – Mau S. no. Name of Project Agriculture (Rs) A. Husbandry (Rs) Casual labour (Rs) Others (Rs) Total (Rs)
1 IWMP-II - MAU 6850.00 4725.50 4500.00 3220.00 19295.00

-------------------------------------------------------------------------------IWMP-IInd MAU (UP):DoLR
35
3.8 Hydrology and water resource
3.8.1. Table no 23: Hydrology status
S.No. Name of Project Item Unit of measurement Status
1 IWMP-II - MAU Status of water table Meters 6-7
2 Ground water structures repaired/ rejuvenated No. -
3 Quality of drinking water Quality Poor
4 Availability of drinking water Days 300
5 Irrigation potential % 4
3.8.2. Water Resource
Table no. 24: Information about water resources and effectiveness use of water S. N. Name of Micro
Watershed
Canal Wells/Borewells Tubewells Ponds Govt.
handpump
Pvt.
handpumps
Others
D N D N D N D N D N D N D N
1 Karisath 2B2A4c1e
- - 325 7 250 5 310 7 235 18 284 42 - -
2 Vijpura 2B2A4c2c
- - 325 7 250 5 310 7 235 18 284 32 - -
3 Rewaridih 2B2A4c1g
- - 320 2 250 2 310 9 235 14 284 10 - -
4 Maidapur Samastipur 2B2A4c2b
- - 325 9 250 3 310 6 235 18 284 82 - -
5 Jamalpur Mirzapur 2B2A4c1c
- - 320 4 250 3 310 5 235 12 260 26 - -
6 Hazipur 2B2A4c1b
- - 330 6 251 4 310 5 235 12 260 23 - -
D= Availability of water in days N= Number Source: District statistic magazine and Secondary data

-------------------------------------------------------------------------------IWMP-IInd MAU (UP):DoLR
36
3.9 PROBLEMS AND NEEDS OF THE AREA
3.9.1 Problem Identification and prioritization
Food sufficiency, economic growth and environmental security ware identified as the major issues to be addressed in the
watershed area. The area has undulating topography, steep unstable slopes, and excessive channel gradient and hence highly prone to
soil erosion. Effective soil depth is limited and spatially highly variable hampering good crop growth (Table 11).
Problems identified and prioritized during the transact walk and PRA exercises in all the villages of this IWMP-II -watershed
were pooled and a list of nine problems representing the whole watershed was prepared. Problems were ranked as per their total
weight age in the three villages. Lack of irrigation water was the greatest problem experienced by the people followed by low
production of filed crops, lack of fodder availability and low animal productivity (Annexure- I).
Strength, weakness, opportunity and threat (SWOT) analysis is a useful decision support tool, A SWOT analysis of the Micro
watersheds is presented in Table 25.
Table no. 25: Problem identification and prioritization for Micro Watersheds
S.No. Problem Rank
1 Low production of field crops 5
2 Lack of drinking water 1
3 Lack of irrigation water 2
4 Lack of fodder availability and low annual productivity 3
5 Non-availability of fuel wood 4
6 Lack of inputs like quality seeds, fertilizer, pesticides etc. 6
7 Lack of market facility 9
8 Lack of medical, educational and transportation facilities 8
9 Medical and health care facilities for mulching animals and low productivity. 7

-------------------------------------------------------------------------------IWMP-IInd MAU (UP):DoLR
37
Table no. 26: SWOT analysis of the Micro Watersheds
Strengths (S) Weakness (W)
i. Cooperative work culture in traditional activities i. Poor water management
ii. Close ethic ties ii. Resource poor farmers
iii. Road at the top as well as outlet of the watershed iii. Out migration of youth
iv. Hard Working iv. Low and erratic rainfall
v. Resource pool of crop genetics diversity v. Fragile geology
vi. Awareness of farmers about watershed management
programme
vi. Fragmented land holing
vii. Well established CPR maintaining and sharing system vii. Heavy infestation of wild animals
viii. Stall feeding of animals viii. Problem of fuel and fodder
ix. Well maintained seasonal water bodies ix. Shallow soil depth and with high percentage of gravel
x. Social outlook of the community towards land less
Opportunities (O) Threats (T)
i. Wide range of annual and perennial crops i. Prone to adverse climate like drought
ii. Scope of regular employment opportunities ii. High market risk
iii. Strengthening of existing irrigation system iii. Social conflicts owing to PRI and WSM polices and local
politics
iv. Conducive climate for rain fed crop diversification iv. Weak coordination among lin departments
v. Good Scope for Agro forestry and dry land horticulture v. Lack of expertise of implementing agency in different
aspects of WSM
vi. Potential for collective action and management
of CPR

-------------------------------------------------------------------------------IWMP-IInd MAU (UP):DoLR
38
4. INSTITUTION BUILDING AND PROJECT MANAGEMENT 4.1 Participatory Rural Appraisal (PRA) The past experience of watershed has given tremendous input to focus on creating accountability of the stakeholders towards
the programme. This has created an emphasis to includes the all stakeholders communities and their local indigenous technological
knowledge while planning for any activity. Participatory approach provides a new path for planning, implementing, monitoring and
post withdrawal activities with a complete accountability of the stakeholders. Various PRA techniques like resource mapping, social
mapping, matrix ranking and season calendar were used to understand the physical and social orientation of the village in general and
watershed specific. These tools put the villagers in ease than the complicated questionnaires. Various tool like matrix ranking, Venn
diagramme were used to identify various local vegetation (apt for afforestation), fodder crops, various institution and their significance
in the life of the farmers.
4.2 Social Mobilization and Community Organization
Table no. 27: Physical outlays oh PIA,U.G., S.H.G., W.D.T. and W.C. S. No.
Name of watershed Code No. U.G. (No.) SHG (No.) WDT (No.) PIA WC (No.)
1 Karisath 2B2A4c1e
2B2A4c1e 20 18 1 1 1
2 Vijpura 2B2A4c2c
2B2A4c2c 22 20 1
3 Rewaridih 2B2A4c1g
2B2A4c1g 10 12 1
4 Maidapur Samastipur 2B2A4c2b
2B2A4c2b 20 25 1
5 Jamalpur Mirzapur 2B2A4c1c
2B2A4c1c 5 5 1
6 Hazipur 2B2A4c1b
2B2A4c1b 10 12 1

-------------------------------------------------------------------------------IWMP-IInd MAU (UP):DoLR
39
4.2.1 Watershed Committee
Watershed committee has been constituted in all five nos of micro-watersheds partially by WDT and Gram Sabha village of micro watershed. These committee are registered under society Registration Act 1860. Capacity building trainings given to the watershed committee by WDT. The watershed committee has a pivotal role to play during and after the project implementation period. Detail of W.C. is given below
Table no. 28: Details of Watershed Committees (WC)
S.No.
Name of WCs Date of Registration as a Society
Name Designation M/F SC ST
SF MF
LF Landless
UG SHG GP Any othe
r
Ed. qualific
ation
Function(s)
assigned #
1 KARISATH 2B2A4c1e
Under Progress
Sri. Kalpnath President M √ √ √ H.S. A,B, E Sri. Umasankar Secretary M √ √ √ Inter C, D, G 10 member Member M/F 2 2 2 2 2 H, I
2 VIJPURA 2B2A4c2a
Sri Ramkuwar President M √ √ √ B.A. A,B, E Sri Devanand Secretary M √ √ √ √ √ Inter. C, D, G 10 member Member M/F 2 4 5 1 1 H, I
3 REWARIDIH 2B2A4c1g
Sri Ramprevesh President M √ Inter A,B, E Sri Omprakash Secretary M √ Inter C, D, G 10 member Member M/F 2 2 2 2 2 H, I
4 MAIDAPUR SAMASTIPUR 2B2A4c2b
Sri Uday Raj President F √ √ Literate A,B, E Sri. Anil Secretary M √ √ Inter C, D, G 10 member Member M/F 2 2 2 2 2 H, I
5 JAMALPUR MIRZAPUR 2B2A4c1c
Smt. Budhiay President F √ H.S. A,B, E Sri. Dependra Secretary M √ B.Sc. C, D, G 10 member Member M/F 2 2 2 2 2 H, I
6 HAZIPUR 2B2A4c1b
Smt .Paramjyoti President F √ H S A,B, E Sri Seshnath Secretary M √ Inter C, D, G 10 member Member M/F 2 2 2 2 2 H, I
# # In column 17, only the letter assigned, as below, needs to be typed, except for ‘J’, where the type may be specifically
mentioned. A PNP and PRA B Planning C Maintenance of Accounts D Signing of cheques and making payments E Supervision of Construction activities F Cost Estimation G Verification & Measurement H Record of labour employed I Social Audit J Any other (please specity).

-------------------------------------------------------------------------------IWMP-IInd MAU (UP):DoLR
40
Watershed Development Team
As per as common guide line direction/ instruction given in para 5.3 point 40 P.I.A. has been constitute watershed
development team as given below
Table no.29 : Details of Watershed Development Teams (WDTs) in the project area
S.
No. Name of the PIA
Name of the Project Names of WDT
members M/F Age
Qualification/
Experience
Description of
professional
training
Role/
Function##
Date of
appointment of
WDT member
1 Bhomi Sanrakshan
Adhikari
Land development
and water resources
Department Mau
(U.P.)
IWMP -IInd Smt Dipendra M 26 B. Sc. Agriculture E
Sri Seshnath M 30 B. Sc. Field Worker H
sri J P Rai M 25 B. Ed. Field Worker J
Sangeeta Rai F 25 B.A. Social Moblizer H
Smt. Reeta M 43 Inter H
Smt. Anita M 35 Inter Field Worker H
Sri. Ramdas M 50 J.E. Agriculture F B
Sri D Tiwari F 24 Inter Social Moblizer A B
Sri Jitendra M 26 Inter C D F
# # In column 8, only the letter, assigned as below, needs to be typed, except for ‘3’, where the type may be specifically mentioned.
A Participatory Net Planning (PNP) and Participatory Rural Approach (PRA), Training and Capacity Building
B Planning C Maintenance of Accounts
D Signing of cheques and making payments E Social audit
F Engineering surveys, drawings and cost estimations G Physical verification & measurement
H Record of labour employed I Livelihood opportunities for landless
J Post project operation, maintenance of assets K Any other (please specify)
4.2.3 Self Help Group
The constitution of Self Help Groups have been constituted by W.C. in all micro watershed for generating income & improved
their social status with the help and financial support through scheme by technical support of P.I.A., detail of 24 SHGs is given below

-------------------------------------------------------------------------------IWMP-IInd MAU (UP):DoLR
41
Table no. 30 SHG detail S.No. Names of
Watershed Total no. of registered SHGs No. of Members No. of SC/ST in
each category No. of BPL in each category
Date of formation of SHGs With
only Men
With only
Women
With Both
Total Categories M F Total M F Total M F Total
1 2 3 4 5 6 7 8 9 10 11 12 13 14 15 16 17 1. KARISATH
2B2A4c1e 10 5 3 18 (i) Landless 20 4 24 12 8 20 16 8 24 UNDER
PROCESS (ii) SF 27 8 35 10 4 14 10 2 12 (iii) MF 13 4 17 4 - 4 - - - (iv) LF 6 2 8 - - - - - -
Total 10 5 3 18 66 18 84 26 12 38 26 10 36 2 VIJPURA
2B2A4c2a 10 7 3 20 (i) Landless 25 42 67 32 26 58 28 19 47
(ii) SF 70 30 100 15 14 29 22 6 28 (iii) MF 20 13 33 7 - 7 - - - (iv) LF 10 - 10 - - - - - -
Total 10 7 3 20 125 85 210 54 40 94 50 25 75 3 REWARIDIH
2B2A4c1g 8 4 - 12 (i) Landless 24 22 44 27 18 45 28 12 40
(ii) SF 69 20 89 18 7 25 17 5 12 (iii) MF 19 8 27 7 - 7 - - - (iv) LF 9 - 9 - - - - - -
Total 8 4 - 12 120 50 170 52 25 77 45 17 62 4 MAIDAPUR
SAMASTIPUR 2B2A4c2b
16 9 - 25 (i) Landless 35 47 82 36 28 64 32 26 58 (ii) SF 108 35 143 19 20 39 19 14 33 (iii) MF 35 13 48 7 - 7 7 - 7 (iv) LF 15 - 15 - - - - - -
Total 16 9 - 25 193 95 288 62 48 110 58 40 98
5 JAMALPUR MIRZAPUR 2B2A4c1c
4 1 - 5 (i) Landless 5 8 13 12 9 21 13 7 20 (ii) SF 30 4 34 8 3 11 9 3 12 (iii) MF 10 - 10 4 - 4 4 - 4 (iv) LF 5 - 5 - - - - - -
4 1 - 5 50 12 62 24 12 36 26 10 36 6 HAZIPUR
2B2A4c1b 4 1 - 5 (i) Landless 5 8 13 12 9 21 13 7 20
(ii) SF 30 4 34 8 3 11 9 3 12 (iii) MF 10 - 10 4 - 4 4 - 4 (iv) LF 5 - 5 - - - - - -
Total 4 1 - 5 50 12 62 24 12 36 26 10 36 GRAND TOTAL 52 27 6 85 604 272 876 242 149 391 231 112 343
(M- Male, F- Female)

-------------------------------------------------------------------------------IWMP-IInd MAU (UP):DoLR
42
4.2.4 User Group The following user’s group are identified and constituted in all micro watershed committee in presence of Watershed Development Team for implementation of watershed work proper use and management of all engineering and vegetative measure to be creating/ constructing under watershed through scheme. Detail of user’s group are given below Table no. 31: UGs detail
S.No. Names of Watershed
Total no. of registered SHGs No. of Members No. of SC/ST in each category
No. of BPL in each category
Date of formation of
SHGs With only Men
With only Women
With Both
Total Categories M F Total M F Total M F Total
1 2 3 4 5 6 7 8 9 10 11 12 13 14 15 16 17 1. KARISATH
2B2A4c1e 8 4 2 15 (i) Landless 10 6 30 15 10 10 12 8 24 UNDER
PROCESS (ii) SF 27 8 35 10 4 14 10 2 12 (iii) MF 13 4 17 4 - 4 - - - (iv) LF 6 2 8 - - - - - -
Total 8 4 2 15 56 20 90 29 14 28 22 10 36 2 VIJPURA
2B2A4c2a 6 5 2 10 (i) Landless 20 30 67 10 10 30 28 19 47
(ii) SF 40 25 50 2 5 20 22 6 28 (iii) MF 20 10 33 7 - 7 - - - (iv) LF 10 - 10 - - - - - -
Total 6 5 2 10 90 65 160 19 15 57 50 25 75 3 REWARIDIH
2B2A4c1g 8 4 - 12 (i) Landless 9 - 9 7 - 7 8 - 8
(ii) SF 12 - 12 3 - 3 2 - 2 (iii) MF 3 - 3 - - - - - - (iv) LF 1 - 1 - - - - - -
Total 8 4 - 12 25 - 25 10 - 10 10 - 10 4 MAIDAPUR
SAMASTIPUR 2B2A4c2b
16 9 - 25 (i) Landless 40 - 40 13 - 13 9 - 9 (ii) SF 50 - 50 14 - 14 3 - 3 (iii) MF 8 - 8 8 - 8 3 - 3 (iv) LF 2 - 2 - - - - - -
Total 16 9 - 25 100 - 100 35 - 35 15 - 15
5 JAMALPUR MIRZAPUR 2B2A4c1c
4 1 - 5 (i) Landless 23 - 23 9 - 9 4 - 4 (ii) SF 30 30 4 - 4 3 - 3 (iii) MF 11 - 11 2 - 2 3 - 3 (iv) LF 6 - 6 - - - - - -
4 1 - 5 70 - 70 15 - 15 10 - 10 6 HAZIPUR
2B2A4c1b 4 1 - 5 (i) Landless 5 8 13 12 9 21 13 7 20
(ii) SF 30 4 34 8 3 11 9 3 12 (iii) MF 10 - 10 4 - 4 4 - 4 (iv) LF 5 - 5 - - - - - -
Total 4 1 - 5 50 12 62 24 12 36 26 10 36 GRAND TOTAL 46 24 4 72 391 97 507 132 41 181 133 45 182
(M- Male, F- Female)

-------------------------------------------------------------------------------IWMP-IInd MAU (UP):DoLR
43
4.2.5 Focused group discussion
FOCUSSED GROUP DISSCUSSION WITH WOMENS
FOCUSSED GROUP DISSCUSSION WITH MENS

-------------------------------------------------------------------------------IWMP-IInd MAU (UP):DoLR
44
4.3 PROJECT IMPLEMENTING AGENCIES
U.P. Government, Land Development Water Resources Department Section-1 Lucknow has nominated as PIA to Bhoomi Sanrakshhan Unit, Land Development Water Resources Department Mau for IWMP-II -vide letter no-666(10)/54-1-10-1(9)02008 dated 25-05-2010 Table no. 32: Project Implementing Agency (PIA)
S.No. Particulars of PIA
(i) Date of selection of PIA 25.05.2011
(ii) Type of organization Govt. organization
(iii) Name of organization # DoLR
(iv) Designation & Address BSA, IWDP, Mau
(v) Telephone 0546 2220 876
(vi) Fax` 0546 2220 876
(vii) E-Mail [email protected]
# Only the letter assigned to each type, as given below, needs to be typed. A Line Dept. B Autonomous organization C Govt. Institute D Research Bodies E Zila Parishad F Intermediate Panchayat G Voluntary Organisations H Any other (please specify). 4.4 Project Implementation Strategy
Watershed management as a strategy has been adopted by Government of India especially in the rainfed region of semi arid
tropics. These region are characterized by low and undependable rain, low soil fertility, poor infrastructure development, low literacy
and high incidence of migration. Several studies have identified that there is a dire need of a systematic and scientific approach to deal
with the watershed development. The common guideline generates a fresh and flexible framework for the next generation watershed
development.

-------------------------------------------------------------------------------IWMP-IInd MAU (UP):DoLR
45
4.4.1 Scientific Planning
i) Cluster Approach
This envisages a broader vision of Geo-hydrological unit which involves treating a cluster of micro watershed. The IWMP-II
1stMau watershed project consist of five micro watershed
ii) Base line Survey
To access the impact of any watershed development programme a detailed baseline survey has to be conducted. This acts a
benchmark for any intervention during and post implementation of any development programme. A detailed baseline survey was undertaken
which involved household census survey, Bio-physical survey and Village level data collection from PIA. Household census survey includes
a detailed questionnaire which was been filled by visiting each and every household in the village. This gave in the details of the
demographic profile of the village, the literacy percentage, SC/ST population, number of BPL household, cattle population, net consumption
rate in the IWMP-II-1st, average milk production of the cattle and various schemes running and their benefits. Bio-physical survey was
undertaken to identify various natural resources available in the village. It included the soil typology, well in the area, crop taken in the field,
Cropping pattern, fertilizer used and various sources of irrigation in the field.
iii) Participatory Rural Appraisal (PRA)
The past experience of watershed has given tremendous input to focus on creating accountability of the stakeholders towards the
programme. This has created an emphasis to include all the stakeholder communities and their local and indigenous Technological
Knowledge (ITK) while planning for any activity. Participatory approach provides a new path for planning, implementing, and monitoring
and post- withdrawal activities with a complete accountability of the stakeholders. Various PRA techniques like resource mapping, social
mapping, and season calendars were used to understand the physical and social orientation of the village in general and watershed in
specific. These tools put the villagers in ease than the complicated questionnaires. Various tools like Matrix ranking, Venn diagram were
used to identify various local vegetations (apt for afforestation) , Fodders crops , various institution and their significance in the life of the
farmers

-------------------------------------------------------------------------------IWMP-IInd MAU (UP):DoLR
46
iv) Use of GIS and Remote sensing for planning
Use of various high science tools has been promoted at various stages of watershed development.
a) Prioritization
Geographical Information System (GIS) has been used for prioritization process. Various layer maps were created like Geo-
morphological, Soil, BPL Population, SC/ST population, Ground water Status, Drinking water situation Slope percent. These were all given
proper weight age according to the DoLR specification. This helped in prioritization of various watershed areas.
b) Planning
A action plan matrix was formulated by State Level Nodal Agency (SLNA) taking into account various features like the slope
percent, soil Depth, Soil Texture, Soil erosion in the area for wasteland, forest land and agricultural land. Global positioning System (GPS)
was used to identify each and every water conservation structures available in the project area. This was used to create a map. Contour Map
of vertical interval of 1 meter at a scale of 1:8000 was used for identifying various locations for soil and water conservation structures.
c) Hydrological modelling
Hydrology modelling technique was used for locating drainage, stream length, flow direction, sink, and flow accumulation. This
model overlaid over cadastral map to calculate the catchments area of each structures like the gully plug etc. This has helped to remove the
human error which generally occurs while calculating the catchments area of a check dam.
Table no. 34: Details of Scientific Planning and Inputs in IWMP-II projects

-------------------------------------------------------------------------------IWMP-IInd MAU (UP):DoLR
47
Scientific criteria/ inputs used Whether scientific criteria was used
1 2
(A) Planning
Cluster approach Yes
Whether technical back-stopping for the project has been arranged? If yes, mention the name of the Institute
Baseline survey Yes
Hydro-geological survey Yes
Contour mapping Yes
Participatory Net Planning (PNP) Yes
Remote sensing data-especially soil/ crop/ run-off cover
Ridge to Valley treatment
Online IT connectivity between
(1) Project and DRDA cell/ZP Yes
(2) DRDA and SLNA Yes
(3) SLNA and DoLR Yes
Availability of GIS layers
1. Cadastral map Yes
2. Village boundaries Yes
3. Drainage Yes
4. Soil (Soil nutrient status) Yes
5. Land use Yes
6. Ground water status Yes

-------------------------------------------------------------------------------IWMP-IInd MAU (UP):DoLR
48
1 2
7. Watershed boundaries Yes
8. Activity Yes
Crop simulation models# No
Integrated coupled analyzer/ near infrared visible spectroscopy/ medium spectroscopy
for high speed soil nutrient analysis
No
Normalized difference vegetation index (NDVI)# No
Weather Station
(B) Inputs No
1. Bio-pesticides No
2. Organic manures Yes
3. Vermicompost Yes
4. Bio-fertilizer Yes
5. Water saving devices Yes
6. Mechanized tools/ implements Yes
7. Bio-fencing Yes
8. Nutrient budgeting No
9. Automatic water level recorders & sediment samplers No
4.5 Convergence of watershed programmes 4.5.1 Earthen bund, contour bund, percolation tank, injection well will be made in watershed area convergence with MNREGS 4.5.2 Soil health card, crop demonstration, kisan gosthi, kisan mela, farmer’s school also organized in watershed area under many
scheme of department of Agriculture. 4.5.3 Composite fish farming or mixed fish farming popularized in this area with Department of fisheries. 4.5.4 Animal health camp, fodder development, vaccination work also made through Veterinary Department. 4.5.5 Aforestation in project area also done with Forest Department. 4.5.6 Dry land horticulture also convergence with department of horticulture. Table no. 35 : Details of Convergence of other Schemes in the Project area with IWMP-II Project S.No. Name of the MW Names of
Departments with Fund made available to
Was this fund included in Rs. 12,000/15,000
Name of activity/task/structure
Reference no. of activity/task/structure in
Level at which decision for

-------------------------------------------------------------------------------IWMP-IInd MAU (UP):DoLR
49
Schemes converging with
IWMP-II*
IWMP-II project due to convergence (Rs. In lakh)
Per ha undertaken with converged funds
DPR convergence was taken $
Yes No (a) Structures (b) Livelihoods (c) Production System
1 KARISATH 2B2A4c1e
MNREGS 20.00 NO a 5 DRDA DA 0.40 No b, c 5 PIA DHO 0.10 No b, c 5 PIA DF 0.20 No b, c 5 PIA F 0.30 No b, c 5 PIA
Total 21.00 No 2 VIJPURA
2B2A4c2a MNREGS 23.00 No a 5 DRDA DA 1.50 NO b, c 5 PIA DHO 0.30 No b, c 5 PIA DF 0.40 No b, c 5 PIA F 0.30 No b, c 5 PIA
Total 25.50 No 3 REWARIDIH
2B2A4c1g MNREGS 11.00 No a 5 DRDA DA 1.70 No b, c 5 PIA DHO 0.50 NO b, c 5 PIA DF 0.50 No b, c 5 PIA F 0.30 No b, c 5 PIA
Total 19.00 No 4 MAIDAPUR
SAMASTIPUR 2B2A4c2b
MNREGS 13.00 No a 5 DRDA DA 1.40 No b, c 5 PIA DHO 0.30 No b, c 5 PIA DF 0.40 NO b, c 5 PIA F 0.45 No b, c 5 PIA
Total 15.55 No 5 JAMALPUR
MIRZAPUR 2B2A4c1c
MNREGS 8.00 No a 5 DRDA DA 0.50 No b, c 5 PIA DHO 0.20 No b, c 5 PIA DF 0.20 No b, c 5 PIA F 0.20 No b, c 5 PIA
Total 9.10 No
6 HAZIPUR 2B2A4c1b
MNREGS 8.00 No a 5 DRDA DA 0.50 No b, c 5 PIA DHO 0.20 No b, c 5 PIA DF 0.20 No b, c 5 PIA F 0.20 No b, c 5 PIA
Total 9.10 No Grand Total 99.25
# only letter (a) or (b) or (c) needs to be filled. In case more than one activity has been undertaken all the concerned letters may be indicated e.g. (a) + (b) $ WC/GP/WDT/PIA/DRDA cell/ZP/DPC/SLNA / DoLR- only initials as indicated here need to be entered. * DA= Department of Agriculture, DHO= Department of Horticulture, VO= Department of Veterinary, DF= Department of Fisheries, F= Forest

-------------------------------------------------------------------------------IWMP-IInd MAU (UP):DoLR
50
5. MANAGEMENT /ACTION PLAN
5.1 PREPARATORY PHASE
5.1.1 Entry Point Activities
Integrated Watershed Development Programme IInd is aimed at the socio economic up liftments of the dweller of watershed
area and to create trust about the programme to be implemented so that they can coordinate in participatory mode for the success of
the programme. As per the new common guidelines total financial outlay for the entry point activities is 4 % of the total project cost.
To increase the per capita availability of drinking water older wells of the village will be renovated as well as pacca jagat will be
constructed, to increase the irrigation water availability older bundhies which are already existed but not functioning will be
reconstructed/ renovated. Repairing and maintenance of water bodies have been proposed on priority basis. School lies in the
watershed areas will be equipped with drinking water facility . To approach watershed village construction and repairing of damaged
pulia has also been proposed and construction of women bathrooms besides hand pump or wells. Total estimated cost for these
activities is Rs 26.76 Lacs.

-------------------------------------------------------------------------------IWMP-IInd MAU (UP):DoLR
51
Table no. 36: Entry point activities (EPA)
(All financial figures in lakh Rs.) S.no. Names of the
Villages Amount
earmarked for EPA
Entry point Activities planned Estimated cost Expected outcome Name of agency which selected
the EPA#
Expected month & year of completion
(mm/yyyy) 1 2 3 4 5 6 7 8
1 KARISATH 2B2A4c1e
8.064 Repair of well/ Pacca jagat-6 3.00 - WC, PIA, WDT 2012 Repairing of damaged Pulia-6 1.80 - WC, PIA, WDT 2012 Repairing of P.School Class room 0.264 - WC, PIA, WDT 2012 Traveler Tin shed-3 3.00 - WC, PIA, WDT 2012
2 VIJPURA 2B2A4c2a
3.744 Repair of well/ Pacca jagat-4 2.00 - WC, PIA, WDT 2012 Repairing of damaged Pulia-5 1.500 - WC, PIA, WDT 2012 Repairing of Pnchayat ghar 0.244 - WC, PIA, WDT 2012
3 REWARIDIH 2B2A4c1g
1.608 Repair of well/ Pacca jagat-1 0.500 - WC, PIA, WDT 2012 Repairing of damaged Pulia-2 0.600 - WC, PIA, WDT 2012 Repairing of Pnchayat ghar 0.508 - WC, PIA, WDT 2012
4 MAIDAPUR SAMASTIPUR 2B2A4c2b
3.00
Repair of well/ Pacca jagat-2 1.000 - WC, PIA, WDT 2012 Repairing of damaged Pulia-3 0.900 - WC, PIA, WDT 2012 Repairing of P.School Class room 0.100 - WC, PIA, WDT 2012 Traveler Tin shed-1 1.000 - WC, PIA, WDT 2012
5 JAMALPUR MIRZAPUR 2B2A4c1c
4.56 Repair of well/ Pacca jagat-2 1.000 - WC, PIA, WDT 2012 Repairing of damaged Pulia-4 1.200 - WC, PIA, WDT 2012 Repairing of P.School Class room 0.36 - WC, PIA, WDT 2012 Traveler Tin shed-2 2.000 - WC, PIA, WDT 2012
6 HAZIPUR 2B2A4c1b
5.784
Repair of well/ Pacca jagat-6 3.000 - WC, PIA, WDT 2012 Repairing of damaged Pulia-2 0.600 - WC, PIA, WDT 2012 Repairing of P.School Class room 0.184 - WC, PIA, WDT 2012 Traveler Tin shed-2 2.000 - WC, PIA, WDT 2012
Total 26.76 26.76 # Was the EPA selected by Gram Panchayat/WC/PIA/WDT/Any other (please specify) Table no. 37 : Other activities of preparatory phase

-------------------------------------------------------------------------------IWMP-IInd MAU (UP):DoLR
52
S.No
Item Initiation of village
level institution
Capacity building
IEC activities
Baseline survey
Hydro-geological
survey
Identifying technical support agencies
Resource agreements
Preparation of DPR
Evaluation of DPR
Any other
(please specify)
1 Estimated cost 1.45 28.00 4.00 3.345 1.338 - - 1.338 0.669 -
2 Status of the activity #
Under Complete
Under Complete
Under Complete
Complete Complete Complete Complete -
3 Expected month & year of completion (mm/yyyy)
2012
2012
2012
2011
2011
2011
- 2011
-
5.1.2 Institution and Capacity Building 5.1.2.1 Institution Table no. 38 : List of approved Training Institutes for capacity Building in the project area S.No. Name of the
Training Institute Full Address with contact no.,
website & e-mail Name &
Designation of the Head of
Institute
Type of Institute
Area (s) of specialization Accreditation details
1 Krishi Vigyan Kendra Pilkhi haldharpur Mau(UP), [email protected] 09451891755
Programme Co-ordinator
Research Extension &
Agriculture, Horticulture, A. Husbandry, Fisheries, Entrepreneurship, Livelihood and Capacity building etc
GOI
1 Krishi Vigyan Kendra Mau (UP), Dr. B.B. Singh Programme Co-ordinator
Research Extension &
Agriculture, Horticulture, A. Husbandry, Fisheries, Entrepreneurship, Livelihood and Capacity building etc
GOI
2 Directorate of Seed Reasearch
DSR, Kusmaur, Mau (U.P.), 0547-2530080, http//www.icar.org.in.nbaim/indexhtm
Director, Dr. Mandal
Research Agriculture GOI
3 NBAIM NBAIM, Kusmaur, Mau (U.P.), 0547-2530080, http//www.icar.org.in.nbaim/indexhtm
Director, Dr. D.K.Arora
Research Agriculture GOI
4 Gramsthali Sikshha Parishad
29 rajrajeshwari nagar colony, Gilat Bajar, Varanasi-221002, [email protected], +91532107394
President, Dr R. K. Singh
NGO Capacity Buildings, Production System
NGO
5 G.K.S.S. SA-19/13 K-2 Janak nagar, Pandeypur Varanasi, +919838001699 [email protected]
President, Dr. A.K. Singh
NGO Capacity Buildings, Production System
NGO
5.1.2.2 Capacity Building

-------------------------------------------------------------------------------IWMP-IInd MAU (UP):DoLR
53
Capacity building and training are the most important components of watershed management programme both for the field level project staff/ officers and functionaries of people institutions i.e. watershed community. Apart from enhancing technical skill of the project staff, this would also provide opportunities to community members to develop their capacity as the feature custodians of the programmes after project’s withdrawal. IWMP-II - MAU financial outlay for capacity buildings is 5% (Rs. 33.45) of the total project cost and out of which Rs 1.45 will be expanded for initiation of village level institution. Table no 39 : Capacity Building activities in the project
S.No. Project Stakeholders
Total no. of persons
No. of persons trained so far
No. of persons of be trained
during current financial year
Sources of funding for training Name and Address of the Institute where Trained
a) DoLR b) any other (pl. specify)
1 PIAs 6 2 8 DoLR KVK, GSP,GKSS 2 WDTs 32 12 32 DoLR KVK, GSP,GKSS 3 UGs 155 52 155 DoLR KVK, GSP,GKSS 4 SHGs 180 42 180 DoLR KVK, GSP,GKSS 5 WCs 17 5 17 DoLR KVK, GSP,GKSS 6 GPs 22 - 22 DoLR KVK, GSP,GKSS 7 Community 1200 - 1200 DoLR KVK, GSP,GKSS 8 Others (pl. specify) Table no 40: Detail of activities undertaken Strategy Proposed activity No. of Units Unit cost Total Cost
Capacity building Activities Stakeholders - Scientists Interaction, 15 0.10 1.00 Training (2 days) 100 0.05 5.00 Vocational/employment Generation Training (5-10 days) 75 0.10 7.50 In-service Training. (3 days) 25 0.10 2.50 Exposure visit within State 5 0.20 1.00 Exposure visit out of State 12 0.50 6.00 Field days 10 0.30 3.00 Workshop 2 1.00 2.00
Total 28.00 Table no 41 : Information, Education & Communication (IEC) activities in the project area S.no. Activity Executing agency Estimated expenditure (Rs.) Expected Outcome (may
quantify wherever possible) 1 Street plays Local Drama Groups 100000.00 Awareness about importance
of watershed project 2 Video Shows IWMP-II, Mau 100000.00 3 Pamphlets and Poster IWMP-II, Mau 100000.00 4 Banners and Hoardings IWMP-II, Mau 100000.00 Total 400000.00 5.1.3 Detail Project Report See table no. 37.

-------------------------------------------------------------------------------IWMP-IInd MAU (UP):DoLR
54
5.2 WORK PHASE
5.2.1 Soil and moisture conservation For soil and moisture conservation, water resource development, horticulture, besides agro forestry vegetation / plantation
work, engineering structure have also been proposed under the project. Engineering structure are important components of soil and
water conservation that can play a vital role in erosion control on arable land. Engineering measure usually involves in creating
mechanical barriers across the direction of flow of water and thus retards or retains runoff on the following principles:
• Increase the time of concentration.
• Break a long slope into short ones.
• Protection of drainage channel against damage.
• Prevent excessive soil and water losses.
1. Ridge Area Treatment Plans: It is very important to treat the ridge as this is where the major water resources originate. For the ridge area treatment of IWMP-II -
watershed following structure are been Proposed after interaction between the watershed committee, Range Forest Officer (RFO) and other
field staff of forest.
A. Contour Bunding :
Contour bunding is and effective in erosion control and moisture conservation in dry areas having less than 2 %
slop to reduce the length of slope. Contour bund constructed against the slope in 1513.00 ha of lands with total estimated
cost of Rs. 60.50 lacs
B. Graded/Marginal and Peripheral Bund:
Marginal bunds are the engineering structure to reduce the volume and speed of runoff. Those locations where
change in slope and soil texture founded there is peripheral bund will be constructed along with nala bank. Total
proposed treatable area is 750.00 ha with financial outlay of Rs. 51.93. lacs

-------------------------------------------------------------------------------IWMP-IInd MAU (UP):DoLR
55
C. Submergence Bundhies and Gully Plug:
Submergence bundhies will be constructed at middle reaches of watershed have in lesser slop. However, gully
plug structure has been proposed to be formed on upper reaches / Ist order stream. Total propsed area for the structures
jointly is 90.00 ha with total financial outlay of Rs. 14.40 lacs.
This generally includes water conservation or surface water storage structures. This being highly labour intensive, will involve more of manual labour; so, funds from National Rural Employment Guarantee Scheme (NREGS) can be taken.
2. Water Harvesting bundhies:
Water harvesting bundhies are primarily aimed at collecting and storing any form of water enter through
rainfall, runoff or subsurface flow for multiple purpose. There will be 65 water harvesting bundhies with farm ponds
structure on 1400.00 h of land will be constructed on lower reaches of the watershed. Estimated financial outlay is Rs.
80.66 lacs.
3. Pucca check damStructure:
These structure of built of mossonary. Pucca structure have been proposed constructed in big gullies / ravines
carrying relatively high run off and sediment load. Water stored in Pucca structure will be utilized as source of irrigation
water during post mansoon season. Construction of five Pucca structure has been proposed with total estimated cost of Rs
7.00 lacs
4. Agroforestry:
About 167.00 ha lands will be taken from the waste land faling in the class-VII category in the watershed.
These lands will be planted with subabool in which urd, moong, til etc planted as intercrop, subabool will be used as fuel
as well as fodder
5. Dry Land Horticulture
About 390 ha area will take for the plantation of fruit trees like aonla, bael, ber, karaunda, mango, will be planted at
suitable spacing in the watershed.
Table no 42 : Activities related to Surface Water resources in the project areas

-------------------------------------------------------------------------------IWMP-IInd MAU (UP):DoLR
56
S.No
Names of villages
Type of structures
Pre-project Proposed target No.
Area irrigated (ha)
Storage capacit
y
Augmentation/repair of existing structures
Construction of new structures Total target
No. Area irrigated (ha)
Storage capacity (lit)
Estimated cost (Rs
in laks)
No.
Area irrigated (ha)
Storage capacity (lit)
Estimated cost(Rs in laks)
Area irrigated (ha)
Storage capacity (lit)
Estimated cost (Rs in
laks) 1 KARISATH
2B2A4c1e (ii) Pond 5 25 25000 5 37.5 37500 5.00 30 30 30000 8.00 67.5 67500 13.00 (iv) Injection well
- - - - - - - 38 - 38000 0.95 - 38000 0.095
2 VIJPURA 2B2A4c2a
(ii) Pond 3 15 15000 3 22.5 22500 3.00 15 15 15000 4.000 37.5 37500 7.00 (iv) Injection well
- - - - - - - 6 - 6000 0.15 - 6000 0.15
3 REWARIDIH 2B2A4c1g
(ii) Pond 3 15 15000 3 22.5 22500 3.00 - - - - 22.5 22500 3.00 (iv) Injection well
- - - - - - - 3 - 3000 0.075 - 3000 0.075
4 MAIDAPUR SAMASTIPUR 2B2A4c2b
(ii) Pond 3 15 15000 3 22.5 22500 3.00 15 15 15000 4.000 37.5 37500 7.00 (iv) Injection well
- - - - - - - 26 - 26000 0.65 - 26000 0.65
5 JAMALPUR MIRZAPUR 2B2A4c1c
(ii) Pond 2 10 10000 2 15 15000 2.00 15 15 15000 4.000 30.00 30000 6.00 (iv) Injection well
- - - - - - - 32 - 32000 0.81 - 32000 0.81
6 HAZIPUR 2B2A4c1b
(ii) Pond 2 10 10000 2 15 15000 2.00 15 15 15000 4.000 30.00 30000 6.00 (iv) Injection well
- - - - - - - 32 - 32000 0.81 - 32000 0.81
Total 18 90 90000 18 135 135000 18
227 90 227000 27.445 225 362000 44.59
@ 50 % work will be done on public asset and 50% done on community asset. Table no. 43: Technical detail of Farm Ponds and Injection Well S. No Particulars Value Ponds Injection Well
1 Top area M2 500.00 (25X20) 1.00 2 Bottom area M2 300.00 (20X15) 1.00 3 Depth M 2.50 1.00 4 Side Slope - 2:1 -
Table no 44 : Activities related to recharging ground water resources in the project areas @

-------------------------------------------------------------------------------IWMP-IInd MAU (UP):DoLR
57
S.N
o
Names of
villages
Type of structures Pre-project Proposed target Expected
month &
year of
completion
(mm/yyyy)
No. Area
irrigate
d (ha)
Augmentation/repair of
existing structures
Construction of new
structures
Total target
No. Area
irrigate
d (ha)
Estimat
ed cost
No. Area
irrigated
(ha)
Estimated
cost
Area
irrigate
d (ha)
Estimat
ed cost
1 KARISATH
2B2A4c1e
(i) Open wells 3 1.50 2 4.00 0.24 - - - 4.00 0.24 2013
(ii) Bore wells 6 6.00 3 11.00 0.66 - - - 11.00 0.66 2013
2 VIJPURA
2B2A4c2a
(i) Open wells 2 1.00 2 5.00 0.30 - - - 5.00 0.30 2013
(ii) Bore wells 5 5.00 5 20.00 1.20 - - - 20.00 1.20 2013
3 REWARIDIH
2B2A4c1g
(i) Open wells 1 0.50 1 2.00 0.12 - - - 2.00 0.12 2013
(ii) Bore wells 4 4.00 4 18.00 1.08 - - - 18.00 1.08 2013
4 MAIDAPUR
SAMASTIPUR
2B2A4c2b
(i) Open wells 2 1.00 2 5.00 0.30 - - - 5.00 0.30 2013
(ii) Bore wells 2 5.00 3 10.00 0.60 - - - 10.00 0.60 2013
5 JAMALPUR
MIRZAPUR
2B2A4c1c
(i) Open wells 2 1.00 2 5.00 0.30 - - - 5.00 0.30 2013
(ii) Bore wells 2 5.00 3 10.00 0.60 - - - 10.00 0.60 2013
6 HAZIPUR
2B2A4c1b (i) Open wells 2 1.00 2 5.00 0.30 - - - 5.00 0.30 2013
(ii) Bore wells 2 5.00 3 10.00 0.60 - - - 10.00 0.60 2013
Total for the project 33 36 32 105 6.3 0 0 0 105 6.3
Above all the assets only 20 % under community and rest related with private sector. Table 45 : Activities executed by User Groups in the Project
S.no Names of Project Major activities No. of UGs involved
Estimated Cost (Rs.)
Amount of WDF to be
collected (Rs.) Structure/activity proposed Expected month
& year of completion (mm/yyyy)
Type No.# Treatment
1 IWMP-II - Mau Structure work Enginering 2015 27 369.30 laks 18.47Lacs
Table no 46 : Details of engineering structures in watershed works

-------------------------------------------------------------------------------IWMP-IInd MAU (UP):DoLR
58
S.No.
Names of villages
Name of structure Type of treatment Type of land Executing agency
Total target
(i) Ridge
area (R)
(ii) Drain
age line (D)
(iii) Land dev. (L)
(i) Priva
te
(ii) Com
munity
(iii) Others (pl. specif
y)
(i)UG (ii) SHG
(iii) Others (pl. specify)
No. of units
(no./cu.m./rmt)
Estimated cost (Rs. In lakh)
Expected month & year of
completion (mm/yyyy)
M W O T 1 2 3 4 5 6 7 8 9 10 11 12 13 14 15 16
1 KARISATH 2B2A4c1e
Contour bunding R - - P C - UG &DoLR 52805 16.0 , 2013 Graded bunding - D - - C UG &DoLR 18571.4
3 13.0 , 2013
Gully plug - D - - C - UG &DoLR 17500 7.00 , 2015 Field bunds - - L P C - UG &DoLR 98011.7
6 35.0 , 2015
2 VIJPURA 2B2A4c2a
Contour bunding R - - P - UG &DoLR 49505 15.0 , 2013 Graded bunding - D - - C UG &DoLR 17142.8
6 12.0 , 2013
Gully plug - D - - C - UG &DoLR 15000 6.00 , 2015 Field bunds - - L P C - UG &DoLR 84010.0
8 30.0 , 2015
3 REWARIDIH 2B2A4c1g
Contour bunding R - - P - UG &DoLR 46205 14.0 , 2013 Graded bunding - D - - C UG &DoLR 17142.8
6 12.0 , 2013
Gully plug - D - - C - UG &DoLR 12500 5.00 , 2015 Field bunds - - L P C - UG &DoLR 84010.0
8 30.0 , 2015
4 MAIDAPUR SAMASTIPUR 2B2A4c2b
Contour bunding R - - P - UG &DoLR 66007 20.0 , 2013 Graded bunding - D - - C UG &DoLR 25714.2
9 18.0 , 2013
Gully plug - D - - C - UG &DoLR 20000 8.00 , 2015 Field bunds - - L P C - UG &DoLR 126015.
1 45.0 , 2015
5 JAMALPUR MIRZAPUR 2B2A4c1c
Contour bunding R - - P - UG &DoLR 18977 5.75 , 2013 Graded bunding - D - - C UG &DoLR 11928.5
7 8.35 , 2013
Gully plug - D - - C - UG &DoLR 10000 4.0 , 2015 Field bunds - - L P C - UG &DoLR 37524.5
0 13.4 , 2015
6 HAZIPUR 2B2A4c1b
Contour bunding R - - P - UG &DoLR 18977 5.75 , 2013 Graded bunding - D - - C UG &DoLR 11928.5
7 8.35 , 2013
Gully plug - D - - C - UG &DoLR 10000 4.0 , 2015 Field bunds - - L P C - UG &DoLR 37524.5
0 13.4 , 2015
Total 907000 330 (M- Materials, W- wages, O- others, T- Total)

-------------------------------------------------------------------------------IWMP-IInd MAU (UP):DoLR
59
Table no 48: Total Treatment of Micro Watershed of IWMP-II
S.N. Watershed Reaches Proposed Work Treatable Area (ha.) CMT Rate
(Rs CMT)
Proposed Cost
(Rs in lacs)
1 Upper Reaches Contour Bund 1513.00 199670 30.30 60.50
Guly Plug 90.00 36000 40.00 14.40
2 Middle Reaches Graded Bund (Marginal bund,
Peripheral bund, Submergance
bund, earthen check dam)
750 741.85 70.00 51.93
Agroforestry/ Horticulture 557 - 60000/ha 33.42
3 Lower Reaches/ Drinage
Line Treatment
Water Harvesting Bundhi Pond 1400 225938 35.71 80.66
Check dams - 1 no - 7.00
Farm Ponds, Injection well 1265 * * 81.59
Total 5575.00 334.50
* details in table no 42 and 44 Table no 49: Technical detail of engineering works in project area S. No. Project No of
villages Type of bund Type of soil Particulars (meter)
Top Base Height Slope Cross section 1 IWMP-II 72 Field Bund Normal 0.30 1.65 0.45 1.5:1 0.438
Contour Bund Clay 0.45 1.65 0.60 1.0:1 0.63 Loam 0.45 2.25 0.60 1.5:1 0.81 Sandy 0.45 2.85 0.60 2.0:1 0.99
Marginal/CRB & peripheral Bund
Plain land 0.60 3.60 1.00 1.5:1 2.10 Undulating land
1.00 4.00 1.00 1.5:1 2.50
Gully Plug At 3% or above3 % slope gully plug will be made between two drainage line with emergency temporary spill way

-------------------------------------------------------------------------------IWMP-IInd MAU (UP):DoLR
60

-------------------------------------------------------------------------------IWMP-IInd MAU (UP):DoLR
61
NOMENCLATUR AND SYMBOLS OF TYPICAL DROP SPILLWAY

-------------------------------------------------------------------------------IWMP-IInd MAU (UP):DoLR
62
5.2.2 PROPOSED LAND USE
Watershed management plan for IWMP-II Mau watershed was prepared with specific objectives of food sufficiency and
income and employment generation with environment security. In plan preparation due importance was given to topographic, land
suitability, irrigation potentially, prevailing farming systems, micro farming situation, farming, farmers preferences and priorities
along with economic and environment securities. Crop and tree selection and area distribution was done as per farmers priorities
revealed through PRA exercise.
Technological options were blended with the ITK based on the latest available research/ experiment findings for this region.
Due attention was given to the resource of the farmers and adjustments were made in capital intensive/high resource demanding
technological outputs while making them adoptable to the resource poor farmers. Emphasis was given on maximum use of farm yard
manure. The proposed land use plan of the watershed is shown in table.
Table no. 50: Present and proposed land use plan of the IWMP-II watershed
S.No. Land use Present (ha) Proposed area (ha) 1 Agriculture 7315.00 7315.00 a. Rain fed 5790.00 5790.00 i. Crops 5780.00 5233.00 ii. Horticulture 8.50 390.00 iii. Agro-forestry 1.50 167.00 b. Irrigated 1525.00 1525.00 i. Assured 225.00 725.00 ii. Partial 1300.00 800.00
2 Waste Land 260.00 260.00 a. A forestation Nil Nil b. Pasture 2.50 2.50 c. Untreatable 256.00 256.00 Total 7575.00 7575.00

-------------------------------------------------------------------------------IWMP-IInd MAU (UP):DoLR
63
5.2.3 WATER RESOURCE DEVELOPMENT AND SOIL CONSERVATION MEASURES
Status of Present Water Resources Utilization
The micro watersheds are having four seasonal water bodies on private as well as on community land. Management and
maintenance of these water bodies is still in the hand of minor irrigation department. During good rainfall year these water bodies
having full of water during kharif season. Before sowing of rabi season crops water from these water bodies is either used for
supplementary irrigation for kharif crops or irrigating fields for rabi sowing or allowed to go as waste. After releasing water from
bodies, submergence area also put under cultivation for rabi crops.
Proposed plan for Irrigation Development of existing water resources
For efficient utilization of available water resources in the IWMP-II watersheds, present system of irrigation and wastage of
water during October-November need to be made more efficient from water management point of view by minimizing conveyance
losses in the existing water courses. The up gradation of the existing system of irrigation will result in:
a. Minimization of conveyance losses
b. Increase in frequency of irrigation
c. Adoption of high yielding varieties of crops, and
d. Assured cultivation of cash Crops
e. Drinking water problem will also solved
f. Local eco system will also improved
New water harvesting structures (Ponds)
Two new dug type water harvesting structures (pond) of capacity about 1400 cum (each) have been proposed to harvest excess
runoff of the watershed. Harvested water will be used for supplementary irrigation and fish rearing. Details of these ponds have been
given in the estimated budget in last.

-------------------------------------------------------------------------------IWMP-IInd MAU (UP):DoLR
64
Crop production
Mulching and crop residue management
The sources of mulching material as brought up mulch i.e. litter or pruned material of trees etc are scarce in the watershed. The
weeds, in situ grown legume and multi purpose trees (as hedge row on marginal and degraded lands) are some of the options available
with growers for mulching the rain-fed crops for moisture conservation, fertility restoration and other purposes. Therefore, weed
mulching and hedge row of MPTs will be demonstrated in the watershed for benefit of the rural community.
Green manuring
Intensive cropping with inadequate application of organic manures i.e. FYM, compost etc, has over exploited the existing
agricultural production system in the watershed. In order to improve the fertility as well as physico- chemical properties of soils green
manuring in-situ and ex-situ with suitable crops like dhaincha, sun-hemp and neel are proposed to be demonstrated in the watershed
areas of IWMP-II watersheds.
Vermi composting
In order to provide quality manure with high nutrient content to various field crops, vegetables and cash crops, to save time
and proper disposal of on farm organic refuse and cow dung as well as to promote organic farming, vermin-composting will be
demonstrated to the farmers so that within a short period they can be able to produce manure from organic waste.
Crop rotation and intercropping
In order to diversify farm produce, minimize the farming risk, mitigate soil erosion, to ensure nutritional security and to
optimize farm return, intercropping of legumes (black gram and green gram) in inter row spaces of bajra are proposed to be
undertaken in the watershed during kharif season. Sustainable and profitable crop-rotations suiting to various needs of the people of
the watershed will be demonstrated.

-------------------------------------------------------------------------------IWMP-IInd MAU (UP):DoLR
65
Bio-fertilizers
The various beneficial bio-fertilizers like nitrogen fixers, phosphate solubliser and organic matter decomposers for both
legumes and non legumes will be demonstrated in the farmers field under the watershed villages.
Tillage operations
Deep tillage technology developed at the NDUAT, Faizabad holds promising in enhancing post monsoon residual soil
moisture conservation and improving the yield of subsequent mustard crop. This technology is proposed to be demonstrated for
benefit of farmers in the watershed.
Introduction of improved seeds of high yielding varieties(HYV)
Replacement of low yielding traditional varieties of Paddy, wheat, jowar, gram and lentil in the villages in the watershed with
improved varieties is necessary for improving the productivity and farm income. These HYVs will be demonstrated in the watershed
for the benefit of the farmers.
Balanced fertilizer use
Inadequate and imbalanced fertilizer use in the Paddy, bajra and jowar during kharif season and in wheat, mustard, gram and
lentil in rabi season are one of the major constraints in agricultural production system of the watershed. Therefore, fertilizer use in
different crops will be demonstrated in the watershed for the benefits of the farming community.

-------------------------------------------------------------------------------IWMP-IInd MAU (UP):DoLR
66
Control of insect pest and diseases
Aphid in the mustard and pod borer in gram are the major insects in the watershed areas leading to loss in crop productivity.
Similarly white blister is also a common disease in the mustard crop. The management strategies of these insect pests and diseases will
also be demonstrated in the watershed for benefit of the growers.
Management of the crop
The recommended technology of crop management will be demonstrated to the farmers in half plot trial approach so as to
enable the farmers to assess the benefits and impact of each technology or package of practice for their ultimate adoption in the
watershed. The interventions scheduled on prioritization of problems in the crop production following PRA and surveys target
specifically solution of the each and problem related to the crop production as per interventions. The specific problems, if any shall be
dealt with contingency budget.
Dry land Horticulture
About 20 ha of land is suitable for horticultural development. Species like Bael and Ber will be planted at suitable spacing in
the watershed.
Agri-Horticulture
Anola and sahjan would be a suitable horticultural crop to the locality. Therefore, about 390.00 ha land in the farmers field
shall be selected and brought under Agri-horti system. The cropping system followed will be Bajra and Wheat.
Plantation :
Fuel wood plantation: About 167.00 ha land will be taken the waste land falling in the class-IV category in the watershed. These
lands will be planted with species like Prosopis juliflora Acacia nilatica, Prosopis cineraria and Holoptelia integrifolia. Table no. 51 : Details of activities connected with vegetative cover in watershed works
Names of Name of Type of treatment Type of land Executing agency Total target

-------------------------------------------------------------------------------IWMP-IInd MAU (UP):DoLR
67
S.No.
villages structure/work (i) Ridge area (R
(ii) Drainage line (D)
(iii) Land
dev. (L)
(i) Priva
te
(ii) Community
(iii) Others (pl.
specify)
(i)UG (ii) SHG
(iii) Others (pl. specify)
Area (ha)
No. of Plants
Estimated cost (Rs. In
lakh)
Expected month & year of completion (mm/yyyy)
1 2 3 4 5 6 7 8 9 10 11 12 13 14 1 Karisath
2B2A4c1e
Afforestation R D L P C - DoLR, DF 30.00 4680 1.80 2013
Agro-forestry - - L P C - DoLR, UG, DF 53.00 8268 3.18 2013
Fodder - - L P - - DoLR,UG, DV 3.00 - 0.18 2012
Horticulture R - L P C - DoLR, UG, DH 68.00 10608 4.08 2013
Pasture dev. R - L - C DoLR,SHG, DV 1.00 - 0.06 2012
Nursery raising - - L - C - DoLR, SHG, DH 0.50 - 0.03 2011
Total 155.50 9.33
2 Vijpura
2B2A4c2a
Afforestation R D L P C - DoLR, DF 28.00 4368 1.68 2013
Agro-forestry - - L P C - DoLR, UG, DF 50.60 7894 30.36 2013
Fodder - - L P - - DoLR,UG, DV 2.50 - 0.15 2012
Horticulture R - L P C - DoLR, UG, DH 66.00 2496 0.96 2013
Pasture dev. R - L - C DoLR,SHG, DV 1.00 - 0.06 2012
Nursery raising - - L - C - DoLR, SHG, DH 0.50 - 0.03 2011
Total 148.60 8.91
3 Rewaridih
2B2A4c1g
Afforestation R D L P C - DoLR, DF 10.00 1560 0.66 2013
Agro-forestry - - L P C - DoLR, UG, DF 26.30 4103 15.78 2013
Fodder - - L P - - DoLR,UG, DV 10.00 - 0.60 2012
Horticulture R - L P C - DoLR, UG, DH 50.00 7800 3.00 2013
Pasture dev. R - L - C DoLR,SHG, DV 5.00 - 0.30 2012
Nursery raising - - L - C - DoLR, SHG, DH 2.00 - 0.12 2011
Total 103.30 6.198
4 Maidapur
Samastipur
2B2A4c2b
Afforestation R D L P C - DoLR, DF 58.35 9103 3.50 2013
Agro-forestry - - L P C - DoLR, UG, DF 60.00 9360 3.60 2013
Fodder - - L P - - DoLR,UG, DV 2.00 - 0.12 2012
Horticulture R - L P C - DoLR, UG, DH 115.00 17940 6.90 2013
Pasture dev. R - L - C DoLR,SHG, DV 1.00 - 0.06 2012
Nursery raising - - L - C - DoLR, SHG, DH 0.25 - 0.02 2011
Total 238.60 14.32

-------------------------------------------------------------------------------IWMP-IInd MAU (UP):DoLR
68
1 2 3 4 5 6 7 8 9 10 11 12 13 14 5 Jamalpur
Mirzapur
2B2A4c1c
Afforestation R D L P C - DoLR, DF 17.00 2652 1.02 2013
Agro-forestry - - L P C - DoLR, UG, DF 1.50 234 0.09 2013
Fodder - - L P - - DoLR,UG, DV 1.50 - 0.09 2012
Horticulture R - L P C - DoLR, UG, DH 18.00 2806 1.08 2013
Pasture dev. R - L - C DoLR,SHG, DV 0.25 - 0.02 2012
Nursery raising - - L - C - DoLR, SHG, DH 0.25 - 0.02 2011
Total 38.00 2.28
6 Hazipur
2B2A4c1b
Afforestation R D L P C - DoLR, DF 17.00 2652 1.02 2013
Agro-forestry - - L P C - DoLR, UG, DF 1.50 234 0.09 2013
Fodder - - L P - - DoLR,UG, DV 1.50 - 0.09 2012
Horticulture R - L P C - DoLR, UG, DH 18.00 2806 1.08 2013
Pasture dev. R - L - C DoLR,SHG, DV 0.25 - 0.02 2012
Nursery raising - - L - C - DoLR, SHG, DH 0.25 - 0.02 2011
Total 38.00 2.28
Grant Total 557.00 86892 38.42
Table no. 52: Technical Details of Afforestation and Agro forestry Activities in 1ha
Particulars Value Unit
Crop Name Prosopis juliflora Acacia nilatica, Prosopis cineraria
Plant To Plant Spacing 8.00 M
Row to Row Spacing 8.00 M
Pit Length 1.00 M
Pit Width 1.00 M
Pit Depth 1.00 M
No. of Plants 156 Nos.
Plantation Area 1.00 ha.
No. of Plants per ha 1,56 Nos.
Gap Filling 20 %
Table no. 53: Cost Estimation for afforestation and Agro forestry activity in 1ha S.
No. Description No. Length
(m.) Width (m.)
Depth (m.) Unit Quantity Rate Amount

-------------------------------------------------------------------------------IWMP-IInd MAU (UP):DoLR
69
1 Digging of pits for plants 156 1 1 1 Cum 156.00 10 1560.00 2 Plants samplings for plantation in Govt. pasture area,
sampling not less than 30 cm. height 156 Nos. 156.00 10 1560.00
3 Transportation of plants from nursery to camp site up to 15Km
156 Nos. 156.00 2 312.00
4 Loading and unloading of plants 156 Nos. 156.00 2 312.00 5 Rehandling of plants from camp site to actual
planting site upto 200m. 156 Nos. 156.00 2 312.00
6 Cost of fertiliser & insecticides incl. application 156 Nos. 156.00 10 1560.00 7 Weeding and Hoeing two times (Twice in year) 156 Nos. 156.00 2.46 384.00 Total 6000.00 Table no. 54: Technical Details of Horticultural Activities in 1ha
Particulars Value Crop Name Aonla, bael Ber, Guava etc Plant To Plant Spacing 8.00 M Row to Row Spacing 8.00 M Pit Length 1.00 M Pit Width 1.00 M Pit Depth 1.00 M No. of Plants 156 Nos. Plantation Area 1.00 ha. No. of Plants per ha 1,56 Nos. Gap Filling 20 % Table no. 55 : Cost Estimation for Horticultural Activities in 1ha S. No
Description No. Length (m.)
Width (m.)
Depth (m.) Unit Quantity Rate Amount
1 Digging of pits for plants 156 1 1 1 Cum 1,56.00 10 1560.00 2 Plants samplings for plantation in Govt. pasture area,
sampling not less than 30 cm. height 156 Nos. 1,56.00 10 1560.00
3 Transportation of plants from nursery to camp site up to 15Km
156 Nos. 1,56.00 2 312.00
4 Loading and unloading of plants 156 Nos. 1,56.00 2 312.00 5 Rehandling of plants from camp site to actual planting
site upto 200m. 156 Nos. 1,56.00 2 312.00
6 Cost of fertiliser & insecticides incl. application 156 Nos. 1,56.00 10 1560.00 7 Weeding and Hoeing two times (Twice in year) 156 Nos. 1,56.00 2.46 384.00 Total 6000.00
5. PRODUCTION SYSTEM AND MICRO ENTERPRIZES (Financial out lays 13% i.e., Rs. 86.97 lacs)

-------------------------------------------------------------------------------IWMP-IInd MAU (UP):DoLR
70
PROPOSED EXTENSION STRATEGIES
The following feasible extension strategies have been proposed based on the analysis of data collected through PRA & related issues/problems in
IWMP-II - Mau district.
Strategies :
B. Improvement of productivity and income of farmers in the existing enterprises and farming system.
C. Diversification and intensification of existing farming system.
D. Sustainability in productivity/income.
E. Integrated nutrient management.
F. Integrated pest management.
G. Seed multiplication and replacement.
H. Horticulture planting material
I. Success story.
J. Natural resources management.
K. Issue for Policy consideration
L. Farm mechanization.
M. Marketing & Media strategies.
N. Human Resource Development.
O. Farmers Organization.
P. Public Private Partnership.
A. Improvement of Productivity and income fo farmers in the existing enterprises and farming system Table no. 56 : Agriculture Production

-------------------------------------------------------------------------------IWMP-IInd MAU (UP):DoLR
71
Crop Critical Gap Strategic issue Strategies
1 2 3 4 1.Wheat 2. Paddy
Yield stagnation Use of recommended seed rate, Weed management, PopularizingSeed production programme, Popularizing Organic farming
Demonstration, Exposure visits,Training
Use of untreated seeds Encouraging sowing with treated seeds Demonstration, Exposure visits,Training Un judicious use of Irrigation water
Irrigation management Demonstration, Exposure visits,Training
Imbalance use of Fertilizer To promote INM Demonstration, Soil testing, Exposure visits, - Training
Un Availability of Quality Seed In crease seed replacement ratio Promote seed production Programme
Demonstration, Exposure visits,Training
1. Improper nursery raising -Raised seed beds Demonstration, Exposure visits,Training 2. Inadequate Pest and disease management
Popularization of Integrated pest and disease management - Demonstration - Exposure visits - Training
3. Weed management Populazation of chemical Pesticide Demonstration, Exposure visits,Training 3..Maize 1. Non adoption of seed treatment Application of seed treatment Demonstration, Exposure visits,Training
2. Excess application of fertilizes Use of recommended dose of fertilizer Demonstration, Exposure visits,Training
3. Use of Micro nutrients -Use of recommended quantity of micro nutrients Demonstration, Exposure visits,Training 4. Non adoption of hand pollination practices
Following hand pollination Demonstration, Exposure visits,Training
4. Mustard 1. Higher plant population Popularization of plant population technique per Demonstration, Exposure visits,Training 2. Low production -Suitable agronomical practices will be popularized Demonstration, Exposure visits,Training 3. Imbalance use of fertilizer -Use of balanced fertilizer promote, sulpher Demonstration, Exposure visits,Training
4. Pest & disease management -Adoption of proper pest and disease management practice Demonstration, Exposure visits,Training 5. Post harvest technology
Popularization of improved storage method Demonstration, Exposure visits,Training
5. Lentil 1. Yield stagnation Timely sown, line sown, seed rate as per recommendation Demonstration, Exposure visits,Training 2. Imbalance use of fertilizers Popularization of phasphetik fertilizer Demonstration, Exposure visits,Training 3. Low quantity of F.Y.M. Use of recommended practice of F.Y.M. Demonstration, Exposure visits,Training 4. Inadequate use of sowing techniques
Use of Recommended techniques Demonstration, Exposure visits, Training
6. Sugarcane 1. Late sowing -Timely sowing Demonstration, Exposure visits, Training 2. Non application of fertilizers Application of seed treatment Demonstration, Exposure visits, Training 3. Excess application of fertilizers Use of recommended dose of fertilizer, Popularization of
recommended dose of F.Y.M./Green Manure Demonstration, Exposure visits, Training
4. Use of Micro Nutrients -Use of recommended quantity of micro nutrients Demonstration, Exposure visits, Training 5. Inadequate pest and disease management
- Adoption of IPM/IDM Demonstration, Exposure visits, Training
6. Injudicious use of water -Irrigation management Demonstration, Exposure visits, Training Table no. 57: Horticultural Production :- I. Un Identified verities Popularization of Identified Recommended verities Demonstration, Exposure visits, Training

-------------------------------------------------------------------------------IWMP-IInd MAU (UP):DoLR
72
Table no. 58:ANIMAL HUSBANDRY Animal Critical gap Strategy Activities
1 2 3 4
Cow & Bufallow
a) Artificial Insemination partial adoption of AI
a) Improving knowledge about advantage and disadvantages of AI
a) Awareness campaign b) Ensure the availability of technical staff. c) Ensure the availability of semen f) Conducting fertility improvement camps. g) Conducting camps for castration of scrub bulls at village level h) Providing wide month cry can & 1 Lit. Thermos for easy transportation of semen to remote villages
b) Unavailable of quality fodder feed. Improving the knowledge about animal production capacity and its fodder requirement
a) Organizing awareness camp about animal production capacity, its requirements and dairy economics. b) ensure the supply of good quality fodder seeds. c) Demonstration of conservation of fodder by silage making
c) Minerals & vitamins. Full gap in adoption of feeding
Motivating farmers about importance of minerals & vitamins.
a) Intensify the awareness programmers about importance of feeding minerals & vitamins by promoting stall feeding
d) Inter-calving period is long period
Awarding about “a calf a year” a) Awareness camp for reduction calving period
e) Health care gap in health care management
Providing knowledge about animal health and hygiene
a) organizing awareness programme about animal health & hygiene through trainings and field visits. b) Awareness campaign about animal health camps
f) General management Partial gap in Adoption of general. Management
Technology dissemination about animal management and its importance
a organizing awareness programme about animal management through training and field visits.
g) Average milk yield. Full gap in average milk yield. Technology dissemination about complete dairy management
By providing awareness about complete dairy m management
(1) Potato 2. No seed treatment Adoption of recommended seed treatment Demonstration, Exposure visits, Training 3. Non use of Micro nutrients -Application of recommended Micro nutrients Demonstration, Exposure visits, Training 4. Non Adoption of pest and disease management
-IDM Demonstration, Exposure visits, Training
(2) Tomato
1. No seed treatment Adoption of recommended seed treatment Demonstration, Exposure visits, Training 2. Imbalace use of fertilizers Application of recommended dose of fertilizers Demonstration, Exposure visits, Training 3. Low quantity use of F.Y.M. Adoption of recommended doseOf F.Y.M. Demonstration, Exposure visits, Training 4. Inadequate plant protection measure Popularization of recommended plant protection
techniques Demonstration, Exposure visits, Training
(3) Banana
1. Low quantity use of F.Y.M. Use of Recommended dose of F.Y.M Demonstration, Exposure visits, Training 2. No seed treatment Popularization of bio agents, Tricoderma and
Pseudomonas For seed treatments
Demonstration, Exposure visits, Training
3. Inadequate plant protection technique Popularization of plan protectiontechnique Demonstration, Exposure visits, Training

-------------------------------------------------------------------------------IWMP-IInd MAU (UP):DoLR
73
1 2 3 4
Goat, Goat & Pig, Poultry
a) Breed up gradation
Awareness about feed and fodder management
a) Providing awareness programme through training and field visits. b) Refresher training course to technical
b) Feed management Partial adoption of feed management
Awareness about feed and fodder management
a) Providing awareness programme about the feed and fodder requirement of the animal. b) Intesify the supply of fodder seeds
d) Health care -gap in health care management -non adoption of deworming schedule
-Popularizing the importance of deworming. - Providing knowledge about animal health and hygiene
a) awareness camp about importance of deworming b) Conducting deworming comps c) Organizing awareness programme about animal health and hygiene through training and field visit.
d) General Management - Partial gap in adoption of general management
- Technology dissemination about animal management and its importance
- Organizing awareness programme about animal management through training and field visit
Table no. 59: Fish Production 1. Fish
production
1 Poor ground water
resource during summer
Water storage facilities from on going schemes Linkage with credit institution
2. Silt & weed problem in existing ponds Desalting of ponds & eradication of weed Demonstration, Exposure visits, Training
3. Improper stocking measures Promotion of proper stocking measures Demonstration, Exposure visits, Training
4. Unawareness about composite fish farming Creating awareness about composite fish farming Demonstration, Exposure visits, Training
5. Improper artificial feeding Promotion of proper artificial feeding Demonstration, Exposure visits, Training
6. Marketing of fish through unorganized
sectors
To promote marketing of fish through organized
sectors
Demonstration, Exposure visits, Training
7. Unawareness about cold storage and
processing of fish
To create awareness about storing fish in cold
storage and process the fish
Demonstration, Exposure visits, Training
Table no. 60 : Details of allied/ other activities (Total of the production system and micro enterprises intervention) S.no Names of the Name of activity Type of land Executing Total target

-------------------------------------------------------------------------------IWMP-IInd MAU (UP):DoLR
74
villages agency (i) Private (ii) Community (iii) Others
(pl. specify) (i)UG
(ii) SHG Estimated cost (Rs. In lakh)
Expected month & year of
completion 1 2 3 4 5 6 7 8 9
A. PRODUCTION SYSTEM AND MICRENTERPRIZES INERVENTION (50 % BUDGET OF EACH INTERVENTION USE AS REVOLVING FUND AND 50 % USE AS TRAINING & TRAINING MATERIOALS) 1 Karisath
2B2A4c1e
(for 17 village)
Milk Collection Centre - Community - SHG 2.00 2015 Bee Keeping - Community - SHG 2.00 2015 Fruit preservation - Community - SHG 2.00 2015 Small ruminants (Goatry)
- Community - SHG 4.00 2015
Fisheries - Community - SHG 3.50 2015 Portable hatchery - - - SHG 3.00 2015 Nursery raising - Community - SHG 2.00 2015 Medicinal Plant Private - - SHG 2.50 2015 Rural craft - Community - SHG 2.00 2015 Vermi composting - Community - SHG 3.00 2015 Animal Nutrient Private - - UG 0.208 2015
Total 26.208 2015 2 Vijpura
2B2A4c2a (for 11 village)
Milk Collection Centre - Community - SHG 1.00 2015 Bee Keeping - Community - SHG 1.00 2015 Fruit preservation - Community - SHG 2.00 2015 Small ruminants (Goatry)
- Community - SHG 1.00 2015
Fisheries - Community - SHG 1.00 2015 Portable hatchery - - - SHG 1.00 2015 Nursery raising - Community - SHG 1.00 2015 Medicinal Plant Private - - SHG 1.00 2015 Rural craft - Community - SHG 1.00 2015 Vermi composting - Community - SHG 2.00 2015 Animal Nutrient Private - - UG 0.168 2015
Total 12.168 2015 3 Rewaridih
2B2A4c1g (for 5 village)
Milk Collection Centre - Community - SHG 0.50 2015 Bee Keeping - Community - SHG 0.50 2015 Fruit preservation - Community - SHG 1.00 2015 Small ruminants (Goatry)
- Community - SHG 0.50 2015
Fisheries - Community - SHG 0.50 2015 Portable hatchery - - - SHG 0.50 2015 Nursery raising - Community - SHG 0.50 2015 Rural craft Community - SHG 1.00 2015 Animal Nutient Private - - UG 0.226 2015
Total 5.226
1 2 3 4 5 6 7 8 9

-------------------------------------------------------------------------------IWMP-IInd MAU (UP):DoLR
75
4 Maidapur Samastipur 2B2A4c2b (for 13 village)
Milk Collection Centre - Community - SHG 1.00 2015
Bee Keeping - Community - SHG 0.50 2015
Fruit preservation - Community - SHG 0.50 2015
Small ruminants (Goatry)
- Community - SHG 1.00 2015
Fisheries - Community - SHG 1.00 2015
Portable hatchery - - - SHG 1.00 2015
Nursery raising - Community - SHG 1.00 2015
Medicinal Plant Private - - SHG 1.00 2015
Rural craft - Community - SHG 1.00 2015
Vermi composting - Community - SHG 1.00 2015
Animal Nutrient Private - - UG 0.75 2015
Total 9.75 2015
5 Jamalpur Mirzapur 2B2A4c1c (for 15 village)
Bee Keeping - Community - SHG 2.00 2015
Fruit preservation - Community - SHG 3.00 2015
Fisheries - Community - SHG 4.00 2015
Portable hatchery - Community - SHG 1.00 2015
Nursery raising - Community - SHG 2.00 2015
Medicinal Plant Private - - SHG 1.00 2015
Rural craft - Community - SHG 1.00 2015
Animal Nutrient Private - - UG 0.82 2015
Total 14.82 2015
6 Hazipur 2B2A4c1b (for 14 village)
Bee Keeping - Community - SHG 3.00 2015
Fruit preservation - Community - SHG 4.00 2015
Fisheries - Community - SHG 2.00 2015
Portable hatchery - Community - SHG 3.00 2015
Nursery raising - Community - SHG 3.00 2015
Medicinal Plant Private - - SHG 2.00 2015
Rural craft - Community - SHG 1.00 2015
Animal Nutrient Private - - UG 0.798 2015
Total 18.798
G. Total (for 72 village) 86.97
Table no. 61: Item wise total for the project S.no Names of the Name of activity Type of land Executing Total target
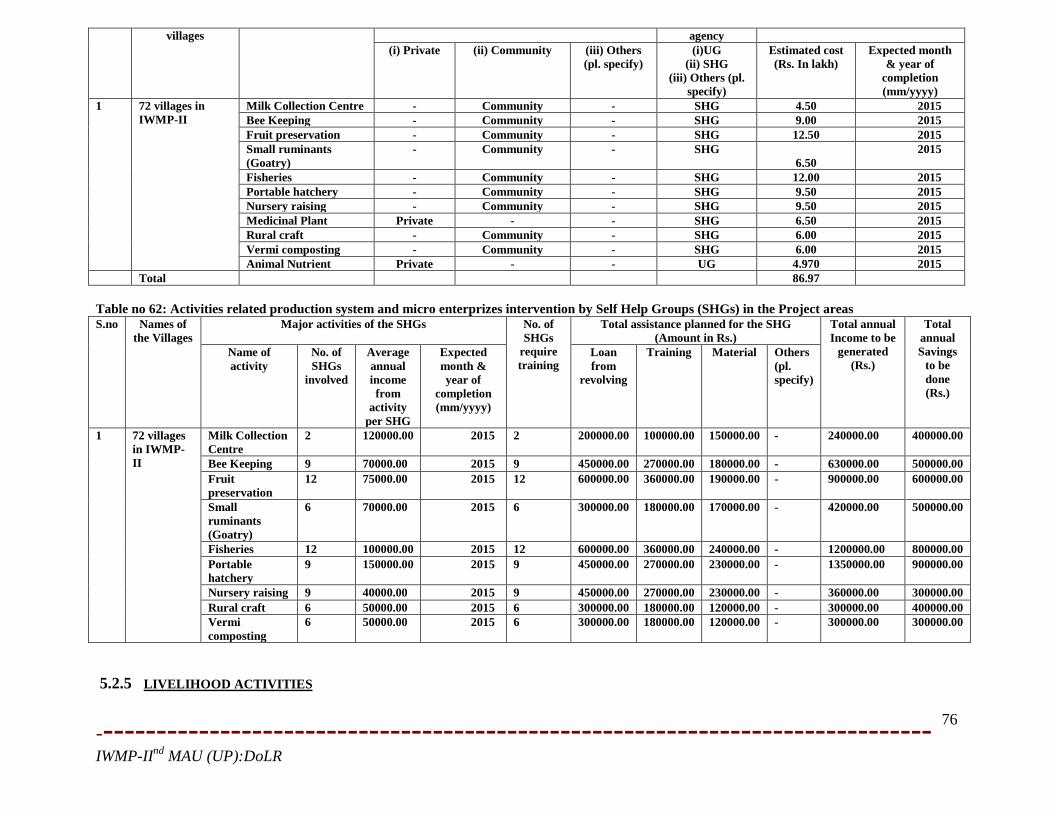
-------------------------------------------------------------------------------IWMP-IInd MAU (UP):DoLR
76
villages agency (i) Private (ii) Community (iii) Others
(pl. specify) (i)UG
(ii) SHG (iii) Others (pl.
specify)
Estimated cost (Rs. In lakh)
Expected month & year of
completion (mm/yyyy)
1 72 villages in IWMP-II
Milk Collection Centre - Community - SHG 4.50 2015 Bee Keeping - Community - SHG 9.00 2015 Fruit preservation - Community - SHG 12.50 2015 Small ruminants (Goatry)
- Community - SHG 6.50
2015
Fisheries - Community - SHG 12.00 2015 Portable hatchery - Community - SHG 9.50 2015 Nursery raising - Community - SHG 9.50 2015 Medicinal Plant Private - - SHG 6.50 2015 Rural craft - Community - SHG 6.00 2015 Vermi composting - Community - SHG 6.00 2015 Animal Nutrient Private - - UG 4.970 2015
Total 86.97 Table no 62: Activities related production system and micro enterprizes intervention by Self Help Groups (SHGs) in the Project areas S.no Names of
the Villages Major activities of the SHGs No. of
SHGs require training
Total assistance planned for the SHG (Amount in Rs.)
Total annual Income to be
generated (Rs.)
Total annual Savings
to be done (Rs.)
Name of activity
No. of SHGs
involved
Average annual income from
activity per SHG
Expected month & year of
completion (mm/yyyy)
Loan from
revolving
Training Material Others (pl. specify)
1 72 villages in IWMP-II
Milk Collection Centre
2 120000.00 2015 2 200000.00 100000.00 150000.00 - 240000.00 400000.00
Bee Keeping 9 70000.00 2015 9 450000.00 270000.00 180000.00 - 630000.00 500000.00 Fruit preservation
12 75000.00 2015 12 600000.00 360000.00 190000.00 - 900000.00 600000.00
Small ruminants (Goatry)
6 70000.00 2015 6 300000.00 180000.00 170000.00 - 420000.00 500000.00
Fisheries 12 100000.00 2015 12 600000.00 360000.00 240000.00 - 1200000.00 800000.00 Portable hatchery
9 150000.00 2015 9 450000.00 270000.00 230000.00 - 1350000.00 900000.00
Nursery raising 9 40000.00 2015 9 450000.00 270000.00 230000.00 - 360000.00 300000.00 Rural craft 6 50000.00 2015 6 300000.00 180000.00 120000.00 - 300000.00 400000.00 Vermi composting
6 50000.00 2015 6 300000.00 180000.00 120000.00 - 300000.00 300000.00
5.2.5 LIVELIHOOD ACTIVITIES

-------------------------------------------------------------------------------IWMP-IInd MAU (UP):DoLR
77
Income generating activities through self help groups for landless farmers like goat farming, poultry farming bee keeping, livestock development
activities, vocational training given with the involvement of KVK, Mau and NGOs. Financial out lays for this component is 10 % i.e., Rs 66.90 lacs, details are
given below in table.
Table no. 63 : Details of allied/ other activities (Total of livelihood intervention) S.no Names of the
villages Name of activity Type of land Executing
agency Total target
(i) Private (ii) Community (iii) Others (pl. specify)
(i)UG (ii) SHG
Estimated cost (Rs. In lakh)
Expected month & year of
completion (mm/yyyy)
1 2 3 4 5 6 7 8 9 A. PRODUCTION SYSTEM AND MICRENTERPRIZES INERVENTION (50 % BUDGET OF EACH INTERVENTION (EXCEPT CROP DEMONSTRATION, MEDICINAL PLANT, HORTICULTURE) USE AS REVOLVING FUND AND 50 % USE AS TRAINING & TRAINING MATERIOALS) 1 Karisath
2B2A4c1e
(for village)
Crop demonstration Private - - UG 4.00 2015 Medicinal plant Private - - UG 2.00 2015 Horticulture Private - UG 2.00 2015 Nursery raising Private - - UG 1.00 2015 Fruit preservation - Community - SHG 3.00 2015 Rural craft - Community - SHG 3.00 2015 Goatery Community SHG 2.00 2015 Piggery Community SHG 3.00 2015 Animal Nutrient Private - - UG 0.160 2015
Total 20.160 2015 2 Vijpura
2B2A4c2a (for village)
Crop demonstration Private - - UG 1.00 2015 Medicinal plant Private - - UG 1.00 2015 Horticulture Private - UG 2.00 2015 Nursery raising Private - - UG 1.00 2015 Fruit preservation - Community - SHG 1.00 2015 Rural craft - Community - SHG 1.00 2015 Goatery Community SHG 1.00 2015 Piggery Community SHG 1.00 2015 Animal Nutrient Private - - UG 0.36 2015
Total 9.36 2015 3 Rewaridih
2B2A4c1g (for village)
Crop demonstration Private - - UG 0.50 2015 Medicinal plant Private - - UG 0.50 2015 Horticulture Private - UG 0.50 2015 Nursery raising Private - - UG 0.50 2015 Fruit preservation - Community - SHG 0.50 2015 Rural craft - Community - SHG 0.50 2015 Goatery Community SHG 0.50 2015 Piggery Community SHG 0.50 2015 Animal Nutrient Private - - UG 0.02 2015
Total 4.02
1 2 3 4 5 6 7 8 9

-------------------------------------------------------------------------------IWMP-IInd MAU (UP):DoLR
78
4 Maidapur Samastipur 2B2A4c2b (for village)
Crop demonstration Private - - UG 1.00 2015 Medicinal plant Private - - UG 1.00 2015 Horticulture Private - UG 1.00 2015 Nursery raising Private - - UG 1.00 2015 Fruit preservation - Community - SHG 0.50 2015 Rural craft - Community - SHG 1.00 2015 Goatery Community SHG 0.50 2015 Piggery Community SHG 1.00 2015 Animal Nutrient Private - - UG 0.5 2015
Total 7.50 2015 5 Jamalpur
Mirzapur 2B2A4c1c (for village)
Crop demonstration Private - - UG 1.00 2015 Horticulture Private - UG 1.00 2015 Fruit preservation - Community - SHG 5.00 2015 Rural craft - Community - SHG 3.00 2015 Piggery Community - SHG 1.00 2015 Animal Nutrient Private - - UG 0.4 2015
Total 11.40 2015 6 Hazipur
2B2A4c1b (for village)
Crop demonstration Private - - UG 3.00 2015 Horticulture Private - UG 5.00 2015 Fruit preservation - Community - SHG 4.00 2015 Rural craft - Community - SHG 1.00 2015 Piggery Community - SHG 1.00 2015 Animal Nutrient Private - - UG 0.40 2015
Total 14.46 G. Total (for 72 village) 66.90 Table no. 64: Item wise total for the project S.no Names of the
villages Name of activity Type of land Executing
agency Total target
(i) Private (ii) Community (iii) Others (pl. specify)
(i)UG (ii) SHG
(iii) Others (pl. specify)
Estimated cost (Rs. In lakh)
Expected month & year of
completion (mm/yyyy)
8 72 villages in IWMP-II
Crop demonstration Private - - UG 10.50 2015 Medicinal plant Private - - UG 4.50 2015 Horticulture Private - UG 11.50 2015 Nursery raising Private - - UG 3.50 2015 Fruit preservation - Community - SHG 14.00 2015 Rural craft - Community - SHG 9.50 2015 Goatery Community SHG 4.00 2015 Piggery Community SHG 7.50 2015 Animal Nutrient Private - - SHG 1.96 2015
Total 66.96 Table no. 65: Activities related to livelihoods by Self Help Groups (SHGs) in the Project areas
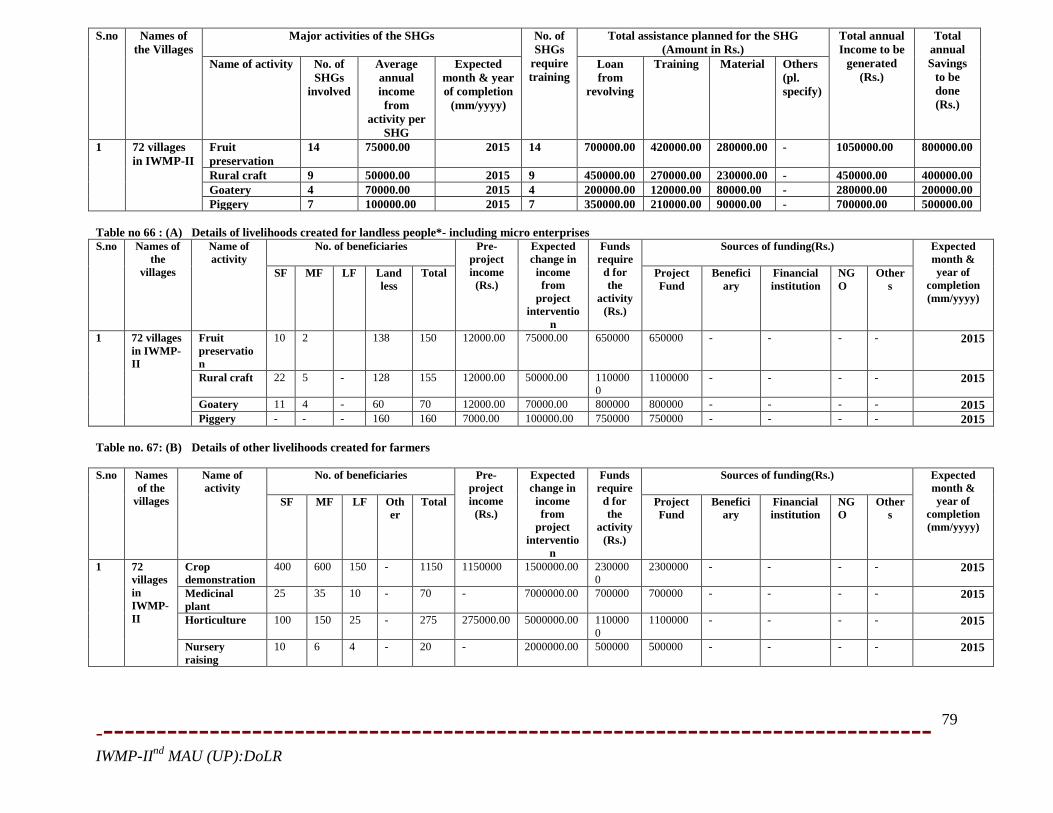
-------------------------------------------------------------------------------IWMP-IInd MAU (UP):DoLR
79
S.no Names of the Villages
Major activities of the SHGs No. of SHGs
require training
Total assistance planned for the SHG (Amount in Rs.)
Total annual Income to be
generated (Rs.)
Total annual Savings
to be done (Rs.)
Name of activity No. of SHGs
involved
Average annual income from
activity per SHG
Expected month & year of completion
(mm/yyyy)
Loan from
revolving
Training Material Others (pl. specify)
1 72 villages in IWMP-II
Fruit preservation
14 75000.00 2015 14 700000.00 420000.00 280000.00 - 1050000.00 800000.00
Rural craft 9 50000.00 2015 9 450000.00 270000.00 230000.00 - 450000.00 400000.00 Goatery 4 70000.00 2015 4 200000.00 120000.00 80000.00 - 280000.00 200000.00 Piggery 7 100000.00 2015 7 350000.00 210000.00 90000.00 - 700000.00 500000.00
Table no 66 : (A) Details of livelihoods created for landless people*- including micro enterprises S.no Names of
the villages
Name of activity
No. of beneficiaries Pre-project income
(Rs.)
Expected change in
income from
project interventio
n
Funds require
d for the
activity (Rs.)
Sources of funding(Rs.)
Expected month & year of
completion (mm/yyyy)
SF MF LF Land less
Total Project Fund
Beneficiary
Financial institution
NGO
Others
1 72 villages in IWMP-II
Fruit preservation
10 2 138 150 12000.00 75000.00 650000 650000 - - - - 2015
Rural craft 22 5 - 128 155 12000.00 50000.00 1100000
1100000 - - - - 2015
Goatery 11 4 - 60 70 12000.00 70000.00 800000 800000 - - - - 2015 Piggery - - - 160 160 7000.00 100000.00 750000 750000 - - - - 2015
Table no. 67: (B) Details of other livelihoods created for farmers S.no Names
of the villages
Name of activity
No. of beneficiaries Pre-project income
(Rs.)
Expected change in
income from
project interventio
n
Funds require
d for the
activity (Rs.)
Sources of funding(Rs.)
Expected month & year of
completion (mm/yyyy)
SF MF LF Other
Total Project Fund
Beneficiary
Financial institution
NGO
Others
1 72 villages in IWMP-II
Crop demonstration
400 600 150 - 1150 1150000 1500000.00 2300000
2300000 - - - - 2015
Medicinal plant
25 35 10 - 70 - 7000000.00 700000 700000 - - - - 2015
Horticulture 100 150 25 - 275 275000.00 5000000.00 1100000
1100000 - - - - 2015
Nursery raising
10 6 4 - 20 - 2000000.00 500000 500000 - - - - 2015

-------------------------------------------------------------------------------IWMP-IInd MAU (UP):DoLR
80
5.2.6 Marketing linkage The direct livelihood activities need good forward and backward support. Without such support system the activities may fail to deliver the desired results. These linkages would involve credit, machinery, input supply, marketing, etc. Table no. 68: Backward and Forward Linkage S. No. Project Type of Marketing Facility Pre-project (no.) During the project (no.) Post-project (no.) 1 IWMP-II Backward linkages
Seed certification 1 1 1 Seed supply system 30 32 48 Fertilizer supply system 12 18 20 Pesticide supply system 6 6 10 Credit institutions Bank-5 Bank-7 Bank-10 Water supply - - - Extension services 3 3 12 Nurseries 1 1 12 Tools/machinery suppliers - - 2 Price Support system - - 4 Labour - - - Any other (please specify) - - - Forward linkages Harvesting/threshing machinery 4 8 12 Storage (including cold storage) 1 1 4 Road network Transport facilities - - - Markets / Mandis 8 9 12 Agro and other Industries 1 5 6 Milk and other collection centres - 2 6 Labour - - - Hatchery (Portable) - 5 8 Vermi-compost unit - 2 5 Animal Mineral Mixture - - 50 gm/day/animal
5.3 Convergence Planning for various activities 5.3.1 Earthen bund, contour bund, percolation tank, injection well will be made in watershed area convergence with MNREGS 5.3.2 Soil health card, crop demonstration, kisan gosthi, kisan mela, farmer’s school also organized in watershed area under many scheme of
department of Agriculture. 5.3.7 Composite fish farming or mixed fish farming popularized in this area with Department of fisheries. 5.3.8 Animal health camp, fodder development, vaccination work also made through Veterinary Department. 5.3.9 Aforestation in project area also done with Forest Department. 5.3.10 Dry land horticulture also convergence with department of horticulture. Table no. 69: Details of Convergence of other Schemes in the Project area with IWMP-II Project S.No. Name of the MW Names of
Departments with Fund made available to
Was this fund included in Rs. 12,000/15,000
Name of activity/task/structure
Reference no. of activity/task/structure in
Level at which decision for

-------------------------------------------------------------------------------IWMP-IInd MAU (UP):DoLR
81
Schemes converging with
IWMP-II*
IWMP-II project due to convergence (Rs. In lakh)
Per ha undertaken with converged funds
DPR convergence was taken $
Yes No (a) Structures (b) Livelihoods (c) Production System
1 KARISATH 2B2A4c1e
MNREGS 20.00 NO a 5 DRDA DA 0.40 No b, c 5 PIA DHO 0.10 No b, c 5 PIA DF 0.20 No b, c 5 PIA F 0.30 No b, c 5 PIA
Total 21.00 No 2 VIJPURA
2B2A4c2a MNREGS 23.00 No a 5 DRDA DA 1.50 NO b, c 5 PIA DHO 0.30 No b, c 5 PIA DF 0.40 No b, c 5 PIA F 0.30 No b, c 5 PIA
Total 25.50 No 3 REWARIDIH
2B2A4c1g MNREGS 11.00 No a 5 DRDA DA 1.70 No b, c 5 PIA DHO 0.50 NO b, c 5 PIA DF 0.50 No b, c 5 PIA F 0.30 No b, c 5 PIA
Total 19.00 No 4 MAIDAPUR
SAMASTIPUR 2B2A4c2b
MNREGS 13.00 No a 5 DRDA DA 1.40 No b, c 5 PIA DHO 0.30 No b, c 5 PIA DF 0.40 NO b, c 5 PIA F 0.45 No b, c 5 PIA
Total 15.55 No 5 JAMALPUR
MIRZAPUR 2B2A4c1c
MNREGS 8.00 No a 5 DRDA DA 0.50 No b, c 5 PIA DHO 0.20 No b, c 5 PIA DF 0.20 No b, c 5 PIA F 0.20 No b, c 5 PIA
Total 9.10 No
6 HAZIPUR 2B2A4c1b
MNREGS 8.00 No a 5 DRDA DA 0.50 No b, c 5 PIA DHO 0.20 No b, c 5 PIA DF 0.20 No b, c 5 PIA F 0.20 No b, c 5 PIA
Total 9.10 No Grand Total 99.25
# only letter (a) or (b) or (c) needs to be filled. In case more than one activity has been undertaken all the concerned letters may be indicated e.g. (a) + (b) $ WC/GP/WDT/PIA/DRDA cell/ZP/DPC/SLNA / DoLR- only initials as indicated here need to be entered. * DA= Department of Agriculture, DHO= Department of Horticulture, VO= Department of Veterinary, DF= Department of Fisheries, F= Forest

-------------------------------------------------------------------------------IWMP-IInd MAU (UP):DoLR
82
6. CAPACITY BUILDING PLAN Capacity Building is the process of assisting the group or individuals to identify and address issues and gain the insights,
knowledge and experience needed to solve problems and implement change. There is a realization in the development sector that there is a need to appraise the success of development interventions by
going beyond the conventional development targets and measures of success (e.g. in the form of commodities, goods and services) to take into account improvements to human potential. Capacity building of stakeholders is also increasingly viewed as an important factor in developmental projects that involve participation of stakeholders at all levels for effective implementation of projects. 6.1 Scope of capacity building at IWMP-II
• Alternative Land Use Plan • Scientific technique of Soil and Moisture conservation • Improved and Scientific agriculture practices • Fodder development and Management • Afforestation • Meteorological Information • Dairy Development and Management • Rural Craft • Income Generation Activities • Stitching • Food Processing • Post Harvest management practices • Fish Production
Capacity building and training are the most important components of watershed management programme both for the field level project staff/ officers and functionaries of people institutions i.e. watershed community. Apart from enhancing technical skill of the project staff, this would also provide opportunities to community members to develop their capacity as the feature custodians of the programmes after project’s withdrawal. IWMP-II - MAU financial outlay for capacity buildings is 5% (Rs. 33.45) of the total project cost and out of which Rs 1.45 will be expanded for initiation of village level institution. 6.2 Table no 70 : Capacity Building activities in the project

-------------------------------------------------------------------------------IWMP-IInd MAU (UP):DoLR
83
S.No. Project Stakeholders
Total no. of persons
No. of persons trained so far
No. of persons of be trained
during current financial year
Sources of funding for training Name and Address of the Institute where Trained
a) DoLR b) any other (pl. specify)
1 PIAs 6 2 8 DoLR KVK, GSP,GKSS 2 WDTs 32 12 32 DoLR KVK, GSP,GKSS 3 UGs 155 52 155 DoLR KVK, GSP,GKSS 4 SHGs 180 42 180 DoLR KVK, GSP,GKSS 5 WCs 17 5 17 DoLR KVK, GSP,GKSS 6 GPs 22 - 22 DoLR KVK, GSP,GKSS 7 Community 1200 - 1200 DoLR KVK, GSP,GKSS 8 Others (pl. specify) 6.3 Table no 70.1: Detail of activities undertaken Strategy Proposed activity No. of Units Unit cost Total Cost
Capacity building Activities Stakeholders - Scientists Interaction, 15 0.10 1.00 Training (2 days) 100 0.05 5.00 Vocational/employment Generation Training (5-10 days) 75 0.10 7.50 In-service Training. (3 days) 25 0.10 2.50 Exposure visit within State 5 0.20 1.00 Exposure visit out of State 12 0.50 6.00 Field days 10 0.30 3.00 Workshop 2 1.00 2.00
Total 28.00 6.4 Table no 70.2 : Information, Education & Communication (IEC) activities in the project area
S.no. Activity Executing agency Estimated expenditure (Rs.) Expected Outcome (may quantify wherever possible)
1 Street plays Local Drama Groups 100000.00 Awareness about importance of watershed project 2 Video Shows IWMP-II, Mau 100000.00
3 Pamphlets and Poster IWMP-II, Mau 100000.00 4 Banners and Hoardings IWMP-II, Mau 100000.00 Total 400000.00

-------------------------------------------------------------------------------IWMP-IInd MAU (UP):DoLR
84
7. PHASING OF PROGRAMMES AND BUDGETING 7.1 FUNDING OF THE PROJECT
Table no. 72 : Funding for the IWMP-II Project * (All financial figures in lakh Rs.) S.No. Names
of Project
IWMP-II fund Funds from other sources in addition to IWMP-II funds Total Central share
State share
Convergence funds
PPP Community Institutional finance Others (pl. specify)
Name of
Scheme
Amount Name of
Private sector
Financial contribution
Name Financial contribution
Name Financial contribution
Name Financial contribution
1 IWMP-II
MAU
669.00 - * 99.25 - - - - - - - - 768.25
*For detail please see table no. 69 it is additional budget and not included in fund budget (Rs. 12000.00). this budget will be use in watershed area according requirement and need during work phase by PIA.
7.2 YEAR WISE PHASING OF WORK (Physical and Financial)
Phasing of various works/ activities during different year of the project for treatable area 6839 ha out of proposed area 7598ss ha presented in table
Table no. 73: COMPONENT WISE AND YEAR WISE PHASING OF PHYSICAL AND FINANCIAL OUT LAY (All financial figures in lakh Rs.)
S.N. Particulars 1st Year (2010-11)
2ndYear (2011-12)
3rd Year (2012-13)
4th Year (2013-14)
5th Year (2014-15)
Total
Finncial lac
Phy. Hc
Finncial lac
Phy. Hc
Finncial lac
Phy. Hc
Finncial lac
Phy. Hc
Finncial lac
Phy. Hc
Finncial lac
Phy. Hc
1 2 3 4 5 6 7 8 9 10 11 12 13 14 1 Administration
Cost 10% 3.345 To meet out the
administrative works/charges
10.035 As per column 4
18.063 As per column 4
18.063 As per column 4
17.394 As per column 4
66.90 As per column 4
2 Monitoring 1%
monitoring of the project
1.338 As per column 4
1.338 As per column 4
1.338 As per column 4
2.676 As per column 4
6.69 As per column 4
3 Evaluation 1% Evaluation of the project
2.007 As per column 4
1.17075 As per column 4
1.17075 As per column 4
2.3415 As per column 4
6.69 As per column 4

-------------------------------------------------------------------------------IWMP-IInd MAU (UP):DoLR
85
1 2 3 4 5 6 7 8 9 10 11 12 13 14 4 Entry point
Activities 4% 26.76 Renovation of
Culvert, well soaking pit kishan vikas manch etc.
As per column 4
As per column 4
As per column 4
As per column 4
26.76 As per column 4
5 Institution & Capacity Building 5%
3.345 Training Of DPR 16.725 As per column 4
5.0175 As per column 4
5.0175 As per column 4
3.345 As per column 4
33.45 As per column 4
6 DPR 1% 6.69 Preparation of DPR
As per column 4
As per column 4
As per column 4
As per column 4
6.69 As per column 4
7 Watershed Dev. Works 50%
Construction of Soil and water recharging structure Agro forestry horticulture etc.
50.175 836.25 103.695 1728.25 97.005 1616.75 83.625 1393.75 334.5 5575
8 Livelihood Activities 10%
Nadef compost unit, Dairy/Goat,Poultry General merchant etc.
6.69 As per column 4
26.76 As per column 4
20.07 As per column 4
13.38 As per column 4
66.90 As per column 4
9 Productiion System & micro Enterprises 13%
farming system approach animal husbandry activates, horticulture, vegetables growing, medicinal plants, Floriculture etc.
6.0879 As per column 4
26.9607 As per column 4
33.0486 As per column 4
20.0031 As per column 4
86.97 As per column 4
10 Consolidation Phase
Consolidation activites
As per column 4
As per column 4
As per column 4
33.45 As per column 4
33.35 As per column 4
Total 40.14 93.0579 836.25 183.00495 1728.25 175.71285 1616.75 176.2146 1393.75 668.90 5575
Table no. 74:ABSTARACT OF COMPONENT WISE WORK AND FINANCIAL OUTLAY OF THE SELECTED 5 WATERSHED S.No. Component Total (Rs. in Lakhs)

-------------------------------------------------------------------------------IWMP-IInd MAU (UP):DoLR
86
S.No. Component Total (Rs. in Lakhs) 1 A
Administration Cost TA & DA, POL/Hiring of vehicles/office and payment of electricity and phone bill etc, computer, stationary and office consumable and Contingency.
66.90
B Monitoring 6.69 C Evaluation 6.69 Sub Total 80.28 2 A
Preparatory Phases Entry Point activities, like improvement of drinking water system, repairing & Renasation Bundhies, check dam and school Activities & const/repair of culverts.
26.76
B Capacity Building 33.45 C Preparation of DPR 6.69 Sub Total 66.90 3 WATERSHED WORKS 334.50 A Soil and Moisture Conservation Contour Bund 60.50
Graded Bund 51.93 Gully Plug 14.40 B Water Resource Development Water harvesting Bundhi, Farm ponds, check dam injection well, open well, bore well etc 169.25 C Agro-forestry & Horticulture Agro-forestry 11.526 Horticulture 26.894 Sub Total 334.50 4 Livelihood Activities
Income generation Activities through SHGs for landless and Marginal formers (Goat farming, Bee keeping, Candle making, Dona Pattal making and live stock development Activities, Rope & Basket Making)
66.90
Sub Total 66.90 5 Production system & Micro enterprises
Demonstration and assessment of of improved composting system. i. Seed ii. Chemical Fertilizer/Bio Fertilizer iii. Pest control iv. Advance Agriculture Equipment v. Production of Compost
86.97
Sub Total 86.97 6 Consolidation Phase 33.45 Sub Total 33.45 Grand Total 669.00

-------------------------------------------------------------------------------IWMP-IInd MAU (UP):DoLR
87
8. CONSOLIDATION/EXIT STRATEGY
8.1 Quality and Sustainability Issues
8.1.1 Plans for Monitoring and Evaluation
A Web-based GIS System is being developed for monitoring and evaluating the project in its planning & implementation
phases. The system would be available on a public domain and can be accessed by all the stakeholders of the project. The system
shows the entire state of Uttarpratesh and all of those areas selected over the next 18 years. Filtering allows the user to zoom onto one
particular project. Details related to soil type, Land-use classification, inhabitation etc., can be obtained village-wise. Furthermore,
survey-number wise details related to ownership, irrigation source, yield etc., can also be accessed by the users of the system. This
system is being used for pooling up the details obtained from the DPR. In other words, the DPR is made available online in the form
of a database which will help the stakeholders know areas of importance viz., already treated areas/historical works in the area,
proposed areas for treatment etc., for further treatment and planning. The system would also show the satellite imageries of various
years from the project inception stage to the project closing stages. This allows the user to evaluate the effectiveness of the treatment
and thereby plan corrective measures for the project area. The system would serve as an aiding tool to the planners and evaluators for
judging the efficacy of the project.
Yet another component of the Web-based GIS system is the Mobile based Monitoring & Evaluation System, which will help the
ground staff alias WDTs (Watershed Development Team) to transmit information from the ground level to the central server. Also,
any higher-up official in charge of the project can obtain information regarding the project area on their mobile phone by means of an
SMS. The system works in the following manner. The WDT equipped with a GPS instrument marks the latitude-longitude information
of various treatment areas during the DPR. The probable sites are then transferred onto the central server. During the works phase, any
progress in the treatment areas is reported to the server by means of an SMS by the WDT. Similarly, any nodal officer or higher-up
official can view the progress in a project by means of summarized reports generated over frequent periods of time.

-------------------------------------------------------------------------------IWMP-IInd MAU (UP):DoLR
88
8.1.2 Plans for Project management:
The Project management of any watershed programme is very important. It mainly depends upon the community organization
and the village level institutes in IWMP-II Mau watershed committee and various user group have been formulated for post project
operation and maintenance of assets created during project period. Major emphasis will be on equity and sustainable benefit of the
project even after implementation stage. A proper link-up will be built during project period with various institutes and capacity
building organization. They will act as a major kingpin during post implementation for scaling up the successful experience during
project.
8.1.3 Watershed Development Fund:
The major source of financial assistance after post implementation period is watershed Development Fund. The contribution of
it will comes mainly fund the following:Attention:
8.1.4 User Charges:
Various user groups will be formed in village. These user groups will collect user charges according to the designated rules
formed during the formation of user group. These funds will be transferred to the WDF funds as per these formulated rules. The
secretary of watershed committee (WC) shall maintain the records of the following.

-------------------------------------------------------------------------------IWMP-IInd MAU (UP):DoLR
89
8.2 Activities in the CPRs in the project area Table no. 75: Details of activities in the CPRs in the Project areas
S.no Name (s) of the villages
CPR particulars
Activity Proposed Target Target area under the
activity (ha)
Estimated expenditure
(laks.)
Expected no. of beneficiaries
Estimated contribution to
WDF (Rs.)
Expected month & year of
completion 1 Karisath Wasteland Engineering work 60.00 3.60 240 18000.00 2015
Forest Afforesttion 25.00 1.50 100 7500.00 2013 Pasture Land development 4.00 0.24 60 1200.00 2013 Orchard Horticulture 10.00 0.60 180 3000.00 2013 Village Pond Moisture onservation 2 no 2.00 140 10000.00 2012 Total 99.00 10.94 720 54700.00 2012
2 Vijpura Wasteland Engineering work 110.00 6.60 440 33000.00 2015 Forest Afforesttion 25.00 1.50 100 7500.00 2013 Pasture Land development 3.00 0.18 92 1000.00 2013 Orchard Horticulture 10.00 0.60 192 3000.00 2013 Village Pond Moisture
Conservation 2 no 2.00 140 10000.00 2012
Total 148.00 13.88 964 69400.00 2012 3 Rewaridih Wasteland Engineering work 82.50 4.95 290 24750.00 2015
Forest Afforesttion 22.00 1.32 82 7000.00 2013 Pasture Land development 5.00 0.30 75 1500.00 2013 Orchard Horticulture 10.00 0.60 192 3000.00 2013 Village Pond Moisture onservation 2 no 2.00 140 10000.00 2012
4 Maidapur Samstipur Total 122.50 7.35 779 36750.00 2012 Wasteland Engineering work 102.00 6.12 350 24750.00 2015 Forest Afforesttion 45.00 2.70 188 13500.00 2013 Pasture Land development 3.00 0.18 70 1000.00 2013 Orchard Horticulture 10.00 0.60 180 3000.00 2013 Village Pond Moisture onservation 3 no 3.00 152 10000.00 2012 Total 160.00 14.60 940 73000.00 2012
5 Jamalpur Mirzapur Wasteland Engineering work 42.70 2.56 295 12800.00 2015 Forest Afforesttion 5.00 0.30 78 1500.00 2013 Pasture Land development 2.00 0.12 12 600.00 2013 Orchard Horticulture 3.00 0.18 70 1000.00 2013 Village Pond Moisture onservation 2 no 2.00 140 10000.00 2012 Total 52.70 5.16 595 25800.00 2012
6 Hazipur Wasteland Engineering work 42.70 2.56 295 12800.00 2012 Forest Afforesttion 5.00 0.30 78 1500.00 2015 Pasture Land development 2.00 0.12 12 600.00 2013 Orchard Horticulture 3.00 0.18 70 1000.00 2013 Village Pond Moisture onservation 2 no 2.00 140 10000.00 2013 Total 52.70 5.16 595 25800.00 2012

-------------------------------------------------------------------------------IWMP-IInd MAU (UP):DoLR
90
8.3 Sustainability and environment security
In the proposed watershed management plan of watershed, proper blending of bio engineering measures will be applied on
60% of the total watershed area, Bases on the results of studies conducted in this region, it is estimated that more than 50% of the
watershed area will be treated and consequently the soil loss and runoff from the area is expected to be reduced by 70% and 65%,
respectively, The proposed land use plan will improve the land utilization index and crop diversification index signification index
significantly as compared to the existing one. It will help in maintaining ecosystem integrity on sustained basis along with improving
the livelihood security of the farming community.
8.4 Economic Analysis
Economic analysis of the project was carried by taking direct benefits and costs considering 25 years project life at 10 percent
discount rate for this purpose of economic analysis. Whole watershed development plan was divided into three sector namely
agriculture, horticulture and forest/Fuel wood plantation, Benefit Cost ratio (BC ratio) criteria was employed to judge the economic
efficiency of each enterprise and sector.
8.4.1 Agriculture
At present agriculture is being done on well maintained field, therefore, the development cost can be recovered within few year
as it does not require much investment. Horticultural plantations of dry land fruit will be done on 74 ha of land with a proposed BC
ratio of 1.85:1 Agro-forestry which not practiced in the watershed area will be promoted on 170 ha land with a proposed BC ratio of
1.85:1.
Table no. 76: Proposed economics of agriculture sector

-------------------------------------------------------------------------------IWMP-IInd MAU (UP):DoLR
91
S.No. Sector Area (ha) NPV (Rs.) BC ratio
1 Agriculture 6758.00 92150000 1.55:1
2 Horticulture 390.00 1690000 1.52:1
3 Agro-forestry 167.00 220100 1.85:1
Table no. 76.1: Economics of agriculture sector
S.No. Sector Area (ha.) NPV (Rs.) BC ratio
1 Irrigated agriculture 1525.00 93745610 1.7 ;1
2 Rainfed agriculture 5233.00 15631828 1.3:1
Total 6758.00 109377438 1.5:1
8.4.2 Horticulture
Economic analysis of horticulture plantation in agri-horti system at IWMP-II watershed Project life is considered to be 25 years and discount rate for NPV estimation is 10% Table no. 77: Economics of Horticulture sector
S.No. Common name Scientific name Area (ha) NPV of net Benefit BC ratio
1 Aonla Embelica officinalis 190.00 1857725 3.97:1
2 Ber Zyziphus mauritiana 100.00 1251962 2.81:1
3 Beil Aegle marmelos 100.00 1069887 2.84:1
Total - 390.00 4179574 -

-------------------------------------------------------------------------------IWMP-IInd MAU (UP):DoLR
92
8.4.3 Forest/ Fuel wood plantation
Economic analysis of fuel wood plantation at IWMP-II watershed. Project life is considered to be 25 years and discount rate
for NPV estimation is 10%
Table no. 78: Economics of aforestation sector
S.No. Common name Scientific name Area (ha) NPV of net benefit (Rs.) BC ratio
1 Vilayati Babul Pongamoa glabra 167.00 736427 2.11:1
8.4.4 Food sufficiency
Achieving self sufficiency in food production is one of the prime objectives of the project. The status of food requirement and
production before and after the project is presented in Table.
Table no 79: Status of food requirement and availability per annum in IWMP-II watershed
S.No. Items Requirement (q/yr) Before project Proposed
Deficit or surplus (q/yr)
Availability (q/yr)
Availability (q/yr)
Deficit or surplus (q/yr)
1 Cereals 150000 -34300 115700 162460 +12460
2 Pulses 30000 -10000 20000 40800 +10800
3 Oilseeds 20000 -10000 10000 38000 +18000
4 Vegetable 50004 -19996 70000 80020 +30016

-------------------------------------------------------------------------------IWMP-IInd MAU (UP):DoLR
93
9. EXPECTED OUTCOMES 9.1 Employment
Employment has always been a problem in the village. The principal occupations of the people are dry land agriculture, animal husbandry and casual labour work. However, rain fall being very limited and erratic, agriculture suffers, i.e. at best they can take only a single crop, which keeps them partially engaged for about 4 months. Lack of fodder makes animal husbandry very difficult too. So, animal husbandry does not keep them engaged full time. Thus the people mainly depend upon casual labour, either in the village itself or outside it.
The project plans for creation of both wage employment and self employment opportunities. Wage employment would be created by engaging people in watershed physical works like construction of earthen bunds, farm bunds, village pond, plantation, etc. Self employment would be created by providing the people with cash support in the form of direct livelihood activities like agriculture, animal husbandry and enterprise development. Table no. 80: Employment in Project area S.no. No. of
the villages
Wage employment Self employment No. of man days No. of beneficiaries No. of beneficiaries
SC ST Others Women Total SC ST Others Women Total SC ST Others Women Total 1 72
(IWMP-II )
1.70 - 1.10 0.32 3.12 800 6 2500 220 3520 80 10 32 25 137
9.2. Migration
Low rainfall results in very little fodder availability in the locality.. On account of agriculture and animal husbandry providing only part time employment for some part of the year, the people migrate for a better half of the year for wage labour. Employment opportunities in the local area as mentioned above will ensure lessening seasonal migration from the area. Table no. 81: Details of seasonal migration from Project area S.no. Names of villages No. of persons
migration
No. of days per
year of
migration
Major reason(s)
for migration
For reduced migration identify
major activities of IWMP-II
responsible
Expected
reduction in No.
of persons
migration (a) Structures (b) Livelihoods
1 IWMP-II (72 village) 5900 180 Due to
employment
Structure Livelihood 3800

-------------------------------------------------------------------------------IWMP-IInd MAU (UP):DoLR
94
9.3 Drinking water As a result of the watershed activities, it is expected that the quantity and quality of drinking water would improve.
Table no. 82: Status of Drinking water
S. No. Names of Villages Availability of drinking water (no. of months in a year)
Quality of drinking water Comments
Pre-project Expected Post project Pre-project Expected Post-project
1 IWMP-II (72 village) 10 month 12 month General water Good water -
9.4 Vegetative cover
There is negligible area under tree cover. The village has a negligible forest area which consists of only Juliflora Prosopis
(babool). Trees like Neem and _Alianthus_are seen just here and there, not concentrated in any area.
It is planned that 167.00 ha land to be covered under new plantation.
Table no. 83: Forest/vegetative cover
S. No. Name of Village Existing area under tree cover (ha) Area under tree cover proposed
1 IWMP-II (72 village) - 167.00 9.5 Livestock
The village has quite a good of livestock population. These include cows, bullocks, buffaloes, goats, sheep and camels. The
interventions like provision of good quality cows and buffaloes, the establishment of a fodder bank and other such related activities
would spur up the dairy development in the village. It is expected that the post project period would see a substantial increase in
livestock population and yield from them.
Table no. 84: Details of livestock in the project areas (for fluids please mention in litres, for solids please mention in kgs. and income in Rs.)

-------------------------------------------------------------------------------IWMP-IInd MAU (UP):DoLR
95
S. no.
Name of MW Type of animal Pre Projected Expected Post Projected No Yield Income No Yield Income
1 IWMP-II (72 village)
Buffalow 12108 2.33lit/animal 20.00/day 15780 4.00lit/animal 30.00/day Cow 10157 1.84lit/animal 16.00/day 14840 3.004lit/animal 25.00/day Sheep 1846 10kg/animal 2000.00/animal 5000 20kg/animal 4000.00/animal Goats 24623 8 kg/animal 1600.00/animal 34850 16 kg/animal 3200.00/animal Pigs 1692 20.0 kg/ha 2000.00/animal 5000 50.0 kg/ha 10000.00/animal Poultry 14395 0.75kg/bird 150.00/bird - 0.75kg/bird 300.00/bird Fish - 10.73 q/ha 15000.00/ha - 50.00 q/ha 75000.00/ha
9.6 Vegetation/ crop related outcomes: Table no. 85: Details of karif drop area and yield in the project areas
S.No. Names of villages Name of crops
Pre-project Expected Post-project Area (ha) Average Yield
(Qtl) per ha. Total Production (Qtl) Area (ha) Average Yield
(Qtl) per ha. Total
Production (Qtl) Irri Rf. Irri Rf. Irri Rf. Irri Rf. Irri Rf. Irri Rf.
1 Karisath Paddy 224 448 18.00 10.00 4032 4480 550 574 30.00 20.00 16500 11440 Others* - 1200 - 8.00 - 9600 - 1000 - 15.00 - 15000
2 Vijpura Paddy 185 409 18.00 10.00 3330 4090 550 593 30.00 20.00 16500 11860 Others* - 1000 - 8.00 - 8000 - 600 - 15.00 - 9000
3 Rewaridih Paddy 171 246 18.00 10.00 3078 2460 400 231 30.00 20.00 12000 4620 Others* - 600 - 8.00 - 4800 - 500 - 15.00 - 7500
4 Maidapur
Samastipur Paddy 198 518 18.00 10.00 3564 5180 700 642 30.00 20.00 21000 12840 Others* - 1500 - 8.00 - 12000 - 1000 - 15.00 - 15000
5 Jamalpur
Mirzapur Paddy 94 96 18.00 10.00 1692 960 300 74 30.00 20.00 9000 1480 Others* - 200 - 8.00 - 1600 - 100 - 15.00 - 1500
6 Hazipur Paddy 94 96 18.00 10.00 1692 960 300 74 30.00 20.00 9000 1480 Others* - 200 - 8.00 - 1600 - 100 - 15.00 - 1500
Total 966 6513 108 108 17388 55730 2800 5488 180 210 84000 93220 Irri.- Irrigated Rf.- Rainfed Others: Pigeon pea, moong urd, jwar, vegetable etc Table No.86 : Details of Rabi drop area and yield in the project areas *

-------------------------------------------------------------------------------IWMP-IInd MAU (UP):DoLR
96
S.No. Names of
villages
Name
of
crops
Pre-project Expected Post-project
Area (ha) Average Yield
(Qtl) per ha.
Total Production
(Qtl)
Area (ha) Average
Yield (Qtl)
per ha.
Total
Production
(Qtl)
Irri Rf. Irri Rf. Irri Rf. Irri Rf. Irri Rf. Irri Rf.
1 Karisath Paddy 224 648 25.00 20.00 5600 12960 550 1074 30.00 25.00 16500 26850
Others* - 1000 - 10.00 - 10000 - 500 - 15.00 - 7500
2 Vijpura Paddy 185 609 25.00 20.00 4625 12180 550 693 30.00 25.00 16500 17325
Others* - 800 - 10.00 - 8000 - 500 - 15.00 - 7500
3 Rewaridih Paddy 171 346 25.00 20.00 4275 6920 400 331 30.00 25.00 12000 8275
Others* - 500 - 10.00 - 5000 - 400 - 15.00 - 6000
4 Maidapur
Samastipur
Paddy 198 918 25.00 20.00 4950 18360 700 842 30.00 25.00 21000 21050
Others* - 1100 - 10.00 - 11000 - 800 - 15.00 - 12000
5 Jamalpur
Mirzapur
Paddy 94 196 25.00 20.00 2350 3920 300 74 30.00 25.00 9000 1850
Others* - 100 - 10.00 - 1000 - 100 - 15.00 - 1500
6 Hazipur Paddy 94 196 25.00 20.00 2350 3920 300 74 30.00 25.00 9000 1850
Others* - 100 - 10.00 - 1000 - 100 - 15.00 - 1500
Total 966 6513 150 180 24150 94260 2800 5488 180 240 84000 113200
Irri.- Irrigated Rf.- Rainfed * others crop: chick pea, pea, ,mustard, potato etc

-------------------------------------------------------------------------------IWMP-IInd MAU (UP):DoLR
97
10- DETAILS ESTIMATE OF WATERSHED DEVELOPMENT WORK PHASES (ANNEXURE-1)

-------------------------------------------------------------------------------IWMP-IInd MAU (UP):DoLR
98

-------------------------------------------------------------------------------IWMP-IInd MAU (UP):DoLR
99
DESIGN OF CONTOUR BUND
Type of Soil - Clay Rain fall - 24 hr in cm -25 cm Fied Stop -1% Virtical interval (Vi) = [s/3+2] = [1/3+2] Horizontal interval (HI) = 0.70 m = 100xV.I/s Heidht of Bond h = (Rex vi)/50 = (25x0.7) /50 0.35 0.59 Say 0.6 m Ferr bord = 15% of high mimimum -10 cm Hight = 0.60+0.10 = 0.70m Taking top widh of bond 0.50 m and side slope 1.5:l Then base of bond =0.50+(1.10d)x 2 = 2.60 m Coress-Seclion of bond =(2.50+ 2.60) x0.70/2 =1.085m2
Length of bond = 100s/V.I. =100x1/0.70 = 142.85 m/ha Say 120 m/ha
Earth work /ha = 250x1.085 = 162.75 cum = 162 .75 cum
Cort Rs./ ha =162.7 x39.16=6373.29 Say 6375.00
DESIGN OF SUMBERGENCE BOND

-------------------------------------------------------------------------------IWMP-IInd MAU (UP):DoLR
100
Types siol – Caly Rainfall intensiy for 24 hrs – 25 cm Fild slope 3% V.I. =[s/3+2] x0.30 = 0.909 m
Horizontal Interval =(100xV.I.)/s = (100x0).3 = 30m Height of bond h = (Re x V.I.)/50 =( 25 x 0.90)/0 =0.45 =0.67m. Say 0.70m Feree bord 20% of hight minimum 20 cm = Total Hight = 0.90 m Takingh top wigth of bond 0.70 m and side slope 1.5:1 Bottom of bund = 0.70+2x 1.5d = 0.70+2.70 = 3.40
Cross section of Submergence Bond = (0.70+3.40)x09.90/2 = 1.845 m2
Lengh of bond = 100s/V.I. = (100x3) /0.90 = 333 m Feasible length = 100+25+25 = 150m Earth work/ha = 150x1.845 = 276.75 = 276.75x39.16 Cost per has = 10,837.53 Say 10,850=00

-------------------------------------------------------------------------------IWMP-IInd MAU (UP):DoLR
101
TYPICAL SECAION OF FILED BUND
Top widht = 0.50m
Side slope =1:1
Height of bound = 0.50m
Bottom Widht = 1.50m
Cross section = (0.580+1.50)x0.50/2=100cum
Length per hectare = 200 m
Earhwork = 200x0.50=100cum
Cost 39.16/cum = Rs.3916.00
Cost per hectare =Rs. 3916.00
TYPICAL SECTION OF P.B., M.B., S.B0.
Top width = 0.70m
Side slope = 1.5: 1
Height = 1.30 m
Bottom =4.60 m
Cross section = (0.70+4.60)x1.30/2=3.445m2
Cost/meter = Rs. 142.00

-------------------------------------------------------------------------------IWMP-IInd MAU (UP):DoLR
102
TYPICAL SECTION OF EARTHEN CHECK DAM / GULLY PLUG Top width =1.50 m Side slope = 2:1 Height = 2.10m Bottom Width =9.90 m Cross section = (1.50 + 9.90 ) x2.10 / 2 =11.97 m2
Cost per meter = Rs. 551.45
TYPICAL SECION OF CHEK DAM / GULLY PLUG Top Width = 2.00m Side slope =2:1 Height = 2.50 m Bottom Width = 12.00 m Cross Section = (2.00 + 12.00 ) x 2.50 / 2 = 17.50 m2
Cost/meter = Rs. 839.12
TYPICAL SECTIO0N OF W.H.B
Top width = 2.50 m Side slope = 2:1 Height = 2.75 m Bottom Width = 13.50 m Cross section = ( 2.50 + 13.50 ) x 2.75/2 = 22.00 m2 Per meter cost = Rs. 1085.92

-------------------------------------------------------------------------------IWMP-IInd MAU (UP):DoLR
103

-------------------------------------------------------------------------------IWMP-IInd MAU (UP):DoLR
104
Design of Drop Spillway to be constructed at a place in a gully having width of 1.0 m and catchment area 1.00 and net drop
0.50 m Taking rainfall intensity for duration equal to time of concentration of watershed and design return period of 25 years , as 120
mm/hr . The coefficient of runoff for the watershed is 0.3.
1.Hydrologic design – The design peak runoff rate(m3/s) for the watershed form Rational formula is given as :
Q= C.I.A. = 0.3x120x1.00 =36/360 =0.10 cum /second
360 360
2. Hydraulic design- The maximum discharge capacity of the rectangular weir given by
Q= 1.711LH3/2 = (1.1+0.01f)= o find suitable value of L&H
Let us assume L=0.50 m(since width of gully is 1.00m)
0.10 =1.711LH3/2 = 1.711L H 3/2
(1.1.+0..01x 0.5) (1.105)
L H 3/2 = 1.105x .10 = 0.1105 = 0.064
1.711 1.711
H3/2 = 0.064 = 0.128
0.50
H = (0.128)3/2 = 0.25m
Test L / h = 0.50 = 2.> 2. 0 hence O.K.; 0.25 h / f = 0.25 = 0.50 < 0.5 hence O.K.
0.50

-------------------------------------------------------------------------------IWMP-IInd MAU (UP):DoLR
105
3. Structural design - 1. Minimum headwall extension , E =(3h +0.6 ) or 1.5 f whichever is greater E= 3x0.5+0.6 or 1.5x0.50
E = 2.10m or 0.75+m = Adopted 2.10m
2. Length of apron basin LB = (2.28 h/f + 0.54 ) =0.50 (2.20 x 0.5 + 0.54)-0.5
=0.50x2.74 =1.37 m says 1.40m
3. Height of end sill, S =h=0.50= 0.16m says 0.20m
4. Height of wing wall and side wall at Junction:
J = 2h or [f + h + S – (LB + 0.10)/2 ] whichever is greater = 2 x 0.20 or [0.50 + 0.50+0.16 –
(1.37+0.10/2)]
= 1.0 or [1.16 -0.735 ] = 1.0 or 0.425 (adopt J = 1.00 m )
5. M = 2(f + 1.33 h –J) = 2 (0.050 + 1.16 – 0.733x 0.25 – 1.00) = 2x (-0.167) = -0.335
6. K = ( LB + 0.1 ) – M = (1.037 + 0.1 ) – 0.335 =1.47 – 0.335 =1.135 m
Toe and cut off walls
Normal scour depth (N S D ) =0.473 x (Q / f )1/3 = 0.473 x (0.1/1) 1/3 = 0.473 x0.464 = 0.219
Maximum Scour depth (M S D ) = 1.5 x N S D = 1.5 x 0.219 = 0.328m Says 0.35 m
Depth of cutoff / Toe wall = 0.35 m
Apron thickness : For an over fall of 0.5 m .The apron thickness in concrete construction is 0.20m since structure is constructed in
masonry ,the Apron thickness will be 0.20x1.50=0.30m
Wall thickness : The thickness of wall of the structure ( masonry construction ) is given below . :

-------------------------------------------------------------------------------IWMP-IInd MAU (UP):DoLR
106
Description Thickness of wall T op width Bottom width
Head wall 0.40 1.00 Side wall 0.30 0.80 Wing all and head wall extension 0.30 0.60
DETAIL ESTIMATE OF DROP SPILLWAY OF CREST LENGTH 0.5 METRE 1. Earth work in cutting in foundation
S.No. Description of work No. L B D/H Quantity
1 Side wall 2 1.50 1.00 1.15 3.45
2 Head wall 1 0.50 1.20 1.15 0.69
3 Head wall extension 2 2.20 0.80 1.15 4.04
4 Wing wall 2 1.15 0.80 1.15 2.11
5 Tow wall 1 0.50 0.80 0.60 0.24
6 Cut off wall 1 4.70 0.80 0.60 2.25
7 Apron 1 0.50 1.50 0.60 0.45
Total 13.23 cum
2 Laying of sand in the bed of foundation S.No. Description of work No. L B D/H Quantity
1 Side wall 2 1.50 1.00 0.10 0.300
2 Head wall 1 0.50 0.40 0.10 0.020
3 Wing wall 2 1.15 0.80 0.10 0.184
4 Toe wall 2 0.50 0.80 0.10 0.040
5 Cut off wall 1 4.70 0.80 0.10 0.376
6 Apron 1 0.50 1.50 0.10 0.075
Total 0.995 cum
3 C.C.W. 1 :3: 6 in foundation

-------------------------------------------------------------------------------IWMP-IInd MAU (UP):DoLR
107
S.No. Description of work No. L B D/H Quantity
1 Cut off wall 1 4.70 0.80 0.15 0.564
2 Head wall 1 0.50 0.40 0.15 0.030
3 Side wall 2 1.50 1.00 0.15 0.450
4 Wing wall 2 1.15 0.80 0.15 0.276
5 Toe wall 1 0.50 0.80 0.15 0.060
6 Apron 1 0.50 1.50 0.15 0.112
Total 1.492 cum
4 Brick masonry 1:4 S.No. Description of work No. L B D/H Quantity
1 Cut off wall 1 1
4.70 4.70
0.80 0.60
0.45 0.45
1.692 1.269
2 Head wall 1 1 1
0.50 0.50 0.50
1.10 1.00
(0.40+1.00)/2
0.45 0.45 0.60
0.247 0.225 0.180
3 Head wall extension 2 2 2 2
2.10 2.10 2.10 2.10
0.80 0.60 0.60 0.40
0.45 0.45 0.60 0.70
1.512 1.134 1.512 1.176
4 Side wall 2 2 2 2 2
1.50 1.50 1.50 1.50
(0.35+1.50)/2
1.00 0.80 0.80 0.60 0.40
0.45 0.45 0.60 0.40 0.30
1.350 1.080 1.440 0.720 0.222
5 Wing wall 2 2 2
1.15 1.15 1.15
0.80 0.60 0.40
0.45 0.45
(1.00+0)/2
0.828 0.621 0.460
6 Tow wall 1 1 1
0.50 0.50 0.50
0.80 0.60 0.40
0.45 0.45 0.20
0.180 0.135 0.040
7 Apron 1 0.50 1.50 0.45 0.337
Total 16.360cum
5. C.C.W. 1:2:4 in the wall S.No. Description of work No. L B D/H Quantity

-------------------------------------------------------------------------------IWMP-IInd MAU (UP):DoLR
108
1 Head wall 1 0.50 0.40 0.025 0.005
2 Side wall 2 2
0.35 0.18
0.40 0.40
0.025 0.025
0.007 0.023
3 Head wall extension 2 2.10 0.40 0.025 0.042
4 Wing wall 2 1.52 0.40 0.025 0.030
5 Toe wall 1 0.50 0.40 0.025 0.005
6 Apron 1 0.50 1.50 0.025 0.018
Total 0.130cum
6. Tuck Pointing 1:3 S.No. Description of work No. L B D/H Quantity
1 Head wall 1 1
0.50 0.50
- 0.60 0.84
0.30 0.42
2 Side wall 2 2
1.50 (0.30+1.50)/2
- 1.00 0.30
3.00 0.55
3 Head wall extension 2 2.10 - 1.00 4.20
4 Wing wall 2 1.15 (1.00+0)/2 1.15
Total 9.62m2
CONSUMPTAION OF MATERIALS S.No. Particulars Quantity Cement (Bags) Coarse Sand
(cum) Brick (No.) G.S.B. 25-40 mm
(cum) G.S. Grit 10-20
mm (cum)
1 Sand laying 0.995cum - 0.995 - - -
2 C.C.W. 1:3:6 1.492 cum 6.61 0.671 - 1.342 -
3 Brick Masonry 16.360 cum 29.26 5.562 1880 - -
4 C.C.W. 1:2:4 0.130 cum 0.79 0.045 - - 0.110
5 Tuck Pointing 1:3 9.62 m2 0.44 0.045 - -
Total 46.90 7.327 8180 1.342 0.110
Say 47 Bags
Cost of Materials
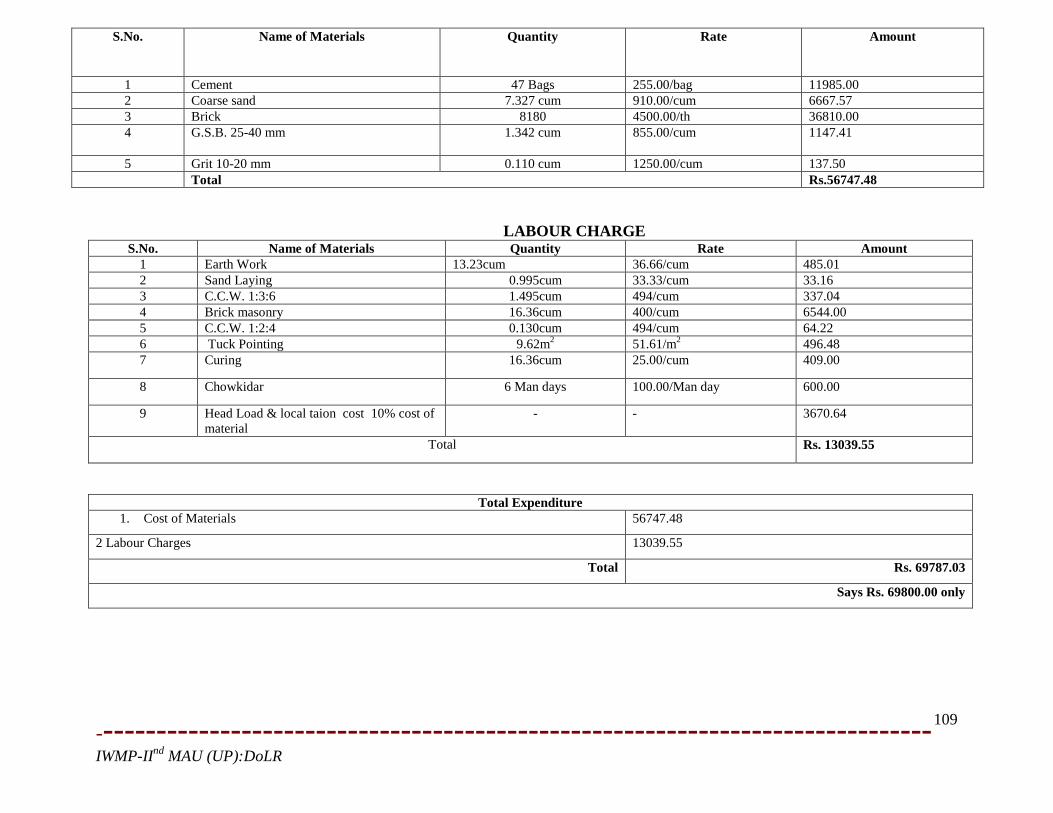
-------------------------------------------------------------------------------IWMP-IInd MAU (UP):DoLR
109
S.No. Name of Materials Quantity Rate Amount
1 Cement 47 Bags 255.00/bag 11985.00 2 Coarse sand 7.327 cum 910.00/cum 6667.57 3 Brick 8180 4500.00/th 36810.00 4 G.S.B. 25-40 mm 1.342 cum
855.00/cum 1147.41
5 Grit 10-20 mm 0.110 cum 1250.00/cum 137.50 Total Rs.56747.48
LABOUR CHARGE S.No. Name of Materials Quantity Rate Amount
1 Earth Work 13.23cum 36.66/cum 485.01 2 Sand Laying 0.995cum 33.33/cum 33.16 3 C.C.W. 1:3:6 1.495cum 494/cum 337.04 4 Brick masonry 16.36cum 400/cum 6544.00 5 C.C.W. 1:2:4 0.130cum 494/cum 64.22 6 Tuck Pointing 9.62m2 51.61/m2 496.48 7 Curing 16.36cum 25.00/cum 409.00
8 Chowkidar 6 Man days 100.00/Man day 600.00
9 Head Load & local taion cost 10% cost of material
- - 3670.64
Total Rs. 13039.55
Total Expenditure 1. Cost of Materials 56747.48
2 Labour Charges 13039.55
Total Rs. 69787.03
Says Rs. 69800.00 only
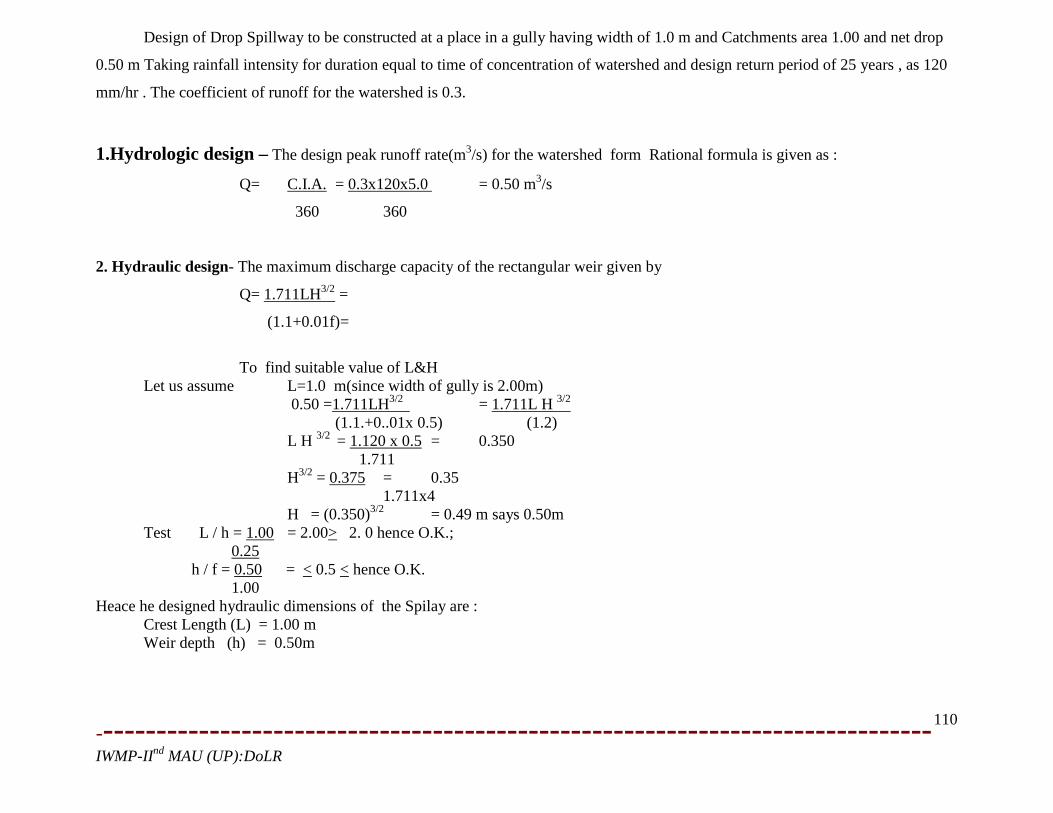
-------------------------------------------------------------------------------IWMP-IInd MAU (UP):DoLR
110
Design of Drop Spillway to be constructed at a place in a gully having width of 1.0 m and Catchments area 1.00 and net drop
0.50 m Taking rainfall intensity for duration equal to time of concentration of watershed and design return period of 25 years , as 120
mm/hr . The coefficient of runoff for the watershed is 0.3.
1.Hydrologic design – The design peak runoff rate(m3/s) for the watershed form Rational formula is given as :
Q= C.I.A. = 0.3x120x5.0 = 0.50 m3/s
360 360
2. Hydraulic design- The maximum discharge capacity of the rectangular weir given by
Q= 1.711LH3/2 =
(1.1+0.01f)=
To find suitable value of L&H
Let us assume L=1.0 m(since width of gully is 2.00m) 0.50 =1.711LH3/2 = 1.711L H 3/2 (1.1.+0..01x 0.5) (1.2) L H 3/2 = 1.120 x 0.5 = 0.350 1.711 H3/2 = 0.375 = 0.35 1.711x4 H = (0.350)3/2 = 0.49 m says 0.50m Test L / h = 1.00 = 2.00> 2. 0 hence O.K.;
0.25 h / f = 0.50 = < 0.5 < hence O.K. 1.00
Heace he designed hydraulic dimensions of the Spilay are : Crest Length (L) = 1.00 m Weir depth (h) = 0.50m

-------------------------------------------------------------------------------IWMP-IInd MAU (UP):DoLR
111
3. Structural design - 1. Minimum headwall extension , E =(3h +0.6 ) or 1.5 f whichever is greater ; 3x0.50+0.6 or 1.5x1 E =(1.5+060) or 21.50m = 2.10 or 1.50 Adopted = 2.10 m
2. Length of apron basin LB = (2.28 h/f + 0.54 ) =1(2.28 x 0.50 + 0.54 = 1.68m
3. Height of end sill, S =h=0.50= 0.16m
3 3
4. Height of wing wall and side wall at Junction:
J = 2h or [f + h + S – (LB + 0.10)/2 ] whichever is greater = 2 x 0.50 or [1.0+ 0.50+0.16 – (1.68+0.10/2)]
= 1.0 or [1.66 -0.89 ] = 1.00 or 0.77(adopt J = 1.00 m )
5. M = 2(f + 1.33 h –J) = 2 (1.0+ 1.33 x 0.50 – 1.00) = 2 (-0.1665-1.00) = 1.33m
6. K = ( LB + 0.1 ) – M = (1.68 + 0.1 ) – 1.33 =0.45 m
Toe and cut off walls
Normal scour depth (N S D ) =0.473 x (Q / f )1/3 = 0.473 x (0.5/1.0) 1/3 taking f =1
= 0.473 x(0.5)1/3 = 0.473 x0.793 =0.375 m
Maximum Scour depth (M S D ) = 1.5 x N S D = 1.5 x 0.375 = 0.56m Says
Depth of cutoff / Toe wall 0.56 m say 0.60m
Apron thickness : For an over fall of 1.0 m .The apron thickness in concrete construction is 0.30m since structure is constructed in
masonry ,the Apron thickness will be 0.30x1.50=0.45m
Wall thickness : The thickness of wall of the structure ( masonry construction ) is given below . :

-------------------------------------------------------------------------------IWMP-IInd MAU (UP):DoLR
112
Description Thickness of wall T op width Bottom width
Head wall 0.45 1.00 Side wall 0.30 0.80 Wing all and head wall extension 0.30 0.60
DETAIL ESTIMATE OF DROP SPILLWAY CREST LENGTH
1. Earth work n cutting S.No. Description of work No. L B D/H Quantity 1 Side wall 2 1.70 1.00 1.15 3.91 2 Head all 1 0.80 1.20 1.15 1.10 3 Head wall extension 2 2.20 0.80 1.15 4.04 4 Toe wall 1 0.80 0.70 0.80 0.45 5 Cut off 1 5.20 0.80 0.70 2.91 6 Apron 1 1.70 0.80 0.60 0.81 7 Wing wall 2 1.30 0.80 1.15 2.39
Total 15.60 cum 2. Laying of sand in the bed & foundation S. No.
Description of work No. L B D/H Quantity
1 Side wall 2 1.70 1.00 0.10 0.340 2 Head all 1 1.00 0.40 0.10 0.040 3 Head wall extension 2 2.10 0.80 0.10 0.336 4 Toe wall 1 1.00 0.80 0.10 0.080 5 Cut off 1 5.20 0.80 0.10 0.416 6 Apron 1 1.60 1.00 0.10 0.160 7 Wing wall 2 1.30 0.80 0.10 0.208 Total 1.580 cum 3.C.C.W 1:3:6 in founjdation

-------------------------------------------------------------------------------IWMP-IInd MAU (UP):DoLR
113
S. No.
Description of work No. L B D/H Quantity
1 Side wall 2 1.70 1.00 0.15 0.510 2 Head all 1 1.00 0.40 0.15 0.060 3 Head wall extension 2 2.10 0.80 0.15 0.378 4 Toe wall 1 1.00 0.80 0.15 0.120 5 Cut off 1 5.20 0.80 0.15 0.624 6 Apron 1 1.60 1.00 0.10 0.160 7 Wing wall 2 1.30 0.80 0.15 0.312 Total 2.164cum 4. Brick masonry S. No.
Description of work No. L B D/H Quantity
1 Cut of wall 1 5.20 0.60 0..60 1.8725 2 Head wall 1 1.00 1.00 0.90 0.900
1 1.00 (0.40+1.00)/2 1.00 0.700 3 Side wall 2 1.70 1.00 0.45 1.530
2 1.70 0.80 0.45 0.918 2 1.70 0.80 0.60 1.020 2 1.70 0.60 0.40 0.544 2 (1.70+0.45)/2 0.40 0.50 0.430
4 Head wall extension 2 2.10 0.80 0.65 2.184 2 2.10 0.60 0.45 1.134 2 2.10 0.40 1.30 2.184
5 Wing wall 2 1.30 0.80 0.45 0.936 2 1.30 0.60 0.45 0.702 2 1.30 0.40 (1.00+0)/2 0.520
6 Toe wall 1 1.00 0.80 0.45 0.360 1 1.00 0.60 0.45 0.270
7 Apron 1 1.70 1.00 0.45 0.765 8 Longitudinal sill 2 1.70 0.20 0.20 0.136 9 Transverse sill 2 1.00 0.20 0.20 0.0440
Total 17.145 cum 5. C.C.W. 1;2;4 on the wall and Apron

-------------------------------------------------------------------------------IWMP-IInd MAU (UP):DoLR
114
S. No.
Description of work No. L B D/H Quantity
1 Hide wall 1 1.00 0.40 0.025 0.010 2 Side wall 2 0.45 0.40 0.025 0.009
2 1.35 0.40 0.025 0.027 3 Head wall extension 2 2.10 0.40 0.025 0.042 4 Wing wall 2 1.60 0.40 0.025 0.032 5 Longitudinal 2 1.70 0.20 0.025 0.017 6 Transverse sill 1 1.00 0.20 0.025 0.005 7 Apron 3 1.60 02. 0.025 0.024
Total 0.166 cum 6. Tuck Pointing 1:3 S. No. Description of work No. L B D/H Quantity 1 Side wall 1 1.00 - 1.00 1.00 1 1.00 - 1.165 1.16 2 Side wall 2 0.45 - 1.50 1.35 2 1.25 - (1.50+1.00)/2 3.12 3. Wing wall 2 2.30 - (1.00+0)/2 1.30 4 Head wall 2 2.10 - 1.00 4.20 Total 12.13m2
CONSUMPTION OF MATERIALS
S. No.
Particulars Quantity Cement(Bags) Sand(cum) Brick (N0) G.S.Git 25-40mm(cum)
Grit 10-20 mm(cum)
1 Sand laying 1.580cum - 1.580 - - - 2 C.C.W. 1:3:6 2.164 cum 9.95 0.973 - 1.947 - 3 Brick masonry 17.145cum 41.14 5.829 8755 - - 4 C.C.W 1:2:4 0.166 cum 1.01 0.069 - - 0.141 5 Tuck Pointing 12.13m2 0.55 0.057 - - - Total 25.65 8.508 8755 1.947 0.141 Say 53 Bags 8.51 cum 8755 1.95cum 0.14 cum

-------------------------------------------------------------------------------IWMP-IInd MAU (UP):DoLR
115
COST OF MATERILS
S.No. Name of materials Quantity Rate Amount 1 Cement 53 ?Bags 255.00 13515.00 2 Course sand 8.51cum 910.00 7744.10 3 Brick 8755 4500/th 39397.50 4 G.S.B. 25-40 mm 1.95 cum 855.00 1667.25 5 G.S.Grit 10-20 0.14 cum 1250.00 175.00 Total Rs.62498.85
LABOUR CHARHGE
S.No. Particulars Quantity Rate Amount 1 Earth work 15.60 cum 36.66/cum 57189 2 Sand Laying 1.580 cum 33.33/cum 52.66 3 C.C.W 1:3:6: 2.164 cum 494/cum 1.69.0. 4 C.C.W. 1:2:4: 0.166 cum 494/cum 82.00 5 Brick Masonry 17.145 cum 400/cum 6858.00 6 Truck Pointing 12.13m 2 51.61/m2 626.02 7 Curing 170145cum 25.00/cum 428.62 8 Chowkidar 65Man Days 100.00/Man Day 600.00 9 Head Load & local transporation 10% cost of materials 4068.00 Total Rs.14356.20
Total Expenditure
1. Cost of Materials 62498.85
2. Labour Charges 14356.20
Total Rs. 76855.05
Say Rs.76900.00

-------------------------------------------------------------------------------IWMP-IInd MAU (UP):DoLR
116
Design of Drop Spillway to be constructed at a place in a gully having width of 1.0 m and Catchments area 1.00 and net drop
0.50 m Taking rainfall intensity for duration equal to time of concentration of watershed and design return period of 25 years , as 120
mm/hr . The coefficient of runoff for the watershed is 0.3.
1.Hydrologic design – The design peak runoff rate(m3/s) for the watershed form Rational formula is given as :
Q= C.I.A. = 0.3x120x20.0 = 2.00 m3/s
360 360
2. Hydraulic design- The maximum discharge capacity of the rectangular weir given by
Q= 1.711LH3/2 =
(1.1+0.01F)=
To find suitable value of L&H
Let us assume L =2.0 m (since width of gully is 3.00m) 2.00 = 1.711LH3/2 = 1.711L H 3/2 (1.1.+0..01x 0.5) (1.10+1.15) L H 3/2 = 2.0 x 1.115 = 0.350 1.711 H3/2 = 2.23 = 0.65 1.711x4 H = (0.65)3/2 = 0.75 m Test L / h = 2.00 = 2.66> 2. 0 hence O.K.;
0.25 h / f = 0.75 = < 0.5 hence O.K. 1.50
Heace he designed hydraulic dimensions of the Spilay are :
Crest Length (L) = 2.00 m
Weir depth (h) = 0.81m

-------------------------------------------------------------------------------IWMP-IInd MAU (UP):DoLR
117
3. Structural design - 1. Minimum headwall extension , E =(3h +0.6 ) or 1.5 f whichever is greater
E = 3x0.81+0.6 or 1.5x1.50 E =3.03 m or 2.25 m
Adopted = 3.03m
2. Length of apron basin LB = (2.28 h/f + 0.54 ) =1.5(2.28 x 0.08 + 0.54) = 1.50 (1.20 + 0.54) =2.61 m 3. Height of end sill, S =h=0.50= 0.16m 4. Height of wing wall and side wall at Junction: J = 2h or [f + h + S – (LB + 0.10)/2 ] whichever is greater
= 2 x 0.80 or [1.50+ 0.81+0.27 – (2.61+0.10/2] = 1.0 or [1.66 -0.89 ] = 1.00 or 0.77(adopt J = 1.00 m ) adopt J = 1.62 m 5. M = 2(f + 1.33 h –J) = 2(1.50 + 1.33 x 0.81 – 1.62 ) = 1.90 m 6. K = ( LB + 0.1 ) – M = (2.61 + 0.1 ) – 190 =0.81 m Toe and cut off walls
Normal scour depth (N S D ) =0.473 x (Q / f )1/3 = 0.473 x (2/1) 1/3 = 0.473 x 1.259 = 0.595 m
Maximum Scour depth (M S D ) = 1.5 x N S D = 1.5 x 0.595= 0.89m
Depth of cutoff / Toe wall 0.89 m say 0.60m
Apron thickness : For an over fall of 1.0 m .The apron thickness in concrete construction is 0.30m since structure is constructed in
masonry ,the Apron thickness will be 0.30x1.50=0.45m

-------------------------------------------------------------------------------IWMP-IInd MAU (UP):DoLR
118
Wall thickness : The thickness of wall of the structure ( masonry construction ) is given below . :
Description Thickness of wall T op width Bottom width
Head wall 0.45 1.33 Side wall 0.30 1.10 Wing all and head wall extension 0.30 0.80
DETAIL ESTIMATE OF DROP SPILLWAY OF CREST LENGTH 2.00 METRE
1. Earth work in cutting in foundation S.No. Description of work No. L B D/H Quantity
1 Side wall 2 2.65 1.30 1.15 7.92
2 Head wall 1 2.00 1.60 1.15 3.68
3 Head wall extension 2 3.05 1.00 1.15 7.01
4 Wing wall 2 1.95 1.00 1.15 4.48
5 Tow wall 1 2.00 1.00 1.15 2.30
6 Cut off wall 1 8.40 1.00 1.15 9.66
7 Apron 1 2.60 2.00 0.75 3.90
Total 38.95 cum
2 Laying of sand in the bed of foundation S.No. Description of work No. L B D/H Quantity
1 Cut of wall 2 8.10 0.90 0.10 0.729
2 Side wall 1 2.65 1.20 0.10 0.636
3 Head wall l 2 2.00 0.70 0.10 0.140
4 Head wall extension 2 3.05 0.10 0.10 0.061
5 Wing wall 1 1.95 0.90 0.10 0.351
6 Toe wall 1 2.00 0.90 0.10 0.180
7 Apron 1 2.00 2.65 0.10 0.530
Total 2.627 cum
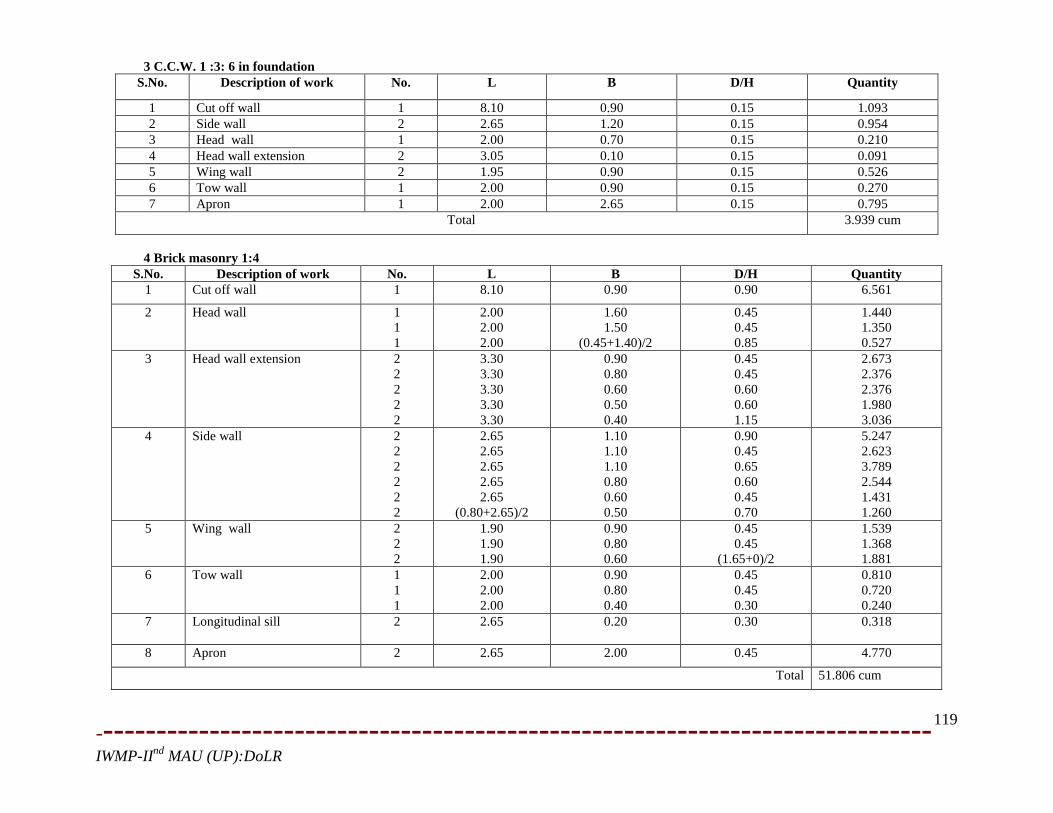
-------------------------------------------------------------------------------IWMP-IInd MAU (UP):DoLR
119
3 C.C.W. 1 :3: 6 in foundation
S.No. Description of work No. L B D/H Quantity
1 Cut off wall 1 8.10 0.90 0.15 1.093 2 Side wall 2 2.65 1.20 0.15 0.954 3 Head wall 1 2.00 0.70 0.15 0.210 4 Head wall extension 2 3.05 0.10 0.15 0.091 5 Wing wall 2 1.95 0.90 0.15 0.526 6 Tow wall 1 2.00 0.90 0.15 0.270 7 Apron 1 2.00 2.65 0.15 0.795
Total 3.939 cum
4 Brick masonry 1:4
S.No. Description of work No. L B D/H Quantity 1 Cut off wall 1 8.10 0.90 0.90 6.561
2 Head wall 1 1 1
2.00 2.00 2.00
1.60 1.50
(0.45+1.40)/2
0.45 0.45 0.85
1.440 1.350 0.527
3 Head wall extension 2 2 2 2 2
3.30 3.30 3.30 3.30 3.30
0.90 0.80 0.60 0.50 0.40
0.45 0.45 0.60 0.60 1.15
2.673 2.376 2.376 1.980 3.036
4 Side wall 2 2 2 2 2 2
2.65 2.65 2.65 2.65 2.65
(0.80+2.65)/2
1.10 1.10 1.10 0.80 0.60 0.50
0.90 0.45 0.65 0.60 0.45 0.70
5.247 2.623 3.789 2.544 1.431 1.260
5 Wing wall 2 2 2
1.90 1.90 1.90
0.90 0.80 0.60
0.45 0.45
(1.65+0)/2
1.539 1.368 1.881
6 Tow wall 1 1 1
2.00 2.00 2.00
0.90 0.80 0.40
0.45 0.45 0.30
0.810 0.720 0.240
7 Longitudinal sill 2
2.65 0.20 0.30 0.318
8 Apron 2 2.65 2.00 0.45 4.770
Total 51.806 cum

-------------------------------------------------------------------------------IWMP-IInd MAU (UP):DoLR
120
5. C.C.W. 1:2:4 in the wall
S.No. Description of work No. L B D/H Quantity 1 Head wall 1 2.00 0.45 0.025 0.0225
2 Side wall 2 2
0.80 1.32
0.50 0.50
0.025 0.025
0.0200 0.330
3 Head wall extension 2 3.02 0.40 0.025 0.610 4 Wing wall 2 2.52 0.60 0.025 0.765 5 Longitudinal sill 2 2.65 0.20 0.025 0.265 6 Apron 1 2.65 1.60/3 0.025 0.353 6 Toe Wall 1 2.00 0.40 0.025 0.200
Total 0.2939cum
6. Tuck Pointing 1:3 S.No. Description of work No. L B D/H Quantity
1 Head wall 1 1
2.00 2.00
- -
0.85 1.27
1.70 2.45
2 Side wall 1 1
2.65 (0.80+2.65)/2
- 1.65 0.70
4.37
3 Head wall extension 2 3.30 - 1.50 1.20
4 Wing wall 2 1.90 - (1.665+0)/2 9.90
Total 3.13m2
CONSUMPTAION OF MATERIALS
S.No. Particulars Quantity Cement (Bags) Coarse Sand (cum)
Brick (No.) G.S.B. 25-40 mm (cum)
G.S. Grit 10-20 mm
(cum) 1 Sand laying 2.627 cum - 2.227 - - -
2 C.C.W. 1:3:6 3.939 cum 16.93 1.772 - 3.545 -
3 Brick Masonry 51.806 cum 124.33 17.614 25903 - -
4 C.C.W. 1:2:4 0.294 cum 1.79 0.123 - - 0.249
5 Tuck Pointing 1:3 22.84 m2 1.50 0.107 - - -
Total 144.10 22.243 25903 3.545 0.249
Say 144 Bags 22.243 cum 25903 3.55 cum 0.250 cum

-------------------------------------------------------------------------------IWMP-IInd MAU (UP):DoLR
121
Cost of Materials
S.No. Name of Materials Quantity Rate Amount
1 Cement 144 Bags 255.00/bag 36720.00
2 Coarse sand 22.243 cum 910.00/cum 20241.13
3 Brick 25903 4500.00/th 115663.50
4 G.S.B. 25-40 mm 3.55 cum
855.00/cum 3035.25
5 G.S. Grit 10-20 mm 0.250 cum 1250.00/cum 312.50
Total Rs.176872.38
LABOUR CHARGE
S.No. Particulars Quantity Rate Amount
1 Earth Work 38.95cum 36.66/cum 1427.90 2 Sand Laying 2.627 cum 33.33/cum 87.55 3 C.C.W. 1:3:6 3.939 cum 494/cum 1945.86 4 C.C.W. 1:2:4 0.2939 cum 400/cum 145.18 5 Brick masonry 51.806 cum 494/cum 20722.40 6 Tuck Pointing 22.84 m2 51.61/m2 1178.77 7 Curing 51.806 cum 25.00/cum 1295.15 8 Chowkidar 13 Man days 100.00/Man day 1300.00 9 Head Load & local taion cost 10% cost of
material - - 11340.03
Total Rs. 39442.84 Total Expenditure
1. Cost of Materials 176872.38
2 Labour Charges 39442.84
Total Rs. 216315.22
Says Rs. 216315.00 only

-------------------------------------------------------------------------------IWMP-IInd MAU (UP):DoLR
122
Design of Drop Spillway to be constructed at a place in a gully having width of 1.0 m and Catchments area 1.00 and net drop
0.50 m Taking rainfall intensity for duration equal to time of concentration of watershed and design return period of 25 years , as 120
mm/hr . The coefficient of runoff for the watershed is 0.3.
1.Hydrologic design – The design peak runoff rate(m3/s) for the watershed form Rational formula is given as :
Q= C.I.A. = 0.3x120x20.0 = 2.00 m3/s
360 360
2. Hydraulic design- The maximum discharge capacity of the rectangular weir given by
Q= 1.711LH3/2 = (1.1+0.01F)= To find suitable value of L&H
Let us assume L =2.0 m (since width of gully is 3.00m) 2.00 = 1.711LH3/2 = 1.711L H 3/2 (1.1.+0..01x 0.5) (1.10+1.15) L H 3/2 = 2.0 x 1.115 = 0.350 1.711 H3/2 = 2.23 = 0.65 1.711x4 H = (0.65)3/2 = 0.75 m Test L / h = 2.00 = 2.66> 2. 0 hence O.K.;
0.25 h / f = 0.75 = < 0.5 hence O.K. 1.50
Heace he designed hydraulic dimensions of the Spilay are :
Crest Length (L) = 2.00 m
Weir depth (h) = 0.81m

-------------------------------------------------------------------------------IWMP-IInd MAU (UP):DoLR
123
3. Structural design - 1. Minimum headwall extension , E =(3h +0.6 ) or 1.5 f whichever is greater
E = 3x0.81+0.6 or 1.5x1.50 E =3.03 m or 2.25 m
Adopted = 3.03m
2. Length of apron basin LB = (2.28 h/f + 0.54 ) =1.5(2.28 x 0.08 + 0.54) = 1.50 (1.20 + 0.54) =2.61 m 3. Height of end sill, S =h=0.50= 0.16m 4. Height of wing wall and side wall at Junction: J = 2h or [f + h + S – (LB + 0.10)/2 ] whichever is greater
= 2 x 0.80 or [1.50+ 0.81+0.27 – (2.61+0.10/2] = 1.0 or [1.66 -0.89 ] = 1.00 or 0.77(adopt J = 1.00 m ) adopt J = 1.62 m 5. M = 2(f + 1.33 h –J) = 2(1.50 + 1.33 x 0.81 – 1.62 ) = 1.90 m 6. K = ( LB + 0.1 ) – M = (2.61 + 0.1 ) – 190 =0.81 m Toe and cut off walls
Normal scour depth (N S D ) =0.473 x (Q / f )1/3 = 0.473 x (2/1) 1/3 = 0.473 x 1.259 = 0.595 m
Maximum Scour depth (M S D ) = 1.5 x N S D = 1.5 x 0.595= 0.89m
Depth of cutoff / Toe wall 0.89 m say 0.60m
Apron thickness : For an over fall of 1.0 m .The apron thickness in concrete construction is 0.30m since structure is constructed in
masonry ,the Apron thickness will be 0.30x1.50=0.45m

-------------------------------------------------------------------------------IWMP-IInd MAU (UP):DoLR
124
Wall thickness : The thickness of wall of the structure ( masonry construction ) is given below . :
Description Thickness of wall T op width Bottom width
Head wall 0.45 1.33 Side wall 0.30 1.10 Wing all and head wall extension 0.30 0.80
DETAIL ESTIMATE OF DROP SPILLWAY OF CREST LENGTH 2.00 METRE 2. Earth work in cutting in foundation
S.No. Description of work No. L B D/H Quantity
1 Side wall 2 3.40 1.30 1.15 9.38
2 Head wall 1 3.00 1.60 1.15 5.52
3 Head wall extension 2 3.00 1.00 1.15 6.90
4 Wing wall 2 1.80 1.00 1.15 4.96
5 Tow wall 1 3.00 1.00 1.15 3.45
6 Cut off wall 1 9.00 1.00 1.15 10.35
7 Apron 1 3.00 2.00 0.75 5.56
Total 46.12 cum
2 Laying of sand in the bed of foundation
S.No. Description of work No. L B D/H Quantity
1 Cut of wall 2 3.40 0.90 0.10 0.680
2 Head wall l 2 3.00 0.70 0.10 0.180
3 Head wall extension 2 1.80 0.10 0.10 3.60
4 Wing wall 1 3.00 0.90 0.10 2.40
5 Toe wall 1 9.00 0.90 0.10 0.900
6 Apron 1 3.00 2.65 0.10 0.795
Total 3.155 cum

-------------------------------------------------------------------------------IWMP-IInd MAU (UP):DoLR
125
3 C.C.W. 1 :3: 6 in foundation
S.No. Description of work No. L B D/H Quantity
1 Cut off wall 1 9.00 0.90 0.15 1.35 2 Head wall 1 3.00 0.70 0.15 0.27 3 Head wall extension 2 3.40 0.10 0.15 1.02 4 Wing wall 2 1.80 0.90 0.15 0.54 5 Tow wall 1 3.00 0.90 0.15 0.36 6 Apron 1 3.00 2.65 0.15 1.192
Total 4732 cum
4. Brick masonry
S.No. Description of work No. L B D/H Quantity
1 Cut off wall 1 9.00 1.00 0.90 8.100
2 Head wall 1 3.00 1.50 0.90 4.050 1 3.00 (1.50+0.50)/2 1.50 4.500
3 Head wall extension 2 3.00 0.80 0.45 2.160 2 3.00 0.60 0.45 1.620 2 3.00 0.60 0.60 2.160 2 3.00 0.50 0.60 1.800 2 3.00 0.40 1.30 2.120
4 Side wall 2 3.40 1.00 0.45 3.060 2 3.60 0.80 0.45 2.592 2 3.80 0.60 0.60 2.736 2 3.90 0.50 1.00 3.900 2 (4.00+1.40)/2 0.40 1.50 3.240
5 Wing wall 2 1.80 1.00 0.45 1.620 2 1.80 0.80 0.45 1.296 2 1.80 0.50 (1.60+0)/2 1.440
6 Toe wall 1 3.00 0.80 0.45 1.080 1 3.00 0.60 0.45 0.810 1 3.00 0.40 0.30 0.360
7 Apron 1 3.00 2.65 0.45 0.577 8 Longitudinal sill 2 2.60 2.20 0.45 0.486
Total 53.689 cum

-------------------------------------------------------------------------------IWMP-IInd MAU (UP):DoLR
126
5. C.C.W. 1:2:4 in the wall
S.No. Description of work No. L B D/H Quantity 1 Head wall 1 3.00 0.50 0.025 0.037 2 Side wall 2 1.40 0.40 0.025 0.028 2 3.00 0.40 0.025 0.060
3 Head wall extension 2 3.00 0.40 0.025 0.060 4 Wing wall 2 2.40 0.50 0.025 0.060 5 Longitudinal sill 2 2.65 0.20 0.025 0.026 6 Apron 3 2.65 0.86 0.025 0.170
Total 0.441cum 6. Tuck Pointing 1:3
S.No. Description of work No. L B D/H Quantity
1 Head wall 1 3.00 - 1.00 4.56 1 3.00 - 1.18 5.40
2 Side wall 2 3.40 - 1.60 10.88 2 (1.40+3.40)/2 - 1.50 7.20
3 Head wall extension 2 3.00 - 1.50 9.00 4 Wing wall 2 1.80 - (1.60+0)/2 2.88
Total 39.86m2
CONSUMPTION OF MATERIALS
S.No. Particulars Quantity Cement (Bags) Coarse Sand (cum)
Brick (No.) G.S.B. 25-40 mm (cum)
G.S. Grit 10-20 mm
(cum) 1 Sand laying 3.155 cum - 3.155 - - -
2 C.C.W. 1:3:6 4.732 cum 2.34 2.129 - 4.258 -
3 C.C.W. 1:2:4 0.441 cum 2.69 0.185 26845 - -
4 B/W 1:4 53.689 cum 128.85 18.254 - - 0.374
5 Raised Pointing 39.86 m2 1.83 0.187 - - -
Total 153.71 23.910 26845 4.258 0.374
Say 154 23.910 26845 4.26 0.374

-------------------------------------------------------------------------------IWMP-IInd MAU (UP):DoLR
127
Cost of Materials
S.No. Name of Materials Quantity Rate Amount 1 Cement 154 Bags 255.00/bag 39270.00 2 Coarse sand 23.91 cum 910.00/cum 21758.10 3 Brick 26845 4500.00/th 129802.00 4 G.S.B. 25-40 mm 4.26 cum 855.00/cum 3633.75
5 G.S. Grit 10-20 mm 0.374 cum 1250.00/cum 467.50 Total Rs.192931.35
LABOUR CHARGE
S.No. Particulars Quantity Rate Amount
1 Earth Work 46.12 cum 36.66/cum 1690.75 2 Sand Laying 3.155 cum 33.33/cum 105.15 3 C.C.W. 1:3:6 4.732 cum 494/cum 2337.60 4 C.C.W. 1:2:4 1.441 cum 494/cum 217.85 5 B/W 1:4 53.689 cum 400/cum 21475.60 6 Tuck Pointing 39.86 m2 51.61/m2 2057.17 7 Curing 53.689 cum 25.00/cum 1342.22 8 Chowkidar 13 Man days 100.00/Man day 1300.00 9 Head Load & local taion cost 10% cost of
material - - 12015.12
Total Rs. 425441.34
Total Expenditure
1-Cost of Materials 192931.35
2 Labour Charges 42541.34
Total Rs. 235472.69
Says Rs. 235500.00 only

-------------------------------------------------------------------------------IWMP-IInd MAU (UP):DoLR
128
(ANNEXURE-2) 11- DRAWING AND DETAILS ESTIMATE OF THE LIVELIHOOD PROGRAMME

-------------------------------------------------------------------------------IWMP-IInd MAU (UP):DoLR
129
PERPARATION OF COMPOST BY NADEF METHOD
NADEF is the name of the method. in this method glazed pit of brick masonry above Ground level is made as shown in the drying. in this method by using a little quantity of cow during, and crop residue, leaf of trees, straw and other organic materials. The method of filling up the pit is – first of all best soil of pond or field is spread in the bottom of pit as least 3” thickness and then one layer of 6” thickness and other agriculture waste is made then best soil is spread on in and on this layer the liquid made of cow dung is spread to wet the crop residue, straw etc. this method is repeated unit the pit is net completely filled up. On the top layer of this material a bulk is made and then pit is closed by earthen gara. water is spread on the top of bulk and from glazed side weekly. This process is repeated to moist the filling material always. The decomposition in filling material started and within six month filled material become compost khad. S.No. Description of work No. L. B. D./H. Quantity
1. Earth work
Long Wall
Short Wall
2
2
3.60
2.33
0.30
0.30
0.30
0.30
0.648
0.419
Total 1.067 cum
2. Brick work 1:4
Long wall solid
Short Wall Solid
2
2
3.46
2.40
0.23
0.23
0.90
0.90
1.432
0.993
Total 2.425 cum
3. Plastering Work
Long Wall
Short Wall
Top of Long Wall
Top of Short Wall
2
2
2
2
3.46
2.40
3.46
2.40
-
-
0.23
0.23
0.60
0.60
-
-
4.152
2.880
1.591
1.104
Total 9.727 m2

-------------------------------------------------------------------------------IWMP-IInd MAU (UP):DoLR
130
ABSTRACT OF WORK
S.N. Particulars Quantity
1. Earth Work 1.06 com
2. Brick Work 1:4 2.425 + 1.616/2 3.233 cum
3. Plastering 1:4 9.727 m2
CONSUMPTION OF MATERIALS
S.NO. Particulars Quantity Cement
(Bags)
Coarse Sand (cum) Brick (nos.)
1. Brick work 1:4 3.233 cum 5.82 0.873 1487
2. Plastering 1:4 9.727 m2 1.07 0.146 -
Total 6.89 1.019 1487
Say 7 Bags 1.02 cum 1500 nos.
COST OF MATERIALS S.NO. Particulars Quantity Rate Amount
1. Cement 7 Bags 255.00/Bag 1785.00 2. Coarse Sand 1.02 cum 910.00/cum 928.20 3. 1st Class Brick work 1:4 1500 nos. 4050.00/
Thousand 6075.00
Total Rs. 8,788.20

-------------------------------------------------------------------------------IWMP-IInd MAU (UP):DoLR
131
LABOUR CHARGES
S.NO. Particulars Quantity Rate Amount
1. Earth Work 1.06 cum 36.66/cum 30.85 2. Brick 3.233 cum 370.00/cum 1196.21 3. Plastering 9.727 m2 40.00/m2 389.08
Total Rs. 1616.14
Total Expenditure 1. Cost of Materials 8788.20 2. Labour Charges 1616.14
Total Rs.10,404.34 Say Rs. 10,400.00 only
DAIRY WORK In income generating activities through Self Help Group, landless and marginal farmers are advised to use three or four cows of SANKER breed or two or three buffalos of MURRA breed, for their good life. Establishment of Goat Unit for S.H.G.’s formed in I.W.M.P. IInd Mau Project District Sant Kabir NagarII is situated in eastern part of state, where the number of goat/sheep is very less and they are small in nature, Goat Population is appreciable and is fact, it is the major source of livelihood for poor people of the district. in the state , on an average, 16 kg of meat is obtained from a goat, if they are dewormmed twice, shall be increment of 4 kg in meat on an average, benefiting the farmers of the state. Deworming and vitamins, mineral- supplement to the goats shall enhance their productivity and also improve anti-body response and protection level through vaccination, i.e., importance in efficiency of vaccination. More Productivity and assured health and low mortality shall result into adoption of more framers to goat farming with the formation of more S.H.G. ‘s and in turn availability of goats for processing unit. Goat excreta shall be of immense help in enrichment of soil fertility.

-------------------------------------------------------------------------------IWMP-IInd MAU (UP):DoLR
132
Establishment of Goat Units for S.H.G.’s Eastern region, due to the geo-climate conditions and land pattern is favorable for goat husbandry. Goats thrive Well in dry and semi-dry climate with bushes and thorny vegetation. Presently in this area, farmers rear goats for their livelihood. If goat husbandry would be transformed to intensive husbandry, there shall be more economic stability of farmers, more profit sharing and availability of running capital for future expansion. Kepping in view above fact, goat unit shall be formed in the area in intensive way. 16 Goat Unit are Proposed in I.W.M.P. IInd Project for S.H.G. one unit constituting 10 goats and 1 buck will be distributed to one S.H.G. A register Of S.H.G. will be maintained by Secretary Of S.H.G. in the supervision of W.D.T. member . The details of benficiaries Of S.H.G. including the breed of goat reared, breeding and feeding status, deworming status, deaths, post mortem conducted claim settlement and working status of unit will be maintained in the register. Preferences shall be given in consecutive years in purchasing the goats and bucks for new unit, from old units for which database maintained shall be of use and it should be assured by buy back arrangement Financial Component S.No. Component Amount
1. Cost Of 10 goat of improved breed (Not less than 6 months of age) @Rs. 3000.00 each
30000.00
2 Cost of 1 back of improved breed @ Rs.5000.00 5000.00 3 Cost of insurance @ 11.63/unit 4070.00 4 Feed cost for 3 months @ 250gm/day for goats @Rs.11.84/250gm 2930.00 5 Provision of deworming, mineral and vitamin supplement, treatment,
vaccination @ Rs/160/animal 1760.00
6 The expense including monitoring expenses, register and record @Rs.170.00/unit
170.00
Total Rs. 43,930.40 Say Rs. 43.950.00

-------------------------------------------------------------------------------IWMP-IInd MAU (UP):DoLR
133
Estimate of Livestock Development Activities Total number of female animals: Buffa1o - 4725
Cow - 5597
Total - 10,322
1. Artificial Insemination (A.I.): 33% of total animals per year, i 3406 (say 3400 nos.)
Amount required for A.I. by BAIF @ 100.00/ animal.
Total Amount - Rs. 3,40,00.00 2. Vaccination: Total number of animals in I.W.M.P IInd - 12657 nos.
1. H.S. + B.Q. @ 5.50 69,613.50
2. F.M.D. @10.50 2 (Twice in a year)
Total Amount - Rs. 3,35,410.00 3. Deworming: Adult animals -. 11472
Child animals - 1185
Albendazole for 11472 animals @ 40.56 4,65,304.00
1185 child [email protected] 24,032.00
Total Amount - Rs. 4,89,336.00 4. Mineral Mixture: Agnmine Forte Chelated for 8205 animals @ 115.00 Rs. 9,43,575.00
GRAND TOTAL - Rs. 21,08,321.00

-------------------------------------------------------------------------------IWMP-IInd MAU (UP):DoLR
134
12- DRWAING AND DETAILS ESTIMATE OF PRODUCTION SYSTEM AND
MICRO-ENTERPRISES (ANNEXURE-3)
DEMOSTRATION OF WHEAT
1. Variety recommended for District Irrigated - W.H.- 542 Unirrigated – K 8027 , K – 5351 (Mandakini)
Kathia – Raj 1555
2- Seed rate – 100 -125 Kg/ hectare
3- Requirement of fertilizers / ha N- 125 Kg , P- 70 -75 Kg, K-70-75 Kg
ESTIMATE OF DEMONSTRATION OF WHEAT IN EATERSHED (PER HA)
S.No. Particulars Quantity Rate Amount Remarks
1 Tillage operation or preparation of field for sowing
100.00 kg 1000.0/ha 1000.00
Since the project is to be operated in a participatory Mode, contribution in form of the tillage ,sowing, irrigation and harvesting done by farmer is not included in the estimates
2 Cost of seed 1.00ha 18.00/kg 1800.00
3 Sowing by seed drill 160 Kg 1000.00/ha 1000.00
4 D.A.P. 18:46 210 Kg 573.00/50 kg 1833.60
5 Urea 150 Kg 270.00/50 kg 1134.00
6 Potash (M.O.P.) 1.0 0ha 300.00/50 kg 900.00
7 Irrigation (three irrigation) 1.00ha 650.00/ha 650.00
8 Harvesting 2000.00/ha 2000.00
Total 5657.60
Say 5700.00
Hence demonstration cost of wheat /ha is Rss 5700.00
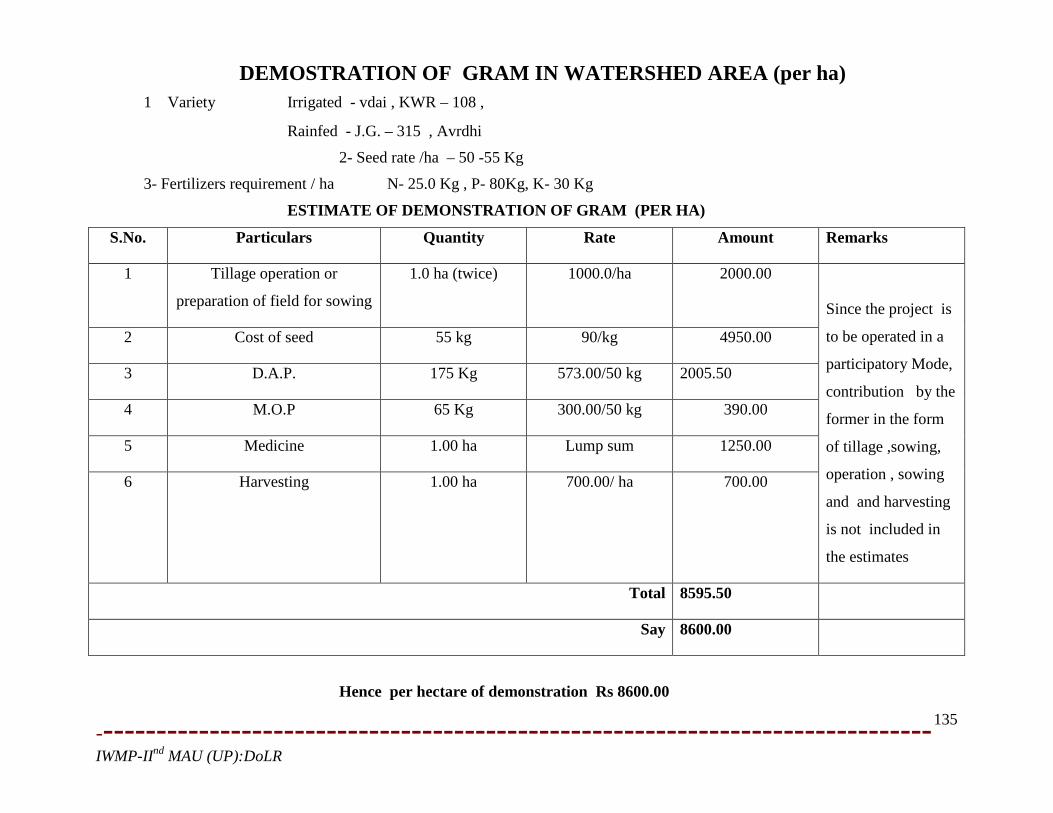
-------------------------------------------------------------------------------IWMP-IInd MAU (UP):DoLR
135
DEMOSTRATION OF GRAM IN WATERSHED AREA (per ha)
1 Variety Irrigated - vdai , KWR – 108 ,
Rainfed - J.G. – 315 , Avrdhi
2- Seed rate /ha – 50 -55 Kg
3- Fertilizers requirement / ha N- 25.0 Kg , P- 80Kg, K- 30 Kg
ESTIMATE OF DEMONSTRATION OF GRAM (PER HA)
S.No. Particulars Quantity Rate Amount Remarks
1 Tillage operation or
preparation of field for sowing
1.0 ha (twice) 1000.0/ha 2000.00
Since the project is
to be operated in a
participatory Mode,
contribution by the
former in the form
of tillage ,sowing,
operation , sowing
and and harvesting
is not included in
the estimates
2 Cost of seed 55 kg 90/kg 4950.00
3 D.A.P. 175 Kg 573.00/50 kg 2005.50
4 M.O.P 65 Kg 300.00/50 kg 390.00
5 Medicine 1.00 ha Lump sum 1250.00
6 Harvesting 1.00 ha 700.00/ ha 700.00
Total 8595.50
Say 8600.00
Hence per hectare of demonstration Rs 8600.00

-------------------------------------------------------------------------------IWMP-IInd MAU (UP):DoLR
136
DEMOSTRATION OF ARAHAR IN WATERSHED AREA (per ha)
1 Variety - Malviya -13 narendra -1 Amar I 2- Seed rate /ha – 30 Kg 3- Fertilizers requirement / ha N- 20.0 Kg , P- 50Kg, K- 40 Kg
ESTIMATE OF DEMONSTRATION OF ARAHAR (PER ha)
S.No. Particulars Quantity Rate Amount Remarks
1 Tillage operation in
preparation of field for sowing
1.0 ha 1000.0/ha 2000.00
Since the project is
to be operated in a
participatory Mode,
contribution by the
former in the form
of tillage operation,
sowing and and
harvesting provided
by participating
farmers ,hence this
cost is not
included in the
estimates
2 Cost of seed 30.0 kg 120.00/kg 3600.00
3 Nitrogen N.P.K.
12:21:16
190.0 Kg 470.00/50 kg 1786.50
4 Urea - - -
5 M.O.P - - -
6 Harvesting 1.00 ha 650.00 650.00
7 Medicine 1.00 ha Lump sum 1000.00
Total 6386.00
Say 6400.00
Hence per hectare of demonstration Rs 6400.00
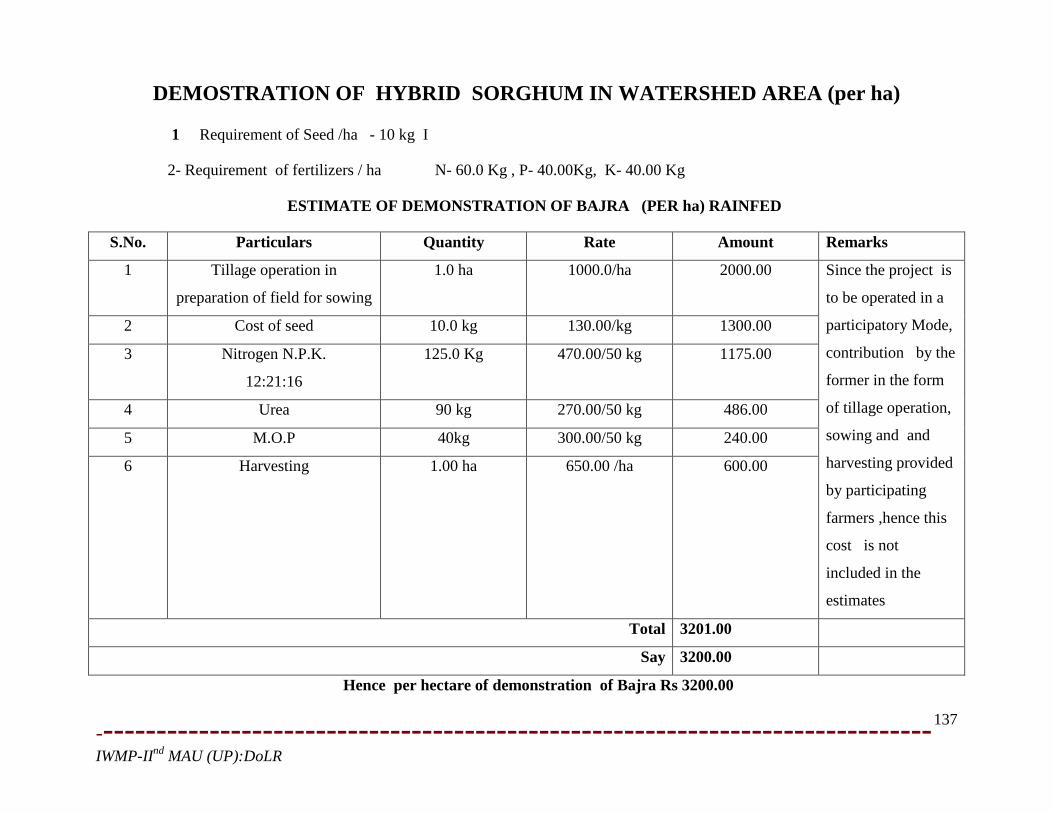
-------------------------------------------------------------------------------IWMP-IInd MAU (UP):DoLR
137
DEMOSTRATION OF HYBRID SORGHUM IN WATERSHED AREA (per ha)
1 Requirement of Seed /ha - 10 kg I
2- Requirement of fertilizers / ha N- 60.0 Kg , P- 40.00Kg, K- 40.00 Kg
ESTIMATE OF DEMONSTRATION OF BAJRA (PER ha) RAINFED
S.No. Particulars Quantity Rate Amount Remarks
1 Tillage operation in
preparation of field for sowing
1.0 ha 1000.0/ha 2000.00 Since the project is
to be operated in a
participatory Mode,
contribution by the
former in the form
of tillage operation,
sowing and and
harvesting provided
by participating
farmers ,hence this
cost is not
included in the
estimates
2 Cost of seed 10.0 kg 130.00/kg 1300.00
3 Nitrogen N.P.K.
12:21:16
125.0 Kg 470.00/50 kg 1175.00
4 Urea 90 kg 270.00/50 kg 486.00
5 M.O.P 40kg 300.00/50 kg 240.00
6 Harvesting 1.00 ha 650.00 /ha 600.00
Total 3201.00
Say 3200.00
Hence per hectare of demonstration of Bajra Rs 3200.00

-------------------------------------------------------------------------------IWMP-IInd MAU (UP):DoLR
138
DEMONSTRATION OF AGRO-HORTICULTURE USING PLASTIC DRUM OF 200 LITRES CAPACITY District Sant Kabir Nagaris situated in Eastern U.P. region where there is scarcity of water and in summer temperature rises up
to 45c causing upper layer of fields dry and therefore mortality rate of plants is very high. Farmers usually like to grow grain crops only. They are not interested in horticulture because of less holding. The production of crops decreases below the tree. Therefore to promote horticulture with crops a demonstration model using plastic drums for horticulture is made. Mainly crops roots go in to the soil up to “4-5” in cereal crops and “6-9” in pulses. Using plastic drums the plants will be planted 50-60 cm below the ground level which is below the root zone of crops. Therefore trees will not able to take nutrients from upper layer of fields and there will no effect of plants on crops
In summer season up to 1 to 1.50m depth of soil becomes dry causes more mortality rate of plants, using drums plants are planted below 50-60 from Ground level and in rainy and winter season up to February roots of plants goes below 2.lOm below where moisture will be available and plants will be safe in summer also. Using barbed wire fencing the plants will be protected. Therefore, it is hoped that farmers will adapt this procedure for Agro-forestry and will become prosperous.
DETAIL ESTIMATE OF DEMONSTRATION OF HORTICULTURE AND MIXED CROPPING S.No. Description of Works No. L. B. D./H. Quantity
1 Earth work in cutting 156 3.14 x 1.20 - 1.35 793.54
Trench 156 1.50 0.75 0.75 131.62
Fencing Poll 133 0.20 0.20 0.20 1.064 Total 926.22 cum
Farm yard manure 156x 10 - 1560 kg Filling of earth work with farm yard
manure 156 3.14 x 1.00 - 1.20 587.80 cum
C.C.W. 1:2:4 for fencing poll 133 0.20 0.20 0.20 1.064 cum Angle iron of poll 133 1.80 - - 239.40 m Barbed wire 3 400 - - 1200.00 m Plants 156 - - - 156 nos Plastic drum (200 litre) 156 - - - 156 nos

-------------------------------------------------------------------------------IWMP-IInd MAU (UP):DoLR
139
CONSUMPTION OF MATERIAL
S.N. Description of Work
Quantity Farmyard Manure (Kg>
Cement Bags (nos)
Coarse Sand ( cum)
G.S. Grit 10-20 mm
Angle Iron (m)
Barbed Wire (Kg)
Planting Drum (nos)
1 C.C.W. 1:2:4 1.064 cum - 6.49 - - - - -
2 Angle Iron 239.4 m - - - - - - -
3 Barbed wire 1200.0m - - - - - - -
4 Farmyard manure
1560.0 kg 1560 kg - - - - - -
5 Plastic drum 156 nos - - - - - - -
Total 1560.0 kg 6.49 0.446 0.883 239.40 1200.00 156
Say 1560.0 kg 6.50 bags 0.450 bags 0.900 cum 239.40 1200.0 m 156
COST OF MATERIALS
S.No. Particulars Quantity Rate Amount 1. Fram yard manure 1560.0kg 10,00 kg 15600.00
2. Barbed wire 1200.0m/120.0kg 60.50/kg 7260.00 3. Angle Iron 239.40m/785kg 40.50/kg 31792.50
4. plastick drum 156 nos 690.50each 107640.00 5. Cement 6.50bags 255.00/bag 1657.50
6. Coarse Sand 0.450 cum 910.00/cum 409.50
7. G.S.Grit 10-20mm 0.900 cum 1250.00/cum 1125.00
8. Plants 156 nos 18.00each 2808.00
Total Rs.1,68,292,50

-------------------------------------------------------------------------------IWMP-IInd MAU (UP):DoLR
140
LBOUR CHARGES
S.NO. Particulars Quantity Rate Amount
1. Earth work 1514.02cum 36.66/cum 55503.97
2. C.C.W 1:2:3: 1.064 cum 492.00 cum 523.88
3. Fixing of angle iron 10 man days 100/Man Day 1000.00
4. Fixing of barbed wire 15 man days 100/Man Day 1500.00
Total Rs, 58,527.85
5- Lack of infrastructure including marketing.
(B) Soil constraints 1- Poor nutrient status of the soil
2- Physical impediment
3- Moisture stress / water logging / inadequate drainage.
(C) Plant related constraints 1- Problem of plant establishment
2- Physiological disorders
3- Fruit drop and poor productivity
4- Incidence of insects-pests.
However, apart from the above mentioned constraints, the measure bottleneck in horticulture development are poor technological advancements, high initial establishment cost, high input demand , timely operation and seasonal shortage of labours, etc.
Total Expenditure 1. Cost of materials 1,68,292.50 2. Labour Charges 58,527.85
Total Rs.2,26,819.50.00 say Rs.2,26,820.00 only
-------------------------------------------------------------------------------IWMP-IInd MAU (UP):DoLR
141
CONCEPTS AND ADVANTAGES OF CONSERVATION HORTICULTURE
Conservation horticulture or horticulture land use based on soil and water conservation principle is a suitable alternative for
utilization and management of land under rainfed conditions. Thus horticulture development in watershed• management appears to be
the most appropriate technique for sustained productivity as well as for restoration of degraded lands. In fact, horticulture system meet
all the basic needs-food, fruits, fodder, fuel and timber besides, providing employment and sustaining a number of products for
industries.
The fruit trees grown with crops can provide. fueJ from pruned-shoots and dried- bra leaf--fodder for animals and leaf litter
that can be utilized as mulch material and organic matter the leaf litter of deciduous fruit trees not only protects the top soil from the
impact of raindrops but also improve soil structure, reduces évapotrànspiration, increases infiltration and add to the nutrient status of
soil. Therefore conservation based horticulture land use system assumes great significance as fruit trees on degraded lands provide
higher returns and offer alternative opportunity in non-arable areas where cropping may not be possible.
CONSERVATION HORTICULTURE PRACTICES
Some of the important practices are given below
1- Selection of Suitable Fruits Types: For the success of conservation horticulture, selection of hardy varieties resistant to diseases
and pests and use of local or other hardy root stocks for raising fruit-trees is of great importance. The major part of the reproductive
cycle i.e. Period from flowering to fruiting must also fall during maximum water availability period and the root ripening must be
completed before the onset of dry summer (April-May).
Ber, Guava, Karonda, Be), Amla, Lemon, and Phalsa etc. are the plants which fulfill this requirement and all these fruit plants are
most suitable for Bunde region.

-------------------------------------------------------------------------------IWMP-IInd MAU (UP):DoLR
142
2- Planting Techniques:_ For degraded lands, pits should be dug of im x im x im size, the excavated soil is mixed with Farmyard
Manure (FYM) @ 5-10kg/pit with doses of potash and phosphorous and some insecticide / pesticide (numicide / aldrex) for
prevention of white ant. Planting of the fruits plants should be done with the onset of monsoon.
3- Use of Root Stokes:_ Budding and grafting on the wild root stock gives benefit of the establishment root and in turn provides
better quality fruits with high field potential. For example, Ziziphun mauritiana, a wild ber can be successful budded with scion of
improved cultivars, This practice is only successful where sizable patch of wild root stock is available. The budded/grafted stock
needs intensive management as it is required to be protected from the wild animals, birds,
insects, pests etc. The wild root stock develops efficient top root to provide moisture and nutrients to the scion. Amla. Bel is other
examples of raising the improved cultivation the wild root stock.
4- In Situ Water Harvesting:_ Since on slopy lands, runoff water is considerably higher, therefore, it should be harvested and used.
The run off can be utilized for growing fruit plants in such a way that each tree in the established plants is at the time of fruit setting
and fruiting. Moisture available at this critical period improves the fruit yield.
Runoff water will be harvested and stored in tanks during the rains. The stored water will be utilized at the time when the fruit trees
show moisture stress during dry months. Counter trenches will dug between the rows of fruit trees because this is effective in
conserving moisture and providing soil erosion.
5-Mulching: Mulching is practiced to conserve moisture. It prevents the loss of moisture by evaporation and improve water intake by
the soils. Various organic (Straw, hay, manure, tree leaves, dry wads) Mulches are used for mulching. Use of plastic mulch has been
taken in rainfed and dryfarrming conditions to increase the productivity by minimizing evapotranspiration losses.

-------------------------------------------------------------------------------IWMP-IInd MAU (UP):DoLR
143
6-Drip Irrigation: Drip irrigation saves water by 40 to 70 percent and two to three times mare area can be irrigated with the same amount of available water. It has the advantages that it ensures uniform distribution of water, provides perfect control over water application and minimizing the losses during convergence and seepage.
Estimate of Orchard Development in the Watersheds Per Hectare (Without Fencing) S.No. Particulars Quantity Rate Amount Remarks
A, Horticulture
1. Soil Working 1m x 1m size pits (270nos.) including cost of refilling
270.00 cum 36.66/cum 9898.20 Since,the project is to be operated in a participatory mode,countribution in the form of labour input for pit digging, FYM and its applications, weeding and hoeing are to be provieded by the participating farmers, hens the cots are no included in the eastmates,
2. Aplicetion of Farmyard manure inclding cast
L.S. 450.00
3. Cost of NPK mixture. neemicide @ 250 gm/plants
L.S. 400.00
4. Cost of plants (including 15% etc. for mortality) including transportation and planting
310 nos. 15.00/Plant
4650.00
5. Casualty replacement @ 10% of item no. 4&5
465.00
6. Cost of 2 weeding and hoeing 1.00/Plant 540
7. Contingency and unforeseen (3%) 492.00
Total Rs.6,007.00
Say Rs. 6,000.00
Maintenance cost 2nd Year onwards – 15% of 1st year cost
900.00
For next 5 years i.e.,Rs. 900x5 4500.00
Total Cost Rs. 10,500.00
Say Rs.10,500.00
B. Agro-Horticulture (Cost per ha) 1 Cost of raising 270 plants UP to 5 year @
Rs. 10,000.00 10500.00 The remarks mentioned under
Horticulture are also applicable for agro Horticulture. 2 Cost of rasising agricultural Crops @ Rs.
5,000 per hectare per year 5000.00
Total Rs.15,500.00

-------------------------------------------------------------------------------IWMP-IInd MAU (UP):DoLR
144
Estimate of Orchard Development in the Watersheds Per Hectare (With Fencing)
S.No. Particulars Quantity Rate Amount Remarks A, Horticulture 1. Soil Working 1m x 1m size pits (270nos.)
including cost of refilling 270.00 cum 36.66/cum 9898.20 Since,the project is to be operated in a
participatory mode,countribution in the form of labour input for pit digging, FYM and its applications, weeding and hoeing are to be provieded by the participating farmers, hens the cots are no included in the eastmates,
2. Aplicetion of Farmyard manure inclding cast L.S. 450.00
3. Cost of NPK mixture. neemicide @ 250 gm/plants
L.S. 400.00
4. Cost of plants (including 15% etc. for mortality) including transportation and planting
310 nos. 15.00/Plant
4650.00
5. Casualty replacement @ 10% of item no. 4&5
465.00
6. Cost of 2 weeding and hoeing 1.00/Plant 540
7. Contingency and unforeseen (3%) 492.00
Total Rs.6,007.00
Say Rs. 6,000.00
Maintenance cost 2nd Year onwards – 15% of 1st year cost
900.00
For next 5 years i.e.,Rs. 900x5 4500.00
Total Cost Rs. 10,500.00
Say Rs.10,500.00
B. Agro-Horticulture (Cost per ha)
1 Cost of raising 270 plants UP to 5 year @ Rs. 10,000.00
10500.00 The remarks mentioned under Horticulture are also applicable for agro Horticulture.
2 Cost of rasising agricultural Crops @ Rs. 5,000 per hectare per year
5000.00
3. Fencing 45300.00
Total Rs.60,800.00

-------------------------------------------------------------------------------IWMP-IInd MAU (UP):DoLR
145
COST IN PLANTING ONE PLANT WITH DIGGING, FILLING MIXED WITH FYM AND COST OF PLANT
S.n
Particular No. L B D/H Quantity Rate Amount
1 Earth work in digging 1 1.0 1.0 1.00 1.00 36.66 36.66 2 Cost of FYM,in kg/pit 1 - - - 10kg 8.00 8.00 3 Filling of pits mixed with FYM
and soil 1 1.0 1.0 1.0 1.00 36.66 36.66
4 Cost of plants 1 - - - 1 18.00 18.00 Total 171.32 Say Rs.172.00
ESTMATE FOR SILVI-PASTROAL SYSTEM (RS.ha-1) PLANTATIONS (800 PLANTS ha1 ) S.N
Particulars of work Rate (Rs.)
Cost (Rs.)
Remarks
1- Clear felling or bush clearance of area Infected with Lantana etc,including cost of burning
LS 550.00 The area is to be procted through biofencing
2- Soil working – earth work ,digging of Pits / holes 60 cm deep, 30cm dia -800 Nos.Including cost of refilling and trenching.(400trenches/ha)
LS 6085.00
3- Cost of seedlings for 900 nos and grass /legumes seeds and planing.sowing
- 2050.00 Rs.2.00 per seeding
4- Weeding and hoeing(2 Nos.) LS 300.00 Total 8985 Mainteance 2nd Years 15% of the 1st year Xpenditure including being up 1st year failure Grand total say
10.335.00 10.335.00

-------------------------------------------------------------------------------IWMP-IInd MAU (UP):DoLR
146
DEMONSTRATION OF GREEN MANURING Green Manuring is very useful but due to sowing of Kharif season crop, lack of suitable type of seeds, and limitation of
moisture, it is not widely practiced. Green Manuring brings immediate advantage because of its quick decomposition where as FYM and compost improves the soil physical condition in the long-run. Benefits of Green Manuring accrue from substitution of chemical fertilizers, enhance soil biological activities and erosion control due to vegetative cover. Sesbania Species (Dhaincha) and Crotolaria Juneea (Sunhemper Sanai) are most common green manure crops. They accumulate about 100 kg N/ha in their biomass and 64-88% of this is derived from atmosphere. Apart from direct benefit of green Manuring as a source of nutrients and organic matter, it has the capacity to mobilize soil phosphorus and other nutrients. It also helps in reclamation of problem of soil, e.g., Sesbania helps in removing exchangeable sodium and reclamation of salt affected soils.
In District Sant Kabir Nagar more fields are kept fallow and only single crop in Rabi is grown. Therefore, this area is suitable for Green Manuring. Therefore, in I.W.M.P.IInd Sant Kabir NagarProject, efforts will be made to oblise the farmers for Green Manuring.
4 typical estimate is made for Green Manuring is given below:
ESTIMATE FOR GREEN MANURING IN THE WATERSHED (PER ha)
S.No. Parcticulurs Rate Cost Remark
1 Seed of Sesbania (Dhanicha) 25 Kg /ha 25.00 /kg 625 Since the prokect to be
operated in a
participatory mode
contribution in the form
of tillage will be done by
farmers in not included
in the estimate
2 Tillage operation before sowing and to
plough the plants of dhaincha after 40 –
45 days of sowing for Green Manuring
1000/ ha Before and
after saring
2000.00
Total Rs . 625.00
Therefore cost per hectare of Green Manuring is Rs. 625.00/ha

-------------------------------------------------------------------------------IWMP-IInd MAU (UP):DoLR
147
PASTURE MANAGEMENT Introduction: The sound animal industry in any country centers around good quality feed and fodders. The livestock population in
India is nearly 15%of the total livestock population of the world, tough we have only 2% of the world’s geographical area. The project
on for green and dry fodder requirement in India has been estimated at 1061 and 590 million tons by 2010 A-D, while the present feed
and fodder resources in the country can meet only 4% of the requirement. The grazing intensity is very high i.e., 26 adult cattle unit
(ACU)/ha as against 0.8 ACU in the developing countries. The importance of grasses for protection and production, the two aspects of
soil and water conservation is well known. Grass is unique in that it is the only resource utilized in situ by grazing. A “grassland” or
more appropriately, a “range” is defined as “the areas which are predominantly covered with grasses or grass like plants and are
primarily utilized as for age for grazing animals or used as hay.” The grasslands are the major sources of food to the animals.
Pasture Management: All grazing areas are referred to as pastures, but ore specifically the term is applied to cultivated grassland
used for grazing. Thus pastures are artificial grasslands with or without non-grass vegetation (such as legumes) that are created with
selected high forage-yielding grass and legume species and with inputs like fertilizers and irrigation and carefully managed to exclude
all other vegetation. Pastures are usually fenced and used either for grazing, for gay and silage making or for both.
Intensive Fodder Production: In areas where. the. major enterprise of the farmers centers around the milk production. Continuous
supply of green fodder round the year is the basis for success of such as industry. Under the aegis of ICAR’s all India coordinated
Research Project on Forage Crops, several highly productive fodder cropping system have been tested and recommendations made for
their general use. For central region important intensive crop rotations are presented as given below:

-------------------------------------------------------------------------------IWMP-IInd MAU (UP):DoLR
148
Zone wise crop rotations Green fodder yield(t / ha)
Central region
1- Hybrid napier +Cowpea-Berseem+Japanrape 286.3
2- Maize+Cowper-Jowar-Berseem+Japanrape 197.2
3- iawar+Cowper-Berseem+Japanrape-Jawer+Cowpea 168.6
Conservation on of Forages: In order to sustain animal production, it is essential that the optimum feeding should be maintained
round the year. In India, we have two seasons, rainy season and winter season, when surplus quantities of green fodder is available-
country to this there are 2 to 3 months of lean periods(October-November and April to July) when the fodder availability to animals is
at its low. In the summer months, it is difficult even to meet the maintenance
requirements of the animals. Stage of maturity to feed the animals adequately during the lean period. The conservation of forages
could be done in the form of silage from cultivated fodders (legumes and cereals) and also pasture grasses.
Forages could also be conserved in the form of hay when dried to its nutrients. This feed stuff is quantitatively important from both
maintenance and nutritional point of view.
Agro-forestry system for fodder production:_A number of fodder trees play an important role in human food security through their
function as animal food sources, especially as drought services. Agro-forestry systems consisting of such tress and animals and/or
pasture are called Silvo-Pastoral system. Silvi-Pasture (or Silvo-Pastoral system) is the most promising alternate land use system
which integrates multipurpose trees, shrubs, legumes and grasses mostly on non arable, degraded and marginal lands for optimizing
land productivity. It helps in conservation of vegetation, soil and nutrients and provides forage, timber and fuel wood on a sustainable
basis. Potentials of Semi-arid region for different forage production systems.
Region Forge Production Systems Semi arid Integration of Agro-Silvi-Pasture, dry land agriculture on cultivated lands. Forage-cum-
Copping forming on the marginal and sub marginal lands with intercropping dry lands cereals and legumes

-------------------------------------------------------------------------------IWMP-IInd MAU (UP):DoLR
149
ROLE OF GRASSLAND IN SOIL CONSERVATION
The grass plant itself protects the soil from the forces of water erosion including the impact of rain drops and surface flow.
Grass acts a spring cushion intercepting and broking up the falling rain drops in their way down. Conducting the water down the
blades and stems of the plants and finally allowing it to reach the ground as fine sprays without disturbing the surface. Clamps of grass
plants, in a mechanical way, obstruct-flowing water and reduce its rate of flow. In fact to control soil erosion whatever technique is
adopted, there are four approaches to deal with the problem:
1- To condition the soil to make it resistant to determent and transportation and create more absorptive surface layer.
2- To cover the soil so that it is protected from the impact of wind and rain drops.
3- To decrease the velocity of wind or runoff water.
4- To provide safe disposal outlet for surplus run off.
Grass in the nature highly efficient device to protect the soil from destructive forces like rain , wind etc. Grass and legumes increase
the aggregation of soil particles; improve soil structure and water holding capacity of the soil. Grasses gives quicker protection to
eroded lands. To establish gully sides, water ways, gully head and check dams. Grass is perhaps the most effective and economical
tool. It can put to various uses in soil conservation:
1- Strip cropping, rotational cropping or lay farming.
2- Stabilization of bunds and terraces.
3- Stabilization of gullies, diversion or drainage channels.
4- Stabilization of sand dunes.
5- Meadows and pasture on steep slopes.
6- Fertility builder for eroded soil.

-------------------------------------------------------------------------------IWMP-IInd MAU (UP):DoLR
150
Expected/Estimated Outcomes (IWMP-II-2nd)-Mau
S. No.
Name of the District Item Unit of
measurement Pre-project
Status Expected Post-project Status Remarks
1 MAU Status of water table Meters 6-8 5-6 2 Ground water structures repaired/ rejuvenated No. - 120 3 Quality of drinking water Quality Poor Good 4 Availability of drinking water Days 320 365 5 Increase in irrigation potential % 3 6 6 Change in cropping/ land use pattern Cropping pattern Single/ double Double/ multiple 7 Area under agricultural crop Ha 7305.00 6758.00 8 i Area under single crop Ha 5780.00 5233.00 9 ii Area under double crop Ha 1300.00 800.00 10 iii Area under multiple crop Ha 225.00 725.00 11 Net increase in crop production area Ha - 950.00 12 Increase in area under vegetation Ha 1.50 167.00 13 Increase in area under horticulture Ha 8.50 390.00 14 Increase in area under fuel & fodder Ha 2.00 15.00 15 Increase in milk production Av.lit/day/ cattle 1.75 3.10 16 No. of SHGs No. 25 80 17 Increase in no. of livelihoods No. 5 15 18 Increase in income Rs. 19295.00 25295.00 19 Migration % 9.00 5.00 20 SHG Federations formed No. 9 19 21 Credit linkage with banks No. 8 32 22 Resource use agreements % Agreed 100% as per
required
23 WDF collection & management % 5-10 100% collection during project period
Summary of lessons learnt Date; Signature of officers authorized
by State Govt. with name and Designation

-------------------------------------------------------------------------------IWMP-IInd MAU (UP):DoLR
151
Chapter-13
MAPPING

-------------------------------------------------------------------------------IWMP-IInd MAU (UP):DoLR
152

-------------------------------------------------------------------------------IWMP-IInd MAU (UP):DoLR
153

-------------------------------------------------------------------------------IWMP-IInd MAU (UP):DoLR
154

-------------------------------------------------------------------------------IWMP-IInd MAU (UP):DoLR
155

-------------------------------------------------------------------------------IWMP-IInd MAU (UP):DoLR
156

-------------------------------------------------------------------------------IWMP-IInd MAU (UP):DoLR
157

-------------------------------------------------------------------------------IWMP-IInd MAU (UP):DoLR
158
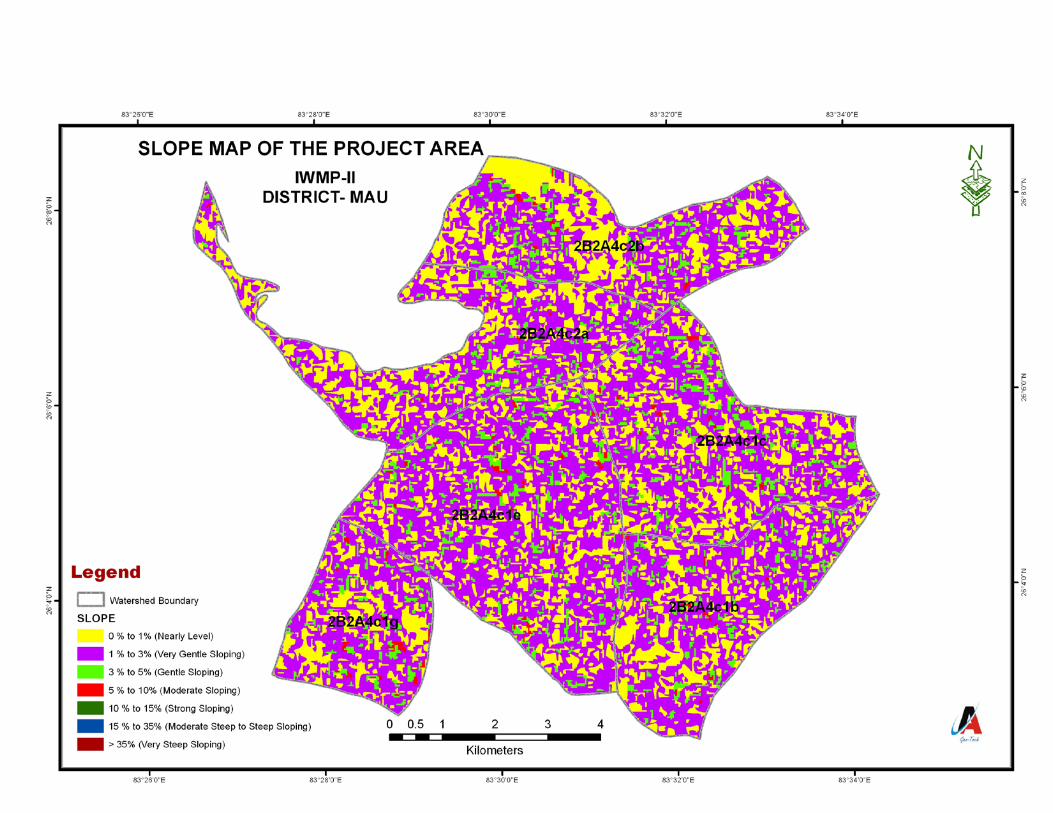
-------------------------------------------------------------------------------IWMP-IInd MAU (UP):DoLR
159

-------------------------------------------------------------------------------IWMP-IInd MAU (UP):DoLR
160

-------------------------------------------------------------------------------IWMP-IInd MAU (UP):DoLR
161

-------------------------------------------------------------------------------IWMP-IInd MAU (UP):DoLR
162
PERPARTION OF DPR
Detail Project Report Of Integrated Watershed Management Programme IWMP-IInd had been prepared through base line/bench Mark survey for Physiographic climate, soil land use, vegetation, hydrology and socio economic date analysis PRA have been exercised to collect primary date secondary date have been collected from Revenue Statistics department Statistical Magazine oft the district, Mau. Toposheet (1:50000) survey of india Dehradoon and technical & specifie input and health with prepartion and drafting of detail project report. Staff at PIA level
S.N. Name Designation Qualification 1 2 3 4 1 Sri Surahoo Ram BSA, IWDP,Mau Inter, Agril Engineering Diploma 2 Dr N. K. Singh Scientist, KVK, Mau Ph. D. 3 Sri Ramdas JE IWDP,Mau Inter, Agril Engineering Diploma 4 Md. Mustkim Accountant IWDP,Mau M. Com 5 Md. Naseem Akhta Draft man IWDP,Mau Draftsman Si. 6 Sri Vinod Kumar Asst Accountant IWDP,Mau M.Com, LLB 7 Sri Ramdhari Yadav S. Clerk, IWDP,Mau Inter Comerce 8 Sri Janardan Singh Jr. Clerk IWDP,Mau B.A. 9 Sri J. P. Rai Jr, Clerk IWDP,Mau M.A. 10 Sri S. P. Singh Munsi IWDP,Mau B.A. 11 Sri Subedar Yadav Tracer IWDP,Mau Iner 12 Sri Anshuman Pandey Tracer IWDP,Mau B.Sc. B.Ed. 13 Sri Seshnath Verma Jiledar IWDP,Mau Inter 14 Sri O.P.Shukla SP, IWDP,Mau Inter 15 Sri Jokhan Lal S.P. IWDP,Mau B.A. 16 Sri Devanand Tiwari SP, IWDP,Mau Inter 17 Sri Nibbo Lal SP IWDP,Mau Inter 18 Sri Anil Kumar Pandey SP, IWDP,Mau B.A. 19 Sri Rama Shankar Mishra ASCI, IWDP,Mau B.Sc. Ag. 20 Sri Laldhar IVth Class IWDP,Mau Class 9 21 Sri Ramdhari Singh IVth Class IWDP,Mau Class 7 22 Sri Ashok Kumar IVth Class IWDP,Mau Class 8 23 Sri Ram Prashad IVth Class IWDP,Mau Class 5 24 Sri Barsati yadav IVth Class IWDP,Mau Literate 25 Sri Umashankar Kushwaha IVth Class IWDP,Mau Inter 26 Sri Rakesh Ram IVth Class IWDP,Mau Class 9 27 Sri Dipendra Kumar Mishra IVth Class IWDP,Mau B.Sc. Type 28 Sri Sarvjeet Sharma Comp. Aperator IWDP,Mau Inter, Computer Diploma

-------------------------------------------------------------------------------IWMP-IInd MAU (UP):DoLR
163
DPR PLAN ABSTRACT
The collection of all the relevant data of watershed area and the possible option and solution are
described with the help of feedback of focused discussion and detailed perspective plan for the watershed area with
year wise and activity wise semmarized for the DPR plan sbstract for 5 year (2010-11 to 2014-14) .
The summary of the above document is verified by the following persons: Prepared By: Technically Approved By: Bhoomi Sanrakshan Adhikari Deputy Director Dept. Of Land Development & Water Resources Dept. Of Land Development & Water Resources District-Mau Region-Azamgarh
Physically & Financially Approved: Project Director Chief Development Officer District Rural Development Authority District- Mau


![Detailed Project Report for the [CITY] Bus Rapid Transit System](https://static.fdokumen.com/doc/165x107/632543f65c2c3bbfa8031be4/detailed-project-report-for-the-city-bus-rapid-transit-system.jpg)