DETAILED PROJECT REPORT (D.P.R.)
145
1 DETAILED PROJECT REPORT (D.P.R.) (I.W.M.P. 2 nd - KANNAUJ) INTEGRATED WATERSHED MANAGEMENT PROGRAMME, BLOCK- CHHIBRAMAU DISTRICT - KANNAUJ (UTTAR PRADESH) Submitted to: - Prepared By:- Department of Land Development & Bhoomi Sanrakshan Adhikari Water Resources. Lucknow (U.P.) Department of Land Development & Water Resources, Kannauj Land Development & Water Resources Government of U. P.
-
Upload
khangminh22 -
Category
Documents
-
view
1 -
download
0
Transcript of DETAILED PROJECT REPORT (D.P.R.)
1
DETAILED PROJECT REPORT (D.P.R.) (I.W.M.P. 2nd - KANNAUJ)
INTEGRATED WATERSHED MANAGEMENT PROGRAMME, BLOCK- CHHIBRAMAU DISTRICT - KANNAUJ (UTTAR PRADESH)
Submitted to: - Prepared By:- Department of Land Development & Bhoomi Sanrakshan Adhikari Water Resources. Lucknow (U.P.) Department of Land Development
& Water Resources, Kannauj
Land Development & Water Resources Government of U. P.
2
INDEX S.No PARTICULARS PAGE NO.
CHAPTER 1 PROJECT BACKGROUND
1.1 Project Background 11
Table no.1: Basic Project Information 12
1.2 Need of Watershed Development Programme 13
Table no.2: Weightage of the Project 13
Table no.2.1: Criteria and weightage for selection of watershed 14-16
Table no. 3: Watershed Information 16
1.3 Other developmental Projects/Schemes running in the project area 17
CHAPTER 2 PROJECT IMPLEMENTING AGENCY
2.1 Project Implementing Agency 19-20
2.2 Programmes of IWMP-II 20
2.3 SWOT Analysis of the Project 21
Table no.6& 7: PIA, Staff at PIA Level. 22-23
CHAPTER 3 BASIC INFORMATION OF THE PROJECT AREA
3.1 Geography and Geo-hydrology 25
3
3.1.1 Land use pattern 25
Table no.8: Land use pattern 25-26
3.1.2 Soil type and topography 26
Table no.9: Soil type and topography 26
Table no.10: Flood and drought condition 26
Table no.11: Soil Erosion 27
Table no.12: Climatic conditions 27
Table no.13: Physiography and relief 28
3.1.3 Land and Agriculture 28-29
Table no.15: Agriculture 29
Table no.16: Irrigation 30
Table no.17: Crop details 30
3.1.4 Livestock 31
Table no.18: Livestock 31-32
Table no.19: Drinking Water 32
3.2 Socio-Economic Profile 33
3.2.1 Demographic Status 34
3.2.3 Infrastructure facilities 37
Table no.25: Village infrastructure 38-39
Historical time line for villages 40-65
3.3 Livelihood Pattern 66

4
Table no. 27: Per Capita Income 66
Table No.28: Dependence On Forest/Cpr 66
3.4. COMPARATIVE DATA OF THE CROP PRODUCTIVITY OF THE AREA: PROJECT AREA VS. DISTRICT VS. STATE VS. COUNTRY VS. WORLD
67
CHAPTER 4 WATERSHED ACTIVITIES
4.1 Scientific Planning 69-70
Table no.30: Detail of Scientific planning and Inputs in IWMP Projects 70-72
4.2.2 Self Help Group 73
Table no.32: SHG detail 73-74
4.2.3 User Group 74
Table no.33: UG detail 74
4.3.1 Entry Point Activity (EPA) 75
4.3.2 Watershed Development Works 76
Table No.35: Detail of activities of preparatory phase 76
Typical Design Of Contour Bund 77-102
Table No.38: Activity related to livelihood by self help groups (SHGS) in the project area 103
Horticulture Development For Watershed Management 104-107
CHAPTER 5 BUDGETING
Table no.47: Budget at a Glance 109

5
Table No.48: Financial Outlays 110-113
Table No.49: Year wise Phasing Physical & Financial item wise 114
CHAPTER 6 EXPECTED OUTCOMES
6.1 Expected Outcomes 116
6.1.1 Employment 116
Table no.52: Employment in Project area 116
6.1.2 Migration 117
Table no. 53: Details of seasonal migration from Project area 117
6.1.3 Ground Water table 118
6.1.4 Drinking Water 118
Table no. 55: Status Of Drinking Water 119
6.1.5 Crops 119
Table No. 56 : Details Of Crop Area And Yield In The Project Area 120
Table no. 57: Area Under Horticulture 121
Table No. 58: Forest/Vegetative Cover 121
Table no. 59: Details Of Livestock In The Project Areas 122-123
Table no. 60: Backward-Forward Linkages 123-125
6.2 Logical Framework Analysis 126-130
CHAPTER 7 QUALITY AND SUSTAINABILITY ISSUE
6
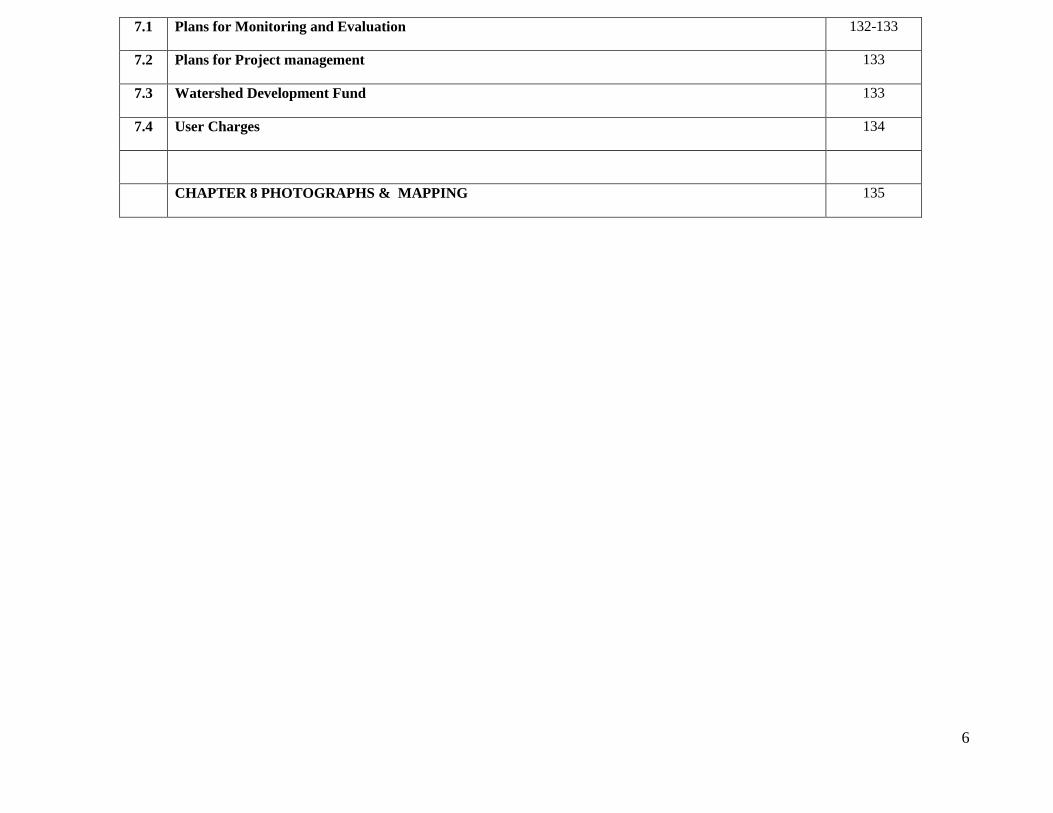
7.1 Plans for Monitoring and Evaluation 132-133
7.2 Plans for Project management 133
7.3 Watershed Development Fund 133
7.4 User Charges 134
CHAPTER 8 PHOTOGRAPHS & MAPPING 135

7
EXECUTIVE SUMMARY
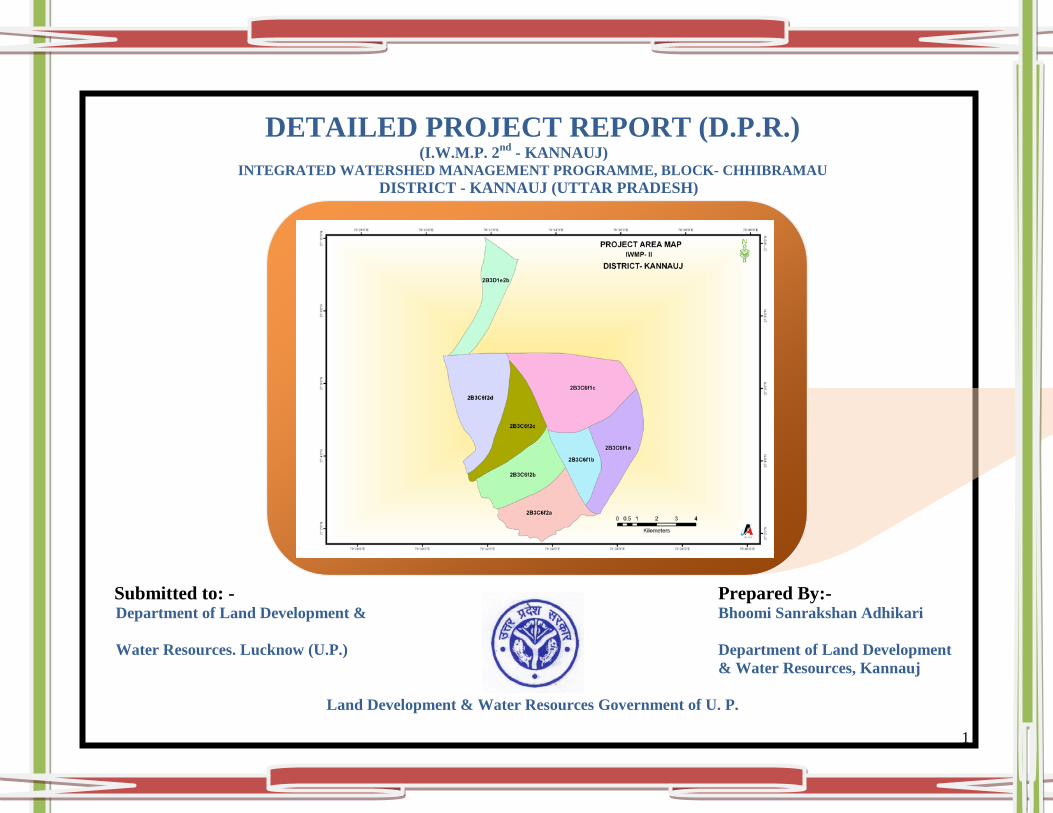
The Isan & Kali nadi watershed comprises of twenty six villages namely Bhikampur Sani, Behta Khas, Jalalpur Dildarpur,
Medepur, Khanpur Kasava, Madaripur Kasava, Kasava, Bhawalpur, Hathin, Mudaiya, Teur, Behta, Aseh, Chanderpur,
Paliyabuchpur, Jagdishpur, UdhranpurDhingpur, KunwarpurJunu, SaraiSunder, Khudava, Patrajpur, Kamalpur, Rasoolpur, Bikupur,
Anantpur , Vinayakpur.. block- Chibramau of Kannauj district of Uttar Presedh.This watershed has been identified by the state
department under NWDPRA scheme by proper prioritization of different parameter for watershed selection criteria The watershed is
located in the west of Kannauj district. It lies between 27°-0’ latitude 79°-30’ longitude (Code No. 2B3D1e2b, 2B3C6f2d,
2B3C6f2c, 2B3C6f1a, 2B3C6f2b, 2B3C6f1b, 2B3C6f2a, 2B3C6f1c) Its altitude ranges from 130 to 135 m above the mean sea level
(MSL). The total area of watershed is 7831.00 ha .It is situated in the Right catchments of the river Isan.
The climate of the region is characterized as arid to semi-arid with average annual rainfall less than 335 mm annually with an
average of 35 rainy days. Out of which about 85 percent is received during the monsoon season from July to September. The area
receives very less rainfall in the winter season. Temperature ranges from as high as 490C in the May-June to as low as 40C during
December-January. The trend of rainfall is highly erratic and maximum (65%) water goes as runoff.
The top most portion of the watershed is river Isaan of Slopy land. The soils of the area are sandy loam . The soil is Brown in
colour and are inherently high in fertility status. Soil texture is sandy loam .
Agriculture is the main source of income of the farmers of the watershed. In Kharif the main crops are Jawar, Bajra, and Makka
Most of the lands are kept fallow because maximum areas are rainfed and the main Rabi crop is taken with the conserved moisture of
rainfall. In Rabi the main crops are Gram, Wheat, Pea, Mustard, Barley .The wheat and Pea crops are taken in the irrigated fields while
the other crops are mostly taken in the rainfed conditions. In Zaid season there is no cropping due to hot weather. Horticultural crops
are taken is very less area. Only some vegetable crops are taken for domestic purpose and some fruit trees in scattered manner.
8
Animal Husbandry is not in good condition because of local breeds. Their milk production is low. Unavailability of green fodder with poor feeding and health management.
Natural vegetation of the watershed area is very poor. There are occasional occurrence of Neem plants (Azadirachta indica),
Pipal, Bargad. There is no grass land in the watershed. Grass patches are seen only on the bunds, road sides and other such places. The
principal grass is Moonj.
The problem of erosion of the watershed is to be tackled by bunding. harvesting additional water in existing water harvesting structures,
Water stored in the water harvesting structures shall be properly recycled to provide supplemental irrigation at critical growth stages of
crops and for the establishment of fruit orchards and forest trees. The agricultural land will be treated with bunding along with minor
leveling. Waste land will be treated with the engineering measures like bunds and aforestation etc
9
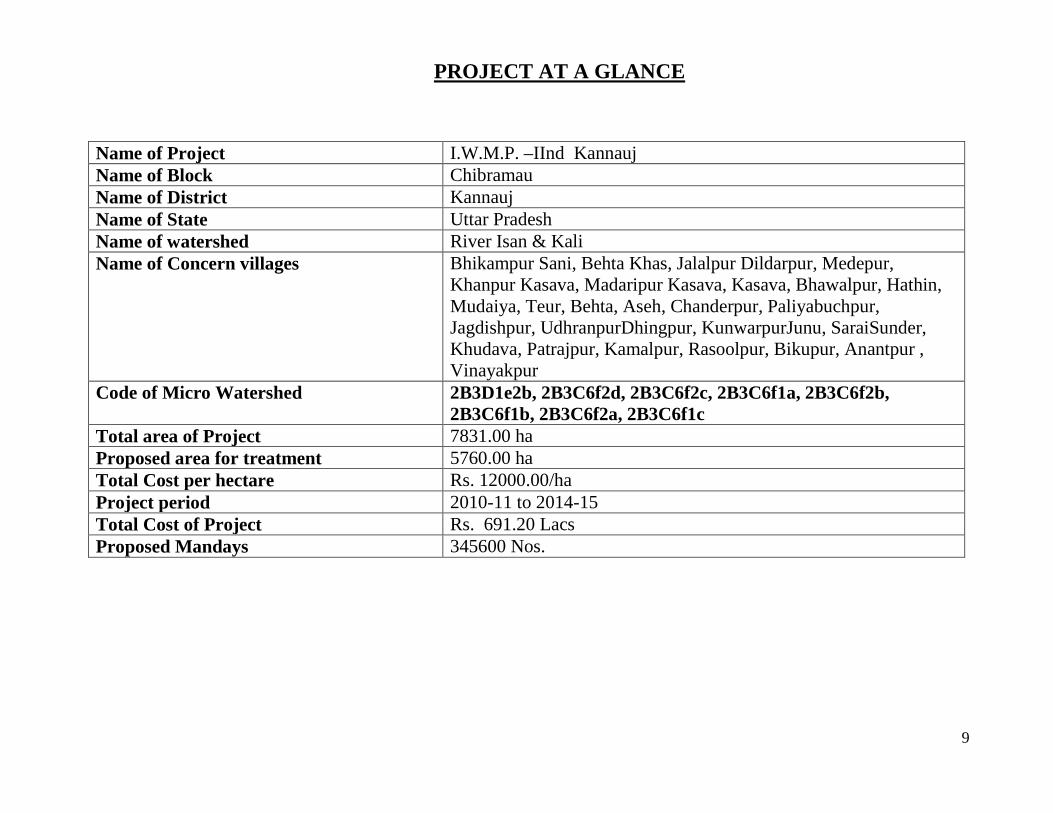
PROJECT AT A GLANCE
Name of Project I.W.M.P. –IInd Kannauj Name of Block Chibramau Name of District Kannauj Name of State Uttar Pradesh Name of watershed River Isan & Kali Name of Concern villages Bhikampur Sani, Behta Khas, Jalalpur Dildarpur, Medepur,
Khanpur Kasava, Madaripur Kasava, Kasava, Bhawalpur, Hathin, Mudaiya, Teur, Behta, Aseh, Chanderpur, Paliyabuchpur, Jagdishpur, UdhranpurDhingpur, KunwarpurJunu, SaraiSunder, Khudava, Patrajpur, Kamalpur, Rasoolpur, Bikupur, Anantpur , Vinayakpur
Code of Micro Watershed 2B3D1e2b, 2B3C6f2d, 2B3C6f2c, 2B3C6f1a, 2B3C6f2b, 2B3C6f1b, 2B3C6f2a, 2B3C6f1c
Total area of Project 7831.00 ha Proposed area for treatment 5760.00 ha Total Cost per hectare Rs. 12000.00/ha Project period 2010-11 to 2014-15 Total Cost of Project Rs. 691.20 Lacs Proposed Mandays 345600 Nos.
10
CHAPTER -1
PROJECT BACKGROUND
11
1.1 Project background
The watershed , withCode No. 2B3D1e2b, 2B3C6f2d, 2B3C6f2c, 2B3C6f1a, 2B3C6f2b, 2B3C6f1b, 2B3C6f2a, 2B3C6f1c
having area of 7831.00 ha is located in South West Part of Kannauj district of U.P. The area of watershed is proposed to be taken up by
Bhoomi sanrakshan Adhikari, Department of land development and water resource project Kannauj for integrated watershed
management programme (IWMP) starting from the year 2010-11 The project will be completed by 2014-15.
The River Isaan watershed in Chibramau Block of Kannauj district (U.P.) is Located near Chibramau about 50 Km from
Kannauj. The watershed at Chibramau Block comprise of 26 village namely Bhikampur Sani, Behta Khas, Jalalpur Dildarpur,
Medepur, Khanpur Kasava, Madaripur Kasava, Kasava, Bhawalpur, Hathin, Mudaiya, Teur, Behta, Aseh, Chanderpur, Paliyabuchpur,
Jagdishpur, UdhranpurDhingpur, KunwarpurJunu, SaraiSunder, Khudava, Patrajpur, Kamalpur, Rasoolpur, Bikupur, Anantpur ,
Vinayakpur. The area lies between 27° -0 ‘ latitude and 79°-30’ longitude .
Total Area of the watershed is 7831.00 ha (Treatable area 5760.00 ha ) Elevation ranges from 130 to 135 m above mean sea
level . The soil of the area are Sandy loam. The soil is Brown in color.
12
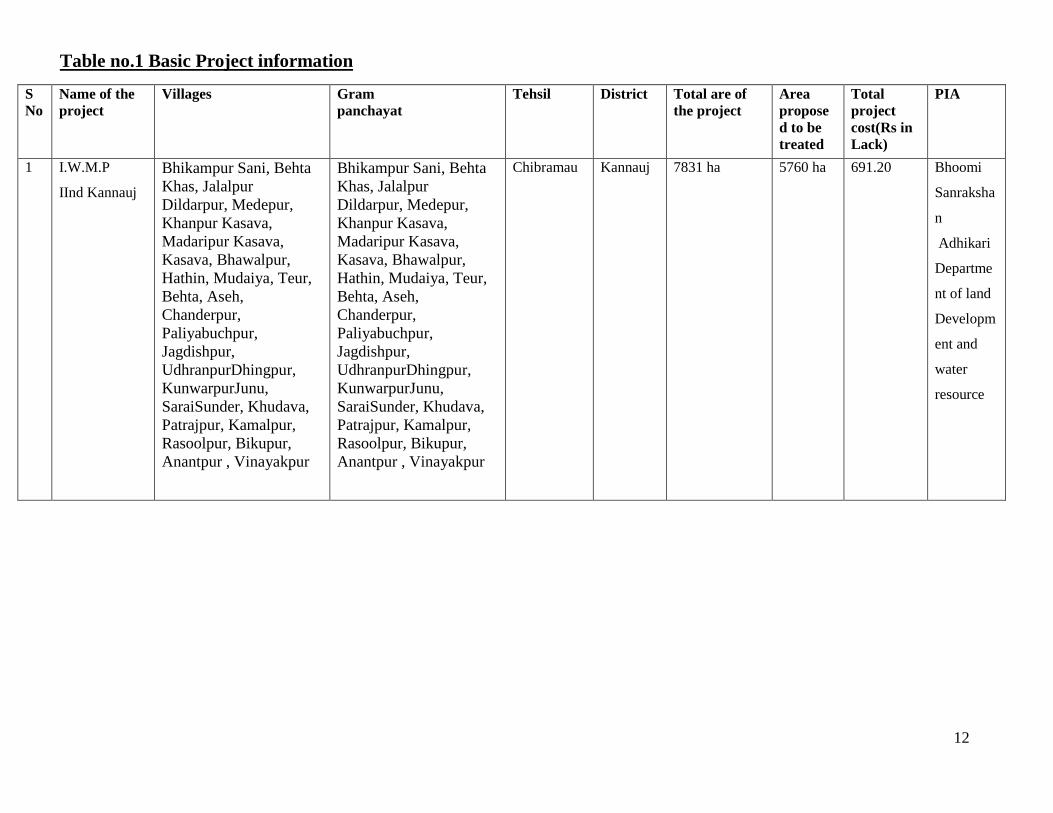
Table no.1 Basic Project information
S No
Name of the project
Villages Gram panchayat
Tehsil District Total are of the project
Area proposed to be treated
Total project cost(Rs in Lack)
PIA
1 I.W.M.P
IInd Kannauj Bhikampur Sani, Behta Khas, Jalalpur Dildarpur, Medepur, Khanpur Kasava, Madaripur Kasava, Kasava, Bhawalpur, Hathin, Mudaiya, Teur, Behta, Aseh, Chanderpur, Paliyabuchpur, Jagdishpur, UdhranpurDhingpur, KunwarpurJunu, SaraiSunder, Khudava, Patrajpur, Kamalpur, Rasoolpur, Bikupur, Anantpur , Vinayakpur
Bhikampur Sani, Behta Khas, Jalalpur Dildarpur, Medepur, Khanpur Kasava, Madaripur Kasava, Kasava, Bhawalpur, Hathin, Mudaiya, Teur, Behta, Aseh, Chanderpur, Paliyabuchpur, Jagdishpur, UdhranpurDhingpur, KunwarpurJunu, SaraiSunder, Khudava, Patrajpur, Kamalpur, Rasoolpur, Bikupur, Anantpur , Vinayakpur
Chibramau Kannauj 7831 ha 5760 ha 691.20 Bhoomi
Sanraksha
n
Adhikari
Departme
nt of land
Developm
ent and
water
resource

13
1.2 NEED OF WATERSHED DEVELOPMENT PROGRAMME:-
Watershed Development Programme is prioritized on the basis of thirteen parameters namely Poverty Index, Percentage of
SC/ST, Actual wages, Percentage of small and marginal farmers, Ground water status, Moisture Index, Area under rainfed agriculture,
Drinking water situation in the area, Percentage of the degraded land, Productivity potential of the land, Continuity of another watershed
that has already developed/treated, Cluster approach for plain or for hilly terrain. Based on these thirteen parameters a composite
ranking was given to Chibramau Watershed project as given in table no. 2.
The soil of project area is mainly Kabar, mar Padwa & Rakar. Middle portion of the project has average slope. There are some
relief in the project area. Agriculture is the main occupation of the people of project area. The main crops are Gram, lentil, Arhar, Bajra.
Most of the fields are kept fallow during Kharif season. In this season ,Green Manuring is proposed to minimize the runoff and to
enhance the soil fertility of the soil.
14
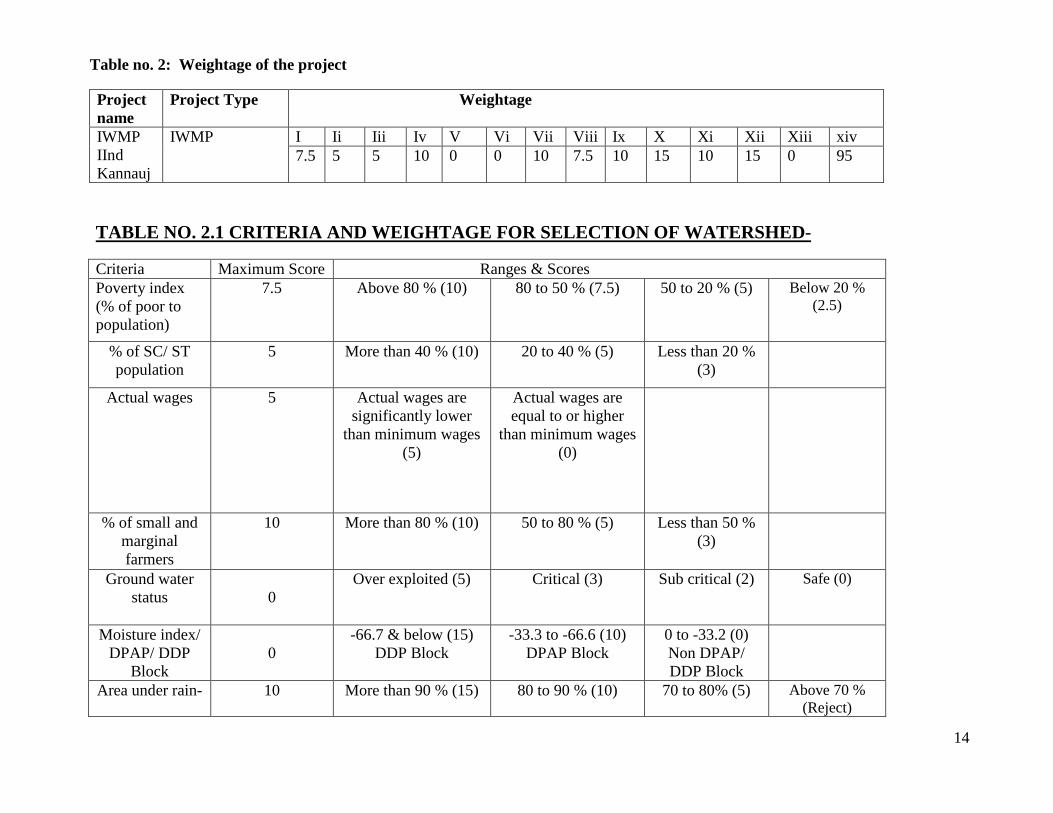
Table no. 2: Weightage of the project
Project name
Project Type Weightage
IWMP IInd Kannauj
IWMP I Ii Iii Iv V Vi Vii Viii Ix X Xi Xii Xiii xiv 7.5 5 5 10 0 0 10 7.5 10 15 10 15 0 95
TABLE NO. 2.1 CRITERIA AND WEIGHTAGE FOR SELECTION OF WATERSHED-
Criteria Maximum Score Ranges & Scores Poverty index (% of poor to population)
7.5
Above 80 % (10)
80 to 50 % (7.5)
50 to 20 % (5)
Below 20 % (2.5)
% of SC/ ST population
5
More than 40 % (10)
20 to 40 % (5)
Less than 20 % (3)
Actual wages
5
Actual wages are significantly lower
than minimum wages (5)
Actual wages are equal to or higher
than minimum wages (0)
% of small and marginal farmers
10
More than 80 % (10)
50 to 80 % (5)
Less than 50 % (3)
Ground water status
0
Over exploited (5)
Critical (3)
Sub critical (2)
Safe (0)
Moisture index/
DPAP/ DDP Block
0
-66.7 & below (15) DDP Block
-33.3 to -66.6 (10) DPAP Block
0 to -33.2 (0) Non DPAP/ DDP Block
Area under rain- 10 More than 90 % (15) 80 to 90 % (10) 70 to 80% (5) Above 70 % (Reject)

15
fed agriculture
Drinking water
7.5
No source (10)
Problematic village
(7.5)
Partially covered
(5)
Fully covered (0)
Degraded land
10 High – above 20 %
(15)
Medium – 10 to 20 % (10)
Low- less than 10 % of TGA (5)
Productivity potential of the
land
15 Lands with low production & where productivity can be
significantly enhanced with
reasonable efforts (15)
Lands with moderate production & where productivity can be
enhanced with reasonable efforts
(10)
Lands with high production &
where productivity can be marginally enhanced with
reasonable efforts (5)
Contiguity to another
watershed that has already
been developed/ treated
10
Contiguous to previously treated
watershed & contiguity within the micro watersheds in
the project (10)
Contiguity within the micro watersheds in the project but non
contiguous to previously treated
watershed (5)
Neither contiguous to
previously treated
watershed nor contiguity within
the micro watersheds in the project (0)

16
Cluster approach in the
plains (more than one
contiguous micro-
watersheds in the project)
15 Above 6 micro-watersheds in cluster (15)
4 to 6 micro watersheds in cluster
(10)
2 to 4 micro watersheds in
cluster (5)
Cluster approach in the hills (more than one contiguous
micro-watersheds in the project)
0 Above 5 micro-watersheds in cluster (15)
3 to 5 micro watersheds in cluster
(10)
2 to 3 micro watersheds in
cluster (5)
95 150 90 41 2.5
TABLE NO.3: WATERSHED INFORMATION
Name Of the Project No.of water sheds to be treated
Watershed Code Watershed regime/type/order
IWMP IInd Kannauj 8
2B3D1e2b, 2B3C6f2d, 2B3C6f2c, 2B3C6f1a, 2B3C6f2b, 2B3C6f1b, 2B3C6f2a, 2B3C6f1c
Micro Watershed
17
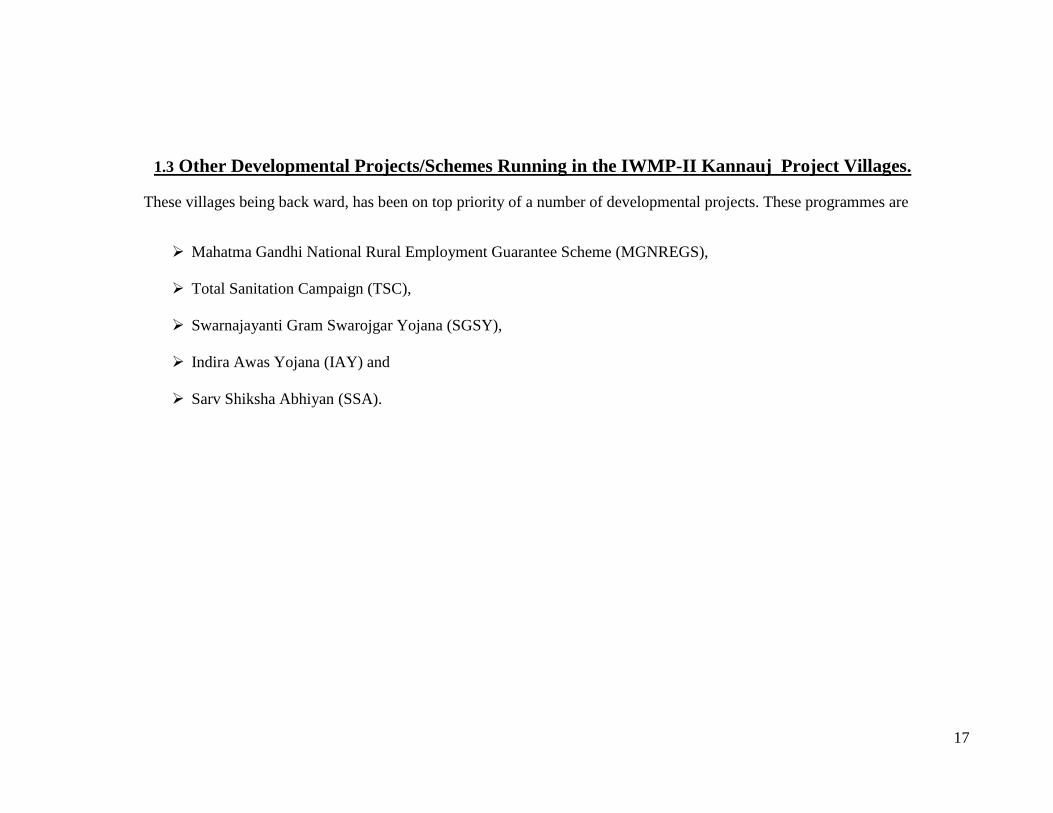
1.3 Other Developmental Projects/Schemes Running in the IWMP-II Kannauj Project Villages.
These villages being back ward, has been on top priority of a number of developmental projects. These programmes are
Mahatma Gandhi National Rural Employment Guarantee Scheme (MGNREGS),
Total Sanitation Campaign (TSC),
Swarnajayanti Gram Swarojgar Yojana (SGSY),
Indira Awas Yojana (IAY) and
Sarv Shiksha Abhiyan (SSA).

18
CHAPTER – 2
PROJECT IMPLEMENTING AGENCY
19
2.1 PROJECT IMPLEMENTING AGENCY (PIA)
U.P. Government, Land Development And Water Resources Department section -1 Lucknow has nominated as PIA to Bhoomi Sanrakshan Unit, Land development and water resources Department Kannauj Dist- Kannauj for IWMP-IInd Kannauj.
2.2 ABOUT DISTRICT RURAL DEVELOPMENT UNIT (DRDU) KANNAUJ
2.2.1 THE ORGANIZATION AND ITS OBJECTIVES:
PROJECT IMPLEMENTING AGENCY (PIA)
The SLNA would evolve appropriate mechanisms for selecting and approving the PIAs, who would be responsible for implementation of watershed projects in different districts. These PIAs may include relevant line departments. Autonomous organizations under State/Central Governments, Government Institutes/Research bodies, Intermediate Panchayats, Voluntary Organizations (VOS).
However, the following criteria may be observed in the selection of these PIAs:
1- They should preferably have prior experience in watershed related aspects or management of watershed development projects. 2- They should be prepared to constitute dedicated Watershed Development Teams.
Selected PIAs will sign a contract/MOU with the concerned DWSUs/District Level Committee as referred in para29 that will
spell out well –defined annual outcomes, against which the performance of each PIA will be monitored each year and evaluated on a regular basis by institutional evaluators from a panel approved by the SLNA/Departmental Nodal Agency at the central level.
Each PIA must put in position a dedicated watershed development team (WDT) with the approval of DWDU. The WDT will be hired on contract/deputation. Transfer etc for a term not exceeding the project period. The composition of the WDT will be indicated in the contract/MOU. No programme funds for DPR and watershed works under any circumstances should be released to either the PIA
20
or Watershed Committee (WC) unless the composition of the WDT has been clearly indicated in the MOU/contract and the team members are fully in place.
2.2.2 PROGRAMMES/PROJECTS OF IWMP-II, KANNAUJ:
The project Implementing Agency(PIA) will provide necessary technical guidance to the Gram Panchayat for preparation of
development plans for the watershed through Participatory Rural Appraisal(PRA) exercise, undertake community organization and
training for the village communities, supervise watershed development activities, inspect and authenticate project accounts, encourage
adoption of low cost technologies and build upon indigenous technical knowledge, monitor and review the overall project
implementation and set up institutional arrangements for post-project operation and maintenance and further development of the assets
created during the project period. The PIA, after careful scrutiny, shall submit the action plan for watershed development project for
approval of the DRDA and other arrangements. The PIA shall submit the periodical progress report to DRDA. The PIA shall also
arrange physical, financial and social audit of the work undertaken. It will facilitate the mobilization of additional financial resource
from other government programmes, such as NREGA, BRGF, SGRY, National Horticulture Mission, Tribal, Welfare Schemes
Artificial Ground Water Recharging, Greening India, etc.
21
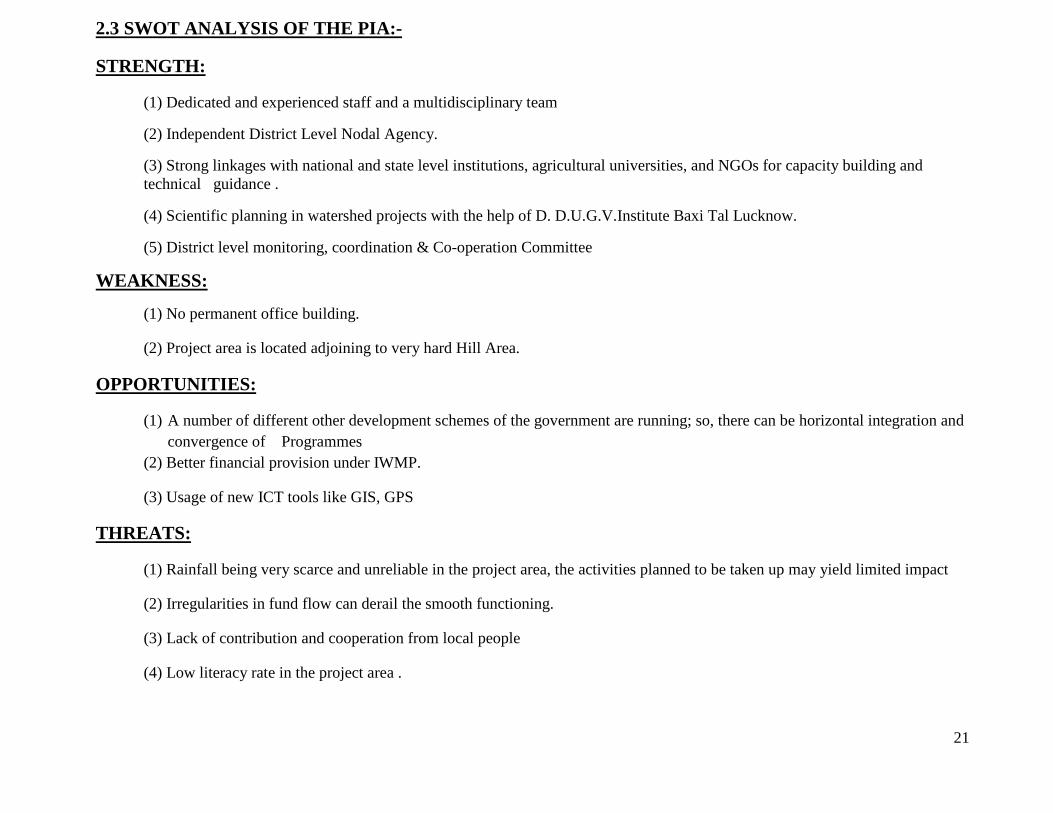
2.3 SWOT ANALYSIS OF THE PIA:-
STRENGTH:
(1) Dedicated and experienced staff and a multidisciplinary team
(2) Independent District Level Nodal Agency.
(3) Strong linkages with national and state level institutions, agricultural universities, and NGOs for capacity building and technical guidance .
(4) Scientific planning in watershed projects with the help of D. D.U.G.V.Institute Baxi Tal Lucknow.
(5) District level monitoring, coordination & Co-operation Committee
WEAKNESS:
(1) No permanent office building.
(2) Project area is located adjoining to very hard Hill Area.
OPPORTUNITIES:
(1) A number of different other development schemes of the government are running; so, there can be horizontal integration and convergence of Programmes
(2) Better financial provision under IWMP.
(3) Usage of new ICT tools like GIS, GPS
THREATS:
(1) Rainfall being very scarce and unreliable in the project area, the activities planned to be taken up may yield limited impact
(2) Irregularities in fund flow can derail the smooth functioning.
(3) Lack of contribution and cooperation from local people
(4) Low literacy rate in the project area .
22
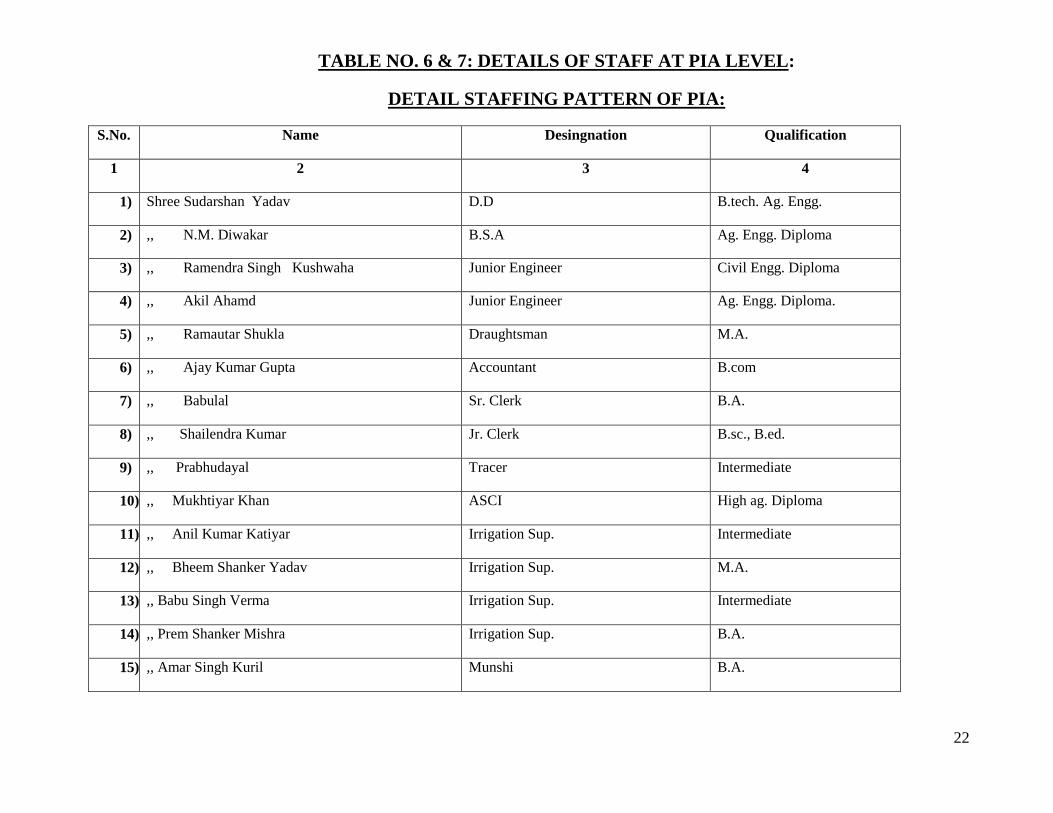
TABLE NO. 6 & 7: DETAILS OF STAFF AT PIA LEVEL:
DETAIL STAFFING PATTERN OF PIA:
S.No. Name Desingnation Qualification
1 2 3 4
1) Shree Sudarshan Yadav D.D B.tech. Ag. Engg.
2) ,, N.M. Diwakar
B.S.A Ag. Engg. Diploma
3) ,, Ramendra Singh Kushwaha
Junior Engineer Civil Engg. Diploma
4) ,, Akil Ahamd Junior Engineer Ag. Engg. Diploma.
5) ,, Ramautar Shukla Draughtsman M.A.
6) ,, Ajay Kumar Gupta Accountant B.com
7) ,, Babulal Sr. Clerk B.A.
8) ,, Shailendra Kumar Jr. Clerk B.sc., B.ed.
9) ,, Prabhudayal Tracer Intermediate
10) ,, Mukhtiyar Khan ASCI High ag. Diploma
11) ,, Anil Kumar Katiyar Irrigation Sup. Intermediate
12) ,, Bheem Shanker Yadav Irrigation Sup. M.A.
13) ,, Babu Singh Verma Irrigation Sup. Intermediate
14) ,, Prem Shanker Mishra Irrigation Sup. B.A.
15) ,, Amar Singh Kuril Munshi B.A.

23
16) ,, Kamlesh Kumar Seenchpal Intermediate
17) ,, Manoj Sharma Seenchpal Intermediate
18) ,, Ajay Kumar Seenchpal B.Sc. Ag.
19) ,, Anil Kumar Katiyar Seenchpal Intermediate
20) ,, Vikas Chandra Katiyar Seenchpal Intermediate
21) ,, Sishupal Singh Driver Literate
22) ,, Virendra Kumar 4th Class Jr. High School
23) ,, Hari Prakash 4th Class Jr. High School
24) ,, Mahmood 4th Class Literate
25) ,, Satish Chandra
4th Class Jr. High School
26) ,, Ramautar 4th Class Jr. High School
24
CHAPTER – 3
BASIC INFORMATION OF THE PROJECT AREA
25
3.1 GEOGRAPHY AND GEO-HYDROLOGY
3.1.1 LAND USE PATTERN:
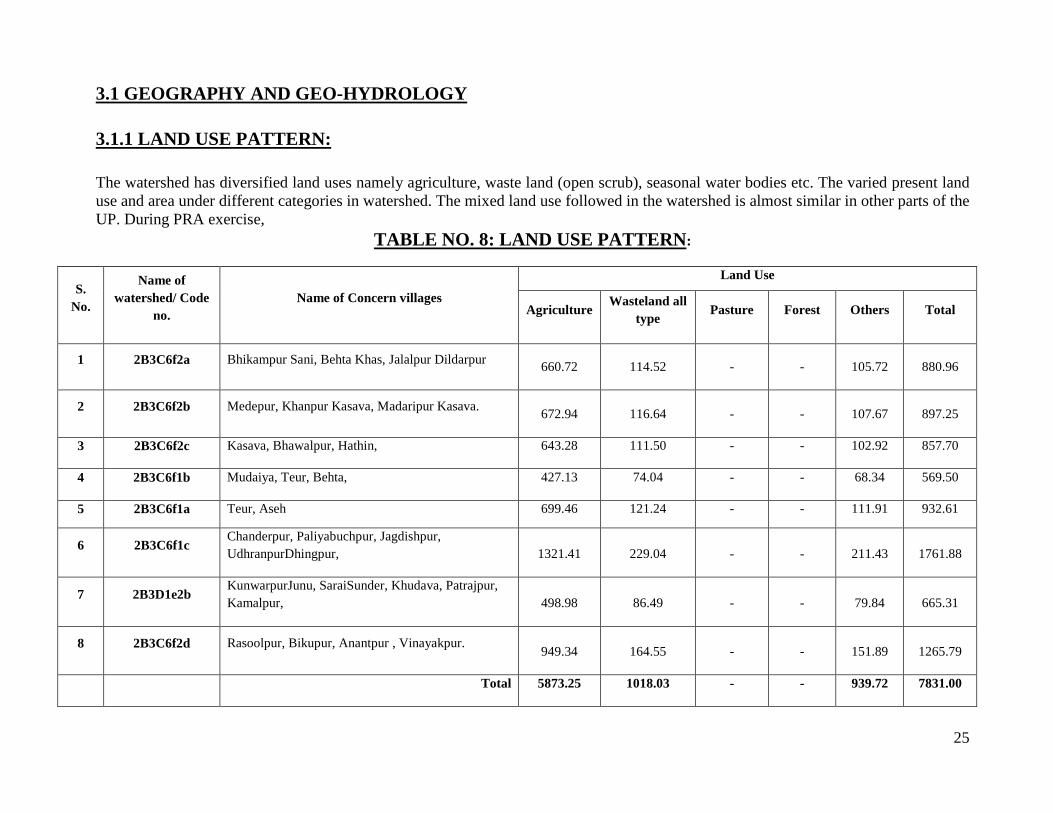
The watershed has diversified land uses namely agriculture, waste land (open scrub), seasonal water bodies etc. The varied present land use and area under different categories in watershed. The mixed land use followed in the watershed is almost similar in other parts of the UP. During PRA exercise,
TABLE NO. 8: LAND USE PATTERN:
S. No.
Name of watershed/ Code
no. Name of Concern villages
Land Use
Agriculture Wasteland all type Pasture Forest Others Total
1 2B3C6f2a Bhikampur Sani, Behta Khas, Jalalpur Dildarpur 660.72 114.52 - - 105.72 880.96
2 2B3C6f2b Medepur, Khanpur Kasava, Madaripur Kasava. 672.94 116.64 - - 107.67 897.25
3 2B3C6f2c Kasava, Bhawalpur, Hathin, 643.28 111.50 - - 102.92 857.70
4 2B3C6f1b Mudaiya, Teur, Behta, 427.13 74.04 - - 68.34 569.50
5 2B3C6f1a Teur, Aseh 699.46 121.24 - - 111.91 932.61
6 2B3C6f1c Chanderpur, Paliyabuchpur, Jagdishpur, UdhranpurDhingpur, 1321.41 229.04 - - 211.43 1761.88
7 2B3D1e2b KunwarpurJunu, SaraiSunder, Khudava, Patrajpur, Kamalpur, 498.98 86.49 - - 79.84 665.31
8 2B3C6f2d Rasoolpur, Bikupur, Anantpur , Vinayakpur. 949.34 164.55 - - 151.89 1265.79
Total 5873.25 1018.03 - - 939.72 7831.00
26
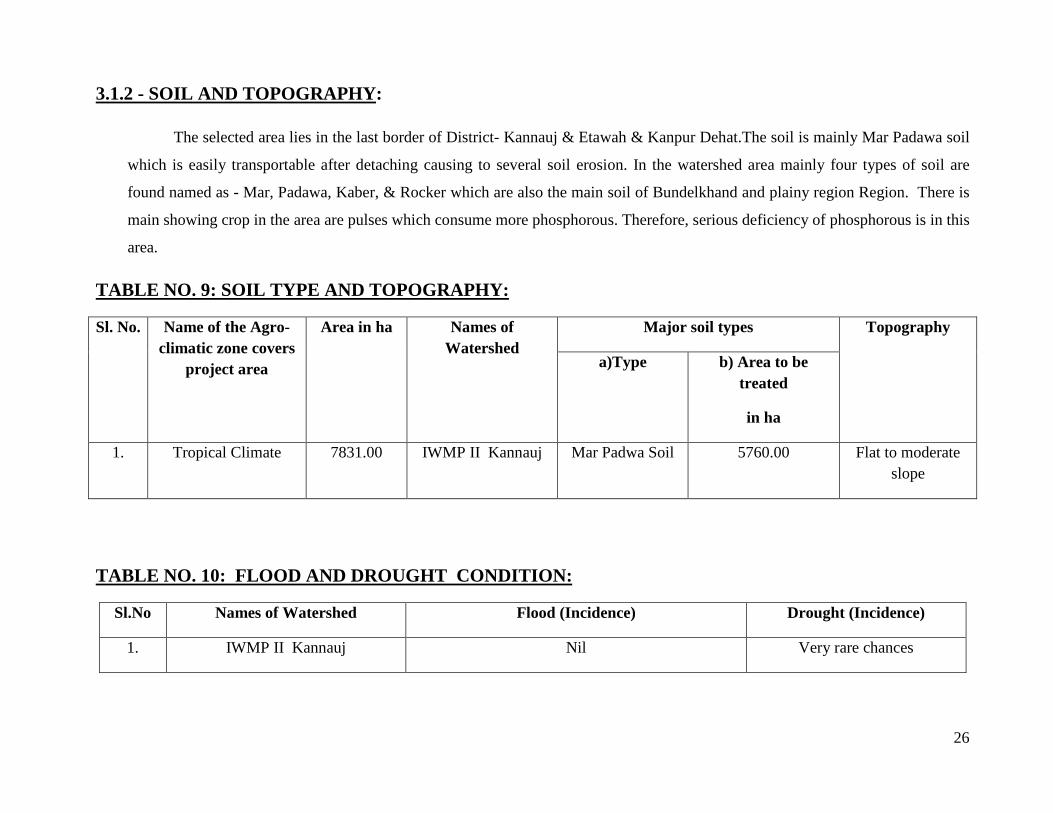
3.1.2 - SOIL AND TOPOGRAPHY:
The selected area lies in the last border of District- Kannauj & Etawah & Kanpur Dehat.The soil is mainly Mar Padawa soil
which is easily transportable after detaching causing to several soil erosion. In the watershed area mainly four types of soil are
found named as - Mar, Padawa, Kaber, & Rocker which are also the main soil of Bundelkhand and plainy region Region. There is
main showing crop in the area are pulses which consume more phosphorous. Therefore, serious deficiency of phosphorous is in this
area.
TABLE NO. 9: SOIL TYPE AND TOPOGRAPHY:
Sl. No. Name of the Agro-climatic zone covers
project area
Area in ha Names of Watershed
Major soil types Topography
a)Type b) Area to be treated
in ha
1. Tropical Climate 7831.00 IWMP II Kannauj Mar Padwa Soil 5760.00 Flat to moderate slope
TABLE NO. 10: FLOOD AND DROUGHT CONDITION:
Sl.No Names of Watershed Flood (Incidence) Drought (Incidence)
1. IWMP II Kannauj Nil Very rare chances

27
TABLE NO. 11: SOIL EROSION
Cause Type of erosion Area affected (ha) Run off (mm/ year) Average soil loss (Tonnes/ ha/ year)
Water erosion A Sheet 3887.00
393.00
17.00 B Rill 1395.00 C Gully 698.00
Sub-Total 5980.00 Wind erosion - NA
Total 5980.00 393.00 17.00
TABLE NO.12: CLIMATIC CONDITIONS-
Sl. No.
Year Rainfall (in mm) Temperature (˚C) Highest intensity of Rainfall
(mm in a day) Max. Min.
1. 2008 480.00 45*c. 6* c. 100 MM
2 2009 582.00 46*c. 5* c. 105 MM
3 2010 530.00 48*c. 4* c. 110 MM
The rainfall is scanty which has resulted in recurrent phenomenon of drought in every two to three years. The average rainfall
of this area is about 459 mm (from past five year data) with a highest intensity of 88 mm within span of a day. This uneven distribution
is leading to run off of soil every year to the streams, rivulets and depressed area of Kannauj.
28
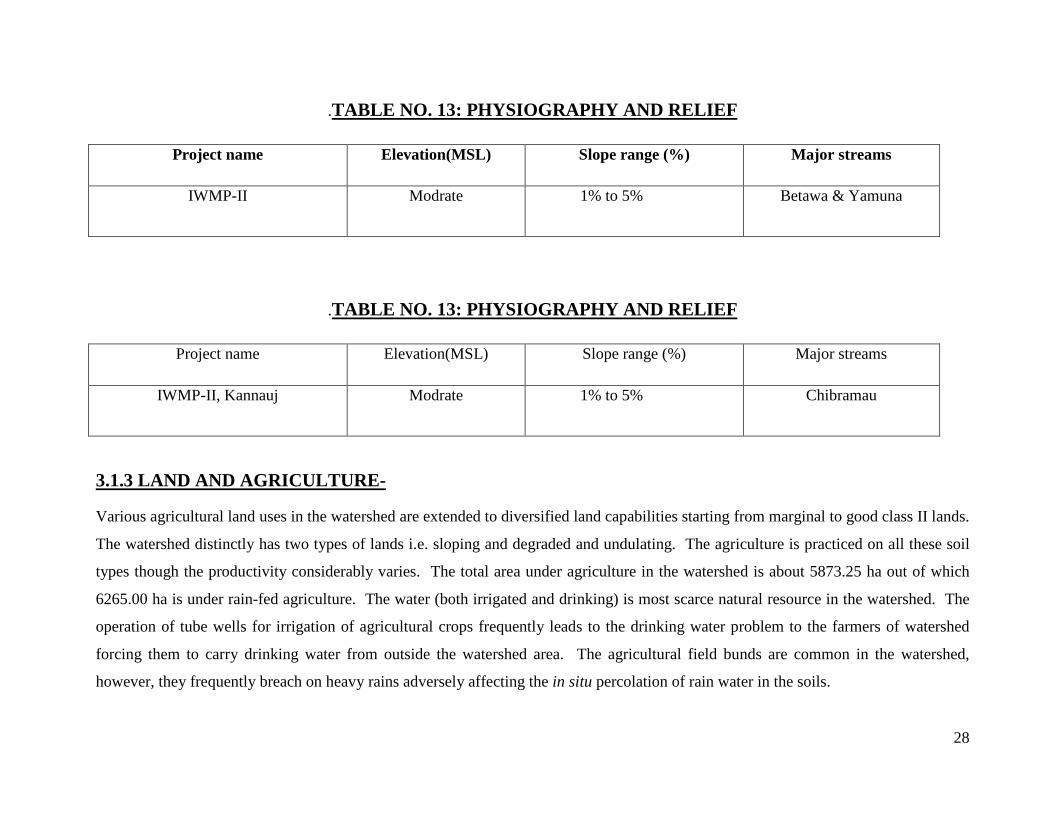
.TABLE NO. 13: PHYSIOGRAPHY AND RELIEF
Project name Elevation(MSL) Slope range (%) Major streams
IWMP-II Modrate 1% to 5% Betawa & Yamuna
.TABLE NO. 13: PHYSIOGRAPHY AND RELIEF
Project name Elevation(MSL) Slope range (%) Major streams
IWMP-II, Kannauj Modrate 1% to 5% Chibramau
3.1.3 LAND AND AGRICULTURE-
Various agricultural land uses in the watershed are extended to diversified land capabilities starting from marginal to good class II lands.
The watershed distinctly has two types of lands i.e. sloping and degraded and undulating. The agriculture is practiced on all these soil
types though the productivity considerably varies. The total area under agriculture in the watershed is about 5873.25 ha out of which
6265.00 ha is under rain-fed agriculture. The water (both irrigated and drinking) is most scarce natural resource in the watershed. The
operation of tube wells for irrigation of agricultural crops frequently leads to the drinking water problem to the farmers of watershed
forcing them to carry drinking water from outside the watershed area. The agricultural field bunds are common in the watershed,
however, they frequently breach on heavy rains adversely affecting the in situ percolation of rain water in the soils.
29
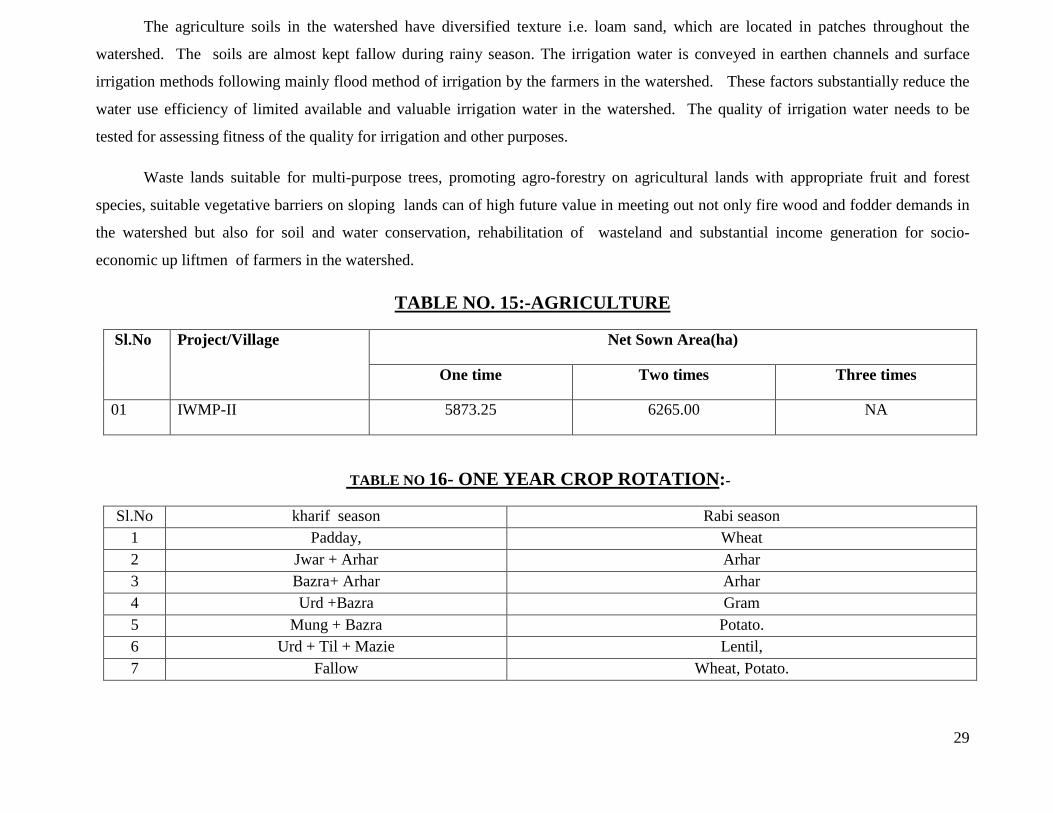
The agriculture soils in the watershed have diversified texture i.e. loam sand, which are located in patches throughout the
watershed. The soils are almost kept fallow during rainy season. The irrigation water is conveyed in earthen channels and surface
irrigation methods following mainly flood method of irrigation by the farmers in the watershed. These factors substantially reduce the
water use efficiency of limited available and valuable irrigation water in the watershed. The quality of irrigation water needs to be
tested for assessing fitness of the quality for irrigation and other purposes.
Waste lands suitable for multi-purpose trees, promoting agro-forestry on agricultural lands with appropriate fruit and forest
species, suitable vegetative barriers on sloping lands can of high future value in meeting out not only fire wood and fodder demands in
the watershed but also for soil and water conservation, rehabilitation of wasteland and substantial income generation for socio-
economic up liftmen of farmers in the watershed.
TABLE NO. 15:-AGRICULTURE
Sl.No Project/Village Net Sown Area(ha)
One time Two times Three times
01 IWMP-II 5873.25 6265.00 NA
TABLE NO 16- ONE YEAR CROP ROTATION:-
Sl.No kharif season Rabi season 1 Padday, Wheat 2 Jwar + Arhar Arhar 3 Bazra+ Arhar Arhar 4 Urd +Bazra Gram 5 Mung + Bazra Potato. 6 Urd + Til + Mazie Lentil, 7 Fallow Wheat, Potato.
30
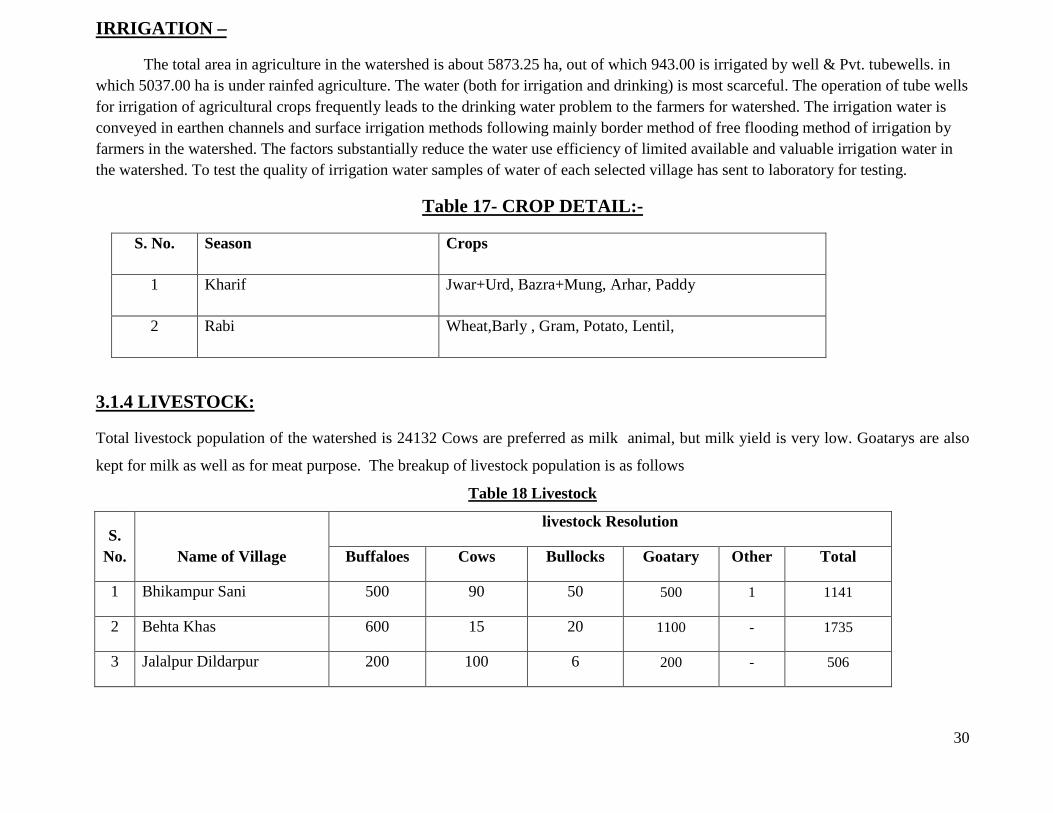
IRRIGATION –
The total area in agriculture in the watershed is about 5873.25 ha, out of which 943.00 is irrigated by well & Pvt. tubewells. in which 5037.00 ha is under rainfed agriculture. The water (both for irrigation and drinking) is most scarceful. The operation of tube wells for irrigation of agricultural crops frequently leads to the drinking water problem to the farmers for watershed. The irrigation water is conveyed in earthen channels and surface irrigation methods following mainly border method of free flooding method of irrigation by farmers in the watershed. The factors substantially reduce the water use efficiency of limited available and valuable irrigation water in the watershed. To test the quality of irrigation water samples of water of each selected village has sent to laboratory for testing.
Table 17- CROP DETAIL:-
S. No. Season Crops
1 Kharif Jwar+Urd, Bazra+Mung, Arhar, Paddy
2 Rabi Wheat,Barly , Gram, Potato, Lentil,
3.1.4 LIVESTOCK:
Total livestock population of the watershed is 24132 Cows are preferred as milk animal, but milk yield is very low. Goatarys are also
kept for milk as well as for meat purpose. The breakup of livestock population is as follows
Table 18 Livestock
S. No. Name of Village
livestock Resolution
Buffaloes Cows Bullocks Goatary Other Total
1 Bhikampur Sani 500 90 50 500 1 1141
2 Behta Khas 600 15 20 1100 - 1735
3 Jalalpur Dildarpur 200 100 6 200 - 506

31
4 Medepur 380 40 45 390 - 855
5 Khanpur Kasava 330 70 100 250 6 756
6 Madaripur Kasava 350 50 18 200 2 620
7 Kasava 1300 115 80 2000 10 3505
8 Bhawalpur 380 50 55 450 18 953
9 Hathin 300 100 20 250 70 740
10 Mudaiya, 400 60 50 500 20 1030
11 Teur 500 200 10 400 40 1150
12 Behta 300 50 17 200 - 567
13 Aseh 500 100 50 500 50 1200
14 Chanderpur 200 50 16 200 35 501
15 Paliyabuchpur 250 100 8 250 25 633
16 Jagdishpur 200 50 10 300 15 575
17 Udhranpur
150 100 12 350 25 637
18 KunwarpurJunu 200 150 10 200 35 595
19 SaraiSunder 150 100 8 100 40 398
20 Khudava 100 50 6 250 50 456
21 Patrajpur 200 100 6 300 15 621
22 Kamalpur 250 120 8 200 30 608
23 Rasoolpur 150 100 10 250 25 535
24 Bikupur 250 150 20 300 35 755
25 Anantpur 200 100 10 2000 27 2337
26 Vinayakpur 250 125 8 300 40 723
Total 8590 2335 653 11940 614 24132

32
Sl. No.
Project name Ground water table (m) Source of drinking water Availability in months Quality
1 IWMP-II Kannauj 7 – 9 Well, Hand Pump, Tub-Well & Water Supply
12 High T.D.S

33
3.2. SOCIO-ECONOMIC PROFILE
SOCIO ECONOMIC ANALYSIS OF THE PROJECT 1-SUSTAINABILITY AND ENVIRONMENTAL SECURITY:
In the proposed watershed management plan of River Isan and Kali, proper blending of bio engineering measures will be
applied. The proposed land use plan will improve the land utilization index and crop diversification index significantly as compared to
existing one. It will help in maintaining ecosystem integrity on sustained basis.
2-ECONOMIC ANALYSIS:
Economic analysis of the project is carried out by taking direct benefits and costs, considering 30 year project life at 10% discount rate. For the purpose of economic analysis, whole watershed development plan is divided into four sectors as agriculture (rainfed and irrigated), pure horticulture, agro-horticulture and silvi pastoral (Silvi-Pastoral + sericulture). Net present value (NPV), Benefit Cost Ratio(BCR) , Payback Period(PBR) and internal rate of return(IRR) criteria is Applied to judge the economic efficiency of each enterprise, sector and project as a whole.
3.2.1 BENEFIT COST RATIO OF I.W.M.P.-II Kannauj
Year Construction cost(00,000 Rs.) Operation and maintenance cost(00,000 Rs.) Benefit(00,000 Rs.)
1 131.904 06.35 15.89 2 197.856 15.89 63.59 3 131.904 22.25 97.37 4 197.856 31.80 318.00 5 0 31.80 318.00 6 0 31.80 318.00 7 0 31.80 318.00 8 0 31.80 318.00 9 0 31.80 318.00 10 0 31.80 318.00

34
BY BENEFIT, COST RATIO METHOD
S.No.
Item 1 2 3 4 5 6 7 8 9 10
1 Discount factor
10%
0.909 0.826 0.751 0.683 0.621 0.564 0.513 0.467 0.424 0.386
2 Total cost (
00,000 Rs.)
165.326 254.354 181.226 270.264 31.80 31.80 31.80 31.80 31.80 31.80
3 Benefit (00,000
Rs.)
15.89 63.59 97.37 318.00 318.00 318.00 318.00 318.00 318.00 318.00
4
150.28 210.09 136.09 184.59 19.74 17.93 16.31 14.85 13.48 12.27 775.63
5
14.44 52.52 73.12 217.19 197.47 129.35 163.13 148.50 134.83 122.74 1303.29
Benefit cost ratio =
=1303.29 775.63 =1.68:1
Hence OK
35
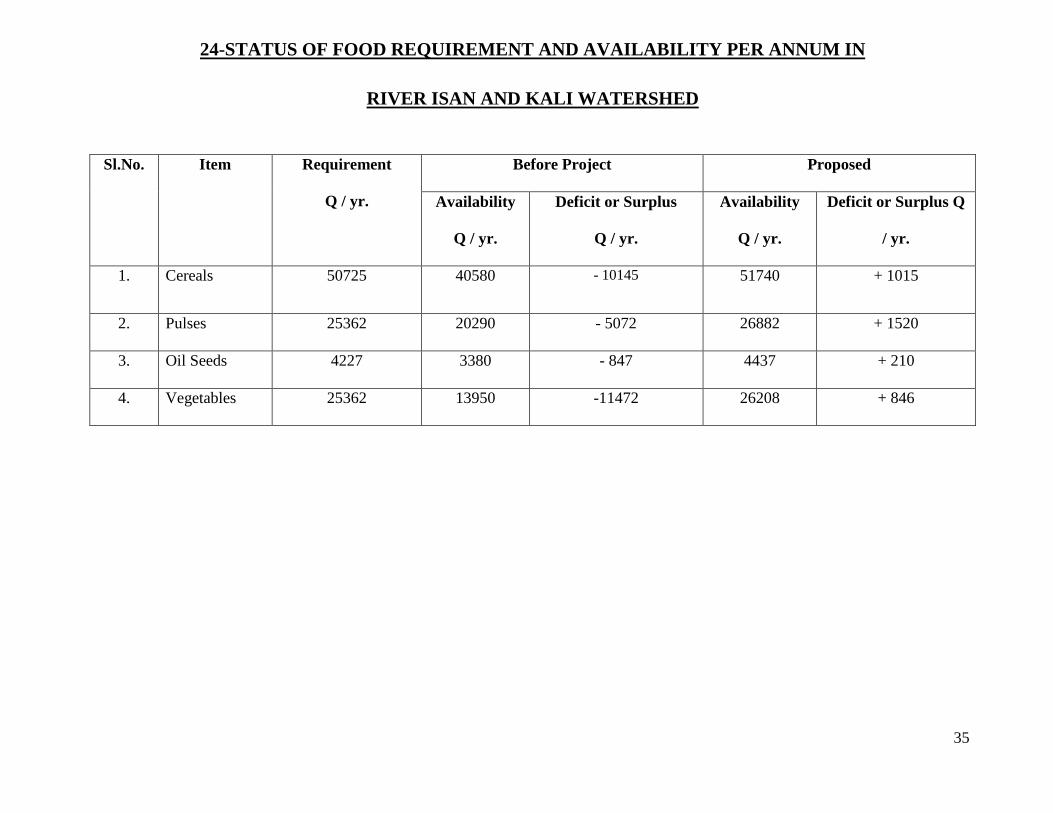
24-STATUS OF FOOD REQUIREMENT AND AVAILABILITY PER ANNUM IN
RIVER ISAN AND KALI WATERSHED
Sl.No. Item Requirement
Q / yr.
Before Project Proposed
Availability
Q / yr.
Deficit or Surplus
Q / yr.
Availability
Q / yr.
Deficit or Surplus Q
/ yr.
1. Cereals 50725 40580 - 10145 51740 + 1015
2. Pulses 25362 20290 - 5072 26882 + 1520
3. Oil Seeds 4227 3380 - 847 4437 + 210
4. Vegetables 25362 13950 -11472 26208 + 846
36
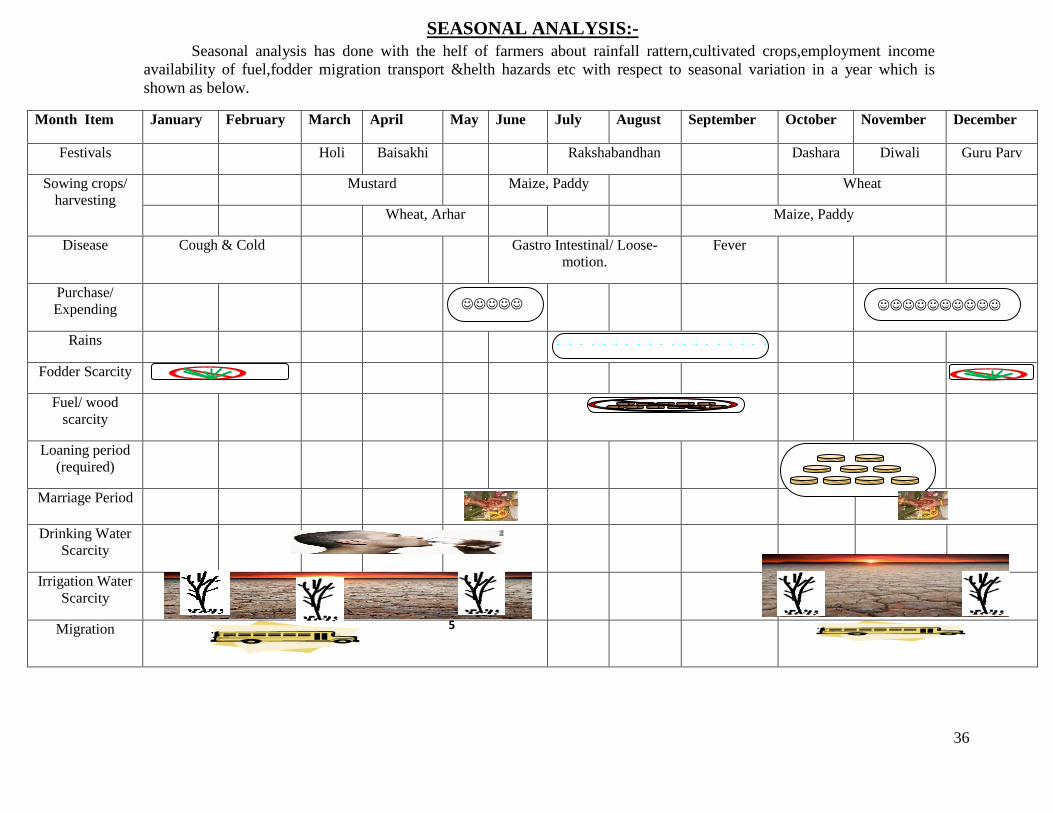
SEASONAL ANALYSIS:- Seasonal analysis has done with the helf of farmers about rainfall rattern,cultivated crops,employment income availability of fuel,fodder migration transport &helth hazards etc with respect to seasonal variation in a year which is shown as below.
Month Item January February March April May June July August September October November December
Festivals Holi Baisakhi Rakshabandhan Dashara Diwali Guru Parv
Sowing crops/ harvesting
Mustard Maize, Paddy Wheat
Wheat, Arhar Maize, Paddy
Disease Cough & Cold Gastro Intestinal/ Loose-motion.
Fever
Purchase/ Expending
Rains
Fodder Scarcity
Fuel/ wood scarcity
Loaning period (required)
Marriage Period
Drinking Water Scarcity
Irrigation Water Scarcity
Migration
5
37
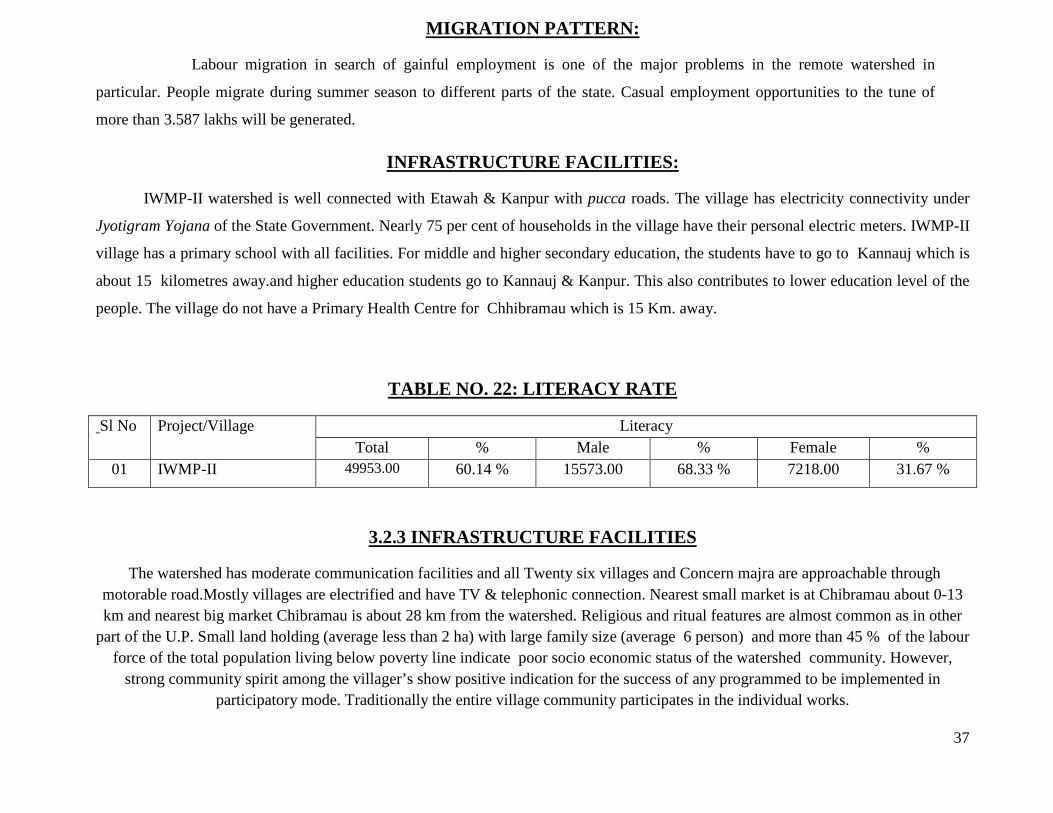
MIGRATION PATTERN:
Labour migration in search of gainful employment is one of the major problems in the remote watershed in
particular. People migrate during summer season to different parts of the state. Casual employment opportunities to the tune of
more than 3.587 lakhs will be generated.
INFRASTRUCTURE FACILITIES:
IWMP-II watershed is well connected with Etawah & Kanpur with pucca roads. The village has electricity connectivity under
Jyotigram Yojana of the State Government. Nearly 75 per cent of households in the village have their personal electric meters. IWMP-II
village has a primary school with all facilities. For middle and higher secondary education, the students have to go to Kannauj which is
about 15 kilometres away.and higher education students go to Kannauj & Kanpur. This also contributes to lower education level of the
people. The village do not have a Primary Health Centre for Chhibramau which is 15 Km. away.
TABLE NO. 22: LITERACY RATE
Sl No Project/Village Literacy Total % Male % Female %
01 IWMP-II 49953.00 60.14 % 15573.00 68.33 % 7218.00 31.67 %
3.2.3 INFRASTRUCTURE FACILITIES
The watershed has moderate communication facilities and all Twenty six villages and Concern majra are approachable through motorable road.Mostly villages are electrified and have TV & telephonic connection. Nearest small market is at Chibramau about 0-13 km and nearest big market Chibramau is about 28 km from the watershed. Religious and ritual features are almost common as in other
part of the U.P. Small land holding (average less than 2 ha) with large family size (average 6 person) and more than 45 % of the labour force of the total population living below poverty line indicate poor socio economic status of the watershed community. However,
strong community spirit among the villager’s show positive indication for the success of any programmed to be implemented in participatory mode. Traditionally the entire village community participates in the individual works.
38
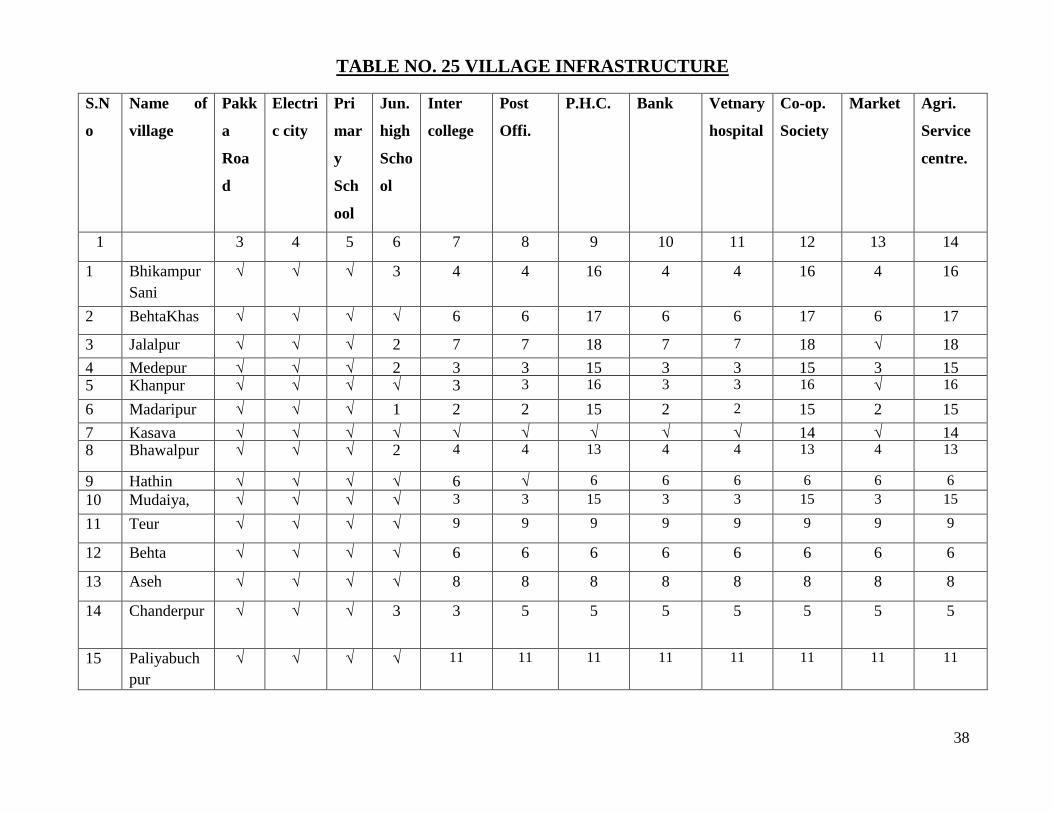
TABLE NO. 25 VILLAGE INFRASTRUCTURE
S.N
o
Name of
village
Pakk
a
Roa
d
Electri
c city
Pri
mar
y
Sch
ool
Jun.
high
Scho
ol
Inter
college
Post
Offi.
P.H.C. Bank Vetnary
hospital
Co-op.
Society
Market Agri.
Service
centre.
1 3 4 5 6 7 8 9 10 11 12 13 14
1 Bhikampur Sani
√ √ √ 3 4 4 16 4 4 16 4 16
2 BehtaKhas √ √ √ √ 6 6 17 6 6 17 6 17
3 Jalalpur
√ √ √ 2 7 7 18 7 7 18 √ 18 4 Medepur √ √ √ 2 3 3 15 3 3 15 3 15 5 Khanpur
√ √ √ √ 3 3 16 3 3 16 √ 16
6 Madaripur
√ √ √ 1 2 2 15 2 2 15 2 15 7 Kasava √ √ √ √ √ √ √ √ √ 14 √ 14 8 Bhawalpur √ √ √ 2 4 4 13 4 4 13 4 13
9 Hathin √ √ √ √ 6 √ 6 6 6 6 6 6 10 Mudaiya, √ √ √ √ 3 3 15 3 3 15 3 15
11 Teur √ √ √ √ 9 9 9 9 9 9 9 9
12 Behta √ √ √ √ 6 6 6 6 6 6 6 6
13 Aseh √ √ √ √ 8 8 8 8 8 8 8 8
14 Chanderpur √ √ √ 3 3 5 5 5 5 5 5 5
15 Paliyabuchpur
√ √ √ √ 11 11 11 11 11 11 11 11
39
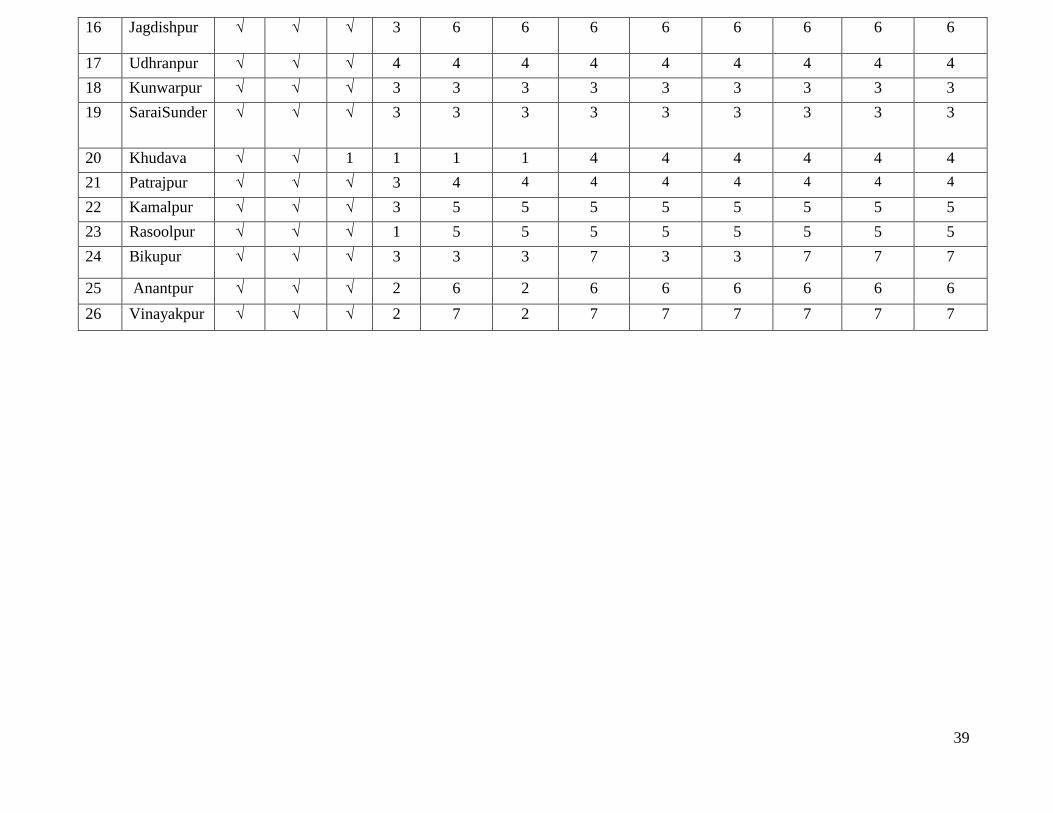
16 Jagdishpur √ √ √ 3 6 6 6 6 6 6 6 6
17 Udhranpur
√ √ √ 4 4 4 4 4 4 4 4 4 18 Kunwarpur
√ √ √ 3 3 3 3 3 3 3 3 3
19 SaraiSunder √ √ √ 3 3 3 3 3 3 3 3 3
20 Khudava √ √ 1 1 1 1 4 4 4 4 4 4 21 Patrajpur √ √ √ 3 4 4 4 4 4 4 4 4
22 Kamalpur √ √ √ 3 5 5 5 5 5 5 5 5 23 Rasoolpur √ √ √ 1 5 5 5 5 5 5 5 5 24 Bikupur √ √ √ 3 3 3 7 3 3 7 7 7
25 Anantpur √ √ √ 2 6 2 6 6 6 6 6 6 26 Vinayakpur √ √ √ 2 7 2 7 7 7 7 7 7

40
Historical time line for village Bhikampur Sani.
S.No. Activities Year
1 Established 1580
2 Construction Bandhi ( water harvesting structure) -
3 Opening up Primary school 1955
4 Introduction of Tractor 1954
5 Establishment of P.H.C. -
6 Kacha road 1978
7 Introduction of thresher 1988
8 First Tube well /Diesel pump set 1990
9 First Motorcycle 1989
10 TV and DVD player 1991/2001
11 Over head water tank -
12 Electricity in the village 1997
13 Bituminous road -
14 Temple renovation 1879
15 Planning for watershed project 2010
41
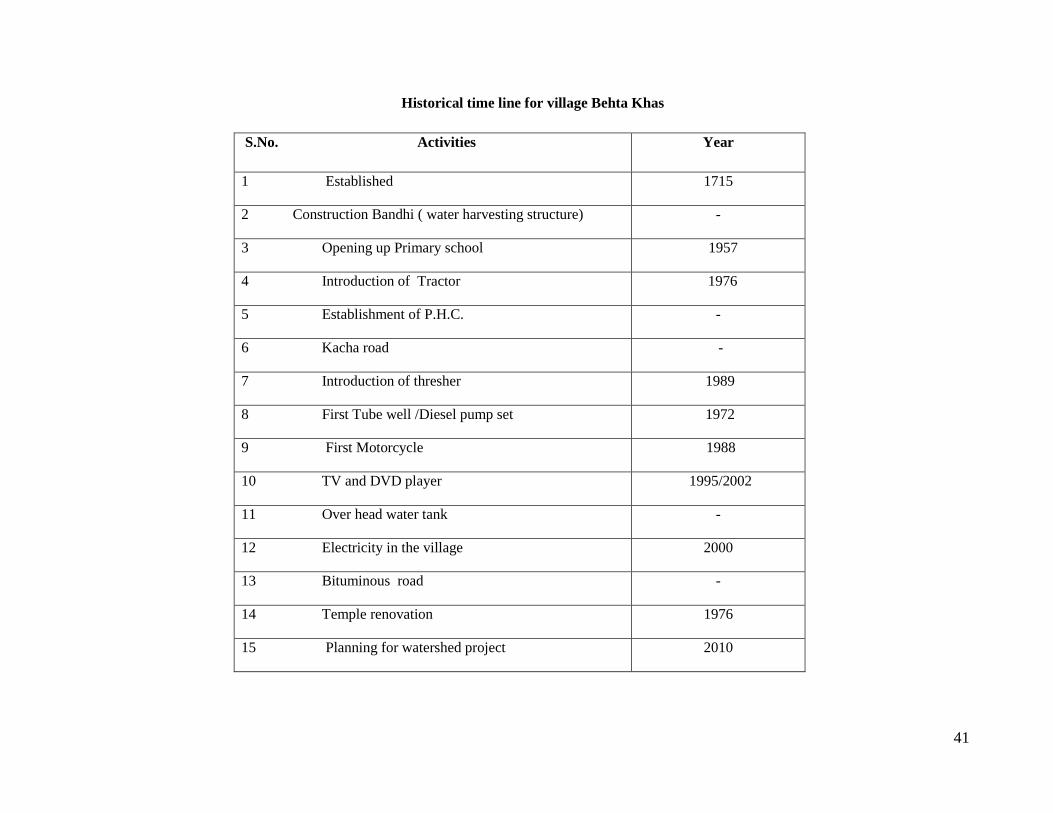
Historical time line for village Behta Khas
S.No. Activities Year
1 Established 1715
2 Construction Bandhi ( water harvesting structure) -
3 Opening up Primary school 1957
4 Introduction of Tractor 1976
5 Establishment of P.H.C. -
6 Kacha road -
7 Introduction of thresher 1989
8 First Tube well /Diesel pump set 1972
9 First Motorcycle 1988
10 TV and DVD player 1995/2002
11 Over head water tank -
12 Electricity in the village 2000
13 Bituminous road -
14 Temple renovation 1976
15 Planning for watershed project 2010

42
Historical time line for village Jalapur Dildarpur.
S.No. Activities Year
1 Established 1868
2 Construction Bandhi ( water harvesting structure) -
3 Opening up Primary school 1958
4 Introduction of Tractor 1978
5 Establishment of P.H.C. -
6 Kacha road 1975
7 Introduction of thresher 1989
8 First Tube well /Diesel pump set 1971
9 First Motorcycle 1984
10 TV and DVD player 1991/2004
11 Over head water tank -
12 Electricity in the village 2002
13 Bituminous road -
14 Temple renovation 1979
15 Planning for watershed project 2010

43
Historical time line for village Medepur.
S.No. Activities Year
1 Established 1745
2 Construction Bandhi ( water harvesting structure) -
3 Opening up Primary school 1970
4 Introduction of Tractor 1981
5 Establishment of P.H.C. -
6 Kacha road 1978
7 Introduction of thresher 1992
8 First Tube well /Diesel pump set 1976
9 First Motorcycle 1989
10 TV and DVD player 1996/2003
11 Over head water tank -
12 Electricity in the village 2002
13 Bituminous road -
14 Temple renovation 1968
15 Planning for watershed project 2010

44
Historical time line for village Khanpur Kasava
S.No. Activities Year
1 Established 1678
2 Construction Bandhi ( water harvesting structure) -
3 Opening up Primary school 1957
4 Introduction of Tractor 1978
5 Establishment of P.H.C. -
6 Kacha road 1972
7 Introduction of thresher 1989
8 First Tube well /Diesel pump set 1972
9 First Motorcycle 1988
10 TV and DVD player 1995/2001
11 Over head water tank -
12 Electricity in the village 2006
13 Bituminous road -
14 Temple renovation 1971
15 Planning for watershed project 2010
45
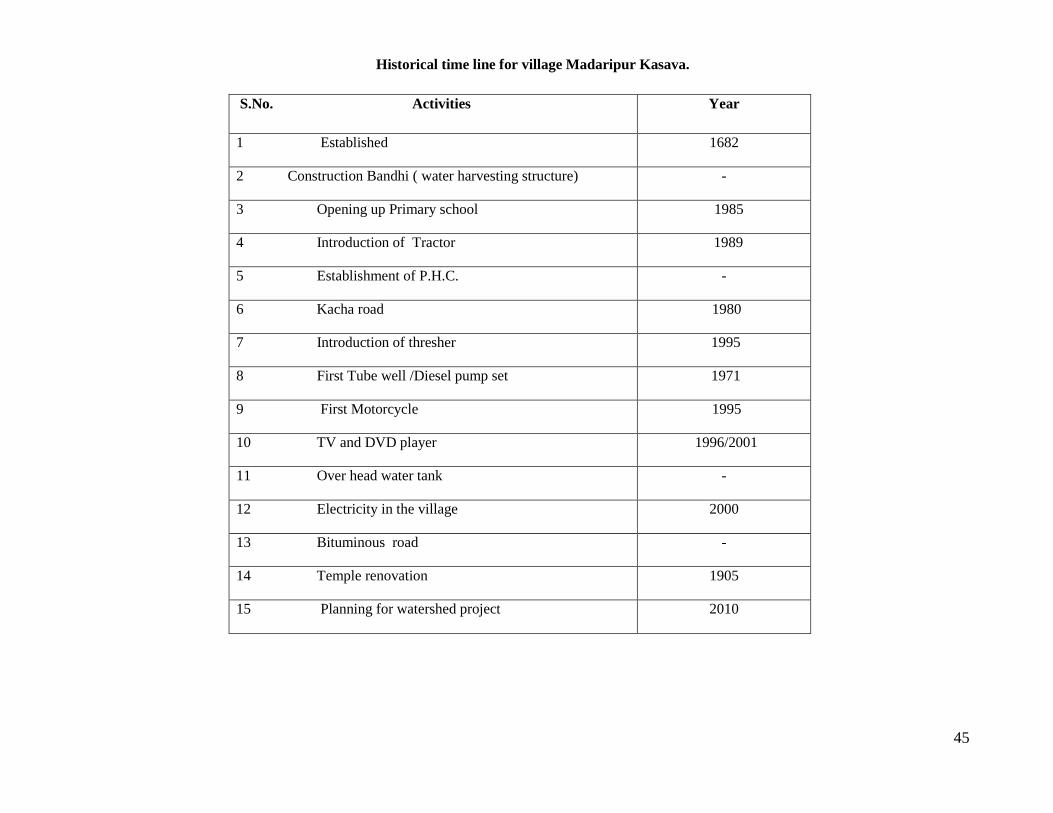
Historical time line for village Madaripur Kasava.
S.No. Activities Year
1 Established 1682
2 Construction Bandhi ( water harvesting structure) -
3 Opening up Primary school 1985
4 Introduction of Tractor 1989
5 Establishment of P.H.C. -
6 Kacha road 1980
7 Introduction of thresher 1995
8 First Tube well /Diesel pump set 1971
9 First Motorcycle 1995
10 TV and DVD player 1996/2001
11 Over head water tank -
12 Electricity in the village 2000
13 Bituminous road -
14 Temple renovation 1905
15 Planning for watershed project 2010
46
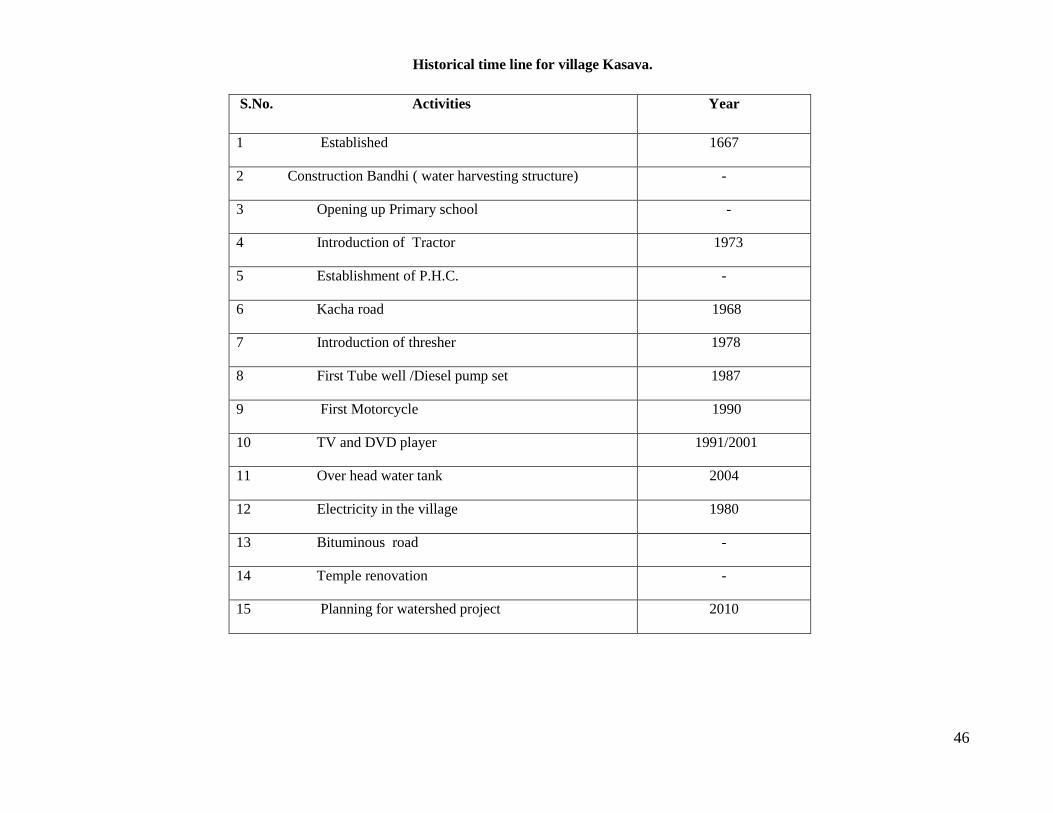
Historical time line for village Kasava.
S.No. Activities Year
1 Established 1667
2 Construction Bandhi ( water harvesting structure) -
3 Opening up Primary school -
4 Introduction of Tractor 1973
5 Establishment of P.H.C. -
6 Kacha road 1968
7 Introduction of thresher 1978
8 First Tube well /Diesel pump set 1987
9 First Motorcycle 1990
10 TV and DVD player 1991/2001
11 Over head water tank 2004
12 Electricity in the village 1980
13 Bituminous road -
14 Temple renovation -
15 Planning for watershed project 2010

47
Historical time line for village Bhawalpur.
S.No. Activities Year
1 Established 1782
2 Construction Bandhi ( water harvesting structure) -
3 Opening up Primary school -
4 Introduction of Tractor 1971
5 Establishment of P.H.C. -
6 Kacha road 1968
7 Introduction of thresher 1976
8 First Tube well /Diesel pump set 1989
9 First Motorcycle 1991
10 TV and DVD player 1992/2002
11 Over head water tank -
12 Electricity in the village 2000
13 Bituminous road -
14 Temple renovation 1966
15 Planning for watershed project 2010

48
Historical time line for village Hathin.
S.No. Activities Year
1 Established 1810
2 Construction Bandhi ( water harvesting structure) 2004
3 Opening up Primary school 1980
4 Introduction of Tractor 1986
5 Establishment of P.H.C. -
6 Kacha road 1975
7 Introduction of thresher 1986
8 First Tube well /Diesel pump set 1984
9 First Motorcycle 1990
10 TV and DVD player 1988
11 Over head water tank -
12 Electricity in the village 2005
13 Bituminous road 1982
14 Temple renovation 1980
15 Planning for watershed project 2010

49
Historical time line for village Mudaiya.
S.No. Activities Year
1 Established 1800
2 Construction Bandhi ( water harvesting structure) 2005
3 Opening up Primary school 1980
4 Introduction of Tractor 1986
5 Establishment of P.H.C. -
6 Kacha road 1976
7 Introduction of thresher 1992
8 First Tube well /Diesel pump set 1986
9 First Motorcycle 1994
10 TV and DVD player 1996
11 Over head water tank -
12 Electricity in the village 2005
13 Bituminous road 1981
14 Temple renovation 1984
15 Planning for watershed project 2010

50
Historical time line for village Teur.
S.No. Activities Year
1 Established 1503
2 Construction Bandhi ( water harvesting structure) 2005
3 Opening up Primary school 1985
4 Introduction of Tractor 1987
5 Establishment of P.H.C. -
6 Kacha road 1981
7 Introduction of thresher 1990
8 First Tube well /Diesel pump set 1975
9 First Motorcycle 1985
10 TV and DVD player 1993/1998
11 Over head water tank -
12 Electricity in the village 2005
13 Bituminous road 1981
14 Temple renovation 1978
15 Planning for watershed project 2010

51
Historical time line for village Behta.
S.No. Activities Year
1 Established 1597
2 Construction Bandhi ( water harvesting structure) -
3 Opening up Primary school 1975
4 Introduction of Tractor 1975
5 Establishment of P.H.C. -
6 Kacha road 1990
7 Introduction of thresher 1980
8 First Tube well /Diesel pump set 1972
9 First Motorcycle 1980
10 TV and DVD player 1992/1998
11 Over head water tank -
12 Electricity in the village 2005
13 Bituminous road 1995
14 Temple renovation 1815
15 Planning for watershed project 2010

52
Historical time line for village Aseh.
S.No. Activities Year
1 Established 1725
2 Construction Bandhi ( water harvesting structure) -
3 Opening up Primary school 1960
4 Introduction of Tractor 1978
5 Establishment of P.H.C. -
6 Kacha road 1976
7 Introduction of thresher 1989
8 First Tube well /Diesel pump set 1968
9 First Motorcycle 1992
10 TV and DVD player 1998/2003
11 Over head water tank -
12 Electricity in the village 2006
13 Bituminous road -
14 Temple renovation 1822
15 Planning for watershed project 2010

53
Historical time line for village Chanderpur.
S.No. Activities Year
1 Established 1732
2 Construction Bandhi ( water harvesting structure) -
3 Opening up Primary school 1965
4 Introduction of Tractor 1979
5 Establishment of P.H.C. -
6 Kacha road 1966
7 Introduction of thresher 1987
8 First Tube well /Diesel pump set 1972
9 First Motorcycle 1981
10 TV and DVD player 1992/2000
11 Over head water tank -
12 Electricity in the village 1995
13 Bituminous road -
14 Temple renovation 1860
15 Planning for watershed project 2010

54
Historical time line for village Paliyabuchpur.
S.No. Activities Year
1 Established 1495
2 Construction Bandhi ( water harvesting structure) -
3 Opening up Primary school 1967
4 Introduction of Tractor 1970
5 Establishment of P.H.C. 1985
6 Kacha road 1965
7 Introduction of thresher 1980
8 First Tube well /Diesel pump set 1970
9 First Motorcycle 1977
10 TV and DVD player 1994/1998
11 Over head water tank 1995
12 Electricity in the village 1997
13 Bituminous road 1965
14 Temple renovation 1805
15 Planning for watershed project 2010
55
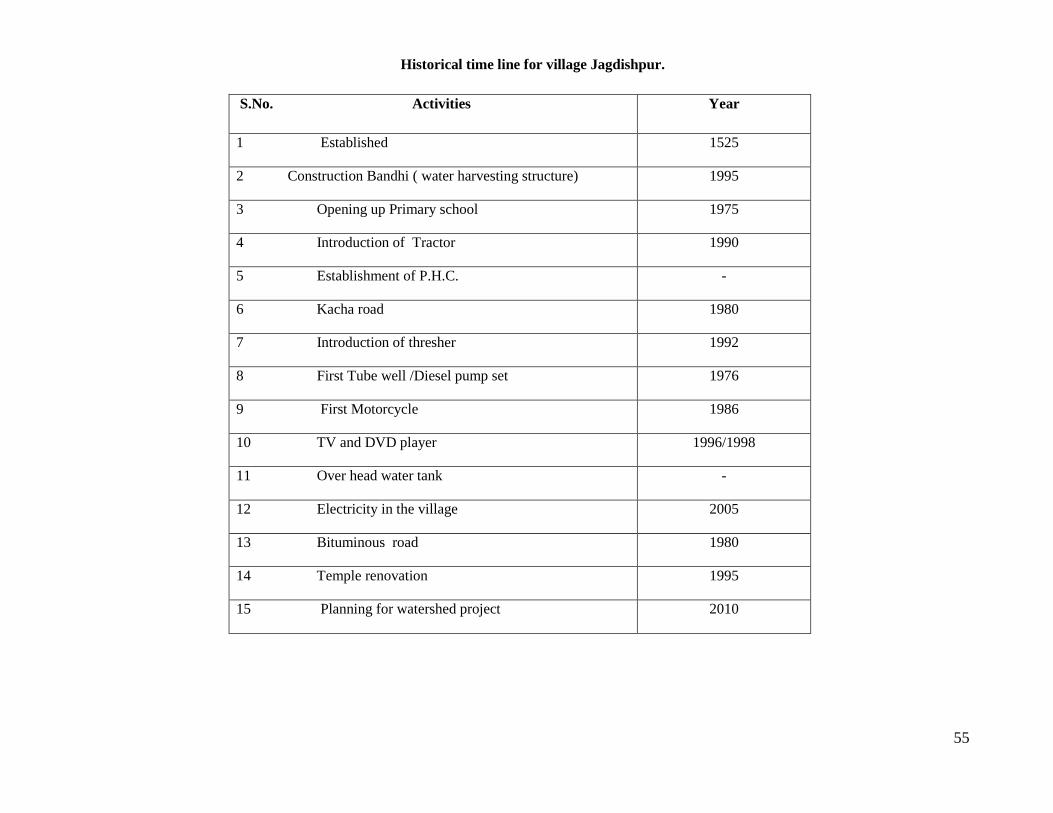
Historical time line for village Jagdishpur.
S.No. Activities Year
1 Established 1525
2 Construction Bandhi ( water harvesting structure) 1995
3 Opening up Primary school 1975
4 Introduction of Tractor 1990
5 Establishment of P.H.C. -
6 Kacha road 1980
7 Introduction of thresher 1992
8 First Tube well /Diesel pump set 1976
9 First Motorcycle 1986
10 TV and DVD player 1996/1998
11 Over head water tank -
12 Electricity in the village 2005
13 Bituminous road 1980
14 Temple renovation 1995
15 Planning for watershed project 2010
56
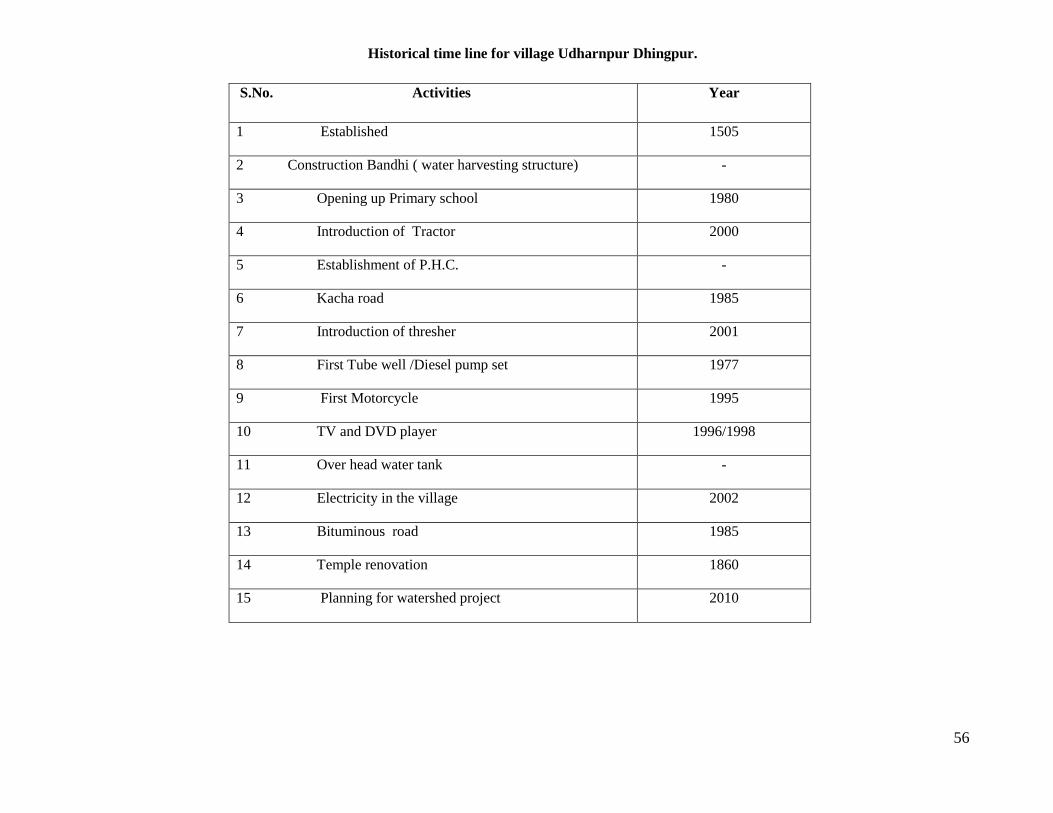
Historical time line for village Udharnpur Dhingpur.
S.No. Activities Year
1 Established 1505
2 Construction Bandhi ( water harvesting structure) -
3 Opening up Primary school 1980
4 Introduction of Tractor 2000
5 Establishment of P.H.C. -
6 Kacha road 1985
7 Introduction of thresher 2001
8 First Tube well /Diesel pump set 1977
9 First Motorcycle 1995
10 TV and DVD player 1996/1998
11 Over head water tank -
12 Electricity in the village 2002
13 Bituminous road 1985
14 Temple renovation 1860
15 Planning for watershed project 2010

57
Historical time line for village Kunwarpur Junu.
S.No. Activities Year
1 Established 1660
2 Construction Bandhi ( water harvesting structure) 1995
3 Opening up Primary school 1975
4 Introduction of Tractor 1987
5 Establishment of P.H.C. -
6 Kacha road 1980
7 Introduction of thresher 1988
8 First Tube well /Diesel pump set 1975
9 First Motorcycle 1985
10 TV and DVD player 1994/1998
11 Over head water tank -
12 Electricity in the village 2003
13 Bituminous road 1980
14 Temple renovation 1945
15 Planning for watershed project 2010
Historical time line for village Sarai Sunder.

58
S.No. Activities Year
1 Established 1670
2 Construction Bandhi ( water harvesting structure) 1995
3 Opening up Primary school 1965
4 Introduction of Tractor 1970
5 Establishment of P.H.C. 2005
6 Kacha road 1965
7 Introduction of thresher 1978
8 First Tube well /Diesel pump set 1970
9 First Motorcycle 1980
10 TV and DVD player 1994/1998
11 Over head water tank -
12 Electricity in the village 2000
13 Bituminous road 1965
14 Temple renovation 1845
15 Planning for watershed project 2010
Historical time line for village Khudava.
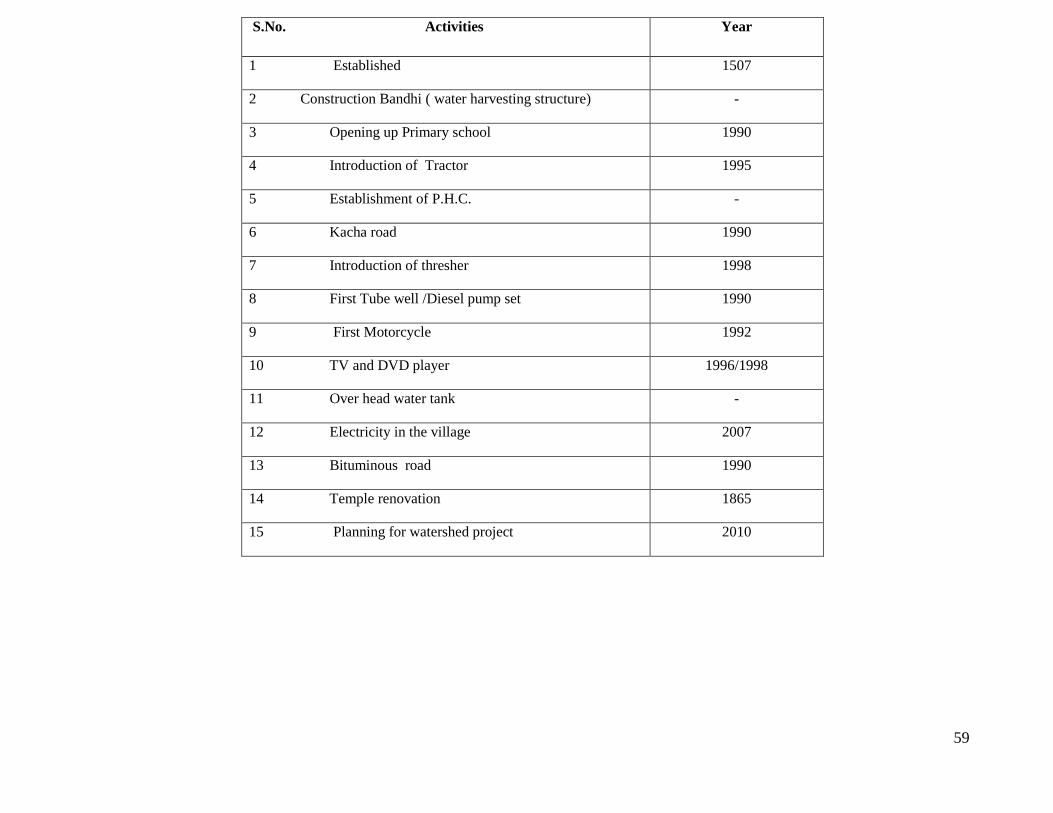
59
S.No. Activities Year
1 Established 1507
2 Construction Bandhi ( water harvesting structure) -
3 Opening up Primary school 1990
4 Introduction of Tractor 1995
5 Establishment of P.H.C. -
6 Kacha road 1990
7 Introduction of thresher 1998
8 First Tube well /Diesel pump set 1990
9 First Motorcycle 1992
10 TV and DVD player 1996/1998
11 Over head water tank -
12 Electricity in the village 2007
13 Bituminous road 1990
14 Temple renovation 1865
15 Planning for watershed project 2010
60
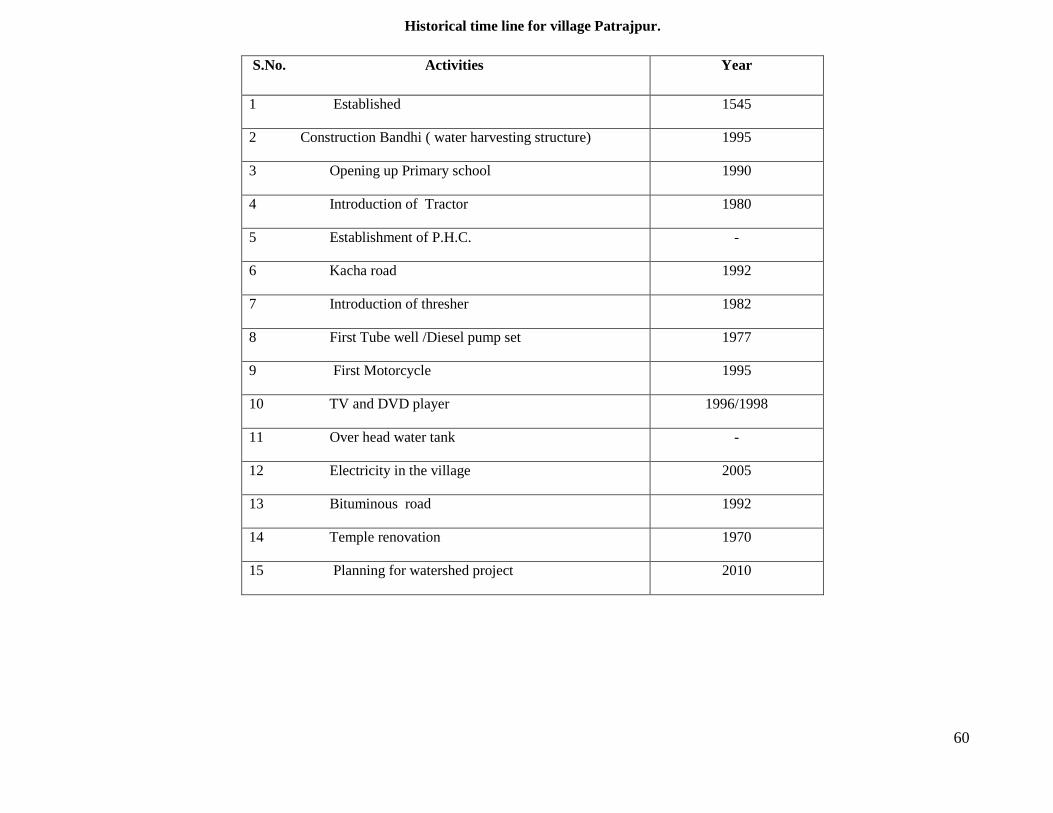
Historical time line for village Patrajpur.
S.No. Activities Year
1 Established 1545
2 Construction Bandhi ( water harvesting structure) 1995
3 Opening up Primary school 1990
4 Introduction of Tractor 1980
5 Establishment of P.H.C. -
6 Kacha road 1992
7 Introduction of thresher 1982
8 First Tube well /Diesel pump set 1977
9 First Motorcycle 1995
10 TV and DVD player 1996/1998
11 Over head water tank -
12 Electricity in the village 2005
13 Bituminous road 1992
14 Temple renovation 1970
15 Planning for watershed project 2010

61
Historical time line for village Kamalpur.
S.No. Activities Year
1 Established 1550
2 Construction Bandhi ( water harvesting structure) 1996
3 Opening up Primary school 1970
4 Introduction of Tractor 1990
5 Establishment of P.H.C. -
6 Kacha road 1992
7 Introduction of thresher 1992
8 First Tube well /Diesel pump set 1977
9 First Motorcycle 1997
10 TV and DVD player 1996/1998-
11 Over head water tank -
12 Electricity in the village 2005
13 Bituminous road 1992
14 Temple renovation 1975
15 Planning for watershed project 2010
62
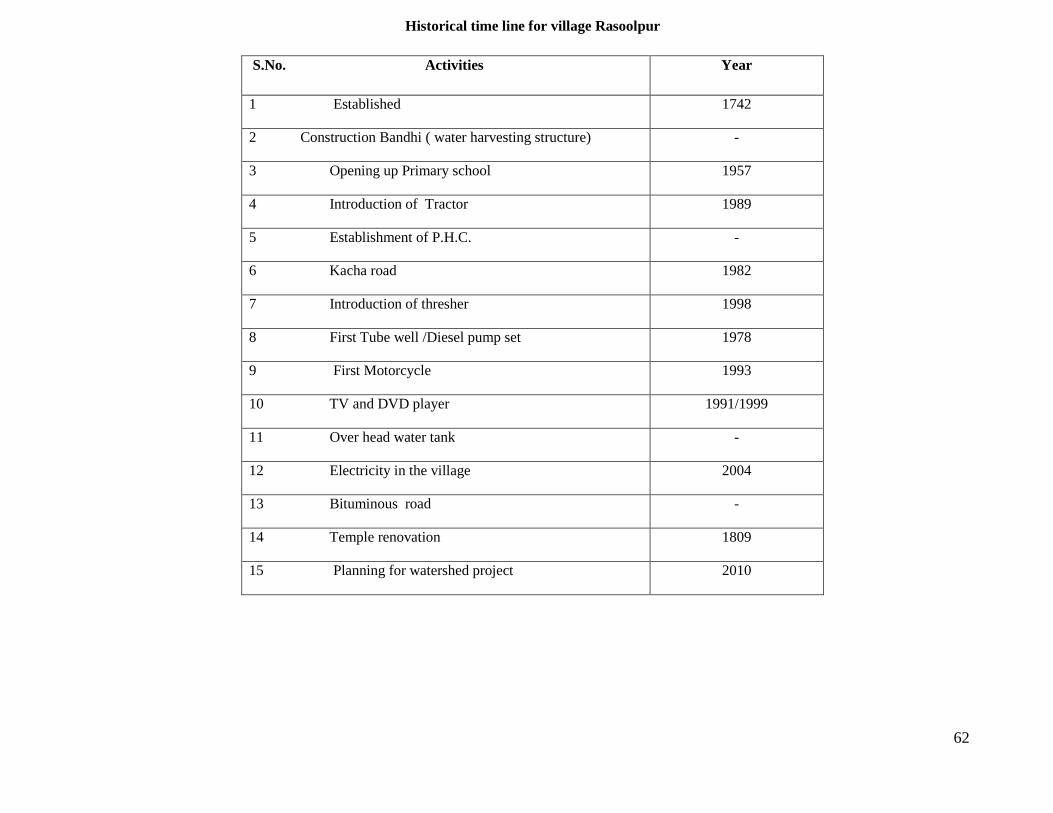
Historical time line for village Rasoolpur
S.No. Activities Year
1 Established 1742
2 Construction Bandhi ( water harvesting structure) -
3 Opening up Primary school 1957
4 Introduction of Tractor 1989
5 Establishment of P.H.C. -
6 Kacha road 1982
7 Introduction of thresher 1998
8 First Tube well /Diesel pump set 1978
9 First Motorcycle 1993
10 TV and DVD player 1991/1999
11 Over head water tank -
12 Electricity in the village 2004
13 Bituminous road -
14 Temple renovation 1809
15 Planning for watershed project 2010
63
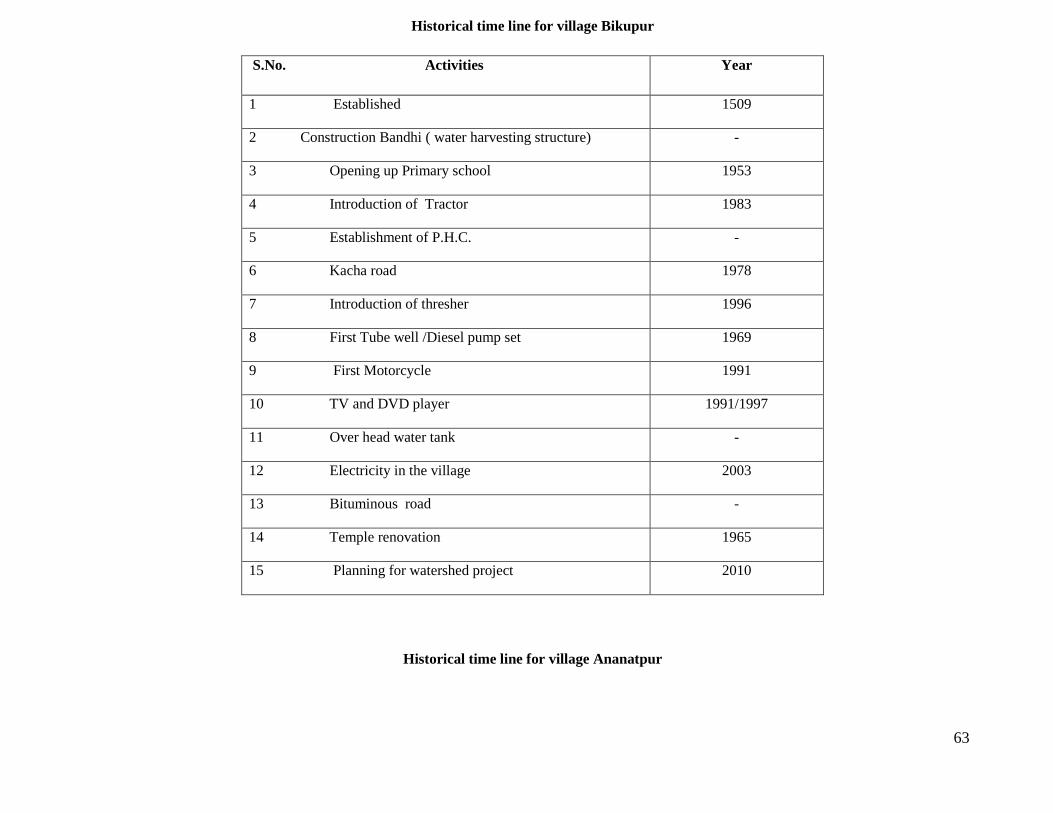
Historical time line for village Bikupur
S.No. Activities Year
1 Established 1509
2 Construction Bandhi ( water harvesting structure) -
3 Opening up Primary school 1953
4 Introduction of Tractor 1983
5 Establishment of P.H.C. -
6 Kacha road 1978
7 Introduction of thresher 1996
8 First Tube well /Diesel pump set 1969
9 First Motorcycle 1991
10 TV and DVD player 1991/1997
11 Over head water tank -
12 Electricity in the village 2003
13 Bituminous road -
14 Temple renovation 1965
15 Planning for watershed project 2010
Historical time line for village Ananatpur

64
S.No. Activities Year
1 Established 1609
2 Construction Bandhi ( water harvesting structure) -
3 Opening up Primary school 1955
4 Introduction of Tractor 1983
5 Establishment of P.H.C. -
6 Kacha road 1978
7 Introduction of thresher 1996
8 First Tube well /Diesel pump set 1969
9 First Motorcycle 1991
10 TV and DVD player 1991/1997
11 Over head water tank -
12 Electricity in the village 2005
13 Bituminous road -
14 Temple renovation 1960
15 Planning for watershed project 2010
Historical time line for village Vinayakpur

65
S.No. Activities Year
1 Established 1575
2 Construction Bandhi ( water harvesting structure) -
3 Opening up Primary school 1957
4 Introduction of Tractor 1983
5 Establishment of P.H.C. -
6 Kacha road 1978
7 Introduction of thresher 1996
8 First Tube well /Diesel pump set 1969
9 First Motorcycle 1991
10 TV and DVD player 1991/1997
11 Over head water tank -
12 Electricity in the village 2003
13 Bituminous road -
14 Temple renovation 1865
15 Planning for watershed project 2010
66
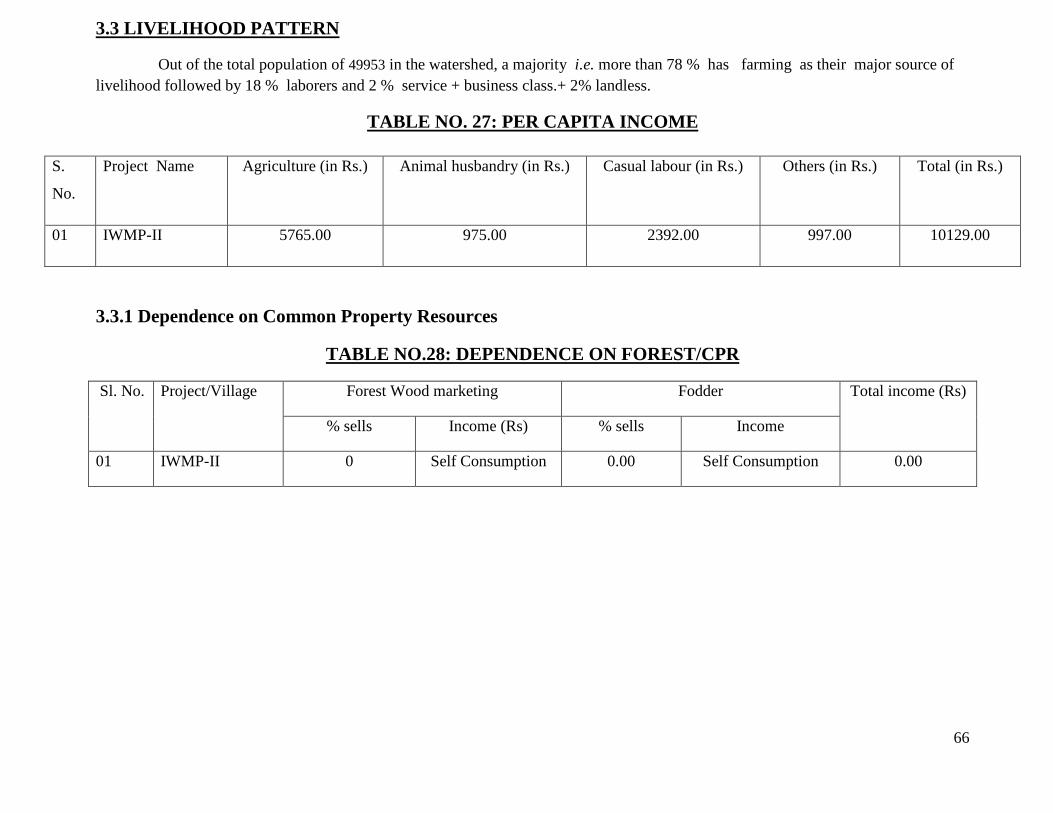
3.3 LIVELIHOOD PATTERN
Out of the total population of 49953 in the watershed, a majority i.e. more than 78 % has farming as their major source of livelihood followed by 18 % laborers and 2 % service + business class.+ 2% landless.
TABLE NO. 27: PER CAPITA INCOME
S.
No.
Project Name Agriculture (in Rs.) Animal husbandry (in Rs.) Casual labour (in Rs.) Others (in Rs.) Total (in Rs.)
01 IWMP-II 5765.00 975.00 2392.00 997.00 10129.00
3.3.1 Dependence on Common Property Resources
TABLE NO.28: DEPENDENCE ON FOREST/CPR
Sl. No. Project/Village Forest Wood marketing Fodder Total income (Rs)
% sells Income (Rs) % sells Income
01 IWMP-II 0 Self Consumption 0.00 Self Consumption 0.00

67
3.4. COMPARATIVE DATA OF THE CROP PRODUCTIVITY OF THE AREA: PROJECT AREA VS. DISTRICT VS. STATE VS. COUNTRY VS. WORLD:
“The term productivity in general means the total output per unit of factor input. For example land productivity means output per
hectare of land. Productivity is an average and is calculated by dividing the total output of a particular crop by the total cultivated area
under that crop.”
Data are made available by the Baseline survey (for IWMP-II), Handbook of Agriculture, ICAR publication 2001(For Censex
data ), and Final district plan (DAP) of Dept. of Agriculture . The results indicate that IWMP-II village has very low productivity
compared to world, India, U.P & Kannauj.
The productivity is low not only because that the land is unproductive or the farmer’s lack the skills to manage their crop but
also due lack to of source of irrigation, salty water and scarcity of rain.
The IWMP-II village comes under arid zone. So farmers grow crop according to the rainfall. If they get good rainfall they
generally grow high value crops like mustard, Arhar,Alsi,Barli Bengal gram etc. In case of low rainfall they go for sorghum, castor, and
pearl millet. So we can say that monsoon decides cropping patterns of IWMP-II village.
68
CHAPTER – 4
WATERSHED ACTIVITIES
69
4.1. SCIENTIFIC PLANNING:
1. Cluster Approach :- This enversages intregrated development of Geo-hydrological unit ie. Treatment of cluster of micro –watershed The IWMP IInd Kannauj Project consist of 8 micro 2B3D1e2b, 2B3C6f2d, 2B3C6f2c, 2B3C6f1a, 2B3C6f2b, 2B3C6f1b, 2B3C6f2a, 2B3C6f1c.
2. Base line Survey To access the impact of any watershed development programme a detailed baseline survey has to be conducted. This acts a benchmark for any intervention during and post implementation of any development programme. A detailed baseline survey was undertaken which involved household census survey, Bio-physical survey and Village level data collection from Talati –cum mantri. Household census survey includes a detailed questionnaire which has been filled by visiting each and every household in the village. This gave in the details of the demographic profile of the village, the literacy percentage, SC/ST population, number of BPL household, cattle population, net consumption rate in the village, average milk production of the cattle and various schemes running and their benefits
Bio-physical survey was undertaken to identify various natural resources available in the village. It included the soil typology, well in the area, crop taken in the field, Cropping pattern, fertilizer used and various sources of irrigation in the field.,
3 Participatory Rural Appraisal (PRA)
The past experience of watershed has given tremendous input to focus on creating accountability of the stakeholders towards the programme. This has created an emphasis to include all the stakeholder communities and their local and Indigenous Technological Knowledge (ITK) while planning for any activity. Participatory approach provides a new path for planning, implementing, monitoring and post- withdrawal activities with a complete accountability of the stakeholders. Various PRA techniques like resource mapping, social mapping, and season calendars were used to understand the physical and social orientation of the village in general and watershed in specific. These tools put the villagers in ease than the complicated questionnaires. 4.2 Use of GIS and Remote sensing for planning
Use of various high science tools has been promoted at various stages of watershed development. a) Prioritization
Geographical Information System(GIS) has been used for prioritization process. Various layer maps were created like Geo-morphological, Soil, BPL Population, SC/ST population, Ground water Status, Drinking water
situation Slope percent. These were all given proper weightage according to the DoLR specification. This helped in prioritization of various watershed areas.
b) Planning
70
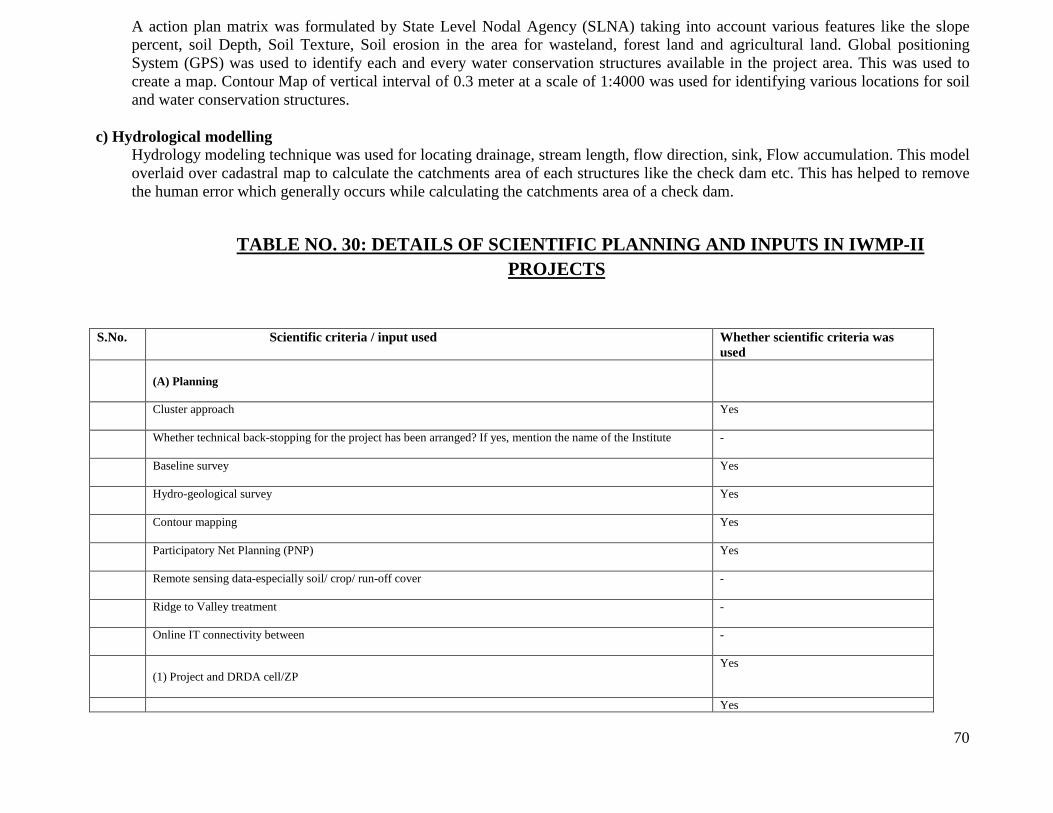
A action plan matrix was formulated by State Level Nodal Agency (SLNA) taking into account various features like the slope percent, soil Depth, Soil Texture, Soil erosion in the area for wasteland, forest land and agricultural land. Global positioning System (GPS) was used to identify each and every water conservation structures available in the project area. This was used to create a map. Contour Map of vertical interval of 0.3 meter at a scale of 1:4000 was used for identifying various locations for soil and water conservation structures.
c) Hydrological modelling
Hydrology modeling technique was used for locating drainage, stream length, flow direction, sink, Flow accumulation. This model overlaid over cadastral map to calculate the catchments area of each structures like the check dam etc. This has helped to remove the human error which generally occurs while calculating the catchments area of a check dam.
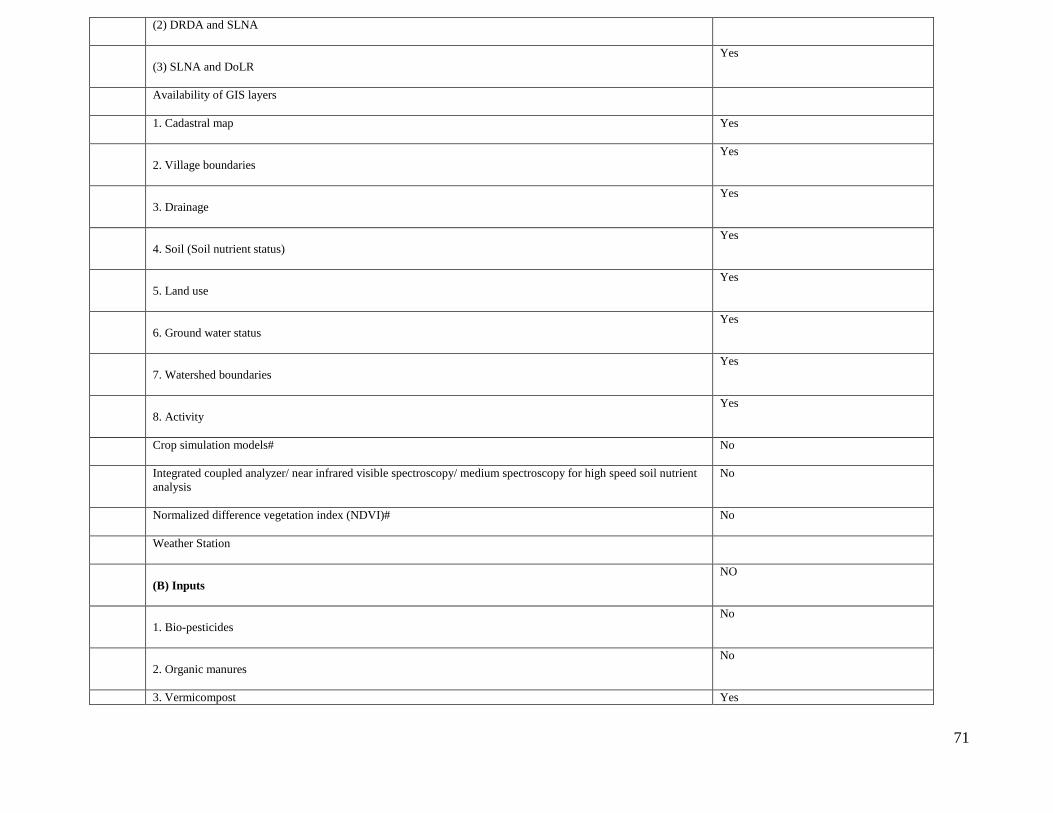
TABLE NO. 30: DETAILS OF SCIENTIFIC PLANNING AND INPUTS IN IWMP-II PROJECTS
S.No. Scientific criteria / input used Whether scientific criteria was used
(A) Planning
Cluster approach
Yes
Whether technical back-stopping for the project has been arranged? If yes, mention the name of the Institute
-
Baseline survey
Yes
Hydro-geological survey
Yes
Contour mapping
Yes
Participatory Net Planning (PNP)
Yes
Remote sensing data-especially soil/ crop/ run-off cover
-
Ridge to Valley treatment
-
Online IT connectivity between
-
(1) Project and DRDA cell/ZP
Yes
Yes
71
(2) DRDA and SLNA
(3) SLNA and DoLR
Yes
Availability of GIS layers
1. Cadastral map
Yes
2. Village boundaries
Yes
3. Drainage
Yes
4. Soil (Soil nutrient status)
Yes
5. Land use
Yes
6. Ground water status
Yes
7. Watershed boundaries
Yes
8. Activity
Yes
Crop simulation models#
No
Integrated coupled analyzer/ near infrared visible spectroscopy/ medium spectroscopy for high speed soil nutrient analysis
No
Normalized difference vegetation index (NDVI)#
No
Weather Station
(B) Inputs
NO
1. Bio-pesticides
No
2. Organic manures
No
3. Vermicompost Yes

72
4. Bio-fertilizer
Yes
5. Water saving devices
Yes
6. Mechanized tools/ implements
Yes
7. Bio-fencing
Yes
8. Nutrient budgeting
Yes
9. Automatic water level recorders & sediment samplers
NO
Any other (please specify)
NO

73
4.2. INSTITUTION BUILDING
4.2.2 SELF HELP GROUP:-
Self Help Groups are motivated, small homogenous groups organized together through credit and thrift activities. Self help group initiative especially for women help uplift their livelihood. Generally self help groups include landless and poor women. Before formation of the SHGs, during PRA activities, Focussed Group Discussions (FGDs) were held with the women, which came up with the following observations: a) Lack of proper credit facilities due to low intervention of formal financial credit institution.
b) Excessive exploitation of weaker section by money lenders
c) Lack of attitude for saving among poor people
d) Lack of knowledge on credit and thrift activity and banking
TABLE NO.32 SHG DETAIL
S.
No.
Name of Micro Watershed
Code No. (M.W.S.)
Name of S.H.G. Occupation of S.H.G. Name of Chairman & No. Members
1 2 3 4 5 6 7
1. Bhikampur Sani
2B3C6f2a Jai Santoshi Maa Dairy Shri Mukesh Kumar 11
2 Khanpur Kasava
2B3C6f2b Viklang Dairy Shri Ravindra 10
3 Kasava 2B3C6f2c Dugavati Dairy Shri ShyamLal 11
4 Mudaiya 2B3C6f1b Jai Mata Di Dairy Smt. Reeta Devi 10
5 Teur 2B3C6f1a Maa Laxmi Goatry Shri NanheLal 10
6 Aseh 2B3C6f1c Jai Maa Kali Dairy Shri Pala Singh 10
74
7. Kamalpur 2B3D1e2b Jai Maa Bhagvati Dairy Shri Ranveer Singh 11
8 Ananatpur 2B3C6f2d Jai Durga Goatry Shri Badam Singh 11
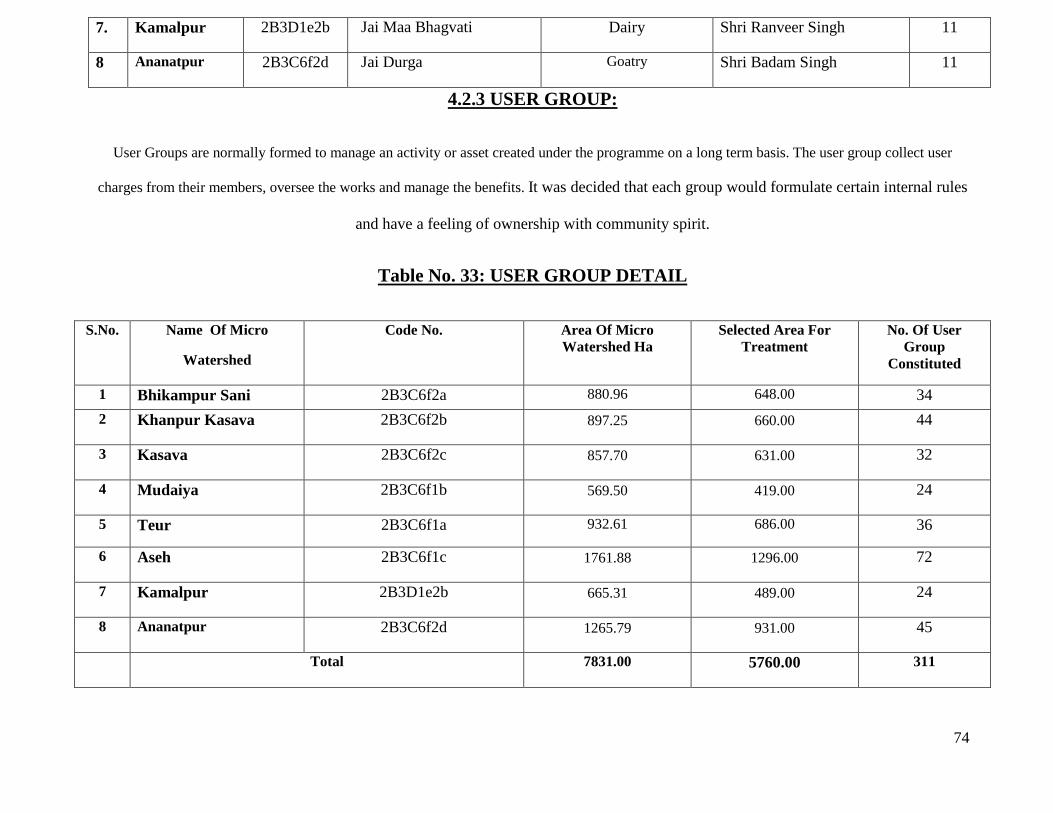
4.2.3 USER GROUP:
User Groups are normally formed to manage an activity or asset created under the programme on a long term basis. The user group collect user
charges from their members, oversee the works and manage the benefits. It was decided that each group would formulate certain internal rules
and have a feeling of ownership with community spirit.
Table No. 33: USER GROUP DETAIL
S.No. Name Of Micro
Watershed
Code No. Area Of Micro Watershed Ha
Selected Area For Treatment
No. Of User Group
Constituted
1 Bhikampur Sani 2B3C6f2a 880.96 648.00 34 2 Khanpur Kasava 2B3C6f2b 897.25 660.00 44
3 Kasava 2B3C6f2c 857.70 631.00 32
4 Mudaiya 2B3C6f1b 569.50 419.00 24
5 Teur
2B3C6f1a 932.61 686.00 36
6 Aseh 2B3C6f1c 1761.88 1296.00 72
7 Kamalpur 2B3D1e2b 665.31 489.00 24
8 Ananatpur 2B3C6f2d 1265.79 931.00 45
Total 7831.00 5760.00 311
75
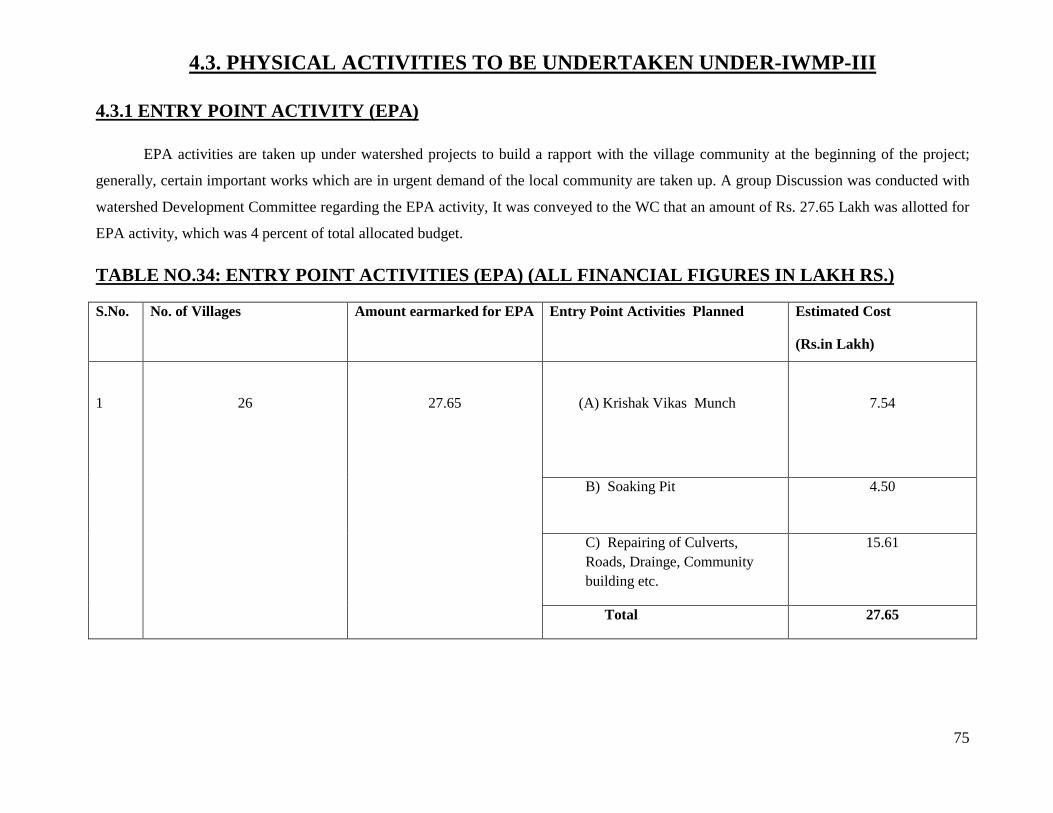
4.3. PHYSICAL ACTIVITIES TO BE UNDERTAKEN UNDER-IWMP-III
4.3.1 ENTRY POINT ACTIVITY (EPA)
EPA activities are taken up under watershed projects to build a rapport with the village community at the beginning of the project;
generally, certain important works which are in urgent demand of the local community are taken up. A group Discussion was conducted with
watershed Development Committee regarding the EPA activity, It was conveyed to the WC that an amount of Rs. 27.65 Lakh was allotted for
EPA activity, which was 4 percent of total allocated budget.
TABLE NO.34: ENTRY POINT ACTIVITIES (EPA) (ALL FINANCIAL FIGURES IN LAKH RS.)
S.No. No. of Villages Amount earmarked for EPA Entry Point Activities Planned Estimated Cost
(Rs.in Lakh)
1
26
27.65
(A) Krishak Vikas Munch
7.54
B) Soaking Pit 4.50
C) Repairing of Culverts, Roads, Drainge, Community building etc.
15.61
Total 27.65
76
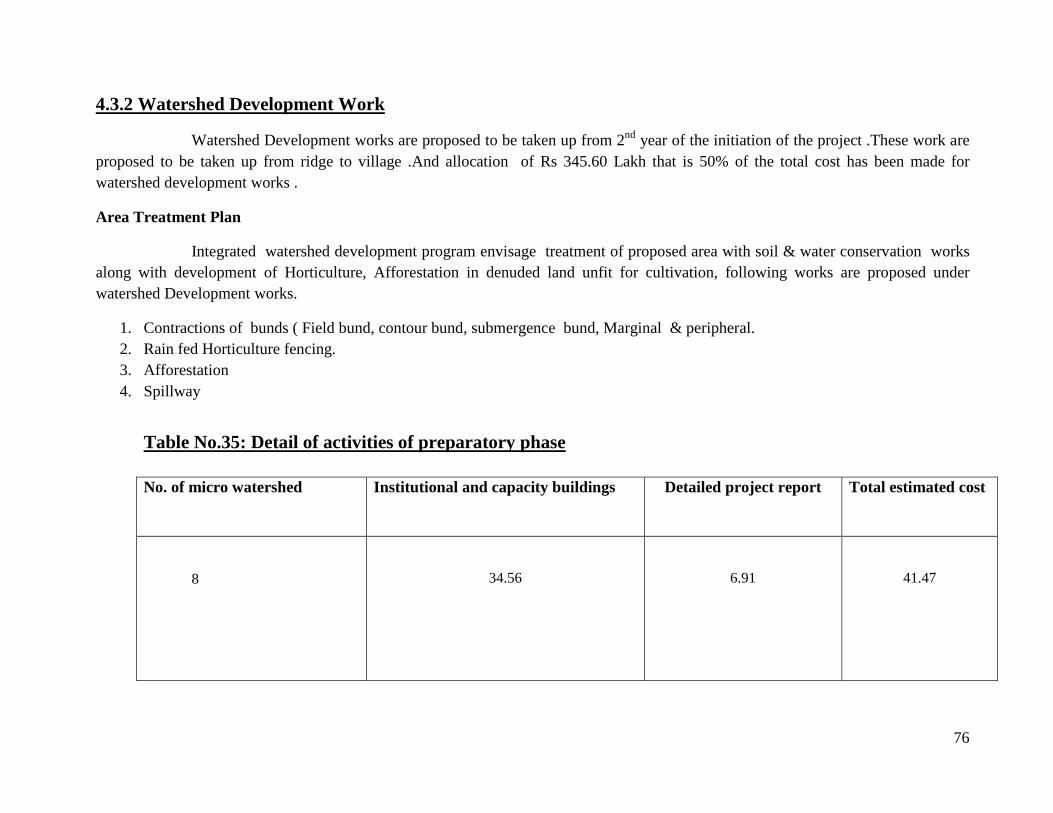
4.3.2 Watershed Development Work
Watershed Development works are proposed to be taken up from 2nd year of the initiation of the project .These work are proposed to be taken up from ridge to village .And allocation of Rs 345.60 Lakh that is 50% of the total cost has been made for watershed development works .
Area Treatment Plan
Integrated watershed development program envisage treatment of proposed area with soil & water conservation works along with development of Horticulture, Afforestation in denuded land unfit for cultivation, following works are proposed under watershed Development works.
1. Contractions of bunds ( Field bund, contour bund, submergence bund, Marginal & peripheral. 2. Rain fed Horticulture fencing. 3. Afforestation 4. Spillway
Table No.35: Detail of activities of preparatory phase No. of micro watershed Institutional and capacity buildings Detailed project report Total estimated cost
8
34.56
6.91
41.47
77
G.L.
1.5:1 S0.60
K
K
CONTOUR BUND
A C.B.
C.S.= 0.81 Sq.mts.
0.45
2.25
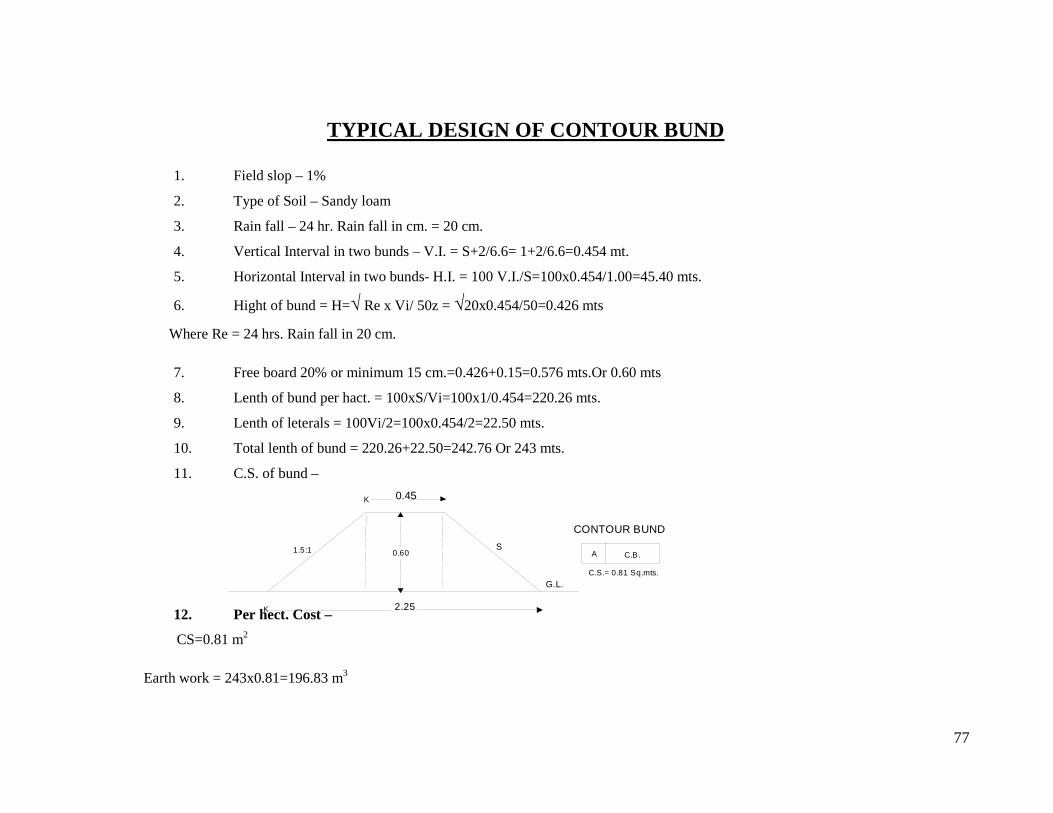
TYPICAL DESIGN OF CONTOUR BUND
1. Field slop – 1%
2. Type of Soil – Sandy loam
3. Rain fall – 24 hr. Rain fall in cm. = 20 cm.
4. Vertical Interval in two bunds – V.I. = S+2/6.6= 1+2/6.6=0.454 mt.
5. Horizontal Interval in two bunds- H.I. = 100 V.I./S=100x0.454/1.00=45.40 mts.
6. Hight of bund = H=√ Re x Vi/ 50z = √20x0.454/50=0.426 mts
Where Re = 24 hrs. Rain fall in 20 cm.
7. Free board 20% or minimum 15 cm.=0.426+0.15=0.576 mts.Or 0.60 mts
8. Lenth of bund per hact. = 100xS/Vi=100x1/0.454=220.26 mts.
9. Lenth of leterals = 100Vi/2=100x0.454/2=22.50 mts.
10. Total lenth of bund = 220.26+22.50=242.76 Or 243 mts.
11. C.S. of bund –
12. Per hect. Cost –
CS=0.81 m2
Earth work = 243x0.81=196.83 m3
78
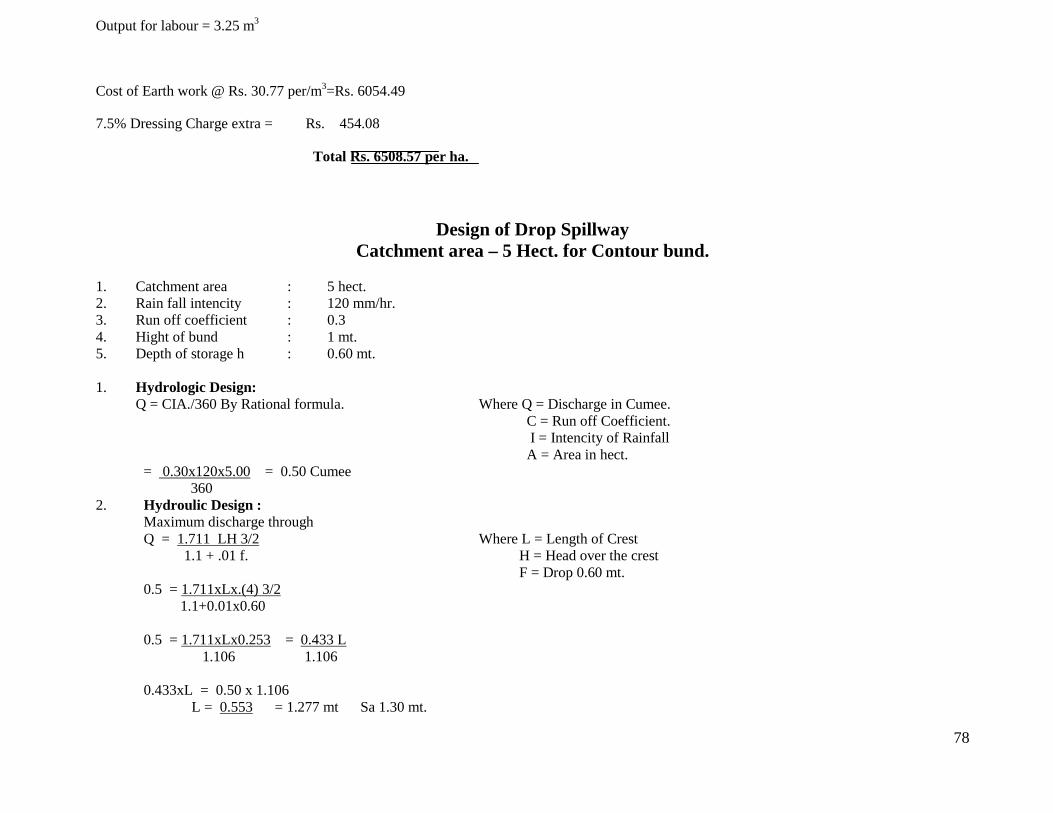
Output for labour = 3.25 m3
Cost of Earth work @ Rs. 30.77 per/m3=Rs. 6054.49
7.5% Dressing Charge extra = Rs. 454.08
Total Rs. 6508.57 per ha.
Design of Drop Spillway Catchment area – 5 Hect. for Contour bund.
1. Catchment area : 5 hect. 2. Rain fall intencity : 120 mm/hr. 3. Run off coefficient : 0.3 4. Hight of bund : 1 mt. 5. Depth of storage h : 0.60 mt. 1. Hydrologic Design: Q = CIA./360 By Rational formula. Where Q = Discharge in Cumee. C = Run off Coefficient. I = Intencity of Rainfall A = Area in hect. = 0.30x120x5.00 = 0.50 Cumee 360 2. Hydroulic Design : Maximum discharge through Q = 1.711 LH 3/2 Where L = Length of Crest 1.1 + .01 f. H = Head over the crest F = Drop 0.60 mt. 0.5 = 1.711xLx.(4) 3/2 1.1+0.01x0.60 0.5 = 1.711xLx0.253 = 0.433 L 1.106 1.106 0.433xL = 0.50 x 1.106 L = 0.553 = 1.277 mt Sa 1.30 mt.
79
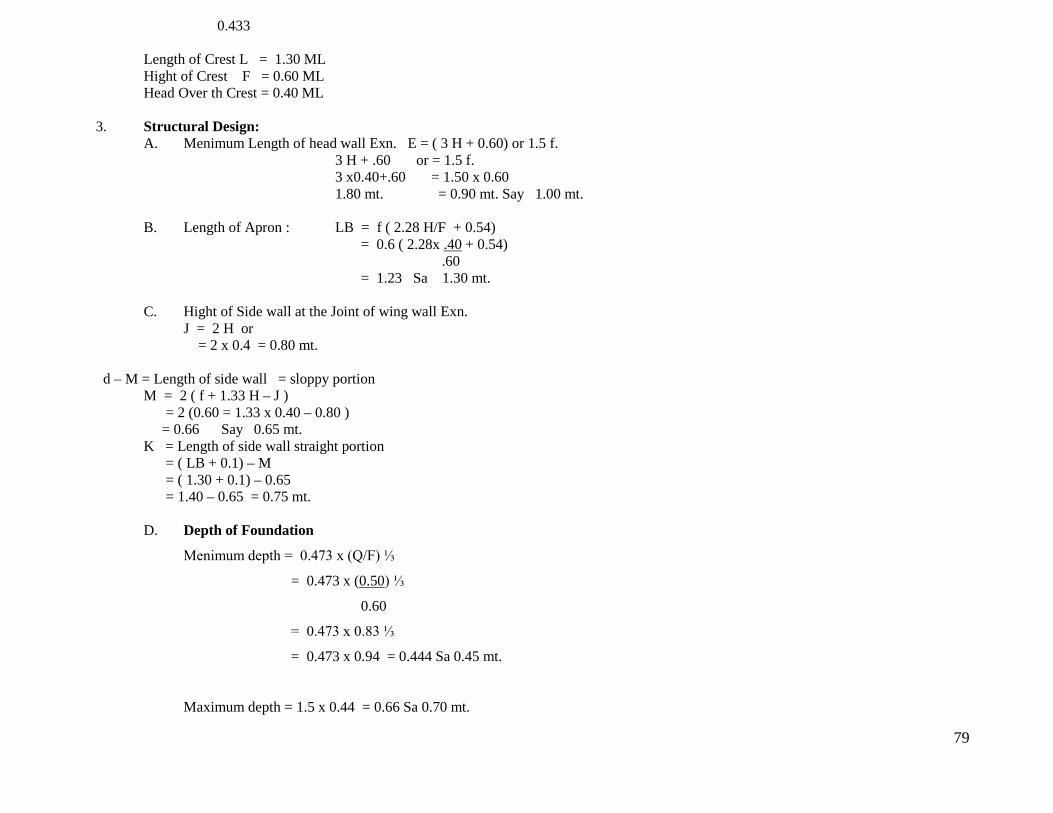
0.433 Length of Crest L = 1.30 ML Hight of Crest F = 0.60 ML Head Over th Crest = 0.40 ML 3. Structural Design: A. Menimum Length of head wall Exn. E = ( 3 H + 0.60) or 1.5 f. 3 H + .60 or = 1.5 f. 3 x0.40+.60 = 1.50 x 0.60 1.80 mt. = 0.90 mt. Say 1.00 mt. B. Length of Apron : LB = f ( 2.28 H/F + 0.54) = 0.6 ( 2.28x .40 + 0.54) .60 = 1.23 Sa 1.30 mt. C. Hight of Side wall at the Joint of wing wall Exn. J = 2 H or = 2 x 0.4 = 0.80 mt. d – M = Length of side wall = sloppy portion M = 2 ( f + 1.33 H – J ) = 2 (0.60 = 1.33 x 0.40 – 0.80 ) = 0.66 Say 0.65 mt. K = Length of side wall straight portion = ( LB + 0.1) – M = ( 1.30 + 0.1) – 0.65 = 1.40 – 0.65 = 0.75 mt. D. Depth of Foundation
Menimum depth = 0.473 x (Q/F) ⅓
= 0.473 x (0.50) ⅓
0.60
= 0.473 x 0.83 ⅓
= 0.473 x 0.94 = 0.444 Sa 0.45 mt.
Maximum depth = 1.5 x 0.44 = 0.66 Sa 0.70 mt.

80
Main Dimension of structure.
Length of head wall = 1.30 mt.
Hight of Crest = 0.60 mt.
Head over the Crest = 0.40 mt.
Menimum top width of head wall = 0.45 mt.
Bottom width of head wall = ½ x ht. crest + Top width
= 0.50 x 0.6 = 0.75 Say 0.70 mt.
Head wall Exn. = 1.80 mt.
Length of Apron = 1.30 mt.

81
Estimate of Drop Spillway for 5 hect. Catchment.
S.
No.
Item Nos. Length Width Hight/ depth Qt.
1 2 3 4 5 6 7
1 E/W in foundation
Head wall Exn
Side wall
Side wall Exn.
Crest wall
Toe wall
Apron
2
2
2
1
1
1
2.00
1.65
1.00
1.30
1.30
1.30
0.35
0.55
0.55
0.80
0.55
1.30
0.70
0.70
0.70
0.70
0.70
0.40
Total
1.540
1.270
0.770
0.728
0.500
0.676
5.484
2 Sand filling work
Head wall Exn.
Side wall
Side wall Exn.
Crest wall
Toe wall
2
2
2
1
1
2.00
1.65
1.00
1.30
1.30
0.55
0.55
0.55
0.80
0.55
0.10
0.10
0.10
0.10
0.10
Total
0.220
0.181
0.110
0.104
0.071
0.686
3 C.C work in 1:3:6
Head wall Exn.
2
2.00
0.55
0.15
0.330

82
Side wall
Side wall Exn.
Crest wall
Toe wall
1:2:4 in Apron
2
2
1
1
1
1.65
1.00
1.30
1.30
1.30
0.55
0.55
0.80
0.55
1.30
0.15
0.15
0.15
0.15
Total
0.20
0.272
0.165
0.156
0.107
1.030
0.338
4 Khanda Manag wall
Head wall Exn.
Side wall upto Toe Exn. Top
Side wall above to ,,
Crest wall up to Apron
Crest wall above to Apron
Side wall Exn.
Toe wall
2
2
2
1
1
1
1
1.80
1.55
1.55+0.65
2
1.30
1.30
0.90
1.30
0.45
0.45
0.45
0.70
0.45 + 0.70
2
0.45
0.45
1.40
0.65
0.80
0.25
0.80
0.65
0.45
Total
0.268
0.906
2.120
0.227
0.598
0.526
0.263
6.908
5 Plastring 1:4
Head wall Exn top
Crest top
Crest U/S
,, D/S
Side wall top
2
1
1
1
2
1.80
1.30
1.30
1.30
(0.65+1.20)
0.45
0.45
-
-
0.45
-
-
0.60
0.84
-
1.620
0.585
0.780
1.092
1.665
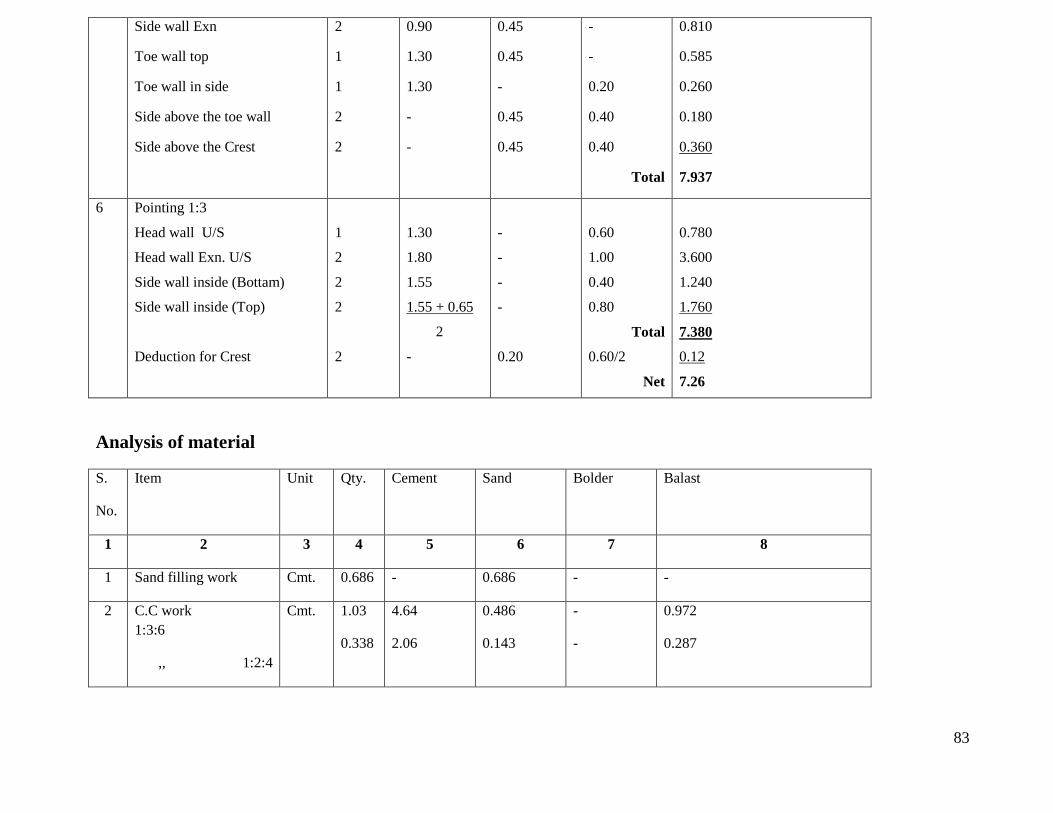
83
Side wall Exn
Toe wall top
Toe wall in side
Side above the toe wall
Side above the Crest
2
1
1
2
2
0.90
1.30
1.30
-
-
0.45
0.45
-
0.45
0.45
-
-
0.20
0.40
0.40
Total
0.810
0.585
0.260
0.180
0.360
7.937
6 Pointing 1:3
Head wall U/S
Head wall Exn. U/S
Side wall inside (Bottam)
Side wall inside (Top)
Deduction for Crest
1
2
2
2
2
1.30
1.80
1.55
1.55 + 0.65
2
-
-
-
-
-
0.20
0.60
1.00
0.40
0.80
Total
0.60/2
Net
0.780
3.600
1.240
1.760
7.380
0.12
7.26
Analysis of material
S.
No.
Item Unit Qty. Cement Sand Bolder Balast
1 2 3 4 5 6 7 8
1 Sand filling work Cmt. 0.686 - 0.686 - -
2 C.C work 1:3:6
,, 1:2:4
Cmt. 1.03
0.338
4.64
2.06
0.486
0.143
-
-
0.972
0.287
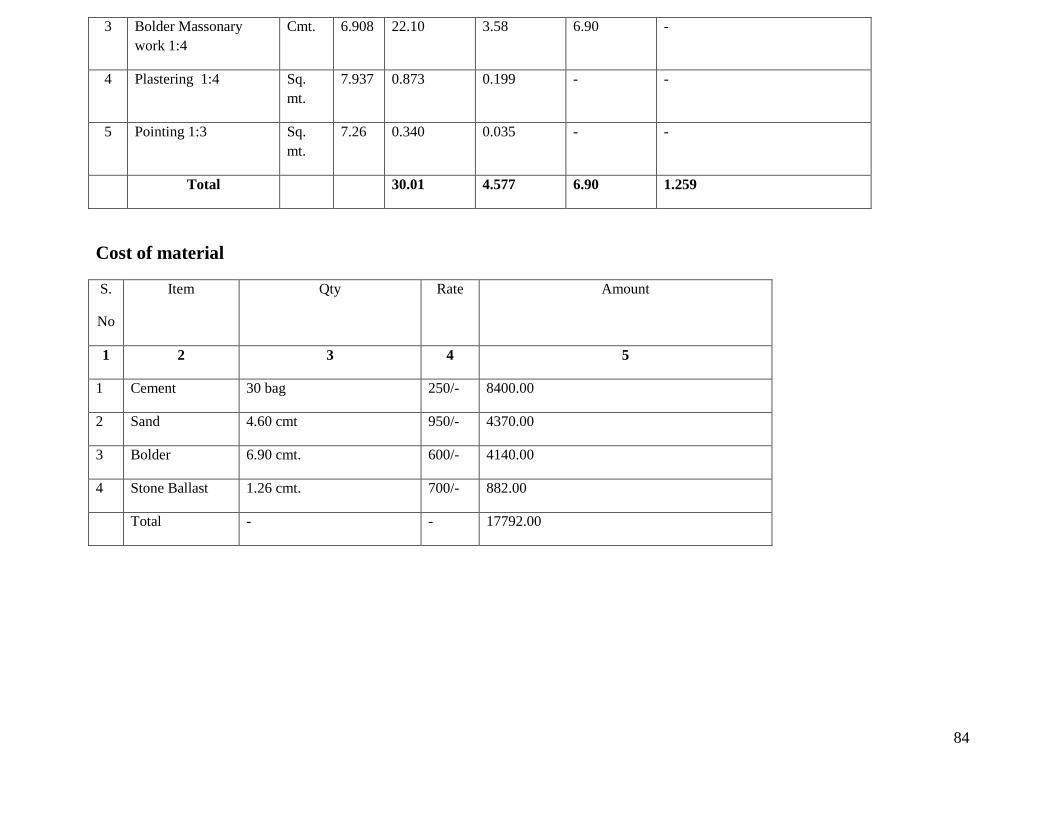
84
3 Bolder Massonary work 1:4
Cmt. 6.908 22.10 3.58 6.90 -
4 Plastering 1:4 Sq. mt.
7.937 0.873 0.199 - -
5 Pointing 1:3 Sq. mt.
7.26 0.340 0.035 - -
Total 30.01 4.577 6.90 1.259
Cost of material
S.
No
Item Qty Rate Amount
1 2 3 4 5
1 Cement 30 bag 250/- 8400.00
2 Sand 4.60 cmt 950/- 4370.00
3 Bolder 6.90 cmt. 600/- 4140.00
4 Stone Ballast 1.26 cmt. 700/- 882.00
Total - - 17792.00

85
Analysis of labour charges
S.
No
Item Qty Rate Amount
1 2 3 4 5
1 E/W in foundation 5.48 cmt. 33.33/- 182.64
2 Sand filling 0.686 cmt. 25/- 17.15
3 C.C works 1.368 cmt. 497/- 679.89
4 Bolder Massanary 6.91 cmt. 385/- 2660.35
5 Plasterring 7.94 m2 41.87/- 332.44
6 Pointing 7.26 m2 28.50 206.91
7 Curing ½ labour 3.50 mandays 100/- 350.00
8 Extra watering 3% Cost of material
- - 533.76
Total 4963.16
Total Cost of Structure Rs. 22755.16 say Rs. 23000.00

86
DRAWING OF WELL
DESCRIPTION
G.L.
G.L.
G.L.
0.40
7.80
0.60
0.15 0.40
0.10
1.00 0.80
0.15
0.5
0.95
G 0.40
3.00 0.40
3.00
0.40
7.80
2.00
0.95
0.20
PLAN
SECTION AT A-A’
A
A’
ISOMETRIC VIEW OF WELL
1. C.C.W. - 1:4:8. 2. R.R. Stone masonry- 1:4 3. Plastering- 1:4 4. Raised Pointing- 1:3.

87
DETAIL ESTIMATE OF JAGAT OF WELL
S.No. Description of Work No. L B D/H Quantity
1. Earth work in foundation 1 3.14 x 7.4 1.20 1.00 27.88
2. Laying of sand 1 3.14 x 7.4 1.00 0.10 2.32
3. C.C.W. 1:4:8 1 3.14 x 7.4 1.00 0.15 3.48
4. R/R Stone masonary 1:4 1 3.14 x 7.4 3.14 x 7.4 3.14 x 7.4 3.14 x 3.4
0.80 0.60 0.40 0.40
0.40 0.40 0.90 0.20
7.43 5.57 8.36 0.85
22.21
5. Filling of earth work 1 3.14 x 5.4 1.60 0.75 20.34
6. C.C.W. 1:4:8 1 3.14 x 5.4 1.60 0.15 4.06
7. C.C.W. 1:2:4 1 {(3.14 x 7.8 x 7.8)/4 – (3.14 x 3.8 x 3.8)/4} x 0.05 1.821
8. Raised pointing 1 3.14 x 7.8 - 0.90 22.04

88
CONSUMPTION OF MATERIALS
S.No. Description of Work Quantity Cement Bags
Coarse Sand (cum)
Khanda (cum)
G.S.B. 25-40 mm (cum)
Grit 10-20 mm (cum)
1. Sand Laying 2.32 cum - 2.320 - - -
2. C.C.W. 1:4:8 (4.06 + 3.48) 7.54 cum 25.63 3.393 - 7.012 -
3. Stone masonary 1:4 22.21 cum 53.30 7.551 22.21 - -
4. C.C.W. 1:2:4 1.821 cum 11.10 0.764 - - 1.547
5. Raised Pointing 22.04 m2 1.01 0.103 - - -
Total 91.04 14.131 22.21 7.012 1.547
Say 91 bags 14.13 cum 22.20 7.01 1.55
COST OF MATERIALS
S.No. Particulars Quantity Rate Amount
1. Cement 91 Bags 255.00/bag 23205.00
2. Coarse Sand 14.13 cum 910.00/cum 12858.30
3. Khanda 20.20 cum 1025.00/cum 22755.00
4. Granite Stone Ballast 25-40 mm
7.01 cum
855/cum 5993.55
5. Granite Stone Grit 10-20 mm 1.55 cum 1250.00/cum 1937.50
Total Rs. 66,749.00
89
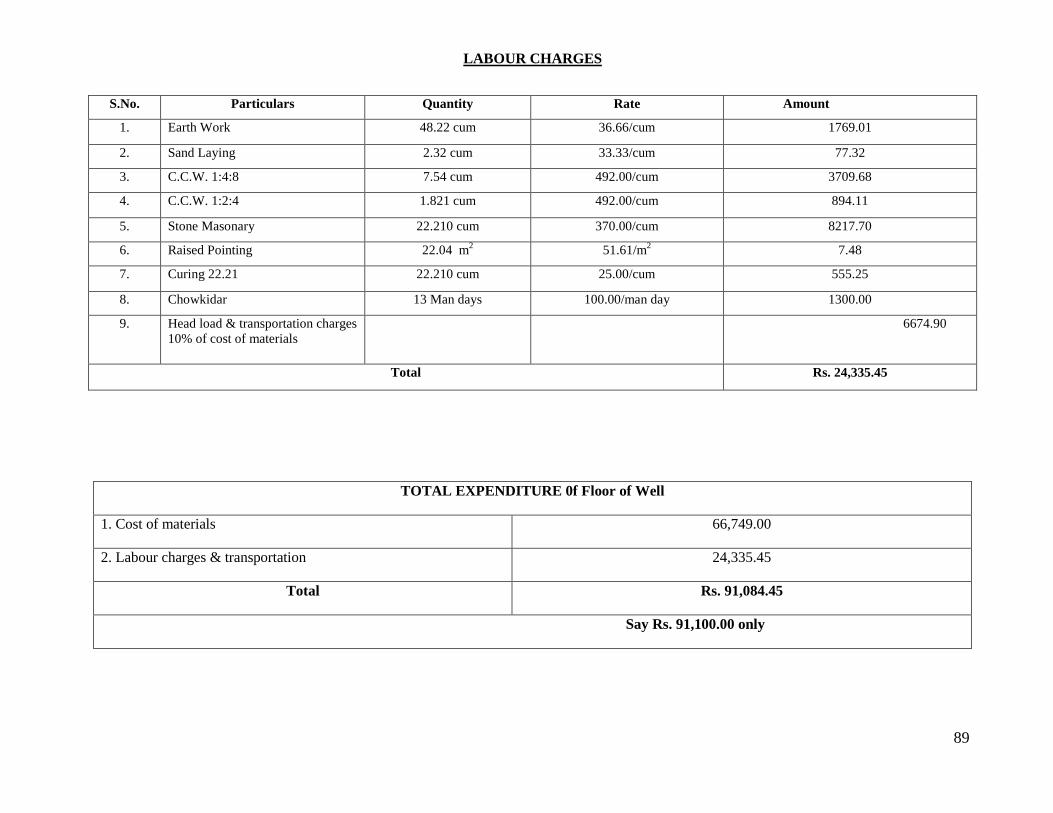
LABOUR CHARGES
S.No. Particulars Quantity Rate Amount
1. Earth Work 48.22 cum 36.66/cum 1769.01
2. Sand Laying 2.32 cum 33.33/cum 77.32
3. C.C.W. 1:4:8 7.54 cum 492.00/cum 3709.68
4. C.C.W. 1:2:4 1.821 cum 492.00/cum 894.11
5. Stone Masonary 22.210 cum 370.00/cum 8217.70
6. Raised Pointing 22.04 m2 51.61/m2 7.48
7. Curing 22.21 22.210 cum 25.00/cum 555.25
8. Chowkidar 13 Man days 100.00/man day 1300.00
9. Head load & transportation charges 10% of cost of materials
6674.90
Total Rs. 24,335.45
TOTAL EXPENDITURE 0f Floor of Well
1. Cost of materials 66,749.00
2. Labour charges & transportation 24,335.45
Total Rs. 91,084.45
Say Rs. 91,100.00 only
90
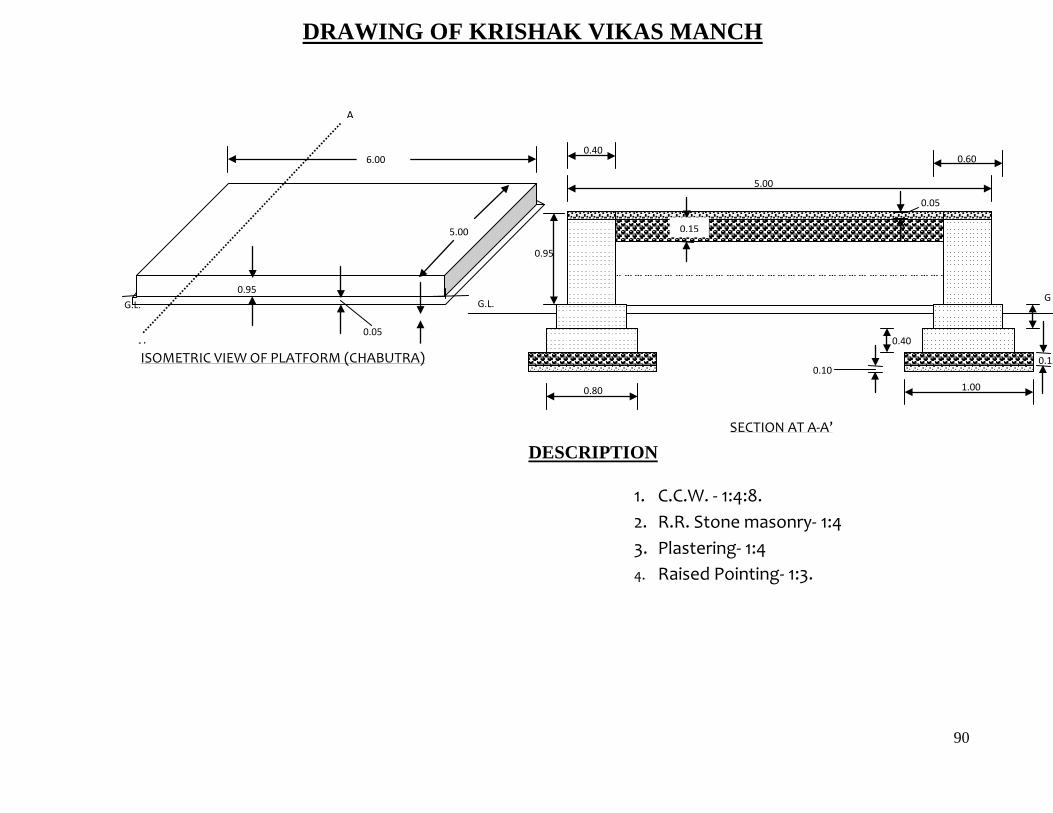
DRAWING OF KRISHAK VIKAS MANCH
DRAWING OF PLATFOR
DESCRIPTION
0.95
0.05
5.00
6.00
A
A’
G.L. G
5.00
0.40 0.60
0.80 1.00
0.95
0.15 0.10
0.40
0
0.05
0.15
G.L.
SECTION AT A-A’
ISOMETRIC VIEW OF PLATFORM (CHABUTRA)
0.15
1. C.C.W. - 1:4:8. 2. R.R. Stone masonry- 1:4 3. Plastering- 1:4 4. Raised Pointing- 1:3.

91
DETAIL ESTIMATE OF KRISHAK VIKAS MANCH S.No. Description of Work No. L. B. D/H Quantity
1. Earth work in foundation Long Wall Short Wall
2 2
8.00 4.00
1.20 1.20
1.10 1.10
21.12 10.56
Total 31.68 cum
2. Laying of Sand Long Wall Short Wall
2 2
6.60 3.60
1.00 1.00
0.10 0.10
1.32 0.72
Total 2.04 cum
3. C.C.W. 1:4:8 Long Wall Short Wall
2 2
6.60 3.60
1.00 1.00
0.15 0.15
1.98 1.08
Total 3.06 cum
4. Stone masonary work 1:4 in foundation & super structure
1st Footing.
Long Wall
Short Wall
2nd Footing
Long Wall
Short Wall Super Structure
Long Wall
Short Wall
2
2
2
2
2
2
6.40
3.80
6.20
4.00
6.00
4.20
0.80
0.80
0.60
0.60
0.40
0.40
0.40
0.40
0.40
0.40
0.90
0.90
4.096
2.432
2.976
1.920
4.320
3.024
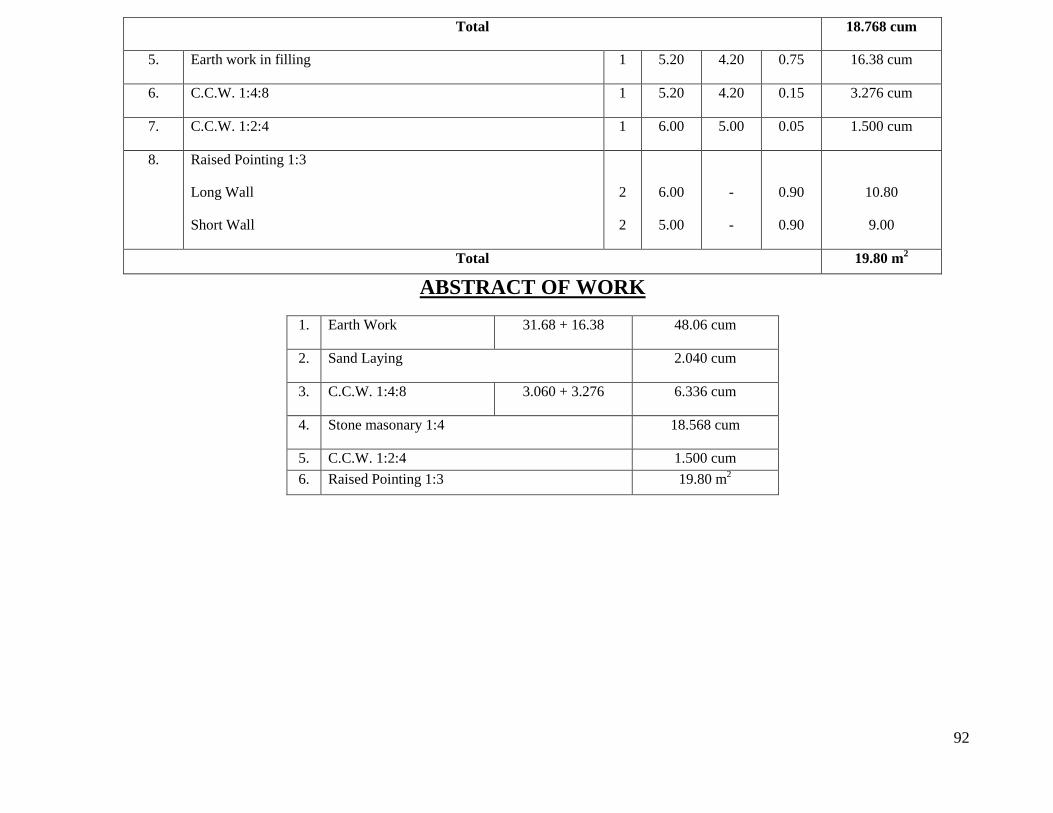
92
Total 18.768 cum
5. Earth work in filling 1 5.20 4.20 0.75 16.38 cum
6. C.C.W. 1:4:8 1 5.20 4.20 0.15 3.276 cum
7. C.C.W. 1:2:4 1 6.00 5.00 0.05 1.500 cum
8. Raised Pointing 1:3
Long Wall
Short Wall
2
2
6.00
5.00
-
-
0.90
0.90
10.80
9.00
Total 19.80 m2
ABSTRACT OF WORK
1. Earth Work 31.68 + 16.38 48.06 cum
2. Sand Laying 2.040 cum
3. C.C.W. 1:4:8 3.060 + 3.276 6.336 cum
4. Stone masonary 1:4 18.568 cum
5. C.C.W. 1:2:4 1.500 cum 6. Raised Pointing 1:3 19.80 m2

93
CONSUMPTION OF MATERIALS
S.No. Particulars Quantity Cement (cum)
Coarse Sand (cum)
Khanda (cum)
G.S.B. 25-40 mm (cum)
Stone Grit 10-20 mm
(cum)
1. Sand Laying 2.040 cum - 2.040 - - -
2. C.C.W 1:4:8 6.336 cum 21.54 2.851 - 5.892 -
3. Stone Masonary 18.768 cum 45.04 6.381 18.768 - -
4. C.C.W. 1:2:4 1.500 cum 9.15 0.630 - - 1.275
5. Raised Pointing 19.800 m2 0.91 0.093 - - -
Total 76.64 11.995 18.768 5.892 1.275
Say 77 Bags 12.000 18.768 5.900 1.280
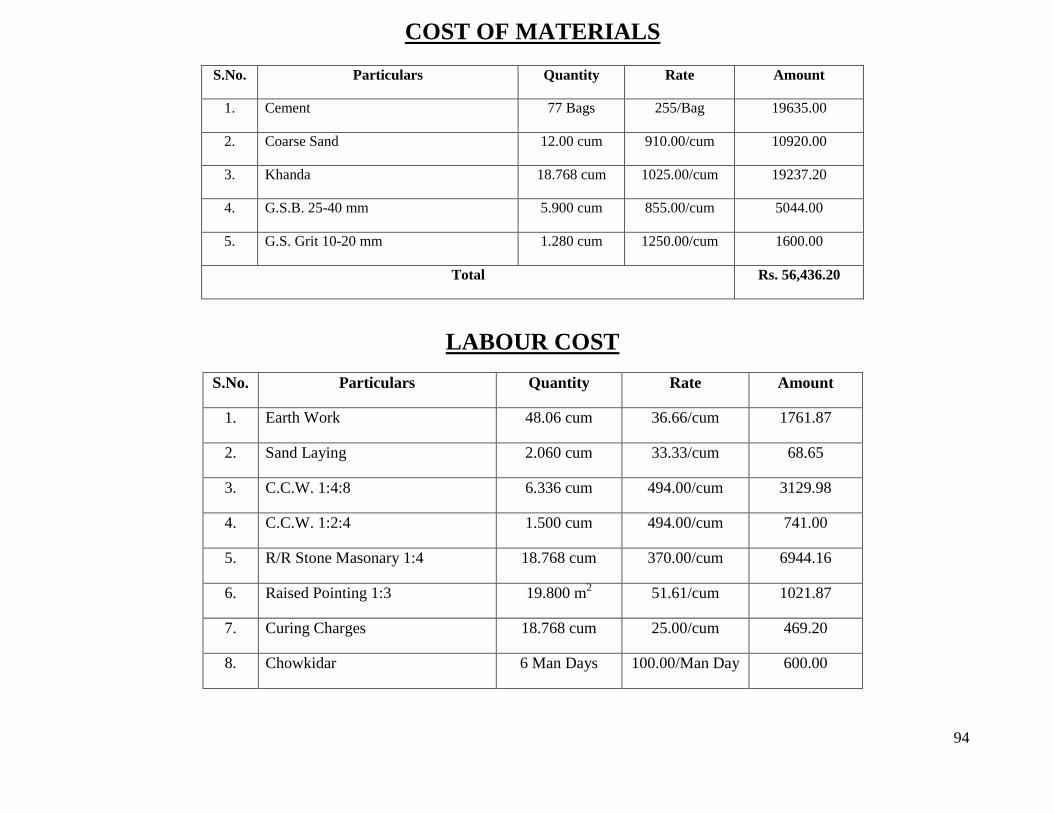
94
COST OF MATERIALS
LABOUR COST
S.No. Particulars Quantity Rate Amount
1. Earth Work 48.06 cum 36.66/cum 1761.87
2. Sand Laying 2.060 cum 33.33/cum 68.65
3. C.C.W. 1:4:8 6.336 cum 494.00/cum 3129.98
4. C.C.W. 1:2:4 1.500 cum 494.00/cum 741.00
5. R/R Stone Masonary 1:4 18.768 cum 370.00/cum 6944.16
6. Raised Pointing 1:3 19.800 m2 51.61/cum 1021.87
7. Curing Charges 18.768 cum 25.00/cum 469.20
8. Chowkidar 6 Man Days 100.00/Man Day 600.00
S.No. Particulars Quantity Rate Amount
1. Cement 77 Bags 255/Bag 19635.00
2. Coarse Sand 12.00 cum 910.00/cum 10920.00
3. Khanda 18.768 cum 1025.00/cum 19237.20
4. G.S.B. 25-40 mm 5.900 cum 855.00/cum 5044.00
5. G.S. Grit 10-20 mm 1.280 cum 1250.00/cum 1600.00
Total Rs. 56,436.20
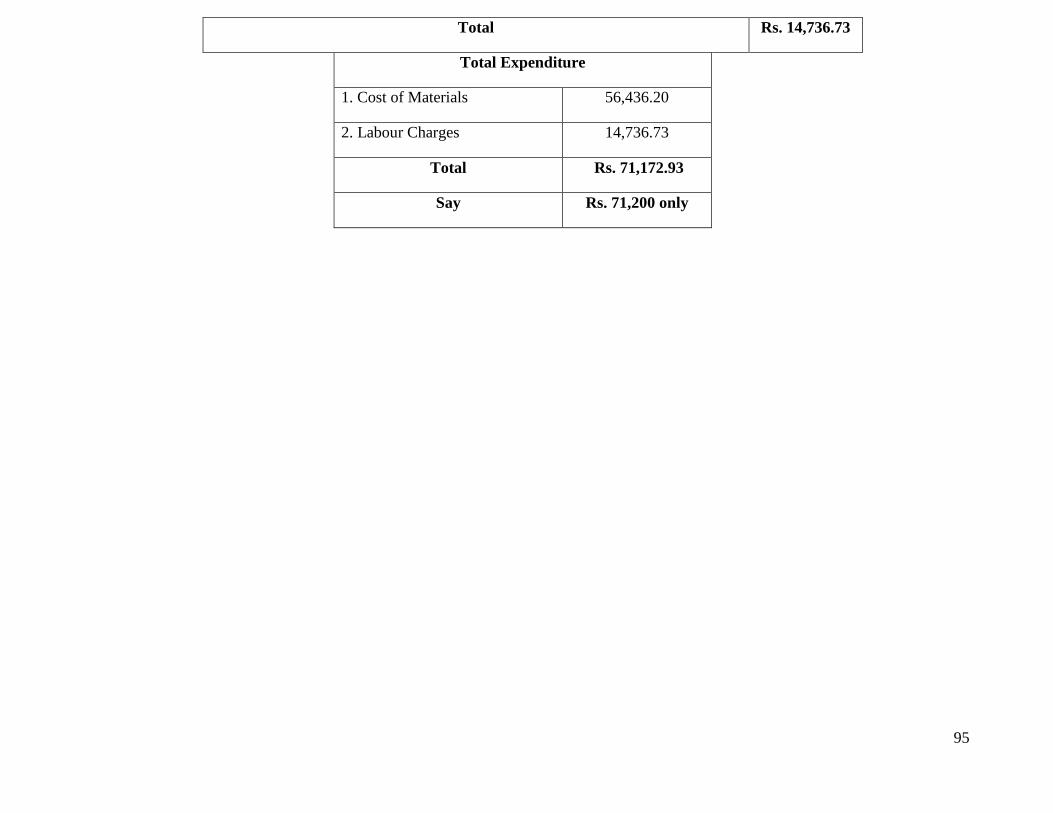
95
Total Rs. 14,736.73
Total Expenditure
1. Cost of Materials 56,436.20
2. Labour Charges 14,736.73
Total Rs. 71,172.93
Say Rs. 71,200 only
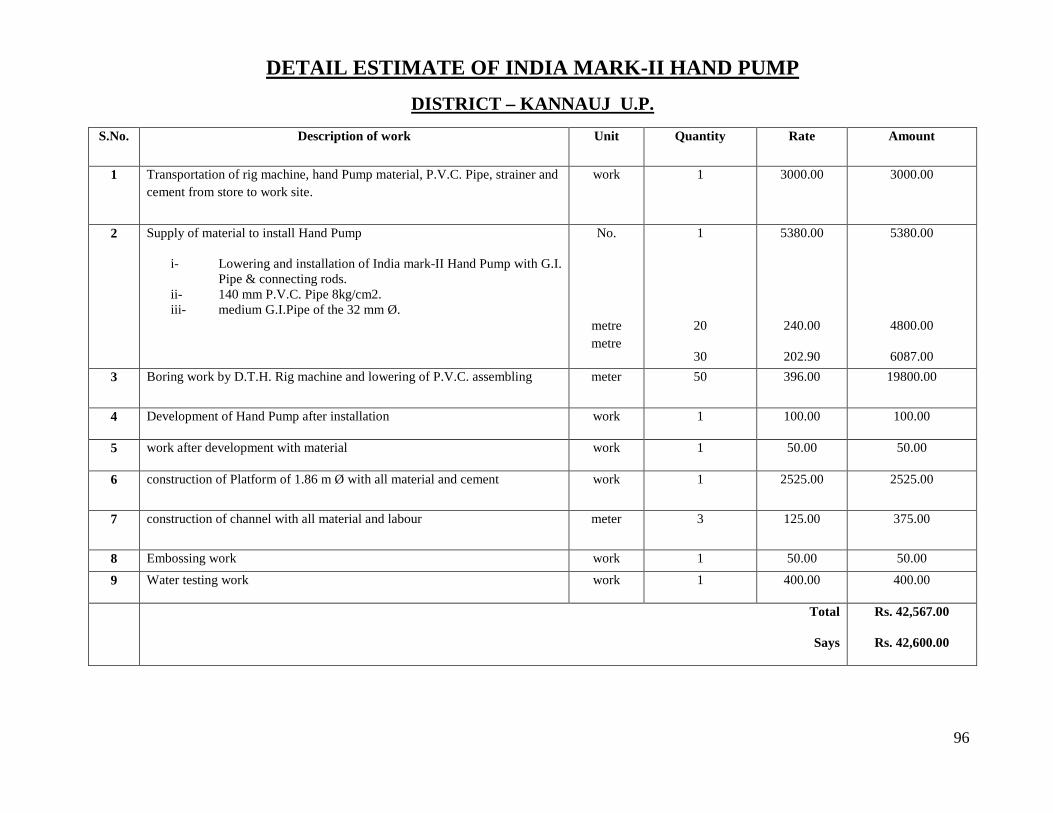
96
DETAIL ESTIMATE OF INDIA MARK-II HAND PUMP
DISTRICT – KANNAUJ U.P. S.No. Description of work Unit Quantity Rate Amount
1 Transportation of rig machine, hand Pump material, P.V.C. Pipe, strainer and cement from store to work site.
work 1 3000.00 3000.00
2 Supply of material to install Hand Pump
i- Lowering and installation of India mark-II Hand Pump with G.I. Pipe & connecting rods.
ii- 140 mm P.V.C. Pipe 8kg/cm2. iii- medium G.I.Pipe of the 32 mm Ø.
No.
metre metre
1
20
30
5380.00
240.00
202.90
5380.00
4800.00
6087.00 3 Boring work by D.T.H. Rig machine and lowering of P.V.C. assembling meter 50 396.00 19800.00
4 Development of Hand Pump after installation work 1 100.00 100.00
5 work after development with material work 1 50.00 50.00
6 construction of Platform of 1.86 m Ø with all material and cement work 1 2525.00 2525.00
7 construction of channel with all material and labour meter 3 125.00 375.00
8 Embossing work work 1 50.00 50.00
9 Water testing work work 1 400.00 400.00
Total
Says
Rs. 42,567.00
Rs. 42,600.00
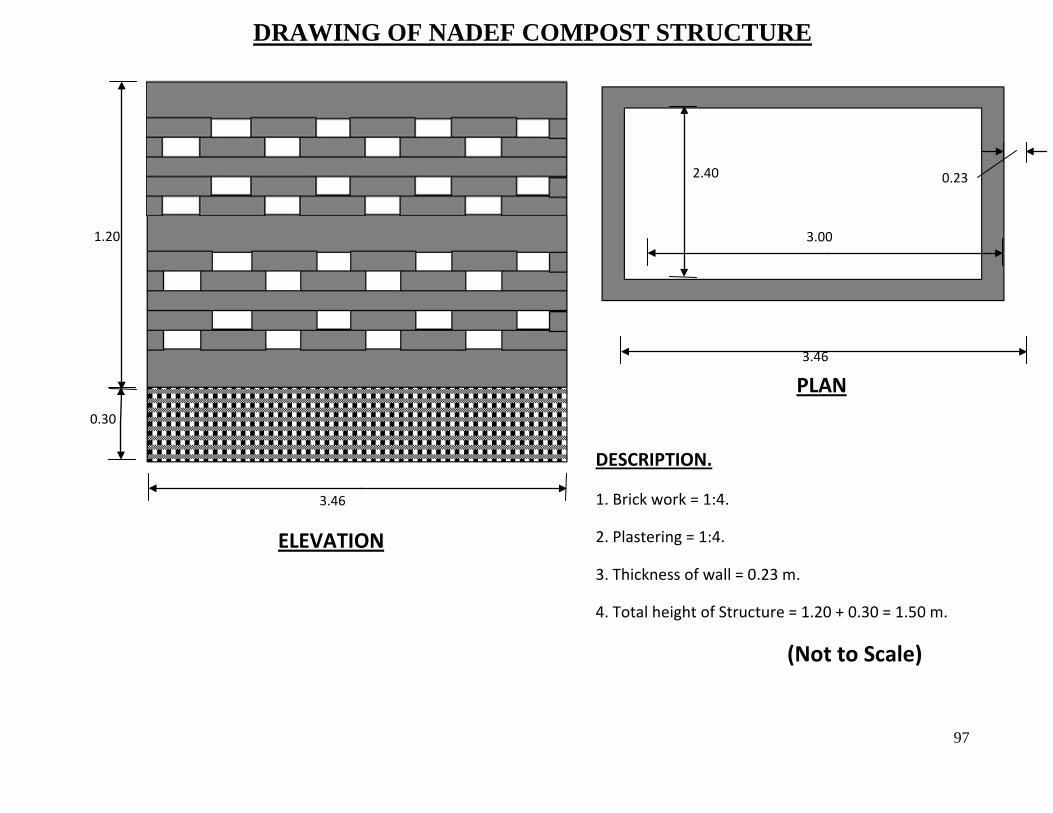
97
DRAWING OF NADEF COMPOST STRUCTURE
3.46
3.46
0.30
1.20
2.40
3.00
0.23
PLAN
ELEVATION
DESCRIPTION.
1. Brick work = 1:4.
2. Plastering = 1:4.
3. Thickness of wall = 0.23 m.
4. Total height of Structure = 1.20 + 0.30 = 1.50 m.
(Not to Scale)

98
ESTIMATE OF COMPOST BY NADEF METHOD
S.No. Description of Work No. L. B. D./H. Quantity 1. Earth Work
Long Wall Short Wall
2 2
3.60 2.33
0.30 0.30
0.30 0.30
0.648 0.419
Total 1.067 cum 2. Brick Work 1:4
Long Wall Solid Short Wall Solid
2 2
3.46 2.40
0.23 0.23
0.90 0.90
1.432 0.993
Total 2.425 cum Long Wall Glazed
Short Wall Glazed 2 2
3.46 2.40
0.23 0.23
0.60 0.60
0.954 0.662
Total 1.616 cum 3. Plastering Work
Long Wall Short Wall Top of Long Wall Top of Short Wall
2 2 2 2
3.46 2.40 3.46 2.40
- -
0.23 0.23
0.60 0.60
- -
4.152 2.880 1.591 1.104
Total 9.727 m2
ABSTRACT OF WORK
S.No. Particulars Quantity 1. Earth Work 1.06 cum 2. Brick Work 1:4 2.425 + 1.616/ 2 3.233 cum 3. Plastering 1:4 9.727 m2

99
CONSUMPTION OF MATERIALS
S.No. Particulars Quantity Cement (Bags)
Coarse Sand (cum)
Bricks (nos.)
1. Brick work 1:4 3.233 cum 5.82 0.873 1487 2. Plastering 1:4 9.727 m2 1.07 0.146 - Total 6.89 1.019 1487 Say 7 Bags 1.02 cum 1500 nos.
COST OF MATERIALS
S.No. Particulars Quantity Rate Amount 1. Cement 7 Bags 255.00/ Bag 1785.00 2. Coarse Sand 1.02 cum 910.00/ cum 928.20 3. 1st class Brick Work 1:4 1500 nos. 4050.00/
Thousand 6075.00
Total Rs. 8,788.20
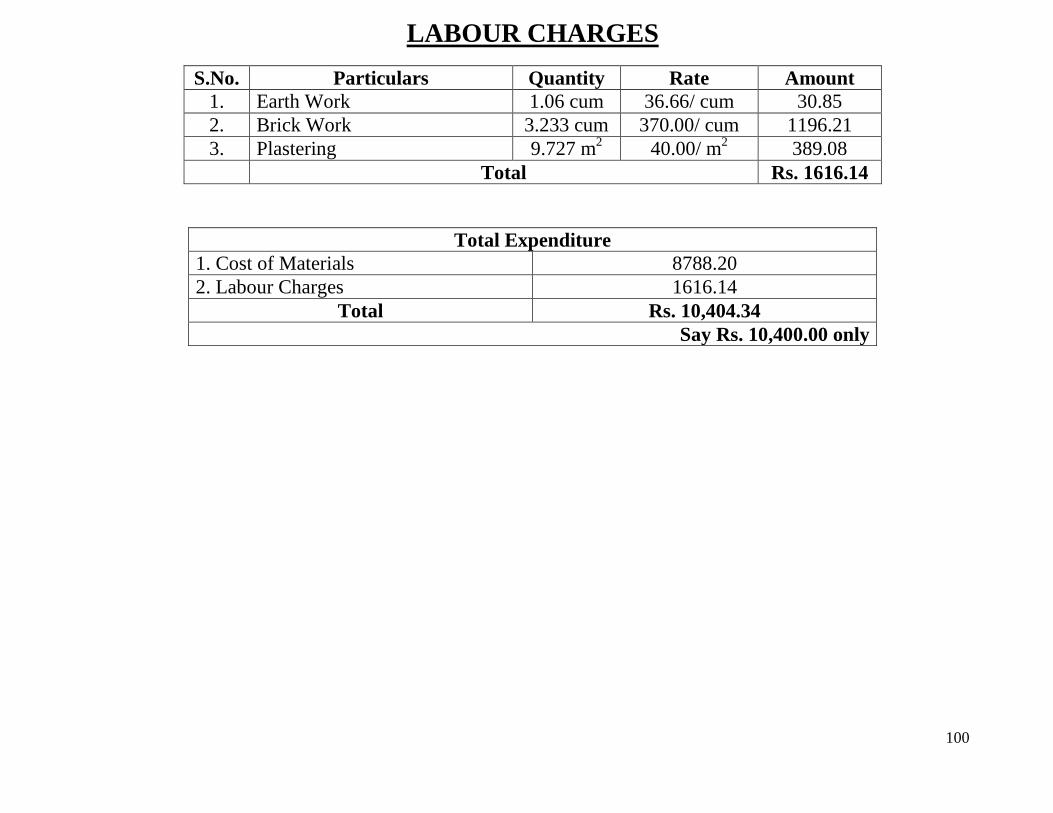
100
LABOUR CHARGES S.No. Particulars Quantity Rate Amount
1. Earth Work 1.06 cum 36.66/ cum 30.85 2. Brick Work 3.233 cum 370.00/ cum 1196.21 3. Plastering 9.727 m2 40.00/ m2 389.08 Total Rs. 1616.14
Total Expenditure 1. Cost of Materials 8788.20 2. Labour Charges 1616.14
Total Rs. 10,404.34 Say Rs. 10,400.00 only
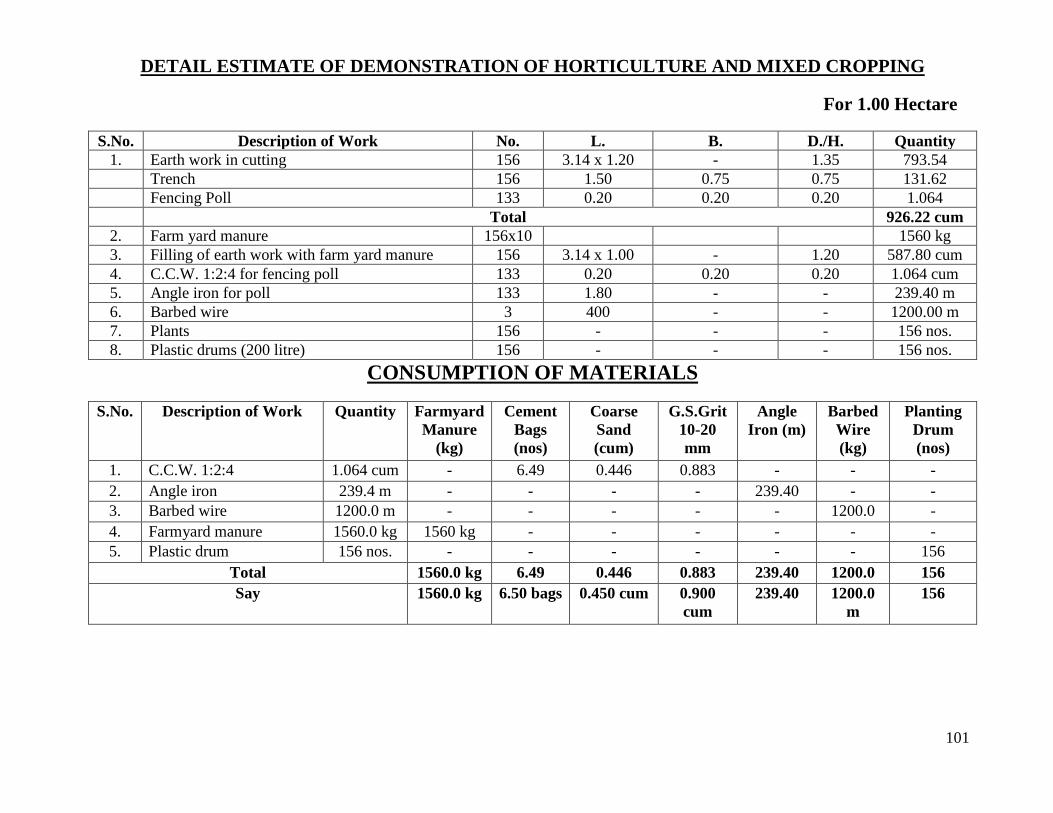
101
DETAIL ESTIMATE OF DEMONSTRATION OF HORTICULTURE AND MIXED CROPPING
For 1.00 Hectare
S.No. Description of Work No. L. B. D./H. Quantity 1. Earth work in cutting 156 3.14 x 1.20 - 1.35 793.54 Trench 156 1.50 0.75 0.75 131.62 Fencing Poll 133 0.20 0.20 0.20 1.064 Total 926.22 cum
2. Farm yard manure 156x10 1560 kg 3. Filling of earth work with farm yard manure 156 3.14 x 1.00 - 1.20 587.80 cum 4. C.C.W. 1:2:4 for fencing poll 133 0.20 0.20 0.20 1.064 cum 5. Angle iron for poll 133 1.80 - - 239.40 m 6. Barbed wire 3 400 - - 1200.00 m 7. Plants 156 - - - 156 nos. 8. Plastic drums (200 litre) 156 - - - 156 nos.
CONSUMPTION OF MATERIALS
S.No. Description of Work Quantity Farmyard Manure
(kg)
Cement Bags (nos)
Coarse Sand (cum)
G.S.Grit 10-20 mm
Angle Iron (m)
Barbed Wire (kg)
Planting Drum (nos)
1. C.C.W. 1:2:4 1.064 cum - 6.49 0.446 0.883 - - - 2. Angle iron 239.4 m - - - - 239.40 - - 3. Barbed wire 1200.0 m - - - - - 1200.0 - 4. Farmyard manure 1560.0 kg 1560 kg - - - - - - 5. Plastic drum 156 nos. - - - - - - 156
Total 1560.0 kg 6.49 0.446 0.883 239.40 1200.0 156 Say 1560.0 kg 6.50 bags 0.450 cum 0.900
cum 239.40 1200.0
m 156
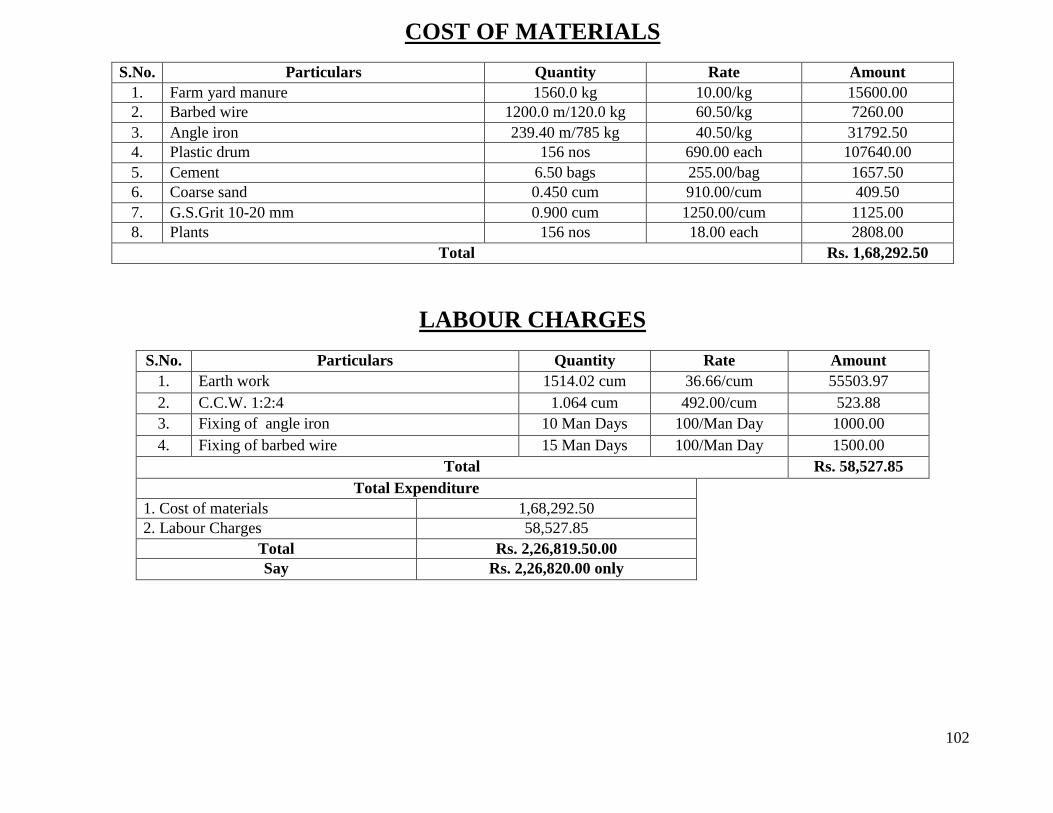
102
COST OF MATERIALS
S.No. Particulars Quantity Rate Amount 1. Farm yard manure 1560.0 kg 10.00/kg 15600.00 2. Barbed wire 1200.0 m/120.0 kg 60.50/kg 7260.00 3. Angle iron 239.40 m/785 kg 40.50/kg 31792.50 4. Plastic drum 156 nos 690.00 each 107640.00 5. Cement 6.50 bags 255.00/bag 1657.50 6. Coarse sand 0.450 cum 910.00/cum 409.50 7. G.S.Grit 10-20 mm 0.900 cum 1250.00/cum 1125.00 8. Plants 156 nos 18.00 each 2808.00
Total Rs. 1,68,292.50
LABOUR CHARGES
S.No. Particulars Quantity Rate Amount 1. Earth work 1514.02 cum 36.66/cum 55503.97 2. C.C.W. 1:2:4 1.064 cum 492.00/cum 523.88 3. Fixing of angle iron 10 Man Days 100/Man Day 1000.00 4. Fixing of barbed wire 15 Man Days 100/Man Day 1500.00
Total Rs. 58,527.85 Total Expenditure
1. Cost of materials 1,68,292.50 2. Labour Charges 58,527.85
Total Rs. 2,26,819.50.00 Say Rs. 2,26,820.00 only
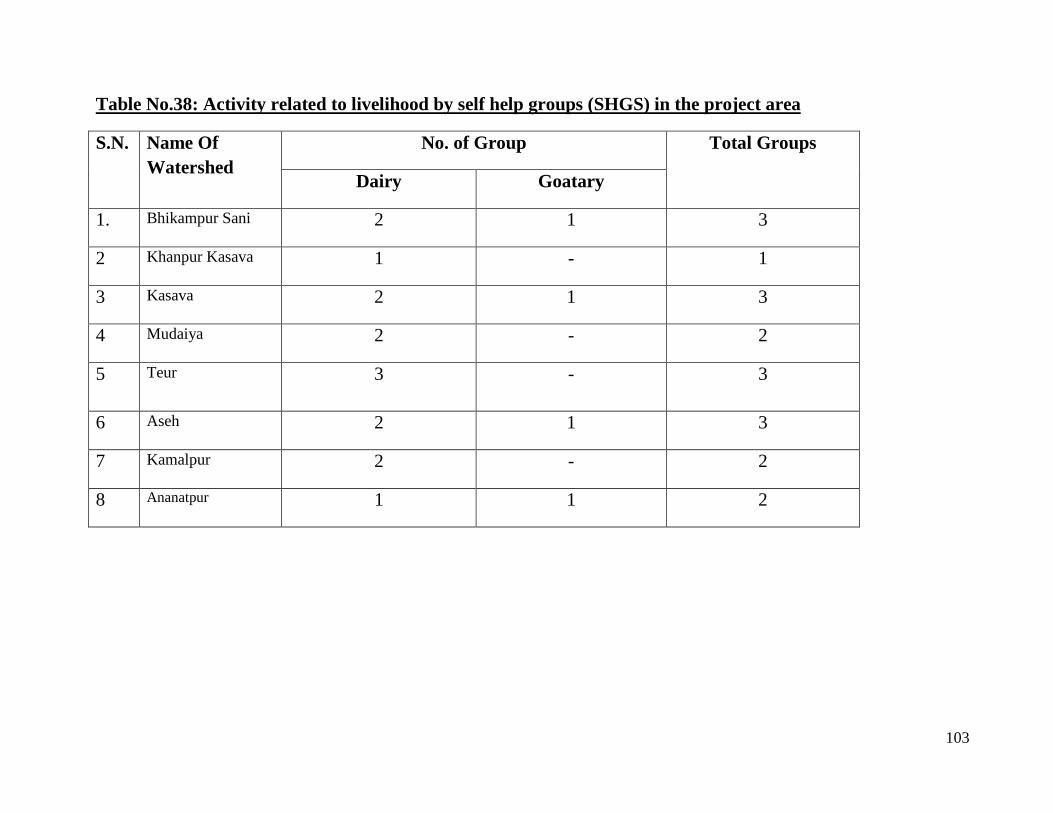
103
Table No.38: Activity related to livelihood by self help groups (SHGS) in the project area
S.N. Name Of Watershed
No. of Group Total Groups
Dairy Goatary
1. Bhikampur Sani 2 1 3
2 Khanpur Kasava 1 - 1
3 Kasava 2 1 3
4 Mudaiya 2 - 2
5 Teur
3 - 3
6 Aseh 2 1 3
7 Kamalpur 2 - 2
8 Ananatpur 1 1 2

104
HORTICULTURE DEVELOPMENT FOR WATERSHED MANAGEMENT
Horticulture is an important component of land use management. Now India is the second largest producer of fruits in the world
after Brazil.However, 53% of the total geographical area of the country is degraded due to various reasons. Fruit trees and fruit based
systems are the viable alternatives for economic utilization of such lands. The basic philosophy behind the conservation horticulture is
the use of available resources and skillful choice of fruits. The use of available soil moisture , collection of the runoff water from the
catchment area to make up the deficit requirements as well as in situ water harvesting techniques are some of the measures . The in situ
water harvesting techniques should be used for growing trees in such a way that each tree has its own micro catchment area. The success
of the conservation of horticulture entirely depends on the selection of economically viable hardy varieties of fruit crops resistant to
moisture stress or drought and other adverse climate conditions. The fruit crops selected for degraded lands must be such that their
maximum growth take place during the period of maximum water availability in the soil and should have low demand.
The main constraints which restrict development of the horticulture land use in degraded lands are enumerated below:
(A) BASIC CONSTRAINTS
1- Lack of suitable agro-techniques for degraded lands
2- Lack of trained resource persons
3- Inadequate dissemination of the technologies
4- Lack of community approach
5- High biotic interference
6- Lack of infrastructure including marketing.
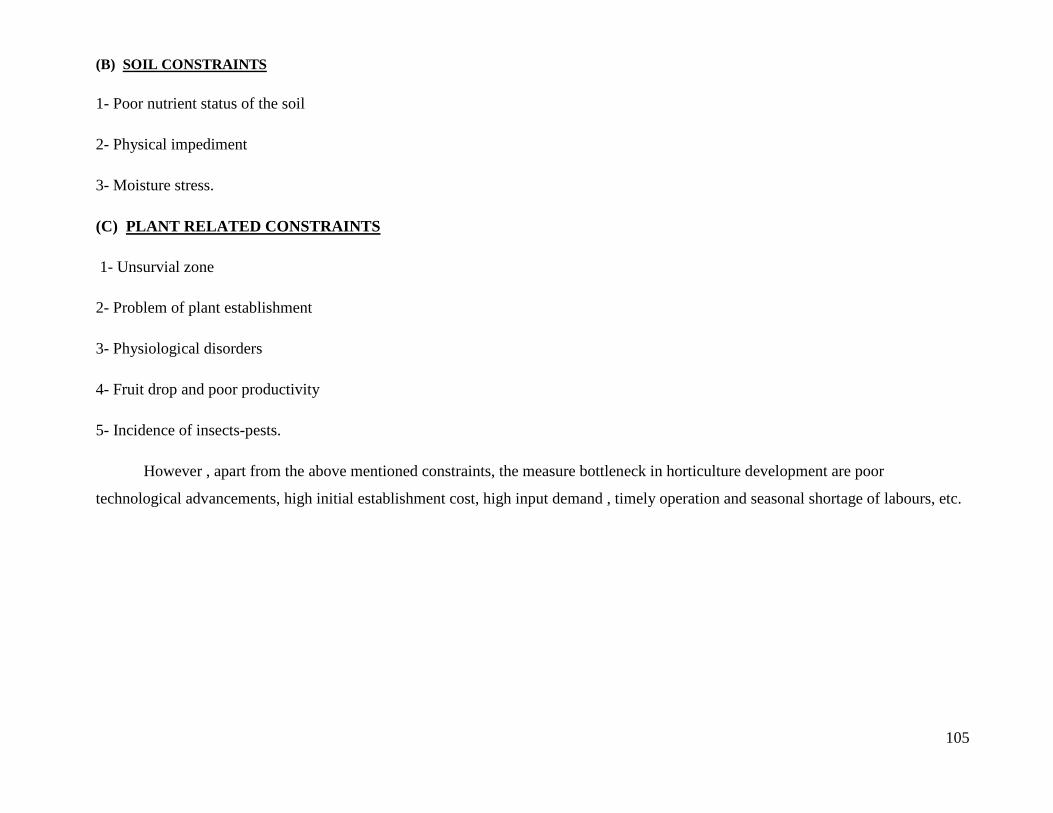
105
(B) SOIL CONSTRAINTS
1- Poor nutrient status of the soil
2- Physical impediment
3- Moisture stress.
(C) PLANT RELATED CONSTRAINTS
1- Unsurvial zone
2- Problem of plant establishment
3- Physiological disorders
4- Fruit drop and poor productivity
5- Incidence of insects-pests.
However , apart from the above mentioned constraints, the measure bottleneck in horticulture development are poor
technological advancements, high initial establishment cost, high input demand , timely operation and seasonal shortage of labours, etc.
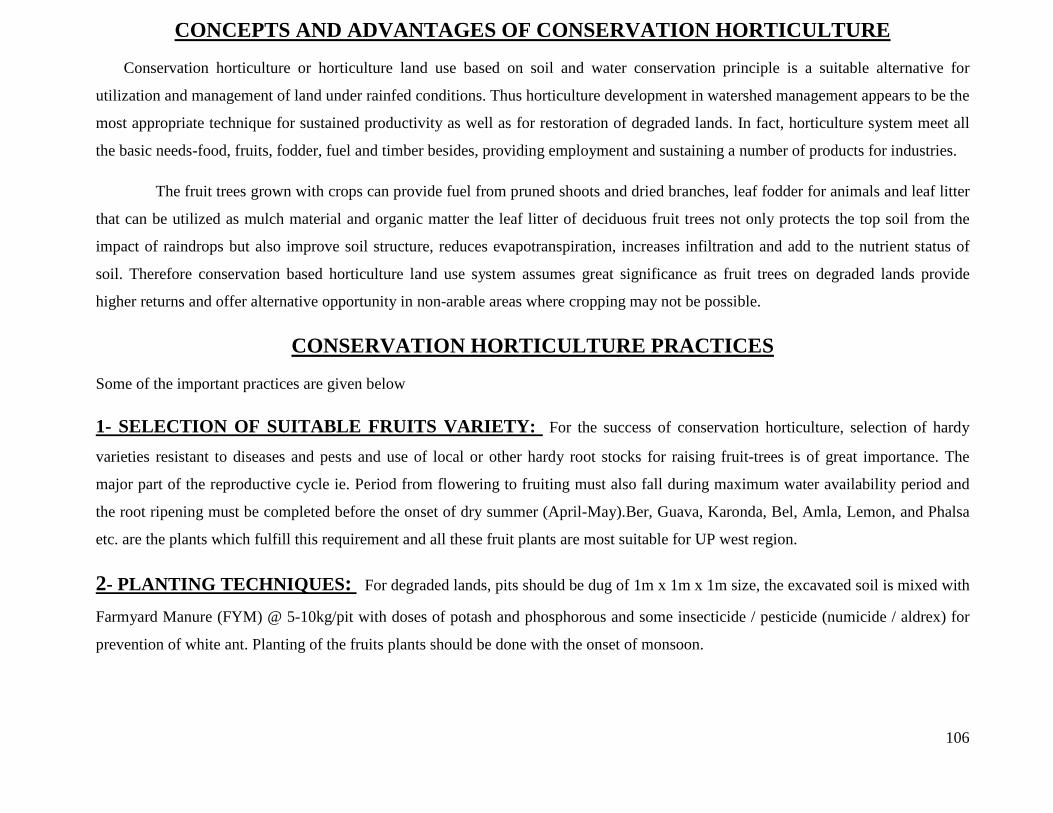
106
CONCEPTS AND ADVANTAGES OF CONSERVATION HORTICULTURE
Conservation horticulture or horticulture land use based on soil and water conservation principle is a suitable alternative for
utilization and management of land under rainfed conditions. Thus horticulture development in watershed management appears to be the
most appropriate technique for sustained productivity as well as for restoration of degraded lands. In fact, horticulture system meet all
the basic needs-food, fruits, fodder, fuel and timber besides, providing employment and sustaining a number of products for industries.
The fruit trees grown with crops can provide fuel from pruned shoots and dried branches, leaf fodder for animals and leaf litter
that can be utilized as mulch material and organic matter the leaf litter of deciduous fruit trees not only protects the top soil from the
impact of raindrops but also improve soil structure, reduces evapotranspiration, increases infiltration and add to the nutrient status of
soil. Therefore conservation based horticulture land use system assumes great significance as fruit trees on degraded lands provide
higher returns and offer alternative opportunity in non-arable areas where cropping may not be possible.
CONSERVATION HORTICULTURE PRACTICES
Some of the important practices are given below
1- SELECTION OF SUITABLE FRUITS VARIETY: For the success of conservation horticulture, selection of hardy
varieties resistant to diseases and pests and use of local or other hardy root stocks for raising fruit-trees is of great importance. The
major part of the reproductive cycle ie. Period from flowering to fruiting must also fall during maximum water availability period and
the root ripening must be completed before the onset of dry summer (April-May).Ber, Guava, Karonda, Bel, Amla, Lemon, and Phalsa
etc. are the plants which fulfill this requirement and all these fruit plants are most suitable for UP west region.
2- PLANTING TECHNIQUES: For degraded lands, pits should be dug of 1m x 1m x 1m size, the excavated soil is mixed with
Farmyard Manure (FYM) @ 5-10kg/pit with doses of potash and phosphorous and some insecticide / pesticide (numicide / aldrex) for
prevention of white ant. Planting of the fruits plants should be done with the onset of monsoon.

107
3-USE OF ROOT STOKES: Budding and grafting on the wild root stock gives benefit of the establishment root and in turn
provides better quality fruits with high field potential. For example, Ziziphun mauritiana, a wild ber can be successful budded with scion
of improved cultivars, This practice is only successful where sizable patch of wild root stock is available. The budded/grafted stock
needs intensive management as it is required to be protected from the wild animals, birds, insects, pests etc. The wild root stock
develops efficient top root to provide moisture and nutrients to the scion. Amla. Bel is other examples of raising the improved
cultivation the wild root stock.
4-IN SITE WATER HARVESTING: Since on slopy lands, runoff water is considerably higher, therefore, it should be
harvested and used. The run off can be utilized for growing fruit plants in such a way that each tree in the established plants is at the
time of fruit setting and fruiting. Moisture available at this critical period improves the fruit yield.
Runoff water will be harvested and stored in tanks during the rains. The stored water will be utilized at the time when
the fruit trees show moisture stress during dry months. Counter trenches will dug between the rows of fruit trees because this is effective
in conserving moisture and providing soil erosion.
5-MULCHING: Mulching is practised to conserve moisture. It prevents the loss of moisture by evaporation and improve water
intake by the soils. Various organic (Straw, hay, manure, tree leaves, dry wads) Mulches are used for mulching. Use of plastic mulch
has been taken in rainfed and dryfarrming conditions to increase the productivity by minimizing evapotranspiration losses.
6-DRIP IRRIGATION: Drip irrigation saves water by 40 to 70 percent and two to three times mare area can be irrigated with
the same amount of available water. It has the advantages that it ensures uniform distribution of water, provides perfect control over
water application and minimizing the losses during convergence and seepage.

108
CHAPTER – 5
BUDGETING
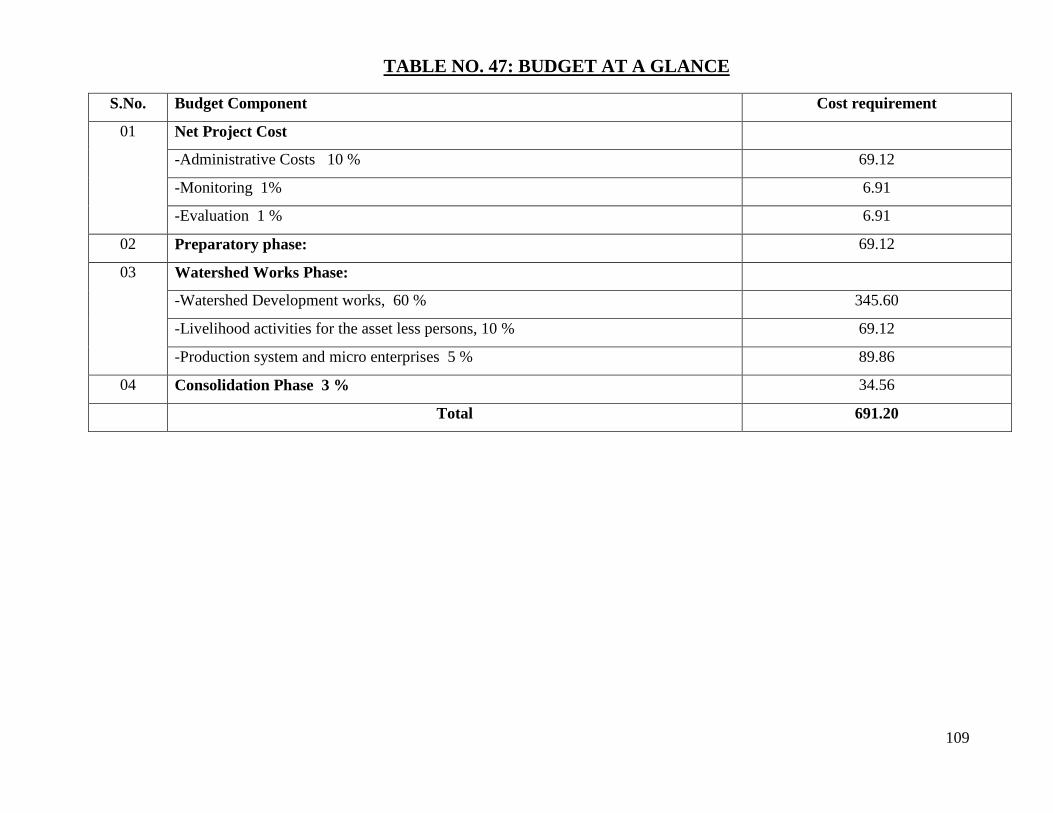
109
TABLE NO. 47: BUDGET AT A GLANCE
S.No. Budget Component Cost requirement
01 Net Project Cost
-Administrative Costs 10 % 69.12
-Monitoring 1% 6.91
-Evaluation 1 % 6.91
02 Preparatory phase: 69.12
03 Watershed Works Phase:
-Watershed Development works, 60 % 345.60
-Livelihood activities for the asset less persons, 10 % 69.12
-Production system and micro enterprises 5 % 89.86
04 Consolidation Phase 3 % 34.56
Total 691.20
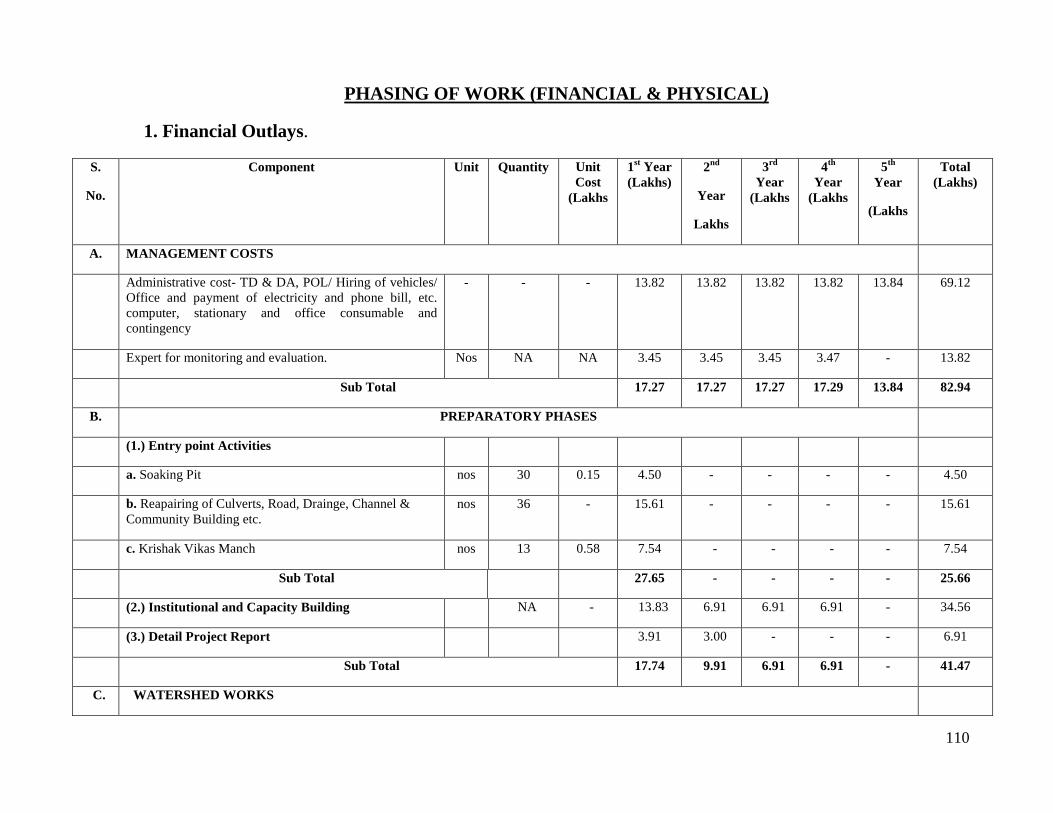
110
PHASING OF WORK (FINANCIAL & PHYSICAL)
1. Financial Outlays.
S.
No.
Component Unit Quantity Unit Cost
(Lakhs
1st Year (Lakhs)
2nd
Year
Lakhs
3rd Year
(Lakhs
4th Year
(Lakhs
5th Year
(Lakhs
Total (Lakhs)
A. MANAGEMENT COSTS
Administrative cost- TD & DA, POL/ Hiring of vehicles/ Office and payment of electricity and phone bill, etc. computer, stationary and office consumable and contingency
- - - 13.82 13.82 13.82 13.82 13.84 69.12
Expert for monitoring and evaluation. Nos NA NA 3.45 3.45 3.45 3.47 - 13.82
Sub Total 17.27 17.27 17.27 17.29 13.84 82.94
B. PREPARATORY PHASES
(1.) Entry point Activities
a. Soaking Pit nos 30 0.15 4.50 - - - - 4.50
b. Reapairing of Culverts, Road, Drainge, Channel & Community Building etc.
nos 36 - 15.61 - - - - 15.61
c. Krishak Vikas Manch nos 13 0.58 7.54 - - - - 7.54
Sub Total 27.65 - - - - 25.66
(2.) Institutional and Capacity Building NA - 13.83 6.91 6.91 6.91 - 34.56
(3.) Detail Project Report 3.91 3.00 - - - 6.91
Sub Total 17.74 9.91 6.91 6.91 - 41.47
C. WATERSHED WORKS
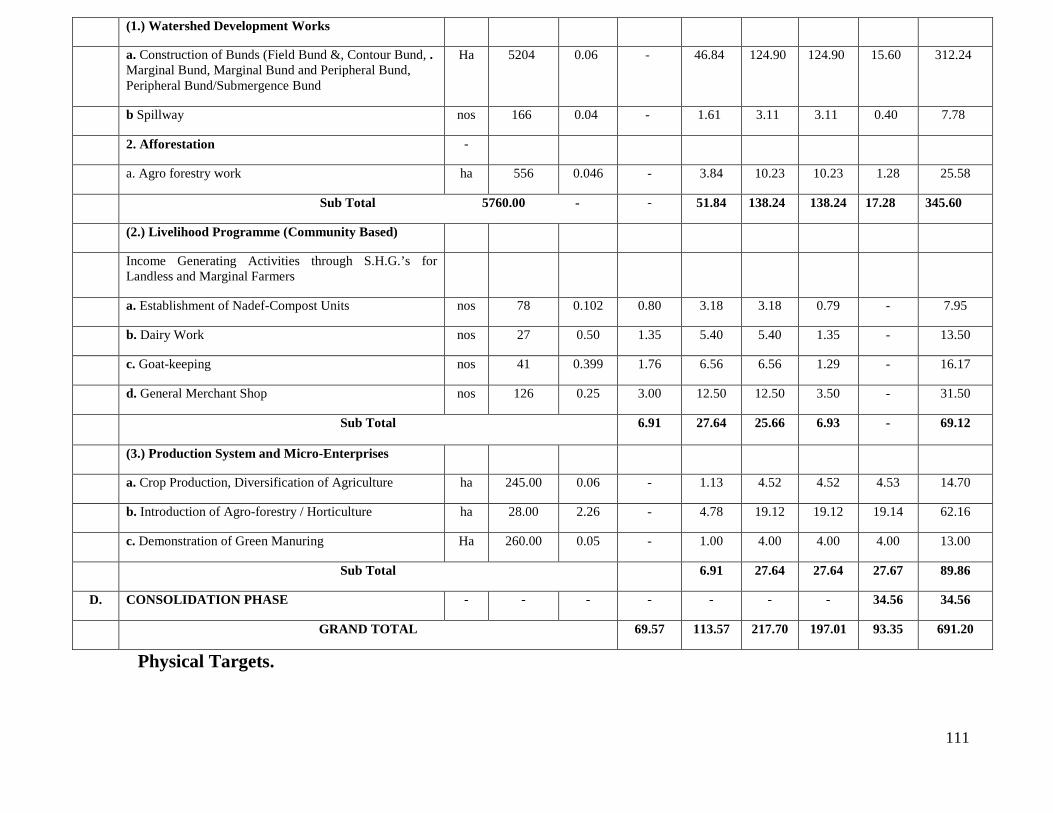
111
(1.) Watershed Development Works
a. Construction of Bunds (Field Bund &, Contour Bund, . Marginal Bund, Marginal Bund and Peripheral Bund, Peripheral Bund/Submergence Bund
Ha 5204 0.06 - 46.84 124.90 124.90 15.60 312.24
b Spillway nos 166 0.04 - 1.61 3.11 3.11 0.40 7.78
2. Afforestation -
a. Agro forestry work ha 556 0.046 - 3.84 10.23 10.23 1.28 25.58
Sub Total 5760.00 - - 51.84 138.24 138.24 17.28 345.60
(2.) Livelihood Programme (Community Based)
Income Generating Activities through S.H.G.’s for Landless and Marginal Farmers
a. Establishment of Nadef-Compost Units nos 78 0.102 0.80 3.18 3.18 0.79 - 7.95
b. Dairy Work nos 27 0.50 1.35 5.40 5.40 1.35 - 13.50
c. Goat-keeping nos 41 0.399 1.76 6.56 6.56 1.29 - 16.17
d. General Merchant Shop nos 126 0.25 3.00 12.50 12.50 3.50 - 31.50
Sub Total
6.91 27.64 25.66 6.93 - 69.12
(3.) Production System and Micro-Enterprises
a. Crop Production, Diversification of Agriculture ha 245.00 0.06 - 1.13 4.52 4.52 4.53 14.70
b. Introduction of Agro-forestry / Horticulture ha 28.00 2.26 - 4.78 19.12 19.12 19.14 62.16
c. Demonstration of Green Manuring Ha 260.00 0.05 - 1.00 4.00 4.00 4.00 13.00
Sub Total 6.91 27.64 27.64 27.67 89.86
D. CONSOLIDATION PHASE - - - - - - - 34.56 34.56
GRAND TOTAL 69.57 113.57 217.70 197.01 93.35 691.20
Physical Targets.
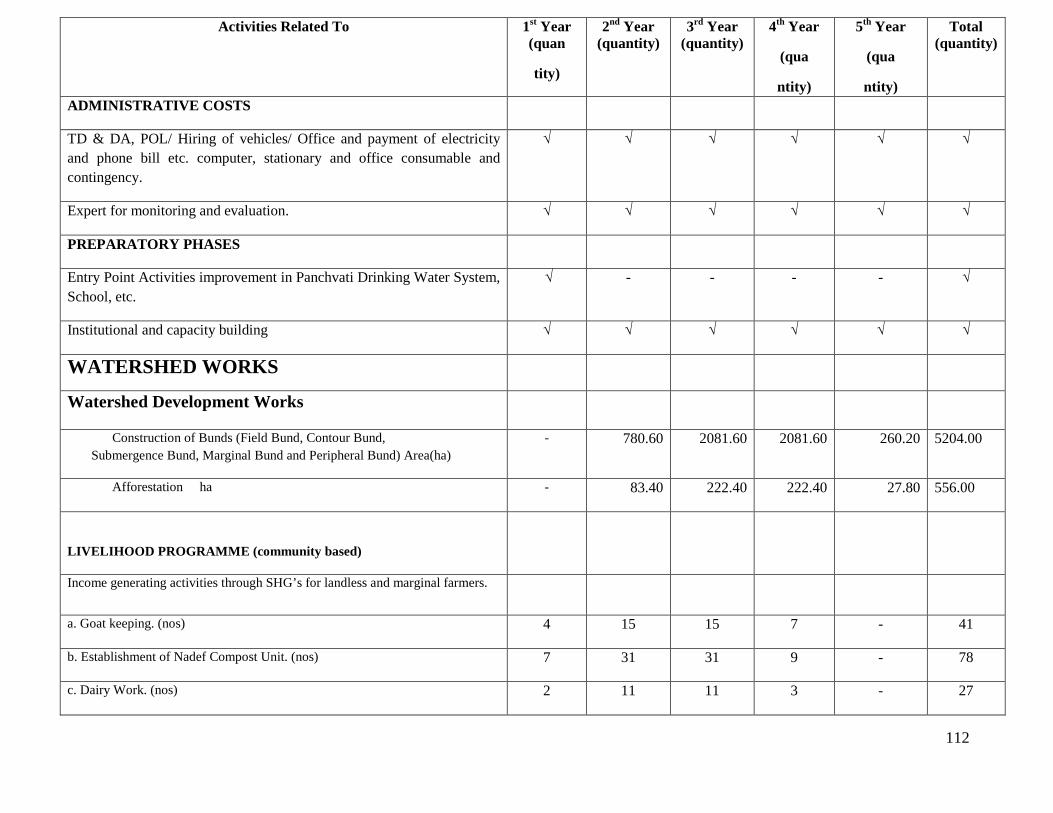
112
Activities Related To 1st Year (quan
tity)
2nd Year (quantity)
3rd Year (quantity)
4th Year
(qua
ntity)
5th Year
(qua
ntity)
Total (quantity)
ADMINISTRATIVE COSTS
TD & DA, POL/ Hiring of vehicles/ Office and payment of electricity and phone bill etc. computer, stationary and office consumable and contingency.
√ √ √ √ √ √
Expert for monitoring and evaluation. √ √ √ √ √ √
PREPARATORY PHASES
Entry Point Activities improvement in Panchvati Drinking Water System, School, etc.
√ - - - - √
Institutional and capacity building √ √ √ √ √ √
WATERSHED WORKS
Watershed Development Works
Construction of Bunds (Field Bund, Contour Bund, Submergence Bund, Marginal Bund and Peripheral Bund) Area(ha)
- 780.60 2081.60 2081.60 260.20 5204.00
Afforestation ha - 83.40 222.40 222.40 27.80 556.00
LIVELIHOOD PROGRAMME (community based)
Income generating activities through SHG’s for landless and marginal farmers.
a. Goat keeping. (nos) 4 15 15 7 - 41
b. Establishment of Nadef Compost Unit. (nos) 7 31 31 9 - 78
c. Dairy Work. (nos) 2 11 11 3 - 27
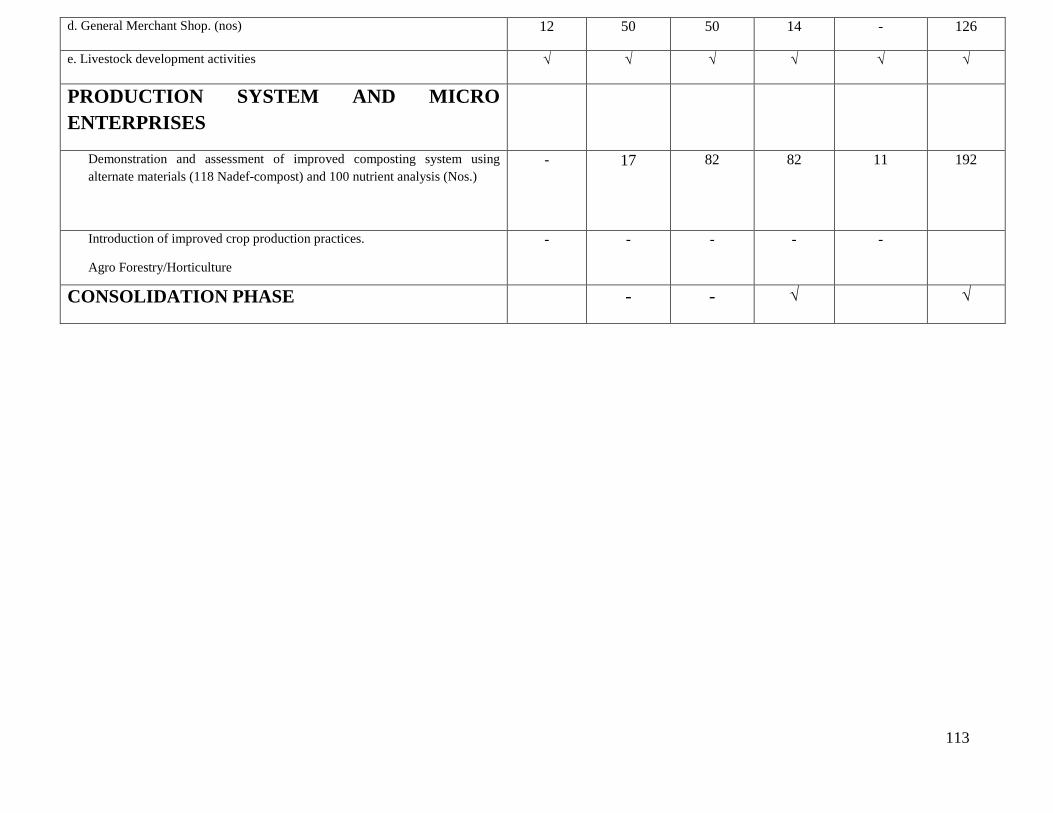
113
d. General Merchant Shop. (nos) 12 50 50 14 - 126
e. Livestock development activities √ √ √ √ √ √
PRODUCTION SYSTEM AND MICRO ENTERPRISES
Demonstration and assessment of improved composting system using alternate materials (118 Nadef-compost) and 100 nutrient analysis (Nos.)
- 17 82 82 11 192
Introduction of improved crop production practices.
Agro Forestry/Horticulture
- - - - -
CONSOLIDATION PHASE - - √ √
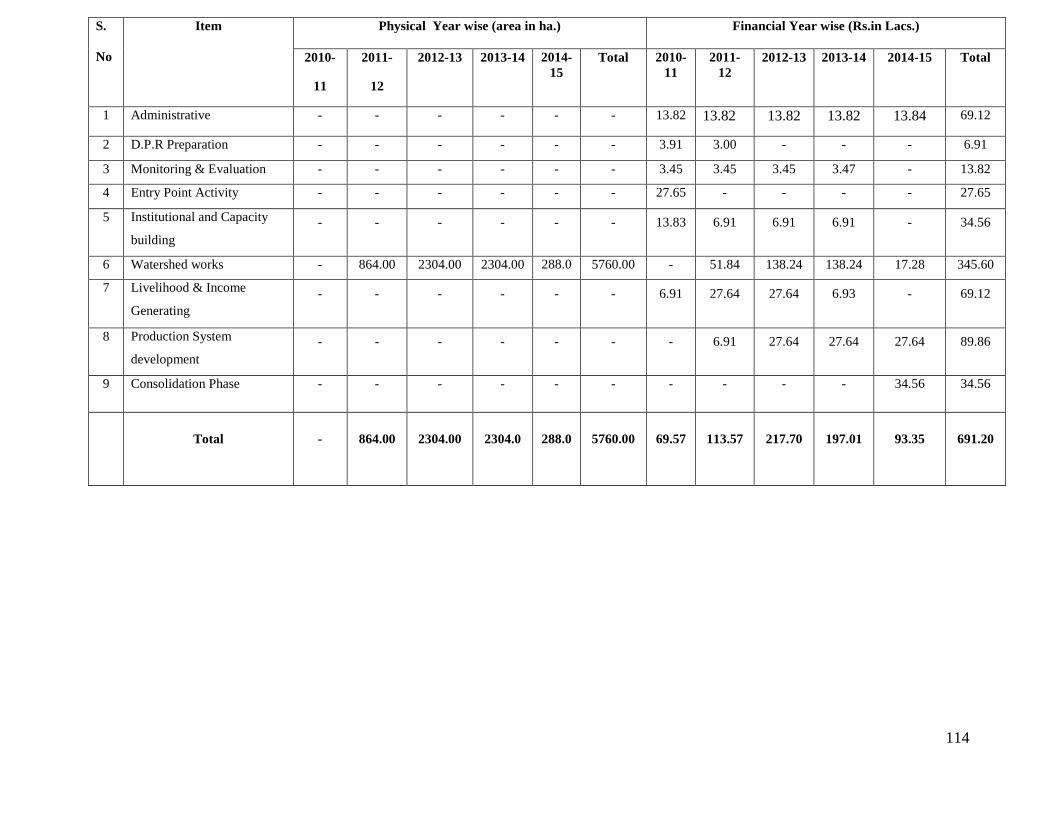
114
S.
No
Item Physical Year wise (area in ha.) Financial Year wise (Rs.in Lacs.)
2010-
11
2011-
12
2012-13 2013-14 2014-15
Total 2010-11
2011-12
2012-13 2013-14 2014-15 Total
1 Administrative - - - - - - 13.82 13.82 13.82 13.82 13.84 69.12
2 D.P.R Preparation - - - - - - 3.91 3.00 - - - 6.91
3 Monitoring & Evaluation - - - - - - 3.45 3.45 3.45 3.47 - 13.82
4 Entry Point Activity - - - - - - 27.65 - - - - 27.65
5 Institutional and Capacity
building - - - - - - 13.83 6.91 6.91 6.91 - 34.56
6 Watershed works - 864.00 2304.00 2304.00 288.0
5760.00 - 51.84 138.24 138.24 17.28 345.60
7 Livelihood & Income
Generating - - - - - - 6.91 27.64 27.64 6.93 - 69.12
8 Production System
development - - - - - - - 6.91 27.64 27.64 27.64 89.86
9 Consolidation Phase - - - - - - - - - - 34.56 34.56
Total - 864.00 2304.00 2304.0 288.0 5760.00 69.57 113.57 217.70 197.01 93.35 691.20
115
CHAPTER – 6
EXPECTED OUTCOMES
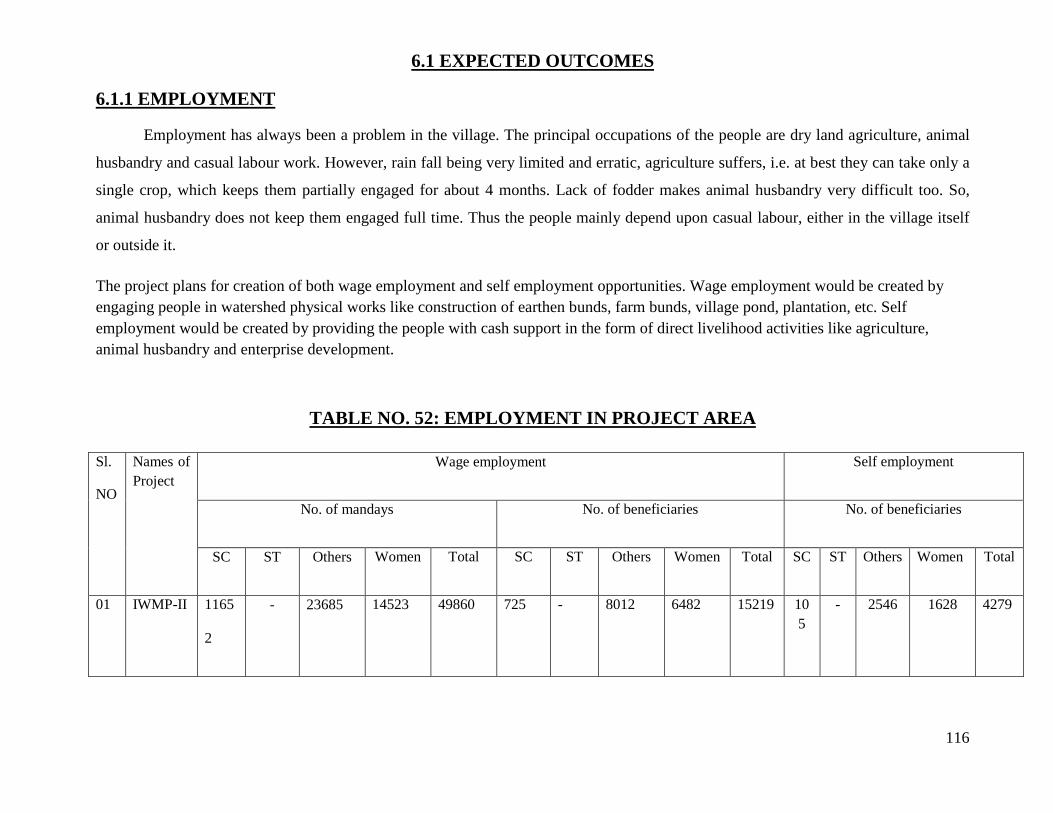
116
6.1 EXPECTED OUTCOMES
6.1.1 EMPLOYMENT
Employment has always been a problem in the village. The principal occupations of the people are dry land agriculture, animal
husbandry and casual labour work. However, rain fall being very limited and erratic, agriculture suffers, i.e. at best they can take only a
single crop, which keeps them partially engaged for about 4 months. Lack of fodder makes animal husbandry very difficult too. So,
animal husbandry does not keep them engaged full time. Thus the people mainly depend upon casual labour, either in the village itself
or outside it.
The project plans for creation of both wage employment and self employment opportunities. Wage employment would be created by engaging people in watershed physical works like construction of earthen bunds, farm bunds, village pond, plantation, etc. Self employment would be created by providing the people with cash support in the form of direct livelihood activities like agriculture, animal husbandry and enterprise development.
TABLE NO. 52: EMPLOYMENT IN PROJECT AREA
Sl.
NO
Names of Project
Wage employment Self employment
No. of mandays No. of beneficiaries No. of beneficiaries
SC ST Others Women Total SC ST Others Women Total SC ST Others Women Total
01
IWMP-II 1165
2
- 23685 14523 49860 725 - 8012 6482 15219 105
- 2546 1628 4279
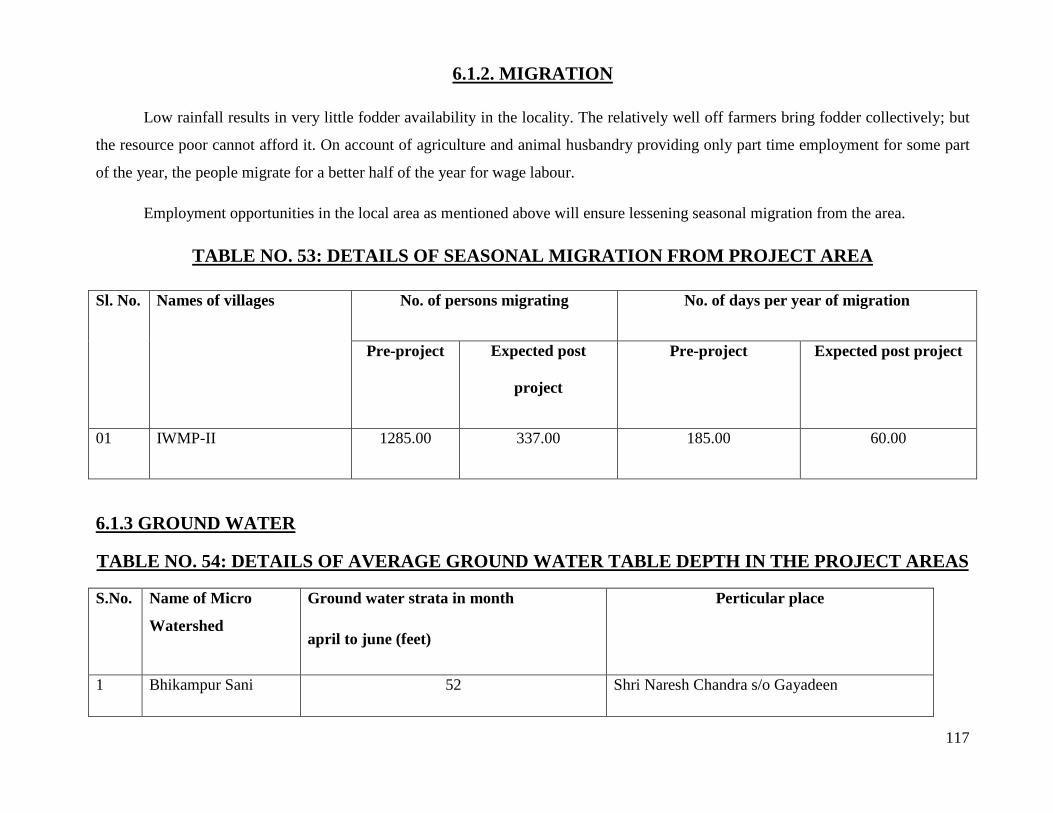
117
6.1.2. MIGRATION
Low rainfall results in very little fodder availability in the locality. The relatively well off farmers bring fodder collectively; but
the resource poor cannot afford it. On account of agriculture and animal husbandry providing only part time employment for some part
of the year, the people migrate for a better half of the year for wage labour.
Employment opportunities in the local area as mentioned above will ensure lessening seasonal migration from the area.
TABLE NO. 53: DETAILS OF SEASONAL MIGRATION FROM PROJECT AREA
Sl. No. Names of villages No. of persons migrating No. of days per year of migration
Pre-project Expected post
project
Pre-project Expected post project
01 IWMP-II 1285.00 337.00 185.00 60.00
6.1.3 GROUND WATER
TABLE NO. 54: DETAILS OF AVERAGE GROUND WATER TABLE DEPTH IN THE PROJECT AREAS
S.No. Name of Micro
Watershed
Ground water strata in month
april to june (feet)
Perticular place
1 Bhikampur Sani 52 Shri Naresh Chandra s/o Gayadeen
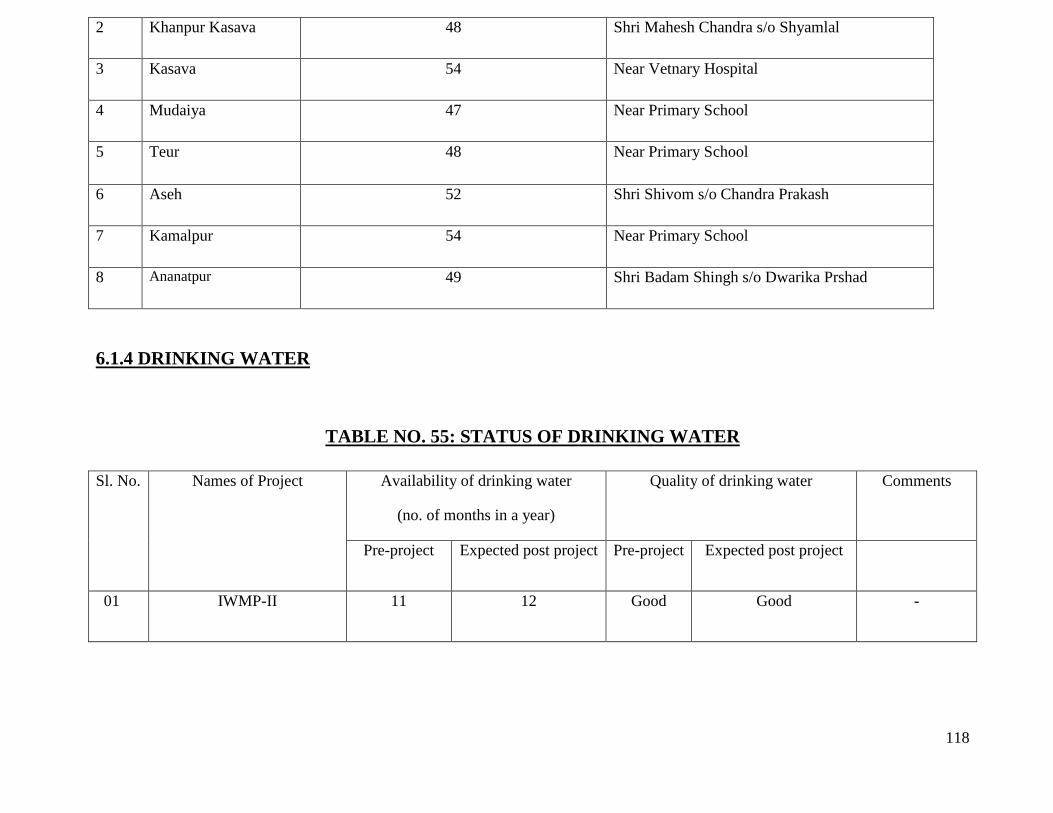
118
2 Khanpur Kasava 48 Shri Mahesh Chandra s/o Shyamlal
3 Kasava 54 Near Vetnary Hospital
4 Mudaiya 47 Near Primary School
5 Teur
48 Near Primary School
6 Aseh 52 Shri Shivom s/o Chandra Prakash
7 Kamalpur 54 Near Primary School
8 Ananatpur 49 Shri Badam Shingh s/o Dwarika Prshad
6.1.4 DRINKING WATER
TABLE NO. 55: STATUS OF DRINKING WATER
Sl. No. Names of Project Availability of drinking water
(no. of months in a year)
Quality of drinking water Comments
Pre-project Expected post project Pre-project Expected post project
01 IWMP-II 11 12 Good Good -
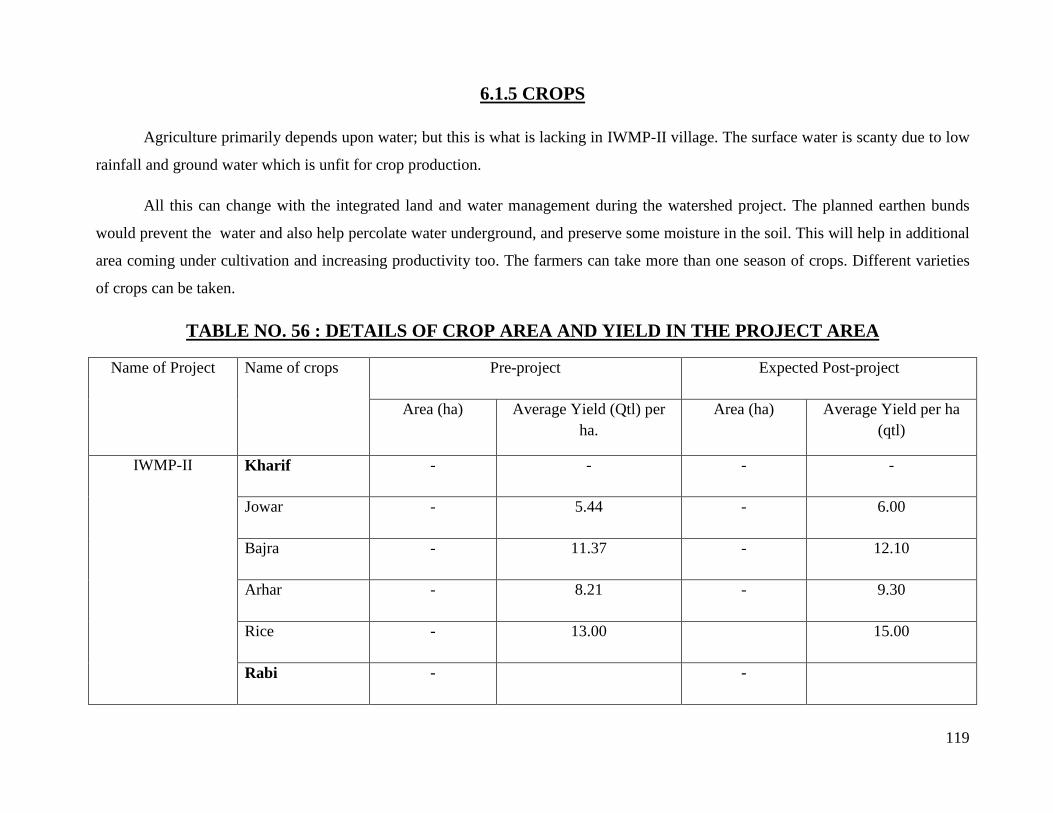
119
6.1.5 CROPS
Agriculture primarily depends upon water; but this is what is lacking in IWMP-II village. The surface water is scanty due to low
rainfall and ground water which is unfit for crop production.
All this can change with the integrated land and water management during the watershed project. The planned earthen bunds
would prevent the water and also help percolate water underground, and preserve some moisture in the soil. This will help in additional
area coming under cultivation and increasing productivity too. The farmers can take more than one season of crops. Different varieties
of crops can be taken.
TABLE NO. 56 : DETAILS OF CROP AREA AND YIELD IN THE PROJECT AREA
Name of Project Name of crops Pre-project Expected Post-project
Area (ha) Average Yield (Qtl) per ha.
Area (ha) Average Yield per ha (qtl)
IWMP-II Kharif - - - -
Jowar - 5.44 - 6.00
Bajra - 11.37 - 12.10
Arhar - 8.21 - 9.30
Rice - 13.00 15.00
Rabi - -
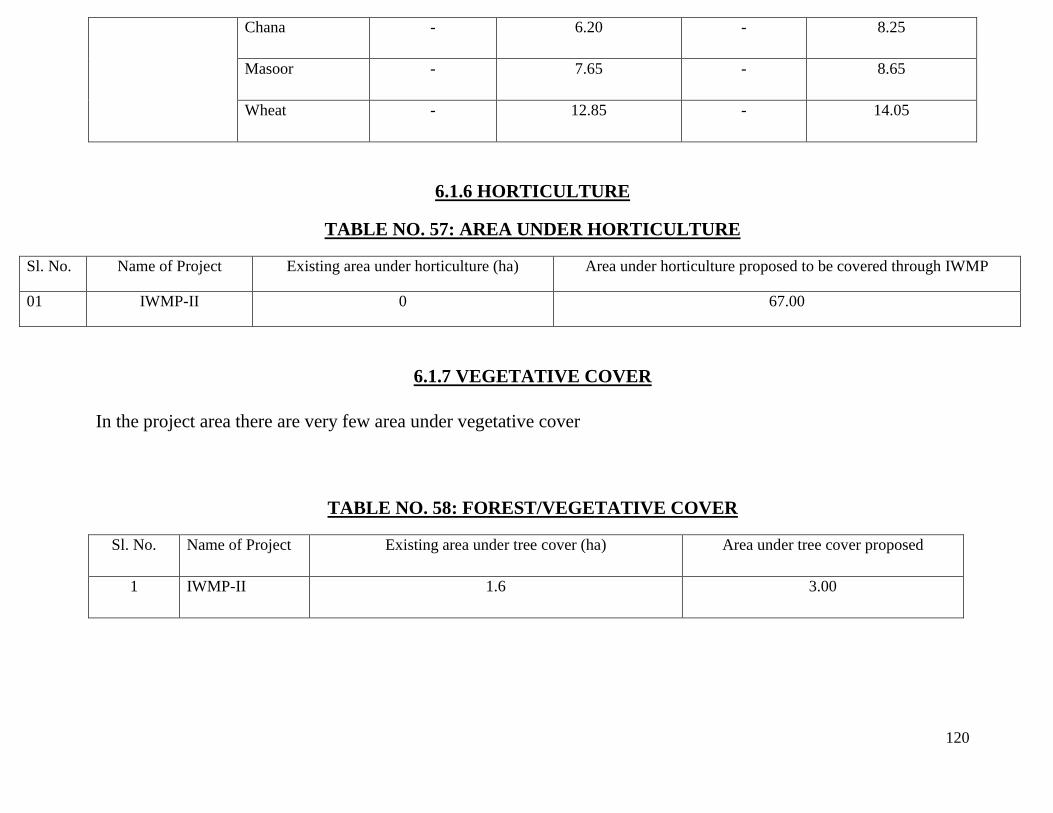
120
Chana - 6.20 - 8.25
Masoor - 7.65 - 8.65
Wheat - 12.85 - 14.05
6.1.6 HORTICULTURE
TABLE NO. 57: AREA UNDER HORTICULTURE
Sl. No. Name of Project Existing area under horticulture (ha) Area under horticulture proposed to be covered through IWMP
01 IWMP-II 0 67.00
6.1.7 VEGETATIVE COVER
In the project area there are very few area under vegetative cover
TABLE NO. 58: FOREST/VEGETATIVE COVER
Sl. No. Name of Project Existing area under tree cover (ha) Area under tree cover proposed
1 IWMP-II 1.6 3.00
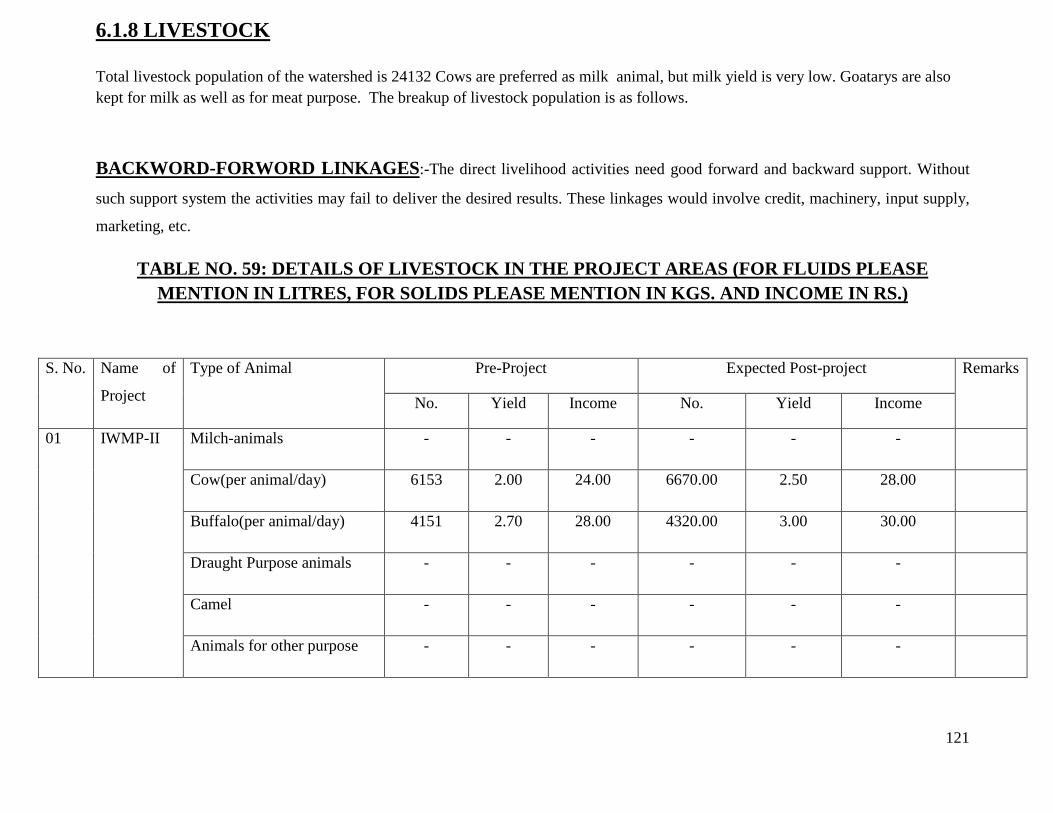
121
6.1.8 LIVESTOCK
Total livestock population of the watershed is 24132 Cows are preferred as milk animal, but milk yield is very low. Goatarys are also kept for milk as well as for meat purpose. The breakup of livestock population is as follows.
BACKWORD-FORWORD LINKAGES:-The direct livelihood activities need good forward and backward support. Without
such support system the activities may fail to deliver the desired results. These linkages would involve credit, machinery, input supply,
marketing, etc.
TABLE NO. 59: DETAILS OF LIVESTOCK IN THE PROJECT AREAS (FOR FLUIDS PLEASE MENTION IN LITRES, FOR SOLIDS PLEASE MENTION IN KGS. AND INCOME IN RS.)
S. No. Name of
Project
Type of Animal Pre-Project Expected Post-project Remarks
No. Yield Income No. Yield Income
01 IWMP-II Milch-animals - - - - - -
Cow(per animal/day) 6153 2.00 24.00 6670.00 2.50 28.00
Buffalo(per animal/day) 4151 2.70 28.00 4320.00 3.00 30.00
Draught Purpose animals - - - - - -
Camel - - - - - -
Animals for other purpose - - - - - -
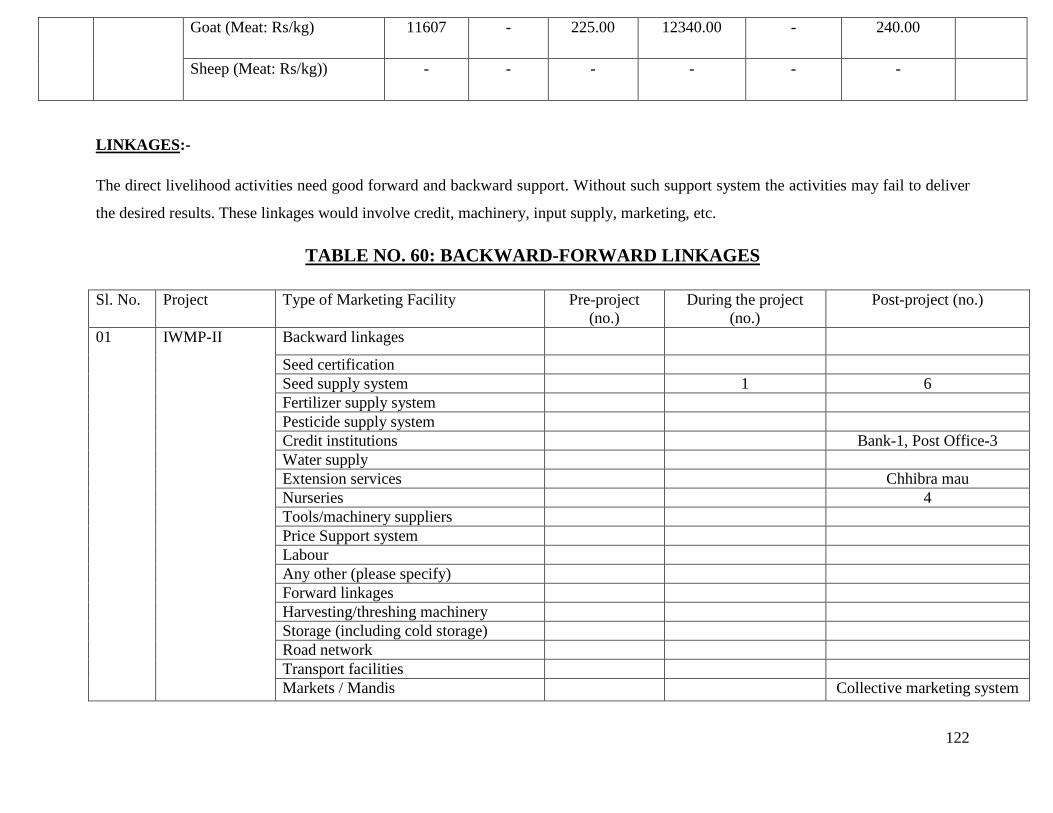
122
Goat (Meat: Rs/kg) 11607 - 225.00 12340.00 - 240.00
Sheep (Meat: Rs/kg)) - - - - - -
LINKAGES:-
The direct livelihood activities need good forward and backward support. Without such support system the activities may fail to deliver
the desired results. These linkages would involve credit, machinery, input supply, marketing, etc.
TABLE NO. 60: BACKWARD-FORWARD LINKAGES
Sl. No. Project Type of Marketing Facility Pre-project (no.)
During the project (no.)
Post-project (no.)
01 IWMP-II Backward linkages
Seed certification Seed supply system 1 6 Fertilizer supply system Pesticide supply system Credit institutions Bank-1, Post Office-3 Water supply Extension services Chhibra mau Nurseries 4 Tools/machinery suppliers Price Support system Labour Any other (please specify) Forward linkages Harvesting/threshing machinery Storage (including cold storage) Road network Transport facilities Markets / Mandis Collective marketing system

123
Agro and other Industries 2 Milk and other collection centres 5 Labour Any other (please specify) 7 6 Animal vitamins (50 lt)
EXPECTED/ESTIMATED OUTCOMES OF IWMP-II,2010-11 KANNAUJ
Sl.No. Item Unit Pre-Project Status Post -Project Status
01 02 03 04 05
01 Status of water table Meters BGL(m) 30.55 27.95
02 Ground water structures repaired rejuvenated
No’s 23 68
03 Quality of drinking water Quality Normal Improved
04 Availability of drinking water No of days 300 365
05 Increase in irrigated area Ha - -
CHANGE IN CROPPING/LAND USE PATTERN
06 Area under agricultural crop Ha
I- Area under sinle crop Ha 3745.00 2885.00

124
II- Area under double crop Ha 1292.00 2263.00
III- Area under multiplele crop Ha - 832.00
IV- Cropping Intensity % 123.08 251.00
07 Increase in area under vegetation(tree cover)
Ha 795.00 1310.00
08 Increase in area under horticulture Ha 0 67.00
09 Area under fuel& Fodder Ha 0 0
10 Increase in milk production Percapita per day/ltr 1.00 To 1.50 2.00 To 3.00
11 No. of SHGs No’s 0 52
12 Increase in livelihood Rs./Capita/Annum Approx 14000 Approx 42000
13 Migration No’s 1470 337
14 SHG federations formed No’s 0 52
15 Credit linkage with banks No’s 1470 1975
16 User Group No’s 0 39
17 No. of WSC Found No’s 0 13
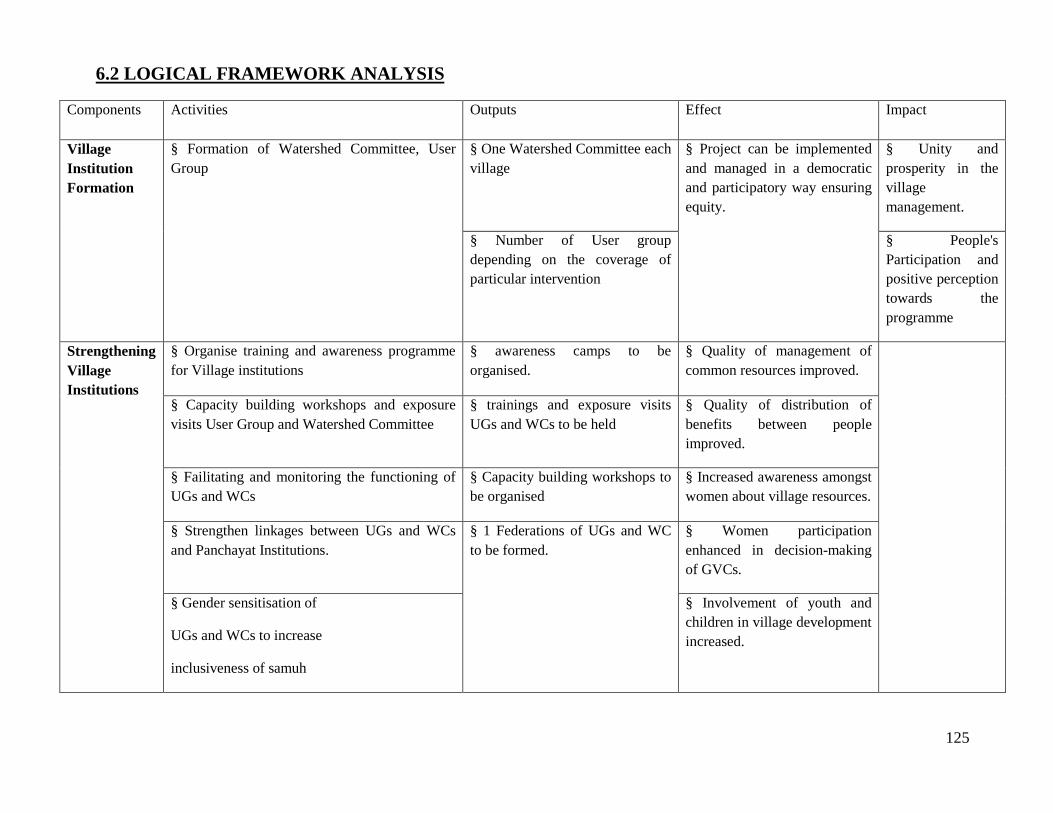
125
6.2 LOGICAL FRAMEWORK ANALYSIS
Components Activities Outputs Effect Impact
Village Institution Formation
§ Formation of Watershed Committee, User Group
§ One Watershed Committee each village
§ Project can be implemented and managed in a democratic and participatory way ensuring equity.
§ Unity and prosperity in the village management.
§ Number of User group depending on the coverage of particular intervention
§ People's Participation and positive perception towards the programme
Strengthening Village Institutions
§ Organise training and awareness programme for Village institutions
§ awareness camps to be organised.
§ Quality of management of common resources improved.
§ Capacity building workshops and exposure visits User Group and Watershed Committee
§ trainings and exposure visits UGs and WCs to be held
§ Quality of distribution of benefits between people improved.
§ Failitating and monitoring the functioning of UGs and WCs
§ Capacity building workshops to be organised
§ Increased awareness amongst women about village resources.
§ Strengthen linkages between UGs and WCs and Panchayat Institutions.
§ 1 Federations of UGs and WC to be formed.
§ Women participation enhanced in decision-making of GVCs.
§ Gender sensitisation of
UGs and WCs to increase
inclusiveness of samuh
§ Involvement of youth and children in village development increased.

126
decision-making.
§ Sensitise village communities to involve children and youth in development.
Fund Management
§ Improve management and utilisation of UGs and WCs.
§ UGs and WCs operating bank account and managing resources on their own
§ Purpose, frequency and volume of use of the fund enhanced.
§ Prepare communities to explore other sources of income for UGs and WCs.
§ Volume of funds generated for UGs and WCs from other sources of income increased.
Ecological Restoration
§ Protection, treatment and regeneration of common and private lands
§ Common and private lands to be brought under new plantations and agro-horti-forestry like Neem, Adusa, prosopis, Banyan and Peepul
§ Fodder availability from common and private lands increased.
§ Better Ecological order in the area
§ Protection, treatment and regeneration of forest lands
§ Forest lands to be brought under new plantations and protection
§ Accessibility to common and forest lands increased with removal of encroachments and resolution of conflicts.
§ Increase in the proportion of households having more security of fodder
§ Plantation of fruits and forest species § Trainings, exposure visits and meetings to be organised for communities, village volunteers and staff
§ Reduction in drudgery of fodder and fuel collection, especially women
§ Impart trainings, conduct meetings and organise exposure visits for communities, village volunteers and staff to effectively plan, execute and monitor activities
§ Income generation intervention promoted
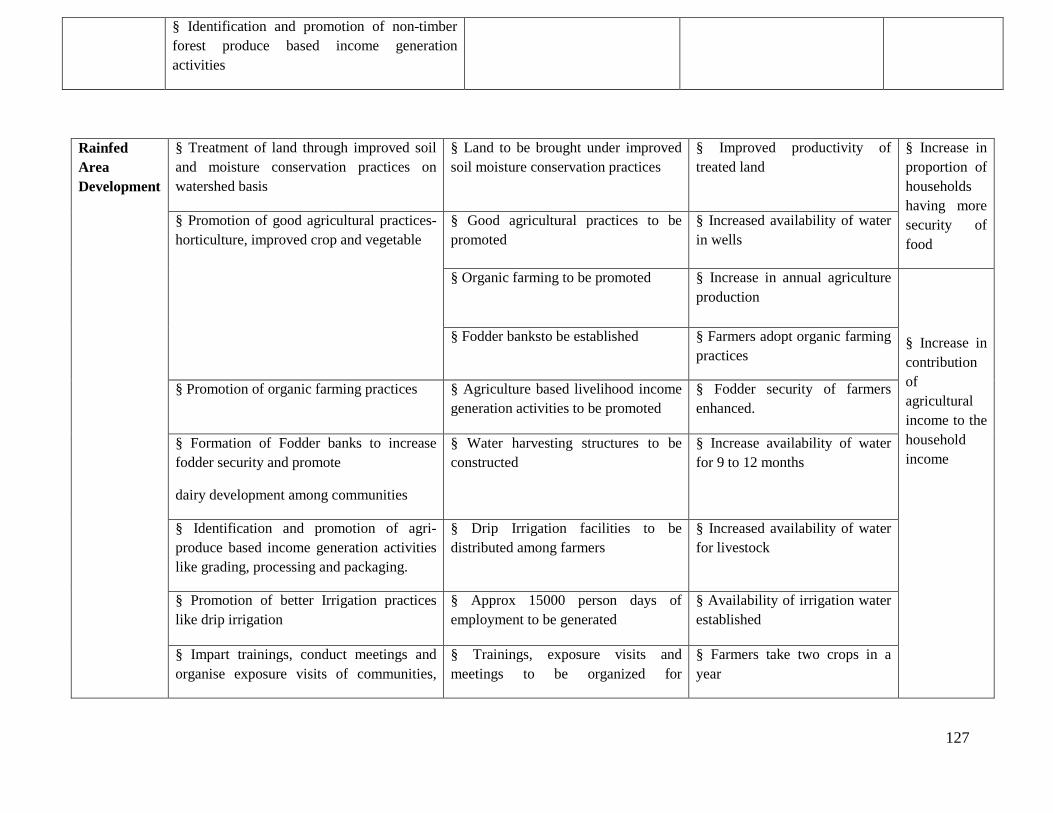
127
§ Identification and promotion of non-timber forest produce based income generation activities
Rainfed Area Development
§ Treatment of land through improved soil and moisture conservation practices on watershed basis
§ Land to be brought under improved soil moisture conservation practices
§ Improved productivity of treated land
§ Increase in proportion of households having more security of food
§ Promotion of good agricultural practices- horticulture, improved crop and vegetable
§ Good agricultural practices to be promoted
§ Increased availability of water in wells
§ Organic farming to be promoted § Increase in annual agriculture production
§ Increase in contribution of agricultural income to the household income
§ Fodder banksto be established § Farmers adopt organic farming practices
§ Promotion of organic farming practices § Agriculture based livelihood income generation activities to be promoted
§ Fodder security of farmers enhanced.
§ Formation of Fodder banks to increase fodder security and promote
dairy development among communities
§ Water harvesting structures to be constructed
§ Increase availability of water for 9 to 12 months
§ Identification and promotion of agri-produce based income generation activities like grading, processing and packaging.
§ Drip Irrigation facilities to be distributed among farmers
§ Increased availability of water for livestock
§ Promotion of better Irrigation practices like drip irrigation
§ Approx 15000 person days of employment to be generated
§ Availability of irrigation water established
§ Impart trainings, conduct meetings and organise exposure visits of communities,
§ Trainings, exposure visits and meetings to be organized for
§ Farmers take two crops in a year

128
Women’s Socio-political and economic empowerment
§ Formation & Strengthening of women’s SHG groups
§ Women’s SHG groups to be formed § Enhanced capacities of leaders of women's group in taking initiatives to solve problems at different levels.
§ Position of women in household, community, society (politically, socially and economically) as perceived by women and community at large
§ Capacity building of womenfolk § Federation of Women’s SHGs to be formed
§ Improved access to credit for livelihood purposes.
§ Performance enhancement of SHGs in terms of participation, decision-making, leadership and fund management.
village volunteers and staff to effectively plan, execute and monitor activities
communities, village volunteers and staff
agricultural productivity of land
§ Availability of drinking water enhanced
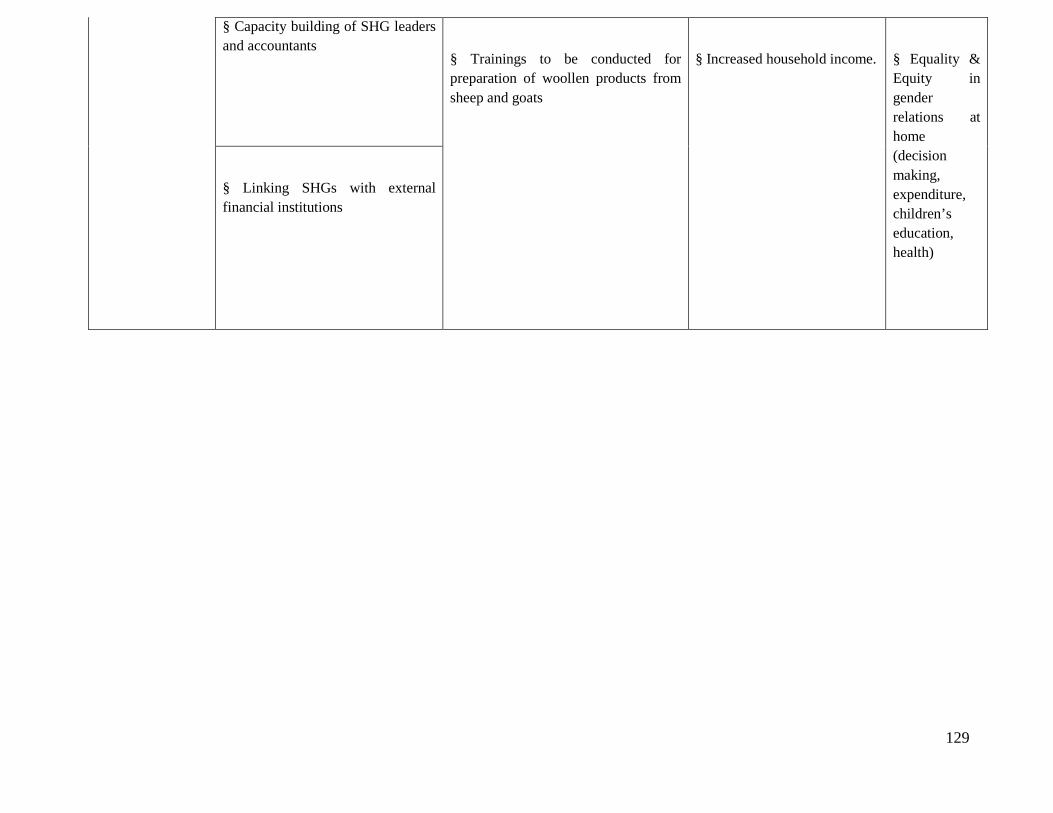
129
§ Capacity building of SHG leaders and accountants
§ Trainings to be conducted for preparation of woollen products from sheep and goats
§ Increased household income.
§ Equality & Equity in gender relations at home (decision making, expenditure, children’s education, health)
§ Linking SHGs with external financial institutions
130
CHAPTER -7
QUALITY AND SUSTAINABILITY
ISSUES
131
7-QUALITY & SUSTAINABILITY ISSUES
7.1-PLANS FOR MONITORING & EVAUATION
A Web-based GIS System is being developed for monitoring and evaluating the project in its planning & implementation phases.
The system would be available on a public domain and can be accessed by all the stakeholders of the project. The system shows the
entire state of Uttar Pradesh and all of those areas selected over the next 20 years. Filtering allows the user to zoom onto one particular
project. Details related to soil type, Land-use classification, inhabitation etc., can be obtained village-wise. Furthermore, survey-number
wise details related to ownership, irrigation source, yield etc., can also be accessed by the users of the system. This system is being used
for pooling up the details obtained from the DPR. In other words, the DPR is made available online in the form of a database which will
help the stakeholders know areas of importance viz., already treated areas/historical works in the area, proposed areas for treatment etc.,
for further treatment and planning. The system would also show the satellite imageries of various years from the project inception stage
to the project closing stages. This allows the user to evaluate the effectiveness of the treatment and thereby plan corrective measures for
the project area. The system would serve as an aiding tool to the planners and evaluators for judging the efficacy of the project.

132
Yet another component of the Web-based GIS system is the Mobile based Monitoring & Evaluation System, which will help the
ground staff alias WDTs (Watershed Development Team) to transmit information from the ground level to the central server. Also, any
higher-up official in charge of the project can obtain information regarding the project area on their mobile phone by means of an SMS.
The system works in the following manner. The WDT equipped with a GPS instrument marks the latitude-longitude information of
various treatment areas during the DPR. The probable sites are then transferred onto the central server. During the works phase, any
progress in the treatment areas is reported to the server by means of an SMS by the WDT. Similarly, any nodal officer or higher-up
official can view the progress in a project by means of summarized reports generated over frequent periods of time.
7.2 PLANS FOR PROJECT MANAGEMENT:
The Project management of any watershed programme is very important. It mainly depends upon the community organisation
and the village level institutes.In Kannauj, watershed committee and various user group have been formulated for post project operation
and maintenance of assets created during project period. Major emphasis will be on equity and sustainable benefit of the project even
after implementation stage. A proper link-up will be built during project period with various institutes and capacity building
organisation. They will act as a major kingpin during post implementation for scaling up the successful experience during project.

133
7.3 WATERSHED DEVELOPMENT FUND:
The major source of financial assistance after post implementation period is watershed Development Fund. The contribution of it
will comes mainly fund the following:
7.4 USER CHARGES:
Various user groups will be formed in village. These user groups will collect user charges according to the designated rules
formed during the formation of user group. These funds will be transferred to the WDF funds as per these formulated rules. The
secretary of watershed committee (WC) shall maintain the records of the following.

134
CHAPTER -8
THEMATIC MAPS
135
136

137
138
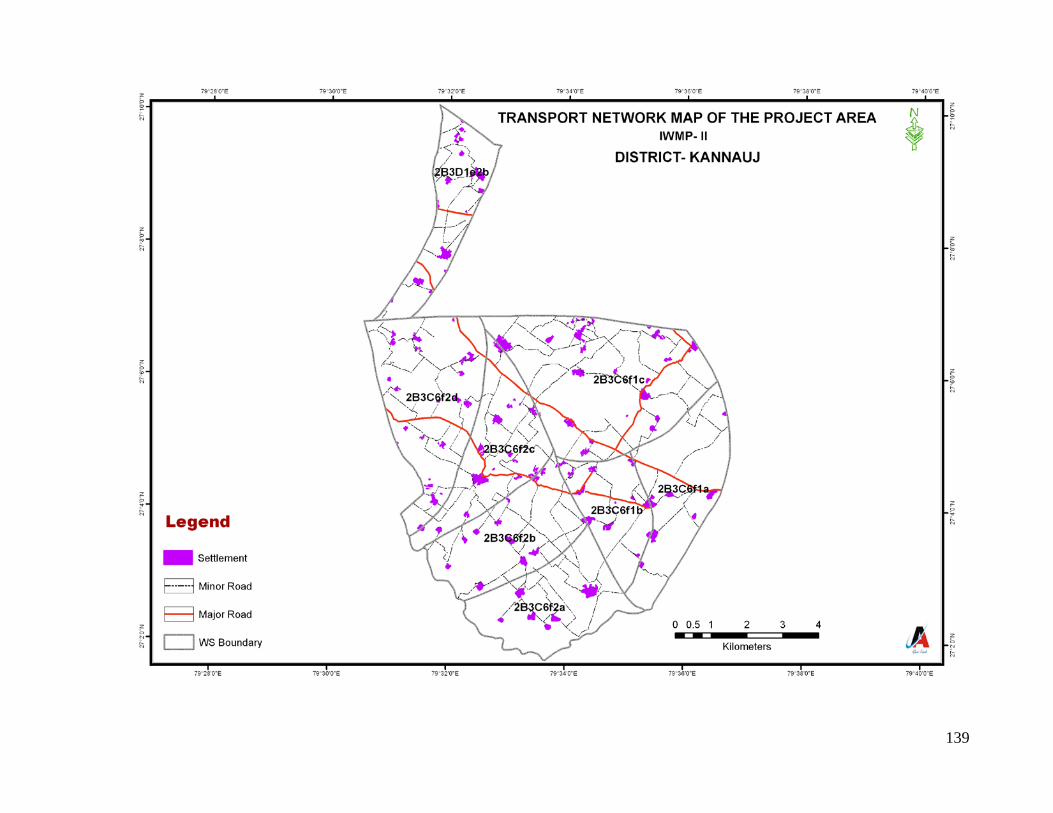
139

140
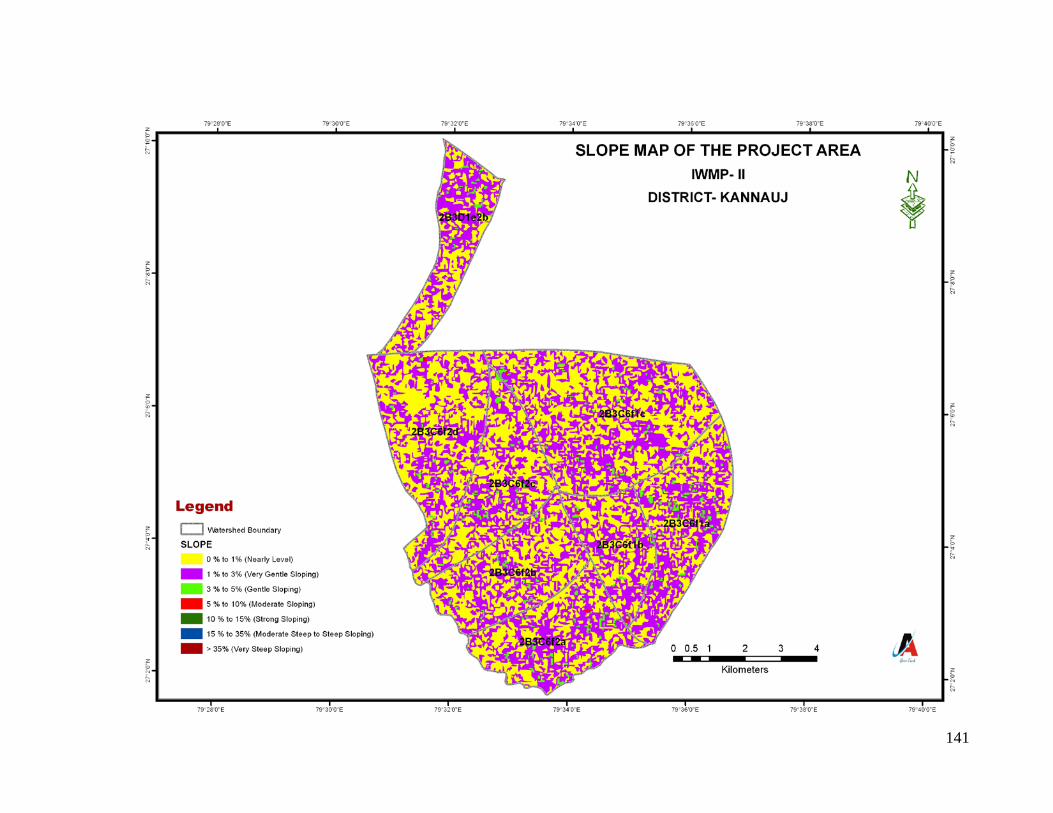
141
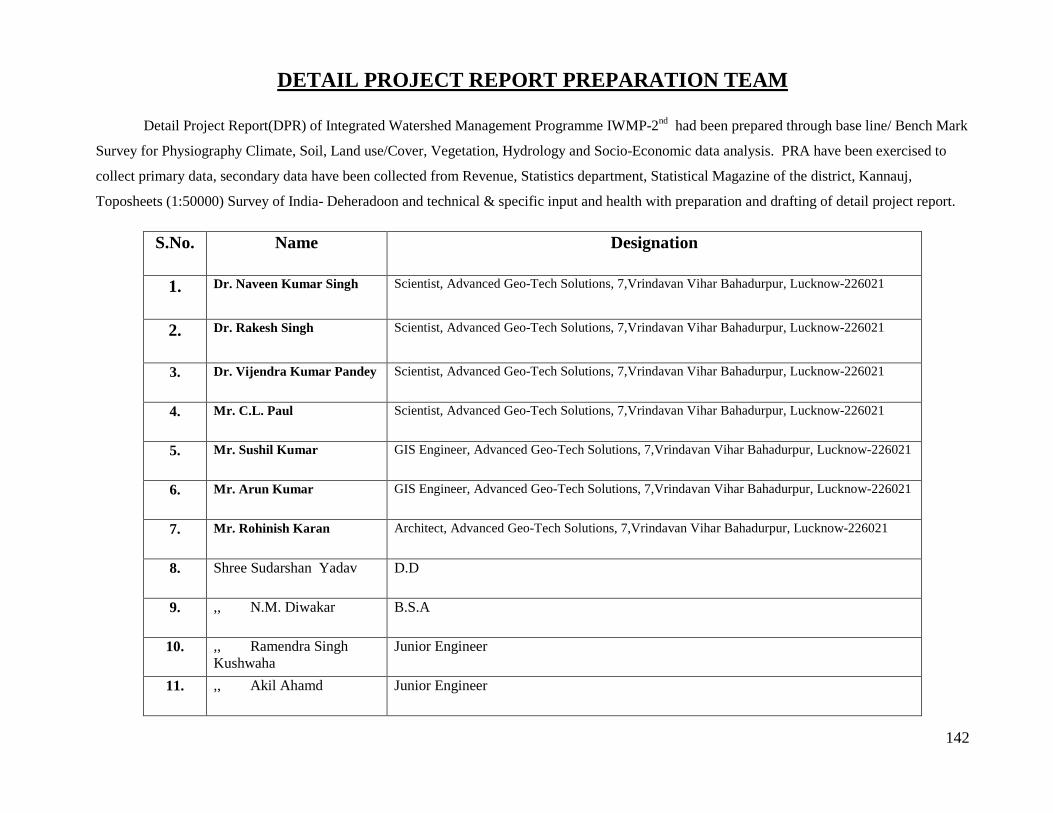
142
DETAIL PROJECT REPORT PREPARATION TEAM
Detail Project Report(DPR) of Integrated Watershed Management Programme IWMP-2nd had been prepared through base line/ Bench Mark
Survey for Physiography Climate, Soil, Land use/Cover, Vegetation, Hydrology and Socio-Economic data analysis. PRA have been exercised to
collect primary data, secondary data have been collected from Revenue, Statistics department, Statistical Magazine of the district, Kannauj,
Toposheets (1:50000) Survey of India- Deheradoon and technical & specific input and health with preparation and drafting of detail project report.
S.No. Name Designation
1. Dr. Naveen Kumar Singh Scientist, Advanced Geo-Tech Solutions, 7,Vrindavan Vihar Bahadurpur, Lucknow-226021
2. Dr. Rakesh Singh Scientist, Advanced Geo-Tech Solutions, 7,Vrindavan Vihar Bahadurpur, Lucknow-226021
3. Dr. Vijendra Kumar Pandey Scientist, Advanced Geo-Tech Solutions, 7,Vrindavan Vihar Bahadurpur, Lucknow-226021
4. Mr. C.L. Paul Scientist, Advanced Geo-Tech Solutions, 7,Vrindavan Vihar Bahadurpur, Lucknow-226021
5. Mr. Sushil Kumar GIS Engineer, Advanced Geo-Tech Solutions, 7,Vrindavan Vihar Bahadurpur, Lucknow-226021
6. Mr. Arun Kumar GIS Engineer, Advanced Geo-Tech Solutions, 7,Vrindavan Vihar Bahadurpur, Lucknow-226021
7. Mr. Rohinish Karan Architect, Advanced Geo-Tech Solutions, 7,Vrindavan Vihar Bahadurpur, Lucknow-226021
8. Shree Sudarshan Yadav D.D
9. ,, N.M. Diwakar B.S.A
10. ,, Ramendra Singh Kushwaha
Junior Engineer
11. ,, Akil Ahamd Junior Engineer
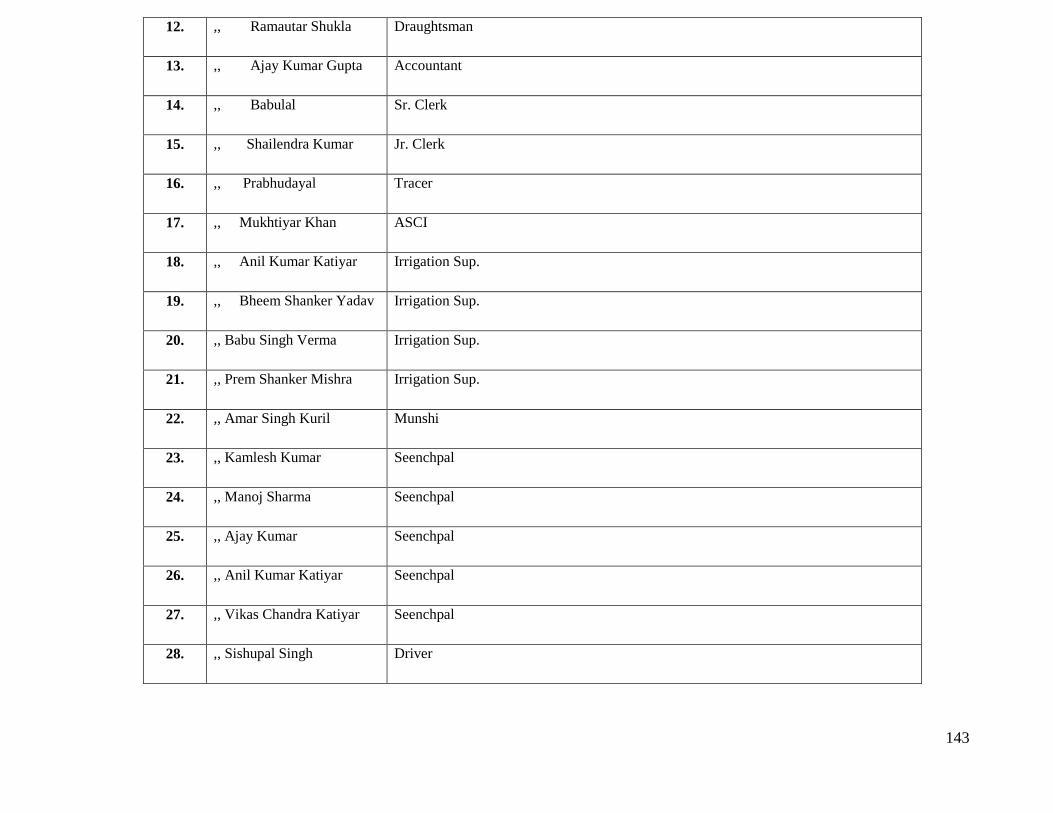
143
12. ,, Ramautar Shukla Draughtsman
13. ,, Ajay Kumar Gupta Accountant
14. ,, Babulal Sr. Clerk
15. ,, Shailendra Kumar Jr. Clerk
16. ,, Prabhudayal Tracer
17. ,, Mukhtiyar Khan ASCI
18. ,, Anil Kumar Katiyar Irrigation Sup.
19. ,, Bheem Shanker Yadav Irrigation Sup.
20. ,, Babu Singh Verma Irrigation Sup.
21. ,, Prem Shanker Mishra Irrigation Sup.
22. ,, Amar Singh Kuril Munshi
23. ,, Kamlesh Kumar Seenchpal
24. ,, Manoj Sharma Seenchpal
25. ,, Ajay Kumar Seenchpal
26. ,, Anil Kumar Katiyar Seenchpal
27. ,, Vikas Chandra Katiyar Seenchpal
28. ,, Sishupal Singh Driver
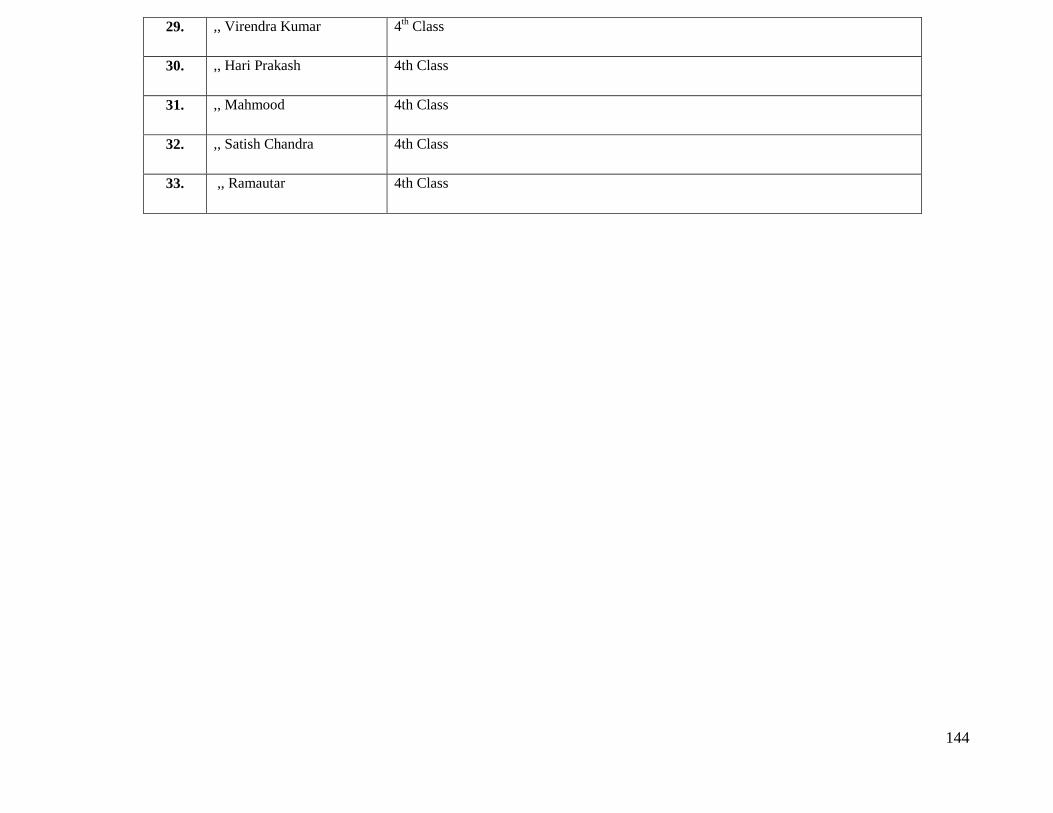
144
29. ,, Virendra Kumar 4th Class
30. ,, Hari Prakash 4th Class
31. ,, Mahmood 4th Class
32. ,, Satish Chandra 4th Class
33. ,, Ramautar 4th Class
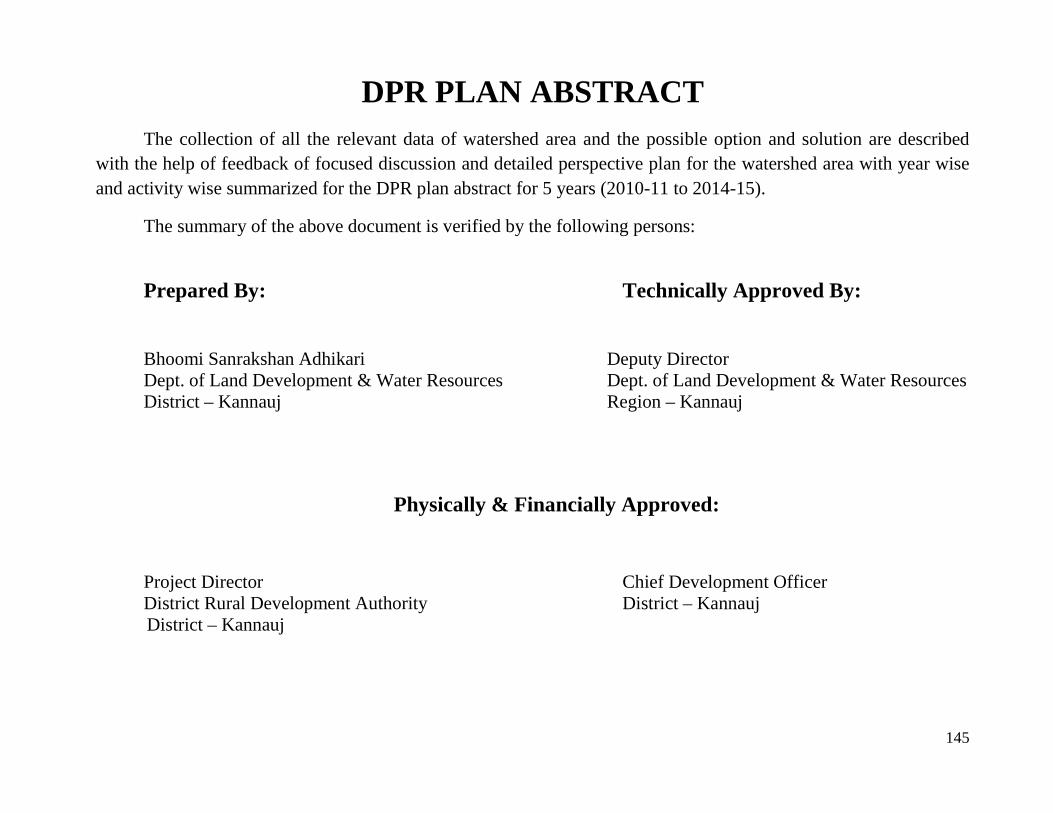
145
DPR PLAN ABSTRACT The collection of all the relevant data of watershed area and the possible option and solution are described with the help of feedback of focused discussion and detailed perspective plan for the watershed area with year wise and activity wise summarized for the DPR plan abstract for 5 years (2010-11 to 2014-15).
The summary of the above document is verified by the following persons:
Prepared By: Technically Approved By: Bhoomi Sanrakshan Adhikari Deputy Director Dept. of Land Development & Water Resources Dept. of Land Development & Water Resources District – Kannauj Region – Kannauj
Physically & Financially Approved:
Project Director Chief Development Officer District Rural Development Authority District – Kannauj
District – Kannauj


![Detailed Project Report for the [CITY] Bus Rapid Transit System](https://static.fdokumen.com/doc/165x107/632543f65c2c3bbfa8031be4/detailed-project-report-for-the-city-bus-rapid-transit-system.jpg)