SOYA PANEER (TOFU) UNIT - Model Detailed Project Report
28
Model Detailed Project Report SOYA PANEER (TOFU) UNIT Prepared by National Institute of Food Technology Entrepreneurship and Management(NIFTEM) Plot No. 97, Sector 56, HSIIDC, Industrial Estate, Kundli, Sonipat, Haryana 131028 Ministry of Food Processing Industries, Government of India
-
Upload
khangminh22 -
Category
Documents
-
view
3 -
download
0
Transcript of SOYA PANEER (TOFU) UNIT - Model Detailed Project Report

Model Detailed Project Report
SOYA PANEER (TOFU) UNIT
Prepared by
National Institute of Food Technology Entrepreneurship and Management(NIFTEM)
Plot No. 97, Sector 56, HSIIDC, Industrial Estate, Kundli, Sonipat, Haryana 131028
Ministry of Food Processing Industries, Government of India

1. INTRODUCTION
SOYA PANEER (TOFU)
Tofu, also known as bean curd is a food prepared by coagulating soy milk
and then pressing the resulting curds into solid white blocks of varying
softness; it can be silken, soft, firm, or extra firm. Beyond these broad
categories, there are many varieties of tofu.
Soya paneer is commonly called as Tofu. While normal paneer is a dairy
product, soya paneer manufacturers make use of soy milk to create this
healthier version of paneer. The texture of tofu or soya paneer is very similar
to that of cottage cheese or paneer.
It has a subtle flavor, so it can be used in savory and sweet dishes. It is often
seasoned or marinated to suit the dish and its flavors, and due to its spongy
texture it absorbs flavors well.
"Tofu is a much healthier option than paneer. 100 grams of tofu has about
60-65 calories, while 100 grams of paneer may have about 260 calories. Iron
content in tofu is more than that of paneer. Both have sufficient amount of
protein content.”
Soybeans are crushed and ground into a milk like substance to form tofu.
This soy milk is used for making soya paneer in the similar manner. The best
part about soya paneer or tofu is that it is totally vegan, perfect for all the
vegan people. This soya paneer is good for all the health-lovers. It is rich in
a number of healthy items like iron, manganese, copper, selenium,
phosphorous, and magnesium.
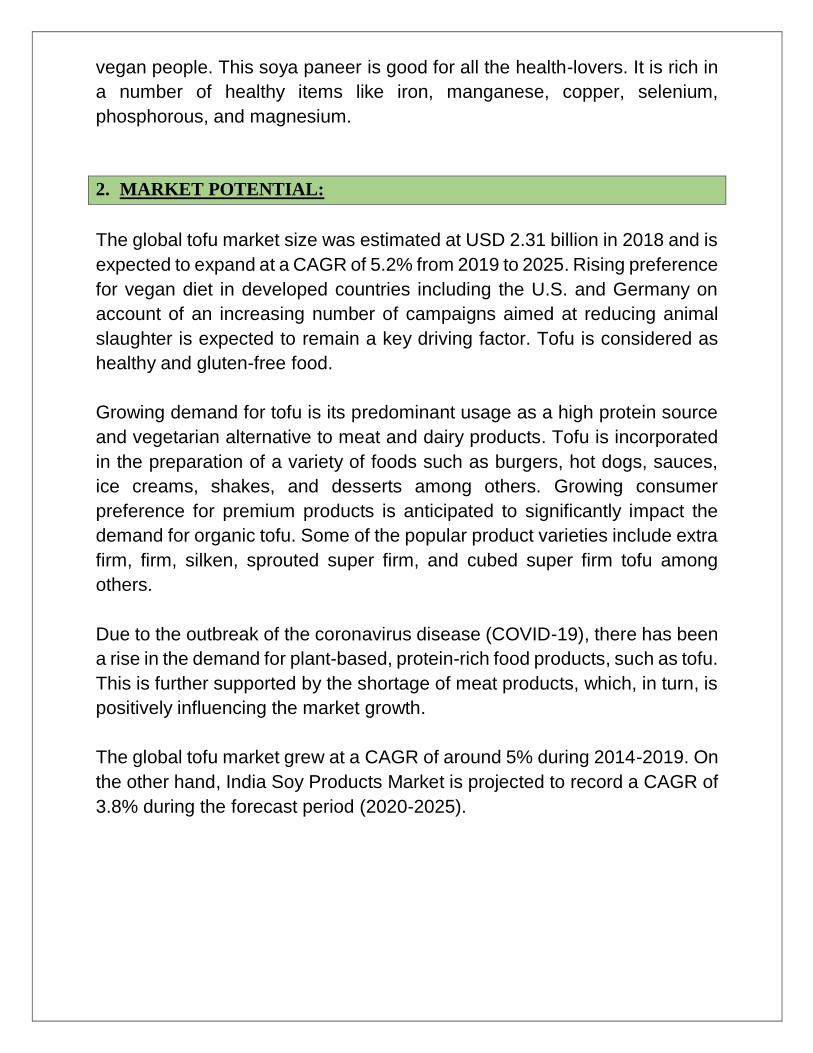
2. MARKET POTENTIAL:
The global tofu market size was estimated at USD 2.31 billion in 2018 and is
expected to expand at a CAGR of 5.2% from 2019 to 2025. Rising preference
for vegan diet in developed countries including the U.S. and Germany on
account of an increasing number of campaigns aimed at reducing animal
slaughter is expected to remain a key driving factor. Tofu is considered as
healthy and gluten-free food.
Growing demand for tofu is its predominant usage as a high protein source
and vegetarian alternative to meat and dairy products. Tofu is incorporated
in the preparation of a variety of foods such as burgers, hot dogs, sauces,
ice creams, shakes, and desserts among others. Growing consumer
preference for premium products is anticipated to significantly impact the
demand for organic tofu. Some of the popular product varieties include extra
firm, firm, silken, sprouted super firm, and cubed super firm tofu among
others.
Due to the outbreak of the coronavirus disease (COVID-19), there has been
a rise in the demand for plant-based, protein-rich food products, such as tofu.
This is further supported by the shortage of meat products, which, in turn, is
positively influencing the market growth.
The global tofu market grew at a CAGR of around 5% during 2014-2019. On
the other hand, India Soy Products Market is projected to record a CAGR of
3.8% during the forecast period (2020-2025).

3. PRODUCT DESCRIPTION
3.1 PRODUCT BENEFITS & NUTRIENTS VALUE
Tofu is low in calories, while containing a relatively large amount of
protein. It is high in iron, and can have a high calcium or magnesium
content depending on the coagulants (e.g. calcium chloride, calcium
sulfate, magnesium sulfate) used in manufacturing.
It is rich in minerals like iron, copper, magnesium, manganese,
phosphorus and selenium. Tofu has vitamin B1 and essential amino
acids while paneer does not have both.
Nutrional values of Soya Paneer (per 100g)
Protein 13.80 g
Carbohydrate 4.20 g
Sugar 0.00 g
Fat 5.00 g
Polysaturated Fat 4.25 g
Saturated Fat 0.75 g
Transfatty Acid 0.00 g
Cholesterol 0.00 g Dietary fibre 2.30 g
Crude Fibre 0.60 g
Calcium 310 mg
Iron 10 mg

Magnesium 58 mg
Phosphorus 190 mg
Pottassium 237 mg
PRODUCT BENEFITS & USES
Promotes Weight Loss: One of the major reason why people opt for tofu over paneer is that it promotes weight loss. If you are also planning to lose your extra kilos, you should replace the dairy paneer with tofu. Majority of the people going to gyms or planning to get a leaner body look for soya paneer manufacturers to get high quality tofu and include it in their everyday life.
Prevents Risk Of Stroke: Another amazing health benefit of tofu is that it can help you secure yourself from getting a stroke attack. If you are consuming tofu regularly, there are very high chances that you may be safe from any type of cardiovascular disease. It can reduce the bad cholesterol level in the body along with decreasing the amount of triglycerides to protect you from stroke.
Helpful for Diabetic: If you are suffering from diabetes, tofu could be a super food for you. As tofu is known to be very low in fat and calories, one can include tofu in the diet without thinking twice. In fact, if a person, who is at the risk of getting Type-2 diabetes consumes at least 200 grams of tofu every day, he/she might have high chances of reducing this risk. Tofu should be a regular item on the everyday diet menu if you plan to reduce your risks of getting diabetes.
Rich in Protein: The biggest reason why one should have tofu is that it is rich in proteins. As tofu or soya paneer is made from soy milk, it is rich in protein content. This protein can be helpful in a number of ways like preventing ageing, keeping the skin’s elasticity intact, and much more.

3.2 Raw Material requirement
Following major raw materials are required for soya paneer
manufacturing unit.
1. Soya bean
2. Citric acid
Average raw material price of soya bean is Rs.4100-4500 per Quintal.
It is presumed that 1 kg of Soyabean may yield 7-7.5 liters of Soymilk.
1 liter Soymilk can be converted into 180-200 Grams of Soya Paneer
(Tofu).
So on an average 1 KG soybean will provide approx. 1.25-1.5 KG Soya
paneer.
3.3 MANUFACTURING PROCESS
The initial stage involves the cleaning, sorting of the Soyabean followed by
dehulling and soaking at room temperature. After soaking the weight of
original soyabean becomes double, the split (dehulled beans) are ground in
hot water in proportionate ratio and filtered to get milk.
The milk is then cooled & citric acid solution is added with slow stirring.
Preparation of soy curd& then it is pressed in paneer making boxes to get
final product & then cut into pieces of approx. desired size and put in cold
water for another 30 minutes. Vacuum packed tofu should always be kept in
the fridge and after unpacking, immersed in water.


4. PROJECT COMPONENTS
4.1 Land
Land required 1500-2000 square feet approx.
Approximate rent for the same is Rs.25000-30000 per month.
4.2 Plant & Machinery
Main Machinery
S.N. Item Description Image
1 Soya bean Grinder & milk
separator
2 Soya milk sterilizer

3 Hot water boiler with heating
option
4 Tofu (Paneer press machine)
5 Machine frame
6 Tank, installation etc.
Note: cost of main machinery for soya paneer plant is Rs.2,10, 000 excluding
GST and other transportation cost.
Optional Machinery
S.N. Item Description Amount
1 Vacuum packing machine

2 Curd making machine
3 Paneer cutting machine
4 Bulk milk cooling machine
Note: cost of optional machinery for soya paneer plant is Rs.2,20,000
excluding GST and other transportation cost.
4.3 Misc. Assets
S.N. Item Description Rate
1 Electrical fitting 50,000
2 Furniture and equipment’s 50,000

4.4 Power Requirement
The borrower shall require power load of 10-12 HP which shall be applied with Power Corporation. However, for standby power arrangement the borrower shall also purchase DG Set.
4.5 Manpower Requirement
5-6 Manpower are required for the Soya Paneer (Tofu)unit.
Includes:
2 Skilled Labour
2 Unskilled Labour
1-2 Helper

5. FINANCIALS
5.1 Cost of Project
COST OF PROJECT
(in Lacs)
PARTICULARS AMOUNT Own Contribution
Bank Finance
25.00% 75.00%
Land & Building Owned /rented
Plant & Machinery 4.30 1.08 3.23
Furniture & Fixtures and Other Assets 1.00 0.25 0.75
Working capital 2.67 0.67 2.00
Total 7.97 1.99 5.98
5.2 Means of Finance
MEANS OF FINANCE
PARTICULARS AMOUNT
Own Contribution
1.99
Bank Loan
3.98
Working capital Limit 2.00
Total 7.97

5.3 Projected Balance Sheet
PROJECTED BALANCE SHEET (in Lacs)
PARTICULARS 1st year 2nd year 3rd year 4th year 5th year
Liabilities
Capital
opening balance
2.09 3.25 4.31 5.47
Add:- Own Capital 1.99
Add:- Retained Profit 0.90 2.42 3.81 5.66 7.44
Less:- Drawings 0.80 1.25 2.75 4.50 6.00
Closing Balance 2.09 3.25 4.31 5.47 6.91
Term Loan 3.53 2.65 1.77 0.88 -
Working Capital Limit 2.00 2.00 2.00 2.00 2.00
Sundry Creditors 0.34 0.41 0.48 0.56 0.64
Provisions & Other Liab 0.20 0.25 0.30 0.36 0.43
TOTAL : 8.16 8.56 8.86 9.27 9.98
Assets
Fixed Assets ( Gross) 5.30 5.30 5.30 5.30 5.30
Gross Dep. 0.75 1.38 1.93 2.40 2.80
Net Fixed Assets 4.56 3.92 3.37 2.90 2.50
Current Assets
Sundry Debtors 1.54 1.87 2.19 2.52 2.89
Stock in Hand 1.61 1.89 2.20 2.51 2.86
Cash and Bank 0.46 0.88 1.10 1.34 1.73
TOTAL : 8.16 8.56 8.86 9.27 9.98

5.4 Projected Cash Flow
PROJECTED CASH FLOW STATEMENT (in Lacs)
PARTICULARS 1st year 2nd year 3rd year 4th year 5th year
SOURCES OF FUND
Own Margin 1.99
Net Profit 0.90 2.42 3.81 5.74 7.73
Depreciation & Exp. W/off 0.75 0.64 0.55 0.47 0.40
Increase in Cash Credit 2.00 - - - -
Increase In Term Loan 3.98 - - - -
Increase in Creditors 0.34 0.07 0.07 0.08 0.08
Increase in Provisions & Oth lib 0.20 0.05 0.05 0.06 0.07
TOTAL : 10.15 3.17 4.48 6.34 8.29
APPLICATION OF FUND
Increase in Fixed Assets 5.30
Increase in Stock 1.61 0.28 0.31 0.31 0.35
Increase in Debtors 1.54 0.34 0.31 0.33 0.37
Repayment of Term Loan 0.44 0.88 0.88 0.88 0.88
Drawings 0.80 1.25 2.75 4.50 6.00
Taxation - - - 0.08 0.30
TOTAL : 9.69 2.76 4.25 6.11 7.90
Opening Cash & Bank Balance - 0.46 0.88 1.10 1.34
Add : Surplus 0.46 0.42 0.22 0.23 0.39
Closing Cash & Bank Balance 0.46 0.88 1.10 1.34 1.73

5.5 Projected Profitability
PROJECTED PROFITABILITY STATEMENT (in Lacs)
PARTICULARS 1st year 2nd year 3rd year 4th year 5th year
Capacity Utilization % 40% 45% 50% 55% 60%
SALES
Gross Sale
Soya Paneer (Tofu) 28.81 35.15 41.01 47.26 54.28
Total 28.81 35.15 41.01 47.26 54.28
COST OF SALES
Raw Material Consumed 10.29 12.27 14.40 16.69 19.13
Electricity Expenses 1.92 2.21 2.54 2.92 3.21
Depreciation 0.75 0.64 0.55 0.47 0.40
Wages & labour 5.76 6.34 6.97 7.67 8.43
Repair & maintenance 0.92 1.12 1.31 1.51 1.74
Packaging Charges 1.58 1.93 2.26 2.36 2.71
Consumables 1.30 1.58 1.95 2.01 2.31
Cost of Production 22.51 26.09 29.97 33.63 37.94
Add: Opening Stock /WIP - 0.75 0.87 1.00 1.12
Less: Closing Stock /WIP 0.75 0.87 1.00 1.12 1.26
Cost of Sales 21.76 25.97 29.84 33.51 37.79
GROSS PROFIT 7.05 9.18 11.17 13.75 16.49
Salary to Staff 1.80 1.98 2.18 2.40 2.64
Interest on Term Loan 0.39 0.34 0.25 0.15 0.05
Interest on working Capital 0.22 0.22 0.22 0.22 0.22

Rent 2.88 3.17 3.48 3.83 4.22
selling & adm exp 0.86 1.05 1.23 1.42 1.63
TOTAL 6.16 6.77 7.36 8.02 8.75
NET PROFIT 0.90 2.42 3.81 5.74 7.73
Taxation
0.08 0.30
PROFIT (After Tax) 0.90 2.42 3.81 5.66 7.44
5.6 Production and Yield
COMPUTATION OF PRODUCTION OF SOYA PANEER (TOFU) Items to be Manufactured
Soya Paneer (Tofu)
Machine capacity per hour 250.0 Liter of soya milk
operation capacity per hour(taken) 150 Liter of soya milk
Operational capacity per Day 1,200 Liter of soya milk
1 KG soya bean provides 7.0 Liter of soya milk
1 Liter soya milk provides 180-200 Gram of Tofu
Total soya paneer production per day 216 KG
Working Days in a month 25 Days
Working Days Per annum 300 Days
machine capacity per annum 64,800 KG
Soya bean requirement
Raw material requirement per Hour 21.43 KG
Total Raw material requirement per day 171.43 KG
Total Raw material requirement per Annum 51,428.57 KG

Production of Soya Paneer (Tofu)
Production Capacity KG
1st year 40% 25,920
2nd year 45% 29,160
3rd year 50% 32,400
4th year 55% 35,640
5th year 60% 38,880
Raw Material Cost
Year Capacity Rate Amount
Utilisation (per KG) (Rs. in lacs)
1st year 40% 50.00 10.29
2nd year 45% 53.00 12.27
3rd year 50% 56.00 14.40
4th year 55% 59.00 16.69
5th year 60% 62.00 19.13
5.7 Sales Revenue
COMPUTATION OF SALE
Particulars 1st year 2nd year 3rd year 4th year 5th year
Op Stock - 864 972 1,080 1,188
Production 25,920 29,160 32,400 35,640 38,880
Less : Closing Stock 864 972 1,080 1,188 1,296
Net Sale 25,056 29,052 32,292 35,532 38,772
sale price per KG 115.00 121.00 127.00 133.00 140.00
Sales (in Lacs) 28.81 35.15 41.01 47.26 54.28

5.8 Working Capital Assessment
COMPUTATION OF CLOSING STOCK & WORKING CAPITAL (in Lacs)
PARTICULARS 1st year 2nd year 3rd year 4th year 5th year
Finished Goods
0.75 0.87 1.00 1.12 1.26
Raw Material
0.86 1.02 1.20 1.39 1.59
Closing Stock 1.61 1.89 2.20 2.51 2.86
COMPUTATION OF WORKING CAPITAL REQUIREMENT
TRADITIONAL METHOD (in Lacs)
Particulars Amount Own Margin Bank Finance
Finished Goods & Raw Material 1.61
Less : Creditors 0.34
Paid stock 1.26 25% 0.32 75% 0.95
Sundry Debtors 1.54 25% 0.38 75% 1.15
2.80 0.70 2.10
WORKING CAPITAL LIMIT DEMAND ( from Bank) 2.00

5.9 Power, Salary & Wages Calculation
Utility Charges (per month)
Particulars value Description
Power connection required 8 KWH
consumption per day 64 units
Consumption per month 1,600 units
Rate per Unit 10 Rs.
power Bill per month 16,000 Rs.
BREAK UP OF LABOUR CHARGES
Particulars Wages No of Total
Rs. per Month Employees Salary
Skilled (in thousand rupees) 15,000 2 30,000
Unskilled (in thousand rupees) 9,000 2 18,000
Total salary per month
48,000
Total annual labour charges (in lacs)
5.76
BREAK UP OF Staff Salary CHARGES
Particulars Salary No of Total
Rs. per Month Employees Salary
helper 7,500 2 15,000
Total salary per month
15,000
Total annual Staff charges (in lacs)
1.80

5.10 Depreciation
COMPUTATION OF DEPRECIATION (in Lacs)
Description Plant & Machinery Furniture TOTAL
Rate of Depreciation 15.00% 10.00%
Opening Balance - - -
Addition 4.30 1.00 5.30
Total 4.30 1.00 5.30
Less : Depreciation 0.65 0.10 0.75
WDV at end of Year 3.66 0.90 4.56
Additions During The Year - - -
Total 3.66 0.90 4.56
Less : Depreciation 0.55 0.09 0.64
WDV at end of Year 3.11 0.81 3.92
Additions During The Year - - -
Total 3.11 0.81 3.92
Less : Depreciation 0.47 0.08 0.55
WDV at end of Year 2.64 0.73 3.37
Additions During The Year - - -
Total 2.64 0.73 3.37
Less : Depreciation 0.40 0.07 0.47
WDV at end of Year 2.24 0.66 2.90
Additions During The Year - - -
Total 2.24 0.66 2.90
Less : Depreciation 0.34 0.07 0.40
WDV at end of Year 1.91 0.59 2.50
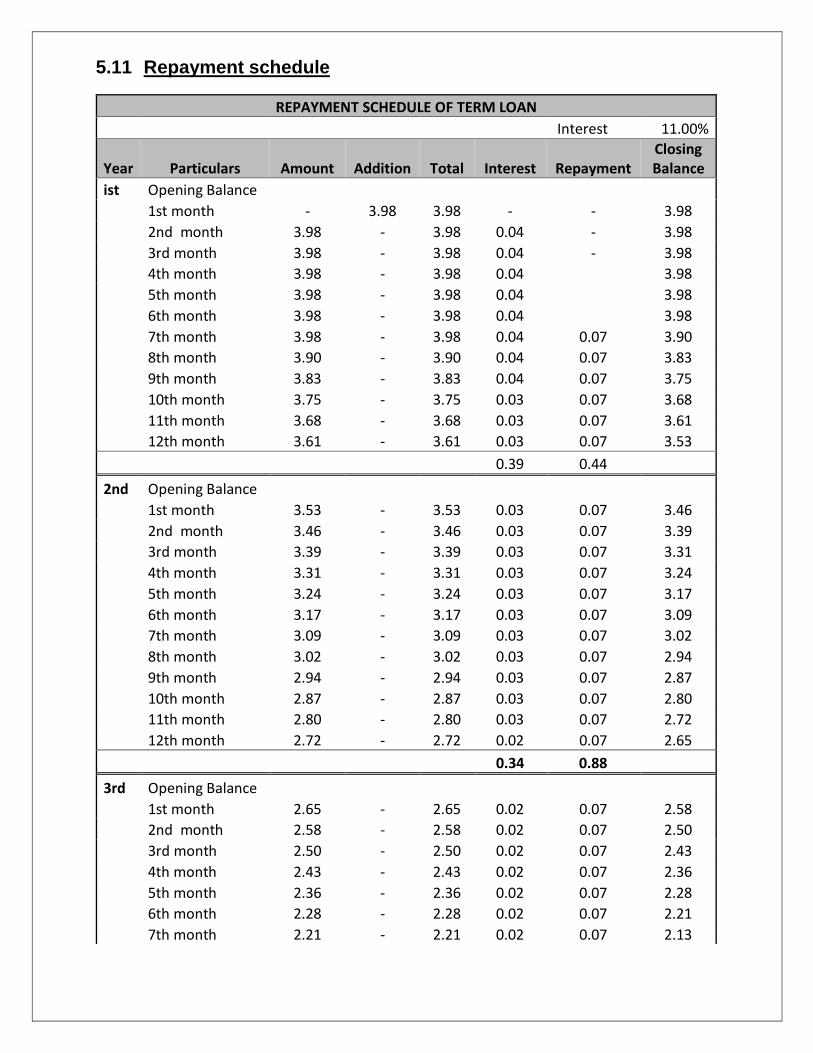
5.11 Repayment schedule
REPAYMENT SCHEDULE OF TERM LOAN
Interest 11.00%
Year Particulars Amount Addition Total Interest Repayment Closing Balance
ist Opening Balance 1st month - 3.98 3.98 - - 3.98
2nd month 3.98 - 3.98 0.04 - 3.98
3rd month 3.98 - 3.98 0.04 - 3.98
4th month 3.98 - 3.98 0.04 3.98
5th month 3.98 - 3.98 0.04 3.98
6th month 3.98 - 3.98 0.04 3.98
7th month 3.98 - 3.98 0.04 0.07 3.90
8th month 3.90 - 3.90 0.04 0.07 3.83
9th month 3.83 - 3.83 0.04 0.07 3.75
10th month 3.75 - 3.75 0.03 0.07 3.68
11th month 3.68 - 3.68 0.03 0.07 3.61
12th month 3.61 - 3.61 0.03 0.07 3.53
0.39 0.44
2nd Opening Balance 1st month 3.53 - 3.53 0.03 0.07 3.46
2nd month 3.46 - 3.46 0.03 0.07 3.39
3rd month 3.39 - 3.39 0.03 0.07 3.31
4th month 3.31 - 3.31 0.03 0.07 3.24
5th month 3.24 - 3.24 0.03 0.07 3.17
6th month 3.17 - 3.17 0.03 0.07 3.09
7th month 3.09 - 3.09 0.03 0.07 3.02
8th month 3.02 - 3.02 0.03 0.07 2.94
9th month 2.94 - 2.94 0.03 0.07 2.87
10th month 2.87 - 2.87 0.03 0.07 2.80
11th month 2.80 - 2.80 0.03 0.07 2.72
12th month 2.72 - 2.72 0.02 0.07 2.65
0.34 0.88
3rd Opening Balance 1st month 2.65 - 2.65 0.02 0.07 2.58
2nd month 2.58 - 2.58 0.02 0.07 2.50
3rd month 2.50 - 2.50 0.02 0.07 2.43
4th month 2.43 - 2.43 0.02 0.07 2.36
5th month 2.36 - 2.36 0.02 0.07 2.28
6th month 2.28 - 2.28 0.02 0.07 2.21
7th month 2.21 - 2.21 0.02 0.07 2.13

8th month 2.13 - 2.13 0.02 0.07 2.06
9th month 2.06 - 2.06 0.02 0.07 1.99
10th month 1.99 - 1.99 0.02 0.07 1.91
11th month 1.91 - 1.91 0.02 0.07 1.84
12th month 1.84 - 1.84 0.02 0.07 1.77
0.25 0.88
4th Opening Balance 1st month 1.77 - 1.77 0.02 0.07 1.69
2nd month 1.69 - 1.69 0.02 0.07 1.62
3rd month 1.62 - 1.62 0.01 0.07 1.55
4th month 1.55 - 1.55 0.01 0.07 1.47
5th month 1.47 - 1.47 0.01 0.07 1.40
6th month 1.40 - 1.40 0.01 0.07 1.33
7th month 1.33 - 1.33 0.01 0.07 1.25
8th month 1.25 - 1.25 0.01 0.07 1.18
9th month 1.18 - 1.18 0.01 0.07 1.10
10th month 1.10 - 1.10 0.01 0.07 1.03
11th month 1.03 - 1.03 0.01 0.07 0.96
12th month 0.96 - 0.96 0.01 0.07 0.88
0.15 0.88
5th Opening Balance 1st month 0.88 - 0.88 0.01 0.07 0.81
2nd month 0.81 - 0.81 0.01 0.07 0.74
3rd month 0.74 - 0.74 0.01 0.07 0.66
4th month 0.66 - 0.66 0.01 0.07 0.59
5th month 0.59 - 0.59 0.01 0.07 0.52
6th month 0.52 - 0.52 0.00 0.07 0.44
7th month 0.44 - 0.44 0.00 0.07 0.37
8th month 0.37 - 0.37 0.00 0.07 0.29
9th month 0.29 - 0.29 0.00 0.07 0.22
10th month 0.22 - 0.22 0.00 0.07 0.15
11th month 0.15 - 0.15 0.00 0.07 0.07
12th month 0.07 - 0.07 0.00 0.07 -
0.05 0.88
DOOR TO DOOR 60 MONTHS MORATORIUM PERIOD 6 MONTHS
REPAYMENT PERIOD 54 MONTHS

5.12 Financial Indicators
FINANCIAL INDICATORS
PARTICULARS 1st year 2nd year 3rd year 4th year 5th year
TURNOVER 28.81 35.15 41.01 47.26 54.28
GROSS PROFIT 7.05 9.18 11.17 13.75 16.49
G.P. RATIO 24.47% 26.13% 27.23% 29.10% 30.37%
NET PROFIT 0.90 2.42 3.81 5.74 7.73
N.P. RATIO 3.11% 6.88% 9.29% 12.14% 14.25%
CURRENT ASSETS 3.61 4.65 5.49 6.37 7.48
CURRENT LIABILITIES 2.54 2.66 2.78 2.92 3.07
CURRENT RATIO 1.42 1.75 1.97 2.18 2.44
TERM LOAN 3.53 2.65 1.77 0.88 -
TOTAL NET WORTH 2.09 3.25 4.31 5.47 6.91
DEBT/EQUITY 1.69 0.81 0.41 0.16 -
TOTAL NET WORTH 2.09 3.25 4.31 5.47 6.91
TOTAL OUTSIDE LIABILITIES 6.08 5.31 4.55 3.80 3.07
TOL/TNW 2.91 1.63 1.05 0.69 0.44
PBDIT 2.25 3.62 4.82 6.57 8.41
INTEREST 0.61 0.56 0.47 0.37 0.27
INTEREST COVERAGE RATIO 3.69 6.42 10.33 17.78 30.85
WDV 4.56 3.92 3.37 2.90 2.50
TERM LOAN 3.53 2.65 1.77 0.88 -
FACR 1.29 1.48 1.91 3.28 -

5.13 DSCR
CALCULATION OF D.S.C.R
PARTICULARS 1st year 2nd year 3rd year 4th year 5th year
CASH ACCRUALS 1.64 3.06 4.36 6.13 7.84
Interest on Term Loan 0.39 0.34 0.25 0.15 0.05
Total 2.03 3.40 4.60 6.28 7.89
REPAYMENT
Instalment of Term Loan 0.44 0.88 0.88 0.88 0.88
Interest on Term Loan 0.39 0.34 0.25 0.15 0.05
Total 0.83 1.23 1.13 1.03 0.94
DEBT SERVICE COVERAGE RATIO 2.44 2.77 4.07 6.08 8.43
AVERAGE D.S.C.R. 4.76

5.14 Break Even Point Analysis
BREAK EVEN POINT ANALYSIS
Year I II III IV V
Net Sales & Other Income 28.81 35.15 41.01 47.26 54.28
Less : Op. WIP Goods - 0.75 0.87 1.00 1.12
Add : Cl. WIP Goods 0.75 0.87 1.00 1.12 1.26
Total Sales 29.56 35.27 41.14 47.38 54.42
Variable & Semi Variable Exp.
Raw Material Consumed 10.29 12.27 14.40 16.69 19.13
Electricity Exp/Coal Consumption at 85% 1.63 1.88 2.16 2.48 2.73
Wages & Salary at 60% 4.54 4.99 5.49 6.04 6.64
Selling & adminstrative Expenses 80% 0.69 0.84 0.98 1.13 1.30
Interest on working Capital 0.22 0.22 0.22 0.22 0.22
Repair & maintenance 0.92 1.12 1.31 1.51 1.74
Pakaging charges 1.58 1.93 2.26 2.36 2.71
Consumables 1.30 1.58 1.95 2.01 2.31
Total Variable & Semi Variable Exp 21.17 24.84 28.77 32.45 36.78
Contribution 8.40 10.44 12.37 14.93 17.64
Fixed & Semi Fixed Expenses
Electricity Exp/Coal Consumption at 15% 0.29 0.33 0.38 0.44 0.48
Wages & Salary at 40% 3.02 3.33 3.66 4.02 4.43
Interest on Term Loan 0.39 0.34 0.25 0.15 0.05
Depreciation 0.75 0.64 0.55 0.47 0.40

Selling & adminstrative Expenses 20% 0.17 0.21 0.25 0.28 0.33
Rent 2.88 3.17 3.48 3.83 4.22
Total Fixed Expenses 7.50 8.02 8.56 9.20 9.91
Capacity Utilization 40% 45% 50% 55% 60%
OPERATING PROFIT 0.90 2.42 3.81 5.74 7.73
BREAK EVEN POINT 36% 35% 35% 34% 34%
BREAK EVEN SALES 26.41 27.10 28.48 29.18 30.56
6. LICENSE & APPROVALS
Obtain the GST registration.
Additionally, obtain the Udyog Aadhar registration Number.
FSSAI License.
Choice of a Brand Name of the product and secure the name with
Trademark if required.
Implementation Schedule
S.N. Activity Time Required
(in Months)
1 Acquisition Of premises 1-2
2 Procurement & installation of Plant & Machinery 1-2
3 Arrangement of Finance 1-2
4 Requirement of required Manpower 1
Total time Required (some activities shall run
concurrently)
3-4 Months

7. ASSUMPTIONS
1. Production Capacity of soya paneer is 216 Kgs per day. First year, Capacity
has been taken @ 40%.
2. Working shift of 8 hours per day has been considered.
3. Raw Material stock is for 25 days and Finished goods Closing Stock has
been taken for 10 days.
4. Credit period to Sundry Debtors has been given for 16 days.
5. Credit period by the Sundry Creditors has been provided for 10 days.
6. Depreciation and Income tax has been taken as per the Income tax Act,
1961.
7. Interest on working Capital Loan and Term loan has been taken at 11%.
8. Salary and wages rates are taken as per the Current Market Scenario.
9. Power Consumption has been taken at 8 KW.
10. Selling Prices & Raw material costing has been increased by 5% & 5%
respectively in the subsequent years.

Limitations of the Model DPR and Guidelines for Entrepreneurs
Limitations of the Model DPR
i. This model DPR has provided only the basic standard components and methodology to beadopted by an entrepreneur while submitting a proposal under the Formalization of Micro FoodProcessing Enterprises Scheme of MoFPI.
ii. This is a model DPR made to provide general methodological structure not for specificentrepreneur/crops/location. Therefore, information on the entrepreneur, forms and structure(proprietorship/partnership/cooperative/ FPC/joint stock company) of his business, details ofproposed DPR, project location, raw material base/contract sourcing, entrepreneurs own SWOTanalysis, detailed market research, rationale of the project for specific location, communityadvantage/benefit from the project, employment generation and many more detailed aspects notincluded.
iii. The present DPR is based on certain assumptions on cost, prices, interest, capacity utilization,output recovery rate and so on. However, these assumptions in reality may vary across places,markets and situations; thus the resultant calculations will also change accordingly.