detailed project report on variable frequency drive for ...
46
DETAILED PROJECT REPORT ON VARIABLE FREQUENCY DRIVE FOR REFRIGERATION PLANT, COOLING TOWERS & CENTRIFUGAL (VAPI CHEMICALS & DYES CLUSTER) Bureau of Energy Efficiency Prepared By Reviewed By
-
Upload
khangminh22 -
Category
Documents
-
view
0 -
download
0
Transcript of detailed project report on variable frequency drive for ...

DETAILED PROJECT REPORT
ON
VARIABLE FREQUENCY DRIVE FOR REFRIGERATION PLANT,
COOLING TOWERS & CENTRIFUGAL
(VAPI CHEMICALS & DYES CLUSTER)
Bureau of Energy Efficiency
Prepared By
Reviewed By

VARIABLE FREQUENCY DRIVE FOR REFRIGERATION PLANT, BOILER FAN, COOLING TOWERS & CENTRIFUGES
VAPI CHEMICALS & DYES CLUSTER

BEE, 2010
Detailed Project Report on Variable Frequency Drive for Refrigeration
Plant, Boiler fan and Cooling Towers & Centrifuges
Chemicals & Dyes SME Cluster, Vapi, Gujarat (India)
New Delhi: Bureau of Energy Efficiency;
Detail Project Report No.: VAPI/C&D/VFD/01
For more information
Bureau of Energy Efficiency (BEE)
(Ministry of Power, Government of India)
4th Floor, Sewa Bhawan
R. K. Puram, New Delhi – 110066
Telephone +91-11-26179699
Fax +91-11-26178352
Websites: www.bee-india.nic.in
Email: [email protected]/ [email protected]

Acknowledgement
We are sincerely thankful to the Bureau of Energy Efficiency, Ministry of Power, for giving us
the opportunity to implement the „BEE SME project in “Chemicals & Dyes Cluster, Vapi,
Gujarat State”. We express our sincere gratitude to all concerned officials for their support
and guidance during the conduct of this exercise.
Dr. Ajay Mathur, Director General, BEE
Smt. Abha Shukla, Secretary, BEE
Shri Jitendra Sood, Energy Economist, BEE
Shri Pawan Kumar Tiwari, Advisor (SME), BEE
Shri Rajeev Yadav, Project Economist, BEE
Zenith Energy Services Pvt Ltd is thankful to Shri Mahesh Pandya, President, Vapi Industries
Association (VIA) and Shri Dilip Doshi, Hon. Secretary, Vapi Industries Association (VIA),
Vapi, for the support and co-operation extended, their valuable inputs, for identification of the
units for Energy Use and Technology Audit studies and in preparation of the Vapi Chemicals
& Dyes cluster manual.
We take this opportunity to express our appreciation for the excellent support provided by
various SME owners, local service providers, and equipment suppliers for their active
involvement and valuable inputs in making the studies successful and in completion of the
cluster manual.
Zenith Energy Services Pvt Ltd is also thankful to all the plant supervisors and workers of the
SME units for their support during the energy use and technology audit studies and in
implementation of the demonstration projects.
Zenith Energy Services Pvt. Ltd.
Hyderabad

Contents
List of Annexure vii
List of Tables vii
List of Figures viii
List of Abbreviation viii
Executive summary ix
About BEE’S SME program xi
1 INTRODUCTION ...................................................................................................... 1
1.1 About the Vapi chemicals and dyes cluster ............................................................... 1
1.1.1 Production process ................................................................................................... 1
1.2 Energy performance in vapi chemicals and dyes cluster ........................................... 4
1.2.1 Specific energy consumption of final product ............................................................ 4
1.3 Proposed equipment to be upgrade .......................................................................... 4
1.3.1 Description of existing equipment .............................................................................. 4
1.3.2 Role in process ......................................................................................................... 5
1.4 Establishing the baseline for the technology/equipment ............................................ 5
1.4.1 Design and operating parameter ............................................................................... 5
1.4.2 Electricity consumption ............................................................................................. 5
1.5.2 Financial Barrier ........................................................................................................ 6
1.5.3 Skilled manpower ..................................................................................................... 6
1.5.4 Other barrier (If any) ................................................................................................. 7
2 PROPOSED ENERGY EFFICIENT EQUIPMENT .................................................... 8
2.1 Detail description of technology ................................................................................. 8
2.1.1 Description of equipment .......................................................................................... 8
2.1.2 Availability of equipment ................................................................................................. 9
2.1.3 Service/equipment providers ..................................................................................... 9
2.1.4 Technology/equipment specification ....................................................................... 10

2.1.5 Justification of technology selected and suitability .................................................. 10
2.1.6 Superiority over existing system ............................................................................. 11
2.1.7 Terms and conditions in sales & service of VFD ..................................................... 11
2.1.8 Process down time during Implementation .............................................................. 11
2.2 Life cycle assesment and risk analysis .................................................................... 12
2.3 Suitable unit for implementation of proposed technology......................................... 12
3 ECONOMIC BENEFITS OF PROPOSED EUIPMENT ........................................... 13
3.1 Technical benefits ................................................................................................... 13
3.1.1 Fuel saving ............................................................................................................. 13
3.1.2 Electricity saving ..................................................................................................... 13
3.3 Social benefits ......................................................................................................... 14
3.2.1 Improvement in working environment ..................................................................... 14
3.2.2 Improvement in skill set of workers ......................................................................... 14
3.2.3 Impact on wages/emoluments ................................................................................ 14
3.4 Envirinmental benefit ............................................................................................... 14
3.4.1 Reduction in effluent generation ............................................................................. 14
3.4.2 Reduction in GHG emission such as CO2, NOx, etc ............................................... 14
3.3.3 Reduction in other emissions like Sox ..................................................................... 14
4 INSTALLATION OF PROPOSED EQUIPMENT ..................................................... 15
4.1 Cost of equipment implementation .......................................................................... 15
4.1.1 Cost of equipment ................................................................................................... 15
4.1.2 Other costs ............................................................................................................. 15
4.2 Arrangement of funds .............................................................................................. 15
4.2.1 Entrepreneur‟s contribution ..................................................................................... 15
4.2.2 Loan amount ........................................................................................................... 15
4.2.3 Terms & conditions of loan...................................................................................... 15
4.3 Financial indicators ................................................................................................. 16
4.3.1 Cash flow analysis .................................................................................................. 16

4.3.2 Simple payback period ............................................................................................ 16
4.3.3 Net Present Value (NPV) ........................................................................................ 16
4.3.4 Internal rate of return (IRR) ..................................................................................... 16
4.3.5 Return on investment (ROI) .................................................................................... 16
4.4 Sensitivity analysis .................................................................................................. 16
4.5 Procurement and Implementation schedule ............................................................ 17
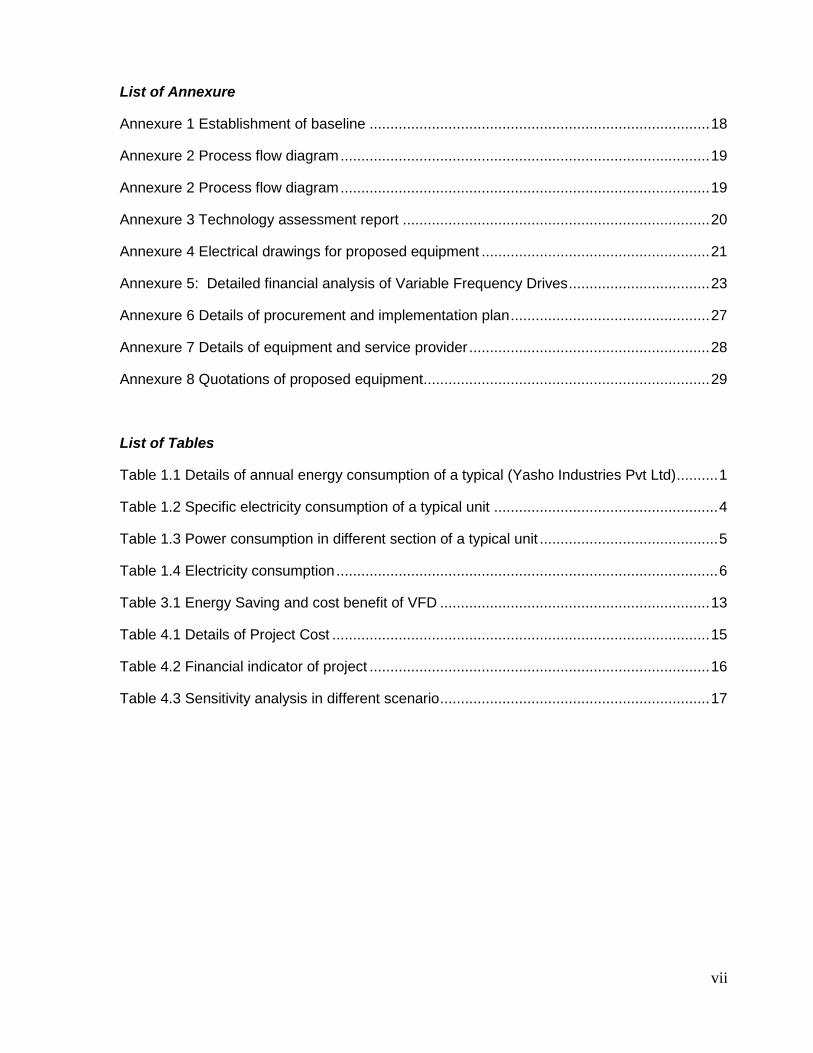
vii
List of Annexure
Annexure 1 Establishment of baseline .................................................................................. 18
Annexure 2 Process flow diagram ......................................................................................... 19
Annexure 2 Process flow diagram ......................................................................................... 19
Annexure 3 Technology assessment report .......................................................................... 20
Annexure 4 Electrical drawings for proposed equipment ....................................................... 21
Annexure 5: Detailed financial analysis of Variable Frequency Drives .................................. 23
Annexure 6 Details of procurement and implementation plan ................................................ 27
Annexure 7 Details of equipment and service provider .......................................................... 28
Annexure 8 Quotations of proposed equipment ..................................................................... 29
List of Tables
Table 1.1 Details of annual energy consumption of a typical (Yasho Industries Pvt Ltd) .......... 1
Table 1.2 Specific electricity consumption of a typical unit ...................................................... 4
Table 1.3 Power consumption in different section of a typical unit ........................................... 5
Table 1.4 Electricity consumption ............................................................................................ 6
Table 3.1 Energy Saving and cost benefit of VFD ................................................................. 13
Table 4.1 Details of Project Cost ........................................................................................... 15
Table 4.2 Financial indicator of project .................................................................................. 16
Table 4.3 Sensitivity analysis in different scenario ................................................................. 17

viii
List of Figures
Figure 1.1 Process flow chart of typical chemical & dye unit .................................................... 3
Figure 2.1 Variable frequency drive ......................................................................................... 8
List of Abbreviations
BEE Bureau of Energy Efficiency
DPR Detailed Project Report
DSCR Debt Service Coverage Ratio
FD Force Draft
GHG Green House Gas
ID Induced Draft
IRR Internal Rate of Return
kWh kilo Watt Hour
NPV Net Present Values
O&M Operational & Maintenance
PAT Profit After Tax
PBT Profit Before Tax
ROI Return on Investment
SIDBI Small Industries Development of India
SME Small and Medium Enterprises
VFD Variable Frequency Drives

ix
EXECUTIVE SUMMARY
Zenith Energy Services Pvt. Ltd is executing BEE - SME program in Vapi chemicals & dyes
cluster, supported by Bureau of Energy Efficiency with an overall objective of improving the
energy efficiency in cluster units.
Since Vapi cluster is one of the largest clusters in chemicals & dyes sector in India, accordingly
this cluster was chosen for energy efficiency improvements by implementing energy efficient
technologies, so as to facilitate maximum replication in other chemicals & dyes clusters in India.
Vapi chemicals & dyes cluster is famous for the production of Organic/Inorganic chemicals,
Specialty chemicals, Disperse dyes, Dye Intermediates, Reactive dyes, Acid dyes, Direct dyes
etc. In fact majority of the chemical units in the cluster are manufacturing two or three types of
products as per the demand for the products in the market.
During energy use and technology audit studies in various chemicals & dyes industries in Vapi
various chemicals & dyes cluster, it was observed that boiler, thermic fluid heaters, dryers,
cooling tower etc has fans and pumps. From energy use and technology gap audit studies in
various chemicals & dyes industries, it is observed that the flow if fan is controlled by mechanical
systems as per the requirement for all the fans and pumps are operated continuously at the high
speed than the requirement. Hence, it is proposed to installed variable frequency drives to
control the speed of fan and pumps as per the requirement.
This DPR highlights the details of the study conducted for assessing the potential for installation
of VFD on different load, possible energy saving, and its monetary benefit, availability of the
technologies/design, local service providers, technical features & proposed equipment
specifications, various barriers in implementation, environmental aspects, estimated GHG
reductions, capital cost, financial analysis, sensitivity analysis for three different scenarios and
schedule of Project Implementation
This bankable DPR also found eligible for subsidy scheme of MoMSME for “Technology and
Quality Upgradation Support to Micro, Small and Medium Enterprises” under “National
Manufacturing and Competitiveness Programme”. The key indicators of the DPR including the
Project cost, debt equity ratio, monetary benefit and other necessary parameters are given in
table:
S.No Parameter Unit Value
1 Project cost ` in lakh 2.83
2 Power saving kWh/year 70644
2 Monetary benefit ` in lakh 4.03

x
The projected profitability and financial indicators shows that the project will be able to earn profit
from inception and installation of VFD‟s for fans, pumps etc is financially viable and technically
feasible.
S.No Parameter Unit Value
3 Simple payback period years 0.70
4 NPV ` in lakh 6.47
5 IRR %age 112.59
6 ROI %age 48.73
7 DSCR ratio 5.16
8 Process down time during implementation Hrs 2-3
9 CO2 emission reduction Tons/annum 57
xi
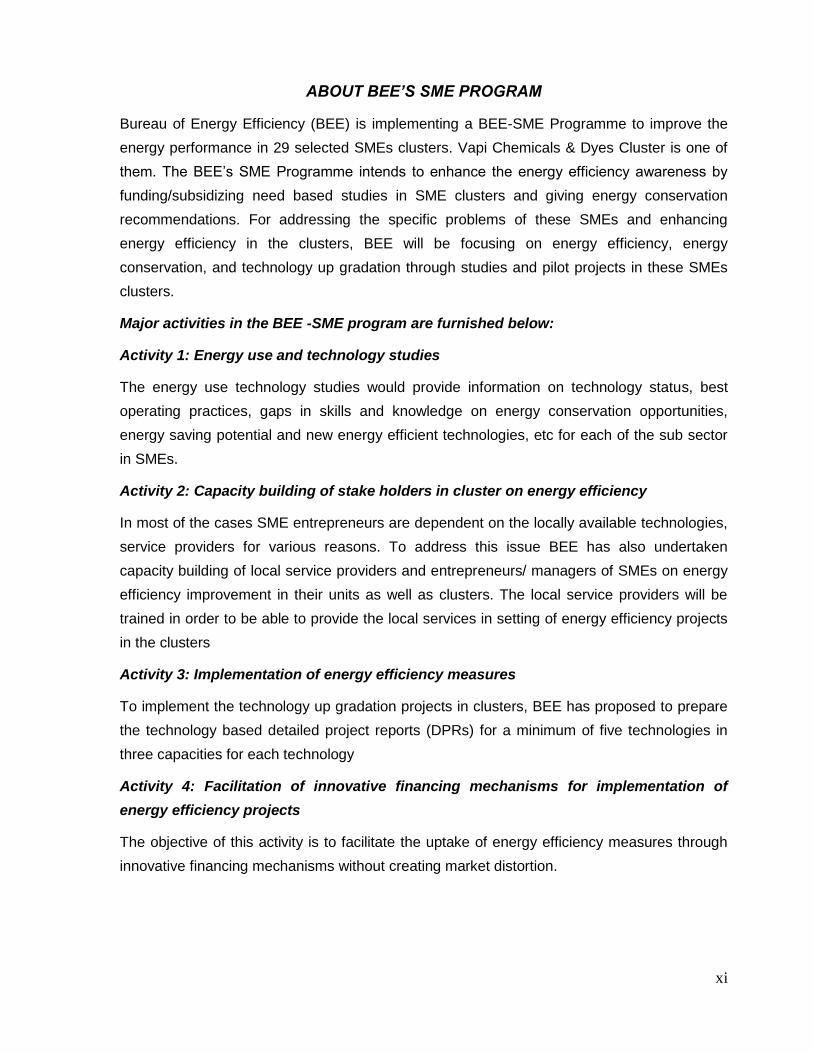
ABOUT BEE’S SME PROGRAM
Bureau of Energy Efficiency (BEE) is implementing a BEE-SME Programme to improve the
energy performance in 29 selected SMEs clusters. Vapi Chemicals & Dyes Cluster is one of
them. The BEE‟s SME Programme intends to enhance the energy efficiency awareness by
funding/subsidizing need based studies in SME clusters and giving energy conservation
recommendations. For addressing the specific problems of these SMEs and enhancing
energy efficiency in the clusters, BEE will be focusing on energy efficiency, energy
conservation, and technology up gradation through studies and pilot projects in these SMEs
clusters.
Major activities in the BEE -SME program are furnished below:
Activity 1: Energy use and technology studies
The energy use technology studies would provide information on technology status, best
operating practices, gaps in skills and knowledge on energy conservation opportunities,
energy saving potential and new energy efficient technologies, etc for each of the sub sector
in SMEs.
Activity 2: Capacity building of stake holders in cluster on energy efficiency
In most of the cases SME entrepreneurs are dependent on the locally available technologies,
service providers for various reasons. To address this issue BEE has also undertaken
capacity building of local service providers and entrepreneurs/ managers of SMEs on energy
efficiency improvement in their units as well as clusters. The local service providers will be
trained in order to be able to provide the local services in setting of energy efficiency projects
in the clusters
Activity 3: Implementation of energy efficiency measures
To implement the technology up gradation projects in clusters, BEE has proposed to prepare
the technology based detailed project reports (DPRs) for a minimum of five technologies in
three capacities for each technology
Activity 4: Facilitation of innovative financing mechanisms for implementation of
energy efficiency projects
The objective of this activity is to facilitate the uptake of energy efficiency measures through
innovative financing mechanisms without creating market distortion.

VFD for Refrigeration Plant, Cooling Towers, Boiler Fan & Centrifuges pump
1
1 INTRODUCTION
1.1 About the Vapi chemicals and dyes cluster
The products manufactured in Vapi Chemicals & Dyes Cluster are Organic/Inorganic
chemicals, Specialty chemicals, Disperse dyes, Dye Intermediates, Reactive dyes, Acid dyes,
Direct dyes etc. In fact majority of the chemical units in the cluster are manufacturing two or
three types of products as per the demand for the products in the market.
The raw material is different for the industries and depends on the product manufactured in
the respective industry.
The main energy forms used in the cluster units are Wood, Imported Coal, LDO, Furnace Oil,
Ground Nut Briquettes & Natural Gas as fuels for boilers, Thermopacs, Tray Dryers & Spray
Dryers. Electricity is used to run reactors, motors, pumps, centrifuges, blowers, fans & Air
Compressors etc.
The details of annual energy consumption of a typical unit engaged in the production of
Chemicals & Dyes are furnished in the Table 1.1 below:
Table 1.1 Details of annual energy consumption of a typical (Yasho Industries Pvt Ltd)
1.1.1 Production process
The process adopted by different units in the Vapi cluster varies with the type of product
manufactured in the unit. However, the general processes & operations involved in a typical
dyes & chemical manufacturing are as indicated below:
a) Raw material selection/ preparation
b) Preparation of solution
c) Precipitation
d) Filtration
e) Drying
f) Pulverization
g) Packing
Parameter Unit Value
Electricity consumption kWh/year 31,81,440
Natural gas consumption SCM/year 14,33,596
VFD for Refrigeration Plant, Cooling Towers, Boiler Fan & Centrifuges pump
2
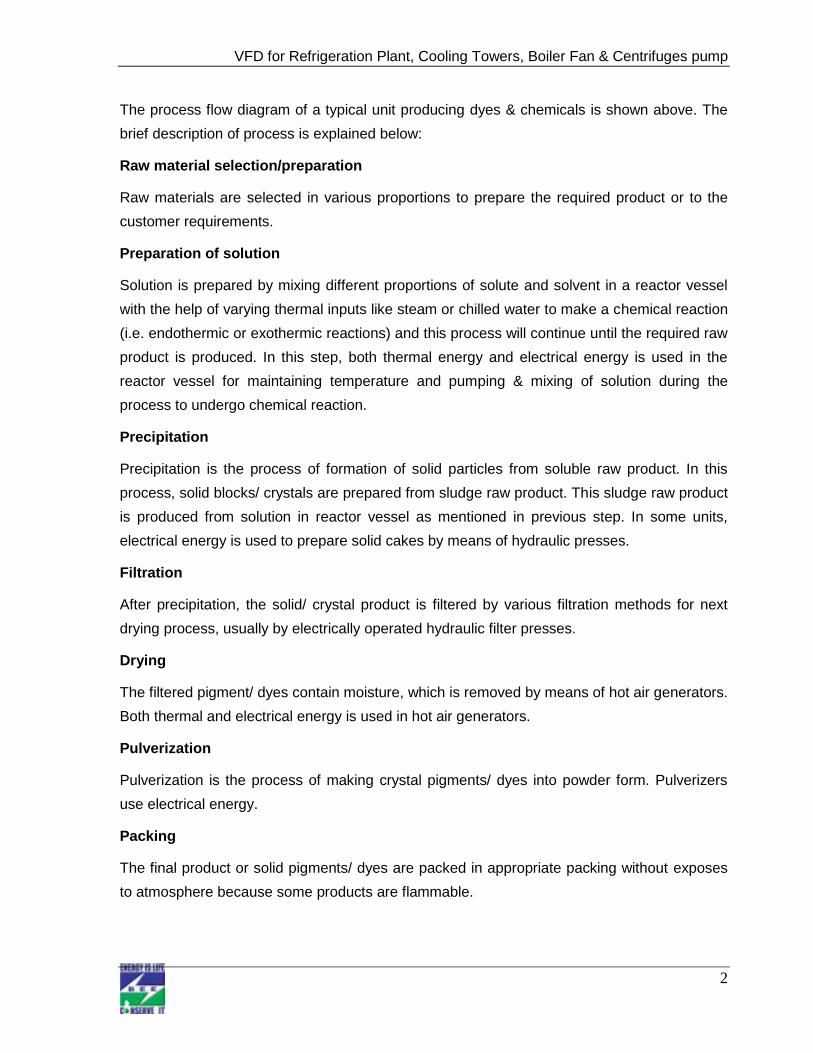
The process flow diagram of a typical unit producing dyes & chemicals is shown above. The
brief description of process is explained below:
Raw material selection/preparation
Raw materials are selected in various proportions to prepare the required product or to the
customer requirements.
Preparation of solution
Solution is prepared by mixing different proportions of solute and solvent in a reactor vessel
with the help of varying thermal inputs like steam or chilled water to make a chemical reaction
(i.e. endothermic or exothermic reactions) and this process will continue until the required raw
product is produced. In this step, both thermal energy and electrical energy is used in the
reactor vessel for maintaining temperature and pumping & mixing of solution during the
process to undergo chemical reaction.
Precipitation
Precipitation is the process of formation of solid particles from soluble raw product. In this
process, solid blocks/ crystals are prepared from sludge raw product. This sludge raw product
is produced from solution in reactor vessel as mentioned in previous step. In some units,
electrical energy is used to prepare solid cakes by means of hydraulic presses.
Filtration
After precipitation, the solid/ crystal product is filtered by various filtration methods for next
drying process, usually by electrically operated hydraulic filter presses.
Drying
The filtered pigment/ dyes contain moisture, which is removed by means of hot air generators.
Both thermal and electrical energy is used in hot air generators.
Pulverization
Pulverization is the process of making crystal pigments/ dyes into powder form. Pulverizers
use electrical energy.
Packing
The final product or solid pigments/ dyes are packed in appropriate packing without exposes
to atmosphere because some products are flammable.

VFD for Refrigeration Plant, Cooling Towers, Boiler Fan & Centrifuges pump
3
The detailed process flow diagram of a typical unit is furnished below.
Figure 1.1 Process flow chart of typical chemical & dye unit
Raw materials
Preparation of solution
(Reactor Vessels)
Precipitation
Filtration
Drying
Pulverization
Packing
Electrical and
Thermal Energy
Electrical Energy
Electrical Energy
Electrical and
Thermal Energy
Electrical and
Thermal Energy

VFD for Refrigeration Plant, Cooling Towers, Boiler Fan & Centrifuges pump
4
The production process as depicted above is similar for all chemical units in Vapi chemicals
and dyes cluster. However, depending on type of product and product quality, the above
stated process flow varies as per the requirement of the industry.
1.2 Energy performance in vapi chemicals and dyes cluster
The main energy sources for Vapi cluster units are Wood, Imported Coal, LDO, Furnace Oil,
Ground Nut Briquettes & Natural Gas as fuels for boilers, Thermopacs, Tray Dryers & Spray
Dryers. Electricity is used to run reactors, motors, pumps, centrifuges, blowers, fans & Air
Compressors etc.
Energy cost is around 8 to10 percent of manufacturing cost in typical manufacturing unit. In
typical manufacturing unit, the annual electricity and Natural gas consumption is 31,81,440
kWh and 14,33,596 SCM respectively.
1.2.1 Specific energy consumption of final product
Specific electrical and thermal energy consumption in chemical & dyes units depends on the
final product manufactured in that unit. However, as the units are producing number of
products, hence, the specific energy consumption could not evaluate.
The average specific fuel consumption per kg of the product for 3 typical units is furnished
below in Table 1.2.
Table 1.2 Specific electricity consumption of a typical unit
1.3 Proposed equipment to be upgrade
1.3.1 Description of existing equipment
During energy use and technology audit studies in various chemicals & dyes industries in
Vapi various chemicals & dyes cluster, it was observed that boiler, thermic fluid heaters,
dryers, cooling tower etc has fans.
S.No Name of unit
Electricity kWh/month
Production tonnes
Specific Electricity consumption
kWh/kg
1 M/s Hema Dye Chem Pvt Ltd 30,148 90 0.335
2 M/s Yasho Industries Pvt Ltd 2,65,120 ___ --
3 M/s Vapi Oxide Colours Pvt Ltd 24,418 80 0.305

VFD for Refrigeration Plant, Cooling Towers, Boiler Fan & Centrifuges pump
5
From energy use and technology gap audit studies in various chemicals & dyes industries, it
is observed that the flow is controlled by mechanical systems as per the requirement for all
the fans.
1.3.2 Role in process
For production of chemicals & dyes, the process requires steam and process equipments.
Thermic fluid heater and boiler are used for hot water generation having FD & ID fans for
supply of combustion air to boilers and thermic fluid heaters and removal of hot flue gas from
the boilers and thermic fluid heaters. Pumps are used in cooling tower and refrigeration units.
1.4 Establishing the baseline for the technology/equipment
Energy consumption in FD & ID fans would depend on load on boiler or thermic fluid heater,
percentage opening of mechanical dampers and operational & maintenance practices.
Whereas, energy consumption in pumps motors is depend on the load.
1.4.1 Design and operating parameter
Present electricity consumption in a typical unit having boiler, thermic fluid heater, CSS and
GL motors etc is 3,53,220 kWh at 50 - 60% damper openings. The details of the equipment
are furnished below in table 1.3 below:
Table 1.3 Power consumption in different section of a typical unit
S.No Equipment Rated
HP
Power input measured (kW)
1 Secondary Pump 30 22.5
2 Centrifuge 1 12.5 5.2
3 Centrifuge 2 12.5 5.3
4 Centrifuge 3 12.5 5.1
5 Boiler FD fan 10 4.61
6 Cooling Tower 1 Fan 7.5 6.01
7 Cooling Tower 2 Fan 7.5 6.02
1.4.2 Electricity consumption
Electricity consumption for three typical units in the cluster having boilers and thermic fluid
heaters and other equipments, where the flow of fans/pumps is controlled by mechanical
systems is furnished in Table 1.4 below:

VFD for Refrigeration Plant, Cooling Towers, Boiler Fan & Centrifuges pump
6
Table 1.4 Electricity consumption
1.5 Barriers for adoption of proposed equipment
1.5.1 Technological Barriers
The major technical barriers that prevented the implementation of variable frequency drives
are as follow:
Lack of awareness and information about the VFD and its benefit
Absence of local VFD supplier
The majority of the chemicals & dyes unit owners/entrepreneurs do not have in-depth
technical expertise, knowledge or training about energy efficiency, and are dependent
on local technology suppliers or service companies, whom they normally rely for
established and commonly used technology.
The lack of technical know-how makes it difficult for the chemicals & dyes unit owners
to identify the most effective technical measures.
1.5.2 Financial Barrier
The SME owners in the cluster have limited financial strength and hence owners would not
like to take the risk and invest in energy efficiency measures.
The owners don‟t have knowledge on the financial benefits of the VFD‟s and its
attractiveness. However, the financial attractiveness of the project activity may motivate the
owners to move forward in taking up initiatives in energy conservation and efficiency.
1.5.3 Skilled manpower
The non-availability of skilled manpower having awareness about energy efficiency and
related issues in the cluster is one of the major barriers. Though, the skilled manpower is
available in the cluster, they are not aware of energy conservation/efficiency and its
S.No. Name of unit Unit Value
1 M/s Yasho Industries Pvt Ltd kWh/year 3,53,220
2 M/s Hema Dye Chem. Pvt Ltd kWh/year 1,08,000
3 M/s Vapi Oxide Colors Pvt Ltd kWh/year 54,000

VFD for Refrigeration Plant, Cooling Towers, Boiler Fan & Centrifuges pump
7
importance. Their prime responsibility of worker is to maintain machines and ensure
uninterrupted production by minimizing down time as per the targets set by the management.
Specialized training with the local service providers for better operation and maintenance of
the equipments, importance of energy use and conservation will create awareness among
workforce thereby enhancing their skill set about efficient use of energy and its conservation.
1.5.4 Other barrier (If any)
Absence of clean environment in the plant and VFD‟s require clean environment for
uninterrupted operation. The suitable location with clean environment is to be identified for
installing VFD‟s

VFD for Refrigeration Plant, Cooling Towers, Boiler Fan & Centrifuges pump
8
2 PROPOSED ENERGY EFFICIENT EQUIPMENT
2.1 Detail description of technology
2.1.1 Description of equipment
In Indian industries more than 50% of the total electrical energy consumption is used by
rotating equipment. Out of which 65% of this is consumed by centrifugal or flow related
applications such as fans, blowers, compressors, and pumps. By using Variable Frequency
Drive (VFD) technology the advantage gained in both productivity improvements and
reduction in energy consumption has been widely documented in the past few years. For
example, by lowering fan or pump speed by 15% to 20%, shaft power can be reduced by as
much as 20-30%. The main purpose of variable speed drives is to reduce energy costs and
prolong the life of equipment by adjusting motor speed to meet load requirements
Variable Frequency Drive
A variable frequency drive is an electronic controller that adjusts the speed of an electric
motor by regulating the power being delivered. Variable-frequency drives provide continuous
control, matching motor speed to the specific demands of the work being performed. Variable-
frequency drives are an excellent choice for adjustable-speed drive users because they allow
operators to fine-tune processes while reducing costs for energy and equipment
maintenance.
Figure 2.1 Variable frequency drive

VFD for Refrigeration Plant, Cooling Towers, Boiler Fan & Centrifuges pump
9
Working Principle
Single-speed drives start motors abruptly, subjecting the motor to high torque and current
surges up to 10 times the full-load current. Variable frequency drives offer a soft start,
gradually ramping up a motor to operating speed. VFD minimizes the mechanical and
electrical stress on the motors and can reduce maintenance and repair costs and extend the
motor life.
Energy savings from variable-frequency drives can be significant. For example with
centrifugal fan even a small reduction in motor speed can reduce fans energy use by as much
as 50%. For example a 25 hp motor running 23 hours per day (2 hours at 100% speed; 8
hours at 75%: 8 hours at 67%; and 5 hours at 50%) a variable frequency drives can reduce
energy use by 45%. Because benefits vary depending on operating speed of the system
hence it is important to calculate benefits for each application before specifying a variable
frequency drive.
In Vapi chemicals and dyes cluster units, the flow of the fans is controlled by mechanical
dampers. If the flow can be controlled by reducing the speed of the fan‟s motor according to
the requirement this would offer a more efficient means of achieving flow control of air. In fact
the saving is greater than that might initially be expected by mechanical damper. As the
speed of the fan is reduced, the flow will reduce partially, while the power required by the fan
reduces with the cube of the speed.
The mechanical damper for control of the flow may reduce the load on the motor/fan/pump
motor, but the constriction itself is an energy loss, which is obviously an inefficient technique.
If the flow or speed can be controlled by reducing the speed of motor, this would offer a more
efficient means of achieving flow control.
Considering the above facts and for reducing electricity consumption in the present boilers
and thermic fluid heaters, it is suggested to install VFD for ID fans and for pumps also.
2.1.2 Availability of equipment
The VFD suppliers are available in the Vapi and Vadodara. M/s Tangent Technologies are
available in the local area and the details are furnished in Annexure 7.
2.1.3 Service/equipment providers
The details of the service/ equipment providers are furnished in Annexure 7.

VFD for Refrigeration Plant, Cooling Towers, Boiler Fan & Centrifuges pump
10
2.1.4 Technology/equipment specification
The details of the technical specifications of VFD‟s are provided below
Power Rating: 5.5 kW / 7.5 HP
Protection class of VSCP-5R5T4
Sensor less vector control
Overload duty:150% for 2 minutes
50 oC Ambient
Power Rating: 7.5 kW / 10 HP
Protection class of VSCP-7R5T4
Sensor less vector control
Overload duty:150% for 2 minutes
50 oC Ambient
Power Rating: 9.25 kW / 12.5 HP
Protection class of VSCP-9R5T4
Sensor less vector control
Overload duty:150% for 2 minutes
50 oC Ambient
Power Rating: 22 kW / 30 HP
Protection class of VSCP- 022T4
Sensor less vector control
Overload duty:150% for 2 minutes
50 oC Ambient
2.1.5 Justification of technology selected and suitability
As discussed above, controlling the flow of fans and pumps by mechanical damper is
inefficient and consumes more power. If the flow is controlled by reducing the speed of the
fan‟s/pumps‟s motor this would offer a more efficient means of achieving flow control. In fact
the saving is greater than that might initially be expected. As the speed of the fan/pump is
reduced, the flow will reduce partially, while the power required by the fan/pump reduces with
VFD for Refrigeration Plant, Cooling Towers, Boiler Fan & Centrifuges pump
11
the cube of the speed. Proposed technology is completely suitable with existing system for
control of flow.
2.1.6 Superiority over existing system
The installation of VFD for fans has the following advantages:
Reduction in breakdowns and smooth start
Reduction in motor burning
Improved life of the motor and increased production
Reduction in production cost and maintenance cost due to frequent failures of belts,
bearings breakages
Improved power factor (0.98 across speed range)
Maximize power distribution system
Reduced inrush current
Minimize peak demand charges
Eliminates mechanical shock and stress on power train (couplings, belts, drive shafts,
gear boxes, etc.)
Reduce Utility operating costs
Allows Load Shedding
May qualify for utility rebates due increase in power factor
Controlled acceleration and deceleration
Eliminates Motor Voltage Imbalance
2.1.7 Terms and conditions in sales & service of VFD
There is no specific term and condition in sales & service of VFD however a general term &
condition of supplier is given at annexure 7.
2.1.8 Process down time during Implementation
No process down time is envisaged as installation of VFD will take 2 to 3 hours for
installation.

VFD for Refrigeration Plant, Cooling Towers, Boiler Fan & Centrifuges pump
12
2.2 Life cycle assesment and risk analysis
Life cycle of VFD is considered as 15 years. Actual capacity and suitable location are two
improtant point must be considerd before instalation of VFD.
2.3 Suitable unit for implementation of proposed technology
The proposed VFD is selected based on the rated capacity of the motors installed for blowers,
pumps and others etc.

VFD for Refrigeration Plant, Cooling Towers, Boiler Fan & Centrifuges pump
13
3 ECONOMIC BENEFITS OF PROPOSED EUIPMENT
3.1 Technical benefits
3.1.1 Fuel saving
No fuel saving is possible by the implementation of the project activity.
3.1.2 Electricity saving
The present utilization capacity of the ID fan flow is only 50% of the rated flow of the fan and
the flow is controlled by mechanical dampers. The flow can also be controlled by monitoring
the motor RPM also. It is well known fact that, a 10% reduction in RPM of the motor will
reduce the motor power consumption by 25%. For assessing the savings, under worst
scenario, a 10% flow reduction is considered for avoiding the other consequences like
overheating boiler and Thermopac and cooling tower also etc. Hence, only 20% power
savings is assumed by installing a VFD for various motors. The details of savings due to
installation of VFD‟s is furnished below:
Table 3.1 Energy Saving and cost benefit of VFD
S.No. Parameter Unit Value
1 Present power consumption in different load kWh/year 353220
2 Proposed power consumption kWh/year 282576
3 Annual savings kWh 70,644
4 Cost of electricity `/kWh 5.7
5 Monetary savings ` in lakh 4.03
.3.1.3 Improvement in product quality
Product quality achieved would be same as the present quality. It does not have any impact in
improving the quality of the product.
3.1.4 Increase in production
The proposed equipment does not contribute to any increase in production.
3.1.5 Reduction in raw material consumption
Raw material consumption is same even after the implementation of proposed technology.

VFD for Refrigeration Plant, Cooling Towers, Boiler Fan & Centrifuges pump
14
3.2 Monetary benefits
The monetary benefit due to installation of VFD for various motor is estimated as ` 4.03 lakh
per annum due to reduction in electricity consumption. Details are shown in above table 3.1.
3.3 Social benefits
3.2.1 Improvement in working environment
As installation of VFD eliminates Mechanical shock and stress on couplings, belts, drive
shafts, gear boxes, etc., this may lessen the breakdowns and working environment may
improved.
3.2.2 Improvement in skill set of workers
The technology selected for the implementation is new and energy efficient. The technology
implemented will create awareness among the workforce about energy saving.
3.2.3 Impact on wages/emoluments
No impact on wages or emolument of workers.
3.4 Envirinmental benefit
3.4.1 Reduction in effluent generation
The effluent generation due to implementation of the project activity is insignificant.
3.4.2 Reduction in GHG emission such as CO2, NOx, etc
The major GHG emission reduction source is CO2 and the technology will reduce electricity
consumption of 70644 kW/year. The total emission reductions are estimated at 57 tons of
CO2 per annum due to implementation of the project activity.
3.3.3 Reduction in other emissions like Sox
No significant impact on SOx emissions.

VFD for Refrigeration Plant, Cooling Towers, Boiler Fan & Centrifuges pump
15
4 INSTALLATION OF PROPOSED EQUIPMENT
4.1 Cost of equipment implementation
4.1.1 Cost of equipment
The cost of VFD‟s for the selected motors is estimated at `.2.43 lakhs, which includes VFD‟s,
Panel, switches and cabling.
4.1.2 Other costs
Other cost includes erection & commissioning charges, applicable taxes and misc. cost etc. A
detail of project cost is given in table 4.1 below:
Table 4.1 Details of Project Cost
S.No Particular Cost ( ` in lakh)
1 Equipment and machinery 2.43
2 Applicable taxes 0.25
3 Erection & Commissioning 0.05
4 Misc cost 0.10
5 Total 2.83
4.2 Arrangement of funds
4.2.1 Entrepreneur’s contribution
The total cost of the proposed technology is estimated at `2.83 lakh. The entrepreneur‟s
contribution is 25% of total project cost, which is `0.71 lakh.
4.2.2 Loan amount
The term loan is 75% of the total project, which is `2.12 lakh.
4.2.3 Terms & conditions of loan
The interest rate is considered at 10.00% which is normal Lending rate for energy efficiency
projects. The loan tenure is assumed 5 years and the moratorium period is 6 months.

VFD for Refrigeration Plant, Cooling Towers, Boiler Fan & Centrifuges pump
16
4.3 Financial indicators
4.3.1 Cash flow analysis
Considering the above mentioned assumptions, the net cash accruals starting with `3.11 lakh
in the first year operation and gradually increases to `18.64 lakh at the end of eighth year.
4.3.2 Simple payback period
The total project cost of the proposed technology is `2.83 lakh and monetary savings due to
reduction in electricity consumption is ` 4.03 lakh and the simple payback period works out to
be 0.7 years (9 months).
4.3.3 Net Present Value (NPV)
The Net present value of the investment at 10.00% works out to be `11.82 lakh.
4.3.4 Internal rate of return (IRR)
The after tax Internal Rate of Return of the project works out to be 108.18% thus the project is
financially viable.
4.3.5 Return on investment (ROI)
The average return on investment of the project activity works out at 30.08%.
Table 4.2 Financial indicator of project
S. No Particulars Unit Value
1 Simple Pay Back period months 9
2 IRR %age 108.18
3 NPV lakh 11.82
4 ROI %age 30.08
5 DSCR ratio 5.63
4.4 Sensitivity analysis
A sensitivity analysis has been carried out to ascertain how the project financials would
behave in different situations like there is an increase in electricity savings or decrease in
electricity savings. For the purpose of sensitive analysis, two scenarios are considered are.

VFD for Refrigeration Plant, Cooling Towers, Boiler Fan & Centrifuges pump
17
Increase in power savings by 5%
Decrease in power savings by 5%
In each scenario, other inputs are assumed as constant. The financial indicators in each of
the above situation are indicated along with standard indicators.
Details of sensitivity analysis for different scenario are furnished in Table 4.3 below:
Table 4.3 Sensitivity analysis in different scenario
Particulars IRR NPV ROI DSCR
Normal 108.18% 11.82 30.08% 5.63
5% increase in power savings 113.24% 12.53 30.25% 5.90
5% decrease in power savings 103.09% 11.11 29.89 5.35
4.5 Procurement and Implementation schedule
The project is expected to be completed in 1 week from the date of financial closure. The
detailed schedule of project implementation is furnished in Annexure 6.

VFD for Refrigeration Plant, Cooling Towers, Boiler Fan & Centrifuges pump
18
Annexure 1 Establishment of baseline
YASHO INDUSTRIES PVT. LTD
S.No. Details Unit Value
1 No of operating hours hr 20
2 No of operating days days 350
3 Power consumption in various motors kWh/hr 50.46
4 Power consumption kWh/day 1009.2
5 Power consumption kWh/year 3,53,220
S.No Equipment Rated HP Power input measured (kW)
1 Secondary Pump 30 22.5
2 Centrifuge 1 12.5 5.2
3 Centrifuge 2 12.5 5.3
4 Centrifuge 3 12.5 5.43
6 Cooling Tower 1 Fan 7.5 6.01
8 Cooling Tower 2 Fan 7.5 6.02
10 Total 82.5 50.46

VFD for Refrigeration Plant, Cooling Towers, Boiler Fan & Centrifuges pump
19
Annexure 2 Process flow diagram
Yarn
PACKING
REACTOR VESSELS
PRODUCT 1
NUTCH FILTER
REACTOR VESSELS
NUTCH FILTER
SEPERATION
REACTION
FILTER DRYING PULVERIZING
PRECIPITATOR
FILTER
PRODUCT 2
DRYING
PULVERIZING
PACKING
Electrical and Thermal Energy
Electrical and Thermal Energy
Electrical and Thermal Energy
Electrical and Thermal Energy

VFD for Refrigeration Plant, Cooling Towers, Boiler Fan & Centrifuges pump
20
Annexure 3 Technology assessment report
S.No. Parameter Unit Value
1 Total power input of the motors selected for VFD’s kW 50.46
2 Operational hours hours/day 20
3 Operational days per annum days/annum 350
4 Expected power savings % 20%
5 Annual savings kWh 70,644
6 Cost of electricity `/kWh 5.75
7 Monetary savings ` in lakh 4.03
8 Investment ` in lakh 2.83
9 payback period years 0.70

VFD for Refrigeration Plant, Cooling Towers, Boiler Fan & Centrifuges pump
21
Annexure 4 Electrical drawings for proposed equipment
Major civil works is not required for the technology hence no drawings are furnished

VFD for Refrigeration Plant, Cooling Towers, Boiler Fan & Centrifuges pump
22

VFD for Refrigeration Plant, Cooling Towers, Boiler Fan & Centrifuges pump
23
Annexure 5: Detailed financial analysis of Variable Frequency Drives
Assumptions
Assumption
Name of the Technology Variable Frequency Drive
Rated Capacity
Details Unit Value Basis
No of working days Hrs 20
Total operating days Days 350
Proposed Investment
Plant & Machinery ` (in lakh) 3.12
Erection & Commissioning ` (in lakh) 0.35
Applicable taxes ` (in lakh) 0.22
Misc. cost ` (in lakh) 0.10
Total Investment ` (in lakh) 2.83
Financing pattern
Own Funds (Equity) ` (in lakh) 0.71 Feasibility Study
Loan Funds (Term Loan) ` (in lakh) 2.12 Feasibility Study
Loan Tenure years 5 Assumed
Moratorium Period Months 6 Assumed
Repayment Period Months 66 Assumed
Interest Rate % 10.00% SIDBI Lending rate
Estimation of Costs
O & M Cost % on Plant & Equip 5 Feasibility Study
Annual Escalation % 5 Feasibility Study
Estimation of Revenue
Power Saving KWh 70644
Cost `/KWh 5.7
St. line Depn. %age 5.28 Indian Companies Act
IT Depreciation %age 80.00 Income Tax Rules
Income Tax %age 33.99 Income Tax
Estimation of Interest on Term Loan (` in lakh)
Years Opening Balance Repayment Closing Balance Interest 1 2.12 0.06 2.06 0.25 2
2.06 0.24 1.82 0.20 3
1.82 0.36 1.46 0.17 4
1.46 0.48 0.98 0.12 5
0.98 0.60 0.38 0.07 6
0.38 0.38 0.00 0.01
2.12

VFD for Refrigeration Plant, Cooling Towers, Boiler Fan & Centrifuges pump
24
WDV Depreciation
Particulars / years 1 2
Plant and Machinery
Cost 2.83 0.57
Depreciation 2.26 0.45
WDV 0.57 0.11
Projected Profitability ` in lakh
Particulars / Years 1 2 3 4 5 6 7 8
Revenue through Savings
Power savings 4.03 4.03 4.03 4.03 4.03 4.03 4.03 4.03
Total Revenue (A) 4.03 4.03 4.03 4.03 4.03 4.03 4.03 4.03
Expenses
O & M Expenses 0.14 0.15 0.16 0.16 0.17 0.18 0.19 0.20
Total Expenses (B) 0.14 0.15 0.16 0.16 0.17 0.18 0.19 0.20
PBDIT (A)-(B) 3.89 3.88 3.87 3.86 3.85 3.85 3.84 3.83
Interest 0.25 0.20 0.17 0.12 0.07 0.01 0.00 0.00
PBDT 3.64 3.68 3.70 3.74 3.78 3.83 3.84 3.83
Depreciation 0.15 0.15 0.15 0.15 0.15 0.15 0.15 0.15
PBT 3.49 3.53 3.56 3.59 3.63 3.68 3.69 3.68
Income tax 0.47 1.10 1.26 1.27 1.29 1.30 1.30 1.30
Profit after tax (PAT) 3.02 2.44 2.30 2.32 2.35 2.38 2.38 2.38
Computation of Tax ` (in lakh)
Particulars / Years 1 2 3 4 5 6 7 8
Profit before tax 3.49 3.53 3.56 3.59 3.63 3.68 3.69 3.68
Add: Book depreciation 0.15 0.15 0.15 0.15 0.15 0.15 0.15 0.15
Less: WDV depreciation 2.26 0.45 - - - - - -
Taxable profit 1.37 3.23 3.70 3.74 3.78 3.83 3.84 3.83
Income Tax 0.47 1.10 1.26 1.27 1.29 1.30 1.30 1.30
Projected Balance Sheet ` (in lakh)
Particulars / Years 1 2 3 4 5 6 7 8
Liabilities
Share Capital (D) 0.71 0.71 0.71 0.71 0.71 0.71 0.71 0.71
Reserves & Surplus (E) 3.02 5.46 7.75 10.07 12.42 14.80 17.18 19.56
Term Loans (F) 2.06 1.82 1.46 0.98 0.38 0.00 0.00 0.00
Total Liabilities D)+(E)+(F) 5.79 7.99 9.92 11.76 13.51 15.51 17.89 20.27
Assets
Gross Fixed Assets 2.83 2.83 2.83 2.83 2.83 2.83 2.83 2.83
Less: Accm. Depreciation 0.15 0.30 0.45 0.60 0.75 0.90 1.05 1.20
Net Fixed Assets 2.68 2.53 2.38 2.23 2.08 1.93 1.78 1.63
Cash & Bank Balance 3.11 5.46 7.54 9.53 11.43 13.58 16.11 18.64
Total Assets 5.79 7.99 9.92 11.76 13.51 15.51 17.89 20.27
Net Worth 3.73 6.16 8.46 10.78 13.13 15.51 17.89 20.27
Dept equity ratio 2.92 2.58 2.07 1.39 0.54 0.00 0.00 0.00

VFD for Refrigeration Plant, Cooling Towers, Boiler Fan & Centrifuges pump
25
Projected Cash Flow: ` (in lakh)
Particulars / Years 0 1 2 3 4 5 6 7 8
Sources
Share Capital 0.71 - - - - - - - -
Term Loan 2.12 Profit After tax
3.02 2.44 2.30 2.32 2.35 2.38 2.38 2.38
Depreciation
0.15 0.15 0.15 0.15 0.15 0.15 0.15 0.15
Total Sources 2.83 3.17 2.58 2.45 2.47 2.50 2.53 2.53 2.53
Application
Capital Expenditure 2.83 Repayment of Loan - 0.06 0.24 0.36 0.48 0.60 0.38 0.00 0.00
Total Application 2.83 0.06 0.24 0.36 0.48 0.60 0.38 0.00 0.00
Net Surplus - 3.11 2.34 2.09 1.99 1.90 2.15 2.53 2.53
Add: Opening Balance - - 3.11 5.46 7.54 9.53 11.43 13.58 16.11
losing Balance - 3.11 5.46 7.54 9.53 11.43 13.58 16.11 18.64
Calculation of Internal Rate of Return
` (in lakh) Particulars / months 0 1 2 3 4 5 6 7 8
Profit after Tax
3.02 2.44 2.30 2.32 2.35 2.38 2.38 2.38
Depreciation
0.15 0.15 0.15 0.15 0.15 0.15 0.15 0.15
Interest on Term Loan
0.25 0.20 0.17 0.12 0.07 0.01 - -
Cash outflow (2.83) - - - - - - - -
Net Cash flow (2.83) 3.42 2.78 2.61 2.59 2.57 2.54 2.53 2.53
IRR 108.18%
NPV 11.82
Break Even Point ` (in lakh)
Particulars / Years 1 2 3 4 5 6 7 8
Variable Expenses
Oper. & Maintenance Exp (75%) 0.11 0.11 0.12 0.12 0.13 0.14 0.14 0.15
Sub Total (G) 0.11 0.11 0.12 0.12 0.13 0.14 0.14 0.15
Fixed Expenses
Oper. & Maintenance Exp (25%) 0.04 0.04 0.04 0.04 0.04 0.05 0.05 0.05 Interest on Term Loan 0.25 0.20 0.17 0.12 0.07 0.01 0.00 0.00
Depreciation (H) 0.15 0.15 0.15 0.15 0.15 0.15 0.15 0.15 Sub Total (I) 0.43 0.38 0.35 0.31 0.26 0.21 0.20 0.20
Sales (J) 4.03 4.03 4.03 4.03 4.03 4.03 4.03 4.03
Contribution (K) 3.92 3.92 3.91 3.90 3.90 3.89 3.88 3.88
Break Even Point (L= G/I) 11.02% 9.75% 9.06% 8.06% 6.76% 5.31% 5.07% 5.14%
Cash Break Even {(I)-(H)} 7.20% 5.94% 5.24% 4.24% 2.93% 1.47% 1.22% 1.28%
Break Even Sales (J)*(L) 0.44 0.39 0.36 0.32 0.27 0.21 0.20 0.21
VFD for Refrigeration Plant, Cooling Towers, Boiler Fan & Centrifuges pump
26
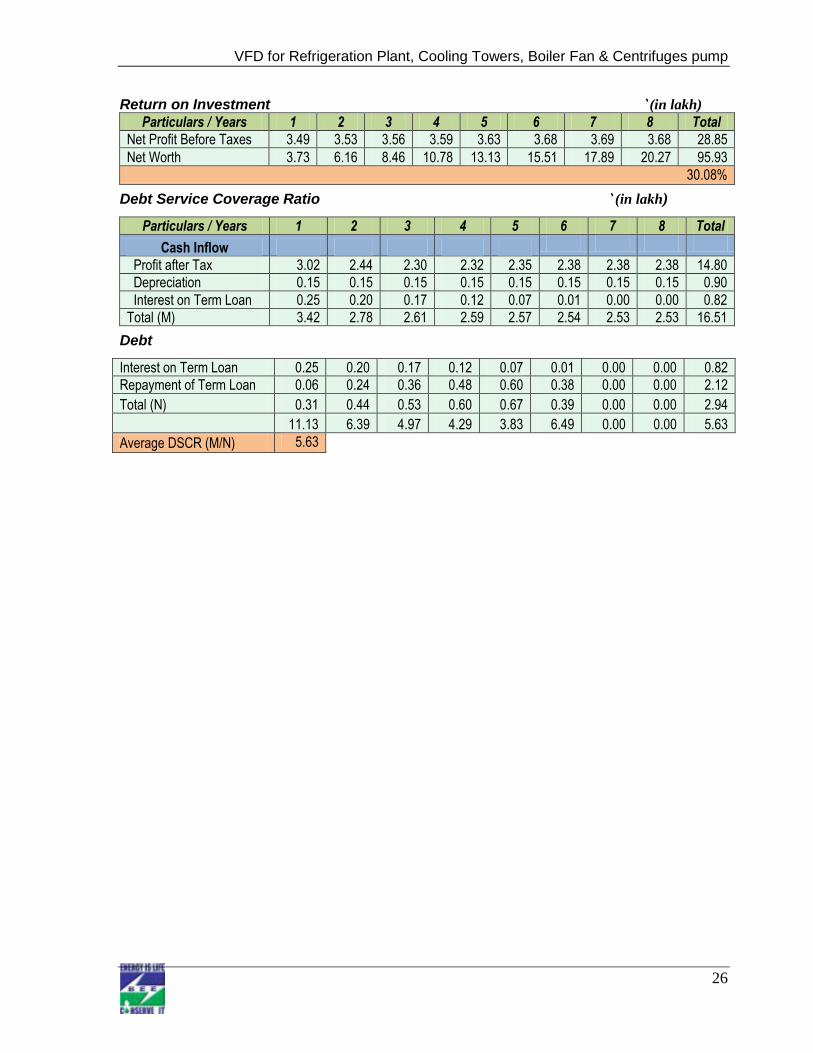
Return on Investment ` (in lakh) Particulars / Years 1 2 3 4 5 6 7 8 Total
Net Profit Before Taxes 3.49 3.53 3.56 3.59 3.63 3.68 3.69 3.68 28.85
Net Worth 3.73 6.16 8.46 10.78 13.13 15.51 17.89 20.27 95.93
30.08%
Debt Service Coverage Ratio ` (in lakh)
Particulars / Years 1 2 3 4 5 6 7 8 Total
Cash Inflow
Profit after Tax 3.02 2.44 2.30 2.32 2.35 2.38 2.38 2.38 14.80
Depreciation 0.15 0.15 0.15 0.15 0.15 0.15 0.15 0.15 0.90
Interest on Term Loan 0.25 0.20 0.17 0.12 0.07 0.01 0.00 0.00 0.82
Total (M) 3.42 2.78 2.61 2.59 2.57 2.54 2.53 2.53 16.51
Debt
Interest on Term Loan 0.25 0.20 0.17 0.12 0.07 0.01 0.00 0.00 0.82
Repayment of Term Loan 0.06 0.24 0.36 0.48 0.60 0.38 0.00 0.00 2.12
Total (N) 0.31 0.44 0.53 0.60 0.67 0.39 0.00 0.00 2.94
11.13 6.39 4.97 4.29 3.83 6.49 0.00 0.00 5.63
Average DSCR (M/N) 5.63

VFD for Refrigeration Plant, Cooling Towers, Boiler Fan & Centrifuges pump
27
Annexure 6 Details of procurement and implementation plan
Project Implementation Schedule
Placement of Orders for
Equipment
Step 1
Supply of VFD’s
Step 2
Installation and trial runs
Step 3
5 days
1 day
1day
7 days TOTAL
Period
VFD for Refrigeration Plant, Cooling Towers, Boiler Fan & Centrifuges pump
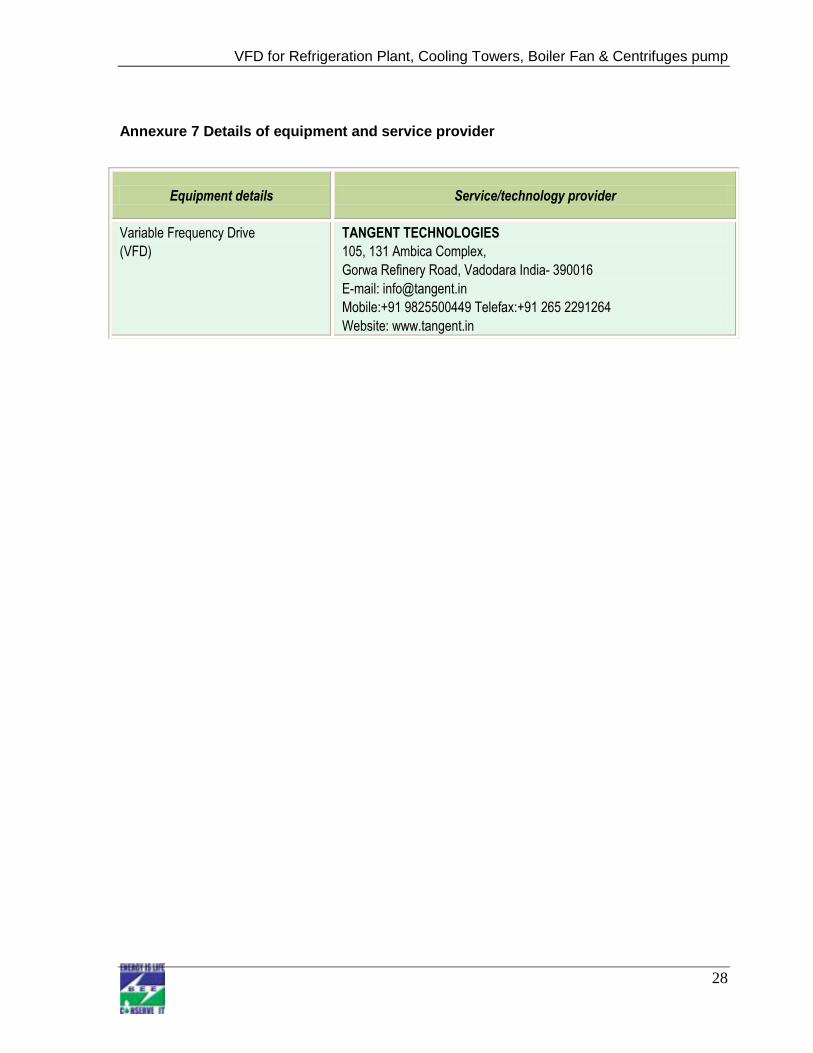
28
Annexure 7 Details of equipment and service provider
Equipment details Service/technology provider
Variable Frequency Drive
(VFD)
TANGENT TECHNOLOGIES
105, 131 Ambica Complex,
Gorwa Refinery Road, Vadodara India- 390016
E-mail: [email protected]
Mobile:+91 9825500449 Telefax:+91 265 2291264
Website: www.tangent.in

VFD for Refrigeration Plant, Cooling Towers, Boiler Fan & Centrifuges pump
29
Annexure 8 Quotations of proposed equipment

VFD for Refrigeration Plant, Cooling Towers, Boiler Fan & Centrifuges pump
30
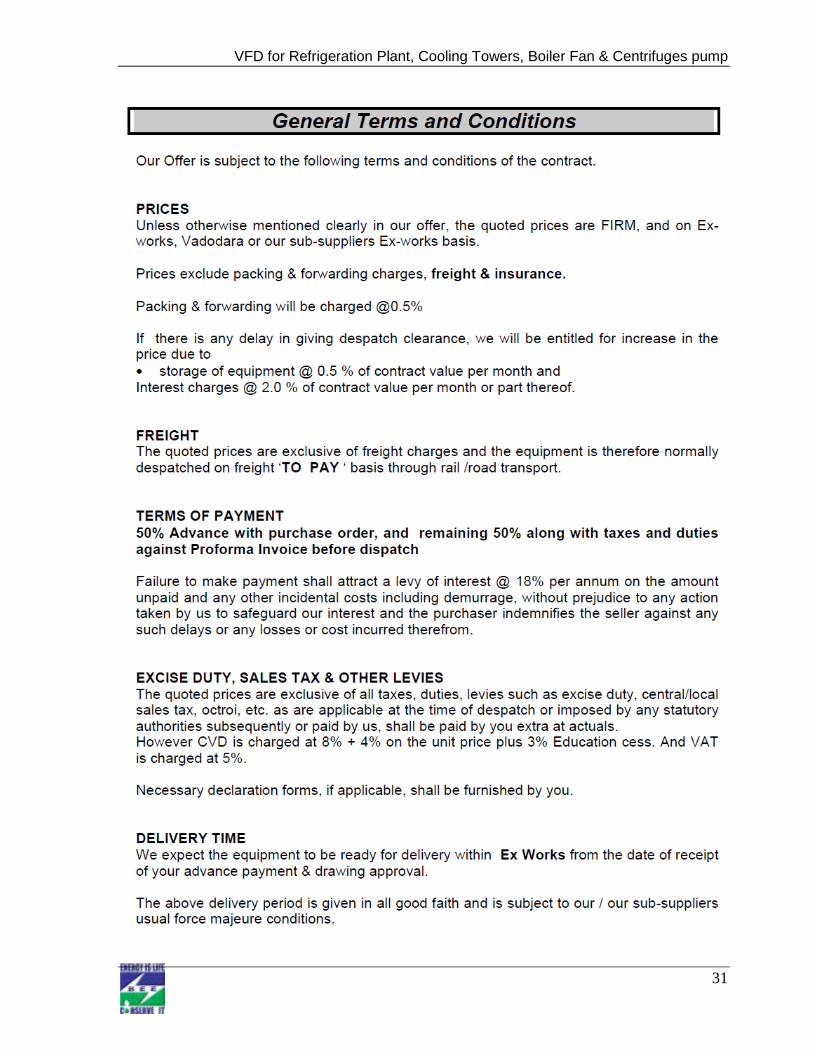
VFD for Refrigeration Plant, Cooling Towers, Boiler Fan & Centrifuges pump
31

VFD for Refrigeration Plant, Cooling Towers, Boiler Fan & Centrifuges pump
32

VFD for Refrigeration Plant, Cooling Towers, Boiler Fan & Centrifuges pump
33

Bureau of Energy Efficiency (BEE) (Ministry of Power, Government of India) 4th Floor, Sewa Bhawan, R. K. Puram, New Delhi – 110066 Ph.: +91 – 11 – 26179699 (5 Lines), Fax: +91 – 11 – 26178352
Websites: www.bee-india.nic.in, www.energymanagertraining.com
Zenith Energy Services Pvt. Ltd 10-5-6/B, My Home Plaza, Masab Tank HYDERABAD, AP 500 028 Phone: 040 23376630, 31, Fax No.040 23322517
Website: www.zenithenergy.com
India SME Technology Services Ltd DFC Building, Plot No.37-38, D-Block, Pankha Road, Institutional Area, Janakpuri, New Delhi-110058 Tel: +91-11-28525534, Fax: +91-11-28525535 Website: www.techsmall.com