DETAILED PROJECT REPORT LIQUID MILK UNIT UNDER ...
25
DETAILED PROJECT REPORT LIQUID MILK UNIT UNDER PMFME SCHEME National Institute of Food Technology Entrepreneurship and Management Ministry of Food Processing Industries Plot No.97, Sector-56, HSIIDC, Industrial Estate, Kundli, Sonipat, Haryana-131028 Website: http://www.niftem.ac.in Email: [email protected] Call: 0130-2281089
-
Upload
khangminh22 -
Category
Documents
-
view
8 -
download
0
Transcript of DETAILED PROJECT REPORT LIQUID MILK UNIT UNDER ...

DETAILED PROJECT REPORT
LIQUID MILK UNIT
UNDER PMFME SCHEME
National Institute of Food Technology Entrepreneurship and Management
Ministry of Food Processing Industries
Plot No.97, Sector-56, HSIIDC, Industrial Estate, Kundli, Sonipat, Haryana-131028
Website: http://www.niftem.ac.in
Email: [email protected]
Call: 0130-2281089

PM FME‐ Detailed Project Report of Liquid Milk Unit
2
TABLE OF CONTENTS
S No. Topic Page Number
1. Project Summary 3
2. About the Product 4-5
3. Process Flow Chart 5-7
4. Economics of the Project 8-25
4.1. Basis & Presumptions 8
4.2. Capacity, Utilisation, Production & Output 9-10
4.3. Premises/Infrastructure 10
4.4. Machinery & Equipment’s 11-13
4.5. Misc. Fixed Assets 13
4.6. Total Cost of Project 14
4.7. Means of Finance 14
4.8 Term Loan 18
4.9. Term Loan repayment & interest schedule 15-18
4.10. Working Capital Calculations 18
4.11. Salaries/Wages 19
4.12. Power Requirement 20
4.13. Depreciation Calculation 20
4.14. Repairs & Maintenance 21
4.15. Projections of Profitability Analysis 21
4.16. Break Even Point Analysis 22
4.17. Projected Balance Sheet 23
4.18. Cash- Flow Statement 24
4.19. Debt-Service Coverage Ratio 25

PM FME‐ Detailed Project Report of Liquid Milk Unit
3
1. PROJECT SUMMARY
1. Name of the proposed project : Liquid Milk Unit
2. Nature of proposed project : Proprietorship/Company/Partnership
3. Proposed project capacity : 456000 Ltr/annum (60,65,70,75&80% capacity utilization in 1st to 5th Year respectively)
4. Raw material : Milk
5. Major product outputs : Liquid Milk
6. Total project cost : Rs. 30.19 Lakh
Land development, building & CivilConstruction
: Nil
Machinery and equipment’s : Rs. 23.05 Lakh
Miscellaneous Fixed Assets : Rs. 2.50 Lakh
Working capital : Rs. 4.64 Lakh
8. Means of Finance
Subsidy (max 10lakhs) : Rs. 8.94 Lakh
Promoter’s contribution (min10%) : Rs. 3.01 Lakh
Term loan : Rs.14.05 Lakh
Working Capital Requirement : Rs. 4.18 Lakh
9. Profit after Depreciation, Interest & Tax
1styear : Rs. 2.72 Lakh
2ndyear : Rs. 4.59 Lakh
3rd year : Rs. 6.55 Lakh
4th year : Rs. 8.78 Lakh
5th year : Rs. 10.61 Lakh
11. Average DSCR : Rs. 2.86
12. Term loan repayment : 5 Years with 6 months grace period

PM FME‐ Detailed Project Report of Liquid Milk Unit
4
2. ABOUT THE PRODUCT
2.1. PRODUCT INTRODUCTION:
India has been the leading producer and consumer of dairy products worldwide since 1998 with a
sustained growth in the availability of milk and milk products. Dairy activities form an essential
part of the rural Indian economy, serving as an important source of employment and income.
Products produced from milk is Known as Dairy Products. They are rich sources of energy. Raw
milk for processing generally comes from cows, but occasionally from other mammals such as
goats, sheep, and water buffalo.
Types of products produced from raw milk:
Curd
Butter milk
Paneer
Ghee
Cream
Flavoured Milk
2.2. MARKET POTENTIAL:
Mostly all of the dairy produce in India is consumed domestically, with the majority of it being
sold as fluid milk. On account of this, the Indian dairy industry holds tremendous potential for
value-addition and overall development.
PM FME‐ Detailed Project Report of Liquid Milk Unit
5
Looking forward, the market is expected to reach a value of INR 21,971 Billion by 2024,
exhibiting a CAGR of around 16% during 2019-2024. The healthy growth of the market can be
attributed to numerous forces. Population growth, rising disposable incomes, easy availability,
and growing awareness about the benefits/ uses of milk are some of the factors that are
broadening the growth aspects of the market. We can expect the market to exhibit strong growth
during 2020-2025. This product is consumed in every household and there is always a significant
demand in both rural as well as in urban sector.
2.3. RAW MATERIAL DESCRIPTION:
The only raw material that is required for Liquid Milk making unit is Milk and is easily available
in the local market.
3. PROCESS FLOW CHART
Process description of Liquid Milk is defined below:
Milk Reception: After procurement of milk bring the milk to the milk reception &cool
the milk, so that life span of the milk can be increased & it can be used for further
processing.
Milk Chilling: Chilling milk entails rapidly cooling raw milk to a temperature low
enough to prevent the development of microorganisms found in the milk. The
temperature of the milk should be decreased to less than 10 degrees Celsius during the
cooling process, preferably 3 to 4 degrees Celsius.

PM FME‐ Detailed Project Report of Liquid Milk Unit
6
Milk Pasteurization: Pasteurization ensures the milk is healthy to consume (by
removing bacteria) and extends its shelf life. Pasteurization is the act of heating milk to
71.7°C for at least 15 seconds (and no more than 25 seconds).
Milk Chilling: Milk is often cooled to a minimum temperature (5 °C or lower) shortly
after arrival at the dairy to avoid the development of microorganisms. The milk is then
cooled to about 4 °C after pasteurisation.
Milk Standardization: The industrial modification of milk or cream fat content to a
specifically defined or expected value is known as standardisation. Raw milk has a higher
fat content than the fat content of the other dairy products that will be processed.
Milk Homogenization: Homogenization is a mechanical procedure of milk fat globules
that involves moving milk under high pressure through a tiny orifice, resulting in a
reduction in average diameter and an increase in the amount and surface area of the fat
globules.
Milk Filling & Packaging: A modern fluid milk plant will not be complete without a
pouch-filling system. The pouches are made from a variety of plastic materials.

PM FME‐ Detailed Project Report of Liquid Milk Unit
7
Milk Reception
Milk Chilling
Milk Pasteurization
Milk Chilling
Milk Standardization
Milk Homogenization
Milk Filling & Packaging

PM FME‐ Detailed Project Report of Liquid Milk Unit
8
4. ECONOMICS OF THE PROJECT
4.1. BASIS & PRESUMPTIONS
1. Production Capacity of Liquid Milk is 200 Ltr per hr. First year, Capacity has been taken @
60%.
2. Working shift of 8 hours per day has been considered.
3. Raw Material stock is for 1 days and Finished goods Closing Stock has been taken for 1 days.
4. Credit period to Sundry Debtors has been given for 10 days.
5. Credit period by the Sundry Creditors has been provided for 2 days.
6. Depreciation and Income tax has been taken as per the Income tax Act, 1961.
7. Interest on working Capital Loan and Term loan has been taken at 11%.
8. Salary and wages rates are taken as per the Current Market Scenario.
9. Power Consumption has been taken at 20 KW.
10. Increase in sales and raw material costing has been taken @ 5% on a yearly basis.

PM FME‐ Detailed Project Report of Liquid Milk Unit
9
4.2. CAPACITY, UTILIZATION, PRODUCTION & OUTPUT
Items to be Manufactured
Liquid Milk
Machine capacity Per Hr 200 LtrTotal working Hours 8
Machine capacity Per Day 1,600 Ltr
Working days in a month 25 Days
Working days per annum 300
Wastage Considered 5%
Raw material requirement 480000 Ltr
Final Output per annum after wastage 456000 Ltr
Final Product to be packed in 1 Ltr. Packet
Number of Packets per annum 456000 1 Ltr. Packet
COMPUTATION OF PRODUCTION OF LIQUID MILK
Production of Liquid Milk
Production Capacity LTR.
1st year 60% 2,73,600
2nd year 65% 2,96,400
3rd year 70% 3,19,200
4th year 75% 3,42,000
5th year 80% 3,64,800
PM FME‐ Detailed Project Report of Liquid Milk Unit
10
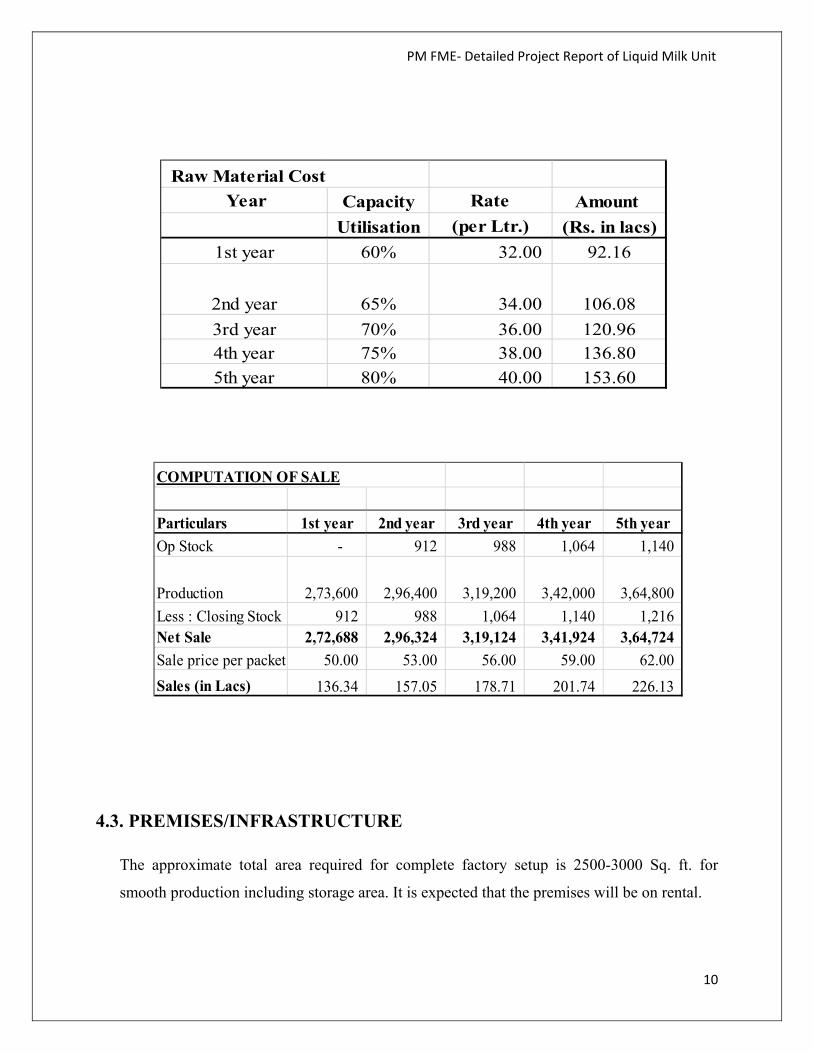
4.3. PREMISES/INFRASTRUCTURE
The approximate total area required for complete factory setup is 2500-3000 Sq. ft. for
smooth production including storage area. It is expected that the premises will be on rental.
Raw Material Cost
Year Capacity Rate Amount
Utilisation (per Ltr.) (Rs. in lacs)
1st year 60% 32.00 92.16
2nd year 65% 34.00 106.08
3rd year 70% 36.00 120.964th year 75% 38.00 136.80
5th year 80% 40.00 153.60
Particulars 1st year 2nd year 3rd year 4th year 5th year
Op Stock - 912 988 1,064 1,140
Production 2,73,600 2,96,400 3,19,200 3,42,000 3,64,800
Less : Closing Stock 912 988 1,064 1,140 1,216 Net Sale 2,72,688 2,96,324 3,19,124 3,41,924 3,64,724
Sale price per packet 50.00 53.00 56.00 59.00 62.00
Sales (in Lacs) 136.34 157.05 178.71 201.74 226.13
COMPUTATION OF SALE

PM FME‐ Detailed Project Report of Liquid Milk Unit
11
4.4. MACHINERY & EQUIPMENTS
Machine
Name
Description Machine Image.
Milk
Reception
System
This system is used for collection
milk in order to maintain freshness
of milk
Milk Chiller The Bulk Milk Chiller is used to
keep milk cool and fresh by cooling
it to 4°C. For Dairy/Milk Collection
Centers, the Bulk Milk Chiller is the
solution for bacteria-free milk
storage.
Refrigeration
Plant
Refrigeration Plant consists of
compressor, condenser, cooling
tower, heat exchanger and other
supporting machine & equipments.
Continuous
Milk
Pasteurizer
Pasteurizer is used for killing
pathogenic microorganisms by
heating milk or milk products to a
specific temperature for a set period
of time without allowing

PM FME‐ Detailed Project Report of Liquid Milk Unit
12
recontamination.
Milk
Standardizati
on System
Milk Standardization system consist
of cream separator and homogenizer.
Milk Filling
& Packaging
Machine
This machine is used to fill milk in
packets of different sizes.
Boiler Boiler is used for producing steam
which is used by Khoa making
machines
Material
handling and
other
equipment’s
These Equipment’s are used for
material handling. Other
equipment’s like water pumps,
weighing machine, etc are also used.

PM FME‐ Detailed Project Report of Liquid Milk Unit
13
Machine Unit Rate Price
Milk reception system (Capacity 1000 Ltr.) 1 160000 160000
Milk chiller (Capacity 1000 Ltr.) 1 250000 250000
Milk Pasteurizer 1 275000 275000
Refrigeration Plant 1 350000 350000
Milk Standardization System 1 620000 620000
Boiler (Capacity 500-1000 Ltr.) 1 180000 180000
Milk Filling & Packaging Machine 1 220000 220000
Material handling and other Equipment’s (water
pumps, trolleys, trays, bins, lactometer, weighing
machine, etc.)
- 250000 250000
Note: Total Machinery cost shall be Rs 23.05 lakh including equipment’s but excluding
GST and Transportation Cost.
4.5. MISCELLANEOUS FIXED ASSETS
Water Supply Arrangements
Furniture & Fixtures
Computers & Printers

PM FME‐ Detailed Project Report of Liquid Milk Unit
14
4.6. TOTAL COST OF PROJECT
4.7. MEANS OF FINANCE
4.8. TERM LOAN: Term loan of Rs. 14.05 Lakh is required for project cost of Rs. 30.19 Lakh
(in Lacs)
PARTICULARS Amount
Land & Building Owned/Rented
Plant & Machinery 23.05
Miscellaneous Assets 2.50
Working capital 4.64
Total 30.19
COST OF PROJECT
PARTICULARS AMOUNT
Own Contribution (min 10%) 3.01
Subsidy @35%(Max. Rs 10 Lac) 8.94
Term Loan @ 55% 14.05
Working Capital (Bank Finance) 4.18
Total 30.19
MEANS OF FINANCE

PM FME‐ Detailed Project Report of Liquid Milk Unit
15
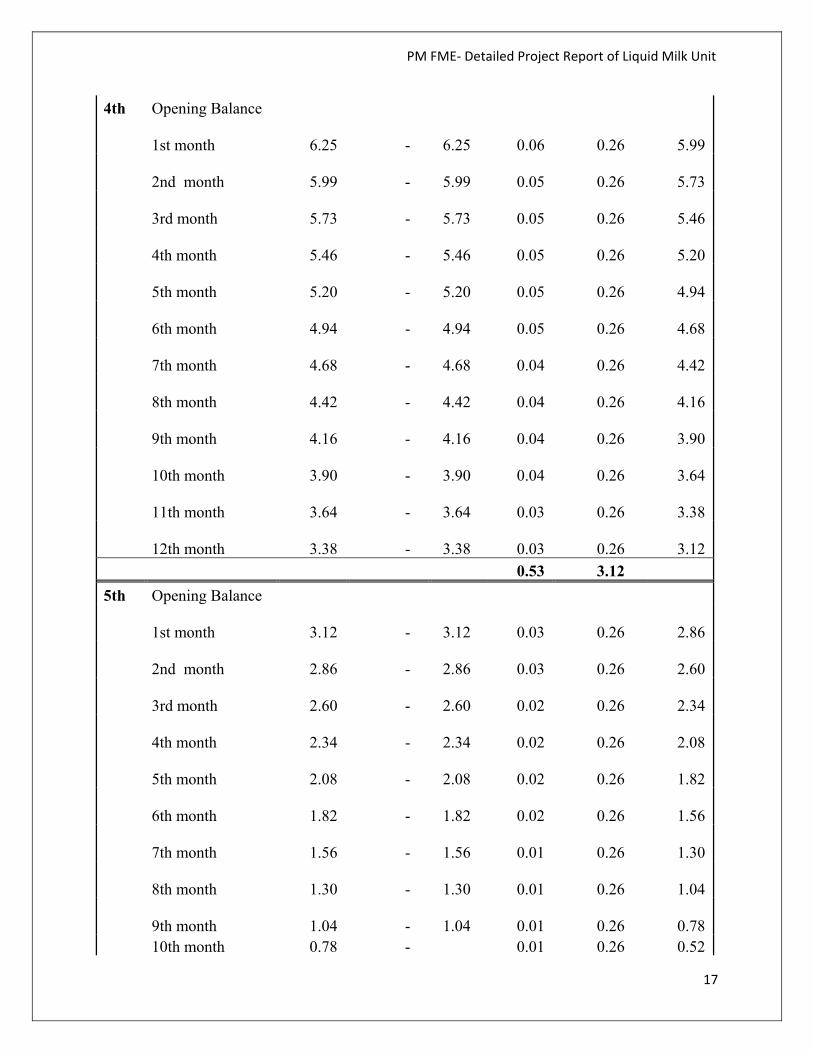
4.9. TERM LOAN REPAYMENT& INTEREST SCHEDULE
REPAYMENT SCHEDULE OF TERM LOAN Interest 11.00%
Year Particulars Amount Addition Total Interest
Repayment Closing Balance
1st Opening Balance
1st month - 14.05
14.05 - - 14.05
2nd month 14.05 -
14.05 0.13 - 14.05
3rd month 14.05 -
14.05 0.13 - 14.05
4th month 14.05 -
14.05 0.13 14.05
5th month 14.05 -
14.05 0.13 14.05
6th month 14.05 -
14.05 0.13 14.05
7th month 14.05 -
14.05 0.13 0.26 13.79
8th month 13.79 -
13.79 0.13 0.26 13.53
9th month 13.53 -
13.53 0.12 0.26 13.27
10th month 13.27 -
13.27 0.12 0.26 13.01
11th month 13.01 -
13.01 0.12 0.26 12.75
12th month 12.75 -
12.75 0.12 0.26 12.49
1.38 1.56
2nd Opening Balance
1st month 12.49 -
12.49 0.11 0.26 12.23
2nd month 12.23 -
12.23 0.11 0.26 11.97
3rd month 11.97 -
11.97 0.11 0.26 11.71

PM FME‐ Detailed Project Report of Liquid Milk Unit
16
4th month 11.71 -
11.71 0.11 0.26 11.45
5th month 11.45 -
11.45 0.10 0.26 11.19
6th month 11.19 -
11.19 0.10 0.26 10.93
7th month 10.93 -
10.93 0.10 0.26 10.67
8th month 10.67 -
10.67 0.10 0.26 10.41
9th month 10.41 -
10.41 0.10 0.26 10.15
10th month 10.15 -
10.15 0.09 0.26 9.89
11th month 9.89 -
9.89 0.09 0.26 9.63
12th month 9.63 -
9.63 0.09 0.26 9.37
1.22 3.12
3rd Opening Balance
1st month 9.37 -
9.37 0.09 0.26 9.11
2nd month 9.11 -
9.11 0.08 0.26 8.85
3rd month 8.85 -
8.85 0.08 0.26 8.59
4th month 8.59 -
8.59 0.08 0.26 8.33
5th month 8.33 -
8.33 0.08 0.26 8.07
6th month 8.07 -
8.07 0.07 0.26 7.81
7th month 7.81 -
7.81 0.07 0.26 7.55
8th month 7.55 -
7.55 0.07 0.26 7.29
9th month 7.29 -
7.29 0.07 0.26 7.03
10th month 7.03 -
7.03 0.06 0.26 6.77
11th month 6.77 -
6.77 0.06 0.26 6.51
12th month 6.51 -
6.51 0.06 0.26 6.25
0.87 3.12
PM FME‐ Detailed Project Report of Liquid Milk Unit
17
4th Opening Balance
1st month 6.25 -
6.25 0.06 0.26 5.99
2nd month 5.99 -
5.99 0.05 0.26 5.73
3rd month 5.73 -
5.73 0.05 0.26 5.46
4th month 5.46 -
5.46 0.05 0.26 5.20
5th month 5.20 -
5.20 0.05 0.26 4.94
6th month 4.94 -
4.94 0.05 0.26 4.68
7th month 4.68 -
4.68 0.04 0.26 4.42
8th month 4.42 -
4.42 0.04 0.26 4.16
9th month 4.16 -
4.16 0.04 0.26 3.90
10th month 3.90 -
3.90 0.04 0.26 3.64
11th month 3.64 -
3.64 0.03 0.26 3.38
12th month 3.38 -
3.38 0.03 0.26 3.12
0.53 3.12
5th Opening Balance
1st month 3.12 -
3.12 0.03 0.26 2.86
2nd month 2.86 -
2.86 0.03 0.26 2.60
3rd month 2.60 -
2.60 0.02 0.26 2.34
4th month 2.34 -
2.34 0.02 0.26 2.08
5th month 2.08 -
2.08 0.02 0.26 1.82
6th month 1.82 -
1.82 0.02 0.26 1.56
7th month 1.56 -
1.56 0.01 0.26 1.30
8th month 1.30 -
1.30 0.01 0.26 1.04
9th month 1.04 -
1.04 0.01 0.26 0.78 10th month 0.78 - 0.01 0.26 0.52
PM FME‐ Detailed Project Report of Liquid Milk Unit
18
0.78
11th month 0.52 -
0.52 0.00 0.26 0.26
12th month 0.26 -
0.26 0.00 0.26 -
0.19 3.12
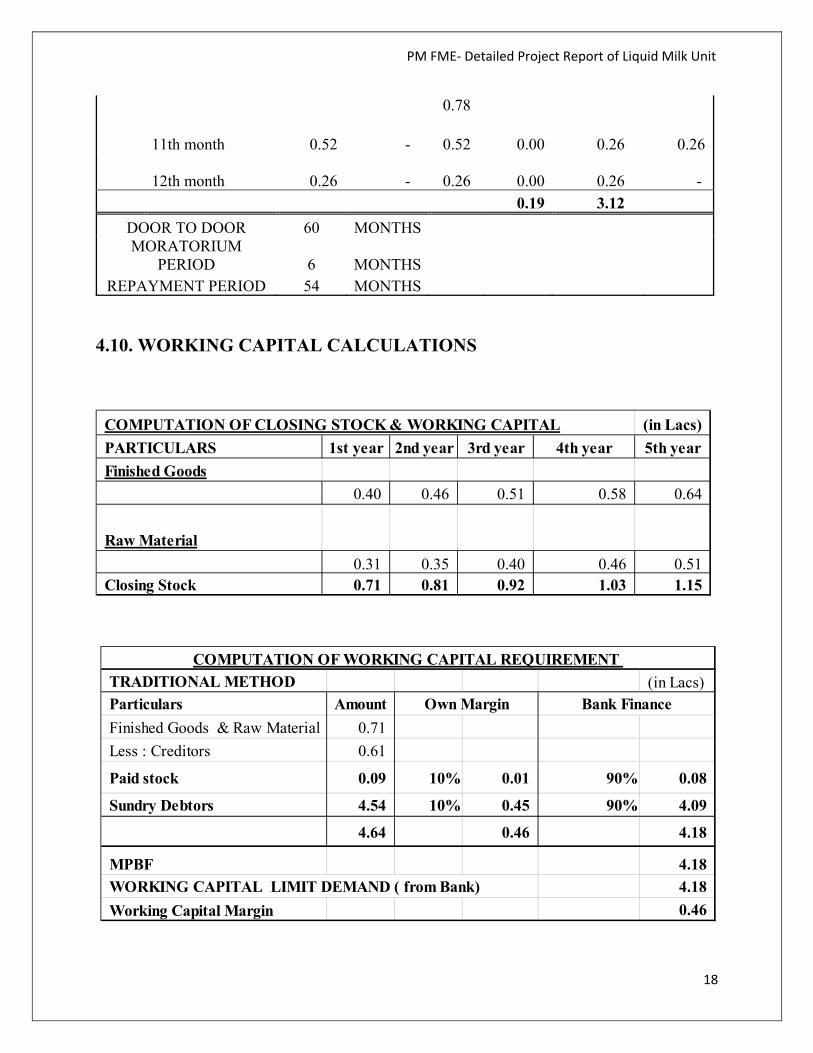
DOOR TO DOOR 60 MONTHS MORATORIUM
PERIOD 6 MONTHS REPAYMENT PERIOD 54 MONTHS
4.10. WORKING CAPITAL CALCULATIONS
(in Lacs)
PARTICULARS 1st year 2nd year 3rd year 4th year 5th year
Finished Goods
0.40 0.46 0.51 0.58 0.64
Raw Material
0.31 0.35 0.40 0.46 0.51 Closing Stock 0.71 0.81 0.92 1.03 1.15
COMPUTATION OF CLOSING STOCK & WORKING CAPITAL
TRADITIONAL METHOD (in Lacs)Particulars Amount
Finished Goods & Raw Material 0.71
Less : Creditors 0.61
Paid stock 0.09 10% 0.01 90% 0.08
Sundry Debtors 4.54 10% 0.45 90% 4.09
4.64 0.46 4.18
MPBF 4.18
4.18
Working Capital Margin 0.46
WORKING CAPITAL LIMIT DEMAND ( from Bank)
Own Margin Bank Finance
COMPUTATION OF WORKING CAPITAL REQUIREMENT
PM FME‐ Detailed Project Report of Liquid Milk Unit
19
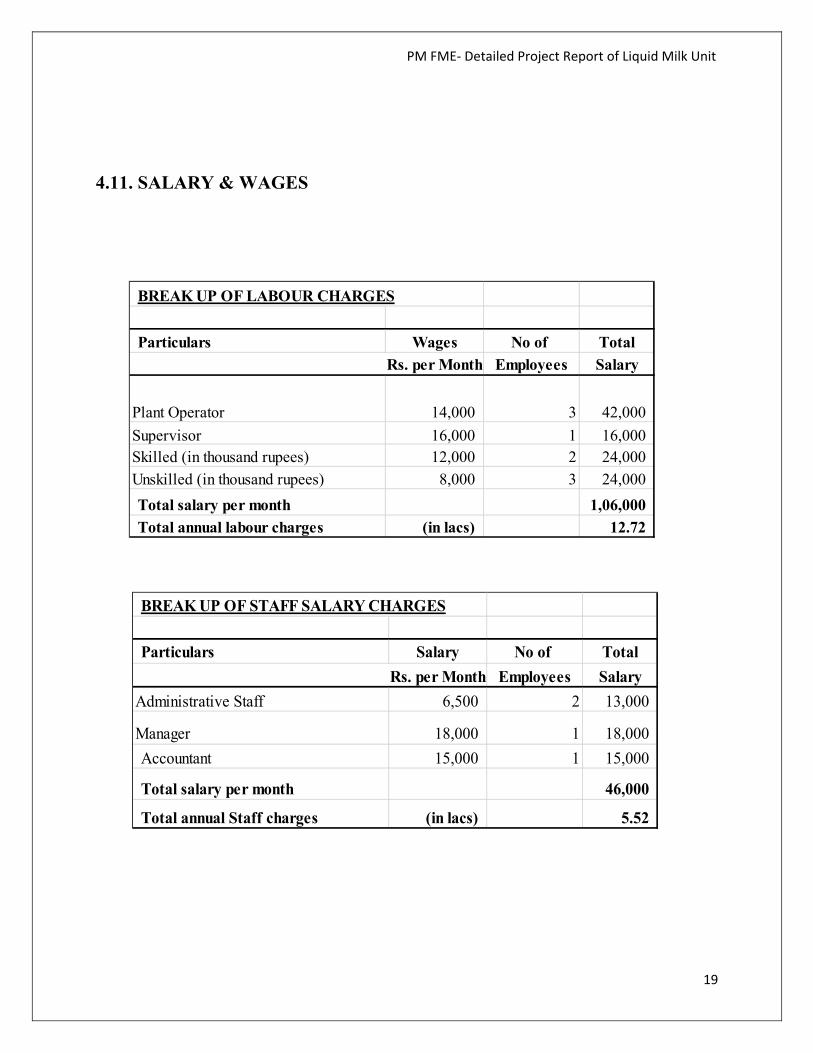
4.11. SALARY & WAGES
BREAK UP OF LABOUR CHARGES
Particulars Wages No of Total
Rs. per Month Employees Salary
Plant Operator 14,000 3 42,000
Supervisor 16,000 1 16,000 Skilled (in thousand rupees) 12,000 2 24,000
Unskilled (in thousand rupees) 8,000 3 24,000
Total salary per month 1,06,000
Total annual labour charges (in lacs) 12.72
BREAK UP OF STAFF SALARY CHARGES
Particulars Salary No of Total
Rs. per Month Employees Salary
Administrative Staff 6,500 2 13,000
Manager 18,000 1 18,000
Accountant 15,000 1 15,000
Total salary per month 46,000
Total annual Staff charges (in lacs) 5.52

PM FME‐ Detailed Project Report of Liquid Milk Unit
20
4.12 POWER REQUIREMENT
4.13. DEPRECIATION CALCULATION
Utility Charges (per month)
Particulars value Description
Power connection required 20 KWH
consumption per day 160 units
Consumption per month 4,000 units
Rate per Unit 10 Rs.power Bill per month 40,000 Rs.
(in Lacs)
Description Plant & Machinery Miss. Assets TOTAL
Rate of Depreciation 15.00% 10.00%
Opening Balance - - -
Addition 23.05 2.50 25.55
Total 23.05 2.50 25.55 Less : Depreciation 3.46 0.25 3.71 WDV at end of Year 19.59 2.25 21.84
Additions During The Year - - -
Total 19.59 2.25 21.84
Less : Depreciation 2.94 0.23 3.16
WDV at end of Year 16.65 2.03 18.68
Additions During The Year - - -
Total 16.65 2.03 18.68
Less : Depreciation 2.50 0.20 2.70
WDV at end of Year 14.16 1.82 15.98
Additions During The Year - - -
Total 14.16 1.82 15.98
Less : Depreciation 2.12 0.18 2.31
WDV at end of Year 12.03 1.64 13.67
Additions During The Year - - -
Total 12.03 1.64 13.67
Less : Depreciation 1.80 0.16 1.97
WDV at end of Year 10.23 1.48 11.70
COMPUTATION OF DEPRECIATION

PM FME‐ Detailed Project Report of Liquid Milk Unit
21
4.14. REPAIR & MAINTENANCE: Repair & Maintenance is 3.0 % of Gross Sale.
4.15. PROJECTIONS OF PROFITABILITY ANALYSIS
(in Lacs)
PARTICULARS 1st year 2nd year 3rd year 4th year 5th year
Capacity Utilisation % 60% 65% 70% 75% 80%
SALES
Gross SaleLiquid Milk 136.34 157.05 178.71 201.74 226.13
Total 136.34 157.05 178.71 201.74 226.13
COST OF SALES
Raw Material Consumed 92.16 106.08 120.96 136.80 153.60
Electricity Expenses 4.80 5.52 6.35 7.30 8.03
Depreciation 3.71 3.16 2.70 2.31 1.97
Wages & labour 12.72 13.99 15.11 16.17 17.79
Repair & maintenance 4.09 4.71 5.36 6.05 6.78
Packaging 3.00 3.14 3.57 4.03 4.52
Cost of Production 120.48 136.61 154.06 172.66 192.69
Add: Opening Stock /WIP - 0.40 0.46 0.51 0.58
Less: Closing Stock /WIP 0.40 0.46 0.51 0.58 0.64
Cost of Sales 120.08 136.55 154.00 172.60 192.62
GROSS PROFIT 16.27 20.50 24.71 29.14 33.50
11.93% 13.05% 13.83% 14.44% 14.82%
Salary to Staff 5.52 6.35 7.62 8.38 9.64
Interest on Term Loan 1.38 1.22 0.87 0.53 0.19
Interest on working Capital 0.46 0.46 0.46 0.46 0.46
Rent 3.60 3.96 4.36 4.79 5.27
selling & adm exp 2.59 3.93 4.29 5.04 5.43 TOTAL 13.55 15.91 17.59 19.20 20.98
NET PROFIT 2.72 4.59 7.12 9.93 12.52
1.99% 2.92% 3.98% 4.92% 5.54%
Taxation - - 0.57 1.15 1.91
PROFIT (After Tax) 2.72 4.59 6.55 8.78 10.61
PROJECTED PROFITABILITY STATEMENT

PM FME‐ Detailed Project Report of Liquid Milk Unit
22
4.16. BREAK EVEN POINT ANALYSIS
BREAK EVEN POINT ANALYSIS
Year I II III IV V
Net Sales & Other Income 136.34 157.05 178.71 201.74 226.13
Less : Op. WIP Goods - 0.40 0.46 0.51 0.58
Add : Cl. WIP Goods 0.40 0.46 0.51 0.58 0.64
Total Sales 136.75 157.11 178.77 201.80 226.20
Raw Material Consumed 92.16 106.08 120.96 136.80 153.60
Electricity Exp/Coal Consumption at 85% 4.08 4.69 5.40 6.21 6.83
Wages & Salary at 60% 10.94 12.20 13.64 14.73 16.45
Selling & adminstrative Expenses 80% 2.07 3.14 3.43 4.03 4.34
Interest on working Capital 0.45928 0.45928 0.45928 0.45928 0.45928
Repair & maintenance 4.09 4.71 5.36 6.05 6.78
Packaging 3.00 3.14 3.57 4.03 4.52
Total Variable & Semi Variable Exp 116.81 134.43 152.82 172.32 192.99
Contribution 19.94 22.68 25.95 29.48 33.21
Electricity Exp/Coal Consumption at 15% 0.72 0.83 0.95 1.10 1.20
Wages & Salary at 40% 7.30 8.14 9.09 9.82 10.97
Interest on Term Loan 1.38 1.22 0.87 0.53 0.19
Depreciation 3.71 3.16 2.70 2.31 1.97
Selling & adminstrative Expenses 20% 0.52 0.79 0.86 1.01 1.09
Rent 3.60 3.96 4.36 4.79 5.27
Total Fixed Expenses 17.22 18.09 18.83 19.55 20.68
Capacity Utilization 60% 65% 70% 75% 80%
OPERATING PROFIT 2.72 4.59 7.12 9.93 12.52
BREAK EVEN POINT 52% 52% 51% 50% 50%
BREAK EVEN SALES 118.11 125.33 129.73 133.81 140.89
Variable & Semi Variable Exp.
Fixed & Semi Fixed Expenses

PM FME‐ Detailed Project Report of Liquid Milk Unit
23
4.17. PROJECTED BALANCE SHEET
(in Lacs)
PARTICULARS 1st year 2nd year 3rd year 4th year 5th year
Liabilities
Capital
opening balance 12.17 12.76 14.31 16.09 Add:- Own Capital 3.01
Add:- Retained Profit 2.72 4.59 6.55 8.78 10.61
Less:- Drawings 2.50 4.00 5.00 7.00 8.50
Subsidy/grant 8.94
Closing Balance 12.17 12.76 14.31 16.09 18.20
Term Loan 12.49 9.37 6.25 3.12 -
Working Capital Limit 4.18 4.18 4.18 4.18 4.18
Sundry Creditors 0.61 0.71 0.81 0.91 1.02
Provisions & Other Liab 0.40 0.50 0.60 0.72 0.86
TOTAL : 29.85 27.51 26.13 25.02 24.26
Assets
Fixed Assets ( Gross) 25.55 25.55 25.55 25.55 25.55
Gross Dep. 3.71 6.87 9.57 11.88 13.85
Net Fixed Assets 21.84 18.68 15.98 13.67 11.70
Current Assets
Sundry Debtors 4.54 5.24 5.96 6.72 7.54
Stock in Hand 0.71 0.81 0.92 1.03 1.15
Cash and Bank 2.75 2.78 3.28 3.59 3.87 TOTAL : 29.85 27.51 26.13 25.02 24.26
PROJECTED BALANCE SHEET

PM FME‐ Detailed Project Report of Liquid Milk Unit
24
4.18. CASH FLOW STATEMENT
(in Lacs)
PARTICULARS 1st year 2nd year 3rd year 4th year 5th year
SOURCES OF FUND
Own Margin 3.01
Net Profit 2.72 4.59 7.12 9.93 12.52 Depriciation & Exp. W/off 3.71 3.16 2.70 2.31 1.97
Increase in Cash Credit 4.18 - - - -
Increase In Term Loan 14.05 - - - -
Increase in Creditors 0.61 0.09 0.10 0.11 0.11
Increase in Provisions & Oth lib 0.40 0.10 0.10 0.12 0.14
Sunsidy/grant 8.94 TOTAL : 37.62 7.94 10.02 12.46 14.75
APPLICATION OF FUND
Increase in Fixed Assets 25.55
Increase in Stock 0.71 0.10 0.11 0.11 0.12
Increase in Debtors 4.54 0.69 0.72 0.77 0.81
Repayment of Term Loan 1.56 3.12 3.12 3.12 3.12
Drawings 2.50 4.00 5.00 7.00 8.50
Taxation - - 0.57 1.15 1.91 TOTAL : 34.86 7.91 9.52 12.16 14.47
Opening Cash & Bank Balance - 2.75 2.78 3.28 3.59
Add : Surplus 2.75 0.03 0.50 0.31 0.28
Closing Cash & Bank Balance 2.75 2.78 3.28 3.59 3.87
PROJECTED CASH FLOW STATEMENT

PM FME‐ Detailed Project Report of Liquid Milk Unit
25
4.19. DEBT SERVICE COVERAGE RATIO
CALCULATION OF D.S.C.R
PARTICULARS 1st year 2nd year 3rd year 4th year 5th year
CASH ACCRUALS 6.42 7.75 9.25 11.09 12.58
Interest on Term Loan 1.38 1.22 0.87 0.53 0.19 Total 7.81 8.97 10.13 11.62 12.77
REPAYMENT
Instalment of Term Loan 1.56 3.12 3.12 3.12 3.12
Interest on Term Loan 1.38 1.22 0.87 0.53 0.19
Total 2.94 4.34 4.00 3.65 3.31
DEBT SERVICE COVERAGE RATIO 2.65 2.07 2.53 3.18 3.86
AVERAGE D.S.C.R. 2.86