Body measures and milk production, milk fat globules granulometry and milk fatty acid content in...
9
[Ital J Anim Sci vol.12:e1, 2013] [page 107] Body measures and milk production, milk fat globules granulometry and milk fatty acid content in Cabannina cattle breed Ricardo Communod, 1 Silvia Guida, 2 Daniele Vigo, 1 Valentino Beretti, 2 Eleonora Munari, 1 Carla Colombani, 1 Paola Superchi, 2 Alberto Sabbioni 2 1 Dipartimento di Scienze Veterinarie e Sanità Pubblica, Università di Milano, Italy 2 Dipartimento di Scienze Medico- Veterinarie, Università di Parma, Italy Abstract Aim of the study was to achieve scientific information about body measures and milk pro- duction of Cabannina cattle, a local breed reared in northern Italy. Fourteen body meas- ures and five morphologic indexes were record- ed from 86 heads enrolled in the herd book. Low differences between males and females of the same age-class were shown. Body measures were generally greater than those reported in previous studies, probably due to recent crosses. With reference to milk production, 991 test-day records from 128 lactations of 59 cows were analysed. Average milk daily production was 8 kg/d in 1 st lactation to 10.61 in 3 rd (P<0.05); the parameters of the Wood equation draw atypical curves with the exception of curves from spring calving cows. Only 74.5% of lactations with an adjusted R 2 >0.75 showed a standard curve, with low persistence (7.7%), high value of d at peak (103 d) and peak production of 20.18 kg of milk. Moreover, 100 milk samples (40 to 220 d of lac- tation) were submitted to a granulometric sur- vey by laser scatter technique in order to evalu- ate the dimensions of fat globules; then milk fat was analyzed by gas chromatography, and desat- urase indexes were determined. Cabannina cows showed small fat globules with high spe- cific surface. Furthermore mean diameter of milk fat globules decreased during lactation then rose. Milk fat contained high levels of cis- MUFA, and high desaturase indexes. In conclu- sion, the low size of Cabannina cattle orients for a limited meat production. Instead milk produc- tion has a higher economic potential, aimed at cheese production and human nutrition. Introduction In a global scenario, in which water, energy and economic resources will decrease more and more, agricultural system’s goal must be vegetal and animal biodiversity preservation and an efficient use of lands (FAO, 2009). In this context the European food system must produce sufficient, healthy and nutritious food, while drastic reducing CO2 emissions and regenerating landscapes and natural resources, in a new concept of innovative and environmentally sustainable agricultural panorama. The Common Agricultural Policy must enhance biodiversity and ecologically functional productions, by connecting tradi- tional knowledge and modern techniques. Researches and projects that explore the potential of diverse and locally adapted produc- tion systems, while respecting the animal wel- fare, will be pivotal in forthcoming years. Due to its north-to-south extension Italy is endowed by a wide variety of climate, and a lot of cattle breeds, approximately 30, among which only 16 are included in the Herd Book of Italian autochthonous cattle breeds (Associazione Italiana Allevatori, 2012b), had the possibility, over the centuries, to adapt themselves to different environmental situa- tions. Local breeds are important for the main- tenance of biodiversity in several territories, mainly in areas where an intensive animal production system is not applicable. However, it is necessary that their productions are known, enhanced and included in a market context, in order to find an economic rationale to their breeding. The Cabannina cattle breed is an autochtho- nous breed that originated in the province of Genoa, in northern Italy and it is considered as a dual purpose cattle breed (Associazione Italiana Allevatori, 2012b). There are currently about 250 heads, enrolled in the Herd Book of Italian endangered cattle breeds, of which only 73 underwent during 2011 to the milk record- ing activity (Associazione Italiana Allevatori, 2012a). Cabannina is a rustic cattle breed, with a low size and with a medium-low milk production. Milk is used for the production of a local cheese, named U’Cabanin (Guida, 2011). The aim of the study was to achieve new sci- entific information about this breed, in order to enhance the meat and milk production and milk quality in the Cabannina breed and to bet- ter introduce these items in the new breeding scenario. Materials and methods Body measures The study was carried out in 10 farms in the province of Genoa, with tie stall rearing in the cold season and pasture in the warm season, during the period from January to July 2011. Rations for growing and adult animals were based on dry forages or pasture and concen- trates given to meet the requirements of the animals in relation to the stage of growth. Body measures were taken from a sample of 86 individuals (75 females born between 1997 and 2011 and 11 males born between 2003 and 2011), enrolled in the Cabannina herd book. The sampled animals were the same for all the considered parameters. In relation to the num- ber of animals six age-classes were defined: i) from 1 d to 30 d (n=5); ii) from 31 d to 60 d (n=4); iii) from 61 d to 120 d (n=2); iv) from 121 d to 365 d (n=6); v) from 366 d to 730 d (n=11); vi) >730 d (n=58). Fourteen body measures (Meregalli, 1980) Corresponding author: Prof. Alberto Sabbioni, Dipartimento di Scienze Medico-Veterinarie, Università di Parma, via del Taglio 10, 43126 Parma, Italy. Tel. +39.0521.032625 – Fax +39.0521.032611. E-mail: [email protected] Key words: Cabannina cattle, Body measures, Lactation curve, Milk fat globules, Fatty acids. Contribution: the authors contributed equally to the paper. Acknowledgments: the authors kindly acknowl- edge Mr. Marco Rizzo from the Provincial Breeders Association (APA), Genova, Italy and all farmers for their collaboration. Received for publication: 25 July 2012. Revision received: 12 December 2012. Accepted for publication: 12 December 2012. This work is licensed under a Creative Commons Attribution NonCommercial 3.0 License (CC BY- NC 3.0). ©Copyright R. Communod et al., 2013 Licensee PAGEPress, Italy Italian Journal of Animal Science 2013; 12:e18 doi:10.4081/ijas.2013.e18 Italian Journal of Animal Science 2013; volume 12:e18 PAPER Non-commercial use only
-
Upload
independent -
Category
Documents
-
view
3 -
download
0
Transcript of Body measures and milk production, milk fat globules granulometry and milk fatty acid content in...

[Ital J Anim Sci vol.12:e1, 2013] [page 107]
Body measures and milkproduction, milk fat globulesgranulometry and milk fattyacid content in Cabanninacattle breedRicardo Communod,1 Silvia Guida,2
Daniele Vigo,1 Valentino Beretti,2
Eleonora Munari,1 Carla Colombani,1
Paola Superchi,2 Alberto Sabbioni21Dipartimento di Scienze Veterinarie eSanità Pubblica, Università di Milano,Italy2Dipartimento di Scienze Medico-Veterinarie, Università di Parma, Italy
Abstract
Aim of the study was to achieve scientificinformation about body measures and milk pro-duction of Cabannina cattle, a local breedreared in northern Italy. Fourteen body meas-ures and five morphologic indexes were record-ed from 86 heads enrolled in the herd book. Lowdifferences between males and females of thesame age-class were shown. Body measureswere generally greater than those reported inprevious studies, probably due to recent crosses.With reference to milk production, 991 test-dayrecords from 128 lactations of 59 cows wereanalysed. Average milk daily production was 8kg/d in 1st lactation to 10.61 in 3rd (P<0.05); theparameters of the Wood equation draw atypicalcurves with the exception of curves from springcalving cows. Only 74.5% of lactations with anadjusted R2>0.75 showed a standard curve, withlow persistence (7.7%), high value of d at peak(103 d) and peak production of 20.18 kg of milk.Moreover, 100 milk samples (40 to 220 d of lac-tation) were submitted to a granulometric sur-vey by laser scatter technique in order to evalu-ate the dimensions of fat globules; then milk fatwas analyzed by gas chromatography, and desat-urase indexes were determined. Cabanninacows showed small fat globules with high spe-cific surface. Furthermore mean diameter ofmilk fat globules decreased during lactationthen rose. Milk fat contained high levels of cis-MUFA, and high desaturase indexes. In conclu-sion, the low size of Cabannina cattle orients fora limited meat production. Instead milk produc-tion has a higher economic potential, aimed atcheese production and human nutrition.
Introduction
In a global scenario, in which water, energyand economic resources will decrease moreand more, agricultural system’s goal must bevegetal and animal biodiversity preservationand an efficient use of lands (FAO, 2009). Inthis context the European food system mustproduce sufficient, healthy and nutritiousfood, while drastic reducing CO2 emissionsand regenerating landscapes and naturalresources, in a new concept of innovative andenvironmentally sustainable agriculturalpanorama. The Common Agricultural Policymust enhance biodiversity and ecologicallyfunctional productions, by connecting tradi-tional knowledge and modern techniques.Researches and projects that explore thepotential of diverse and locally adapted produc-tion systems, while respecting the animal wel-fare, will be pivotal in forthcoming years.Due to its north-to-south extension Italy is
endowed by a wide variety of climate, and a lotof cattle breeds, approximately 30, amongwhich only 16 are included in the Herd Book ofItalian autochthonous cattle breeds(Associazione Italiana Allevatori, 2012b), hadthe possibility, over the centuries, to adaptthemselves to different environmental situa-tions. Local breeds are important for the main-tenance of biodiversity in several territories,mainly in areas where an intensive animalproduction system is not applicable. However,it is necessary that their productions areknown, enhanced and included in a marketcontext, in order to find an economic rationaleto their breeding. The Cabannina cattle breed is an autochtho-
nous breed that originated in the province ofGenoa, in northern Italy and it is considered asa dual purpose cattle breed (AssociazioneItaliana Allevatori, 2012b). There are currentlyabout 250 heads, enrolled in the Herd Book ofItalian endangered cattle breeds, of which only73 underwent during 2011 to the milk record-ing activity (Associazione Italiana Allevatori,2012a). Cabannina is a rustic cattle breed,with a low size and with a medium-low milkproduction. Milk is used for the production of alocal cheese, named U’Cabanin (Guida, 2011).The aim of the study was to achieve new sci-
entific information about this breed, in orderto enhance the meat and milk production andmilk quality in the Cabannina breed and to bet-ter introduce these items in the new breedingscenario.
Materials and methods
Body measuresThe study was carried out in 10 farms in theprovince of Genoa, with tie stall rearing in thecold season and pasture in the warm season,during the period from January to July 2011.Rations for growing and adult animals werebased on dry forages or pasture and concen-trates given to meet the requirements of theanimals in relation to the stage of growth.Body measures were taken from a sample of 86individuals (75 females born between 1997and 2011 and 11 males born between 2003 and2011), enrolled in the Cabannina herd book.The sampled animals were the same for all theconsidered parameters. In relation to the num-ber of animals six age-classes were defined:i) from 1 d to 30 d (n=5);ii) from 31 d to 60 d (n=4);iii) from 61 d to 120 d (n=2);iv) from 121 d to 365 d (n=6);v) from 366 d to 730 d (n=11);vi) >730 d (n=58).Fourteen body measures (Meregalli, 1980)
Corresponding author: Prof. Alberto Sabbioni,Dipartimento di Scienze Medico-Veterinarie,Università di Parma, via del Taglio 10, 43126Parma, Italy. Tel. +39.0521.032625 – Fax +39.0521.032611. E-mail: [email protected]
Key words: Cabannina cattle, Body measures,Lactation curve, Milk fat globules, Fatty acids.
Contribution: the authors contributed equally tothe paper.
Acknowledgments: the authors kindly acknowl-edge Mr. Marco Rizzo from the ProvincialBreeders Association (APA), Genova, Italy and allfarmers for their collaboration.
Received for publication: 25 July 2012.Revision received: 12 December 2012.Accepted for publication: 12 December 2012.
This work is licensed under a Creative CommonsAttribution NonCommercial 3.0 License (CC BY-NC 3.0).
©Copyright R. Communod et al., 2013Licensee PAGEPress, ItalyItalian Journal of Animal Science 2013; 12:e18doi:10.4081/ijas.2013.e18
Italian Journal of Animal Science 2013; volume 12:e18
PAPER
Non-co
mmercial
use o
nly

[page 108] [Ital J Anim Sci vol.12:e18, 2013]
were taken by means of the meter stick and ofthe metric tape:- height at withers (HW): from the withers tothe ground;
- height at croup (HC): from the top of thecroup to the ground;
- chest circumference (CC): behind the pos-terior edge of the shoulders at the point ofleast perimeter;
- length of the trunk (LTr): from the anterioredge of shoulder to the posterior edge ofbuttock;
- depth of chest (DC): from the withers to thesternum;
- chest width (CW): behind the shoulder;- length of the thorax (LTh): from the tip ofthe shoulder to the rear edge of the last rib;
- rump width (RW1): distance between thetwo iliac tuberosities;
- rump width (RW2): between the two ischialtuberosities;
- rump width (RW3): between the hips;- rump length (RL): from the tip of the hip tothat of the buttock;
- cannon bone circumference (CBC): at theupper third of the metacarpal bone;
- length of head (LH): from the head top tothe tip of the muzzle;
- width of head (WH): between the temples.- Five morphologic indexes were then calcu-lated from body measures (Magliano, 1950;Fernandez et al., 2007), namely:
- anamorphosis index (AI): CC2/HW;- pelvic index (PI): RW1/RL;- lateral corporal index (LCI): HW/LTr;- corporal index (CI): LTr/CC;- dactylo-thoracic index (DTI): CBC/CC.
Milk productionThe study was carried out using the test day
(TD) records for milk production (kg), fat andprotein content (%) and somatic cell count(SCC, no.*1000) of Cabannina cows reared in7 herds of the province of Genoa from July2008 to December 2011. The cattle manage-ment system was the same in all herds, basedon tie stalls rearing and traditional feeding(dry forages and concentrates given separatelytwice a day, with a forage/concentrate ratio of60/40) during the cold season and daily pastureplus evening concentrates in stalls during thewarm season. In all herds involved in the studyan automatic milking system was adopted, alsoduring the pasture period.Lactations with less than 5 controls were
removed from the dataset, so the analysis wasconducted on 991 monthly TD records (con-ducted in 145 different days) from 128 lacta-tions of 59 cows. Out of the 128 lactations, 27were first, 20 were second and 81 third or high-
er lactation; 34 started in spring, 28 in sum-mer, 22 in autumn and 44 in winter (respec-tively, from March to May, from June to August,from September to November and fromDecember to February). Fourty-four 7-dayclasses plus one class for lactations over 308 dwere considered. Data for fat and protein pro-duction (g/d) were calculated from milk pro-duction and percentage composition. BecauseSCC data were not normally distributed, SCCwas transformed into somatic cell score (SCS),according to Shook and Schutz (1994) bymeans of the following equation:SCS=3+log2(SCC/100,000).
Milk fat globule granulometryA total number of 100 milk samples were
taken from 10 lactating Cabannina cows (5 insecond and 5 in third lactation) from one herd.Milk samples were collected from the wholeudder by a lactometer during the morningmilking from animals in early and mid lacta-tion, ranging from 40 to 220 days in milk(DIM), with a 20 d sampling interval. Milksamples were forwarded to the laboratory at4°C and analyzed within 2 h.Distributions of fat globules diameter were
performed on 10 mL samples using a granu-lometer laser scatter, according to the indirectmethod proposed by Lopez (2005). Size distri-butions were characterized by volume weight-ed diameter of the globules (d43, in µm) and byspecific surface area (SSA, in cm2 mL–1).
Fatty acid extraction, derivatizationand desaturase indexesThe remaining part of the samples was
stored at -20°C until analysis. Lipid extractionwas performed according to a modified Blighand Dyer method (Manirakiza et al., 2001)with chloroform/methanol mixtures, chloro-form and micro-filtered distilled water. Thesamples (7.25 mL) were thus placed in cen-trifuge at 2000 rpm for 10 min at room temper-ature (20°C) in order to separate the solutioninto three phases. The deepest phase (solutionof chloroform containing the lipids) was drawnand placed in a glass tube in order to be driedunder a slight nitrogen flow. The solution pre-viously dried was derivatized according toMolto-Puigmartì et al. (2007), using solutionsof NaOCH3/MeOH 0.5M and BF3. After com-plete derivatization, 0.5 �L of solution contain-ing lipids was finally injected and analyzed bygas chromatograph Trace GC 2000 (Thermo-Fisher Scientific, Waltham, MA, USA)equipped with a TR-CN100 column (100 m,0.25 mm i.d. x 0.20 µm film thickness) and a 5m precolumn (i.d. 0.25 mm) deactivated
(TeknoKroma, Barcelona, Spain). The oventemperature program was: 70°C held for 3 min,then from 70°C to 240°C at 2.5°C min–1, heldfor 10 min. Carrier gas was nitrogen at 0.5 mLmin–1. Fatty acids were identified using exter-nal standards (Standard containing 37 fattyacids, FAME Mix 37, Supelco, Bellefonte, PA,USA) and two CLA standards (Matreya,Pleasant Gap, PA, USA) and quantified usingC19:0 (nonadecanoic acid) as internal stan-dard. Peak areas were corrected according tothe theoretical relative FID response correc-tion factors (TRFs) published by Ackman(2002). The results are presented as g/100 gfatty acids (% by weight).The percentage of the contribute of each
fatty acid was calculated on the total of thearea under the known peaks. Desaturaseindexes (Δ) were calculated according toSchennink et al. (2008) and the total desat-urase index (TDI) was calculated according toMele et al. (2007) on C14, C16 and C18 fattyacids; briefly, the individual Δ was calculatedas Cx:1/(Cx+Cx:1)*100, where x is the numberof carbons of fatty acid. The total desaturaseindex was calculated as [(C14:1 + C16:1 +C18:1) / (C14 + C14:1 + C16 + C16:1 + C18 +C18:1) * 100)].
Statistical analysisThe body measurements and morphologic
indexes data were processed by analysis ofvariance, by using the following general linearmodel (SAS, 2008):
yijkl = µ + Hi + Sj + Ak + SAjk + eijkl
whereyijkl = dependent variable (body measure ormorphologic index);µ� = overall mean;Hi = fixed effect of herd (10 levels);Sj = fixed effect of sex (2 levels);Ak = fixed effect of age-class (6 levels);SAjk = interaction between sex and age-class(12 levels);eijkl = residual error.Limitedly to HW and CC, the growth curves
were then calculated, through the applicationof the non-linear regression analysis to fit theGompertz equation in the following form:
P = b0 * exp (- exp (- b1 * (t - b2)))
where P is the body measure (cm) at the age t (d); b0is the measure at maturity, b1 is the rate ofgrowth and b2 the age at maximum growth.The described curve is a continue sigmoidcurve (France et al., 1996).
Communod et al.
Non-co
mmercial
use o
nly

[Ital J Anim Sci vol.12:e18, 2013] [page 109]
Data from milk TD controls were submittedto analysis of variance, using the followingmixed model (SAS, 2008):
yijklmno = μ + TDi + Hj + Lk + Sl + DIMm +Cn(Hj) + eijklmno
whereyijklmno = dependent variable;μ� = overall mean;TDi = fixed effect of the day of test (145 lev-els);Hj = fixed effect of herd (7 levels);Lk = fixed effect of lactation number (3 levels,1st, 2nd and ≥3rd);Sl = fixed effect of season of calving (4 levels,winter, spring, summer, autumn);DIMm = fixed effect of class of days in milk (44seven days classes plus one class for lactationsover 308 d);Cn(Hj) = random effect of individual cow with-in herd (59 levels);eijklmno = residual error.The lactation curve parameters for milk pro-
duction were calculated by means of the nonlinear regression analysis to fit the Wood(1967) model:
yn=A*nBe(Cn)
where yn is the production (kg/d) at day n, andA, B and C are the equation parameters (initialyield or scale factor, and slope during theascendant and the descendent phase of thecurve, respectively). The linear form of themodel (Macciotta et al., 2005) was used:
log yn=log A + B log n + Cn
The equation parameters were estimatedfor the whole sample or by lactation numberand calving season. The model was also fittedto TD records of each individual lactation; theadjusted R-square (ADJRSQ) was calculatedfor each individual curve and when ADJRSQswere >0.75, then the B and C parameters signwere highlighted, so to define three differentshapes of the lactation curve: standard, contin-uously decreasing and reversed (Macciotta etal., 2005).For standard curves with ADJRSQ >0.75, the
mean equation parameters were combined tocalculate the persistency (-(B+1)*lnC), thepeak day (B/C) and the peak production(A*(B/C)B*e–B) (Rekaya et al., 2000). Data con-cerning the size of fat globules and the analy-sis of fatty acids were submitted to analysis ofvariance by means of the following mixedmodel (SAS, 2008):
yijkl = μ + Li + DIMj + Ck + eijkl
whereyijkl = dependent variable;μ = overall mean;Li = fixed effect of lactation number (2 levels,2nd and 3rd);DIMj = fixed effect of stage of lactation (ten 20d classes from 40 to 220 d of lactation), testeduntil the 4th power;Ck = random effect of individual cow (10 lev-els);eijkl = residual error.
Results and discussion
Body measures and morphologicindexesThe study involved about 34% of the total
population of Cabannina cattle, so it can beconsidered as a good indicator of the actualstatus of the breed. The analysis of varianceapplied to body measures and morphologicindexes of Cabannina cattle (Table 1)revealed, along with a predictable and alwayshighly significant (P<0.001) effect of age-class(with the exception of CI; P>0.05), also a sig-nificant herd effect in 9 out of 14 body meas-
ures and in 3 out of 5 morphologic indexes.This finding is probably related to selectivechoices by individual farmers, who, while try-ing to adhere to the breed standard, sometimesselect to improve some specific traits, relatedto the production of meat (in particular highHW, LTr, DC) (Stålhammar et al., 1995) or milk(in particular high RL, low HC) (Strapak et al.,2011). Sex resulted as a source of variabilityfor LTr, CC, RW2 (P<0.05) and for the sizes ofthe head (P<0.01). The interaction betweensex and age-class was found to be significantfor some dimensions of the rump (P<0.05 andP<0.01), as far as for LH (P<0.001), CBC(P<0.001), PI (P<0.05) and DTI (P<0.001).High proportion of variability (R2>0.75) wasexplained by the model for all parameters, butnot for CI (R2=0.41).Table 2 shows the least squares means of
the interaction between sex and age-class forbody measures and morphologic indexes. Lowdifferences between males and females of thesame age-class have been found, though theresults could be affected by the low number ofanimals in some classes. When differenceswere significant, generally females showedlower values than males of the same age-class.An exception was in a measure of the width ofthe croup (RW3), where class 3 femalesshowed a significant higher value than males(which then reversed over time). Males with
Body and milk traits in Cabannina cattle
Table 1. Analysis of variance (F values) of body measures and morphologic indexes.
Source Herd Sex Age class Sex * age-class RSE R2
Df 10 1 5 5 66Body measures Height at withers 2.108* 3.143 159.850*** 1.001 4.3 0.965Height at croup 2.112* 1.479 119.661*** 1.075 4.7 0.954Length of the trunk 1.395 3.946* 110.387*** 0.957 7.4 0.950Depth of chest 0.259 0.028 20.309*** 0.568 8.0 0.801Chest width 4.303*** 2.298 33.335*** 0.992 4.1 0.901Length of the thorax 1.011 2.931 35.117*** 0.435 6.2 0.865Chest circumference 3.105** 5.475* 223.589*** 1.318 6.6 0.973RW1 2.509* 0.019 91.471*** 0.763 2.7 0.951RW2 7.574*** 5.027* 21.481*** 2.847** 2.5 0.862RW3 3.166** 0.025 19.329*** 2.145* 3.9 0.821Rump length 0.847 1.428 107.993*** 1.779* 2.3 0.956Cannon bone circumference 3.428** 3.409 42.337*** 3.393*** 1.0 0.889Length of head 4.510*** 7.180** 74.794*** 3.493*** 2.6 0.932Width of head 1.099 7.633** 33.561*** 1.395 1.8 0.823
Morphologic indexes Anamorphosis index 1.928 2.722 89.502*** 0.977 17.7 0.935Pelvic index 2.417* 1.242 8.080*** 2.251* 0.1 0.746Lateral corporal index 2.457* 0.464 15.336*** 1.284 0.0 0.770Corporal index 1.603 0.058 1.150 0.984 0.0 0.410Dactylo-thoracic index 3.430** 0.140 63.585*** 5.100*** 0.0 0.930
Df, degrees of freedom; RW1, rump width (distance between the two iliac tuberosities); RW2, rump width (distance between the twoischial tuberosities); RW3, rump width (distance between the hips). *P<0.05; **P<0.01; ***P<0.001.
Non-co
mmercial
use o
nly

[page 110] [Ital J Anim Sci vol.12:e18, 2013]
age >730 d were higher (about 6 cm) andlonger (about 13 cm) than females of the sameage class; they had a greater CC (about 18 cm),a wider rump, a more robust skeleton (greaterCBC, approximately 2.5 cm) and a longer andwider head (P<0.05). Moreover, starting from1 year of age, males showed a significantly(P<0.05) higher value of the anamorphosisindex than females, that indicates a greaterdimensional development, as reported also byFernandez et al. (2007). The differencesbetween males and females were highest attwo years of age (class 5) and then reduced(class 6).In males between 1 and 2 years of age and in
individuals of both sexes older than of 2 years,nine out of twelve body measures were greaterthan those reported in the breed standard(Associazione Italiana Allevatori, 2012b) andin previous studies (Usai, 1974; Orefice,1978). This tendency to an increased size isprobably related to recent crosses with highersized breeds, such as Italian Brown, aimed at ahigher milk (Sieber et al., 1988) and meat pro-duction, rather than to selection. Such behav-iour by farmers represents a danger to thebreed, because it affects a fundamental mor-phologic aspect. In fact, the small size is a pos-itive feature for Cabannina cattle exploiting
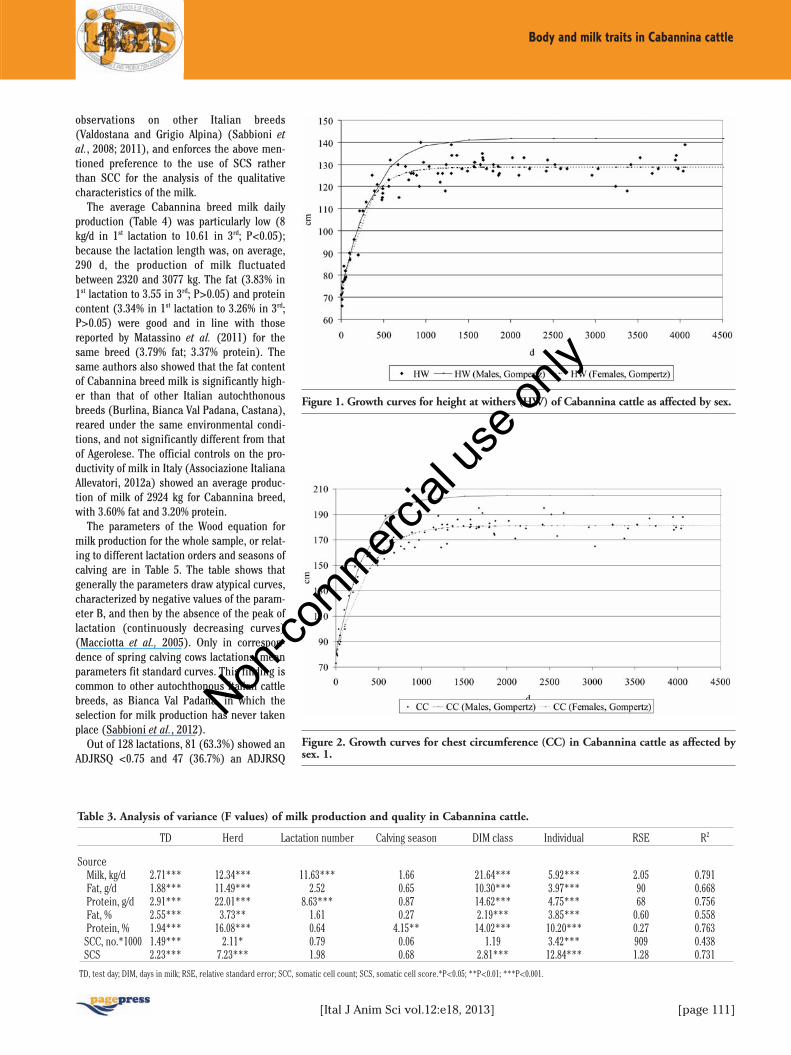
the pasture in a hill-mountain environment,because, lowering the centre of gravity, itallows them to be more stable in the slopingpastures. In addition, small-sized animals havelower maintenance requirements; in fact,when cattle is bred under a pasture regime,systems utilizing small cows are more prof-itable (Long et al., 1975). It could be thereforepositive to return quickly to the typical mor-phological features (low size) by means ofselection, abandoning cross-breeding.The analysis of growth curves for CC and
HW showed a great sexual dimorphism inadults (Figures 1 and 2), but the time when thedimorphism became apparent was different,depending on the measure concerned. It is evi-dent that for CC, young males differed fromfemales, while in the case of the HW, the twocurves were parallel up to about 500 d of ageand then they divided sharply. As previouslystated, this also affected the value of theanamorphosis index, that well describes themorphological type of animals and their apti-tude: typically, high values of the anamorpho-sis index indicate the ability for meat produc-tion (brachymorphic type) (Araújo et al., 2006)and reduced values the ability for milk produc-tion (dolichomorphic type) (Beretti et al.,2010).
Milk productionThe study involved over 80% of cows of the
breed that underwent the milk productivitycontrols, the remaining part of the cow’s popu-lation being distributed in several small sizedherds. The analysis of variance conducted onTD data (Table 3) revealed a highly significanteffect (P<0.001) of day of test and of the indi-vidual on all the production parameters consid-ered; the SCC showed a less important effect ofthe herd (P<0.05) and a non-significant effectof the class of DIM (P>0.05). Compared to theSCS, the SCC presented lower F values and,consequently, also a smaller R2: this is probablydue to the fact that SCC was not normally dis-tributed; it is therefore more correct to use theSCS value for the analysis. The lactation num-ber showed a significant effect only on milkand protein daily production (P<0.001), whilethe calving season was significant for the per-centage content of protein (P<0.01). Thisresult was common to other cattle breeds(Reggiana, Valdostana, Grigio Alpina, ItalianFriesian and Bianca Val Padana) under Italianenvironmental conditions (Sabbioni et al.,2003, 2008, 2011, 2012, 2013) and for Holsteinsin Arizona (Ray et al., 1992). The R2 wasalways higher than 0.55, less than for the SCC(0.44). This finding is supported by previous
Communod et al.
Table 2. Least squares means of body measures in cm and morphologic indexes in Cabannina cattle.
Age class1 2 3 4° 5 6
Female Male Female Male Female Male Female Male Female Male Female Male
Body measures Height at withers 70.8 74.0 79.7 84.0 88.5 96.0 - 107.0 120.6a 132.0b 128.4a 134.5b
Height at croup 71.8 75.0 82.3 87.0 90.0 98.0 - 109.0 120.3a 133.0b 127.6a 134.0b
Length of the trunk 67.8 70.0 79.7 79.0 90.0a 114.0b - 117.2 133.3a 148.0b 148.4a 161.5b
Depth of chest 31.5 31.5 33.0 38.0 40.0 49.0 - 54.5 63.7 70.0 69.9 63.5Chest width 17.5 16.5 22.7 22.0 22.0 32.0 - 33.5 39.6 45.0 46.0 45.0Length of the thorax 35.8 39.5 39.0 45.0 45.5 58.0 - 62.3 67.8 88.0 74.6 81.5Chest circumference 79.8 81.5 91.0 100.0 107.5 126.0 - 144.7 158.9a 189.0b 179.5a 197.5b
RW1 17.8 18.0 19.3 21.0 23.0 28.0 - 27.2 35.7 43.0 44.4 45.5RW2 8.3 11.0 10.0 19.0 12.0 16.0 - 20.8 19.9a 30.0b 20.1a 27.5b
RW3 22.0 21.5 24.7 31.0 27.5b 18.0a - 29.2 34.4 35.0 39.2a 44.0b
Rump length 23.8 23.5 24.0 28.0 31.5 28.0 - 35.5 42.4 42.0 49.1 48.5Cannon bone circumference 11.8 12.5 13.3 13.0 13.0 16.0 - 16.3 17.3 24.0 18.6a 21.0b
Length of head 18.5 17.0 21.3 18.0 24.5 26.0 - 27.2 35.3 32.0 39.7a 47.5b
Width of head 11.8 10.0 12.3 12.0 15.0 17.0 - 20.8 19.5 21.0 19.8a 26.0bMorphologic indexes Anamorphosis index 90.2 90.1 104.0 119.0 130.9 165.4 - 195.8 209.5a 270.6b 251.7a 290.2b
Pelvic index 0.754 0.761 0.808 0.750 0.732 1.000 - 0.767 0.842 1.024 0.905 0.944Lateral corporal index 1.044 1.063 1.003 1.063 0.984 0.842 - 0.914 0.906 0.892 0.867 0.833Corporal index 0.850 0.859 0.875 0.790 0.839 0.905 - 0.810 0.839 0.783 0.828 0.818Dactylo-thoracic index 0.147 0.154 0.147 0.130 0.122 0.127 - 0.113 0.109 0.127 0.103 0.106
°No females in age class 4 were measured. RW1, rump width (distance between the two iliac tuberosities); RW2, rump width (distance between the two ischial tuberosities); RW3, rump width (distancebetween the hips). a,bDifferences between sexes within age class (P<0.05).
Non-co
mmercial
use o
nly
[Ital J Anim Sci vol.12:e18, 2013] [page 111]
observations on other Italian breeds(Valdostana and Grigio Alpina) (Sabbioni etal., 2008; 2011), and enforces the above men-tioned preference to the use of SCS ratherthan SCC for the analysis of the qualitativecharacteristics of the milk.The average Cabannina breed milk daily
production (Table 4) was particularly low (8kg/d in 1st lactation to 10.61 in 3rd; P<0.05);because the lactation length was, on average,290 d, the production of milk fluctuatedbetween 2320 and 3077 kg. The fat (3.83% in1st lactation to 3.55 in 3rd; P>0.05) and proteincontent (3.34% in 1st lactation to 3.26% in 3rd;P>0.05) were good and in line with thosereported by Matassino et al. (2011) for thesame breed (3.79% fat; 3.37% protein). Thesame authors also showed that the fat contentof Cabannina breed milk is significantly high-er than that of other Italian autochthonousbreeds (Burlina, Bianca Val Padana, Castana),reared under the same environmental condi-tions, and not significantly different from thatof Agerolese. The official controls on the pro-ductivity of milk in Italy (Associazione ItalianaAllevatori, 2012a) showed an average produc-tion of milk of 2924 kg for Cabannina breed,with 3.60% fat and 3.20% protein.The parameters of the Wood equation for
milk production for the whole sample, or relat-ing to different lactation orders and seasons ofcalving are in Table 5. The table shows thatgenerally the parameters draw atypical curves,characterized by negative values of the param-eter B, and then by the absence of the peak oflactation (continuously decreasing curves)(Macciotta et al., 2005). Only in correspon-dence of spring calving cows lactations, meanparameters fit standard curves. This finding iscommon to other autochthonous Italian cattlebreeds, as Bianca Val Padana, in which theselection for milk production has never takenplace (Sabbioni et al., 2012).Out of 128 lactations, 81 (63.3%) showed an
ADJRSQ <0.75 and 47 (36.7%) an ADJRSQ
Body and milk traits in Cabannina cattle
Figure 1. Growth curves for height at withers (HW) of Cabannina cattle as affected by sex.
Figure 2. Growth curves for chest circumference (CC) in Cabannina cattle as affected bysex. 1.
Table 3. Analysis of variance (F values) of milk production and quality in Cabannina cattle.
TD Herd Lactation number Calving season DIM class Individual RSE R2
SourceMilk, kg/d 2.71*** 12.34*** 11.63*** 1.66 21.64*** 5.92*** 2.05 0.791Fat, g/d 1.88*** 11.49*** 2.52 0.65 10.30*** 3.97*** 90 0.668Protein, g/d 2.91*** 22.01*** 8.63*** 0.87 14.62*** 4.75*** 68 0.756Fat, % 2.55*** 3.73** 1.61 0.27 2.19*** 3.85*** 0.60 0.558Protein, % 1.94*** 16.08*** 0.64 4.15** 14.02*** 10.20*** 0.27 0.763SCC, no.*1000 1.49*** 2.11* 0.79 0.06 1.19 3.42*** 909 0.438SCS 2.23*** 7.23*** 1.98 0.68 2.81*** 12.84*** 1.28 0.731
TD, test day; DIM, days in milk; RSE, relative standard error; SCC, somatic cell count; SCS, somatic cell score.*P<0.05; **P<0.01; ***P<0.001.
Non-co
mmercial
use o
nly

[page 112] [Ital J Anim Sci vol.12:e18, 2013]
>0.75. By limiting the survey to the latter, thedata presented in Table 6 (Figure 3) wereobtained. Standard curves were 74.5%, contin-uously decreasing 21.3% and reversed stan-dard 4.3%. No continuously increasing curveswere detected. Standard curves with ADJRSQ>0.75 have shown a high decreasing rate (per-sistence = 7.7%), a very high value of days atpeak (103 d) and a peak production of 20.18 kgof milk.
Fat globules size and fatty acidscontentMeans of Cabannina fat globules size and
specific surface area are summarized in Table7. The data confirmed the results shown in arecent survey by Communod et al. (2012), inwhich Cabannina breed showed smaller fatglobules than Friesian cows, and, consequent-ly, the highest specific surface area. The spe-cific surface area were twofold in Cabanninathan in Friesian fat globules; this means thatsmall fat globules contains twice as much fatglobule membrane material (trilayered biolog-ical membrane) per unit triglyceride content,as reported by Michalsky et al. (2005).It has been reported (Communod et al.,
2012; Martini et al., 2013) that in cow and inewe’s milk the globule diameter decreases dur-ing lactation. In our study, this reduction is
more evident in the first part of lactation, slow-ing down until it reaches a plateau at the 5th
month. This remarkable initial decrease in fatglobule diameter during the first lactationperiod could be explained by the maturation ofthe mammary gland that progressively pro-vides more membrane to cover milk fat core, assuggested in a recent study by Michalsky et al.(2005). In the second part of lactation, the
results of the actual research are in contrastwith those obtained by Communod et al.(2012), whereas they confirm the results byMichalsky et al. (2005), who described a subse-quent increase in mature fat globule size dur-ing later months of lactation, probably due tothe increased fat content and limited availablemembrane coverage.The size of milk fat globules is directly relat-
Communod et al.
Figure 3. Different shapes of the lactation curve for milk production in Cabannina cattle(curves with adjusted R-square >0.75).
Table 4. Least squares means (±SE) of milk production and quality as affected by lactation number and calving season.
Lactation number Calving season
1 2 ≥3 Spring Summer Autumn Winter
Milk, kg/d 8.00±0.37a 9.10±0.28b 10.61±0.30c 9.27±0.30 9.04±0.32 8.90±0.37 9.73±0.29Fat, g/d 310±16 335±12 364±13 337±13 335±14 324±16 349±13Protein, g/d 264±12a 297±9b 339±10c 309±10 298±11 286±12 306±10Fat, % 3.83±0.11 3.72±0.08 3.55±0.09 3.73±0.09 3.75±0.09 3.65±0.11 3.68±0.08Protein, % 3.34±0.05 3.31±0.04 3.26±0.04 3.40±0.04b 3.30±0.04ab 3.29±0.05ab 3.23±0.04a
SCS 3.70±0.23 3.31±0.17 3.41±0.19 3.65±0.19 3.31±0.20 3.35±0.23 3.59±0.18
SCS, somatic cell score. a,b,cDifferent at P<0.05.
Table 5. Parameters (±SE) of the Wood’s equation for milk production in kg/d, as affected by lactation number and calving season.
No. of observations A B C RSE ADJRSQ
All 991 17.83±1.08 -0.070±0.022 -0.00080±0.00009 0.14 0.388Lactation number
1 212 13.50±1.17 -0.083±0.043 -0.00032±0.00016 0.12 0.2212 180 14.24±1.16 -0.017±0.041 -0.0092±0.00017 0.12 0.437≥3 599 20.43±1.10 -0.076±0.028 -0.00094±0.00012 0.13 0.448
Calving season Spring 233 11.39±1.17 0.086±0.049 -0.00183±0.00025 0.14 0.430Summer 192 24.63±1.19 -0.181±0.049 -0.00027±0.00019 0.13 0.352Autumn 181 14.93±1.21 -0.077±0.051 -0.00051±0.00019 0.12 0.294Winter 385 17.83±1.12 -0.039±0.032 -0.00099±0.00012 0.13 0.471
RSE, residual standard error; ADJRSQ, adjusted R-square.
Non-co
mmercial
use o
nly

[Ital J Anim Sci vol.12:e1, 2013] [page 113]
ed to the physiology of the mammal femaleproducing milk (Lopez, 2011). The secretion ofsmall milk fat globules is a biological processthat requires the production of high amountsof membrane material to cover the whole sur-face of the lipid droplets and thus a high syn-thesis activity of the lactating cells (Lopez,2011). Cabannina cows that secrete small fatglobules could have a potential higher mam-mary metabolic activity than those secretinglarge fat globules (Communod et al., 2012).Having more abundant milk fat globule mem-brane (MFGM) could have important effects oncheese making processes (Martini et al.,2008), such as better incorporation of MFGMin cheese, higher resistance to churning, andmore extensive water retention by the mem-brane, resulting in less firmness but also bet-ter storage ability (Michalski et al., 2002).The high mammary activity is suggested
also by high desaturase indexes, if comparedto literature (Schennink et al., 2008; Heck etal., 2009; Garnsworthy et al., 2010), especiallyΔ14, Δ16 and Δ18 (Table 7); these indexescould also explain the ability of Cabanninacows to produce more unsaturated fatty acidsthan Friesian cows (Schennink et al., 2008,Communod et al., 2012).In the last years the importance of milk fat
in human and animal nutrition has come rap-idly to the fore. Several nutritionistAssociations recommend the intake of higherlevels of cis-MUFA in milk despite of SFA levels(Kris-Etherton, 1999). The content in cis-MUFA found in the present research is quitesimilar to data reported in the recent literature(Mansson, 2008; Soyeurt et al., 2008; Heck etal., 2009; Gaspardo et al., 2010), with someexceptions: in particular, the C14:1cis9 andC16:1cis9 levels were higher, whereasC18:1cis9 showed slight lesser levels thanthose reported by Mansson (2008), Soyeurt etal. (2008) and Gaspardo et al. (2010). Also thedesaturase indexes overlap with those report-ed by other authors, with slightly reduced Δ14levels (Schennink et al., 2008; Heck et al.,2009; Garnsworthy et al., 2010). The enhancement of the cis-MUFA in milk is
desirable for the human consumption, asreported by Givens (2008). Higher intakes ofcis-MUFA and a reduction in short fatty acidsreduce the plasma insulin levels, the total plas-ma cholesterol and the LDL-cholesterol con-centrations, therefore reducing the risks ofcoronary heart disease. The positive effects ofcis-MUFA can exert also on the udder health.During mastitis, for example, an enhancementin lipase activity can be appreciated, withincrease in free fatty acids, mainly short chainfatty acids (Randolph and Erwin, 1974); sever-
al fatty acids are endowed of a good antibioticpower, that can be expressed via inhibition ofenzyme/fatty acid synthesis/nutrient uptake,cell lysis, metabolites leakage, disruption ofelectron transport chain, interference withoxidative phosphorylation and lipid peroxida-tion (Desbois and Smith, 2010). By enhancingthe activity of stearoyl CoA desaturase, thenutritional value of milk would be positively
ameliorated, but a simple up regulation of itsactivity seems to be limited, as reported in acomprehensive milk lipid synthesis model(Shorten et al., 2004). In our study, Cabannina cows showed both
higher levels of cis-MUFAs and of desaturaseindexes if compared with recent literature(Schennink et al., 2008; Garnsworthy et al.,2010; Communod, 2012). These features could
Body and milk traits in Cabannina cattle
Table 6. Frequency of lactation curves with different shapes and mean values (±SD) ofparameters calculated only from individual curves with adjusted R-square >0.75 inCabannina cattle.
Shape Frequency Log A Log B Log CN % Mean SD Mean SD Mean SD
All 47 100 0.91 0.58 0.231 0.429 -0.00292 0.00258Standard 35 74.5 0.73 0.56 0.365 0.406 -0.00355 0.00261Continuously decreasing 10 21.3 1.36 0.15 -0.099 0.136 -0.00152 0.00089Reversed standard 2 4.3 1.73 0.38 -0.460 0.205 0.00113 0.00115
Table 7. Ls means for d43 (volume weighted diameter), specific surface area, fatty acidsand desaturase indexes of milk fat in Cabannina cows.
Mean ±SD Trend during lactation
Parameter d43, μm �2.92±0.32 i,hSSA, cm2*mL–1 25,534±2474 h �
Fatty acids SFA C14:0, % 15.16 ±5.74 nsC16:0, % 34.44± 7.46 nsC18:0, % 9.26 ± 2.29 ns
MUFA C14:1-cis9, % 1.19 ± 0.26 h�C15:1-cis10, % 0.09 ± 0.15 i�C16:1-cis9, % 1.92 ± 0.67 h�C17:1-cis10, % 0.16 ± 0.22 iC18:1-cis9, % 19.31 ± 4.31 nsC20:1-cis11, % 0.05 ± 0.14 i�C22:1-cis13, % 0.01 ± 0.03 �i∑cis-MUFA, % 22.40 ± 5.35 nsC18:1-cis / C18:0 2.03 ± 0.45 �h
PUFA, % C18:3n3 0.56 ± 0.47 nsC18:3n6 0.001 ± 0.004 nsC20:2 0.02 ± 0.01 nsC20:3n3 0.01 ± 0.03 nsC20:3n6 0.04 ± 0.05 nsC18:2-cis9-trans11 0.34 ± 0.11 ns
Desaturase indexes Δ14 7.29 ± 4.24 �hΔ16 5.28 ± 3.07 �hΔ18 67.58 ± 4.56 �h
�� 27.58 ± 3.96 ns
SSA, specific surface area; MUFA, monounsaturated fatty acids; cis-MUFA, cis-monounsaturated fatty acids; PUFA, polyunsaturatedfatty acids; Δ, desaturase index; Σ, total desaturase indexes.h, increasing trend during lactation (P<0.05); i�,decreasing trend dur-ing lactation (P<0.05). ns, not significant.
Non-co
mmercial
use o
nly

[page 114] [Ital J Anim Sci vol.12:e18, 2013]
be linked to genetics, by complex interaction ingene/allele expressions, as evidenced bySchennink et al. (2008). Another importantcharacteristic taken into account was the oleicacid content, in relation to stearic acid content.C18:1cis/C18:0 trend increases with the lacta-tion stage. Recent studies (Schwartz et al.,2008; Dipasquale et al., 2010) showed thatoleic acid introduced by diet is the most impor-tant substrate to produce a lipid amide by ente-rocytes, involved in the induction of satiety.This compound is oleoylethanolamide (OEA)and, as reported by Dipasquale et al. (2010),has several characteristics of satiety factor: itinhibits feeding by prolonging the interval tonext meal. OEA synthesis is regulated by nutri-ent availability and its levels undergo circadianfluctuations.
Conclusions
The study confirmed the low milk produc-tion of Cabannina cattle and highlighted thatthe lactation curves are frequently far from astandard shape, and that, also when the shapeis in the standard type, the peak is very lateand the persistence is low. Smaller dimensional aspect of Cabannina
milk globules could become an important rea-son to recover this autochthonous breed,because this peculiar feature could assign tomilk fat globules a potential higher digestibili-ty, influencing pancreatic lipase activity. Smallglobule dimension highlights the crucial roleof the MFGM in the efficient digestion of milkfat globules and brings new perspectives forthe design of dairy products and infant formu-las. Moreover, the results suggest that it isinteresting to assume that from a breed biodi-versity could derive a milk biodiversity, show-ing in the forthcoming years peculiar nutri-tional and nutraceutical aspects in this differ-ent milk and dairy products derived.Meat production has a lower importance
because the breed is small sized: nevertheless,males can be an important source of income.Males reach the highest differences in sizewith females at approximately two years;moreover, crosses with larger breeds should beavoided in future, to maintain the breed effi-ciency in pasture systems.Further studies should be conducted at farm
level to optimize feeding and pasture quality,in order to improve the potentiality of thebreed.
References
Ackman, R.G., 2002. The gas chromatograph inpractical analyses of common and uncom-mon fatty acids for the 21st century. Anal.Chim. Acta 465:175-192.
Araújo, J P., Machado, H., Cantalapiedra, J.,Iglesias, A., Petim-Batista, F., Colaço, J.,Sánchez, L., 2006. Biometric andliveweight analysis of Minhota beef cows.pp 15-32 in Proc. 8th World Congr.Genetics Appl. Livest. Prod., BeloHorizonte, Brazil.
Associazione Italiana Allevatori, 2012a.Bollettino dei Controlli della Produttivitàdel Latte. Available from: http://bollettino.aia.it/bollettino/bollettino.htm
Associazione Italiana Allevatori, 2012b. Normetecniche del Registro Anagrafico dellerazze bovine autoctone a limitata diffu-sione. Available from: http://www.aia.it/aia-website/it/attivita/area-tecnica/ufficio-sviluppo/razze-bovine-autoctone
Beretti, V., Simonazzi, D., Paini, V., Superchi,P., Sabbioni, A., 2010. Body measures inReggiana cattle and their correlations withmorphological evaluations. Ann. Fac. Med.Vet. Parma 30:89-100.
Communod, R., 2012. Bovine lactation andreproduction physiology: a survey on somefundamental features in autochthonousdairy breeds reared in northern Italy.Degree Diss., University of Milano, Italy.
Communod, R., Faustini, M., Chiesa, L.M.,Torre, M.L., Lazzati M., Vigo, D., 2012. Milkbiodiversity: future perspectives of milkand dairy products from autochthonousdairy cows reared in northern Italy. In: A.Aladjadjiyan (ed.) Food production -Approaches, challenges and tasks. InTechOn-line Publ., pp 169-184.
Desbois, A.P., Smith, V.J., 2010. Antibacterialfree fatty acids: activities, mechanisms ofaction and biotechnological potential.Appl. Microbiol. Biotech. 85:1629-1642.
Dipasquale, P., Romano, A., Cianci, S.,Righetti, L., Gaetani, S., 2010.Oleoylethanolamide: a new player in ener-gy metabolism control. Role in food intake.Drug Discov. Today 7:e169-e174.
FAO, 2009. How to feed the world in 2050.Available from: http://www.fao.org/filead-min/templates/wsfs/docs/expert_paper/How_to_Feed_the_World_in_2050.pdf
Fernandez. E.N., Martinez, R.D., Genero, E.R.,Broccoli, A.M., 2007. Indices zoometricosen bovinos criollos de origen patagonico ydel noroeste argentino. Veterinaria(Montevideo) 42:23-27.
France, J, Dijkstra, J, Thornley, J.H., DhanoaM.S., 1996. A simple but flexible growthfunction. Growth Develop. Aging 60:71-83.
Garnsworthy, P.C., Feng, S., Lock, A.L., Royal,M.D., 2010. Heritability of milk fatty acidcomposition and stearoyl-CoA desaturaseindices in dairy cows. J. Dairy Sci.93:1743-1748.
Gaspardo, B., Lavrencic, A., Levart, A., DelZotto, S., Stefanon, B., 2010. Use of milkfatty acids composition to discriminatearea of origin of bulk milk. J. Dairy Sci.93:3417-3426.
Givens, D.I., 2008. Challenges facing the foodindustry in innovating for health: impacton CVD risk of modifying milk fat todecrease intake of SFA and increaseintake of cis-MUFA. pp 419-427 in Proc.Nat. Symp. Nutrition Society of theUniversity of Dublin, Dublin, Ireland.
Guida, S., 2011. Caratterizzazione morfologicae studio della curva di lattazione nellarazza bovina Cabannina. Degree Diss.,University of Parma, Italy.
Heck, J.M.L., Valenberg, H.J.F.V.,Dijkstra, J.,Hooijdonk, A.C.M.V., 2009. Seasonal varia-tion in the Dutch bovine raw milk compo-sition. J. Dairy Sci. 92:4745-4755.
Kris-Etherton, P.M., 1999. AHA Science adviso-ry: monounsaturated fatty acids and risk ofcardiovascular disease. J. Nutr. 129:2280-2284.
Long, C.R, Cartwrigh, T.C., Fitzhugh Jr., H.A.,1975. Systems analysis of sources ofgenetic and environmental variation inefficiency of beef production: cow size andherd management. J. Anim. Sci. 40:409-420.
Lopez, C., 2005. Focus on the supramolecularstructure of milk fat in dairy products.Reprod. Nutr. Dev. 45:497-511.
Lopez, C., 2011. Milk fat globules enveloped bytheir biological membrane: Unique col-loidal assemblies with a specific composi-tion and structure. Curr. Opin. Colloid. In.16:392-404.
Macciotta, N.P.P., Vicario, D., Cappio-Borlino,A., 2005. Detection of different shapes oflactation curve for milk yield in dairy cattleby empirical mathematical models. J.Dairy Sci. 88:1178-1191.
Magliano, A., 1950. Ezoognosia generale.Vallardi Ed., Milano, Italy.
Manirakiza, P., Covaci, A., Schepens, P., 2001.Comparative study on total lipid determi-nation using Soxhlet, Roese-Gottlieb,bligh & dyer, and modified bligh & dyerextraction methods. J. Food Compos. Anal.14:93-100.
Mansson, H.L., 2008. Fatty acids in bovine milk
Communod et al.
Non-co
mmercial
use o
nly

[Ital J Anim Sci vol.12:e18, 2013] [page 115]
fat. Food Nutr. Res. 52:10-34.Martini, M., Altomonte, I., Salari, F., 2013.
Evaluation of the fatty acid profile from thecore and membrane of fat globules inewe’s milk during lactation. LWT-Food Sci.Technol. 50:253-258.
Martini, M., Scolozzi, C., Cecchi, F., Mele, M.,Salari, F., 2008. Relationship between mor-phometric characteristics of milk fat glob-ules and the cheese making aptitude ofsheep’s milk. Small Ruminant Res. 74:194-201.
Matassino, D., Barone, C.M.A., Castellano, N.,Gigante, G., Grasso, M., Zullo, A., 2011.Effect of autochthonous bovine genetictype on some quanti-qualitative character-istics of milk. Ital. J. Anim. Sci.10(Suppl.1):13 (abstr.).
Mele, M., Conte, G., Castiglioni, B., Chessa, S.,Macciotta, N.P.P., Serra A., Buccioni, A.,Pagnacco, G., Secchiari, P., 2007. Stearoyl-Coenzyme A desaturase gene polymor-phism and milk fatty acid composition inItalian Holsteins. J. Dairy Sci. 90:4458-4465.
Meregalli, A., 1980. Conoscenza morfo-funzio-nale degli animali domestici. Liviana Ed.,Padova, Italy.
Michalski, M.C., Briard, V., Michel, F., Tasson,F., Poulain, P., 2005. Size distribution of fatglobules in human colostrum, breast milk,and infant formula. J. Dairy Sci. 88:1927-1940.
Michalski, M.C., Cariou, R, Michel, F., Garnier,C., 2002. Native vs. damaged milk fat glob-ules: membrane properties affect the vis-coelasticity of milk gels. J. Dairy Sci.85:2451-2461.
Molto-Puigmartì, C., Castellote, A.I., Lopez-Sabater, M.C., 2007. Conjugated linoleicacid determination in human milk by fast-gas chromatography. Anal. Chim. Acta602:122-130.
Orefice, G., 1978. Studio dei caratteri morfolo-gici e produttivi di una razza bovina autoc-
tona della valle d’Aveto. Degree Diss.,University of Pisa, Italy.
Randolph, H.E., Erwin, R.E,. 1974. Influence ofmastitis on properties of milk.X. Fatty-acidcomposition. J. Dairy Sci. 57:865-868.
Ray, D.E., Halbach, T. J., Armstrong, D. V., 1992.Season and lactation number effects onmilk production and reproduction of dairycattle in Arizona. J. Dairy Sci. 75:2976-2983.
Rekaya, R., Carabano, M.J., Toro, M.A., 2000.Bayesian analysis of lactation curves ofHolstein-Friesian cattle using a non linearmodel. J. Dairy Sci. 83:2691-2701.
Sabbioni, A., Beretti, V., Superchi, P., 2008.Curve di lattazione in bovine di razzaValdostana. Sci. Tecn. Latt. Cas. 59:345-349.
Sabbioni, A., Beretti, V., Tardini, L., Vezzali, S.,Paini, V., Superchi, P., 2012. Milk produc-tion and lactation curves of Bianca ValPadana and Italian Friesian dairy cows inrelation to the management system. Ital. J.Anim. Sci. 11:e26.
Sabbioni, A., Beretti, V., Tardini, L., Vezzali, S.,Paini, V., Superchi, P., 2013. Frequenzadelle curve di lattazione standard e atipi-che per latte, grasso, proteine e lattosio inbovine di razza Bianca Val Padana. Sci.Tecn. Latt. Cas. (In press).
Sabbioni, A., Beretti, V., Zanon, A., Franceschi,P., 2003. Factors affecting the shape of thelactation curve in Reggiana cattle. Ital. J.Anim. Sci. 2(Suppl.1):278-280.
Sabbioni, A., Superchi, P., Beretti, V.,Malacarne, M., Quagliati, C., Summer, A.,2011. Curve di lattazione in bovine dirazza Grigio Alpina. Sci. Tecn. Latt. Cas.62:301-308.
SAS, 2008. User’s Guide: Statistics, ver. 9.2.SAS Inst. Inc., Cary, NC, USA.
Schennink, A., Heck, J.M.L., Bovenhuis, H.,Visker, M.H.P.W., Valenberg, H.J.F.V.,Arendonk, J.A.M.V., 2008. Milk fatty acidunsaturation: genetic parameters and
effects of Stearoyl-CoA desaturase (SCD1)and Acyl CoA: diacylglycerol acyltrans-ferase 1 (DGAT1). J. Dairy Sci. 91:2135-2143.
Schwartz, G.J., Fu, J., Astarita, G., Li, X,Gaetani, S., Campolongo, P., Cuomo, V.,Piomelli D., 2008. The lipid messengerOEA links dietary fat intake to satiety. CellMetab. 8:281-288.
Shook, G.E., Schutz, M.M., 1994. Selection onSomatic Cell Score to improve resistanceto mastitis in the United States. J. DairySci. 77:648-658.
Shorten, P.R., Pleasants, T.B., Upreti, G.C.,2004. A mathematical model for mammaryfatty acid synthesis and triglycerideassembly: the role of stearoyl CoA desat-urase (SCD). J. Dairy Res. 71:385-397.
Sieber, M., Freeman, A.E., Kelley, D.H., 1988.Relationships between body measure-ments, body weight, and productivity inHolstein dairy cows. J. Dairy Sci. 71:3437–3445.
Soyeurt, H., Dehareng, F., Mayeres, P.,Bertozzi, C., Gengler, N., 2008. Variation ofΔ9- desaturase activity in dairy cattle. J.Dairy Sci. 91:3211-3224.
Stålhammar, H., Henningsson, T., Philipsson,J., 1995. Factors influencing ultrasonicscanning measures, muscularity scoresand body measures in performance-testeddairy bulls and their usefulness as predic-tors of beef production ability in Friesiancattle. Acta Agr. Scand. A-An. 47:230-239.
Strapak, P., Juhas, P., Strapakova, E., 2011. Therelationship between the length of produc-tive life and the body conformation traitsin cows. J. Cent. Eur. Agr. 12:239-254.
Usai, G., 1974. Ricerche biometriche sullarazza bovina Cabannina in provincia diGenova. Specialization Diss., University ofMilano, Italy.
Wood, P.D.P., 1967. Algebraic model of the lac-tation curve in cattle. Nature 216:164-165.
Body and milk traits in Cabannina cattle
Non-co
mmercial
use o
nly