Coagulating Potential of Fresh Cow Milk from Dairy Cattle in ...
127
UNIVERSITY OF GHANA COLLEGE OF BASIC AND APPLIED SCIENCES COAGULATING POTENTIAL OF FRESH COW MILK FROM DAIRY CATTLE IN GHANA AND THE ECONOMIC VALUE OF PROCESSING CHEESE BY CECILLE WENDY ABOAGYE (10387989) THIS THESIS IS SUBMITTED TO THE UNIVERSITY OF GHANA, LEGON IN PARTIAL FULFILLMENT OF THE REQUIREMENT FOR THE AWARD OF MPHIL FOOD SCIENCE DEGREE JULY, 2018
-
Upload
khangminh22 -
Category
Documents
-
view
2 -
download
0
Transcript of Coagulating Potential of Fresh Cow Milk from Dairy Cattle in ...

UNIVERSITY OF GHANA
COLLEGE OF BASIC AND APPLIED SCIENCES
COAGULATING POTENTIAL OF FRESH COW MILK FROM DAIRY
CATTLE IN GHANA AND THE ECONOMIC VALUE OF PROCESSING
CHEESE
BY
CECILLE WENDY ABOAGYE (10387989)
THIS THESIS IS SUBMITTED TO THE UNIVERSITY OF GHANA,
LEGON IN PARTIAL FULFILLMENT OF THE REQUIREMENT FOR
THE AWARD OF MPHIL FOOD SCIENCE DEGREE
JULY, 2018

I
DECLARATION
I declare that this work was conducted by me under supervision in the Department of Nutrition
and Food Science, University of Ghana, Legon.
…………………………………….. ……………………………………
CECILLE WENDY ABOAGYE DATE
(STUDENT)
………………………………………. ………………………………….
DR. MAAME YAAKWAAH ADJEI DATE
(SUPERVISOR)
………………………………………. ………………………………….
PROF. FIRIBU KWESI SAALIA ` DATE
(CO-SUPERVISOR)

II
DEDICATION
I dedicate this research work to the Almighty Lord for how far He has brought me, my parents:
Mr. John Aboagye and Mrs. Agatha Aboagye and my best friend Mr. Alfred Agbekudzi.

III
ACKNOWLEDGEMENT
I am very grateful to the Almighty God for the courage, strength and knowledge He provided me
throughout the project. I am grateful to my parents for their financial and moral support. My
gratitude also goes to my supervisors, Dr. Maame Yaakwaah Adjei and Prof. Firibu Kwesi Saalia,
whose selfless guidance, supervision and funds allowed me to carry out this project. I am also
grateful to all the workers in the Sensory lab especially Miss Priscilla Ahadzi and Nana Kwabena
Nketia and my friends Yaw Doe Akumey, Kwame Dzardeh, Anthony Acquatey-Mensah, Bernard
Aseidu and Emmanuel Berko for their help. My thanks also go to the lab technicians at the
Department of Nutrition and Food Science for their technical guidance and Mr. Alfred Agbekudzi
who motivated me any time things were difficult.
My gratitude also goes to the dairy farmers who provided me with milk for my project work, I say
a very big thank you. I also want to show my gratitude to Mr. Frimpong the Deputy Director of
Amrahia Farms. He provided me with a lot of insight on the cattle breeds in Ghana. Finally, I
would like to acknowledge the Dairy Research, Improvement and Innovation Consortium
(DRIINC) through the Dairy Technology Center Project for providing me with some funds for my
work.

IV
TABLE OF CONTENT
DECLARATION ......................................................................................................................... i
DEDICATION ............................................................................................................................ ii
ACKNOWLEDGEMENT ......................................................................................................... iii
TABLE OF CONTENT.......................................................................................................... iv
LIST OF FIGURES ..................................................................................................................... v
LIST OF TABLES ................................................................................................................... viii
ABSTRACT ................................................................................................................................ x
CHAPTER ONE ......................................................................................................................... 1
1.0 INTRODUCTION ............................................................................................................. 1
1.1 Cattle Rearing in Ghana ................................................................................................. 1
1.2 Problem statement .......................................................................................................... 2
1.3 RATIONALE ................................................................................................................. 4
1.4 OBJECTIVES ................................................................................................................ 4
1.4.1 Main Objective............................................................................................................ 4
1.4.2 Specific Objectives ..................................................................................................... 5
CHAPTER TWO......................................................................................................................... 6
2.0 LITERATURE REVIEW .................................................................................................. 6
2.1 Cattle Breeds in Ghana .................................................................................................. 6
2.2 Milk Composition and Physicochemical Properties ...................................................... 9
2.3 Coagulation of Milk ..................................................................................................... 14
2.4 Cheese .......................................................................................................................... 19
2.5 Factors Influencing Coagulation .................................................................................. 21
2.5.4 Temperature .............................................................................................................. 23
2.5.5 Conclusion ................................................................................................................ 24
CHAPTER THREE ................................................................................................................... 25
3.0 MATERIALS AND METHODS .................................................................................... 25
3.1 Materials ...................................................................................................................... 25
3.2 Experimental Design .................................................................................................... 25
3.3 Objective 1 – Physicochemical analyses of milk samples ........................................... 30
3.4 Objective 2- Potential of the milks to coagulate using different coagulants ............... 32

V
3.5 Objective 3- Physicochemical Analysis on dewatered coagulum obtained from
different coagulants and milks ........................................................................................... 32
3.6 Objective 4 – Sensory and Physicochemical properties of the dewatered coagulum .. 34
3.7 Objective 5 – Setting up, running and producing cheese in a cheese factory (Economic
analysis) ............................................................................................................................. 36
3.8 Statistical analyses ....................................................................................................... 38
CHAPTER FOUR ..................................................................................................................... 39
4.0 RESULTS AND DISCUSSION ...................................................................................... 39
4.1 Physicochemical properties of milk that influence coagulation .................................. 39
4.2 Coagulating potential of the milks from the different breeds using different coagulants
............................................................................................................................................ 44
4.3 Physicochemical properties of dewatered coagulum obtained .................................... 48
4.4 Sensory and physicochemical properties of pooled milk coagulum ............................ 60
4.5 Cost of setting up, running and producing cheese in a cheese factory ........................ 70
4.5.1 Total Capital Investment ........................................................................................... 70
4.5.2.1 Direct Production Cost ........................................................................................... 75
CHAPTER FIVE ....................................................................................................................... 89
5.0 CONCLUSION AND RECOMMENDATION .............................................................. 89
5.1 Conclusions .................................................................................................................. 89
5.2 Recommendations ........................................................................................................ 90
REFERENCES .......................................................................................................................... 91
APPENDIX- Anova Tables and Tukey’s Pairwise comparisons ........................................... 103
LIST OF FIGURES
Figure 2.1: The Structure of Casein Micelle in the Sub-Micelles. Model Showing the Protruding
C-Terminal Parts of Κ-Casein as Proposed by Walstra. (Source:(Walstra, 1999) ................ 14
Figure 2.2: Sodom Apple (Calotropis procera) Plant .................................................................. 18
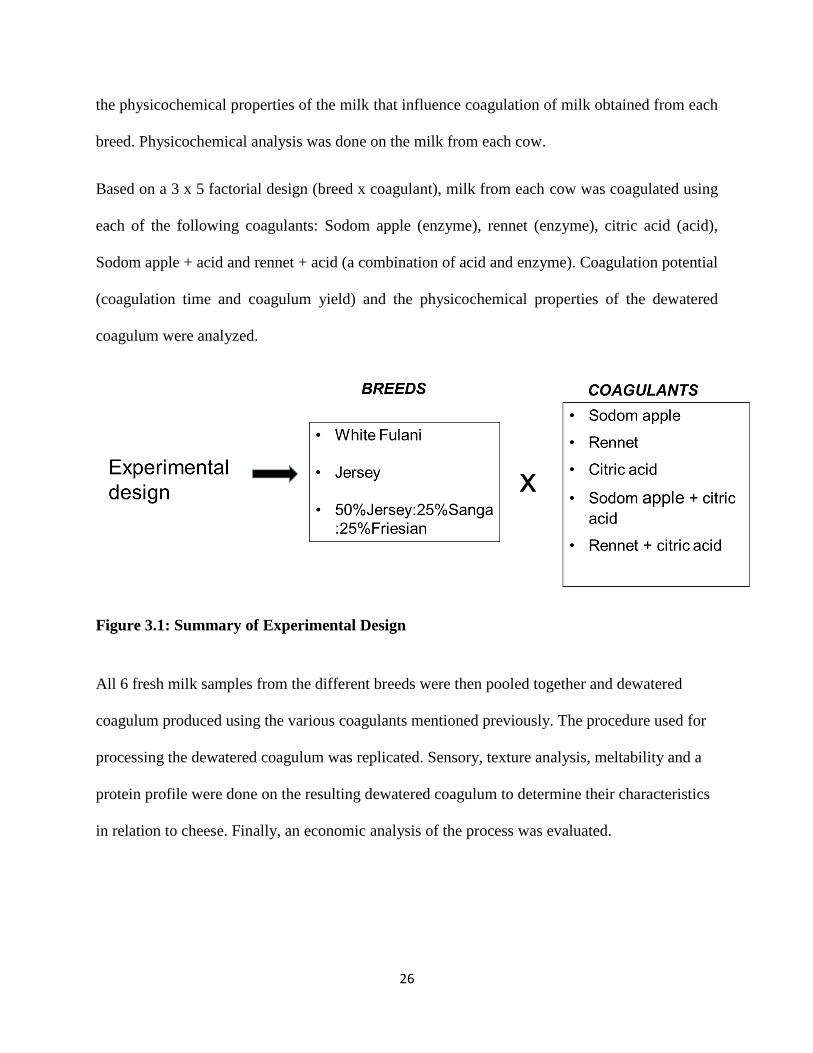
Figure 3.1: Summary of Experimental Design ............................................................................. 26
Figure 3.2: Cow Being Milked by a Herdsman. ........................................................................... 27
Figure 4.1: Colour of Milk Samples. Where L-lightness, a- greenness and b-yellowness ........... 42

VI
Figure 4.2: Coagulum Yield of Milk from Different Breeds Using 5 Coagulants. Where: Acid
Only - A, Rennet Only – R, Rennet +Acid – RA, Sodom Apple Only - S, Sodom Apple +
Acid – SA, White Fulani – F, Cross – C, Jersey – J .............................................................. 44
Figure 4.3: Time Taken for First Coagulum to be Formed. Where: Acid Only - A, Rennet Only –
R, Rennet +Acid – RA, Sodom Apple Only - S, Sodom Apple + Acid – SA, White Fulani –
F, Cross – C, Jersey – J. Values with the same alphabet are statistically the same for each
physicochemical property at p<0.05 ...................................................................................... 46
Figure 4.4: Moisture Content of Coagulum from Different Breeds Using Different Coagulant
Where: Acid Only - A, Rennet Only – R, Rennet +Acid – RA, Sodom Apple Only - S,
Sodom Apple + Acid – SA, White Fulani – F, Cross – C, Jersey – J ................................... 48
Figure 4.5: pH of Coagulum from Different Breeds Using Different Coagulants. Where: Acid
Only - A, Rennet Only – R, Rennet +Acid – RA, Sodom Apple Only - S, Sodom Apple +
Acid – SA, White Fulani – F, Cross – C, Jersey – J .............................................................. 49
Figure 4.6: % Fat Content of Coagulum from Different Breeds Using Different Coagulants.
Where: Acid Only - A, Rennet Only – R, Rennet +Acid – RA, Sodom Apple Only - S,
Sodom Apple + Acid – SA, White Fulani – F, Cross – C, Jersey – J ................................... 51
Figure 4.7: % Protein Content of Coagulum from Different Breeds Using Different Coagulants.
Where: Acid Only - A, Rennet Only – R, Rennet +Acid – RA, Sodom Apple Only - S,
Sodom Apple + Acid – SA, White Fulani – F, Cross – C, Jersey – J ................................... 52
Figure 4.8: *L of Coagulum from Different Breeds Using Different Coagulants. Where: Acid
Only - A, Rennet Only – R, Rennet +Acid – RA, Sodom Apple Only - S, Sodom Apple +
Acid – SA, White Fulani – F, Cross – C, Jersey – J .............................................................. 54

VII
Figure 4.9: *A of Coagulum from Different Breeds Using Different Coagulants. Where: Acid
Only - A, Rennet Only – R, Rennet +Acid – RA, Sodom Apple Only - S, Sodom Apple +
Acid – SA, White Fulani – F, Cross – C, Jersey – J .............................................................. 54
Figure 4.10: *B of Coagulum from Different Breeds Using Different Coagulants. Where: Acid
Only - A, Rennet Only – R, Rennet +Acid – RA, Sodom Apple Only - S, Sodom Apple +
Acid – SA, White Fulani – F, Cross – C, Jersey – J .............................................................. 55
Figure 4.11: ∆L of Coagulum from Different Breeds Using Different Coagulants. Where: Acid
Only - A, Rennet Only – R, Rennet +Acid – RA, Sodom Apple Only - S, Sodom Apple +
Acid – SA, White Fulani – F, Cross – C, Jersey – J .............................................................. 57
Figure 4.12: ∆A of Coagulum from Different Breeds Using Different Coagulants. Where: Acid
Only - A, Rennet Only – R, Rennet +Acid – RA, Sodom Apple Only - S, Sodom Apple +
Acid – SA, White Fulani – F, Cross – C, Jersey – J .............................................................. 57
Figure 4.13: ∆B of Coagulum from Different Breeds Using Different Coagulants. Where: Acid
Only - A, Rennet Only – R, Rennet +Acid – RA, Sodom Apple Only - S, Sodom Apple +
Acid – SA, White Fulani – F, Cross – C, Jersey – J .............................................................. 58
Figure 4.14: Sensory Profile of the Dewatered Coagulum. *Attributes are Statistically
Significant. Where: Acid Only - A, Rennet Only – R, Rennet +Acid – RA, Sodom Apple
Only - S, Sodom Apple + Acid – SA .................................................................................... 61
Figure 4.15: PCA of Dewatered coagulum Samples. Where: Acid Only - A, Rennet Only – R,
Rennet +Acid – RA, Sodom Apple Only - S, Sodom Apple + Acid – SA ........................... 62
Figure 4.16: Picture Showing the Meltability of the Cheese Samples. ........................................ 63

VIII
Figure 4.17: Meltability of Cheese Samples. Samples with the Same Alphabet are Statistically
the Same at P<0.05. Where: Acid Only - A, Rennet Only – R, Rennet +Acid – RA, Sodom
Apple Only - S, Sodom Apple + Acid – SA .......................................................................... 63
Figure 4.18: A Typical Texture Profile Graph of Dewatered Coagulum ..................................... 66
Figure 4.19: SDS-PAGE of Dewatered Coagulum Made from Different Coagulants. Where:
Acid Only - A, Rennet Only – R, Rennet +Acid – RA, Sodom Apple Only - S, Sodom
Apple + Acid – SA ................................................................................................................ 68
LIST OF TABLES
Table 4.1: Chemical Properties of Milks from Different Breeds of Cattle ................................... 39
Table 4.2: Sensory Attributes for the Coagulum Samples ............................................................ 60
Table 4.3: Texture Profile of the Cheese Samples ........................................................................ 65
Table 4.4: Cost of Major Equipment ............................................................................................ 70
Table 4.5: Cost of Minor Equipment ............................................................................................ 71
Table 4.6: Cost of Vehicle ............................................................................................................ 73
Table 4.7: Fixed Capital Investment ............................................................................................ 73
Table 4.8: Summary of Results .................................................................................................... 75
Table 4.9: Production Rate for Cheese ......................................................................................... 76
Table 4.10: Depreciation (d) ......................................................................................................... 77
Table 4.11: Total Operating Labour ............................................................................................. 78
Table 4.12: Total Production Cost ................................................................................................ 79
Table 4.13: Summary of Total Production Cost ........................................................................... 80
Table 4.14: Manufacturing Cost (CM) .......................................................................................... 81
Table 4.15: Summary ................................................................................................................... 82

IX
Table 4.16: Sales, Profit and Net Profit ........................................................................................ 84
Table 4.17: Summary of Profitability Analysis ............................................................................ 87

X
ABSTRACT
Milk is a nutritious food obtained from ruminants such as cattle, goats and sheep. In Ghana, milk
is usually obtained from indigenous cattle. These have low milk yield hence the introduction of
hybrids and exotic breeds. Embracing these new breeds has to an extent increased milk yield. The
problem is that the yield is still not enough. Also, the milk obtained is usually sold in the fresh
state which goes bad within a short time and is also patronized by few Ghanaians. For these reasons
it is necessary to add value to fresh milk and one way of doing this is by processing cheese. This
would provide farmers with some economic benefit and also bring more variety in processed milk
products in the country.
Milks were collected from three different cattle breeds; White Fulani, Jersey and a Cross breed.
Physicochemical analyses were done on the milks to compare them. After which each of the milks
was coagulated with five different coagulants (Sodom apple, rennet, acid, Sodom apple + acid and
rennet + acid) to ascertain their coagulating potential and physicochemical properties. Then, the
milks were pooled and coagulated using the different coagulants to observe their cheesing
characteristics and protein profile. Finally, economic analysis was done on the different cheeses to
find out if it was viable to commercially produce cheese in Ghana. One-way ANOVA was used to
determine if differences existed amongst the milks from the breeds and the cheeses made from the
different coagulants. Two-way ANOVA was used to determine the interaction between the breeds
and coagulants for the various indices measured for the coagulum obtained.
It was observed that the physicochemical properties of the milks from the breeds were similar in
fat and protein content. Milk from the White Fulani took the shortest time to coagulate and milks
coagulated with Acid first had the least coagulation time. The highest coagulum yield was obtained
from milk processed with Sodom apple and milk from the Jersey cow. Coagulum made with Acid

XI
had the highest meltability and coagulum from Sodom apple was highest for 7 out of 10 sensory
attributes. Amongst all the coagulum, the ones processed from Rennet + acid and Sodom apple +
acid had the hardest texture with cheese from Sodom apple being the softest. For the protein
profile, Rennet only had all the caseins being hydrolysed. Acid only and Sodom apple + acid
showed similar results. All three caseins were not hydrolysed. The economic analysis showed that
the cheeses if processed commercially can be sold at the following prices: Rennet only - GHȻ
8.00, Acid only - GHȻ 16.00, Sodom apple only - GHȻ 6.00, Sodom apple +acid - GHȻ 12.00
and Rennet +acid - GHȻ10.00.
Cheese can be obtained from the breeds analyzed using different coagulants and it would be viable
and profitable to produce cheese commercially in Ghana.

1
CHAPTER ONE
1.0 INTRODUCTION
1.1 Cattle Rearing in Ghana
According to the Country’s Fact Sheet on Food and Agriculture Policy Trends
(n.d), Ghana’s economy largely depends on agriculture. This sector encompasses both crops and
livestock. Livestock are rich sources of protein in human diet. Examples of livestock reared in
Ghana include ruminants like cattle, goats and sheep and non-ruminants like pigs and poultry.
Cattle can be bred in any part of the country but are predominantly in the Northern part. There
are fewer cattle rearing areas in the Western part of the county due to the higher incidence of
tsetsefly in these areas. The three Northern regions are responsible for 75% of the total cattle
bred in the country (Adzitey, 2011). The cattle found in Ghana include indigenous breeds (Ghana
Sanga, White Fulani, Sokoto Gudali); exotic breeds (Jersey) and cross breeds or hybrids
(Friesian-Sanga). The exotic breeds are usually reared for milk and the indigenous for both meat
and milk but mostly for meat. The indigenous breeds produce very low quantity of milk as
compared to the exotic breeds (Aboagye, 2002; Animal genetic training resource n.d).
In Ghana, the milk produced is usually used to feed the calf, feed the farmer’s family and
the surplus, which is very little, is sold in the informal market (Aboagye, 2002).
Milk is a nutritious food and can be processed into various products (Pereira, 2014). Locally, milk
is processed into various products such as yoghurt, burkina, boiled milk and wagashie. Processing
of milk adds value to it and can make the milk market more attractive to farmers, processors and
sellers. One lucrative area for adding value to milk is cheese making. Cheese just like its raw
material, milk, is nutritious but has a longer shelf life as compared to milk. It has concentrated
amount of proteins, fat, and minerals (Pereira, 2014). A study showed that caseins which make up

2
cheese have antihypertensive effect and help in weight control by influencing intestinal motility.
This allows food to move slowly in the gastrointestinal tract, leading to delayed sensation of hunger
in the consumer. (De Noni & Cattaneo, 2010). Cheese is used to prepare many foods in the world
and these foods are gradually but steadily finding their way on our Ghanaian menus. Examples are
pizza, cheese burgers, cheese cake and lasagna. Some cheeses produced around the world include
Gouda, cottage cheese, cheddar cheese, mozzarella, feta and Quarg cheese.
1.2 Problem statement
Currently, many Ghanaian dairy farmers are making efforts to scale up their milk production in
order to increase their profits. A one on one interview with Mr. Frimpong, the Deputy Director of
Amrahia Dairy Farms, revealed that some farmers have been introduced to rearing the exotic
breeds while some have hybrids of indigenous and exotic breeds. This is increasing the milk yield
hence making milk more available. A visit to some farms in the Greater Accra and Eastern region
of Ghana showed that the indigenous breeds produce milk between 1L to 5L a day and those with
the hybrids and foreign breeds are able to produce milk between 2L-20L. This clearly shows an
increase in the milk yield as compared to the indigenous breeds provided there is good animal
rearing management and feeding in particular. There is however, still not enough milk to meet the
growing demand for milk and milk products in Ghana. Farmers are also not able to keep the milk
for long because of its short life span and lack of chilling equipment. Furthermore, studies have
shown that Ghanaians do not patronize fresh milk as compared to other countries (Gate Way to
Dairy Production and products (2018); Smallholder Dairy Production and Marketing-
Opportunities and Constraints,(2001) and Aidoo, et al. (2009) found that consumers preferred
processed milk to fresh milk. This means farmers cannot gain much from the sale of fresh milk
only.

3
One way of making fresh milk more beneficial is by adding value to it. Value addition improves
the product and makes it more economically beneficial. A case study in Dakota showed that a
group of dairy farmers earned more when they processed their raw milk into cheese and ice cream
(Coltrain, Barton, & Boland, 2000). There are various ways of adding value to our milk, and
processing milk into cheese is one of them. Currently, wagashie, a soft cheese is the only cheese
produced in Ghana and it is mostly found on the informal market. Casual one-on-one interviews
with wagashie sellers around Accra, revealed that selling wagashie is lucrative for people in the
informal market. Those who sell the cheese can make almost 50% profit when it is sold fried, also
depending on the type of market and the demand for the product, more profit can be made
(unpublished data). According to the UK Dairy Council cheese fact sheet (2017), 10L of fresh
milk can produce 1kg of cheese. Informal price checks in some supermarkets in Accra showed that
100g of cheese is sold on average at GH¢14.00 and 1L of fresh unpasteurized milk is sold on the
informal market at approximately GH¢4. This suggests that if a farmer makes 1kg of cheese from
10L of milk, it could be sold for GH¢140.00 whereas, that same 10L of milk will be sold for only
GH¢40. Apart from being economically beneficial to farmers, the cheeses can now be sold on the
formal market attracting even more revenue to the farmer and making dairy products accessible to
the middle and upper class who can afford them but because of perceptions of safety avoid local
dairy products. Although, the cost of processing has not been factored into these estimations, there
seems to be a comparative profitability in processing the milk into cheese as opposed to selling the
milk in its fresh form.
While considering adding value to cow milk in Ghana, it also necessary to find out if the milks
have the potential of being made into cheese in the first place. This is because some cows produce
milk that cannot clot. Clotting is the first step in cheese making hence, a very important factor in

4
cheese making milk. In order for milk to be considered as one that can be used for cheese
processing, it should be able to clot within 30 minutes after adding the enzyme rennet (Troch et
al., 2017).
1.3 RATIONALE
Cheese lasts longer than fresh milk and can be sold at a higher price than fresh milk. In addition,
cheese is a versatile ingredient in many ethnic and continental cuisines and Ghanaians have
embraced many of these recipes. A visit to various supermarkets in Ghana inevitably shows a
range of imported cheeses and cheese-based products on the shelves. Also, popular restaurants like
Pizza Inn, Burger King and Baritas always have at least a meal made from cheese featuring on
their menus. These observations may be signaling an available and yet unexploited market for
production of cheese in Ghana. Adding value to our milks by coagulating them for cheese would
be beneficial to farmers, consumers, restaurants and sellers. This cheese would eventually have a
longer shelf life, may be more acceptable than fresh milk, bring variety and add economic value
to fresh milk.
To this end, this study focused on finding out whether milks from some locally bred cattle can be
used to make cheese.
1.4 OBJECTIVES
1.4.1 Main Objective
To investigate the cheesing potential of milk obtained from locally bred cows and determine the
economic value of the process.

5
1.4.2 Specific Objectives
To compare those physicochemical properties of the milk that influence coagulation.
To determine the yields and speed of coagulation of milks when different coagulants are used
To determine physicochemical properties of the coagulum obtained when different coagulants
are used.
To determine some cheesing properties of coagulum processed from pooled milks from
different cow breeds.
To explore the economic value of commercial cheese processing for milk obtained from locally
bred cows

6
CHAPTER TWO
2.0 LITERATURE REVIEW
2.1 Cattle Breeds in Ghana
Cattle are ruminants that are reared domestically for the purposes of milk, beef, hide for leather
and meat and draught power on the farm (Felius, Koolmees, & Theunissen, 2011). In Ghana, there
are two main types of cattle. They are the Bos taurus and Bos indicus. Bos taurus like the N’dama
cattle are humpless and the Bos indicus like the White Fulani are humped. The indigenous Bos
taurus breeds are almost only found in West Africa now. Currently there are six indigenous breeds
of cattle in Ghana; West African Shorthorn, N’dama, Sokoto Gudali, White Fulani, Sanga and
Muturu. Various hybrids (Friesian-Sanga, Jersey-Sanga) and a few exotic breeds (Jersey) can also
be found in Ghana (MOFA, 2016). Almost all these breeds are milk producers except the Muturu.
Indigenous cattle in Ghana are for dual purposes. They are generally reared for their meat and
some milk is obtained from them too. Cattle in Ghana are low milk producers and compared to the
exotic breeds and hybrids, they mature much slower. This flaw is accounted for by the low
nutritional composition of their diet, poor management systems (Aboagye, 2002) and the fact that
they are not solely dairy cattle.
2.1.1 Types of Cattle
The West African Shorthorn, also called the Ghana Shorthorn or WASH are Bos Taurus. They are
found all over the country but are mostly concentrated in the Northern and Ashanti region. West
African shorthorns are small with long necks and heads. They also have short and thin horns. In
terms of coat colour, the most common colour is black and white but there are a few with solid
black, white and mottled black and white patterns. As Bos Taurus, they have underdeveloped
dewlap and umbilical folds (Animal Genetic Training Resource, n.d). They are resistant to

7
trypanosomosis, tick-borne disease and are heat tolerant. West African Shorthorns produce the
least amount of milk as compared to the other indigenous breeds. They are not able to let down
milk without their calves and their milk yield ranges between 384L-774L for 182 to 295 days of
lactation (Animal Genetic Training Resource, n.d). Rege, Aboagye & Tawah (2004), showed that
they are able to produce more milk when provided with a healthier diet.
The N’dama cattle are Bos taurus with long horns. They are believed to have originated from Fauta
Djallon in Guniea. Currently, they can be found in countries such as Senegal, Ghana, Togo,
Nigeria, Cameroon and Gabon (Animal Genetic Training Resource, n.d). N’damas are medium
sized cattle with short legs, short and broad heads and long and curvy horns. Their dewlap and
umbilical folds are underdeveloped. Their coat colour is usually fawn but it can range from dark
fawn, to grey, chestnut and to red with a black head. They are also intolerant to trypanosomiasis
(DAGRIS 2005). In Ghana N’dama’s provide both meat and milk but the milk produced is quite
low (Animal Genetic Training Resource, n.d). In a year, a cow can produce 70L-100L of milk
(FAO 1980). The full lactation yield is usually between 500L-600L (Portar, 1991).
Just as the name depicts, the White Fulani has a white coat with the ears, eyes, muzzle, hooves,
horn and tail tips being black. They have a well-developed dewlap and hump. They have a long
head with slender horns that are curved upwards with an outwards turn at the tips. They are
generally tall and have a well-developed udder. White Fulanis’ are heat tolerant and have a low
mortality rate. Traditional owners usually keep them for milking purposes (Animal Genetic
Training Resource, n.d). According to Tawah & Rege (1996), they are able to produce more milk
as compared to other Bos indicus. Average milk yield per average lactation length of 220days is
627L-1034L (Animal Genetic Training Resource, n.d).

8
Sokoto Gudali are usually found in Benin, Ghana, Nigeria and Mali. They are one of five breeds
from the Gudali family. Because of their hardy nature, they are able to survive in very dry
conditions such as those experienced in the northern regions of Ghana (Animal Genetic Training
Resource, n.d). The Sokoto Gudali cattle, are of the Bos indicus family with long head and long
ears that are large and convex and are sometimes observed to be hanging. As their name Gudali
implies in Hausa, they have short legs and short horns. Their coat colour is usually multi-coloured
but the most dominating colours are black and white. Among all the indigenous cattle found in
Ghana, they are the most efficient in milk production. A mean total of 1101.3L of milk can be
obtained in 244.8 days of lactation (Animal Genetic Training Resource, n.d).
Sanga is a hybrid obtained by crossing the N’dama and the WASH. The Sanga Cross has been
stabilized over the years hence it is now seen as a pure breed. This breed is mostly found in the
Northern, Greater Accra and Volta regions of the country. In a personal communication with the
Deputy Director at Amrahia Dairy Farms he expressed that the Sanga is one of the most common
breeds found throughout the country because of its hardy nature. They have an undeveloped hump
with a long head. They have a variety of horn sizes, but majority are small and slender. Their coat
colour is usually variegated. A study conducted by Okanta (1992), showed that the average daily
yield of milk was 875±11ml.
Jerseys are exotic dairy cattle that are able to survive in the arid conditions of Ghana because they
are heat tolerant. They were introduced into the country by an NGO (Heifer International) in 2008
(MOFA, 2016). Jerseys come in a variety of colours but the generally occurring colour is fawn
with or without white marks. They have a small body size as compared to other dairy cattle
(Paulson, Endres, & Reneau, 2015). They are able to calf at an early age because of their high
fertility rate and produce about 6000L of milk per year. Milks obtained from the Jersey are very

9
high in protein and butterfat leading to a high solid content. The protein content is about 3.8% and
that of the butterfat is 4.8% (Ontario Dairy Facts and Figures, n.d).
The Holstein-Friesians were believed to have originated from the Netherlands. They are a high
milk producing cattle providing 90% of milk in the United States of America (Paulson et al., 2015).
Their coats are usually black and white or red and white. They are able to produce about 8600L of
milk per year (Ontario Dairy Facts and Figures, n.d). They were introduced into Ghana from
Europe to improve the milk yield of our indigenous breeds, but they were not able to survive due
to the climatic conditions in the country (Aboagye, 2002). They were later crossed with the Sanga
via artificial insemination. These hybrids known as the Friesian-Sanga are still in existence in a
few farms in the country.
2.2 Milk Composition and Physicochemical Properties
Milk is a nutritious food obtained from the lacteal secretion of mammals such as cows, sheep,
goats, buffalos and donkeys (Pereira, 2014).
2.2.1 Properties of milk from different dairy ruminants
Milk from all ruminants have different milk compositions. They vary based on various factors
such as genotype, breed, age, diet and stage of lactation (Schwendel et al., 2014). Generally,
sheep and buffalo milk have higher dry matter:18.6% and 17.75% respectively as compared to
other ruminants. Goat milk has a dry matter content of 13.3% which is quite similar to that of
cow milk at about 12.8%. That of the donkey is lowest at 10.8%. A similar trend is observed for
the fat content. That of the buffalo and sheep is highest followed by the goat, cow and finally the
donkey.

10
High total solids in sheep milk makes it very appropriate for cheese making. The same can be
said for buffalo, cow milk and goat milk. Donkey milk is usually not used in cheese production
because of its low dry matter. It generally has very low protein especially in caseins content
(www.fao.org).
2.2.2 Properties of milk from different breeds of cows
Breed of cattle has an influence on milk produced (De Marchi et al., 2008). Milk from Bos
indicus have higher fat content as compared to Bos Taurus. This means that cattle breeds such as
Sokoto Gudali and White Fulani should have higher fat content as compared to N’dama, Jersey,
and WASH (beef2live.com). This is not always the case though. The genetic make-up of the
breed also has an influence on the milk composition (De Marchi et al., 2008).
Most of the cattle bred in Ghana are for dual purpose, that is beef and milk, but some of the
exotic breeds like the Jersey are purposely for milk. This means that the genetic make-up of the
dairy cattle provides it with the added advantage of producing milk of better quality (Schwendel
et al., 2014). Therefore, milk from the dairy cow would be slightly different from that of the dual
purpose cow. For instance, the fat content of milk from White Fulani is 3.6% (Adesina, 2012) as
compared to that of a Jersey which is around 4.6% (Heinrichs, Jones, & Bailey, 2016). Jerseys
are known to have higher fat content as compared to their other dairy cow counter parts like the
Holstein and Guernsey. The fat content of Jersey milk is 4.6%, Guernsey 4.51% and Holstein
3.65% (Heinrichs et al., 2016). There is usually a lot of variation in the fat content of cow milk
as compared to the protein and ash content hence, the comparisons of the breeds based on fat
content (Walstra, Wouters, & Geurts, 2006).

11
Milk obtained from cattle contains proteins, fat, minerals, vitamins, carbohydrates and water in
different proportions based on the type and breed of animal as well as the management practices
for rearing the animal (FAO, 2013).
2.2.3 Composition of cow milk
Cow milk contains proteins, lactose, fat, vitamins and minerals. Protein content of milk is ranges
between 3.2-3.8%. Milk proteins are very important to human diet and nutrition because they
contain all the essential amino acids needed by the body. The proteins are also easily digestible
and are bioavailable (Pereira, 2014). Lactose, which accounts for about 4-5% of milk is the sugar
or carbohydrate found in milk. Lactose is made up of galactose and glucose (Pereira, 2014). It is
not as sweet as sucrose hence the almost bland taste of milk. Depending on the breed of cow, the
fat content of milk ranges from 2.5-5.5% ( Walstra, Wouters, & Geurts, 2006). This fat is made up
of both saturated and unsaturated fatty acids. Averagely, the saturated fatty acids such as myristic
and palmitic acid make up 70% of the fat content whereas unsaturated fatty acids like linolenic
acid make up 30% (Lindmark Månsson, 2008). The vitamins present in milk include fat soluble
vitamins A, D, E and water-soluble vitamins B complex and C. The quantity of fat soluble vitamins
is dependent on the amount of fat that is in the milk. Therefore, skimmed milk would have a lower
quantity of A, D and E as compared to whole milk since it has less fat content. (Pereira, 2014).
Milk contains various minerals. Some of these minerals include calcium, phosphorus, zinc,
potassium and selenium. The most abundant mineral found in milk is calcium. This explains why
milk is said to be a very rich source of calcium. The phosphorous present comes in organic and
inorganic forms (Gaucheron, 2011). Milk is mostly made up of water. Milk has about 87% water
with the remaining 13% consisting of the other nutrients (Pereira, 2014). The high amount of
water is responsible for the quick spoilage of milk.

12
One physical property that helps distinguish cow milk from other dairy milks is the colour. Cow
milk is usually yellowish white in colour. The colour intensity varies based on the type of breed.
Cow milk as compared to buffalo milk is yellower because of the higher β carotene content in it
(Ullah et al., 2017).
Milk pH is a very important chemical property that enables milk remain in its liquid state. Milk
pH ranges between 6.6-6.8 (Tsioulpas, Lewis, & Grandison, 2007). When the pH of milk is
lowered, the milk proteins begin to denature making the milk change from its liquid state to a solid
state (Phadungath, 2005a). Higher milk pH gives an indication that the cow is suffering from
mastitis; a disease that affects the udder of the cow hence affecting the quality of milk (Contreras
& Rodríguez, 2011).
2.2.3.1 Milk Proteins
The solid content of milk which is approximately 13% is made up of 3.2-3.8% proteins (Pereira,
2014). The proteins in milk endow it with unique properties that are not observed in many protein-
containing foods. The proteins in milk are in two forms. The soluble proteins called caseins and
the insoluble proteins called whey. Caseins make up 80% of milk proteins and the remaining 20%
is whey (Phadungath, 2005a).
There are four types of caseins in milk. They are αs1, αs2, β and κ casein (Walstra et al.,1999). The
αs proteins contain the highest number of phosphoserine. This is followed by β casein with κ casein
having only one phosphoserine group. The phosphoserine groups of the α and β caseins make them
sensitive to calcium salts hence, precipitating out in the presence of calcium. κ caseins on the other
hand prevent the other caseins from precipitating because of their lack of phosphoserine groups
(Phadungath, 2005a). This process of precipitation also denatures the proteins, changing the state
of the milk from liquid to solid. The side chain of the caseins also influences their hydrophilic and

13
hydrophobic nature. β caseins are the most hydrophobic and κ caseins the most hydrophilic due to
the glycoproteins present. This determines their position on the micelle (Walstra et al., 1999).
Caseins, unlike other proteins that are denatured at high temperatures, remain stable above 1000C.
Denaturation begins above 1200C, however, they are denatured by low pH at an isoelectric point
of 4.6 (Phadungath, 2005a). Some studies done on caseins showed that they have antihypertensive
effect and help in weight control by influencing intestinal motility. This allows food to move
slowly in the gastrointestinal tract preventing one from getting hungry at a faster rate. (De Noni &
Cattaneo, 2010).
The other proteins in milk known as whey are the insoluble components of milk proteins obtained
from the removal of caseins. It is mainly made up of α lactalbumin and β lactoglobulin. It is made
up of globular proteins which have high densely folded peptide chains with high hydrophobicity.
Whey also known as serum denatures when heat is applied to it (Walstra et al., 1999). It is usually
lost during cheese making through the process of dewatering.
2.2.3.2 Micelle Structure of Milk Proteins
Milk proteins are bound to some minerals collectively called Colloidal Calcium Phosphates (CCP)
to form casein micelles. CCP is made up of calcium, citrate, phosphorous and magnesium
(Phadungath, 2005a). The structure of the casein micelle is described by various scientists but the
most commonly accepted one is that proposed by Walstra in 1984 (Rollema, 1992).
The casein micelle is made up of sub-micelles. Each sub-micelle differs in size; 12-15nm in
diameter with each containing 20-25 casein molecules. Micelle sizes can be measured using
dynamic light scattering. These sub-micelles are of two types. Those consisting of only α and β
caseins are hydrophobic; and are found in the central part of the micelle. The second type is made
up of α and κ caseins. These are more hydrophilic and usually found on the peripheral of the

14
micelle. The ‘C’ terminal of the hydrophilic part, protrudes to form a ‘hairy-like’ layer. This helps
avoid aggregation of the sub-micelles by using steric and electrostatic repulsion thereby
maintaining milk in its liquid state (Walstra et al., 1999).
Figure 2.1: The Structure of Casein Micelle in the Sub-Micelles. Model Showing the
Protruding C-Terminal Parts of Κ-Casein as Proposed by Walstra. (Source:(Walstra,
1999)
2.3 Coagulation of Milk
Milk is transformed into cheese by three major processes. These are coagulation, dewatering and
refining. Without denaturation or coagulation occurring cheese cannot be made. The curd that
forms is known as coagulum (Troch et al., 2017). In order for the caseins to remain in solution,
they form micelles as stated earlier. Acids and enzymes are able to destabilize the micelle causing
it to precipitate. They both have different mechanisms of operating, hence produce different
coagulum.

15
Milks coagulate when the pH is reduced. Coagulation of milk occurs at an isoelectric point of 4.6
at 300C (Phadungath, 2005a). At this point the colloidal suspension precipitates out to form a
coagulum. Milk can be acidified via various processes such as direct acidification by adding acids
such as hydrochloric acid, acetic acid, citric acid and glucono-ᵹ-lactone or indirectly by using lactic
acid bacteria. Lactic acid bacteria can be used to reduce the pH of milk. They accomplish this by
utilizing the lactose in the milk to produce lactic acid (Phadungath, 2005b).
Coagulation via acidification occurs after CCP dissociates from the micelles. The negative charges
in the casein micelles become neutralised by the hydrogen ion from the acid. This results
in aggregation of the casein micelle at the isoelectric point The final cheese produced at the end
of coagulation becomes acidic (Troch et al., 2017).
Apart from acids, milks can also be coagulated using enzymes. These enzymes are called rennet
(Pezeshki et al., 2011). Rennet can be obtained from plants, animals, or microorganisms.
Generally, they cleave the κ casein of the milk micelle at Phenylalanine105 and Methionine106. The
proteinase found in rennet that helps in hydrolyzing caseins are cysteine, serine or aspartic acid
proteinases (Shah, Mir, & Paray, 2014). Cysteine proteinases, also known as thiol proteinases have
a cysteine group in their active site. They are well noted for their ability to be active in a wide
range of pH and temperatures. Serine proteinases also have a serine residue in their active site just
like cysteine proteinases (Shah et al., 2014) . Aspartic proteinases have two aspartic residues which
have a specificity for cleaving peptide bonds between hydrophobic amino acid residues. They are
also very active at an acidic pH (Domingos et al., 2000). After κ casein is cleaved by rennet, it
becomes incapable of protecting the hydrophobic components of the micelle structure. The
phosphorylated inner α and β caseins, then start to interact with the calcium present to form
paracaseinate (Lucey,2002). This begins the coagulation process.

16
2.3.1 Types of Coagulating Enzymes
There are generally two sources of enzyme coagulants. They include animal and plant sources.
Chymosin an animal source is a type of rennet found in the abomasum (fourth stomach) of a calf
before it is weaned (Çakmakçi and Boroǧlu, 2004). It is important for digesting milk in the calf.
Years ago, cheese makers cleaned and dried the stomach and when the enzyme was needed they
soaked it in whey to extract it. As time went on, the stomach was kept frozen instead of dried, and
extraction done when necessary (Jacob, Jaros, & Rohm, 2011). Now, chymosin is being produced
via genetic engineering where microorganisms are engineered to produce the enzyme. It is
obtained by fermentation in microorganisms such as Escherichia coli, Bacillus subtilis, and
Saccharomyces cerevisiae (Jacob et al., 2011). This has become necessary because of the number
of calves that have to be sacrificed in order to obtain the enzyme. Chymosin can produce firmer
gels than plant enzymes and gives higher yields (Ben Amira et al., 2017).
It is active at temperatures between 30-420C and a pH range of 6.2-6.8 and 5.1 - 5.5 Chymosin
cleaves the κ casein of the milk micelle at Phenylalanine105 and Methionine106. The proteases in
Chymosin are specific in their reaction (Ben Amira, et al., 2017).
There are various plants that have the ability to coagulate milk and these include Pawpaw (carica
papaya), Sodom apple (Calotropis procera) (Akinloye & Adewumi, 2014), Moringa (Moringa
oleifera) (Orhevba & Taiwo, 2016) and Cadoon flowers (Cynara cardunculus) (Ben Amira et al.,
2017). Due to availability, affordability and the ease to extract the enzymes, cheese processors are
gradually introducing plant rennet into their production (Freitas et al., 2016).
Just like chymosin, most of the proteases cleave the bonds of κ-casein at phenylalanine105 and
methionine106. A few of these proteases are not specific hence cleave other bonds apart from the
phenylalanine105 and methionine106 bond (Ben Amira et al., 2017). These proteases are distributed

17
in the plants in different parts (leaves, flowers, stems, roots, fruits) and at different concentrations.
Plant rennet usually have very high proteolysis. This can affect the texture and yield of the final
cheese obtained. The higher the activity of the enzyme, the lower the yield and the less firm the
cheese. This may be due to the extra hydrolysis of other bonds in the casein and the rearrangement
of the coagulum structure (Ben Amira et al., 2017). When using plant rennet, the crude extract
usually imparts colour to the product. This is usually seen for the leaves of sodom apple and
pawpaw which impart a green coloration to the final cheese (Akinloye & Adewumi, 2014). To
control this, some researchers have extracted the enzymes by centrifuging and using the
supernatant.
2.3.1.1 Calotropis procera
Calotropis procera is a shrub from the family Asclepiadaceae (Upadhyay, 2014). In Ghana, they
are known as Sodom apple but are identified in other places as Rubber bush, Sodom’s milkweed,
Swallowwort, Akud and Giant milkweed (Upadhyay, 2014). They are mostly found in the tropical
and subtropical areas of the world (Upadhyay, 2014). C. procera has gray green broad leaves with
a fleshy and waxy appearance. The stem has a dry corky bark and is generally curved (Orwa et al.,
2011). Its flowers are small and clustered. The flowers are cream or greenish white in colour at the
base and purple or violet at the extremities of the lobes. It has green fruits that are inflated and
usually arranged laterally on the branch (Orwa et al., 2011). It is resistant to drought and heat and
tolerant to salty soils (Orhevba & Taiwo, 2016). It can grow at deserted areas such as road sides
and over used lands where most plants cannot survive. It also grows in all manner of soil types and
climates (EcoPort, 2007). C. procera is a very important shrub. Every part of it is very useful.
Generally it can be used as a source of fuel (EcoPort, 2007), for medicinal purposes (Upadhyay,
2014) and as a coagulant for coagulating milk (Akinloye & Adewumi, 2014) .

18
Figure 2.1: Sodom Apple (Calotropis procera) Plant
2.3.1.2 Calotropis procera as a Coagulant
In many places in West Africa, C. procera is used for coagulating milk to produce a soft cheese.
This cheese is called wagashie in Ghana and Wara or warankasi in Nigeria (Orhevba & Taiwo,
2016). C. procera is used to coagulate milks at high temperatures. A study showed that the rate of
coagulation of milk was highest at 700C at an optimum pH of 5.6 (Raheem, Suri, & Saris, 2007).
Cysteine protease is responsible for the coagulation of the milk (Freitas et al., 2016). Cysteine
protease causes proteolysis of the caseins by using the thiol group of a cysteine residue as a

19
nucleophile. The two main enzymes found in the C. procera responsible for proteolysis are
procerain and procerainB. They differ in their iso-elcectric point, molecular weight and optimal
pH for activity. Procerain, has an optimal working pH of 8 and the cysteine present in it has a
molecular weight of 28.8KDa but little is known about procerainB. According to Rayanatou et al.
(2017), the hydrolysis is not specific as that of chymosin. Chymosin specifically cleaves κ casein
whereas there is proteolysis of all the caseins for C. procera. However, proteins found in the whey
component obtained after coagulation with C. procera are similar to those in chymosin. The
coagulum formed by C. procera is slightly different from that of chymosin. Coagulum from C.
procera is more compact than that of chymosin (Rayanatou et al., 2017) and C. procera influences
the colour of coagulum obtained by imparting a green colour to it. .Coagulum from C. procera has
higher yield than some plant coagulants like lemon juice (Akinloye & Adewumi, 2014).
2.4 Cheese
Cheese is a compact nutrient dense food mainly made from dairy milk (Singh, Drake, &
Cadwallader, 2003). After coagulating the milk, whey is drained out and allowed to ripen for days
and sometimes, years. There are different kinds of cheeses found all over the world. They are
generally grouped into soft, hard, fresh and ripened cheese (Budreckiene & Struzeckiene, 2014).
The textures and flavours are influenced by the ripening process and type of coagulant used
(Gutiérrez-Méndez, et al., 2013). Acid addition makes cheese less firm as compared to milk with
higher pH at about 6.0-6.2. Also, acid induced cheeses have a higher moisture content as compared
to rennet induced cheeses (Lucey, Johnson, & Horne, 2003). Usually, fresh cheese is bland and
retains the aroma and flavor of the milk used in preparing it. The flavours developed during
ripening are also specific to the type of cheese being produced (Murtaza, et al., 2014) .

20
2.4.1 Soft and Hard Cheese
Soft cheese has a very limited life span because of the high moisture content hence, consumed
within a short period after production. Moisture on a fat free basis of hard cheese ranges from 61%
- >67% (Dairy Processing Hand Book, n.d). Hard cheeses are obtained from the combination of
rennet and acid. They have less moisture as compared to soft cheese. Ripening duration and
moulding process plays a role in the final moisture content of hard cheese (Buckley, 2017). Hard
cheeses due to their lower moisture content have a longer shelf life. Moisture on a fat free basis of
hard cheese ranges from <41%-56% (Dairy Processing Hand Book, n.d). Some examples of hard
cheeses include cheddar, gouda and parmesan Some examples of ripened cheese are cheddar,
camembert and gouda.
Cottage cheese is made by only acidification of milk. Mesophilic microbes are added to reduce the
pH for coagulation. One peculiar feature of cottage cheese is that it is made up of individual grains
of relatively similar sizes. It has low calories and is quite low in fat due to the use of skimmed milk
for its production (Tratnik et al., 2000).
2.4.2 Ripened or Matured and Fresh Cheese
Ripening is an important step that is done when processing some types of cheeses. It is done at
lower temperatures as compared to that needed for coagulation and at controlled humidity. This is
done to provide the right conditions for the biochemical, microbiological and chemical reactions
that are needed to take place (Singh, Drake, & Cadwallader, 2003). The temperature and humidity
also depend on the type of cheese being made. For instance, cheddar is ripened at 80C at a relative
humidity of 80% (Singh, Drake, & Cadwallader, 2003) and camembert,120C at a relative humidity
of 93% (Leclercq-Perlat et al., 2013). Ripened cheese as compared to fresh cheese, have different
flavour and aroma profiles. This is due to various biochemical reactions in the cheese. These

21
reactions range from the breakdown of residual lactose, lactate and citrate via glycolysis,
proteolysis and lipolysis (McSween, 2004). Other compounds that also influence the flavor profile
include alcohols, organic acids, phenolic compounds and sulphur compounds ( Murtaza et al.,
2014). Cheddar cheese is a typical example of ripened cheese. It is made by coagulating milk using
both acid (lactic acid bacteria) and rennet (Murtaza et al., 2014). After draining, it is usually salted
and dyed with annatto to improve upon its colour (orange colour) and flavour. The ripening process
influences the texture and flavor. It loses more moisture during the ripening process hence becomes
drier and crumblier. The ripening process can range from weeks to years; the longest usually being
5 years (International Dairy Foods Association, 2018)
Fresh cheeses usually do not undergo any form of ripening. Cottage cheese, cream cheese and
wagashie are all typical examples of fresh cheese. Usually, Soft cheeses are processed fresh but
there are a few soft cheeses that are ripened for a few days or weeks. A typical example of soft
ripened cheese is brie. Brie undergoes ripening for a few weeks before consumption
(Budreckiene & Struzeckiene, 2014).
Brie cheese has a soft texture and is not crumbly. It is ripened for a few weeks and the final product
has a white to cream colour. It is coagulated with rennet and lactic acid bacteria as the starters for
the required pH (CODEX, 1973).
2.5 Factors Influencing Coagulation
There are numerous factors that influence the rate of coagulation of milk, the texture and yield of
coagulum obtained. The main factors include calcium content, protein content, temperature and

22
pH of the milk used. Apart from these four factors, the presence of non-coagulating milk can also
influence the coagulation process.
2.5.1 Calcium Content
Calcium exists in milk in soluble and colloidal forms. Calcium interacts with α and β caseins to
form a mass known as coagulum (Phadungath, 2005a). Some manufacturers speed up the
coagulation process by adding calcium in the form of CaCl2. This increases the yield and reduces
the coagulation time. The higher the level of calcium in the milk the lower the pH of the milk. And
lower pH influences the rate of coagulation. Calcium generally affects the coagulation time and
the texture of the cheese obtained making the resulting cheese firmer (Troch et al., 2017) . It also
enhances the retention of minerals, the rate at which protein and fat is retained and also improves
the dry weight (Santos et al., 2013).
2.5.2 Protein Content
The protein content is an important factor that influences both acid and enzyme coagulation. The
caseins either react with calcium or get denatured due to change in pH to precipitate out or form
coagulum. Variation in milk coagulation is largely influenced by protein. The type of casein
present is very important.
According to (Abeykoon et al., 2016) high coagulum yield, curd firmness and high meltability was
observed from milk with high total casein, κ-casein and β-casein. The concentration of caseins in
the milk influences the texture of the coagulum and the firming time. Casein micelle size also
influences the texture of the coagulum. Smaller micelles produce firmer coagulum (Walstra,
Wouters, & Geurts, 2006).

23
2.5.3 pH
Lowering the pH changes the size of the casein micelle and causes the hairy layers to collapse.
This reduces the stability of the casein micelle, leading to coagulation. This influences the
coagulating time and rate of firming (Sinaga, Bansal, & Bhandari, 2017).
The optimum working pH of animal rennet is between 5.1-5.5 and its activity increases with
increasing pH (Troch et al., 2017). For acidulation, coagulation can occur between a pH range of
4.6- 6.6. This is possible because at a pH region between 5.0-6.6 there is solubilization of calcium
phosphate; then, there is a dissociation of calcium complexes by phosphoserines at a pH range of
4.6- 5.0. These lead to a reduction in both electrostatic repulsion and steric stabilization of the
micelle causing coagulation (Phadungath, 2005b)..
2.5.4 Temperature
Temperature is an environmental factor that influences the rate at which coagulation occurs. For
animal rennet there is no coagulation below 100C (Troch et al., 2017). Coagulation can occur
between 100-200C but it is at a very slow rate. Then between 300C and 420C coagulation
becomes gradual, falls above 420C and stops completely at 550C (Walstra, Wouters, & Geurts,
2006). Sodom apple however coagulates best at an optimum temperature of 700C (Raheem, Suri,
& Saris, 2007). Acid induced coagulation also depends on temperature and pH (Troch et al.,
2017). It has been shown that increasing coagulation temperature, increases the rate of enzymatic
reaction such as cleaving κ- casein by rennet. Increase in enzymatic activity and the rate of
aggregation at higher temperature reduces the coagulation time. However, if the temperature of
milk is too high that is, above 360C coagulation time will increases due to heat induced
inactivation of rennet (Ong, et al, 2011) .

24
2.5.5 Non-coagulating Milk
Milk that does not coagulate after 30 minutes after the addition of rennet or acid is known as non-
coagulating milk. This milk is not suitable for the production of cheese. The addition of non-
coagulating milk to coagulating milk especially effects the firmness of the final coagulum and
eventually the cheese obtained. The cause of this problem is not known but the composition of the
milk could be of great influence (Troch et al., 2017).
2.5.5 Conclusion
Different breeds of cattle are reared in the country. They provide farmers with additional benefit
in the form of milk. Milk is very nutritious and high in protein, fat and minerals. The proteins in
milk are very important in the formation of cheese. This is possible via some specific proteins
known as caseins. Caseins coagulate in the presence of an acid or enzyme to precipitate out. This
precipitate is known as coagulum. This coagulum begins the process of cheese making. Cheese is
usually made by coagulating milk, dewatering the coagulum and ripening it. There are different
types based on texture and level of maturity. Cheese production in Ghana can further add value
to milk production. In order to find out if this is even feasible, this study aims to determine if
milk from Ghanaian cattle breeds can coagulate by using different types of coagulants.

25
CHAPTER THREE
3.0 MATERIALS AND METHODS
3.1 Materials
Rennet (Chymosin) - Chymax, chr. Hansen Standard, Denmark
Citric acid – Sigma-Aldrich Life Science
Sodom apple (Calotropis procera) branches
Cow breeds – White Fulani, Jersey and Cross breed (50% Jersey:25% Sanga:25% Friesian)
Milk from the White Fulani was from Nsawam, the Crosses from Malejor and the Jerseys from
Suhum and Afienya.
3.1.1 Rearing practices
Apart from the White Fulani, the Cross and Jersey cows were reared under the same management
system. The White Fulani was reared via open range and the Cross and Jersey via zero Grazing.
From time to time, the White Fulani cows were provided with cassava peels. Those managed via
zero grazing were provided with brewers spent malt, cassava peels and cut grass like elephant
grass. The cows used for the analysis were also at different lactation periods. Some were at the
beginning of the lactation cycle, others were at in their mid-lactation period and some at the end
of lactation. All the Crosses were pregnant during sample collection.
3.2 Experimental Design
Milk was collected from a total of 6 cows; two of each breed. Milk samples were collected three
different times from each cow (at least 2 weeks apart) except for one Cross. The Cross had some
health problems after two times of sampling. Analyses were done to compare between the breeds,
26
the physicochemical properties of the milk that influence coagulation of milk obtained from each
breed. Physicochemical analysis was done on the milk from each cow.
Based on a 3 x 5 factorial design (breed x coagulant), milk from each cow was coagulated using
each of the following coagulants: Sodom apple (enzyme), rennet (enzyme), citric acid (acid),
Sodom apple + acid and rennet + acid (a combination of acid and enzyme). Coagulation potential
(coagulation time and coagulum yield) and the physicochemical properties of the dewatered
coagulum were analyzed.
Figure 3.1: Summary of Experimental Design
All 6 fresh milk samples from the different breeds were then pooled together and dewatered
coagulum produced using the various coagulants mentioned previously. The procedure used for
processing the dewatered coagulum was replicated. Sensory, texture analysis, meltability and a
protein profile were done on the resulting dewatered coagulum to determine their characteristics
in relation to cheese. Finally, an economic analysis of the process was evaluated.

27
3.2.1 Sample collection
Fresh milk samples were collected early in the morning from the selected farms in clean 1L plastic
bottles with lids. Milk samples were collected right after the cows were milked. Collected milk
samples were then transported to the Department of Nutrition and Food Science, where all analyses
were done, in an insulated cool box with ice packs. On arrival at the department, the samples were
batch pasteurized at 650C for 30 minutes and stored in a fridge at 40C for analyses and processing.
Pasteurized milk was stored for at least 4 days before discarding.
Figure 3.2: Cow Being Milked by a Herdsman.

28
3.2.2 Coagulant Preparation - Concentrates
3.2.2.1 Citric acid
Citric acid (6.4g) was dissolved in 100ml of distilled water at 27± 20C. Fresh citric acid
concentrate was prepared for every batch of milk collected.
3.2.2.2 Sodom apple
Sodom apple branches (fresh and green) were obtained from University of Ghana campus behind
the Balme Library. They were washed thoroughly with portable water, cut into tiny pieces and
blended using a dry mill blender. 10g of the blended Sodom apple branches was added to 20ml of
milk (27± 20C) and allowed to coagulate at 700C for 5-6 minutes. Coagulation was done in a water
bath. The mixture was stirred, and the whey filtered using a sieve and collected as the concentrate.
3.2.2.3 Rennet
A gram of granular rennet was dissolved in 10ml of tepid distilled water. Fresh rennet
concentrate was prepared for every batch of milk collected.
3.2.3 Coagulation Process
Coagulation was done at different temperatures for the different coagulants. This was based on
the optimum temperature at which they are able to coagulate milk. For rennet, the temperature
used was based on the manufacturer’s instructions. All coagulation was done in a water bath,
where the temperature was maintained using a hot plate.
3.2.3.1 Citric acid coagulation
Pasteurized milk (100ml) was heated to 320C, then 5ml of citric acid solution was added and stirred
for a minute. The sample was allowed to stand for 30 minutes at 320C and drained for another 30
minutes using a cheese cloth with a 150g weight sitting on it.

29
3.2.3.2 Sodom apple coagulation
Pasteurized milk (100ml) was heated to 700C. 6ml of Sodom apple concentrate was added to the
milk and allowed to stand for an hour at 700C without agitating. The curds were cut into cubes 5
minutes before time and then transferred to a cheese cloth, where it was drained for 30 minutes
with a 150g weight sitting on it.
3.2.3.3 Rennet coagulation
Pasteurized milk (100ml) was heated to 380C. 0.5ml of rennet concentrate was added to the milk
and allowed to stand for 30min at 380C without agitating it. The curds were cut into cubes 5
minutes before time and then transferred to a cheese cloth, where it was drained for 30 minutes
with a 150g weight sitting on it.
3.3.2.4 Acid +Sodom apple coagulation
Pasteurized milk (100ml) was heated to 320C. 5ml of citric acid concentrate was added to the milk.
Sodom apple (6ml) was added to the acidified milk and the temperature raised to 700C. The sample
was allowed to stand for an hour at 700C and drained with a cheese cloth for 30 minutes with a
150g weight sitting on it.
3.3.2.5 Acid + Rennet coagulation
Pasteurized milk (100ml) was heated to 320C. 5ml of citric acid concentrate was added to the milk.
The temperature was raised to 380C and 0.5ml of Rennet was added to the acidified milk. The
sample was allowed to stand for 30min at 380C and drained with a cheese cloth for 30 minutes
with a 150g weight sitting on it.

30
3.3 Objective 1 – Physicochemical analyses of milk samples
3.3.1 pH
An HI 2211 pH/ORP meter (HANNA instruments) was used to analyze the pH. Milk (60ml) was
measured into a 100ml beaker. The probe was dipped into the milk and the pH measured. pH was
measured in triplicates for each milk sample. Mean pH values were used for interpretation.
3.3.2 Colour
The Hunter lab colorimeter (Chroma meter CR-410, Monica Minolta) was used for measuring the
colour of the milk samples. The calibrated calorimeter was placed on the fresh milk sample and
the colour measurements were taken at *L*a*b. Values were taken in triplicates for each sample
3.3.3 Protein – Biuret test
Standards were prepared using a stock of 10mg/ml of bovine serum albumin to prepare a
calibration curve. The absorbance was taken at a wave length of 540nm.
Milk samples (0.02ml) were pipetted into test tubes. Distilled water (0.98ml) was added and topped
up with 2ml of biuret reagent. The samples were vortexed and allowed to stand for 20 minutes.
The samples were carefully transferred into a cuvette and the absorbance taken at a wave length
of 540nm using a Shimadzu UV spectrophotometer (UV-1800). Measurements were taken in
triplicates.
The protein concentration was calculated using the calibration curve with the protein being the
unknown variable.
3.3.4 Fat - Rose Gottlieb method
An empty flask was weighed. Milk (10g) was weighed and transferred into the extraction
tube. Ammonia (2ml) was added and the sample shaken thoroughly. Ethyl alcohol (10ml) was
added and mixed again. Then 25 ml of diethyl ether (peroxide free) was added, stoppered and

31
shaken vigorously for about a minute. An additional 25ml petroleum ether was added and shaken
vigorously for about half a minute. The solution was allowed to stand until the upper ethereal layer
separated completely and was clear. The clear ethereal layer was decanted into the weighed flask.
Then 15 ml of diethyl ether (peroxide free) was added, stoppered and shaken vigorously for about
a minute. Then an additional 15ml petroleum ether was added and shaken again vigorously for
about half a minute. The solution was allowed to stand until the upper ethereal layer separated
completely and was clear again. The delivery end of the extraction tube was rinsed with a little
ether and added to the flask. The content of the flask was evaporated and placed in an air oven at
105°C for 30 mins, cooled in a desiccator and weighed.
Calculations
% Fat = 𝑀1− 𝑀2
𝑀𝑆 𝑋 100
Where M1- mass of flask with fat
M2- mass of empty flask
MS – mass of sample only
3.3.5 Total solids
An empty evaporating dish and lid was dried in an air oven at 105°C for 3 hours and transferred
to a desiccator to cool. The empty dish and lid were weighed. Two grams (2g) of the milk sample
was weighed into the dried dish, spread uniformity, partially covered with the lid and placed in the
oven. It was dried for 3 hours at 105°C. After drying, it was transferred into a desiccator to cool.
After cooling it was weighed with the lid.
Calculations
% Total solids = 𝑀1− 𝑀2
𝑀𝑆 𝑋 100
Where M1- mass of dried can +lid + sample

32
M2- mass of empty can +lid
MS – mass of sample only
3.3.6 Calcium content
Milk (1g) was weighed into a khedjal flask. Concentrated nitric acid (25ml) was added and heated
for about 30mins till a pale-yellow coloration was observed. The sample was cooled and 1ml of
perchloric acid was added and heated again till the sample was colourless. It was cooled again and
30ml of distilled water was added and boiled for 10mins more minutes. The sample was cooled,
and the calcium content measured using a Perkinelmer Atomic Absorption Spectrometer
(PinAAcle 900T). Calcium content was measured in triplicates.
3.4 Objective 2- Potential of the milks to coagulate using different coagulants
3.4.1 Coagulation time
This was observed immediately the coagulant was added. The time in seconds for the first curd to
form was recorded. This was noted using a stop watch in seconds.
3.4.1 Coagulum yield
After whey was drained out of the coagulum, the weight of the coagulum was determined
gravimetrically, and the % coagulum yield calculated.
% Coagulum yield= 𝑤𝑒𝑖𝑔ℎ𝑡 𝑜𝑓 𝑐𝑜𝑎𝑔𝑢𝑙𝑢𝑚
𝑤𝑒𝑖𝑔ℎ𝑡 𝑜𝑓 𝑚𝑖𝑙𝑘 𝑢𝑠𝑒𝑑𝑥 100
3.5 Objective 3- Physicochemical Analysis on dewatered coagulum obtained from different
coagulants and milks
3.5.1 Moisture Content
An empty evaporating dish and lid was dried in an air oven at 105°C for 3 hours and transferred
to a desiccator to cool. The empty dish and lid were weighed. Two grams (2g) of the milk sample

33
was weighed into the dried dish, spread uniformity, partially covered with the lid and placed in the
oven. It was dried for 3 hours at 105°C. After drying, it was transferred into a desiccator to cool.
After cooling it was weighed with the lid.
Calculations
% Moisture content = 𝑀1− 𝑀2
𝑀𝑆 𝑋 100
Where M1- mass of can +lid+ sample
M2- mass of dried can +lid + sample
MS – mass of sample only
3.5.2 pH
Same as 3.3.1
3.5.3 pH
Same as 3.3.2
3.5.4 Change in Colour
Change in Lab was obtained by subtracting the value of the coagulum from that of the milk. This
was to determine how much the samples had changed in comparison to the milk which was the
starting point or raw material. When ∆L is positive, the sample is lighter than the milk and a
negative ∆L indicates that the sample is darker than the milk. Negative ∆b means the sample is
greener than the milk and positive ∆b indicates that the sample is redder than the milk. Negative
∆a means the sample is more yellow than the milk and a positive ∆a indicates that the sample is
more blue than the milk.
3.4.5 Fat content
This was calculated using the principle of mass balance
Mass of cheese x fat of cheese = 0.9(mass of milk used for coagulation) x fat of milk
34
% fat of coagulum = 0.9(mass of milk used for coagulation) x fat of milk
𝑚𝑎𝑠𝑠 𝑜𝑓 𝑐𝑜𝑎𝑔𝑢𝑙𝑢𝑚
It is assumed that 90% of the fat is retained in coagulum.
(Morison, 1997)
3.4.6 Protein Content
This was also calculated using the principle of mass balance. This is based on the assumption that
minerals, water soluble vitamins and lactose are lost with the whey since they are water soluble
(Morison, 1997) and (Walstra, Wouters, & Geurts, 2006)
% moisture +% fat +% protein = 100
% protein =100 - % moisture - % fat
3.6 Objective 4 – Sensory and Physicochemical properties of the dewatered coagulum
3.6.1 Sensory Analysis- Quantitative Descriptive Analysis (QDA)
A descriptive panel made up of 12 trained assessors analysed the dewatered coagulum samples.
The samples were made from Rennet, Sodom apple, acid, Sodom apple + acid and Rennet +acid
coagulation of pooled milk using the same process as described for obtaining the coagulum from
individual animals. The assessors met three times in a week for 3 hours each day. The training and
final evaluation happened in 9 sessions which was a total of 27 hours.
The samples were analyzed in the Sensory Evaluation Laboratory at the Department of Nutrition
and Food Science, University of Ghana under controlled environmental conditions. Assessors gave
a profile of the modalities; appearance, aroma and texture in hand.
Samples were cut into cubes of 1x1x1cm. They were served in 80cc transparent cups at 27±20C
and presented to the assessors in a monadic sequential order. Assessors were provided with spoons

35
to assist with the analysis. The test involved panel training and final evaluation. For training,
panelists were made to generate terms, build consensus, rate, rank and do panel performance. Final
evaluation was done in booths where the assessors worked individually. The scale used was a
150mm intensity line scale and the samples were evaluated in triplicates using Compusense 5 by
Compusense®, Canada.
3.6.2 Meltability
The method described by Poduval and Mistry (1999) was used with some modifications.
Dewatered coagulum (3g) was grated and placed in a test tube. The grated dewatered coagulum in
the test tube, was compressed and the height marked. The tube was covered with perforated
aluminium foil to allow the escape of gas during heating. The tube was placed vertically in a fridge
at 4°C for 30min then horizontally in a preheated air oven at 105°C for 10 min. The flow distance
of the melted dewatered coagulum was measured in cm. Meltability for each cheese sample was
done in triplicates.
Calculation
Meltability = final distance of cheese – initial distance of cheese
3.6.3 Texture Analysis
The method described by Zheng et al. (2016) was used with some modifications. The texture
profile analysis (TPA) was done using a Stable Micro System Texture Analyzer. A double-bite
compression cycle using a cylinder with a flat ended probe of diameter (75mm) was used for
compressing the dewatered coagulum. A pre-test speed of 2mm/sec, test speed 1mm/sec, post-test
speed 5mm/sec and a 75% strain were applied. The samples were cut into cubes of 1x1x1cm,
thawed and analyzed at room temperature (27±20C). Each sample was run 15 times and the four

36
most consistent values were selected for further statistical analysis. The indices measured were
hardness, adhesiveness, springiness, chewiness and cohesiveness.
3.6.4 Protein profile- SDS PAGE
Proteins were extracted from the 5 dewatered coagulums and the pooled milk used for coagulation.
This was done to identify the caseins present in the samples using SDS PAGE. A casting plate of
1.5mm was used. A concentration of 12% separating gel and 3.9% stacking gel were prepared into
the casting plate for the separation. A gram of the cheese and milk samples were used in sample
preparation. Sample buffer and sodium dodecyl sulfate (SDS) were added to the samples and
sonicated. Dithiothreitol (DTT) was added to the sonicated samples and they were centrifuged at
5000rpm for10 minutes. The supernatant was collected into a falcon tube and stored in the freezer.
100µl each of the supernatant were pipetted into eppendorf tubes. Sample buffer and loading buffer
were added and boiled for 10 minutes. 0.5µl each of the samples were then pipetted into the wells
of the gel with 0.5µl of BSA and 0.5µl of molecular protein marker. The gel was allowed to run at
a voltage of 100V until the samples reached the bottom of the gel. The gel was removed and
transferred into a clean container. Staining buffer (Coomassie blue) was added and allowed to
stand for about two hours. The staining buffer was discarded, and de-staining buffer was added
and allowed to stand for a couple of hours till the bands were clear and visible. The image of the
gel was captured using an Amersham Imager 600.
3.7 Objective 5 – Setting up, running and producing cheese in a cheese factory (Economic
analysis)
This economic analysis was to explore the economic potential of commercially processing
cheese in Ghana. The analysis was done for cheese made from each of the coagulants: Rennet
only, Acid only, Sodom apple only, Rennet + acid and Sodom apple + acid. Even though farmers

37
have a higher yield from some of the crosses and exotic breeds, the current quantities produced
by the few dairy cows available would be insufficient to run a cheese factory every single day,
thus an assumption has been made that such a factory if existing would operate 3 times a day
each week thus a total of 144 days in the year. The economic analysis, was done based on the
method developed by Peters & Timmerhaus (1991). Modifications and/or assumptions are shown
in the calculations.
3.7.1 Total Capital Investment (TCI)
This involves the summation of the working capital and the fixed capital. The working capital is
the amount of money needed for the start and operation of a plant whereas the fixed capital is the
capital that is needed to supply the necessary manufacturing and plant facilities and their
installation too.
3.7.2 Total Production Cost (TPC)
This refers to the costs that would be incurred in the operation of a plant as well as the sale of the
products. The estimation of costs for operating the plant and selling 100g of cheese can be grouped
under the general heading of total production cost. The Total Production cost is generally divided
into manufacturing costs and general expenses. Manufacturing costs are also known as operating
or production costs (Peters and Timmerhaus, 1991).
Total product cost is usually done on annual cost basis. This is because:
The effect of seasonal variations is smoothed out,
Plant on-stream time or equipment operating factor is considered,
It permits more-rapid calculation of operating costs at less than full capacity, and
It provides a convenient way of considering infrequently occurring but large expenses such as
annual turnaround costs.

38
3.7.3 Profitability Analysis (PA)
This gives a measure of the amount of profit that can be obtained from a given situation.
3.8 Statistical analyses
Minitab software version 17 was used to analyze data obtained from the physicochemical analyses.
One-way ANOVA was done to determine if differences existed amongst the milk samples and the
cheese samples. Two-way ANOVA was used to determine the interaction between the breeds and
coagulants for the various coagulum obtained. Excel-Stats (Addinsoft, France) was used to analyse
Sensory data using two-way ANOVA. Tukey’s HSD post hoc analysis was further carried out to
explain sample differences.

39
CHAPTER FOUR
4.0 RESULTS AND DISCUSSION
4.1 Physicochemical properties of milk that influence coagulation
Physicochemical analysis was done on the milks from the different breeds to determine their
composition.
Table 4.1: Physicochemical Properties of Milks from Different Breeds of Cattle
Values with different alphabets are statistically different for each physicochemical property at p<0.05.
4.1.1 pH of milk samples
pH of the breeds showed a statistical significant difference between the Cross and the other two
breeds. Although there was a significant difference, the values obtained were in the range required
for pH of fresh milk. Fresh milk pH ranges between 6.6-6.8.; at this pH the milk is able to stay in
the liquid form (Tsioulpas et al., 2007). Lactation period has an influence on the pH of milk. The
differences in the pH could be due to the different lactation periods of the cows. At early lactation,
the pH is low. It increases slightly during mid-lactation and further increases during late lactation
BREED
pH
FAT
(%)
PROTEIN
(mg/ml)
TOTAL
SOLIDS (%)
ASH
(%)
CALCIUM
(mg/100g)
WHITE
FULANI 6.784±0.03a 2.46±0.25a 13.36±0.67a 12.29±0.24b 0.76±0.09a 289.05±25.88a
CROSS 6.707±0.06b 3.26±1.0a 13.15±2.02a 13.81±0.89a 0.64±0.08b 165.69±23.38c
JERSEY 6.808±0.11a 3.46±1.95 a 13.65±1.74a 14.61±2.76a 0.79±0.11a 194.63±41.53b

40
(Tsioulpas et al., 2007). Four out of six of the cows were in their mid-lactation period. They
included a Jersey, a Cross and both White Fulani. The other Jersey was in her early lactation period
and the other Cross in her late lactation period. Since the Cross had the least pH amongst the breeds
it would have been expected that the cows would be in their early lactation period, but this was not
so. The deviation may be due to the differences in lactation period within the Cross breeds.
4.1.2 Fat and protein content of milk samples
Fat and protein content of the milks from the different breeds showed no statistical significant
difference. Fat and protein content are influenced by breed type. According to Walstra, Wouters,
& Geurts (2006), Jerseys have higher protein and fat content as compared to other breeds. The
deviation for the lower fat content may be due to the feed provided. Apart from breed type, feed
type also influences fat content of milk. The feed type determines the by-products of digestion.
Feeds that are easily digestible influence the precursors of milk fat. Instead of producing more
acetic acid and butyric acid, more propionic acids are rather produced. Propionic acid stimulates
insulin production which reduces free fatty acid release from the adipose tissue, leading to less fat
being released into the milk (Linn, 1988). This could mean that the feed provided for the Jerseys
was easily digestible hence the production of less free fatty acids than their usual fat content. Even
though statistically there was no difference in the fat content of the milks, it was observed that the
mean fat content of the Jersey was higher than the other two breeds. This could be due to the large
deviation seen on Table 4.1 for the Jersey. The deviation may have occurred perhaps due to
different farming practices executed at the different farms. Even though they were both Jerseys
were managed via zero grazing some practices may have differed between farms. Also, protein
content of the Jersey was not higher than that of the Cross and White Fulani. This may be due to
their lactation period and whether the cows were pregnant or not. After a few weeks of lactation,

41
protein content in cow milk begins to increase. From the lactation history of the cows, it can be
seen that the reduction in protein content may be due to the early lactation period of one Jersey
(Linn, 1988).
4.1.3 Total solids, Ash and Calcium content of milk samples
For total solids, milk from the White Fulani was significantly different from the Cross and Jersey.
The White Fulani had a lower total solids content. Feed affects the nutritional composition of milk.
The cows that have to find their own food via grazing may not get enough as compared to those
provided with feed. Those under Zero grazing (Cross and Jersey) may have the same quantity and
quality of feed everyday as compared to the White Fulani cows whose eating pattern and
nutritional composition of feed may not be consistent. Inconsistencies in the feeding of the White
Fulani may be the cause of the lower total solid content observed. Ash content showed significant
difference between the Cross and the other two breeds. Milk from the Cross had the least ash
content. According to Zamberlin et al.(2012), mineral content in feed and soil influences the
mineral content in cow’s milk. This may mean that the feed provided for the Cross had less
minerals in it as compared to that of the Jersey and the Fulani. The ash content influenced the
calcium content of the milks. Calcium is a mineral hence the higher the mineral content the higher
the calcium content. All the breeds showed significant difference with the Cross having the least
calcium content.
4.1.4 Colour of Milk Samples from the Different Breeds
Colour of the milk samples were determined to find out if the milk from the breeds showed some
differences based on the Lightness, greenness and yellowness

42
Figure 4.1: Colour of Milk Samples. Where L-lightness, a- greenness and b-yellowness
All the samples were light as seen on the lightness scale (*L) on Figure 4.2, but statistically, milk
obtained from the White Fulani was different from the other two. It was the lightest amongst the
three. The *a scale tells whether the samples are red or green. Positive values indicate redness and
negative values indicate greenness. The *a scale for the milk samples indicated, all the samples
were more green than red but milk from the Jersey was seen to be the greenest as compared to the
other two breeds. A positive *b scale shows that the sample is yellow and negative means it is
blue. Figure 4.1 shows that the samples are more yellow than blue. There was statistical significant
difference between breeds for yellowness with the Jersey breed showing the highest values for
yellow. Yellow colour in milk is normal and is as a result of beta-carotene in the fat component of
milk (Walstra, Wouters, & Geurts, 2006). Ullah et al. (2017), explained that the milk fat in Jersey
89
-3.25
14.07
89.58
-2.01 8.68
90.86
-2.6
8.3
-40
-20
0
20
40
60
80
100
120
140
L a b
CO
LOU
R V
ALU
ES
COLOUR SCALE
JERSEY CROSS WHITE FULANI

43
cows are however more yellow coloured as they are able to breakdown the beta-carotene in their
food which is then absorbed in their milk.

44
4.2 Coagulating potential of the milks from the different breeds using different coagulants
Coagulum yield was determined to find out which breed and coagulant produced the highest
amount of coagulum after coagulation and dewatering. The time for coagulation was also
measured to find out how fast the milks could coagulate and also know how the coagulants
influenced the rate of coagulation.
4.2.1 Yield of Coagulum Obtained
Figure 4.2: Coagulum Yield of Milk from Different Breeds Using 5 Coagulants. Where: Acid
Only - A, Rennet Only – R, Rennet +Acid – RA, Sodom Apple Only - S, Sodom Apple + Acid
– SA, White Fulani – F, Cross – C, Jersey – J
Figure 4.2 shows that the coagulum with the least yield was processed using A and this was
followed by SA and RA, then R and finally S. There was a statistical significant difference at a p
value < 0.05 of the interaction between the breeds and the coagulants. Generally, the milk from
the Jersey cows gave higher yield of coagulum for three out of five different coagulants used. This
9.2
19.07
15.4
25.68
14.72
8.87
18.17
15.2
23.31
12.86
10.16
17.97
12.02
19.85
11.44
0
5
10
15
20
25
30
A R RA S SA
% Y
ELD
COAGULANTS
J C F

45
may be attributed to the fact that coagulum from Jerseys are able to recover most of the nutrients
in the milk. According to (Stocco et al., 2018) analysis done on milk from Jersey and five other
cows showed that the recovery rate for both coagulum fat and protein content was highest. This
means that, most of the proteins and fat are not lost but are retained in the coagulum as compared
to other breeds.
R is known to give high coagulum yield (Ben Amira et al., 2017) but from Figure 4.2, S has the
highest yield. The high yield for S maybe due to the high temperature needed for coagulation.
According to El-Gawad & Ahmed (2011), high temperatures denature whey proteins which adds
to the total coagulum yield. Also, longer coagulation time using enzyme produces coagulum with
high yield (Johnson, Chen, & Jaeggi, 2010). Figure 4.3 showed that milks coagulated using Sodom
apple had the longest coagulation time followed by rennet. Low yield in A, RA and SA may be
due to loss of proteose- peptones (a peptone is a soluble protein formed in the early stage of protein
breakdown and a proteose is any water-soluble compound produced during digestion by the
hydrolytic breakdown of proteins) in whey due to low pH. The rate at which they are lost is more
reduced in enzyme coagulated milk (Johnson, Chen, & Jaeggi, 2010).

46
4.2.2 Time Required for First coagulum to Form
Figure 4.3: Time Taken for First Coagulum to be Formed. Where: Acid Only - A, Rennet
Only – R, Rennet +Acid – RA, Sodom Apple Only - S, Sodom Apple + Acid – SA, White
Fulani – F, Cross – C, Jersey – J. Values with the same alphabet are statistically the same for
each physicochemical property at p<0.05
There was a statistical significant difference at a p value < 0.05 of the interaction between the
breeds and the coagulants. For the breeds, milk from the White Fulani had the shortest coagulation
time for coagulum processed with S as compared to the Cross and Jersey. The ability of the White
Fulani milk to coagulate within a short period of time maybe due to its high calcium content (Table
4.1). Calcium content influences the rate of coagulation according to Troch et al. (2017). The
higher the calcium content, the faster the rate of coagulation.
All milk samples that had an initial addition of acid had the first coagulum formed in less than 10
seconds. It took a longer period for coagulum processed with sample R and sample S to coagulate,
and between the two, sample R had a shorter coagulation time. The differences in time may be due
7
120
7
866
77
169
7
973
7638
6
546
50
100
200
300
400
500
600
700
800
900
1000
A R RA S SA
TIM
E(S)
COAGULANTS
J C F
a
a
b
c c c c c c c c c c c c
47
to the process by which the different coagulants react. The change in milk pH by adding acid
immediately neutralizes the casein micelle. When this happens, the caseins start to coagulate. This
takes a very short time to occur as compared to the enzyme, hence the quick rate of coagulation
for coagulum processed with A, SA and RA (Troch et al., 2017). Sodom apple and Rennet are
enzymes and the process of coagulation is a proteolytic reaction. Coagulum processed with S took
a longer time to coagulate and this may be because proteolysis is not as specific as that of R
(Rayanatou et al., 2017). It means a longer time would be needed to cleave the right bonds for
coagulation to occur.

48
4.3 Physicochemical properties of dewatered coagulum obtained
Coagulum moisture, pH, fat, protein and colour were determined. This was done to find out if the
milk from the different breeds and different coagulants influenced the final physicochemical
properties of the coagulum.
4.3.1 Moisture Content and pH of Coagulum
Figure 4.4: Moisture Content of Coagulum from Different Breeds Using Different Coagulant
Where: Acid Only - A, Rennet Only – R, Rennet +Acid – RA, Sodom Apple Only - S, Sodom
Apple + Acid – SA, White Fulani – F, Cross – C, Jersey – J
0
10
20
30
40
50
60
70
A R RA S SA
% M
OIS
TUR
E
COAGULANTS
J C F

49
Figure 4.5: pH of Coagulum from Different Breeds Using Different Coagulants. Where: Acid
Only - A, Rennet Only – R, Rennet +Acid – RA, Sodom Apple Only - S, Sodom Apple + Acid
– SA, White Fulani – F, Cross – C, Jersey – J
4.3.1.1 Moisture content
There was a statistical significant difference at a p value < 0.05 of the interaction between the
breeds and the coagulants
Coagulum from the Jersey showed the highest moisture content for four coagulums. A study
conducted by Stocco et al. (2018) also showed that the moisture retained in coagulum processed
from Jersey milk retained more water as compared to five other cattle breeds.
Coagulum processed with S had the highest moisture content while coagulum processed from RA
and SA were the driest. This may be due to continuous syneresis that occurs after cutting or stirring
coagulum made from enzymes. Syneresis is the oozing out of moisture in the form of whey when
the coagulum is disturbed (Lucey, 2002). In the case of sample S, it means even after dewatering
more whey was being let out hence the high moisture content. Longer coagulation time also has
an influence on the final moisture content of the product. According to Johnson, Chen, & Jaeggi,
0
1
2
3
4
5
6
7
8
A R RA S SA
pH
COAGULANTS
J C F

50
(2010), the longer the coagulation time for enzyme coagulation the higher the moisture content of
the final coagulum.
Coagulum processed from A also had a high moisture content. This could be attributed to low
calcium -casein interaction leading to more hydrated proteins during direct acidulation (Ismail &
Hamad, 2015). The drier state of coagulum from RA and SA may also be due to the low pH of the
coagulum. According to Ismail & Hamad, (2015) there is a decrease in hydration of protein due to
hydrophobic interactions when the pH of acid-rennet coagulum is closer to the isoelectric point
<5.4.
4.3.1.2 pH of coagulum
There was a statistical significant difference at a p value < 0.05 of the interaction between the
breeds and the coagulants.
pH values of coagulum obtained in Figure 4.5 varied for all the coagulants. The breeds showed
almost the same pH pattern for all the coagulum obtained. The White Fulani showed the highest
pH values for coagulum that had acid. Apart from the Jersey which showed high pH for coagulum
processed with R the other breeds showed almost the same pH for coagulum processed with R. All
three breeds showed similar pH values for coagulum processed with S.
From the graph, the pH of the coagulum processed with S reduced slightly as compared to the pH
of the milks. This may be due to the slightly acidic nature of Sodom apple which is 6.36. Coagulum
processed with R had its pH values closer to that of the milk used in coagulating. The very close
values of coagulum processed with R and S to the original pH value of the milk samples is because
enzyme coagulation does not change the pH but rather cleaves κ caseins (Ricardo et al. 2017). The
rest of the samples which had acid being added had a more acidic pH. Coagulum processed with
A was the most acidic and this was followed by sample RA and finally sample SA. When pH of

51
milk is lowered, casein micelles reduce in size. The reduced size influences texture of coagulum
obtained. The coagulum is much firmer as compared to large sized micelles (Sinaga, Bansal, &
Bhandari, 2017). Also, the smaller the micelle size the less ligher the colour of the acidified
coagulum. This was seen in Figure 4.11. Samples A, RA and SA where not as light as sample R
and S which had no acid added to them.
4.3.2 Fat and Protein Content of Coagulum
Figure 4.6: % Fat Content of Coagulum from Different Breeds Using Different Coagulants.
Where: Acid Only - A, Rennet Only – R, Rennet +Acid – RA, Sodom Apple Only - S, Sodom
Apple + Acid – SA, White Fulani – F, Cross – C, Jersey – J
34.5
16.47
21
12.37
23.01
33.41
17.1219.35
12.63
22.8222.48
12.71
18.72
11.36
19.64
0
5
10
15
20
25
30
35
40
A R RA S SA
%FA
T
COAGULANTS
J C F

52
Figure 4.7: % Protein Content of Coagulum from Different Breeds Using Different
Coagulants. Where: Acid Only - A, Rennet Only – R, Rennet +Acid – RA, Sodom Apple Only
- S, Sodom Apple + Acid – SA, White Fulani – F, Cross – C, Jersey – J
4.3.1.3 Fat content
There was a statistical significant difference at a p value < 0.05 of the interaction between the
breeds and the coagulants. Coagulum obtained from the Jersey showed high fat content for most
of the samples (Figure 4.6). This was followed closely by the Cross with White Fulani having the
least fat content. This may be because coagulum processed from Jerseys usually retain more fat
than other cattle breeds (Stocco et al., 2018). Also, the fat content for the cow milks (Table 4.1)
showed a similar pattern. Milk from Jersey cows had the highest fat content followed by the Cross
and White Fulani. Milk composition has an influence in the final coagulum composition (El-
Gawad & Ahmed, 2011). It is therefore not surprising to see that coagulum from the Jersey has
higher fat content than the other cows.
Coagulum processed with A had the highest fat content as compared to the other samples. This
was not observed by Ismail & Hamad (2015). According to them milk cheese produced via direct
acidulation using glucono- δ-lactone had lower fat content as compared to cheese coagulated using
27.25
43.35
30.69
53.37
28.13
23.88
42.65
29.34
50.11
25.31
38.55
48.67
31.85
52.14
26.04
0
10
20
30
40
50
60
A R RA S SA
%P
RO
TEIN
COAGULANTS
J C F

53
microorganisms. The difference may be due to the type of acid used. Coagulum processed with R
and S had the least fat content. This could be accounted for by the firmness of the curd. Firmer
curds lose more fat than soft curds. The process of breaking curd before dewatering may have also
influenced the fat content too (El-Gawad & Ahmed, 2011). Longer coagulation time also
influences the fat recovery of coagulum. S was seen to take a very long time to coagulate as
compared to the other coagulants. This could have accounted for the low fat content in S (Johnson,
Chen, & Jaeggi, 2010)
4.3.1.4 Protein content
From Figure 4.7, protein content was lowest for coagulum processed with A and SA. The highest
was that of S. The protein content of the various coagulum follows the same trend as that of the
yield. Samples with acid had lower protein content as compared to those that had enzyme only.
This may be due to the fact that proteins coagulate at different pH’s (Phadungath, 2005a). That is,
all the proteins in the milk were not able to coagulate hence the low protein content. Coagulum
from S had the highest protein content because some of the whey proteins in the milk got
denatured, therefore remained in the coagulum increasing the protein content (El-Gawad &
Ahmed, 2011). For breeds, the Cross showed the least protein content for all coagulum. This could
be due to the inability of proteins to be retained in the coagulum (Stocco et al., 2018). Unlike milk
from the Jerseys that are able to retain proteins in coagulum, the Crosses was not able to do so.
This means that most of the proteins were lost since there was no statistical difference in the protein
content of the milks from the different breeds (Table 4.1).

54
4.3.3 Colour of Coagulum - *L *a and *b.
Figure 4.8: *L of Coagulum from Different Breeds Using Different Coagulants. Where: Acid
Only - A, Rennet Only – R, Rennet +Acid – RA, Sodom Apple Only - S, Sodom Apple + Acid
– SA, White Fulani – F, Cross – C, Jersey – J
Figure 4.9: *A of Coagulum from Different Breeds Using Different Coagulants. Where: Acid
Only - A, Rennet Only – R, Rennet +Acid – RA, Sodom Apple Only - S, Sodom Apple + Acid
– SA, White Fulani – F, Cross – C, Jersey – J
94.6395.07
92.63
94.79
92.14
96.47 96.68
94.26
96.57
92.83
95.0794.63
92
95.2
89.37
84
86
88
90
92
94
96
98
A R RA S SA
*L
COAGULANTS
J C F
-2.09-2.23
-1.89
-3.93
-3.51
-2.4 -2.4-2.1
-3.58
-4.45
-2.16
-2.72
-2.3
-3.26
-3.98
-5
-4.5
-4
-3.5
-3
-2.5
-2
-1.5
-1
-0.5
0
A R RA S SA
*a
COAGULANTS
J C F

55
Figure 4.10: *B of Coagulum from Different Breeds Using Different Coagulants. Where:
Acid Only - A, Rennet Only – R, Rennet +Acid – RA, Sodom Apple Only - S, Sodom Apple
+ Acid – SA, White Fulani – F, Cross – C, Jersey – J
4.3.1.5 Colour of coagulum
There was a statistical significant difference at a p value < 0.05 of the interaction between the
breeds and the coagulants for all the colour indices. For the lightness scale (*L), in Figure 4.8
coagulum samples processed with coagulants A, R and S were observed to be lighter than RA and
SA. For the breeds, coagulum from the Cross were lighter than that of the Jersey and the White
Fulani
The negative values of the *a scale Figure 4.9 are an indication that the samples are greener than
red. Coagulum made with coagulants S and SA were seen to be greener as compared to the other
coagulum. This may be due to the influence of the colour of the S as stated by Akinloye &
23.78
29.9730.97
25.49
30.14
19.1221.11 22.15
18.7
27.32
16.2119.54
22.49 23.3
27.77
0
5
10
15
20
25
30
35
A R RA S SA
*b
COAGULANTS
J C F

56
Adewumi, (2014). Coagulum processed from SA using milk from the Cross was the greenest
amongst all the samples with sample RA processed from the Jersey having the least greenness.
Generally, the greenest coagulum was observed to be from the White Fulani and the least from the
Jersey.
The *b scale Figure 4.10 indicated that the samples were more yellow than blue. All coagulum
processed using milk from the Jersey had high yellowness as compared to the other breeds. This
may be due to the yellowness of the Jersey milk as observed in Figure 2. For the Jersey breed,
coagulum with the highest yellowness were those processed with R, RA and SA and the least was
the sample from A. For the Cross breed, coagulum processed from SA was the yellowest and the
least yellow was the coagulum with S. Finally, for the White Fulani breed, coagulum with SA was
the most yellow and coagulum with A being the least. For all the coagulants used coagulum
obtained using A, was generally the lowest for yellowness and the highest was generally coagulum
with SA.
4.3.4 Change in Coagulum Colours ∆L, ∆a, and ∆b
Change in coagulum colour was done to see if there was a change in the final coagulum when
compared to the milk that was used in processing it.

57
Figure 4.11: ∆L of Coagulum from Different Breeds Using Different Coagulants. Where:
Acid Only - A, Rennet Only – R, Rennet +Acid – RA, Sodom Apple Only - S, Sodom Apple
+ Acid – SA, White Fulani – F, Cross – C, Jersey – J
Figure 4.12: ∆A of Coagulum from Different Breeds Using Different Coagulants. Where:
Acid Only - A, Rennet Only – R, Rennet +Acid – RA, Sodom Apple Only - S, Sodom Apple
+ Acid – SA, White Fulani – F, Cross – C, Jersey – J
5.626.06
3.63
5.78
3.13
6.9 7.1
4.68
6.99
3.25
4.13.84
1.14
4.33
3
0
1
2
3
4
5
6
7
8
A R RA S SA
∆L
COAGULANTS
J C F
0.91.02
1.14
-0.67
-0.26-0.06 -0.21
0.24
-1.24
-2.11
0.44
-0.12
0.3
-0.66
-1.38
-2.5
-2
-1.5
-1
-0.5
0
0.5
1
1.5
A R RA S SA
∆a
COAGULANTS
J C F

58
Figure 4.13: ∆B of Coagulum from Different Breeds Using Different Coagulants. Where:
Acid Only - A, Rennet Only – R, Rennet +Acid – RA, Sodom Apple Only - S, Sodom Apple
+ Acid – SA, White Fulani – F, Cross – C, Jersey – J
There was a statistical significant difference at a p value < 0.05 of the interaction between the
breeds and the coagulants for the change in L, a and b. For ∆L Figure 4.11, coagulum obtained
from the White Fulani changed the least, followed by the Jersey and finally the Cross breed. The
positive values give an indication that the samples are lighter than the milk samples used. Amongst
all the samples, coagulum processed with A, R and S were the lightest when compared to the milk
and those processed with RA and SA were the least light.
From Figure 4.12, all the three breeds had a greener colour for coagulum obtained from S and SA
when compared to the milk samples. Coagulum from coagulant RA was red across all breeds,
meaning that it was redder than the milk. Coagulum obtained from the Cross showed the highest
9.7
15.916.89
11.41
16.06
10.43
12.4313.46
10.02
18.64
7.91
11.24
14.215
19.47
0
5
10
15
20
25
A R RA S SA
∆b
COAGULANTS
J C F

59
level of greenness when compared to the other breeds and coagulum from the Jersey showed 3
samples being redder than the milk samples. Apart from coagulum processed from RA which was
redder than the milks for all three breeds, the other coagulum showed both some redness and
greenness depending on the breed.
From the graph all the coagulums were more yellow than the milk. Generally, the sample that was
most yellow for all three breeds was coagulum processed with SA. And the least was coagulum
processed with A. Coagulum from the Jersey breed generally showed high level of yellowness as
compared to the other breeds.

60
4.4 Sensory and physicochemical properties of pooled milk coagulum
4.4.1 Sensory properties of pooled milk Coagulum
Three modalities of the coagulum samples: appearance, aroma and texture in hand were analysed
using QDA. A total of 10 attributes were obtained. These consisted of 2 appearance attributes, 3
aroma attributes and 5 texture in hand attributes. Some of the attributes were similar to that
obtained by (Aday et al., 2010).
Table 4.2: Sensory Attributes for the Coagulum Samples
Modality Descriptor Definition Reference Anchor Protocol
Appearance Cream
colour
Light- Dark Open disposable cup
Observe sample
from top
Moist Having a wet
appearance
Not- Very
Aroma Cowy Characteristic
aroma of raw
cow meat
Raw cow
meat
Not- Very
Shake disposable
cup
Bring close to nose,
open to perceive
aroma note
Milky Characteristic
aroma of hot
powdered
milk drink
Full cream
Cowbell
powdered
milk
mixed
with hot
water
Not- Very
Buttery Characteristic
aroma of
unsalted
butter
Lucke
unsalted
butter
Not- Very
Texture in
hand
Mushy Becoming
squashy
when rubbed
between
fingers
Not- Very Cut a quarter of
sample
Gently press sample
between fingers
Flaky & Mushy:
Take a quarter of
sample
Rub sample with
thumb and middle
finger in a forward
Springy “Returning”
to original
state after
being
compressed
Not- Very

61
Recovery
rate
Time
required for
sample to
return to
original
shape
High - Low and backward
motion
Flaky Breaking into
small
fragments
Not- Very
Moist Having a wet
feel
Not- Very
Figure 4.14: Sensory Profile of the Dewatered Coagulum. *Attributes are Statistically
Significant. Where: Acid Only - A, Rennet Only – R, Rennet +Acid – RA, Sodom Apple Only
- S, Sodom Apple + Acid – SA
0
15
30
45
60
75
90
105
120
135
150
*CREAM COLOUR-AP
*MOIST-AP
*COWY-AR
*MILKY-AR
*BUTTERY-AR
*SPRINGY-TX
*RECOVERY RATE-TX
*FLAKY-TX
*MOIST-TX
*MUSHY-TX
A R RA S SA

62
Figure 4.15: PCA of Dewatered coagulum Samples. Where: Acid Only - A, Rennet Only – R,
Rennet +Acid – RA, Sodom Apple Only - S, Sodom Apple + Acid – SA
All 10 attributes statistically significantly discriminated (alpha=0.05) amongst the samples,
showing how the samples differed from each other. Figure 4.14 shows the full appearance, aroma
and texture in hand profile of the samples. All the samples were cream in colour with some having
a lighter intensity than others. Sample R and S were observed to be the moistest and this was
replicated in the attribute moist for the modality texture in hand. This may be due to continuous
syneresis that occurs after cutting or stirring coagulum made from enzymes. Syneresis is the oozing
out of moisture in the form of whey when the coagulum is disturbed (Lucey, 2002)
A
R
RA
S
SA
CREAM COLOUR-AP
MOIST-APCOWY-AR
MILKY-AR
BUTTERY-AR SPRINGY-TX
RECOVERY RATE-TX
FLAKY-TX
MOIST-TXMUSHY-TX
-5
-4
-3
-2
-1
0
1
2
3
4
5
6
-7 -6 -5 -4 -3 -2 -1 0 1 2 3 4 5 6 7
F2
(17.6
8 %
)
F1 (78.74 %)
Sensory profiles (axes F1 and F2: 96.43 %)

63
Sample S was also seen to have the highest intensity for cowy and milky aromas. For texture in
hand, sample S was the springiest, had the highest recovery rate and was the flakiest. This was
closely followed by sample R.
Sample SA had the highest buttery aroma as compared to the other samples and sample R, RA and
SA were observed to be mushier as compared to samples S and R for texture in hand.
From the PCR in Figure 4.15, it was observed that samples SA, RA and A had a mushy texture
when in hand and they were generally buttery. The samples on the positive side: S and R had a
more cowy aroma. In terms of texture in hand, S and R were generally springy, moist and flaky.
4.4.2 Meltability of Samples
Meltability of the samples was determined in order to find out which of them had the capability
of melting when heat was applied.
0
1
2
3
4
5
6
7
8
9
RA A SA S R
Dis
tan
ce (
cm)
Cheese
a
c
b
c c
Figure 4.17: Picture Showing the
Meltability of the Cheese
Samples.
Figure 4.16: Meltability of Cheese Samples. Samples with
Different Alphabets are Statistically different at P<0.05.
Where: Acid Only - A, Rennet Only – R, Rennet +Acid –
RA, Sodom Apple Only - S, Sodom Apple + Acid – SA

64
Figure 4.16 showed that sample RA melted more than the other samples and this was followed by
sample A. Sample SA showed some level of melting, but there was no statistical significance
difference amongst it, sample S and R. Melting in cheese actually occurs due to fat melting (Lucey,
Johnson, & Horne, 2003). According to Cais-Sokolińska & Pikul (2009), the higher the fat content
the higher the meltability. This is evident in Figure 4.7, where sample RA, SA and A were seen to
generally have a higher fat content as compared to the other samples. SA deviated from this fact
and this could be due to the optimum temperature at which coagulation occurs for S. According to
Lucey, Johnson, & Horne (2003), cheese processed from milks at very high temperatures are not
able to melt. The high rate of melting seen in sample RA and not in sample R may be due to the
influence of the acid present. The acid may have reduced the protein-protein interaction that takes
place during enzyme coagulation thereby reducing the association of calcium with the casein
molecules. Strong protein-protein interactions prevents cheese from melting (Lucey, Johnson, &
Horne, 2003).

65
4.4.3 Texture Profile of Dewatered Coagulum Samples
Texture of the samples were determined to know the textural properties of the individual
coagulum’s processed from different coagulants.
Table 4.3: Texture Profile of the Cheese Samples
Values with the different alphabets are statistically different for each textural property at p<0.05.
Values are means ± standard deviations. Where: Acid only - A, Rennet only – R, Rennet +Acid – RA, Sodom
apple only - S, Sodom apple + Acid – SA
Sample Hardness
(g)
Adhesiveness
(gs)
Springiness
(s)
Cohesiveness
Chewiness
(gs)
A 962.73±7.25 b -35.61±10.29c 0.45±0.036c 0.24 ±0.008c 103.13±5.98b
R 939.00±19.9 b -10.76±1.29a 0.71±0.031a 0.36±0.010a 235.36±4.68a
RA 1066.80±17.5 a -74.71±0.67d 0.22±0.02d 0.20±0.004b 45.86±4.74c
S 530.60±31.7c -20.80±0.58ab 0.62±0.047b 0.33±0.026a 107.40b±17.30b
SA 1029.78±7.15a -34.92±5.65bc 0.38±0.014c 0.26±0.015b 101.22±9.68b

66
Figure 4.18: A Typical Texture Profile Graph of Dewatered Coagulum
From Table 4.3, samples RA and SA were the hardest amongst all the samples, while sample S
was the softest. Comparing sample R to S, sample R was seen to have a harder texture. This
correlates with Ben Amira et al. ( 2017), when they make mention of the fact that rennet or
chymosin produces firmer gels as compared to plant enzymes.
Sample R was observed to be the most adhesive. This means that for sample R, more force was
required in pulling the compression force off. The least adhesive was sample RA. This trend can
be accounted for on the basis that the harder the sample, the less adhesive it becomes (Saunders,
Hamann, & Lineback, 1992). This can be observed in Table 4.3 where RA was the hardest
among all the samples.

67
The springiest samples were R and S. This indicates that they recovered more of their original
height as compared to the other samples. Similar results were seen for texture in hand in the
sensory analysis. More energy (chewiness) was needed to break down or masticate sample R and
S as compared to the other samples. The least chewy sample was RA. According to Foegeding &
Drake (2007), low fat content of coagulum produces springy and chewy samples. This could be
the reason why sample R and S were the springiest and chewiest. They had the least fat content
in (Figure 4.6). Samples R and S were also the most cohesive. Cohesiveness is the degree to
which the sample deforms before shearing.

68
4.4.4 Protein Profile of Dewatered Coagulum and Milk Samples
Proteins in the milk undergo various processes during coagulation. This test was done to find out
which proteins were lost and which ones were retained in the various coagulums.
Figure 4.19: SDS-PAGE of Dewatered Coagulum Made from Different Coagulants. Where:
Acid Only - A, Rennet Only – R, Rennet +Acid – RA, Sodom Apple Only - S, Sodom Apple
+ Acid – SA
From Figure 4.19 visible bands indicate presence of a protein. The deeper the band the more the
protein present. The milk sample had all three caseins in it with β casein being the most. Generally,
sample R had had the faintest bands for all proteins. For all the samples there was a band that
69
showed presence of αs casein. The bands for A and S were the deepest and that of R was the
faintest. Amongst all the caseins, β casein was observed to be the most abundant. It was lowest in
R and RA and highest in A and SA. The same was observed for κ casein; deeper bands were
observed for A and SA. The faint bands seen in sample R could be because more κ caseins were
hydrolyzed allowing other caseins to bind to calcium to form paracaseinate (Lucey, 2002) . The
specificity of the rennet enzyme could also account for this (Ben Amira et al., 2017). Acids do not
have any influence on the caseins as compared to enzymes (Troch et al., 2017), hence the high
concentration of the caseins. SA had similar bands as that of A. This may be due to denaturation
of the Sodom apple enzyme due to the presence of the acid.

70
4.5 Cost of setting up, running and producing cheese in a cheese factory
The assumptions made in estimating the economic potential of using local raw materials to make
cheese from any of the coagulum developed in the current experiment are outlined below:
Working period: 144 days per year continuously (three times a week)
Production rate for cheese: 80kg/day (800L of milk/day) assuming that 1L of milk gives
100g of cheese.
Plant life: 20 years.
Exchange rate: $1 = GHȼ 4.41 (Bank of Ghana rate: 28/05/2018).
Interest rate (i) = 17% (Bank of Ghana rate: 28/05/2018).
Tax rate- Corporate tax (t): 25% (Ghana revenue authority: 28/05/2018)
4.5.1 Total Capital Investment
4.5.1.1 Equipment Cost
One of the major costs involved in a plant is the cost of equipment. This involves all the major and
minor equipment and the vehicles needed. The spare parts, contingency, handling and
transportation of the equipment were also calculated using factors proposed by (Peters &
Timmerhaus, 1991).
Table 4.4: Cost of Major Equipment
Equipment Material of construction Quantity
Batch pasteurizer and fermentation tank Stainless steel 1 SET
Automatic control panel - 1 SET
Milk pump Stainless steel 1 UNIT
Cream separator Stainless steel 1 UNIT
Cream collection trolley Plastic 1 UNIT
Homogenizer Stainless steel 1 UNIT

71
Fermentation tank Stainless steel 1 UNIT
Cheese press Stainless steel 1 UNIT
Cheese molds Plastic 1 SET
Cheese working table Stainless steel 1 SET
Hot water boiler - 1 UNIT
TOTAL $95,000
DELIVERY COST- Shipping and packaging $2,500
TOTAL COST IN $ $97,500
TOTAL COST IN GHȻ 429,975.00
Table 4.5: Cost of Minor Equipment
Equipment Material of
construction
Quantity Unit cost
(GHȼ)
Total cost
(GHȼ)
Cheese cloth Cotton 50 yards 7.00 350.00
Knives Stainless steel 5 5.00 25.00
Basin Stainless steel 5 35.00 175.00
Thermometer 1 550.00 550.00
Hand held pH meter 1 50.00 50.00
Aerometer 1 250.00 250.00
Electronic scale 1 155.00 155.00
Measuring cup 5 6.00 30.00
Spatula Stainless steel 5 35.00 175.00

72
*Industrial grinder 1 7,497.00 7,497.00
Glass door
Refrigerator
1 1,800.00 1,800.00
*TOTAL 11,057.00
TOTAL 3,560.00
*Required only for producing sample Sodom apple and Sodom apple + acid
*Total cost of equipment = Cost of major equipment + Cost of minor equipment
= 429,975.00+ 11,057.00
= GHȻ 441,032.00
*Estimated: Spare parts = 10%
= 1.10 × 441,032.00= GHȻ 485,135.20
Contingency = 2%
= 1.02 × 485,135.20 = GHȻ 494,837.90
Handling and Transportation= 0.5%
= 1.005 × 494,837.90 = GHȻ 497,312.09
Total cost of equipment = Cost of major equipment + Cost of minor equipment
= 429,975.00+ 3560.00
= GHȻ 433,535.00
Estimated: Spare parts = 10%
= 1.10 × 433,535.00= GHȻ 476,888.50
Contingency = 2%

73
= 1.02 × 476,888.50= GHȻ 486,426.27
Handling and Transportation = 0.5%
= 1.005 × 486,426.27 = GHȻ 488,858.40
Table 4.6: Cost of Vehicle for transporting milk and cheese
Cost of vehicle Quantity Unit cost (GHȼ) Total cost (GHȼ)
Refrigerated truck 1 138,000.00 138,000.00
TOTAL 138,000.00
*Total purchased equipment cost (PEC) = total cost of equipment + cost of vehicle
PEC = GHȻ 497,312.09+ GHȻ 138,000
= GHȻ 635,312.09
Total purchased equipment cost (PEC) = total cost of equipment + cost of vehicle
PEC = GHȻ 488,858.40+ GHȻ 138,000
= GHȻ 626,858.40
4.5.1.2 Estimation of Fixed Capital Investment (CF)
Costs associated with Fixed Capital investment include expenditures for raw materials, direct
operating labor; supervisory; plant maintenance and repairs; operating supplies; power; utilities
etc. (Peters & Timmerhaus, 1991).
Table 4.7: Fixed Capital Investment
Item Cost factor
of PEC Estimated cost (GHȼ) *Estimated cost (GHȼ)
Purchased equipment
cost (PEC) 1.00 626,858.4 635,312.09
Equipment
installation 0.30 188,057.52 190,593.6

74
piping 0.15 94,028.76 95,296.81
Electrical installation 0.10 62,685.84 63,531.21
Building/ auxiliary 0.20 125,371.68 127,062.4
Service and land
improvement 0.40 250,743.36 254,124.8
Instrumentation
control 0.20 125371.68 127062.4
Engineering and
supervision 0.05 31342.92 31765.6
Construction expense
and contractor 0.12 75223.008 76237.45
Contingency 0.01 6268.584 6353.121
CF TOTAL 1,585,951.75 1,607,339.59
Calculations are based on the PEC
4.5.1.2.1 Working Capital
According to Peters and Timmerhaus (1991), Working Capital (CW) is 15% of the Total
Capital investment (CT).
CT = CF + CW
CW = 0.15 CT
CT = CF + 0.15CT
CF = CT – 0.15CT
CF = 0.85 CT
4.5.1.2.2 Total Capital Investment
*CT = CF
0.85 =
1,607,339.59
0.85
*CT = 1890987.75
*CW = 0.15CT
= 0.15 × 1890987.75
= GHȻ 283648.163

75
CT = 𝐶𝐹
0.85 =
1,585,951.75
0.85
CT = GHȻ1865825.59
CW = 0.15CT
= 0.15 × 1865825.59
= GHȻ 279873.839
Table 4.8: Summary of Results
SAMPLES Total Capital
Investment (CT)
(GHȻ)
Working Capital
(CW)
(GHȻ)
Fixed Capital
Investment (CF)
(GHȻ)
Sodom apple and Sodom
apple +acid
1890987.75 283648.163 1,607,339.59
Rennet only, Acid only
and Rennet + Acid
1865825.59 279873.839 1,585,951.75
4.5.2 Estimation of Total Production Cost
Total production is expressed as:
Total production cost (TPC) = manufacturing cost (CM) + general expenses
Manufacturing cost (CM) = Direct production cost + fixed charges + plant overhead cost
4.5.2.1 Direct Production Cost
Costs associated with this section include expenditures for raw materials direct operating labor;
supervisory; plant maintenance and repairs; operating supplies; power; utilities etc. (Peters and
Timmerhaus, 1991).
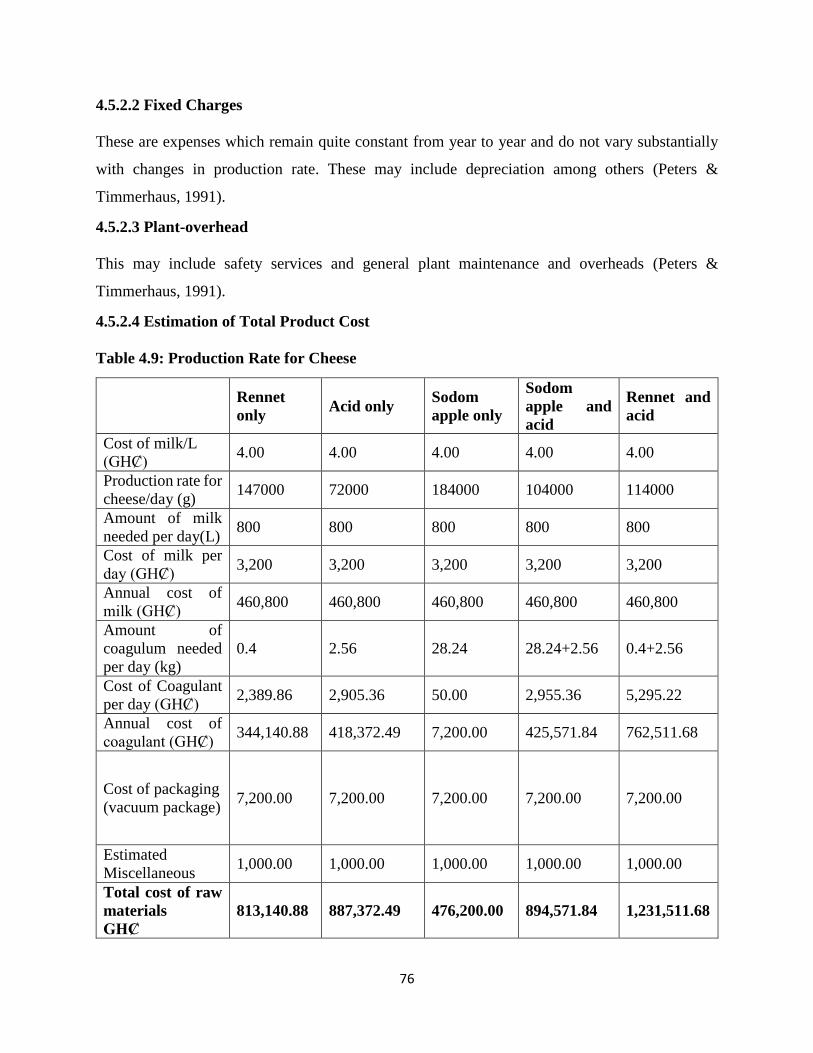
76
4.5.2.2 Fixed Charges
These are expenses which remain quite constant from year to year and do not vary substantially
with changes in production rate. These may include depreciation among others (Peters &
Timmerhaus, 1991).
4.5.2.3 Plant-overhead
This may include safety services and general plant maintenance and overheads (Peters &
Timmerhaus, 1991).
4.5.2.4 Estimation of Total Product Cost
Table 4.9: Production Rate for Cheese
Rennet
only Acid only
Sodom
apple only
Sodom
apple and
acid
Rennet and
acid
Cost of milk/L
(GHȻ) 4.00 4.00 4.00 4.00 4.00
Production rate for
cheese/day (g) 147000 72000 184000 104000 114000
Amount of milk
needed per day(L) 800 800 800 800 800
Cost of milk per
day (GHȻ) 3,200 3,200 3,200 3,200 3,200
Annual cost of
milk (GHȻ) 460,800 460,800 460,800 460,800 460,800
Amount of
coagulum needed
per day (kg)
0.4 2.56 28.24 28.24+2.56 0.4+2.56
Cost of Coagulant
per day (GHȻ) 2,389.86 2,905.36 50.00 2,955.36 5,295.22
Annual cost of
coagulant (GHȻ) 344,140.88 418,372.49 7,200.00 425,571.84 762,511.68
Cost of packaging
(vacuum package) 7,200.00 7,200.00 7,200.00 7,200.00 7,200.00
Estimated
Miscellaneous 1,000.00 1,000.00 1,000.00 1,000.00 1,000.00
Total cost of raw
materials
GHȻ
813,140.88 887,372.49 476,200.00 894,571.84 1,231,511.68

77
Amount of coagulum needed per day (kg) was estimated from the quantity used in coagulating
100ml of milk.
4.5.2.5 Depreciation Cost (d)
This is the assumed decrease in value of a material that can occur throughout its lifespan.
Several methods are available for determining the depreciation cost. The straight-line method was
used for this project
𝑑 = 𝑉−𝑉𝑠
𝑛
Where:
d = annual depreciation (GH₵/yr)
V = the Initial Fixed Capital Investment
VS = Salvage value = 10% CF
N = Service life or useful life of plant (yrs) = 20yrs
For rennet only
𝑑 = 1,585,951.75 − 158,595.18
20= 𝐺𝐻Ȼ 64,606.6053/𝑦𝑟
Table 4.10: Depreciation (d)
Depreciation Rennet only Acid only
Sodom apple
only
Sodom apple
and acid
Rennet and
acid
CF 1,585,951.75 1,585,951.75 1,607,339.59 1,607,339.59 1,585,951.75
Vs 158,595.18 158,595.18 160,734.96 160,734.96 1,585,95.18
V 1,585,951.75 1,585,951.75 1,607,339.59 1,607,339.59 1,585,951.75
n 20 20 20 20 20
d (GH₵/yr)
71,367.83
71,367.83
72,330.28
72,330.28
71,367.83

78
4.5.2.6 Total Operating Labour
This involves the wages for all the workers employed in the factory.
Table 4.11: Total Operating Labour
Personnel Number
Monthly salary
(GHȼ)
Total annual salary
(GHȼ)
Managing director 1 2,000.00 288,000.00
Product manager 1 1,500.00 216,000.00
Quality assurance
manager
1 1,500.00 216,000.00
Accountant 1 1,000.00 144,000.00
Casual workers 4 500.00 288,000.00
Driver 1 400.00 57,600.00
Canteen attendants 2 350.00 100,800.00
Nurse 1 500.00 72,000.00
Security 2 300.00 86,400.00
Cleaners 2 300.00 86,400.00
Receptionist 1 500.00 72,000.00
TOTAL 1,627,200.00
Social security 18.5% 301,032.00

79
TOTAL
OPERATING
LABOUR COST
(GHȻ)
1627200+301032 1,928,232.00
4.5.2.7 Total Production Cost
Table 4.12: Total Production Cost
Direct production cost
FACTOR
TOTAL COST (GHȻ)
Rennet only Acid only Sodom
apple
Sodom
apple
+Acid
Rennet
+acid
Raw material 10%TPC 0.1TPC 0.1TPC 0.1TPC 0.1TPC 0.1TPC
Utilities 15% TPC 0.15 TPC 0.15 TPC 0.15 TPC 0.15 TPC 0.15 TPC
Maintenance
5%
equipment
cost
31342.92
31342.92
31765.60
31765.60
31342.92
Supervision
15%
operating
labour
289,234.80 289,234.80 289,234.80 289,234.80 289,234.80
Operating
labour 15% TPC 0.15 TPC 0.15 TPC 0.15 TPC 0.15 TPC 0.15 TPC
Total 320,577.72
+0.4TPC
320,577.72
+0.4 TPC
321,000.40
+0.4 TPC
321,000.40
+0.4 TPC
320,577.72
+0.4 TPC
FIXED CHARGES
Plant
overheads 10%TPC 0.10TPC 0.10TPC 0.10TPC 0.10TPC 0.10TPC
Depreciation 71,367.83
71,367.83
72,330.28
72,330.28
71,367.83

80
Insurance 1%CF 15,859.52
15,859.52
16,073.4
16,073.4
15,859.52
Rates 5%CF 79,297.59
79,297.59
80,366.98
80,366.98
79,297.59
Total 166,524.93
+0.1TPC
166,524.93
+0.1TPC
168,770.66
+0.1TPC
168,770.66
+0.1TPC
166,524.93
+0.1TPC
GENERAL EXPENSES
Sales
expenses 2%TPC 0.02TPC 0.02TPC 0.02TPC 0.02TPC 0.02TPC
Research and
development 2%TPC 0.02TPC 0.02TPC 0.02TPC 0.02TPC 0.02TPC
General
overhead 2%TPC 0.02TPC 0.02TPC 0.02TPC 0.02TPC 0.02TPC
Total 0.06TPC 0.06TPC 0.06TPC 0.06TPC 0.06TPC
TPC for rennet only
= Direct production cost + Fixed Charges + General Expenses
= 320,577.72+0.4TPC+ 166,524.93+0.1TPC + 0.06TPC
TPC = 487,102.65+0.56TPC
TPC (1- 0.56) = 487,102.65
0.44 TPC = 487,102.65
TPC = 487,102.65
0.44
= 𝐺𝐻Ȼ 1,107,051.49
Table 4.13: Summary of Total Production Cost
TOTAL PRODUCTION COST (TPC) (GHȻ)
Rennet only Acid only Sodom apple Sodom apple
+Acid Rennet +acid

81
Direct production
cost
320,577.72
+0.4TPC
320,577.72
+0.4 TPC
321,000.40
+0.4 TPC
321,000.40
+0.4 TPC
320,577.72
+0.4 TPC
Fixed Charges 166,524.93
+0.1TPC
166,524.93
+0.1TPC
168,770.66
+0.1TPC
168,770.66
+0.1TPC
166,524.93
+0.1TPC
General Expenses 0.06TPC 0.06TPC 0.06TPC 0.06TPC 0.06TPC
Total production
cost
487,102.65
+0.56TPC
487,102.65
+0.561TPC
489,771.06
+0.56TPC
489,771.06
+0.56TPC
487,102.65
+0.56TPC
TOTAL(GHȻ) 1107051.49 1107051.49 1113116.05 1113116.05 1107051.49
4.5.2.8 Manufacturing Cost (CM )
For rennet only
General expenses = 0.06 TPC
= 0.06 x 1107051.49
` = GHȻ 66423.09
TPC = Manufacturing Cost (CM) + General Expenses
CM = TPC – general expenses
= 1107051.49– 66423.09
= GHȻ 1173474.57
Table 4.14: Manufacturing Cost (CM)
Rennet only Acid only Sodom apple Sodom apple
+Acid Rennet +acid
Total production
cost (TPC) 1,107,051.49 1,107,051.49 1,113,116.05 1,113,116.05 1,107,051.49
General expenses 66,423.09 66,423.09 66,786.96 66,786.96 66.423.09

82
(CM) (GHȻ) 1,040,628.40 1,040,628.40 1,046,329.09 1,046,329.09 1,040,628.40
4.5.3 Profitability Analysis
This is to find out if there would be some profit realized from running the project. Profitability
evaluation can be categorized under the following headings:
Rate of return on investment
Discounted cash flow based on full-life performance
Net present worth
Capitalized costs
(Peters and Timmerhaus, 1991
Table 4.15: Summary
SUMMARY
Rennet only Acid only Sodom apple Sodom apple
+Acid Rennet +acid
Cost of
cheese/100g
(GHȻ)
8.00 16.00 6.00 12.00 10.00
Total production/
day of cheese (g) 147000 72000 184000 104000 114000
Total Capital
Investment (CT)
(GHȻ)
1865825.59 1865825.59 1890987.75 1890987.75 1865825.59
Manufacturing
cost (CM) (GHȻ) 1040628.40 1040628.40 1046329.09 1046329.09 1040628.40

83
d (GH₵/yr) 71,367.83 71,367.83 72,330.28 72,330.28 71,367.83
4.5.3.1 Sales(S)
S = 𝑡𝑜𝑡𝑎𝑙 𝑎𝑚𝑜𝑢𝑛𝑡 𝑜𝑓 𝑐ℎ𝑒𝑒𝑠𝑒 (𝑔)
100𝑔𝑥 𝑛𝑢𝑚𝑏𝑒𝑟 𝑜𝑓 𝑤𝑜𝑟𝑘𝑖𝑛𝑔 𝑑𝑎𝑦𝑠 𝑥 𝑎𝑚𝑜𝑢𝑛𝑡 /100𝑔
For rennet only:
Annual sales = 147000𝑔/100𝑔 × 144𝑑𝑎𝑦𝑠 × 10𝐺𝐻Ȼ
= GHȻ1693440/year
4.5.3.2 Profit
This is the gross profit or profit before tax
For rennet only
Profit = S-CM
S-CM = 1693440– 1040628.4
= 652811.6GHȻ/year
4.5.3.3 Net Profit After Tax (P)
This is the profit obtained after the tax has been deducted
P = (S-CM-d)(1-t)
Tax (t) = 0.20 (20%)
Net profit for rennet only = (1693440– 1040628.4-71367.8288)(1-0.20)
= GHȻ 595717.337/year

84
Table 4.16: Sales, Profit and Net Profit
Rennet only Acid only Sodom apple Sodom apple
+Acid Rennet +acid
Cost of
cheese/100g
(GHȻ)
8.00 16.00 6.00 12.00 10.00
Total production/
day of cheese (g) 147000 72000 184000 104000 114000
Total production/
day of cheese/
(100g)
1470 720 1840 1040 1140
Total annual
sales (S) (GHȻ) 1,693,440 1,658,880 1,589,760 1,497,600 1,641,600
Gross profit
S-CM 652,811.60 618,251.60 543,430.91 451,270.91 600,971.60
Net profit after
tax (P) 595,717.34 561,157.34 485,566.68 393,406.69 543,877.34
4.5.3.4 Annual Cashflow (ACF)
This is the amount of money that would be available yearly
For rennet only
ACF = P- d
= 595717.34– 71367.83
= GHȻ 524,349.51
4.5.3.5 Cumulative Cash Flow (CCF)
This helps to determine the long-term strength of a company
For rennet only
CCF = −CT + (n x ACF)
CCF = −1865825.59 + (20 x 524349.51)

85
CCF = GHȻ 8,621,164.58
4.5.3.6 Payback Period (PBP)
This is the period or time required for a project to recover the money invested in it. It is usually
expressed in years.
For rennet only
PBP =CT
P
PBP =1865825.59
595717.34
PBP = 3.1 years
Therefore, the Payback Period is approximately 36 months.
4.5.3.7 Return on Investment (ROI)
This deals with the money you invest in the company and the return you realize on that money
based on the net profit of the business.
This is expressed on annual percent basis:
𝑅𝑒𝑡𝑢𝑟𝑛 𝑜𝑛 𝑖𝑛𝑣𝑒𝑠𝑡𝑚𝑒𝑛𝑡 = 𝑦𝑒𝑎𝑟𝑙𝑦 𝑝𝑟𝑜𝑓𝑖𝑡
𝑇𝑜𝑡𝑎𝑙 𝑖𝑛𝑖𝑡𝑖𝑎𝑙 𝑖𝑛𝑣𝑒𝑠𝑡𝑚𝑒𝑛𝑡 𝐶𝑇× 100
For rennet only
𝑅𝑒𝑡𝑢𝑟𝑛 𝑜𝑛 𝑖𝑛𝑣𝑒𝑠𝑡𝑚𝑒𝑛𝑡 = 595717.34
1865825.59× 100
= 31.93%
4.5.3.8 Net Present Value (NPV)
A positive NPV generally means the investment will be profitable and a negative NPV will result
in a net loss.
Capital Recovery Factor, e =i(1+i)n)
(1+i)n−1
Where i is interest rate

86
= 0.17(1 + 0.17)20)
(1 + 0.17)20 − 1
= 0.178
NPV = −𝐶𝑇 +𝑃
𝑒
For rennet only
NPV = [−1865825.59 +595717.34
0.178]
NPV = GHȻ 3,346,726.61
4.5.3.9 Profitability Index (PI)
It is a ratio that shows how much profit results from a project. If a project has a profitability index
greater than 1, it should be accepted; if lower than 1, it should be rejected.
PI = NPV
CT
For rennet only
=1,480,901.02
1865825.59
PI = 1.79

87
Table 4.17: Summary of Profitability Analysis
It is therefore viable to run a cheese factory or plant in Ghana, using the different coagulants. The
estimated cost of the cheese samples varies. They are as follows.
Rennet only - GHȻ 8.00
Acid only - GHȻ 16.00
Sodom apple only (wagashie) - GHȻ 6.00
Sodom apple +acid - GHȻ 12.00
Rennet +acid - GHȻ10.00
Rennet only Acid only Sodom apple Sodom apple
+Acid Rennet +acid
Annual cashflow
(ACF)
(GHȻ)
524,349.51 489,789.51 413,236.40 321,076.40 472,509.51
Cumulative
Cash Flow
(CCF) (GHȻ)
8,621,164.58 7,929,964.58 6,373,740.30 4,530,540.31 7,584,364.58
Payback Period
in years (PBP) 3.1 3.3 3.9 4.8 3.4
Return on
Investment
(ROI)%
31.93 30.08 25.68 20.80 29.15
Net Present
Value (NPV)
(GHȻ)
1,480,901.02 1,286,743.72 836,914.97 319,162.164 1,189,665.067
Profitability
Index (PI) 1.79 1.69 1.44 1.17 1.64

88
Based on the survey done in some shops in Accra, and on the informal market, price of 100g of
cheese ranged from GHȻ 14.00 to GHȻ17.00 but some of the cheeses cost as low as GHȻ 6. For
wagashie, on the informal market, 100g was sold averagely for GHȻ3.00.
In terms of sales, cheese processed from acid only was the most expensive with rennet only being
the least expensive. Sodom apple only may not be lucrative if sold on the informal market because
the price has doubled but can be sold on the formal market where the middle-income earners and
high-income earners consumers can have access to it.

89
CHAPTER FIVE
5.0 CONCLUSION AND RECOMMENDATION
5.1 Conclusions
There was a significant difference amongst the three milk samples for all the physicochemical
properties except for protein and fat content. Milk from the Jersey and the White Fulani were
similar for, ash and pH, and milk from the White Fulani showed highest calcium content.
Coagulum obtained showed that there was an interaction between the breeds and the coagulants
used in coagulation. Sodom apple gave the highest yield and the addition of Acid first to the milk
shortened the time for coagulation. Coagulum from the Jersey gave the highest yield and
coagulation time was the shortest with White Fulani.
Physicochemical properties of coagulum obtained showed that there was an interaction between
the breeds and the coagulants used in coagulation. Acid influences the moisture content, fat content
and pH of coagulum when combined with an enzyme. Coagulum processed from Jersey produces
coagulum with high fat content.
Dewatered coagulum samples showed significant difference for the coagulants used in processing
them. Rennet + acid and acid only can be used for cheeses that need to be melted. Hard cheeses
could be obtained from Rennet + acid and Sodom apple coagulum retained more of the milk
properties in terms of their sensory properties. The combination of Sodom apple with acid does
not allow the full potential of the Sodom apple to hydrolyse κ caseins.
It is economically viable to establish a cheese factory in Ghana using Sodom apple, acid or rennet
as coagulant.
90
5.2 Recommendations
It would be very helpful if the enzymes in Sodom apple can be extracted and purified. This
would reduce the time needed for processing. It takes about an hour for the coagulation
process and extra time would be needed to crush and obtain the crude extract for
coagulation.
Even though Sodom apple grows easily, it would be beneficial if farmers start cultivating
it to make it more available.
Instead of processing the cheese with fresh coagulants all the time, whey can be kept and
used as starter culture to reduce cost.
Sensory acceptance test can be done to determine which cheese would be liked most by
consumers.
If the coagulants can be out sourced locally instead of importing, the rate of production can
be minimized to an extent.

91
REFERENCES
Aboagye, Gertrude S. (2002). “Phenotypic and Genetic Parameters in Cattle Populations in
Ghana.” AGTR Case Study. Nairobi, Kenya: ILRI. https://hdl.handle.net/10568/3582
Abeykoon, C. D., Rathnayake, R. M. C., Johansson, M., Silva, G. L. L. P., Ranadheera, C. S.,
Lundh, Å., & Vidanarachchi, J. K. (2016). Milk Coagulation Properties and Milk Protein
Genetic Variants of Three Cattle Breeds/Types in Sri Lanka. Procedia Food Science,
6(Icsusl 2015), 348–351. https://doi.org/10.1016/j.profoo.2016.02.070
Aday, M. S., Caner, C., & Yuceer, Y. K. (2010). Instrumental and Sensory Measurements of Ezine
Cheese Texture, Akademik Gıda 8(3), 6–10.
Adesina, K. (2012). Effect of Breed on the Composition of Cow Milk under Traditional
Management Practices in Ado-Ekiti, Nigeria. J. Appl. Sci. Environ. Manage., Vol. 16((1)),
55–59.
Adzitey, Frederick. (2011). “Animal and Meat Production in Ghana-An Overview. Journal of
World’s poultry Research 3(1): 1–4.
Aidoo, R., Nurah, G. K., Fialor, S. C., & Ohene, Y. (2009). Determinants of dairy consumption
expenditure. Journal of Science and Technology, 29(1), 87–96.
https://doi.org/10.4314/just.v29i1.46444
Akinloye, M., & Adewumi, O. O. (2014). Effects of local coagulants on the yield of cheese using
cow and sheep milk. International Journal of Development and Sustainability, 3(1), 150–
161. Retrieved from http://isdsnet.com/ijds-v3n1-9.pdf

92
Animal genetic training resource and International livestock research institute. Swedish university
of Agricultural sciences. http://agtr.ilri.org retrieved on 25/08/2017 at 3:43pm.
Beef to live. Cattle Breeds: List Of Bos Indicus (Zebus) Cattle, FarmCentric (2019).
https://beef2live.com/story-cattle-breeds-list-bos-indicus-zebus-cattle-89-104668.
Retrieved on 6/7/2019 at 12:30pm
Ben Amira, A., Besbes, S., Attia, H., & Blecker, C. (2017). Milk-clotting properties of plant
rennets and their enzymatic, rheological, and sensory role in cheese making: A review.
International Journal of Food Properties, 2912(October), 1–18.
https://doi.org/10.1080/10942912.2017.1289959
Buckley, B. (2017). The difference between hard and soft cheese. Nutrition Carnival. Retrieved
from nutritionalcarnival.com on 7/27/2018 at 4:53am
Budreckiene, R., & Struzeckiene, A. (2014). Short Communication Optimization of
Manufacturing, 311–314.
Cais-Sokolińska, D., & Pikul, J. (2009). Cheese meltability as assessed by the Tube Test and
Schreiber Test depending on fat contents and storage time, based on curd-ripened fried
cheese. Czech Journal of Food Sciences, 27(5), 301–308.
Çakmakçi, S., & Boroǧlu, E. (2004). Some quality characteristics of commercial liquid rennet
samples. Turkish Journal of Veterinary and Animal Sciences, 28(3), 501–505.
Caroli, A. M., Chessa, S., & Erhardt, G. J. (2009). Invited review: Milk protein polymorphisms in

93
cattle: Effect on animal breeding and human nutrition. Journal of Dairy Science, 92,
5335e5352.
Chikpah, S K, and M Teye. (2014) “Effects of different concentrations of fresh and dried calotropis
procera (sodom apple) extract on cow milk coagulating time, cheese yield and organoleptic
properties of West African soft cheese (wagashie ).” 10(27): 317–26.
CODEX. (1973). Standard for Brie, (277), 1–4.
Chitchyan, Z. T., & Grigoryan, A. A. (2016). Yield and quality of brine-ripened cheeses,
production from the milk of jersey and simmental cows. Annals of Agrarian Sciences.
https://doi.org/10.1016/j.aasci.2016.05.003
Coltrain, D., Barton, D. G., & Boland, M. (2000). Value Added: Opportunities and Strategies.
Department of Agricultural Economics, Kansas State University Department of
Agricultural Economics, (June 2014).
Contreras, G. A., & Rodríguez, J. M. (2011). Mastitis: comparative etiology and epidemiology.
Journal of Mammary Gland Biology and Neoplasia, 16(4), 339–356.
https://doi.org/10.1007/s10911-011-9234-0
Country Fact Sheet on food and agriculture policy trends – Ghana. www.fao.org Retrieved on
9/5/2017 at 5:20am
DAGRIS 2005 Retrieved from http://dagris.ilri.cgiar,org on 27/08/2017 at 4:43pm
Dairy Processing Hand Book (n.d). Retrieved from dairy processing handbook.com. Retrieved
on 7/27/2018
De Marchi, M., Bittante, G., Dal Zotto, R., Dalvit, C., & Cassandro, M. (2008). Effect of
Holstein Friesian and Brown Swiss Breeds on Quality of Milk and Cheese. Journal of Dairy

94
Science, 91(10), 4092–4102. https://doi.org/10.3168/jds.2007-0788
De Noni, I. and Cattaneo, S. (2010). Occurrence of b-casomorphins 5 and 7 in commercial dairy
products and in their digests following in vitro simulatedgastro-intestinal digestion. Food
Chem 119:560–6.
Domingos, A., Cardos,P.C., Xue, Z.T., Clemente, A., Brodelius, P.E. & Pais, M.S. (2000).
Purification, cloning and autoproteolytic processing of an aspartic proteinase from
Centaurea calcitrapa. Eur J Biochem 267:6824–6831
EcoPort (2007). FAO http://ecocrop.fao.org/ecocrop/srv/en/cropView?id=4079. Retrieved on
2/11/2017 at 7:50am.
El-Gawad, M. A. & Ahmed, N. S. (2011). Cheese Yield as Affected by Some Parameters Review
Acta Sci.Pol., Technol. Aliment, 10(2), 131–153.
FAO (1987). The trypanotolerant cattle populations (1983-1985). Trypanotolemi cattle and
livestock development in West and Central Africa (Vol. 1). FAO. Rome
FAO. (2004).Livestock development in Ghana- Policies and strategies.
FAO. (2013). Milk and dairy products in human nutrition. Milk and Dairy Products in Human
nutrition. https://doi.org/10.1186/1471-2458-11-95
FAPDA country fact sheet on food and agriculture policy trends/ Ghana
Felius, M., Koolmees, P. and Theunissen, B. (2011). On the Breeds of Cattle—Historic and
Current Classifications. Diversity 3, 660-692; doi:10.3390/d3040660

95
Foegeding, E. A., & Drake, M. A. (2007). Invited Review: Sensory and Mechanical Properties of
Cheese Texture. Journal of Dairy Science, 90(4), 1611–1624.
https://doi.org/10.3168/jds.2006-703
Freitas, C. D. T., Leite, H. B., Oliveira, J. P. B., Amaral, J. L., Egito, A. S., Vairo-cavalli, S., …
Ramos, M. V. (2016). Insights into milk-clotting activity of latex peptidases from
Calotropis procera and Cryptostegia grandi fl ora. FRIN, 87, 50–59.
https://doi.org/10.1016/j.foodres.2016.06.020
Gateway to dairy production and products (2019). Food and Agriculture Organization of the
United States. Retrieved from http://www.fao.org/dairy-production-
products/products/milk-composition/en/. on 6/7/2019 at 12:55pm
Gate Way to Dairy Production and products (2018). Food and Agriculture Organization of the
United States. Retrieved from http://www.fao.org/dairy-production-products/products/en/
on 7/25/2018 at 3:16 pm
Gaucheron, F. (2011). Milk and dairy products: a unique micronutrient combination. Journal of
the American College of Nutrition, 30(sup5), Pages 400S-409S.
Gellrich, K., Meyer, H. H. D., & Wiedemann, S. (2014). Composition of major proteins in cow
milk differing in mean protein concentration during the first 155 days of lactation and the
influence of season as well as short-term restricted feeding in early and mid-lactation.
Czech Journal of Animal Science, 59(3), 97-106.

96
Gutiérrez-Méndez, N., Trancoso-Reyes, N. and Y. L.-R. (2013). Texture profile analysis of Fresh
cheese and Chihuahua cheese using miniature cheese models, Technocienca, VII(2), 65–
74.
Heinrichs, J., Jones, C., & Bailey, K. (2016). Milk Components: Understanding the Causes and
Importance of Milk Fat and Protein Variation in Your Dairy Herd Topics include: Average
components by breed Components in the Mideast federal order Factors affecting
component levels Nutritional strategies to . 1–8. Retrieved from www.das.psu.edu/
International Dairy foods Association (2018). Types of cheeses. Retrieved from
http://www.idfa.org/news-views/media-kits/cheese/types-of-cheeses- on 4/25/2018 at
6:33pm
Ismail, M. M., & Hamad, M. N. F. (2015). Manufacture of Mozzarella Cheese using Glucono-
Delta-Lactone Manufacture of Mozzarella cheese using Glucono-Delta-Lactone,
(February).
Jacob, M., Jaros, D., & Rohm, H. (2011). Recent advances in milk clotting enzymes. International
Journal of Dairy Technology, 64(1), 14–33. https://doi.org/10.1111/j.1471-
0307.2010.00633.x
Johnson, M. E., Chen, C. M., & Jaeggi, J. J. (2010). Effect of Rennet Coagulation Time on
Composition, Yield, and Quality of Reduced-Fat Cheddar Cheese. Journal of Dairy
Science, 84(5), 1027–1033. https://doi.org/10.3168/jds.s0022-0302(01)74562-6
Koca N., Metin M. (2004): Textural, melting and sensory properties of low-fat fresh kashar
cheeses produced by using fat replacers. International Dairy Journal, 14: 365–373.

97
Leclercq-Perlat, M.N., Picque, D. & Corrieu, G. (2013). 21. Camembert cheese: processing and
ripening. (V. B. Preedy, V.R Watson, R.R. and Patel, Ed.) (Handbook 6). Handbook of
cheese in health: production, nutrition and medical sciences Human Health.
https://doi.org/10.3920/978-90-8686-766-0
Lindmark Månsson, H. (2008). Fatty acids in bovine milk fat. Food & Nutrition Research, 52(1),
1821. https://doi.org/10.3402/fnr.v52i0.1821
Linn, G.J (1998). Factors affecting the composition of milk from dairy cows. In Designing foods:
Animal Product Options in the Marketplace. National Research Council (US) Committee
on Technological Options to improve the nutritional Attibute of animal products.
Washington DC, National Academies
press.https://www.ncbi.nlm.nih.gov/books/NBK218193/
Lucey, J. A. (2002). Formation and Physical Properties of Milk Protein Gels, 281–294.
https://doi.org/10.3168/jds.S0022-0302(02)74078-2
Lucey, J. A., Johnson, M. E., & Horne, D. S. (2003). Invited Review : Perspectives on the Basis
of the Rheology and Texture Properties of Cheese. Journal of Dairy Science, 86(9), 2725–
2743. https://doi.org/10.3168/jds.S0022-0302(03)73869-7
McSweeney, P. L. H. (2004). Biochemistry of cheese ripening. International Journal of dairy
technology57(2), 127–144.
MOFA (2016). Ghana livestock development policy and strategy. Pg 8
Morison, K. R. (1997). Cheese Manufacture as a Separation and Reaction Process. Journal of Food

98
Engineering, 32(2), 179–198. https://doi.org/10.1016/S0260-8774(97)00022-8
Murtaza, M. A., Ur-Rehman, S., Anjum, F. M., Huma, N., & Hafiz, I. (2014). Cheddar Cheese
Ripening and Flavor Characterization: A Review. Critical Reviews in Food Science and
Nutrition, 54(10), 1309–1321. https://doi.org/10.1080/10408398.2011.634531
Ong, L., Dagastine, R. R., Auty, M. A. E., Kentish, S. E., & Gras, S. L. (2011). Coagulation
temperature affects the microstructure and composition of full fat Cheddar cheese. Dairy
Science and Technology, 91(6), 739–758. https://doi.org/10.1007/s13594-011-0033-6
Ontario Dairy facts and Figures (n.d) retrieved from www.milk.org at 30/08/2017 at 2:50pm.
Orhevba B.A, & Taiwo A.D. (2016). Research & Reviews : Journal of Food and Dairy Technology
Comparative Assessment of Wara ( Local Cheese ) Produced using Three Natural
Additives as Coagulants, 4(3), 1–7.
Orwa, C., Mutua, A., Kindt, R., Jamnadass, R & Anthony, S. (2011).Agroforestree database: A
tree reference and selection guide version 4.0. World Agroforestry Centre, Kenya
Ecocrop, Ecocrop database. FAO; http://www.feedipedia.org/node/7923. Retrieved on
9/11/2017 at 5:57am
Paulson, J., Endres, M., & Reneau, J. (2015). Learning About Dairy, (November).
Pereira, P. C. (2014). Milk nutritional composition and its role in human health. Nutrition, 30(6),
619-627.
Peters, M. S., & Timmerhaus, K. D. (1991). Plant Design and Economics for Chemical Engineers.

99
Pezeshki, A., Hesari, J., Ahmadi Zonoz, A., & Ghambarzadeh, B. (2011). Influence of Withania
coagulans protease as a Vegetable rennet on Proteolysis of Iranian UF White Cheese.
Journal of Agricultural Science and Technology, 13(4), 567–576.
Phadungath, C. (2005a). Casein micelle structure : a concise review. Journal of Science and
Technology, 27(May 2004), 201–212.
Phadungath, C. (2005b). The mechanism and properties of acid-coagulated milk gels.
Songklanakarin J. Sci. Technol., 27(2), 433–448.
Poduval V.S. & Mistry V.V. (1999): Manufacture of reduced fat Mozzarella cheese using
ultrafiltered sweet buttermilk and homogenized cream. Journal of Dairy Science, 82: 1–9.
Portar, V. (1991). Cattle-A handbook to the breeds of the world. Christopher Helm publishers.
Raheem, D., Suri, N., & Saris, P. E. (2007). The characterization and application of Calotropis
procera, a coagulant in Nigerian Wara cheese. International Journal of Food Science and
Technology, 42(2), 220–223. https://doi.org/10.1111/j.1365-2621.2006.01244.x
Rayanatou, I. A., Mahamadou, E. H. G., Garric, G., Harel-Oger, M., Leduc, A., Jardin, J.&
Gaucheron, F. (2017). Physico-chemical characterization of dairy gel obtained by a
proteolytic extract from Calotropis procera – A comparison with chymosin. Food
Chemistry, 232, 405–412. https://doi.org/10.1016/j.foodchem.2017.04.039
Rege J., Aboagye, S. and Tawah, C. (1994). Shorthorn cattle of West Africa and Central Africa II.

100
Ecological settings, utility, management and production systems. FAO World Animal Review
78:14-21
Ricardo, Bruno et al. 2017. “Food Hydrocolloids Comparative Study among Rheological , near-
Infrared Light Backscattering and Confocal Microscopy Methodologies in Enzymatic Milk
Coagulation : Impact of Different Enzyme and Protein Concentrations.” Food
hydrocolloids 62: 73–82. http://dx.doi.org/10.1016/j.foodhyd.2016.07.035.
Rollema, H. S. (1992). Proteins: Casein association and micelle formation, In Advanced Dairy
Chemistry. (P. Fox, Ed.) (Vol 1). Essex: Elsevier Science Publisher, Ltd.
Santos, B. N. C., Silva, C. C. C. V., Domingues, J. R., Cortez, M. A. S., Freitas, D. D. G. C.,
Chiappini, C. C. J., & Araújo, K. G. L. (2013). Effect of calcium addition and pH on yield
and texture of Minas cured cheese. Arquivo Brasileiro de Medicina Veterinaria E
Zootecnia, 65(2), 601–609. https://doi.org/10.1590/S0102-09352013000200042
Saunders, S. R., D. D. Hamann, and D. R. Lineback. 1992. A systems approach to food material
adhesion. Lebensm. Wiss. Technol. 25:309–315.
Schwendel, B. H., Wester, T. J., Morel, P. C. H., Tavendale, M. H., Deadman, C., Shadbolt, N.
M., & Otter, D. E. (2014). Invited review: Organic and conventionally produced milk—An
evaluation of factors influencing milk composition. Journal of Dairy Science, 98(2), 721–
746. https://doi.org/10.3168/jds.2014-8389
Shah, M. A., Mir, S. A., & Paray, M. A. (2014). Plant proteases as milk-clotting enzymes in
cheesemaking: A review. Dairy Science and Technology, 94(1), 5–16.
https://doi.org/10.1007/s13594-013-0144-3

101
Sinaga, H., Bansal, N., & Bhandari, B. (2017). Effects of milk pH alteration on casein micelle
size and gelation properties of milk. International Journal of Food Properties, 20(1), 179–
197. https://doi.org/10.1080/10942912.2016.1152480
Singh, T. K., Drake, M. A., & Cadwallader, K. R. (2003). Flavor of Cheddar Cheese: A Chemical
and Sensory Perspective. Comprehensive Reviews in Food Science and Food Safety, 2(4), 166–
189. https://doi.org/10.1111/j.1541-4337.2003.tb00021.x
Stocco, G., Gasparotto, V., Cecchinato, A., & Bittante, G. (2018). Breed of cow and herd
productivity affect milk nutrient recovery in curd and cheese yield, efficiency and daily
production, 434–444. https://doi.org/10.1017/S1751731117001471
Tawah, C. and Rege, J (1996). White White Fulani cattle of west and Central Africa. Animal
Genetic Resource Information Bulletin. 17:137-158
The Dairy Council, Cheese fact sheet (2017). www.milk.co.uk. Retrieved on 12/12/2017 at
7:40pm
The world dairy situation (2016). Bulletin of the International Dairy Federation 485/2016. ISSN
0250-5118
Tratnik Lj, Bozanic R, Goran Miokovic G, and Subaric, D. (2000). Optimisation of Manufacture
and Quality of Cottage Cheese. Food Technology and Biotechnology, 39(1), 43–48.
Troch, T., Lefébure, É., Baeten, V., & Colinet, F. (2017). Cow milk coagulation : process
description , variation factors and evaluation methodologies . A review.
Ullah, R., Khan, S., Ali, H., Bilal, M., & Saleem, M. (2017). Identification of cow and buffalo

102
milk based on Beta carotene and vitamin-A concentration using fluorescence spectroscopy.
PLoS ONE, 12(5), 1–10. https://doi.org/10.1371/journal.pone.0178055
Tsioulpas, A., Grandison, A. S., & Lewis, M. J. (2007). Changes in Physical Properties of
Bovine Milk from the Colostrum Period to Early Lactation. Journal of Dairy Science,
90(11), 5012–5017. https://doi.org/10.3168/jds.2007-0192
Upadhyay, R. (2014). Ethnomedicinal, pharmaceutical and pesticidal uses of Calotropis procera
(Aiton) (Family: Asclepiadaceae). International Journal of Green Pharmacy, 8(3), 135.
https://doi.org/10.4103/0973-8258.140165
Walstra, P., Geurts, T.J., Noomen, A., Jellema, A., A., & van Boekel, M. A. J. . (1999). Dairy
Technology: Principles of Milk Properties and Processes. New York: Marcel Dekker, Inc.
Walstra, P. (1999). Casein sub-micelles : do they exist ?, 9, 189–192.
Walstra, P., Wouters, J. T. M., & Geurts, T. J. (2006). Dairy Science and Technology. Facilities
(Vol. 4). https://doi.org/9780824727635
Zamberlin, Š., Antunac, N., Havranek, J., & Samaržija, D. (2012). Mineral elements in milk and
dairy products, 62(2), 111–125.
Zheng, Y., Liu, Z., & Mo, B. (2016). Texture Profile Analysis of Sliced Cheese in relation to
Chemical Composition and Storage Temperature, 2016.
Zimecki M, Kruzel ML. (2007). Milk-derived proteins and peptides of potential therapeutic and
nutritive value. J Exp Ther Oncol 6:89–106.

103
APPENDIX- ANOVA TABLES AND TUKEY’S PAIRWISE COMPARISONS
One-way ANOVA: total solid versus BREED
Analysis of Variance
Source DF Adj SS Adj MS F-Value P-Value
BREED 2 49.95 24.977 8.46 0.001
Error 48 141.73 2.953
Total 50 191.68
One-way ANOVA: FAT versus BREED
Analysis of Variance
Source DF Adj SS Adj MS F-Value P-Value
BREED 2 9.597 4.799 2.92 0.064
Error 45 74.004 1.645
Total 47 83.601
One-way ANOVA: pH versus BREED
Analysis of Variance
Source DF Adj SS Adj MS F-Value P-Value
BREED 2 0.08911 0.044555 7.92 0.001
Error 48 0.26999 0.005625
Total 50 0.35910
a letter are significantly different.
One-way ANOVA: PROTEIN versus BREED
Analysis of Variance
Source DF Adj SS Adj MS F-Value P-Value
BREED 2 2.029 1.015 0.42 0.660
Error 48 116.235 2.422
Total 50 118.264
One-way ANOVA: ASH versus BREED
Analysis of Variance
Source DF Adj SS Adj MS F-Value P-Value
BREED 2 0.2069 0.103432 11.89 0.000

104
Error 48 0.4177 0.008703
Total 50 0.6246
One-way ANOVA: CALCUIM versus BREED
Analysis of Variance
Source DF Adj SS Adj MS F-Value P-Value
BREED 2 141638 70819 70.29 0.000
Error 48 48365 1008
Total 50 190002
One-way ANOVA: *L versus BREED
Analysis of Variance
Source DF Adj SS Adj MS F-Value P-Value
BREED 2 32.45 16.2230 22.03 0.000
Error 48 35.35 0.7364
Total 50 67.79
Tukey Pairwise Comparisons
Grouping Information Using the Tukey Method and 95% Confidence
BREED N Mean Grouping
F 18 90.864 A
C 15 89.580 B
J 18 89.004 B
Means that do not share a letter are significantly different.
One-way ANOVA: *a versus BREED
Analysis of Variance
Source DF Adj SS Adj MS F-Value P-Value
BREED 2 12.78 6.3876 10.56 0.000
Error 48 29.04 0.6049
Total 50 41.81
Tukey Pairwise Comparisons
Grouping Information Using the Tukey Method and 95% Confidence
BREED N Mean Grouping
C 15 -2.007 A
F 18 -2.6017 A
J 18 -3.253 B

105
Means that do not share a letter are significantly different.
One-way ANOVA: *b versus BREED
Analysis of Variance
Source DF Adj SS Adj MS F-Value P-Value
BREED 2 366.8 183.409 51.89 0.000
Error 48 169.6 3.534
Total 50 536.5
Tukey Pairwise Comparisons
Grouping Information Using the Tukey Method and 95% Confidence
BREED N Mean Grouping
J 18 14.074 A
C 15 8.683 B
F 18 8.296 B
Means that do not share a letter are significantly different.
General Linear Model: YIELD versus BREED, COAGULANT
Analysis of Variance
Source DF Adj SS Adj MS F-Value P-Value
BREED 2 288.2 144.12 9.42 0.000
COAGULANT 4 5508.8 1377.20 89.98 0.000
BREED*COAGULANT 8 272.1 34.01 2.22 0.027
Error 240 3673.5 15.31
Total 254 9757.8
Tukey Pairwise Comparisons: Response = YIELD, Term = BREED*COAGULANT
Grouping Information Using the Tukey Method and 95% Confidence
BREED*COAGULANT N Mean Grouping
J S 18 25.6827 A
C S 15 23.3097 A B
F S 18 19.8486 B C
J R 18 19.0647 B C D
C R 15 18.1657 C D
F R 18 17.9706 C D
J RA 18 15.4044 C D E
C RA 15 15.1987 C D E
J SA 18 14.7176 D E
C SA 15 12.8596 E F
F RA 18 12.0177 E F
F SA 18 11.4425 E F
F A 18 10.1552 F
J A 18 9.1997 F
C A 15 8.8719 F
Means that do not share a letter are significantly different.
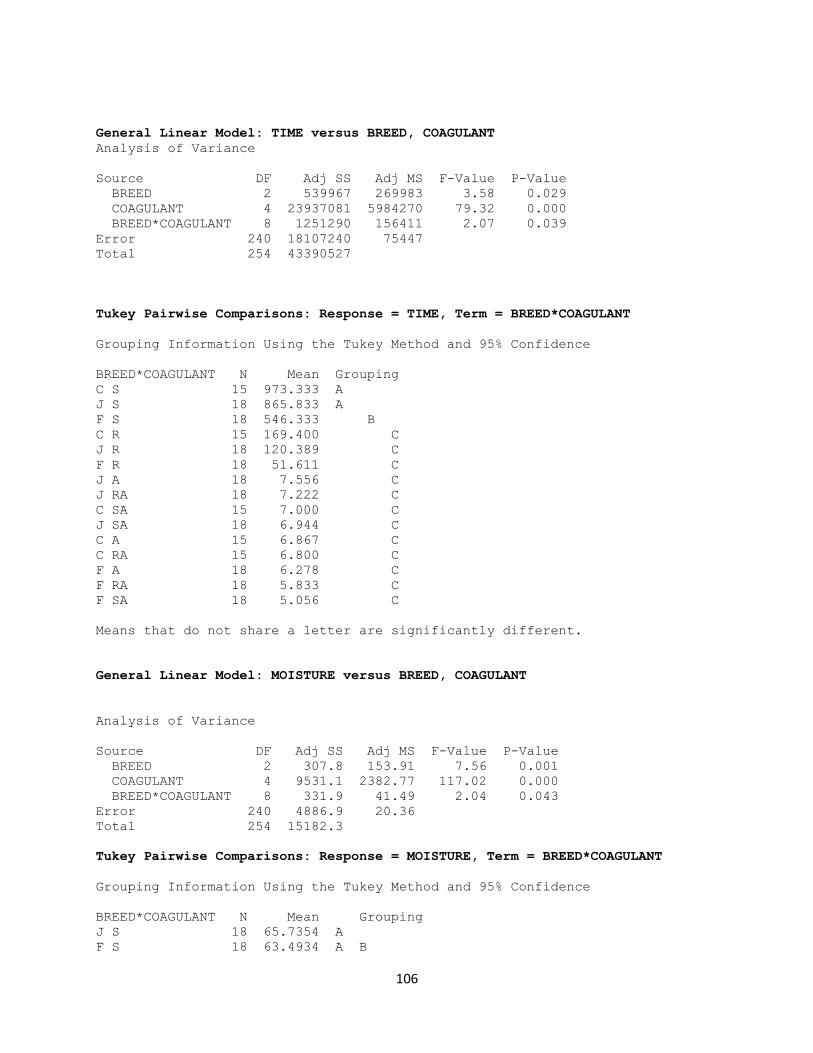
106
General Linear Model: TIME versus BREED, COAGULANT
Analysis of Variance
Source DF Adj SS Adj MS F-Value P-Value
BREED 2 539967 269983 3.58 0.029
COAGULANT 4 23937081 5984270 79.32 0.000
BREED*COAGULANT 8 1251290 156411 2.07 0.039
Error 240 18107240 75447
Total 254 43390527
Tukey Pairwise Comparisons: Response = TIME, Term = BREED*COAGULANT
Grouping Information Using the Tukey Method and 95% Confidence
BREED*COAGULANT N Mean Grouping
C S 15 973.333 A
J S 18 865.833 A
F S 18 546.333 B
C R 15 169.400 C
J R 18 120.389 C
F R 18 51.611 C
J A 18 7.556 C
J RA 18 7.222 C
C SA 15 7.000 C
J SA 18 6.944 C
C A 15 6.867 C
C RA 15 6.800 C
F A 18 6.278 C
F RA 18 5.833 C
F SA 18 5.056 C
Means that do not share a letter are significantly different.
General Linear Model: MOISTURE versus BREED, COAGULANT
Analysis of Variance
Source DF Adj SS Adj MS F-Value P-Value
BREED 2 307.8 153.91 7.56 0.001
COAGULANT 4 9531.1 2382.77 117.02 0.000
BREED*COAGULANT 8 331.9 41.49 2.04 0.043
Error 240 4886.9 20.36
Total 254 15182.3
Tukey Pairwise Comparisons: Response = MOISTURE, Term = BREED*COAGULANT
Grouping Information Using the Tukey Method and 95% Confidence
BREED*COAGULANT N Mean Grouping
J S 18 65.7354 A
F S 18 63.4934 A B

107
C S 15 62.7415 A B C
J A 18 61.7559 A B C
F R 18 61.3857 A B C
F A 18 61.0202 A B C
J R 18 59.8167 B C
C R 15 59.7676 B C
C A 15 57.2927 C
J RA 18 51.6921 D
J SA 18 51.1530 D
F RA 18 50.5672 D E
C RA 15 48.6904 D E
C SA 15 48.1264 D E
F SA 18 45.6743 E
Means that do not share a letter are significantly different.
General Linear Model: Ph versus BREED, COAGULANT
Analysis of Variance
Source DF Adj SS Adj MS F-Value P-Value
BREED 2 1.140 0.5702 18.74 0.000
COAGULANT 4 145.694 36.4235 1196.91 0.000
BREED*COAGULANT 8 1.230 0.1538 5.05 0.000
Error 240 7.303 0.0304
Total 254 155.829
Tukey Pairwise Comparisons: Response = Ph, Term = BREED*COAGULANT
Grouping Information Using the Tukey Method and 95% Confidence
BREED*COAGULANT N Mean Grouping
J R 18 6.87167 A
F R 18 6.70778 A B
C R 15 6.67067 A B
F S 18 6.65333 B
C S 15 6.63133 B
J S 18 6.60389 B
F SA 18 5.44056 C
F RA 18 5.36167 C D
J SA 18 5.25444 C D E
C SA 15 5.21733 D E
J RA 18 5.14722 E
F A 18 5.14667 E
C RA 15 5.13800 E
J A 18 4.89333 F
C A 15 4.84333 F
Means that do not share a letter are significantly different.
General Linear Model: FAT versus BREED, COAGULANT
Analysis of Variance

108
Source DF Adj SS Adj MS F-Value P-Value
BREED 2 1086.6 543.31 14.38 0.000
COAGULANT 4 9562.6 2390.65 63.26 0.000
BREED*COAGULANT 8 857.8 107.22 2.84 0.005
Error 240 9070.3 37.79
Total 254 20503.0
Tukey Pairwise Comparisons: Response = FAT, Term = BREED*COAGULANT
Grouping Information Using the Tukey Method and 95% Confidence
BREED*COAGULANT N Mean Grouping
J A 18 34.5041 A
C A 15 33.4083 A
J SA 18 23.0131 B
C SA 15 22.8169 B
F A 18 22.4745 B
J RA 18 21.0012 B
F SA 18 19.6390 B C
C RA 15 19.3469 B C D
F RA 18 18.7171 B C D
C R 15 17.1181 B C D E
J R 18 16.4686 B C D E
F R 18 12.7122 C D E
C S 15 12.6268 C D E
J S 18 12.3677 D E
F S 18 11.3552 E
Means that do not share a letter are significantly different.
General Linear Model: Protein versus BREED, COAGULANT
Factor Information
Factor Type Levels Values
BREED Fixed 3 C, F, J
COAGULANT Fixed 5 A, R, RA, S, SA
Analysis of Variance
Source DF Adj SS Adj MS F-Value P-Value
BREED 2 1118 558.79 8.12 0.000
COAGULANT 4 24535 6133.67 89.15 0.000
BREED*COAGULANT 8 1478 184.71 2.68 0.008
Error 240 16512 68.80
Total 254 43728
Tukey Pairwise Comparisons: Response = Protein, Term = BREED*COAGULANT
Grouping Information Using the Tukey Method and 95% Confidence

109
BREED*COAGULANT N Mean Grouping
J S 18 53.3677 A
F S 18 52.1381 A B
C S 15 50.1148 A B
F R 18 48.6735 A B
J R 18 43.3481 B C
C R 15 42.6495 B C
F A 18 38.5458 C D
F RA 18 31.8501 D E
J RA 18 30.6908 D E
C RA 15 29.3435 D E
J SA 18 28.1399 E
J A 18 27.2518 E
F SA 18 26.0353 E
C SA 15 25.3095 E
C A 15 23.8845 E
Means that do not share a letter are significantly different.
General Linear Model: *L versus BREED, COAGULANT
Analysis of Variance
Source DF Adj SS Adj MS F-Value P-Value
BREED 2 190.89 95.446 37.90 0.000
COAGULANT 4 699.77 174.944 69.47 0.000
BREED*COAGULANT 8 61.44 7.680 3.05 0.003
Error 240 604.35 2.518
Total 254 1567.14
Tukey Pairwise Comparisons: Response = *L, Term = BREED*COAGULANT
Grouping Information Using the Tukey Method and 95% Confidence
BREED*COAGULANT N Mean Grouping
C R 15 96.6840 A
C S 15 96.5733 A B
C A 15 96.4693 A B C
F S 18 95.1967 A B C D
J R 18 95.0683 A B C D
F A 18 94.9594 A B C D
J S 18 94.7889 A B C D
F R 18 94.7033 B C D E
J A 18 94.6267 C D E
C RA 15 94.2580 D E F
C SA 15 92.8313 E F G
J RA 18 92.6300 F G
J SA 18 92.1378 G
F RA 18 91.9983 G
F SA 18 89.3706 H
Means that do not share a letter are significantly different.
General Linear Model: *b versus BREED, COAGULANT

110
Analysis of Variance
Source DF Adj SS Adj MS F-Value P-Value
BREED 2 2306.0 1153.01 27.84 0.000
COAGULANT 4 2114.0 528.51 12.76 0.000
BREED*COAGULANT 8 672.6 84.08 2.03 0.044
Error 240 9938.1 41.41
Total 254 15051.1
Tukey Pairwise Comparisons: Response = *b, Term = BREED*COAGULANT
Grouping Information Using the Tukey Method and 95% Confidence
BREED*COAGULANT N Mean Grouping
J RA 18 30.9656 A
J SA 18 30.1378 A B
J R 18 29.9739 A B
F SA 18 27.7683 A B C
C SA 15 27.3207 A B C
J S 18 25.4883 A B C D
J A 18 23.7778 A B C D
F S 18 23.2961 B C D E
F RA 18 22.4928 C D E
C RA 15 22.1453 C D E
C R 15 21.1120 C D E
F R 18 19.5350 D E
C A 15 19.1173 D E
C S 15 18.7027 D E
F A 18 16.2056 E
Means that do not share a letter are significantly different.
General Linear Model: *a versus BREED, COAGULANT
Analysis of Variance
Source DF Adj SS Adj MS F-Value P-Value
BREED 2 3.292 1.6461 4.61 0.011
COAGULANT 4 147.138 36.7846 102.98 0.000
BREED*COAGULANT 8 12.365 1.5457 4.33 0.000
Error 240 85.728 0.3572
Total 254 247.423
Tukey Pairwise Comparisons: Response = *a, Term = BREED*COAGULANT
Grouping Information Using the Tukey Method and 95% Confidence
BREED*COAGULANT N Mean Grouping
J RA 18 -1.88944 A
J A 18 -2.09444 A B
C RA 15 -2.10067 A B
F A 18 -2.16333 A B
J R 18 -2.23389 A B
F RA 18 -2.30333 A B
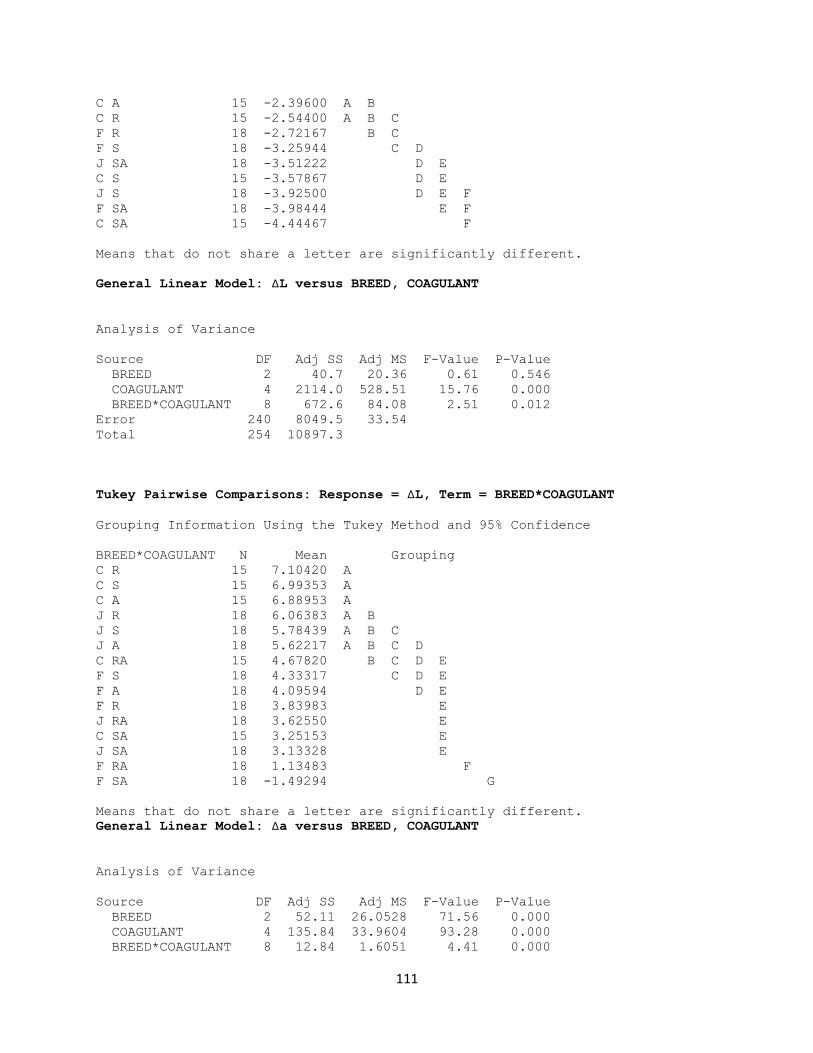
111
C A 15 -2.39600 A B
C R 15 -2.54400 A B C
F R 18 -2.72167 B C
F S 18 -3.25944 C D
J SA 18 -3.51222 D E
C S 15 -3.57867 D E
J S 18 -3.92500 D E F
F SA 18 -3.98444 E F
C SA 15 -4.44467 F
Means that do not share a letter are significantly different.
General Linear Model: ∆L versus BREED, COAGULANT
Analysis of Variance
Source DF Adj SS Adj MS F-Value P-Value
BREED 2 40.7 20.36 0.61 0.546
COAGULANT 4 2114.0 528.51 15.76 0.000
BREED*COAGULANT 8 672.6 84.08 2.51 0.012
Error 240 8049.5 33.54
Total 254 10897.3
Tukey Pairwise Comparisons: Response = ∆L, Term = BREED*COAGULANT
Grouping Information Using the Tukey Method and 95% Confidence
BREED*COAGULANT N Mean Grouping
C R 15 7.10420 A
C S 15 6.99353 A
C A 15 6.88953 A
J R 18 6.06383 A B
J S 18 5.78439 A B C
J A 18 5.62217 A B C D
C RA 15 4.67820 B C D E
F S 18 4.33317 C D E
F A 18 4.09594 D E
F R 18 3.83983 E
J RA 18 3.62550 E
C SA 15 3.25153 E
J SA 18 3.13328 E
F RA 18 1.13483 F
F SA 18 -1.49294 G
Means that do not share a letter are significantly different.
General Linear Model: ∆a versus BREED, COAGULANT
Analysis of Variance
Source DF Adj SS Adj MS F-Value P-Value
BREED 2 52.11 26.0528 71.56 0.000
COAGULANT 4 135.84 33.9604 93.28 0.000
BREED*COAGULANT 8 12.84 1.6051 4.41 0.000

112
Error 240 87.37 0.3641
Total 254 286.37
Tukey Pairwise Comparisons: Response = ∆a, Term = BREED*COAGULANT
Grouping Information Using the Tukey Method and 95% Confidence
BREED*COAGULANT N Mean Grouping
J RA 18 1.13528 A
J R 18 1.01861 A B
J A 18 0.90139 A B C
F A 18 0.43817 B C D
F RA 18 0.29817 C D E
C RA 15 0.23613 C D E
C A 15 -0.05920 D E F
F R 18 -0.12017 D E F
C R 15 -0.20720 D E F
J SA 18 -0.25972 E F
F S 18 -0.65794 F G
J S 18 -0.67250 F G
C S 15 -1.24187 G H
F SA 18 -1.38294 H
C SA 15 -2.10787 I
Means that do not share a letter are significantly different.
General Linear Model: ∆b versus BREED, COAGULANT
Analysis of Variance
Source DF Adj SS Adj MS F-Value P-Value
BREED 2 522.29 261.146 121.02 0.000
COAGULANT 4 699.77 174.944 81.07 0.000
BREED*COAGULANT 8 61.44 7.680 3.56 0.001
Error 240 517.88 2.158
Total 254 1812.07
Tukey Pairwise Comparisons: Response = ∆b, Term = BREED*COAGULANT
Grouping Information Using the Tukey Method and 95% Confidence
BREED*COAGULANT N Mean Grouping
F SA 18 19.4723 A
C SA 15 18.6379 A B
J RA 18 16.8911 A B C
J SA 18 16.0633 A B C D
J R 18 15.8994 A B C D
F S 18 15.0001 A B C D
F RA 18 14.1968 A B C D E
C RA 15 13.4625 A B C D E
C R 15 12.4292 B C D E
J S 18 11.4138 C D E
F R 18 11.2390 C D E

113
C A 15 10.4345 C D E
C S 15 10.0199 C D E
J A 18 9.7033 D E
F A 18 7.9096 E
Means that do not share a letter are significantly different.
One-way ANOVA: Hardness versus Sample
Analysis of Variance
Source DF Adj SS Adj MS F-Value P-Value
Sample 4 559332 139833 386.07 0.000
Error 10 3622 362
Total 14 562954
One-way ANOVA: Adhesiveness versus Sample
Analysis of Variance
Source DF Adj SS Adj MS F-Value P-Value
Sample 4 7096.6 1774.16 63.26 0.000
Error 10 280.4 28.04
Total 14 7377.1
One-way ANOVA: Springiness versus Sample
Analysis of Variance
Source DF Adj SS Adj MS F-Value P-Value
Sample 4 0.44751 0.111878 108.97 0.000
Error 10 0.01027 0.001027
Total 14 0.45778
One-way ANOVA: Cohesiveness versus Sample
Analysis of Variance
Source DF Adj SS Adj MS F-Value P-Value
Sample 4 0.050986 0.012746 59.87 0.000
Error 10 0.002129 0.000213
Total 14 0.053115
One-way ANOVA: Chewiness versus Sample
Analysis of Variance

114
Source DF Adj SS Adj MS F-Value P-Value
Sample 4 58772.7 14693.2 154.91 0.000
Error 10 948.5 94.8
Total 14 59721.2
One-way ANOVA: Meltability(cm) versus Sample
Analysis of Variance
Source DF Adj SS Adj MS F-Value P-Value
Sample 4 158.593 39.6483 75.66 0.000
Error 10 5.240 0.5240
Total 14 163.833
Two- way Anova- sensory profile
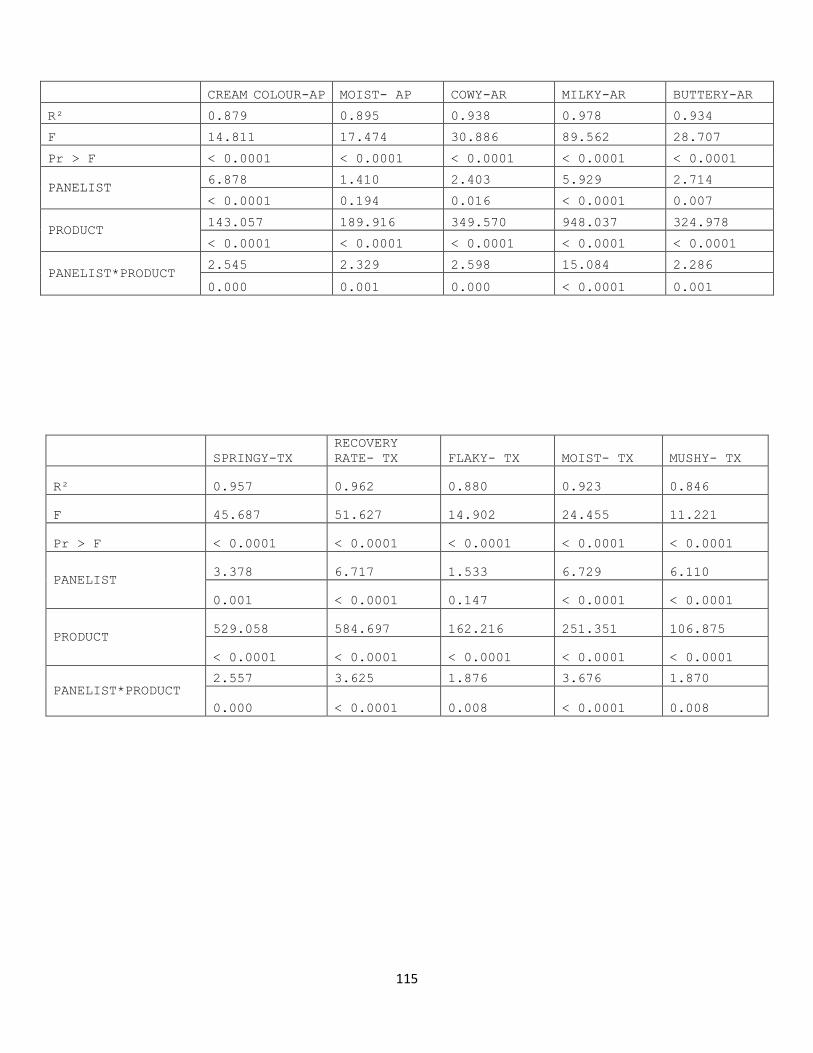
115
SPRINGY-TX
RECOVERY
RATE- TX FLAKY- TX MOIST- TX MUSHY- TX
R² 0.957 0.962 0.880 0.923 0.846
F 45.687 51.627 14.902 24.455 11.221
Pr > F < 0.0001 < 0.0001 < 0.0001 < 0.0001 < 0.0001
PANELIST 3.378 6.717 1.533 6.729 6.110
0.001 < 0.0001 0.147 < 0.0001 < 0.0001
PRODUCT 529.058 584.697 162.216 251.351 106.875
< 0.0001 < 0.0001 < 0.0001 < 0.0001 < 0.0001
PANELIST*PRODUCT 2.557 3.625 1.876 3.676 1.870
0.000 < 0.0001 0.008 < 0.0001 0.008
CREAM COLOUR-AP MOIST- AP COWY-AR MILKY-AR BUTTERY-AR
R² 0.879 0.895 0.938 0.978 0.934
F 14.811 17.474 30.886 89.562 28.707
Pr > F < 0.0001 < 0.0001 < 0.0001 < 0.0001 < 0.0001
PANELIST 6.878 1.410 2.403 5.929 2.714
< 0.0001 0.194 0.016 < 0.0001 0.007
PRODUCT 143.057 189.916 349.570 948.037 324.978
< 0.0001 < 0.0001 < 0.0001 < 0.0001 < 0.0001
PANELIST*PRODUCT 2.545 2.329 2.598 15.084 2.286
0.000 0.001 0.000 < 0.0001 0.001