Detailed Project Report on Water Audit, Leak Detection ...
165
Date : 11 th March, 2005 Detailed Project Report on Water Audit, Leak Detection & Leak Reduction for Nagpur Municipal Corporation Nagpur SUBMITTED TO :- THE EXECUTIVE ENGINEER Water Works Department Nagpur Municipal Corporation, Pandit Jawaharlal Nehru Marg, Sitabuldi, Nagpur – 440 012 [M.S.] India. SHAH TECHNICAL CONSULTANTS PRIVATE LTD. Consulting Engineers 407, Raheja Centre, Nariman Point, Mumbai – 400 021 [M.S.] India Ph. : 020-22820018, 22871061, 22820121, Fax : 020-22023714 E-mail : [email protected]
-
Upload
khangminh22 -
Category
Documents
-
view
3 -
download
0
Transcript of Detailed Project Report on Water Audit, Leak Detection ...

Date : 11th March, 2005
Detailed Project Report
on Water Audit, Leak Detection & Leak Reduction
for Nagpur Municipal Corporation Nagpur
SUBMITTED TO :- THE EXECUTIVE ENGINEER Water Works Department Nagpur Municipal Corporation, Pandit Jawaharlal Nehru Marg, Sitabuldi, Nagpur – 440 012 [M.S.] India.
SHAH TECHNICAL CONSULTANTS PRIVATE LTD. Consulting Engineers 407, Raheja Centre, Nariman Point, Mumbai – 400 021 [M.S.] India Ph. : 020-22820018, 22871061, 22820121, Fax : 020-22023714 E-mail : [email protected]

NMC, Water Audit & Leak Detection DPR, Index
Shah Technical Consultants Pvt. Ltd, Mumbai
I N D E X
Page No. Sr. No.
Description From To
I ABBREVIATIONS I I
II EXECUTIVIE SUMMARY II IX
NAGPUR WATER SUPPLY
1.0 General 1 1
2.0 Water Demand / Population 1 1
3.0 Present Nagpur Water Supply Scenario 2 3
4.0 Present Water Distribution System 4 5
5.0 NMC Budget for Water Works Department (2003-2004) 5 5
6.0 Water Auditors View on NMC Budget 6 6
01.
7.0 Water Audit & Leak Detection 6 6
WATER AUDIT BEYOND NMC LIMIT
1.0 Raw Water Transmission Losses Through Canal 7 10
2.0 Raw Water Tariff 11 11
3.0 Action Plan Proposed 11 11
02.
4.0 Action Taken by NMC 12 12
WATER AUDIT METHODOLOGY
1.0 Introduction 13 13
2.0 Importance of Measurement & Metering 13 14
3.0 Important Definitions for Water Audit Use 14 16
03.
4.0 Water Audit Work-Sheet & Steps for Calculating Non-Revenue Water & Water Losses 17 18

NMC, Water Audit & Leak Detection DPR, Index
Shah Technical Consultants Pvt. Ltd, Mumbai
Page No. Sr.
No. Description
From To
NINE TASKS OF WATER AUDIT & LEAK DETECTION
Task-1 System Input Volume 19 19
Task-2 Billed Metered Consumption & Billed Un-metered Consumption
20 20
Task-3 Calculate the Volume of Non-Revenue 21 21
Task-4 Calculate the Unbilled Authorised Consumption 21 26
Task-5 Calculate Authorised Consumption 26 26
Task-6 Calculate Water Losses 27 27
Task-7 Calculate The Apparent Losses 27 31
Task-8 Calculate Real Losses 31 31
Task-9 Assessment of Real Losses 31 38
04.
Summary of Performance Indicators 39 39
LEAK DETECTION STUDY
1.0 Objective 40 40
2.0 Present UFW Scenario for Nagpur City 40 40
05.
3.0 Methodology to Study Un-accounted for Water 41 48
SLUM POLICY
1.0 Preamble 49 49
2.0 Case Studies for Water Supply to Representative Slums 49 49
3.0 CPHEEO Norms of Minimum Water Supply to Communities 49 49
4.0 General Information About the Slum 50 50
5.0 Cost of Water Supply in Nagpur City 50 50
6.0 Categories of Structures 50 50
7.0 Calculations for Water Charges 50 51
06.
8.0 Recommendations 51 68

NMC, Water Audit & Leak Detection DPR, Index
Shah Technical Consultants Pvt. Ltd, Mumbai
Page No. Sr.
No. Description
From To
ANNEXURES
Annexure-1 Cost of Water for Rated Capacity of 470 mld 69 69
Annexure-2 Major Leak Detection 70 94
Annexure-3 144 Test Zone Consumer Survey 95 129
Annexure-4 Analysis of Maintenance Record 130 130
Annexure-5 Details of Public Stand Post [PWR] 131 131
Annexure-6 Average Flow Rate at Public Stand Post 132 132
Annexure-7 Average Flow Rate at Consumer End 133 133
07.
Annexure-8 Water Tariff Structure 134 134

ABBREVIATIONS

NMC, Water Audit & Leak Detection DPR, Abbreviations
Shah Technical Consultants Pvt. Ltd, Mumbai
Abbreviations ALC Active Leakage Control
APPX. Approximate
AVG Average
CPHEEO Central Public Health Engineering & Environmental Organization
DPR Detailed Project Report
ESR Elevated Service Reservoir
GSR Ground Service Reservoir
GL Ground Level
ID Irrigation Department
IWWA Indian Water Works Association
LPS Liter Per Second
MBR Main Balancing Reservoir
MSL Mean Sea Level
MLD Million Liter Per Day
MM3 Million Cubic Meter
ML Million Liter
NMC Nagpur Municipal Corporation
NRW Non Revenue Water
PRBC Pench Right Bank Canal
PWR / PWS Public Water Supply
PWTM Pure Water Transmission Main
RCC Reinforced Cement Concrete
RBC Right Bank Canal
STC Shah Technical Consultant Pvt. Ltd.
UFW Un-accounted for Water
WCL Western Coalfield Limited
WTP Water Treatment Plant Conversions Commonly Used in Water Audit 1 m3 = 1000 ltrs.
1 unit = 1000 ltrs.
1 ml = 1000 units / 1000 m3
1 mm3/yr. = 2.74 mld
1 mm3 = 1000 ml
1 cusec = 2.446 mld Unit of Measure :- Unit of measure has been taken as mld (Million Liter Per Day) as all the
Input & Output is considered in mld. These figures are calculated for annual consumption and divided by 365 days.

EXECUTIVE SUMMARY

NMC, Water Audit & Leak Detection DPR, Executive Summary
Shah Technical Consultants Pvt. Ltd, Mumbai
Water Audit, Leak Detection & Leak Reduction for
Nagpur Municipal Corporation, Nagpur
Executive Summary Nagpur city the second capital of Maharashtra State with population of 2.35 million. It is practically at the centre of India. Nagpur Municipal Corporation (NMC) manages treated water supply of 470 mld with annual budget on water supply is appx. 95 crore (expenditure) against actual receipt of only 50 crore (Revenue). The preliminary audit report reveals that Un-account of Water (UFW) is 50% of pure water. NMC has three sources of raw water. I] Pench Right Bank Canal off-take at 48.5 k.m. chainage at Mahadula (PRBC from Pench
Dam) II] Kanhan River head works at Kampttee. III] Gorewada Tank. NMC purchase appx. 625 mld of raw water from Irrigation Department & Gorewada Tank. NMC generates only 490 mld of treated water from all the WTP against rated capacity of 470 mld. NMC sales only 241 mld of water (as per billing records). This report puts the effort to identify the causes for gap between quantum of raw water purchased / input and water sold. It provides priority for action plans to reduce water losses & UFW. The water audit study reveals that : 1.0] The transmission losses of raw water through canal is ranging from minimum 20% to
35% depending on quantum of water releases in canal. The quantum of water loss was estimated to the tune of minimum 100 mld to 250
mld. If NMC recovers these losses, the additional water available from recovery of losses
will be sufficient upto 2016 for expected population growth of city. It is noted with great pleasure that NMC has taken initiative for laying of MS pipeline
for transmission of raw water and discussions are started with irrigation department to provide the benefit of recovered losses in terms of providing addition fresh water to city. The total estimated cost of pipe line project was Rs. 162.62 Crores.

NMC, Water Audit & Leak Detection DPR, Executive Summary
Shah Technical Consultants Pvt. Ltd, Mumbai
2.0] NMC is likely to save appx. Rs. 6.08 crore / year for 137 mm3 (existing requirement) and 8.44 crore / year for 190 mm3 Ultimate requirement due to difference of water tariff for canal Rs. 6.0 lakhs / mm3 against dam Rs. 1.56 lakhs/mm3. It is a additional benefit of bringing water by pipeline.
3.0] Meterisation at raw water off-take points, pure water transmission mains and all ESR
has been recommended in water audit study with following advantages. 3.1] Savings in excess water charges paid to irrigation department – Rs. 1.95 crore
/ year. 3.2] Accountability of pure water input to distribution system. 3.3] Accountability of water for each zone as quantum of water receipt and quantum
of water sold to consumer and UFW. 3.4] Equitable distribution of water. NMC has finalized the tender for purchasing of meter and likely to install the 1st lot of
meter within a month time. 4.0] Water Audit study reveals that appx. 17.90 mld of water lost through water treatment
plant for back wash and leakage losses. It was recommended to re-cycle the WTP water to avoid the water losses. NMC has floated the tenders for re-cycling of back wash water in WTP’s. 5.0] The authorized un-metered unbilled consumption of NMC was estimated at appx. 22
mld costing NMC (appx. 4.40 crore) the major contributors are i) stand post, ii) tanker supply, iii) NMC offices, schools, hospitals etc. & iv) authorized unbilled connections.
6.0] The unauthorized consumption of NMC was estimated at 54 mld with estimated
45,600 un-authorised connection based on detailed survey carried out in 144 test zones.
The most of the un-authorised connections are in slum areas, separate slum policy
has been recommended to reduce the number of stand post and illegal connections. NMC has under taken the work of social survey to identifying the illegal connections
and setup the central cell to speedily process application for regularization. 7.0] The detailed survey of consumers in 144 test zones reveals that bills given to appx.
89% consumers are not based on meter reading due to various reasons. The metering error contributes major share in UFW. The detailed study will start to
quantify the UFW after NMC procure the meter and install at specified consumer location. The tenders are finalized and due for approval from standing committee. The detailed action plan will be proposed in final report on water audit.
8.0] Leak detection program for WTP, reservoirs, distribution mains, pumping mains has
been carried out and details are given in the report. The leak detection program for service connections and distribution lines are under progress for 144 test zones & likely to be completed within next three month.

NMC, Water Audit & Leak Detection DPR, Executive Summary
Shah Technical Consultants Pvt. Ltd, Mumbai
9.0] It is worth to mentioned that NMC has very effective active leak control program as the contracts to private agencies are given for each zones, based on rate fixed for each type of activities to carried out for leak repairing, once leak has been reported or identified, agency has to repair the leak immediately and has to take photograph of before repairing & after repairing. Thanks to above program the real losses (physical losses) are much less than apparent losses.
10.0] NMC has also taken up the following improvement / up-gradation of water distribution
system for reducing the free water supply by Tankers. (The cost of water by tanker is Rs. 55.50/unit).
A] Up-gradation / expansion of water distribution network with appx. 18.00 k.m. of
pipeline network. B] Improvement to North Nagpur water supply by diverting Pench water to North
Nagpur, reduce the served by Kanhan water. C] Improvement to feeder main of Nandanvan ESR and supply additional water to
make daily water supply in Nandanvan area in place of alternate day supply. The detailed project will be prepared after completion of on-going study of water losses at 144 test zones, the detailed project report will consist of I] Estimated UFW at service connections & micro level distribution network. II] Consumer metering errors, billing & its improvements. III] Targeted Economical level of UFW. IV] Action plan to achieve Targeted Economical level of UFW. V] Detailed cost estimates for action plan suggested. CONCLUSION :- The objective of submission of draft report is to implement of action plan to reduce discovered raw water & treated water losses given below, without waiting for final report on water audit & leak detection. � NMC shall immediately implement the action plan with payback period less than one
year. � NMC shall make all efforts to replacement of Canal by close conduit pipe for
transmission of raw water to save precious fresh water to the tune of minimum 100 mld to 250 mld.
� NMC shall install the flow meters at all raw water, pure water transmission main &
ESR/GSR inlets to a Save raw water cost by appx. 20%.

NMC, Water Audit & Leak Detection DPR, Executive Summary
Shah Technical Consultants Pvt. Ltd, Mumbai
a Accountability of water usage at zonal & sub zonal level. a Equitable distribution of water. � Recover the water losses at WTP’s / Gorewada tank to the tune of 22 mld or more. � Immediately repair the discovered leakages (already many leakages has been repaired). � Implement the slum policy for water supply to reduce un-authorised consumption. � Continue the efforts to identify the illegal connections. � Revised the water tariff on cost basis.


NMC, Water Audit & Leak Detection DPR, Executive Summary
Shah Technical Consultants Pvt. Ltd, Mumbai
SUMMARY OF PERFORMANCE INDICATORS
Sr. No. Description
01. Population of Nagpur City 23,50,000 souls
02. System Input Volume 625 mld
03. Actual Water Supply in Distribution System 490 mld (78%)
04. Actual Water Sales 241 mld (38%)
UFW (Gross) 384 mld (62%)
5.1] UFW for Raw Water upto WTP 135 mld (22%)
05.
5.2] UFW for Treated Water 249 mld (40%)
Total Non-Revenue Water (Administrative + Real) 384 mld (62%)
6.1] Administrative losses (apparent losses + free water)
236 mld (38%)
6.2] Real Losses 104 mld (17%)
06.
6.3] Unidentified Losses 43 mld (7%)
07. Water cost / unit (1000 ltrs.) Rs. 5.55/unit
08. Minimum Water Tariff (1000 ltrs.) Rs. 3.50/unit
09. Total Water Connections (inclusive of authorized unbilled) Appx. 2.0 lakhs
10. Avg. no. of persons / connections (90% piped water) 10-11
11. Total Water Connection (inclusive of unauthorized) Appx. 2.45 lakhs
12. Total Treated Water Losses (Real + Apparent) excluding raw water losses [490 mld – (billed consumption + unbilled authorized consumption)]
227 mld
13. Treated Water Losses / Connections (12÷11) 926 ltrs./connection/day
14. Treated Water Losses / Person (12÷1) 97 ltrs./person/day
Note :- All figures in % given with reference to System Input Volume (625 mld).

NMC, Water Audit & Leak Detection DPR, Executive Summary
Shah Technical Consultants Pvt. Ltd, Mumbai
ACTION PLAN TO REDUCE WATER LOSSES (Based on Draft Report on Water Audit & Leak Detection Program)
A] REDUCTION IN RAW WATER LOSSES :-
Sr. No.
Description of Water Losses
Quantum of Losses
Action Plan Investment Payback Period
01. Raw Water Transmission Losses in Canal
*100-250 mld (Real Losses)
Laying of 2 X 1930 mm M.S. pipe line in two phase
Rs. 162.62 crore. Ret Note
02. Excess billing of Raw Water
127 mld (Apparent Losses) 1.95 Crore / year
Installation of Flow Meter at Raw Water Off-take points
Rs. 30.00 Lakhs
2 Months
03. WTP Losses 17.9 mld (Real Losses)
• Recycling of backwash of WTP water
Rs. 1.50 Crore 5 Months
04. Gorewada Tank Leakage
4.78 mld (Real Losses)
• Recycle or improvement to gates
Rs. 0.50 Lakhs 7 Months
Note :- 1) Recovery of 100-250 mld of water at much less capital cost compare to
development of any new source. 2) Additional saving of 8.42 crore / year on water tariff (Payback period 20 year
only by tariff charge)

NMC, Water Audit & Leak Detection DPR, Executive Summary
Shah Technical Consultants Pvt. Ltd, Mumbai
B] REDUCTION IN TREATED WATER LOSSES :-
Sr. No.
Description of Water Losses
Quantum of Losses
Action Plan Investment
• Proposed Slum Policy & improvement to slum connectivity
Rs. 3.30 Crore
01. Un-metered Unbilled Consumption
22 mld
• Meterisation to NMC Properties
• Improvement to billing system.
02. Un-authorised Consumption
27 mld
Meterisation of all ESR/GSR for better accountability
Rs. 1.80 Crore
• 89% of bills prepared are not based on meter readings.
03. Minimising Metering errors
**48 mld
• Complete metering / reading / billing system needs improvement
• PPP for better accountability maximum losses are in service connections
04. Water Leaks in Distribution System
**75 mld
• Most of leakages are in pipes less than 100 mm
05. Other Losses (Discovered Leakage)
1.525 mld • May be taken up by NMC active leak control program
• Detailed estimates will be submitted along with final report. ** Detailed action plan will be submitted with final report.

NAGPUR WATER SUPPLY

NMC, Water Audit & Leak Detection DPR, Nagpur Water Supply
Shah Technical Consultants Pvt. Ltd, Mumbai 1
Nagpur Water Supply 1.0] GENERAL :- Nagpur City, the second capital of Maharashtra State, is a major center of education,
culture & commerce. It is practically at the geographical center of India. All major highways and railways pass via Nagpur. Recently Nagpur is in lime light for its road infrastructure, cleanliness and upcoming Cargo Hub.
The Nagpur Municipal Corporation (NMC) manages water supply and waste water
collection, treatment and disposal as also municipal solid waste management within the corporation limits having an area of 217.56 Sq. Km.
Nagpur is situated at a latitude of 210-9’ North and longitude 790-6’ East at altitude of
310 m appx. above sea level. Maximum average and minimum rainfalls are 1933 mm, 1205 mm and 606 mm respectively.
NMC has awarded the consultancy work for Conducting Water Audit, Leak Detection
& Leak Reduction for Water Works Department of Nagpur Municipal Corporation, Nagpur to M/s Shah Technical Consultancy Pvt. Ltd., Mumbai.
2.0] WATER DEMAND / POPULATION :- 2.1] Population :-
Treated Water @ WTP Year Population
Demand (Mld) Supply (Mld)
1991 17,00,000 290 369
2001 21,50,000 474 369
2004 23,50,000 489 470
2.2] Pure Water :- (Rated Capacity from existing WTP)
Kanhan Water Works 108.00 Mld
Pench Phase – I 113.00 Mld
Pench Phase – II 133.00 Mld
Pench Phase – III, Stage – I 100.00 Mld
Old Gorewada 16.00 Mld
Total 470.00 Mld

NMC, Water Audit & Leak Detection DPR, Nagpur Water Supply
Shah Technical Consultants Pvt. Ltd, Mumbai 2
3.0] PRESENT NAGPUR WATER SUPPLY SCENARIO :- The brief details of existing water supply schemes are:-
3.1] Old Gorewada Water Works :-
This was developed in the year 1911. It consists of an earthen bund across river Pili at a distance of about 8 Km. towards North-East of Nagpur city having gross and live storage capacities 8.82 Mm3 and 7.92 Mm3 respectively. On the downstream of Gorewada tank, conventional Water Treatment Plant of 16.0 Mld capacity is constructed. Treated water is collected in pure water sump of capacity 18.16 lakh ltrs. and then pumped to Seminary Hills G.S.R.
3.2] Kanhan Water Works :-
Surface water from the perennial river Kanhan, 18 Km away from the city. The
head works are located 0.3 Km. down stream of confluence of river Kanhan and river Kolar.
Kanhan Water Works was commissioned in four phases during the years 1940
to 1970. The first phase capacity in year 1940 was 27.3 Mld which was then augmented to 63.6 Mld in 1954. The capacity was further augmented to 86.3 Mld in 1966 and finally to 109 Mld in 1970.
3.3] Augmentation to Nagpur Water Supply Scheme, Pench Phase-I :-
In 1970, the Irrigation Department of Government of Maharashtra executed a
storage dam across river Pench for hydro electric project at Totaladoh and pickup dam at Navegaon Khairy. The right bank canal from this pickup dam was proposed to supply water to the Koradi Thermal Power Station as also about 247 Mld for Nagpur city water supply. It was planned to implement the scheme in stages and accordingly Phase-I scheme was sanctioned in the year 1975 and the scheme commissioned in March, 1982.
3.4] Improvements to Distribution System for Nagpur City Stage-I :- Under Pench Phase-I scheme, three G.S.Rs Seminary Hills, Gittikhadan and
Sitabuldi Fort have been constructed. For proper distribution of water in all parts of city after execution of
Augmentation to Nagpur water supply scheme Pench Phase-I, improvements to Distribution system for Nagpur City, Stage-I has been executed.
Under this scheme seven E.S.Rs have been constructed at Laxminagar (1
No.), Wanjarinagar (1 No.), Minimatanagar (1 No.), Sakkardara (2 Nos.), Lakadganj (2 Nos.) each having capacity of 2.27 ML. For proper distribution of water from these seven E.S.R.s distributions net work in seven zones has been provided.
3.5] Augmentation to Nagpur Water Supply Scheme Pench, Phase-II :-
After executing Phase-I scheme; Nagpur city was to receive 256 Mld of water
from all sources. However, due to the losses due to leakages and other factors in the pipe lines, the actual supply to the city was to the tune of 130 Mld. Thus for 1991 census population of 16.57 lakhs, the actual supply from all sources

NMC, Water Audit & Leak Detection DPR, Nagpur Water Supply
Shah Technical Consultants Pvt. Ltd, Mumbai 3
worked out to only 77 LPCD against an anticipated supply of 180 LPCD and hence Augmentation to Nagpur Water Supply Scheme Pench Phase-II was implemented.
Accordingly, Augmentation to Nagpur Water Supply Scheme Pench-II with
Pench right bank canal as a source was sanctioned in the year 1989 and commissioned on 22/03/1994.
3.6] Improvements to Distribution System for Nagpur City, Stage-II :-
In order to distribute the additional quantity of water from Pench Phase-II
scheme, equitably, it was necessary to strengthen the existing distribution and transmission system.
Accordingly, based on the recommendations of the Tripathi committee and
considering future development of City, Maharashtra Jeevan Pradhikaran has prepared the scheme as ‘Improvements to Distribution system for Nagpur City, Stage-II’ which was administratively approved by Government vide G.R. No. WSS-1092/620/C.R. No. 117/92/UD-30, dated 19-11-1992 for Rs. 54.14 Crores.
The scheme envisages construction of 22.70 lakhs liters capacity R.C.C.
E.S.R.s (Seven Nos.) at Ramnagar, Khamla, Jaripatka, Onkarnagar, Nandanwan, Subhannagar and Takliseem (Jaitala), feeder mains to feed all these reservoirs and distribution network.
3.7] Pench - III, Stage - I :-
Tata consulting Engineers (TCE) has prepared Master plan for Water supply &
sewerage for Nagpur city upto year 2031. The digital base map for Nagpur City by aerial photography & complete piping network is imposed during Pench –III project.
After execution of Pench-III, Stage-I, Nagpur City has received 100 – 120 Mld
of water. The scheme envisages additional Raw Water Pumping Machinery at Mahadula Pumping Station, Raw water gravity main from Gorewada Tank to New state of art Technology 120 Mld water treatment plant including pumping station at Gorewada. 1200 mm dia. M.S. treated water pumping main from WTP to Seminary Hill MBR.
Construction of R.C.C. 14 Nos. elevated service reservoirs 2.27 Ml each at
following locations & one ESR of 0.85 ml capacity at Wadi-Tekadi.
1) Nara, 2) Mahalginagar, 3) Wanjari, 4) Dhaba, 5) Dhantoli, 6) Reshimbag, 7) Boriyapura, 8) Gayatrinagar, 9) Chinchbhuvan, 10) Killa Mahal, 11) Bezanbag, 12) Kalamna, 13) Bharatwadi, 14) Dighori.
There are 43 service reservoirs in the city at 31 locations. Details of the
existing reservoirs are given in Table. The existing storage capacity is 150.79 Ml which @ 32% of the total supply.

NMC, Water Audit & Leak Detection DPR, Nagpur Water Supply
Shah Technical Consultants Pvt. Ltd, Mumbai 4
4.0] PRESENT WATER DISTRIBUTION SYSTEM :- Raw water supply to Nagpur city is from two major sources, Kanhan River (North-
East direction) at Kamptee and RBC of Pench (North-West direction) at Mahadula near Koradi. Prior to Pench-III scheme, there were 28 service reservoirs in the city. After commissioning of Pench III, Ph.I City is served by 43 reservoirs. These 43 service reservoirs are located in 31 ESR/GSR command area in ten water distribution zones (administrative) of Water Works Department of NMC.
Existing water distribution system to Nagpur city is broadly divided in to three areas. 4.1] North / East / South part of Nagpur city with water supply from Kanhan Head
Works & WTP. 4.2] North / West / South / Central part of Nagpur city with water supply from Pench
project and WTP at Gorewada. 4.3] North / Central part of Nagpur city with water supply from both the sources i.e.
Pench & Kanhan.
EXISTING TEN WATER DISTRIBUTION ZONES

NMC, Water Audit & Leak Detection DPR, Nagpur Water Supply
Shah Technical Consultants Pvt. Ltd, Mumbai 5
ZONE NO. Name of Zone POPULATION
(Yr. 2001) No. of
Connections
I DHARAMPETH 2,50,000 20,525
II LAXMI NAGAR 2,50,000 19,266
III HANUMAN NAGAR 2,00,000 13,498
IV DHANTOLI 2,00,000 14,346
V NEHARU NAGAR 1,45,000 21,906
VI GANDHIBAG 2,60,000 21,498
VII SATARANGI PURA 3,20,000 20,271
VIII LAKADGANJ 1,60,000 11,594
IX ASHINAGAR 1,80,000 24,112
X MANGALWARI 2,05,000 14,700
Water is supplied to the city by Master Balancing Reservoirs at Seminary Hills
& Govt. House. Seminary hills and Govt. house are the two master balancing reservoirs from which the water is supplied to other reservoirs. These two MBR’s also supply water to its command area. The reservoirs which get water from Kanhan are directly connected to pumping main.
5.0] NMC BUDGET FOR WATER WORKS DEPARTMENT (2003-2004) :-
(in Lakhs)
Expenses Revenue
1. Establishment Expenses 550 1. Water *7,150
Expenses 2. Govt. Grant 1,900
a) Chemicals 100 3. Other Income 516
b) Energy Bill 2,100
c) Raw Water Charges for Pench 1,000
2.
d) Other expenses 236 3,436
3. Operation & Maintenance 702
4. Repayment of Loans 2,620
Revenue Expenditure 7,308
5. Capital / Development expenses 2,213
TOTAL 9,521 9,566
*Actual water charges receipt was appx. 5000 lakhs.

NMC, Water Audit & Leak Detection DPR, Nagpur Water Supply
Shah Technical Consultants Pvt. Ltd, Mumbai 6
6.0] WATER AUDITORS VIEW ON NMC BUDGET :-
1. Annual expenditure of Municipal Corporation on Water Supply
Rs. 95 Crore
2. Total water charges demanded from consumers. Rs. 71.50 Crore (deficit of 23.50 crores)
3. Total Recovery against water bill Rs. 50.00 Crore (arrears of 21.50 crores)
State of Water Supply & Sales for last three years (No change in tariff)
Year Water Supply Value of Water Sales as per bills raised to consumer
2001-2002 370 mld 70.00 Crore
2002-2003 370 mld 73.50 Crore
2003-2004 490 mld 71.50 Crore
4.
Note :- Water supply rate has been increased by 32% but no increase in water sales figure.
5. Nagpur Municipal Corporation makes payment to Irrigation Department for
600 mld (annual average)
6. NMC supplies treated water to city (Rated capacity)
490 mld
7. NMC billing to all consumers against water supply 240 mld
8. Total water losses / UFW / NRW are 360 mld i.e. 60% of total water purchased
9. Cost of treated water is Rs. 5.55/1000 ltrs.
10. Above figures suggest that water audit required to be carried out to identify the causes and remedies for Un-account for Water (UFW) / Non Revenue water (NRW)
7.0] WATER AUDIT & LEAK DETECTION :- Water Audit & Leak Detection is divided in two parts. i] Water Audit beyond NMC limits i.e. losses upto raw water measurement points. ii] Water Audit for the quantum of water purchased from Irrigation Department. The detailed study of as a Part-A was not in the scope of water Audit but it was worth
to include in the water audit report as it causes for major water loss.

WATER AUDIT BEYOND NMC LIMIT

NMC, Water Audit & Leak Detection DPR, Water Audit Beyond NMC Limit
Shah Technical Consultants Pvt. Ltd, Mumbai 7
Water Audit Beyond NMC Limit (Losses upto Raw Water Measurement Point)
1.0] RAW WATER TRANSMISSION LOSSES THROUGH CANAL :- Pench & Nagpur Water Supply Pench Dam
Kanhan, 25%
Pench, 72%
Gorewada, 3%
Important :- 72% of Raw water is from Pench – RBC on Chainage 48.5 km. at Mahadula. A
possible breach of canal may cause the crisis for Nagpur Water Supply. PRBC being the major source to of raw water for Nagpur city and also the source of
major real water losses. Right Bank Canal :- RBC has a designed carrying capacity of 28.40 cumec. However, at present its
carrying capacity has reduced to 21.23 cumec. This is because of bad condition of the canal. The canal lining is damaged badly. Siltation as well as vegetation growth has also occurred at numerous points. The canal structures, which were originally constructed for the baby canal are now causing obstruction to the flow. Also, many of the head / cross regulators as well as aqueducts have heavy leakages. Due to all these reasons, the carrying capacity of RBC has reduced considerably.
RBC supplies water to Nagpur Municipal Corporation for domestic water requirement
of Nagpur city. It has to cater for industrial requirements of Koradi and Khaparkheda Thermal Power Stations also. The storage capacity of Groewada tank from where water is supplied to Nagpur city is only for the requirement of 7-8 days. As such, RBC has to run continuously without closure period. And hence, proper maintenance and repairs of the canal is not possible.
Regular maintenance of RBC is essential. If RBC breaches, then water supply to
Nagpur city will be disrupted. Irrigation Department had asked NMC to increase the storage capacity of Gorewada tank so that maintenance and repairs of RBC could be done during the closure period. However, neither the storage capacity of the tank has been increase, nor any other alternate arrangements made by NMC. This is an important issue and needs to be sorted out early.

NMC, Water Audit & Leak Detection DPR, Water Audit Beyond NMC Limit
Shah Technical Consultants Pvt. Ltd, Mumbai 8
Photographs showing condition of Right Bank Canal

NMC, Water Audit & Leak Detection DPR, Water Audit Beyond NMC Limit
Shah Technical Consultants Pvt. Ltd, Mumbai 9
Photographs showing condition of Right Bank Canal

NMC, Water Audit & Leak Detection DPR, Water Audit Beyond NMC Limit
Shah Technical Consultants Pvt. Ltd, Mumbai 10
Hence during audit the quantification of canal losses were carried out as follows : The transmission efficiency of 48.50 k.m. long PRBC – 65%* for partially lined canal
(as lining of canal has been damaged at many places)
01] Actual water measurement at Mahadula 458 Mld
02] With 65% efficiency water to release from Pench dam to RBC 705 Mld
03] Estimated transmission losses (leakages + theft + evaporation) 247 Mld
*Refer “Guidelines for Water Audit & Water Conservation” by Govt. of India. During audit study the information gathered at Pench dam for water discharge
through PRBC during hot weather (non-irrigation time) as follows : Estimation of Canal losses based on Pench Right Bank Canal discharge data
enquired from Irrigation Department for non-irrigation use (hot weather)
Rate of Water Discharge (with nil Irrigation) Only from
NMC
NMC + Koradi /
Khaparkheda
In the month of March, 2005 enquired on 1st week of March)
225 Cusec. 325 Cusec.
Total discharge in Mld ≅550 Mld ≅795 Mld
Less for Koradi / Khaparkheda TPS – 175 Mld
Less for NMC 450 Mld 450 Mld
Canal Losses 100 Mld 170 Mld
% of losses (on productive use) 22% 27.2%
Above study suggest that losses to increase with irrigation use of canal with increase
of water level & velocity at canal, as actual capacity of canal is 21.23 cumec ≅ 750 cusec ≅ 1835 mld with irrigation.
Note :- The canal losses estimated based on guidelines of water audit, water conservation &
data collection by inquiry made at Pench dam. The detailed audit of canal was not the scope of Water Audit. NMC/Irrigation department shall carryout the detailed audit for raw transmission losses through canal, however canal losses are ranging from minimum 20 to 35% and corrective action shall be taken immediately by raw water transmission through close conduit for Nagpur city and save huge loss of water.

NMC, Water Audit & Leak Detection DPR, Water Audit Beyond NMC Limit
Shah Technical Consultants Pvt. Ltd, Mumbai 11
2.0] RAW WATER TARIFF :- Raw water tariff of Irrigation Department as applicable on 01/01/2005 was as follows.
01] Raw water lifting from canal Rs. 500/mld + 20% cess Rs. 600 / mld
02] Raw water lifting directly from Dam (Ref. Annexure-8)
Rs. 130/mld + 20% cess Rs. 156 / mld
Saving in Tariff Rs. 444 / mld
Hence, 1] Saving for existing water requirements (137 mm3) 6.08 Crore/Year 2] Savings for total water reservation (190 mm3) 8.43 Crore/Year Important :- Savings / year is based on existing tariff structure and likely to increase with increase
in tariff. Note :- NMC shall consider above savings as an additional advantages for transporting the
water through close conduit. 3.0] ACTION PLAN PROPOSED :- NMC shall make the alternative arrangement for transmission of raw water through
close conduit to avoid leakage, theft & evaporation losses in canal with following advantages.
3.1] Reduce water losses from minimum 100 mld to 250 mld or more. 3.2] Additional water can be made available to Nagpur city & farmers. 3.3] Better maintained canal will increase productivity of water resources. 3.4] Reduced salinity & water logging for agriculture land adjoining to canal. 3.5] NMC can avoid enhancement of local storage capacity of Gorewada & can
save the existing forest as Pench dam will be a bigger and reliable water storage for city.
3.6] Water tariff saving to the tune of 8.43 crore / year, a good 18% savings in
variable cost.

NMC, Water Audit & Leak Detection DPR, Water Audit Beyond NMC Limit
Shah Technical Consultants Pvt. Ltd, Mumbai 12
4.0] ACTION TAKEN BY NMC :- 4.1] Appointed consultant for preparation of DPR for Pench-IV (name given to the
project). 4.2] Feasibility report has been submitted by consultant with investment for pipe
line was 162.64 crores. 4.3] Standing Committee has approved to the project for 162.64 crores. 4.4] NMC has taken initiation for raising the fund for project. 4.5] Project will take 2 year to complete.


WATER AUDIT METHODOLOGY

NMC, Water Audit & Leak Detection DPR, Water Audit Methodology
Shah Technical Consultants Pvt. Ltd, Mumbai 13
Water Audit Methodology (For Quantum of water Purchased by NMC)
1.0] INTRODUCTION :- The problems of water and revenue losses are : • Technical : not all the water supplied by a water utility reaches the customer. • Financial & Economic : not all the water supplied is paid for. • Terminology : lack of standardized definitions of water and revenue losses. The objectives of this chapter is : • Explained the standard terminology used for water audit. • Procedure given for calculation of annual volume of real and apparent losses from
a Water Balance. • Recommend the most appropriate Performance Indicators for water audit use. The actual quantity of water lost from a water distribution system will vary from utility
to utility depending upon local factors such as topography, length of mains, number of connections and standards of service, and upon how well the system is being operated and maintained. In a well operated system, water losses should be continuously monitored and controlled, and noted each year in an annual report.
The annual volume of losses consist of two separate types of losses – Real
(physical) and Apparent (non-physical), which are described in below : 2.0] IMPORTANCE OF MEASUREMENT & METERING :- Reliable metering of all water volumes should and must be an integral component of
water supply, water demand management and loss determination (Figure-1). The most important part of determining how much water is being lost in a system is to accurately quantify the volume of water which is entering that system. Metering of source meters for abstraction, treatment works production, imported and exported water, input volumes and inflows to sectorised distribution systems is essential for water balance calculations.
Measurements of night flow into sectors of the distribution system are extremely
useful for rapidly identifying the presence of new unreported leaks, which can then be located and quickly repaired. This technique can be used irrespective of whether customers are metered or un-metered.
The primary purpose of customer meters is generating economic revenue based on
metered consumption, but the accuracy of these meters is also a key issue in water balance calculations. Customer meters require careful management if representative and significant results are to be obtained.

NMC, Water Audit & Leak Detection DPR, Water Audit Methodology
Shah Technical Consultants Pvt. Ltd, Mumbai 14
An efficient organization will recognize and will deal with potential problems such as improper meter type or meter sizing, incorrect meter installation, meter encrustation, deterioration with age, flow rates less than the meter can reliably register, insufficient maintenance/replacement, frequency of calibration, inability to obtain readings, and influence of meter reading cycles.
Whenever actual metering is not possible, for example in activities such as stand
post, etc., every effort should be made to estimate each component of water use accurately to determine realistic quantities for the water balance.
Figure No. - 1
3.0] IMPORTANT DEFINITIONS FOR WATER AUDIT USE :- Any discussion relating to losses must be preceded by a clear definition of the water
balance components and supplementary data use in water supply. However, there are significant differences in the definitions used in different countries. The IWA ‘Best Practice’ terminology in (Figure-2) below has been selected from countries which already have their own well-documented (but different) standard national procedure and terminology for Water Balance (France, Germany, Japan, UK & USA).
So, each national terminology differs from the IWA standard to some extent, not least
because of different languages. Accordingly, when undertaking an international comparison or benchmarking study, it is necessary to first re-allocate the components of the national water balance into the same components as shown in (Figure-2). Where India do not yet have a standard for such calculations, the IWA standard terminology as shown in (Figures-1&2) is proposed as a model version for consideration. This terminology includes the following definitions :

NMC, Water Audit & Leak Detection DPR, Water Audit Methodology
Shah Technical Consultants Pvt. Ltd, Mumbai 15
“Water Abstracted” is the volume of water obtained for input to raw water mains leading to water treatment plants.
“Water Produced” is the volume of water treated for input to water transmission
mains or directly to the distribution system. “Water Imported and Exported” relates to the volumes of bulk transfers across
operational boundaries. “System Input Volume” is the volume of water input to a transmission system or a
distribution system. “Authorised Consumption” is the volume of metered and/or un-metered water taken
by registered customers, the water supplier and others who are implicitly or explicitly authorized to do so by the water supplier, for domestic, commercial and industrial purposes. It includes water exported.
Note that authorized consumption (Figure-2) includes items such as fire fighting and
training, flushing of mains and sewers, street cleaning, flushing of mains and sewers, street cleaning, watering of municipal gardens, public fountains, frost protection, building water. These may be billed or unbilled, metered or un-metered according to local practice.
“Water Losses” of a system are calculated as : Water Losses = System Input Volume – Authorised Consumption. Water losses can be considered as a total volume for the whole system, or for partial
systems such as raw water mains, transmission or distribution. In each case the components of the calculation would be adjusted accordingly. Water losses consist of Real and Apparent losses, and are effectively identical to the previous IWSA definition(1) of Unaccounted for Water.
“Real Loses” are physical water losses from the pressurized system, up to the point
of customer metering. The volume lost through all types of leaks, bursts and overflows depends on frequencies flow rates, and average durations of individual leaks.
“Apparent Losses” consist of unauthorized consumption (theft or illegal use), and all
types of inaccuracies associated with production metering and customer metering. Under-registration of production meters, and over-registration of customer meters, leads to under-estimation of real losses. Over-registration of production meters, and under-registration of customer meters, leads to over-estimation of Real Losses.
“Non-Revenue Water” is the difference between the System Input Volume and Billed
Authorised Consumption (Figure-2).

NMC, Water Audit & Leak Detection DPR, Water Audit Methodology
Shah Technical Consultants Pvt. Ltd, Mumbai 16
WATER AUDIT WORK SHEET
A B C D E
Billed Authorised Consumption
Billed Metered Consumption (including water exported
Revenue Water
M3/year Billed Un-metered* Consumption M3/year
Authorised Consumption
Unbilled Authorised
Consumption
Unbilled Metered Consumption
M3/year M3/year Unbilled Un-metered Consumption
Apparent Losses Un-authorised Consumption
M3/year Metering Inaccuracies
Real Losses Leakage on Transmission and/or Distribution Mains
System Input
Volume
Water Losses
Leakage and Overflows at Utility’s Storage Tanks
Non-Revenue Water**
M3/year M3/year M3/year
Leakage on Service Connections up to point of Customer metering M3/year
• Difficult has been experienced in completing the water balance with reasonable accuracy where a
significant number of customers are not metered. In such cases, authorized un-metered consumption has been derived from sample metering of sufficient numbers of statistically representative individual connections of various categories, and/or by measurement of inflow into discrete areas of uniform customer profile (with data adjusted for leakage and diurnal pressure variations as appropriate).
** The IWA Task Force of Performance Indicators recommends that, if the term ‘Unaccounted-for-Water’ (UFW) is used, it should be defined and calculated in the same way as ‘Non-
Revenue Water’ (NRW) in the above Table. Steps for Calculating Non-Revenue Water and Water Losses
Step-1 : Define System Input Volume and enter in Col. A
Step-2 : Define Billed Metered Consumption and Billed Un-metered Consumption in Col. D; enter total in Billed Authorised Consumption (col. C) and Revenue Water (Col. E)
Step-3 : Calculate the volume of Non-Revenue Water (Col. E) as System Input Volume (Col. A) minus Revenue Water (Col. E).
Step-4 : Define Unbilled Metered Consumption and Unbilled Un-metered Consumption in Col. D; transfer total to Unbilled Authorised Consumption in Col. C.
Step-5 : Add volumes of Billed Authorised Consumption and Unbilled Authorised Consumption in Col. C; enter sum as Authorised Consumption (top of Col. B)
Step-6 : Calculate Water Losses (Col. B) as the difference between System Input Volume (Col. A) and Authorised Consumption (Col. B).
Step-7 : Assess components of Un-authorised Consumption and Metering Inaccuracies (Col. D) by best means available, add these and enter sum in Apparent Losses (Col. C)
Step-8 : Calculate Real Losses (Col. C) as Water Losses (Col. B) minus Apparent Losses (Col. C)
Step-9 : Assess components of real losses (Col. D) by best means available (night flow analysis, burst frequency/flow rate/duration calculations, modeling etc.), add these and cross-check with volume of Real Losses in Col. C which was derived from Step-8.
Figure No.-2
Components of Water Balance for a Transmission System or a Distribution System.

NMC, Water Audit & Leak Detection DPR, Water Audit Methodology
Shah Technical Consultants Pvt. Ltd, Mumbai 17
4.0] WATER AUDIT WORK-SHEET & STEPS FOR CALCULATING NON-REVENUE WATER & WATER LOSSES :-
The best practice in management of water losses consists of a combination of
continuous water balance calculations together with night flow measurements on a continuous or ‘as required’ basis. The water balance, usually taken over a 12-months period, should include :
• a thorough accounting of all water into and out of a utility system, including
inspection of system records. • an ongoing meter testing and calibration program. • due allowance for the time lags between production meter reading and customer
meter reading. The water balance calculation quantifies volumes of total water into the system,
authorized consumption (billed and unbilled, metered and un-metered) and water losses (apparent and real), see (Figure-2). Where continuous leak detection is not being practiced, the process may also include a benefit cost analysis for recovering excess leakage, leading to a leak detection program.
All water balance calculations are approximate to some degree because of the
difficulty of assessing all the components with complete accuracy. The reliability is likely to be greatest when input volumes are purchased (with duplicate metering), and all water is measured through regularly maintained accurate customer meters supplying properties which do not have storage tanks. Storage tanks can result in low flow rates through service connections, and these low flows may not register accurately on the customer meter.
Step 9 of the calculation process recommends that volumes of Real Losses
calculated by difference between Water Losses and Apparent Losses should be checked if possible by assessing the individual components of Real Losses from first Principle. A much improved understanding of Real Losses can be obtained by classifying components as follows :
• Background losses from very small undectable leaks – typically low flow rates,
long duration, large volumes. • Losses from leaks and bursts reported to the NMC – typically high flow rates,
short duration, moderate volumes. • Losses from unreported bursts, found by active leakage control (ALC) – medium
flow rates, but duration and volume depends on ALC policy. • Overflows at, and leakage from, service reservoirs. Methods of assessing Real Losses, other than from Water Balances, include : • analyzing zonal flows based on test zone meter data. • recording numbers and types of leaks and bursts and their average flow rates and
durations.

NMC, Water Audit & Leak Detection DPR, Water Audit Methodology
Shah Technical Consultants Pvt. Ltd, Mumbai 18
• modeling calculations which allow for background leakage and pressure. Although physical losses after the point of customer metering are excluded from
assessment of Real Losses under this definition, they can sometimes be highly significant and worthy of attention for demand management purposes.

NINE TASKS OF WATER AUDIT AND
LEAK DETECTION

NMC, Water Audit & Leak Detection DPR, Nine Tasks of Water Audit & Leak Detection
Shah Technical Consultants Pvt. Ltd, Mumbai 19
Nine Tasks of Water Audit & Leak Detection The total water audit & leak detection program has been carried out in Nine tasks as explained below :- TASK-1 System Input Volume :- 1.1] Water Input or Purchase from Irrigation Department :- Is the volume of water input to a transmission system or purchased from
Irrigation Department (ID). System input volume has been considered as water off-take from Mahadula
Canal (Raw Water Pump House), Kanhan River and Gorewada Tank.
a) Water Input from Mahadula Raw Water Pump House (based on actual flow measurement) 376 Mld ≅137 mm3
b) Water Input from Kanhan at Kanhan (based on actual flow measurement) 121 Mld ≅44 mm3
1.2] Raw Water Intake :- Raw water charges paid to Irrigation Department.
a) Raw water charges for Mahadula 167 mm3
b) Raw water charges for Kanhan 55 mm3
TOTAL 222 mm3
Total raw water quantity paid to Irrigation Department ≅608 Mld
Raw water from Gorewada tank of NMC (5.83 mm3) 17 Mld
TOTAL Raw Water Intake 625 Mld
A B C D E
System Input Volume
1. Identify and map sources.
2. Measure the water from each sources.
3. Adjust the figures for total supply.
625 mld

NMC, Water Audit & Leak Detection DPR, Nine Tasks of Water Audit & Leak Detection
Shah Technical Consultants Pvt. Ltd, Mumbai 20
TASK-2 Billed Metered Consumption & Billed Un-metered Consumption :- (Average quantity has been taken into account for Billing as per consumer data
(2003-2004).
i) Dharampeth Zone-I 48.16 MLD
ii) Laxminagar Zone-II 33.80 MLD
iii) Hanuman Nagar Zone-III 11.08 MLD
iv) Dhantoli Zone-IV 19.21 MLD
v) Nehrunagar Zone-V 16.99 MLD
vi) Sokta Bhavan Zone-VI 25.74 MLD
vii) Satranjipura Zone-VII 22.14 MLD
viii) Lakadganj Zone-VIII 9.55 MLD
ix) Ashinagar Zone-IX 15.31 MLD
x) Mangalwari Zone-X 39.27 MLD 241.380 MLD
A B C D E
Billed Metered Consumption
(Including water exported)
Billed Authorised
Consumption
241 mld Billed Un-metered Consumption
Revenue Water
(Total billed quantity)
mld
System Input Volume
625 mld

NMC, Water Audit & Leak Detection DPR, Nine Tasks of Water Audit & Leak Detection
Shah Technical Consultants Pvt. Ltd, Mumbai 21
TASK-3 Calculate the Volume of Non-Revenue :- Non Revenue Water = System Input Volume (Column-A) – Revenue Water (Column-
E).
A B C D E
Billed Metered Consumption
(Including water exported)
Billed Authorised
Consumption 241 mld
Billed Un-metered Consumption
Revenue Water
241 mld
System Input Volume
625 mld
Non-Revenue
Water (System Input
volume – Revenue Water)
384 mld
TASK-4 Calculate the Unbilled Authorised Consumption (Metered & Unmetered
Consumption) :- There are following unbilled authorized consumption are identified during water audit
study. i) Public stand post water supply appx. 6500 (0.22 LPS X 3 hrs.) ii) Tanker water supply iii) NMC offices, Schools, Hospitals. iv) Public Parks & Gardens (old). v) Public Urinals. vi) Un-metered unbilled connections – 7200. 1.1] Estimated Water Supply from Public Stand Post :- NMC has appx. 6500 nos. of stand post in all 10 zones. Most of the stand
posts were found without tap fixed on it and water was continuously flowing irrespective of productive use.
The volumetric flow measurement sample population spread in all ten water
distribution zone with supply hrs.

NMC, Water Audit & Leak Detection DPR, Nine Tasks of Water Audit & Leak Detection
Shah Technical Consultants Pvt. Ltd, Mumbai 22
The average flow rate 0.220 LPS
The average supply hours 3 hrs. / day
Total no. of authorised stand post
6500 appx.
6500 X 0.220 X 3600 X 3 Estimated water flow per day
10,00,000 = 15.44 Mld
Cost of water Rs. 5,550 / mld
Cost of water / day Rs. 85,714/-
Cost of water supply / year Rs. 3.13 crore.
Observations :- i) No taps on stand post. ii) No norms were followed for number of stand post vs population serve. iii) People are using flowing water of stand post for bathing & cloth washing. iv) Many places 24 hrs. water available on stand post. v) No policy for grant of new stand post. vi) Many of the stand post connections are in broken conditions & become
source to polluted water. Recommendations :- i) NMC shall provide individual house connections to slum dwellers and
shall start removing the stand post. ii) NMC shall restrict water supply through stand post @40 lpcd as per
CPHEEO norms wherever stand post can not be removed. iii) No. of stand post shall be restricted to as per 200 souls in slums as first
step towards removal of stand post. iv) No stand post shall be given to the areas other than slums. 1.2] Tanker Water Supply :- NMC provides water supply by tanker at free of cost where piped water supply
is not available. Appx. 250 trips / day of 4000 ltrs. tankers to cater mostly outer side of city i.e.
Wadi, Dhaba, South-East Nagpur etc. Estimated water supply per day

NMC, Water Audit & Leak Detection DPR, Nine Tasks of Water Audit & Leak Detection
Shah Technical Consultants Pvt. Ltd, Mumbai 23
250 X 4000 ltrs. = 1 mld 10,00,000 Supply through tanker increases in summer by 50% for three months cost of
water with tanker distribution Rs. 200 / trip = Rs. 50.00 per thousand ltrs. 4,000 Add water cost5.55 + 50.00 = Rs. 55.55 / 1000 ltrs. Additional cost / year 1000 units X 365 X 55.55 = Rs. 2.02 crore inclusive of water cost. Observations :- i) As water cost / 1000 ltrs. for NMC @Rs. 5.55 inclusive of water cost
increases to Rs. 55.55 / 1000 ltrs. for tanker supply without income. ii) NMC shall immediately take action to bring all the areas under piped
water supply. iii) Although only 1.0 mld of water supplied out of 500 mld water through
tanker, it constitute major share of complaints from elected members and general public (about 50%).
iv) Only 00.20% of water supplied through tanker but it takes much of
productive time of NMC officials as consumer served by tankers are also not satisfied and they waste good amount of productive man hours every day.
Recommendations :- i) NMC shall arrange to bring the area served by tankers under piped
network on priority basis. ii) NMC shall charge the water supply by tanker at subsidized rates instead
of supplying at free of cost. Action Taken by NMC :- In the year 2004-2005 NMC has provided appx. 12.0 crore for expansion / up-
gradation of distribution network with the objective of providing relief to areas served by tankers it is expected that 100 trips / day can be reduced after expansion of network.

NMC, Water Audit & Leak Detection DPR, Nine Tasks of Water Audit & Leak Detection
Shah Technical Consultants Pvt. Ltd, Mumbai 24
1.3] NMC Offices, Schools, Hospitals, Gardens & Urinals :- NMC has following infrastructure with appx. 13,500 employees. A) NMC Schools :-
Nurseries 98 Nos.
Primary Schools 271 Nos.
Higher Primary Schools 61 Nos.
Middle School 22 Nos.
Jr. College & Others 03 Nos.
Appx. 70,000 students in above Institutes. B) Others :-
NMC Gardens 38 Nos.
Gymnasium 08 Nos.
Badminton Hall 01 No.
Stadium 02 Nos.
Fire Stations 06 Nos.
NMC Offices Central offices at Civil Lines & Mahal, 10 zonal offices etc.
The calculation of water consumption in NMC properties was very
difficult as no metering was provided, however with calculation as per prescribed norms given in CPHEEO manual for specific use is given below.
Description Estimated Water Consumption
NMC Hospitals (appx. 150 bed X 180 lpcd) 27,000 Ltrs.
NMC Schools (70,000 X 30 ltrs.) 21,00,000 Ltrs.
NMC employees in all offices (13,500 X 30 X 2) inclusive of visitors for visit.
8,10,000 Ltrs.
NMC Gardens 38 nos.
(0.220 X 38 X 3600 X 3 hrs.)
90,000 Ltrs.
Public Urinal appx. 100 nos. (0.220X100X3600X3 hrs.)
2,37,600 Ltrs.
TOTAL 32,64,600 Ltrs.
SAY 3.65 Mld
Cost of Water Rs. 3.65 X 5550 X 365 0.74 Crore

NMC, Water Audit & Leak Detection DPR, Nine Tasks of Water Audit & Leak Detection
Shah Technical Consultants Pvt. Ltd, Mumbai 25
Note :- Calculations given above are only for indicative consumption, actual
consumption shall be calculated by fixing of flow meter at each consumption point.
Recommendations :- NMC, Water Works Department shall install the meter send the bills to all
NMC offices, atleast for quantity supplied. 1.4] Authorised Unbilled Consumption :- The detailed consumer survey in 144 test zones under ten water distribution
zones of NMC covering 11906 connections about 3.61% of connections found without billing, but authorized by NMC. The detailed investigation of matter reveals that records has been missing at billing department while paper movement from various section or records was missing while updating or any other reasons.
Based on above survey which was spread all over Nagpur city (Refer Index
Plan & Summary of Consumer Survey for Water Audit, Leak Detection Plan) the estimated numbers unbilled authorized consumers area.
Total no. of connections appx. 2.0 lakhs 2,00,000 X 3.61% X 100 = Say 7200 Appx. consumption @0.220 LPS X 7200 X 3600 X 3 = 1.55 mld Appx. cost of water supplied 1.55 X 5550 X 365 = 0.30 Crore Hence Total authorized unbilled water consumption
Sr. No.
Description Water Consumpti
on (mld)
Annual Cost of Water (Rs.
in Crore)
(i) Estimated water supply from public stand post (appx. nos. 6500)
15.44 3.13
(ii) Tanker water supply (250 trips / day) 1.00 2.02
(iii) NMC buildings, gardens, schools, hospitals, urinals etc.
3.65 0.74
(iv) Authorised unbilled consumption 1.55 0.30
Total estimated un-metered / unbilled water consumption 21.64 6.19
SAY 22.00 6.20

NMC, Water Audit & Leak Detection DPR, Nine Tasks of Water Audit & Leak Detection
Shah Technical Consultants Pvt. Ltd, Mumbai 26
A B C D E
Billed Metered Consumption
(Including water exported)
Billed Authorised
Consumption 241 mld
Billed Un-metered Consumption
Revenue Water
241 Mld
Unbilled Metered Consumption
Unbilled Authorised
Consumption
22 mld Unbilled Un-metered
Consumption
System Input Volume
625 mld
Non-Revenue
Water (System Input volume – Revenue Water)
384 mld
TASK-5 Calculate Authorised Consumption :- Authorised Consumption = Billed Authorised Consumption (Top of Col.B) + Unbilled Authorised Cosumption
A B C D E
Billed Metered Consumption
(Including water exported)
Billed Authorised
Consumption 241 mld
Billed Un-metered Consumption
Revenue Water
241 Mld
Unbilled Metered Consumption
Authorised Consumption (Billed Authorised
Consumption + Unbilled Authorised
Consumption)
263 mld Unbilled
Authorised Consumption
22 mld Unbilled Un-metered
Consumption
System Input
Volume
625 mld
Non-Revenue
Water (System Input volume – Revenue Water)
384 mld

NMC, Water Audit & Leak Detection DPR, Nine Tasks of Water Audit & Leak Detection
Shah Technical Consultants Pvt. Ltd, Mumbai 27
TASK-6 Calculate Water Losses :-
Water Losses = System Input Volume (Col.-A) - Authorised Consumption
A B C D E Billed Metered Consumption
(Including water exported)
Billed Authorised
Consumption 241 mld
Billed Un-metered Consumption
Revenue Water
241 Mld
Unbilled Metered Consumption
Authorised Consumption (Billed Authorised
Consumption + Unbilled Authorised
Consumption)
263 mld Unbilled Authorised
Consumption 22 mld Unbilled Un-metered
Consumption
System Input
Volume
625 mld
Water Losses (System Input
Volume – Authorised Consumption)
362 mld
Non-Revenue
Water (System Input volume – Revenue Water)
384 mld
TASK-7 Calculate The Apparent Losses :-
Apparent Losses = Un-authorised Consumption + Metering Inaccuracies 1.1] Un-authorised Consumption :- From detailed consumer survey of 144 test zones, appx. 2715 of total 11906
consumers were found illegal, which is 22.80% of total consumers (Refer Annexure-3).
Estimated illegal consumer’s appx. 22.80% is 45,600 Consumers (22.80% of 2.0 lakhs consumers) Estimated water consumption 54.16 mld (0.165 X 2 hr. X 3600 X 45,600) The cost of water consumption appx. 11.00 Crore / year. (@Rs. 5.55 per Unit)
CONSUMER SUMMARY FOR SELECTED 144 TEST ZONES
Legal, 64.19%
Illegal, 22.80%
No Connection, 8.66%
ILGL Billing , 0.74%
No Billing, 3.61%
Refer Annexure-3

NMC, Water Audit & Leak Detection DPR, Nine Tasks of Water Audit & Leak Detection
Shah Technical Consultants Pvt. Ltd, Mumbai 28
1.2] Metering Inaccuracies :- A] Raw Water Measurement Losses to NMC :- A-1] Raw Water From Mahadula Pumping Station :-
As per Irrigation demand from NMC at Mahadula Canal (167 mm3 for 2003-2004) based on rated capacity of pump
*458 Mld
As per actual Measurement, estimated water lifting (137 mm3 for 2003-2004)
*376 Mld
Excess measurements or 30 mm3/annual (21.8%) 82.00 Mld
A-2] Losses at Kanhan Pump House :-
Water charges paid to Irrigation Department 55 mm3
*150.70 Mld
Estimated water lifting from Kanhan (based on actual flow measurement)
121.00 Mld
Excess measurement & payment to Irrigation dept. (10.84 mm3/year)
29.70 Mld
*Annual average. 1. NMC purchase the raw water from Irrigation Department at PRBC
Mahdula & Kanhan River. 2. No meter was installed at raw water offtake points. 3. Raw water charges were taken by Irrigation Department, based on
pump rating capacity. 4. Water audit study reveals that appx. 20% excess payment are being
made to Irrigation Department, the details are given below Hence total apparent losses at Raw Water off-take point to pure water
sump is given below :
Excess Billing Sr. No.
Description
In mm3 In Rs. (Lakhs)
1) Real losses (only for Pench water) 30.00 180
Excess water lifting charges at Kanhan @1.38 lakhs/mm3
10.80 15 2)
TOTAL 40.80 195
≅≅112 mld

NMC, Water Audit & Leak Detection DPR, Nine Tasks of Water Audit & Leak Detection
Shah Technical Consultants Pvt. Ltd, Mumbai 29
B] Measurement Losses in Distribution System :- As per NMC record found to be 55% are working meter however after detailed
consumer survey of 144 test zone it was found that only 706 metered connection out of total 6595 metered connections were billed as per actual meter reading i.e. less than 11%. 46% were billed as per average reading, 42% were billed as per minimum billing (Refer table type of billing Annexure-7).
CONSUMER BILLING PATTERN FOR 144 SELECTED TEST ZONES(Others include slum, disconnections and unauthorised)
Actual11%
Average45%
Others2%
Minimum42%
The above figures suggest that appx. 89% of metered consumers are billed
without considering of actual readings. Preliminary study suggest appx. 20% under billing has been carried out due to
non-works of meters, hence (0.20 X 241 mld = 48.2 mld). Detailed study is under progress to estimate the actual UFW in this account
after installation of meters at consumer location (Refer chapter on leak detection plan).
The cases were found that average billing is continued even house has been
expanded to multi-storied building with increase consumption. • The discounting of NMC bills are regular practice, if consumer goes with
complaint of higher bill, the office-in-charge offer the discount or minimum billing as settlement as there is no working meter or authentic meter reading records are available with him to argue with consumer.
• Meter readers who are employees of NMC are not visiting to most of the
meter site before submitting the reading details. The officer-in-charge does not have any control over meter reader.
• Bills for regularized illegal connection (past drive) total 33,554 consumers
can not be distributed as, the regularization drive initiated in past was in waste and no proper record of property, address were kept. Bills are printed based on average consumption and kept at zonal offices without distribution.
• Bulk consumer appx. 1400 nos. (out of total 2.0 lakhs consumers) are
contributing 50% in total receipt (25 crore/year) where bills are prepared as per actual meter reading on monthly basis and controlled by head office of Water Works Department.

NMC, Water Audit & Leak Detection DPR, Nine Tasks of Water Audit & Leak Detection
Shah Technical Consultants Pvt. Ltd, Mumbai 30
It is an important lesson for future regularization program to maintain the proper record to trace the consumer for meter reading, distribution and recovery of bills.
The metering inaccuracies observed as a major component of UFW and hence
detailed study is initiated in 144 test zone. NMC has finalized the tender for high quality Class-B consumer meter and bulk meter to install at 1% consumer of test zone to estimate the metering inaccuracies and decide the metering policies.
• The water audit study suggested then metering at raw water off-take point
itself can save appx. 20% of raw water charges to the tune of 1.95 crore / year with investment of less than 30 lakhs with payback period of just over 2 months.
• The accounting of water should start from zonal level & performances shall
be assessed based on quantum of water received by zone and quantum of water sold to customer (billed or unbilled) and this accountability shall go down to ESR area to sub zones to individual consumer. Hence it was recommended to install the flow meter at each ESR inlet to start a better accountability for each zone on water receipt and water sold.
• Private participation in water distribution, meter installation, meter readings,
bills preparation, bills distribution shall be encouraged as such a important revenue source of NMC has been ignored and causing major losses to water works accounts.
The detailed action plan will be suggested after study of installation of meters.
A B C D E
Billed Metered Consumption
(Including water exported)
Billed Authorised
Consumption 241 mld
Billed Un-metered Consumption
Revenue Water
241 Mld
Unbilled Metered Consumption
Authorised Consumption (Billed Authorised
Consumption + Unbilled Authorised
Consumption)
263 mld Unbilled
Authorised Consumption
22 mld Unbilled Un-metered Consumption
Un-authorised Consumption
54.16 mld
Apparent Losses 214.36
mld Metering Inaccuracies
(112 + 48.20)
*160.20 mld
System Input
Volume
625 mld
Water Losses (System Input
Volume – Authorised Consumption)
362 mld
Non-Revenue
Water (System Input volume – Revenue Water)
384 mld
*Study for metering inaccuracies of consumer meters are under progress.

NMC, Water Audit & Leak Detection DPR, Nine Tasks of Water Audit & Leak Detection
Shah Technical Consultants Pvt. Ltd, Mumbai 31
Hence actual apparent losses can only be estimated after detailed study & figures given are subject to revise (Refer chapter on Leak Detection Plan).
TASK-8 Calculate Real Losses :- Real Losses = Water losses (Col.-B) – Apparent losses (Col.-C)
A B C D E Billed Metered Consumption
(Including water exported)
Billed Authorised
Consumption 241 mld
Billed Un-metered Consumption
Revenue Water
241 Mld
Unbilled Metered Consumption
Authorised Consumption (Billed Authorised
Consumption + Unbilled Authorised
Consumption)
263 mld Unbilled Authorised
Consumption 22 mld Unbilled Un-metered
Consumption
Un-authorised Consumption
54.16 mld
Apparent Losses 214.36 Mld
Metering Inaccuracies 160.20 mld
Water Losses (System Input
Volume – Authorised Consumption)
362 mld Real Losses (Water Losses –
Apparent Losses)
147.64 mld
Non-Revenue
Water (System Input volume – Revenue Water)
384 mld
System Input
Volume
625 mld
*Unidentified Water Losses
*Unidentified water losses included in Real losses. TASK-9 Assessment of Real Losses :- There are following sources of real losses in water system. i) Leaks at raw water transmission. ii) Evaporation losses. iii) Water treatment losses. iv) Leaks / seepage of reservoirs. v) Overflows of reservoirs. vi) Leaks of distribution mains. vii) Leakages from valves & air valves. viii) Leakages from service connections upto meter. ix) Leakages in consumer premises after the meter (not in scope of water audit).

NMC, Water Audit & Leak Detection DPR, Nine Tasks of Water Audit & Leak Detection
Shah Technical Consultants Pvt. Ltd, Mumbai 32
The first three loses are calculated and action plan is given separately as it required special attention.
The methodology adapted for leak detection program for NMC has been given in
next chapter and study is likely to in details. Complete within next three months, immediately after installation of zonal flow meters
and consumer meters. Measuring & estimating losses from discovered leaks the following methods has
been adapted for measuring & estimating losses for discovered leaks are. i) Bucket and stop watch methods. ii) Portable Ultrasonic Flow Meter. iii) Volumetric measurement. iv) Measurements by partially filled pipe, V-notch etc. The detailed list of discovered leaks with water loss figures are given below and
detailed calculations are given in separate chapter. 1.1] Input Volume in Distribution System :-
Actual system input volume in to distribution system (Refer Task-1(B) of Preliminary Report)
490 Mld
Pench Water 560.97 MLD
i) Gorewada (Old) 15.263
ii) Pench-I 112.047
iii) Pench-II 151.689
iv) Pench-III *127.137
TOTAL 406.156
*Note Pench-III had been reduced to 100 mld after reduction in water level at Gorewada and valve failure
Hence net Inflow 379.019
Less 2% meter error (-) 7.580
A]
Net Inflow from Pench 371.439
Kanhan Water 121.430
Less 2% meter error 2.420
Net Inflow from Kanhan WTP 119.000
Hence Net Inflow to Distribution System (A+B) 490.430 MLD
B]
SAY 490.000 MLD

NMC, Water Audit & Leak Detection DPR, Nine Tasks of Water Audit & Leak Detection
Shah Technical Consultants Pvt. Ltd, Mumbai 33
Based on preliminary study minimum distribution losses are estimated at appx. 15% of input volume into distribution system. The UFW on account of losses in distribution system including service connections upto consumer meter & metering errors shall be estimated accurately only after completion of detailed study of 144 test zones in 31 ESR/GSR command areas. The detailed leak detection plan is explained in next chapter.
Hence minimum distribution losses is 15% X 490 mld = 73.50, Say 75 mld. 1.2] Real Losses :- A] Raw Water Transmission Losses :- Raw water pumping main of 5.730 k.m. length between Mahadula Raw
Water Pumping and Gorewada BPT was surveyed by water audit team and observed the leakages on Air Valve near Gondhni and measurement were taken and given in leak detection chapter estimated transmission losses are 0.009 Mld.
B] Evaporation Losses at Gorewada :- Nagpur being hot & dry for six months in a year and estimated
evaporation rate is 1.6 Mtr./year and with capacity curve the evaporation loses at Gorewada was estimated.
Avg. water level at Gorewada 315 – 312 msl
Capacity of Gorewada Tank between 315-312 3.19 mm3
Rate of evaporation :- Oct. to Feb. (4.4. mm/day) 660 mm
Rate of evaporation :- March to May (10 mm/day) 900 mm
Rate of evaporation :- June to Sept. (mansoon) negligible
-
TOTAL 1560 MM
(Ref. :- Hydro meteorological Parameters given at www.cgwbnagpur.gov.in)
Hence annual evaporation losses (50% of 3.19 mm3)
1.60 mm3 ≅ 4.38 Mld
C] Leakages at Gorewada :-
Partially filled 450 mm pipe with half filled pipe was estimated (Ref. Annexure-2 major leak detection page L-2)
4.74 Mld
Note :- The Fetri Rural Water Supply Scheme is designed based on
losses from Gorewada tank.& old Goreada WTP leakages.

NMC, Water Audit & Leak Detection DPR, Nine Tasks of Water Audit & Leak Detection
Shah Technical Consultants Pvt. Ltd, Mumbai 34
D] WTP Losses :- The total WTP losses for old-Gorewada, Pench-I, II & III are measured
as follows (Ref. Annexure-2, Page-40)
Old Gorewada WTP losses 0.27 Mld
Pench-I WTP losses 3.48 Mld
Pench-II WTP losses 3.06 Mld
Pench-III WTP losses 0.55 Mld
TOTAL 7.37 Mld
Hence total real losses from Mahadula pumping station to WTP (upto
pure water sump) is
(A) + (B) + (C) + (D) [0.009 + 4.38 + 4.74 + 7.37] 16.50 Mld
E] Losses from Kanhan :-
Kanhan WTP with back wash water (Old WTP with filter bed)
2.63 Mld
Kanhan WTP with back wash water (new WTP with filter bed)
3.35 mld
Kanhan WTP losses (overflow leakages excluding backwash & others
4.55 mld
TOTAL 10.53 mld
Total real losses upto pure water pump houses (Kanhan + Pench) –
27.03 1.3] Water Losses at Seminary Hills MBR :- Real losses i) Seepage from GSR, ii) Leakages on air valves and iii) Leakages
from pipe line / valves. Seminary hills MBR has been located at highest contour of city with G.L. of
349.70 MSL. Hence all the leakages from MBR premises are formed in two water streams, visible on slope of the hill and hence measurements has been taken at following two location.
1) Slope of hill at WCL side. 2) Slope of hill at “Ludhra Mata” Church. Assuming 20% of water being percolated in the ground.

NMC, Water Audit & Leak Detection DPR, Nine Tasks of Water Audit & Leak Detection
Shah Technical Consultants Pvt. Ltd, Mumbai 35
1.4] Water Losses at Pure Water Transmission Main :- Water losses at pure water transmission main has been detected at following
places. 1] Kanhan pure water pumping main – joint leakages at many places. 2] Air valve lakages. 3] Un-authorised use of scour valve at Pilli Nadi by slum population. 4] Estimation of water losses at joint leakages with average 5 mm opening
and pressure of appx. 40 mtr. of water column is 28 LPM X 12 = 280 LPM = 0.6 Mld

NMC, Water Audit & Leak Detection DPR, Nine Tasks of Water Audit & Leak Detection
Shah Technical Consultants Pvt. Ltd, Mumbai 36
5] Air valve leakages (Ref. calculation sheet) :- The estimated water losses
through air valves were calculated on different air valves.
Real losses :- i) Pipe Joints, ii) Air Valves, iii) Corrosion / Old age of pipe. Apparent losses :- i) Illegal tappings, ii) Unknown branches.

NMC, Water Audit & Leak Detection DPR, Nine Tasks of Water Audit & Leak Detection
Shah Technical Consultants Pvt. Ltd, Mumbai 37
1.5] Water Losses in Distribution System :- 1] Real water losses in distribution system :- There are following reasons
for real water losses in distribution system. a) Service connections :- It contributes 15% of total leakage points reported by active leak
control program of NMC. b) Pipe joints :- 41% of total joints failures are in 100 mm pipe. c) Valves :- Appx. 1400 value leakages cases reported in year. d) Pipe burst :- 90% of total pipe leakages are in <=100 mm diameter of pipe line. e) Illegal tapping holes on pipe line :- The maintenance record of active leak reduction program shows details of total
5471 detected leaks in 8 zones out of total 10 zones. 1.6] Other Losses :- During leak detection program various leaks were discovered and measured as
given in annexure-2 the summary of real losses are given below.
Summary of Discovered Real Losses (Transmission Mains)
Sr. No.
Description Life of
Leakage [Years]
Supply Hrs.
Water Loss in
MLD
1 Backwash Water Leakage at WTP, Pench -II [Lead Joint Leakage]
1/12 24 0.403
2 Kanhan Line [Air Valve Leakage Infront of Fookat Nagar,Chamar Nallah]
1 24 0.075
3 Pure Water Rising Main, From WTP to Seminery Hills.Gorewada, [Sluice Valve Leakage]
1 24 0.061
4 Seminary Hills MBR [Pench-II] Air Valve Leakage
5 24 0.069
5 Pure Water Supply Main, From Seminary Hills, Lourd Mata Mandir [Pipe Leakage]
1 24 0.060

NMC, Water Audit & Leak Detection DPR, Nine Tasks of Water Audit & Leak Detection
Shah Technical Consultants Pvt. Ltd, Mumbai 38
Sr. No.
Description Life of
Leakage [Years]
Supply Hrs.
Water Loss in
MLD
6 Seminary Hills [MBR Seepage, Near Mini Railway Track] 20 24 0.468
7 Loha Pulliya [Lead Joint Leakage at Wanjari Nagar ESR Feeder] 1 24 0.215
8 Opp. Arun Automobile [Air Valve Leakage, Ghat Road]
1 24 0.012
9 Murgiwala Valve [Near Tukdoji Putla] 3 5 0.012
10 Seepage loss at Fort GSR >15 24 0.149
Total 1.524
DETAILED WATER AUDIT WORK SHEET (DRAFT)
A B C D E
Billed Metered Consumption (Including
water exported)
Billed Authorised
Consumption 241 mld
Billed Un-metered Consumption
Revenue Water
241 Mld
Unbilled Metered Consumption
Authorised Consumption
(Billed Authorised
Consumption + Unbilled
Authorised Consumption)
263 mld Unbilled
Authorised Consumption
22 mld Unbilled Un-metered Consumption
Un-authorised Consumption
54.16 mld
Apparent Losses
214.36 mld Metering Inaccuracies
160.20 mld
Leakages on Transmission and/or Distribution Mains
1.50 mld*
Leakages and Overflows at Utility’s Storage Tanks/WTP
27.65 mld
Water Losses
(System Input Volume – Authorised
Consumption)
362 mld Real Losses
147.64 mld
Leakage on Distribution Service Network
Connections up to point of Customer metering
75 mld*
Non-Revenue
Water
(System Input volume –
Revenue Water)
384 mld
System Input
Volume
625 mld
Unidentified Water Losses 43.49 mld*
*Note :- Based on preliminary study of 144 test zones, figures subject to change after detailed study.

NMC, Water Audit & Leak Detection DPR, Nine Tasks of Water Audit & Leak Detection
Shah Technical Consultants Pvt. Ltd, Mumbai 39
SUMMARY OF PERFORMANCE INDICATORS
Sr. No. Description
01. Population of Nagpur City 23,50,000 souls
02. System Input Volume 625 mld
03. Actual Water Supply in Distribution System 490 mld (78%)
04. Actual Water Sales 241 mld (38%)
UFW (Gross) 384 mld (62%)
5.1] UFW for Raw Water upto WTP 135 mld (22%)
05.
5.2] UFW for Treated Water 249 mld (40%)
Total Non-Revenue Water (Administrative + Real) 384 mld (62%)
6.1] Administrative losses (apparent losses + free water)
236 mld (38%)
6.2] Real Losses 104 mld (17%)
06.
6.3] Unidentified Losses 43 mld (7%)
07. Water cost / unit (1000 ltrs.) Rs. 5.55/unit
08. Minimum Water Tariff (1000 ltrs.) Rs. 3.50/unit
09. Total Water Connections (inclusive of authorized unbilled) Appx. 2.0 lakhs
10. Avg. no. of persons / connections (90% piped water) 10-11
11. Total Water Connection (inclusive of unauthorized) Appx. 2.45 lakhs
12. Total Treated Water Losses (Real + Apparent) excluding raw water losses [490 mld – (billed consumption + unbilled authorized consumption)]
227 mld
13. Treated Water Losses / Connections (12÷11) 926 ltrs./connection/day
14. Treated Water Losses / Person (12÷1) 97 ltrs./person/day
Note :- All figures in % given with reference to System Input Volume (625 mld).

LEAK DETECTION STUDY

NMC, Water Audit & Leak Detection DPR, Leak Detection Study
Shah Technical Consultants Pvt. Ltd, Mumbai 40
Leak Detection Study 1.0] OBJECTIVE :- The second part of water audit is the preparation of leak detection and repair plan,
the main objective is Quantification of Unaccounted for Water (UFW) 2.0] PRESENT UFW SCENARIO FOR NAGPUR CITY :-
A] As per Preliminary Water Audit Report :-
Rs. Crore Sr. No.
UFW ML % %
i) Raw Water 37,691 16.90 1.65 2.30
ii) Other Losses 1,464 0.60
iii) Pure Water 90,746 41.00 17.55 24.90
TOTAL 1,28,901 58.50 19.20 27.20
As the UFW rate for Pure Water is very high. The details of zone wise pure
water UFW is as under.
QTY. SUPPLI
ED QTY. BILLED NET UFW (MLD)
Sr. No. ZONE
IN MLD IN MLD
BILLING %
MLD % **
1 I DHARAMPETH 78.55 48.29 61.47 30.27 12.17
2 II LAXMI NAGAR 54.05 33.80 62.53 20.25 8.15
3 III HANUMAN NAGAR 27.91 11.08 39.69 16.83 6.77
4 IV DHANTOLI 36.16 19.21 53.13 16.95 6.82
5 V NEHARU NAGAR 27.22 16.99 62.44 10.22 4.11
6 VI SOKTA BHAWAN 61.03 25.74 42.18 35.29 14.19
7 VII+IX SATRANJIPURA + ASHINAGAR 115.12 37.45 32.53 77.55 31.15
8 VIII LAKHADGANJ 16.04 9.55 59.56 6.49 2.61
9 X MANGALWARI 44.26 39.27 88.72 4.99 2.01
10 PUMPING/FEEDER MAIN 29.65 29.65 11.93
TOTAL POP. FOR 10 ZONES 490.00 241.38 52.43 248.62 100.00
TOTAL UFW % 50.74
*Combined calculations for Ashinagar & Satranjipura ** Zonal contribution in total UFW The unaccounted for water in Nagpur is approximate 50% of pure water
supply and therefore the situation is alarming.

NMC, Water Audit & Leak Detection DPR, Leak Detection Study
Shah Technical Consultants Pvt. Ltd, Mumbai 41
3.0] METHODOLOGY TO STUDY UNACCOUNTED FOR WATER (UFW) :- The quantification of UFW is carried using following methods. 3.1] Audible Leak Detection Using Electronic Equipment :- Audible leak detection uses electronic listening equipments to detect the
sounds of leakage. The pressurized water creates audible sound waves that can be sensed and amplified by electronic listening equipments. The sound waves are evaluated to determine exact location of leak.
3.2] Zone Flow Measurement :- Zone flow measurement is carried by isolating the section of the water system
and water flow is allowed through a single line. Actual flow rates are measured during normal course of operation and during
test time when all consumption points are closed. The flow rates during test hours indicates the physical loss due to leaks and loss due to illegal connections.
For quantification of UFW using audible leak detection is more useful for real
losses due to underground leaks. To estimate the apparent loss and major leakage, zone flow measurement is used. Therefore the methodology to study the UFW in distribution system is as follows:
3.3] Pre Test Activities :- 3.3.1] Selection of Test Zone :- The test zone to be studied for UFW is selected with the help of zonal
staff which includes the zonal office, Engineers and field staff. 3.3.2] Test Zone Selection Criteria :- In each ESR command zone, test zone shall include following areas. ¾ Housing Category :- 1) HIG 2) MIG 3) LIG 4) Slum
Zone with existing distribution system combination of Housing
Category may also be selected. ¾ No. of Consumer Connections :- Along the length of the test zone, no. of service connections are
restricted to 50 to 60 hours.

NMC, Water Audit & Leak Detection DPR, Leak Detection Study
Shah Technical Consultants Pvt. Ltd, Mumbai 42
¾ Availability of Isolation Valves :- It is required to isolate the test zone from the distribution network.
The lines with existing isolation valves avoids installation of valves. ¾ Availability of Present Status of Test Zone :- � Billing Status. � Consumer Data. � Existing Water Meter Details. 3.4] Pipe and Valve Survey :- Pipe & Valve survey is required to identify and verify the alignment of mains,
service connections, location of valves in distribution system, fixing of flow measurement and pressure recording points. If existing isolation valves are not available the location for isolation valves is decided during survey.
3.5] Consumer Connectivity Survey :- Consumer to consumer survey is conducted in the test zone. The information
regarding no. of connections, type of housing category, water meter details, condition of meters and stop tap details are collected during survey. Also the available records of test zone will be verified during survey and the level of satisfaction of consumers is studied.
3.6] Identification of Consumer :- Identification of consumer for installation of new NMC water meter to study the
consumption pattern. [1% of existing no. of meters in test zone selected will be replaced by new meter from NMC.]
3.7] Checking of Existing Flow :- Checking of existing flow by installation of bulk flow meter and also using
Ultrasonic Flow Meter in test zone during normal working hours. Also the flow rate in test zone will measured at consumer tap using bucket-filling method to check the average flow rate.
3.8] Testing of Valves :- The existing valves will be checked whether working or not. The existing valves
are also checked for the no. of threads in normal operating conditions, so that it can be restored to its normal condition of during and after the test.
3.9] Leak Detection Test :- The leak detection using electronic equipments will be carried out during
supply hours and the zone flow measurement will be carried during non supply hours so that the regular supply is not affected. Prior to start of zone flow measurement test all consumer taps are closed and lines with no stop taps are plugged, and also the consumers are appealed to co-operate during the test.

NMC, Water Audit & Leak Detection DPR, Leak Detection Study
Shah Technical Consultants Pvt. Ltd, Mumbai 43
Flow during test hours is measured using flow meters and pressure are recorded on pre decided location. Test generally lasts for about 2 to 4 hours depending on the size and zone selected and the success of this method involves effective co-ordination as multiple activities are required during test.
Working in smaller zones with about 50 to 60 house service connections helps
to pay attention to each houses, communication is better and also the normal supply In selected ESR command area is not disrupted.
During the test if the flow recorded is high then additional investigation are
required like. 01] Audible Leak Detection. 02] Multiple Pressure Recordings. 03] Visual Leak Detections. During the test the leak points located by the team are marked to leak repair
teams to carryout leak repairs. Zones with major leaks detected, the flow and pressure measurements are rechecked to calculate the benefits of repairs.
On completion of study the connection for pressure measurements are
plugged, the plugs and isolation arrangements provided are removed and the valves are opened to normal condition and the line is restored.
3.10] Equipments to be used During Test :- 01] Ultrasonic Flow Meters.
02] Pressure Gauges.
03] Pipe Locators.
04] Leak Locators.
05] Sounding Rods.
06] Tanker and Pump unit (if required). The detailed breakup of activities along with the respective responsibilities to
be shared is given in following table. Also the team composition of consultant and NMC office staff and time
schedule is given for reference.

STC, Mumbai NMC Water Works Dept., Nagpur
STC LOCAL OFFICE
NMC ZONE OFFICE
NMC HEAD OFFICE
STC LOCAL OFFICE
NMC ZONE OFFICENMC HEAD
OFFICE
1 Selection of Test zone P P PC/JE ZO/JE -
2
2.1 Pipe and Valve location P P PC/JE/ASST. ZO/JE/VO
2.2 Fixing of location for flow and pressure measurement P P PC/JE/ASST. ZO/JE
2.3 Housing Category survey P P JE/ASST. ZO/JE
2.4 Study of existing meter condition P P P JE/ASST. ZO/JE/MR
2.5 Present status of supply in test zone P P PC/JE ZO/JE
2.6 Number of house connection in test zone with category P P P JE/ASST. MI/MR
2.7 Identification of consumer for replacement meter P P P PC/JE ZO/JE WWPC
2.8 Estimation of items required for isolation of test zone P P PC/JE ZO/JE
2.9 Population estimation of test zone P P JE/ASST. MI/MR
3 Consumer record of test zone P P PC/JE MI/MR
4 Billing record of test zone P P PC/JE MI/MR
5 Issue and replacement of meter of selected consumer P P ZO/JE WWPC
6 Excavation and provision for flow measurement P P JE/MAINT. AGENCY WWPC
7Flow and pressure measurement during normal working in test zone.
P P PC/JE/ASST. ZO/JE
8 Intimation to consumer of test zone regarding test P P JE/ASST. MR
9 Plugging of house service connections in test zone P P JE/ASST. MR
10 Isolation of test zone P P PC/JE/ASST. ZO/JE/VO
11Flow and pressure measurement in test zone for leak deduction.
P P PC/JE/ASST. ZO/JE/VO
TASK ASSIGNED TO
BREAKUP OF ACTIVITY AND TASK ASSIGNMENT
Survey of test zone for
RESPONSIBILITY OFSR. NO.
DESCRIPTION
PC - Project Coordinator, JE - Junior Engineer, ASST. - Assistant, VO - Valve Operator, ZO - Zonal Officer, BS - Billing Section, WWPC - Water Works Project Co-ordinator., Maint. Agency - Maintainance AgencyWater Audit, Leak Detection Plan

STC, Mumbai NMC Water Works Dept., Nagpur
STC LOCAL OFFICE
NMC ZONE OFFICE
NMC HEAD OFFICE
STC LOCAL OFFICE
NMC ZONE OFFICENMC HEAD
OFFICE
TASK ASSIGNED TORESPONSIBILITY OFSR. NO.
DESCRIPTION
12
12.1 Visual inspection method. P P PC/JE/ASST. ZO/JE
12.2 Leak locator P P PC/JE/ASST.
12.3 Sounding rod P P PC/JE/ASST.
13 Restoration of service in test zone P P JE/ASST. ZO/JE/VO
14 Estimation of leaks P P PC/JE ZO/JE
15 Preparation of leak repair plan P P PC/JE ZO/JE
16 Repair of leaks P P PE MAINT. AGENCY/ VO
17 Retest if required P P PC/JE/ASST. ZO/JE/VO
Note: Progress review meeting will be held on every Saturday at consultants local office.
PC - Project Coordinator, JE - Junior Engineer, ASST. - Assistant, VO - Valve Operator, ZO - Zonal Officer, BS - Billing Section, WWPC - Water Works Project Co-ordinator., Maint. Agency - Maintainance Agency
Identification of major and minor leak in test zone
PC - Project Coordinator, JE - Junior Engineer, ASST. - Assistant, VO - Valve Operator, ZO - Zonal Officer, BS - Billing Section, WWPC - Water Works Project Co-ordinator., Maint. Agency - Maintainance AgencyWater Audit, Leak Detection Plan

STC, Mumbai NMC Water Works Dept., Nagpur
SR. NO.
DESCRIPTION OF ACTIVITY
Time in Days Start Finish
Pre Test Activity 69 18-Aug-04 08-Oct-04
1 Selection of Test Zone 11 21-Aug-04 01-Sep-04
2Submission of Drawing along with MOM
13 21-Aug-04 03-Sep-04
3 Preliminary Site Visit 50 23-Aug-04 12-Oct-04
5Consumer and Billing Record for Test Zone.
48 01-Sep-04 19-Oct-04
6Replacement of consumer meter.
46 06-Sep-04 22-Oct-04
7Data Verification including site visit.
51 08-Sep-04 29-Oct-04
WORK PLAN FOR LEAK DETECTIONDuration in Days
01-Sep-04
03-Sep-04
12-Oct-04
19-Oct-04
22-Oct-04
29-Oct-04
21-Aug-04
21-Aug-04
23-Aug-04
01-Sep-04
06-Sep-04
08-Sep-04
Water Audit, Leak Detection Plan


STC, Mumbai NMC, Water Works Dept., Nagpur
HIG MIG LIG Slum HIG/MIG MIG/LIGBaji Prabhu Nagar Gajanan nagar Manohar Vihar SurendraGadh
Ambajari Layout Giripeth Trust Layout Vishwas Nagar
Friend Colony Seva Nagar
Tilak Nagar Ambedkar Nagar, Dharampeth
Nelco Society / Patel Nagar Prasad Nagar Kamgar Nagar Laxmi Nagar
Friends Layout Gudhe Layout Dhangarpura Bhamptee Village Panchdeep Nagar
Congress Nagar Vijaya Nagar Savitri Nagar Tukdoji Nagar Nag Bhumi layout
NIT Layout Gittikhadan Takliseem
Milind Nagar Takiya
Adhyapak Nagar
Benerjee Layout Mahatma Fule Nagar Bajrang Nagar Chandramani Nagar Kukde Layout Shiv Shakti Nagar No.1
Shivraj Nagar (viswakarma nagar) Bhim Nagar
Vinkar Colony Sanjay Gandhi Nagar
Trikoni Maidan Somwari Quarters Juni Shukrawari ReshimbagRaja Baksha Siraspeth Hanuman Nagar
Ganeshpeth behind police stn. Kurnel Bagh
PTS Colony Rambag
Vakil Peth LIG Vakil Peth Slum
Surve Nagar Ayodhya Nagar(Near Ram Mandir) Rajiv Gandhi Nagar Sevadal Nagar Dattatraya Nagar
Sanmarg Nagar Ayodhya Nagar(Near Thakur chakki) Raghuji Nagar Dighori Village
Pragati Colony Old Malgi Nagar New Malgi Nagar Hasanbagh Slum
Gurudeo Nagar Sai Nagar Adarsh Nagar Nandanvan Slum
Mhada Colony Telephone Nagar Auliya Nagar
Shakti Mata Nagar
Shri Krishna Nagar
Queta Colony Hansapuri Old, Bhandra Road Ganjipeth, near Shukawat ali Sq. Bhohipura, near Santra market Mahal Near Sangh Bldg. Gandhi Gate Market
Chitnavispura Aadarsh Nagar
Namak Factory Slum
Killa Mahal, near Pakwasa Hospital
Santranjipura
Loha Oli Timki Near Ganjakhet Chowk Ladpura Nandgiri Road Timki Near Kurudkar Rd. Barse Nagar
Kashmiri Gali Nawa Nakasha Vinkar colony, tandapeth Parwarpura, near Itwari Shanti Nagar
Tulsi Nagar Vinoba Bhave Nagar Naik Talav Slum
Rajiv Gandhi Nagar
Bangde Layout
Deshpande Layout Trimurti Nagar Deshpande Layout Nr. Haldiram Prajapati Nagar
H B Town Gangabag, Pardi Vinoba Bhave Nagar pardi Bhandewadi
Jalaram Nagar Janki Nagar Pujoramwadi, near Dipti signal
Shishak Nagar
Yashodeep Nagar Anand Nagar Yogi Arvind Nagar Adarsh Nagar
New Thaware Nagar Boudha Nagar, Indora Sq. Jaripatka, near Choudri sq. Devi Nagar
Boudha Nagar,Zone office Hemu Colony Chawks Colony
Siddarth Nagar Sant Lahanuji Nagar Pili Nadi - 1 Sugath Nagar
Kabeer Nagar Wanjra village Kamgar Nagar
Maya Nagar
Nari Basti
Nara Village
Patel Nagar Geeta Nagar Byramji town Shiela Nagar
Mohan Nagar MHADA Colony New Basti Krishna Nagar
Borgaon Slum21 28 32 45 8 10
Ashi Nagar
10 Mangalwari
Zone No.
Zone Name
2 Laxmi Nagar
3 Hanuman Nagar
4
7
Summary of Test Zones for Water Audit, Leak Detection WorkHousing Category
1 Dharampeth
9
Dhantoli
TOTAL
Lakadganj8
5 Nehru Nagar
6Gandhibag (sokta bhavan)
Satranjipura
WATER AUDIT, LEAK DETECTION PLAN

SLUM POLICY

NMC, Water Audit & Leak Detection DPR, Slum Policy
Shah Technical Consultants Pvt. Ltd, Mumbai 49
DRAFT POLICY RECOMMENDATIONS FOR WATER SUPPLY IN SLUM AREA IN NAGPUR CITY
1.0] PREAMBLE :- The population of Nagpur City in the year 2001 works out to around 21.50 lakhs. As per
the slum study reports of Nagpur Municipal Corporation. The population residing in slum is 7.14 lakhs which works out to 33.21% of the total population of Nagpur City.
The total supply to Nagpur City from all sources is 510 MLD out of which in the
proportion of population, the water reaching to slums is about 1/3 i.e. 170 MLD. In view of the fact that almost all slums are covered by piped water supply. Less than 50% of structures of slum are having legal connections & out of all the legal connections less than 20% of recovery is achieved. Water supplied in terms of quantity is at par with or more than the normal residential area. Responsibility of Wastage of water and revenue loss for the quantum of water supplied beyond 70 LPCD, lies with NMC, as slum dwellers do not have any utilization of water other than personal use.
2.0] CASE STUDIES FOR WATER SUPPLY TO REPRESENTATIVE SLUMS :- To conduct case studies for water supply to slums, Rambagh Slum (Code No. 244) and
a group of slums comprising Pandharabodi (Code No. 105), Sevanagar (Code No. 123) and new Pandharabodi (Code No. 116) slums were selected as representative slums. The studies were conducted during the period from 6/1/04 to 29/1/04 and, 21/1/04 to 6/2/04. It was found that the Rambagh Slums gets practically 24 hours water supply where as Pandharabodi and allied slums receive water for 3 to 4 hours.
Flow meters were installed at all the entry points of pipe lines leading to above slums.
The inferences of the case studies were that the Rambagh Slum gets water to extent of 558 LPCD vis-à-vis 93 LPCD in the Pandharabodi and allied slums. The case studies conducted are annexed herewith. The average water supply for City is appx. 140 LPCD.
3.0] C.P.H.E.E.O. NORMS OF MINIMUM WATER SUPPLY TO (COMMUNITIES) :- The norms are as follows : 3.1] For Public stand Post 40 LPCD 3.2] For others 70 LPCD As could be seen from the case studies, water supply to the representative slums is
much more than the prescribed norms.

NMC, Water Audit & Leak Detection DPR, Slum Policy
Shah Technical Consultants Pvt. Ltd, Mumbai 50
4.0] GENERAL INFORMATION ABOUT THE SLUM :- As per the slum data prepared by the NMC the population residing in 430 slums area is
7,14,425 souls housed in 1,24,274 structures. The number of persons per structure works out to 5.74. For the purpose of calculating water supply etc. the figure is taken as 6 persons per structure.
5.0] COST OF WATER SUPPLY IN NAGPUR CITY :- The annual operation and maintenance cost of water supply to Nagpur City is appx. Rs.
95 crores (including of Pench-III) for a corresponding water supply of 490 MLD. Thus the cost of water per unit of 1000 ltrs. Of water works out to Rs. 5.55.
As per the above stated cost of water, the annual dues payable to NMC from slums is
about Rs. 35 crores. In view of the financial standard prevailing in the slums it is just not possible for NMC to recover such a huge amount. In the field of water supply the slums are on par with other localities but when the recovery aspect is taken into consideration, the slums are far behind as has already been stated in the foregoing paras. The situation therefore warrants formulation of a viable policy to ensure only necessary water supply to the slums and corresponding revenue recovery therefore.
6.0] CATEGORIES OF STRUCTURES :- While drafting the policy, the structures in the slums have been categorised as below : 6.1] Kaccha Structure 6.2] Pacca Structure 6.3] Multi Storied Structure The rate of water supply to Kaccha structure and P.W.S. is taken as 40 LPCD and for
others it is 70 LPCD as per the CPHEEO norms (see Table-D). 7.0] CALCULATIONS FOR WATER CHARGES :- A] Kaccha Structure :-
i] No. of persons per structure 6
ii] Rate of Water Supply 40 LPCD
iii] Total water supply in a day / structure 240 liters.
iv] Total water supply in a month (240X31) 7440 liters i.e. 7.5 units. With cost of water charges at Rs. 5.55 per unit, water charges per structure per month Rs. 40.70

NMC, Water Audit & Leak Detection DPR, Slum Policy
Shah Technical Consultants Pvt. Ltd, Mumbai 51
B] Pacca Structures i] No. of persons per structure 6
ii] Rate of Water Supply 70 LPCD
iii] Total water supply in a day / structure 420 liters.
iv] Total water supply in a month (420X31) 13020 liters i.e. 13.02 units. With cost of water charges at Rs. 5.55 per unit, water charges per structure per month Rs. 72.26 In view of the financial status of the slum dwellers, the water charges per structure per
month as calculated above need to be subsidised. The difference in the water charges as calculated and as recommended below can be made good from the slightly higher water charges levied to commercial establishment of other areas.
8.0] RECOMMENDATIONS :- 8.1] The water charges in the slums should be levied as part of property tax. 8.2] The meterisation in slum areas should be totally dispensed with for the following
reasons. 8.2.1] Very large establishment is required for meter reading, preparation of
bills, dispatch of bills and recovery of water bills. 8.2.2] It is very difficult to trace the illegal connection in the slum areas.
Measures to identify illegal connections in the slum area lead to law and order situations.
8.2.3] The recover of water charges becomes more cost effective and viable to
greater extent when levied as a part of property tax. 8.2.4] Duplication of work by the water & property tax departments needs to be
avoided. 8.3] With a consideration of subsidy (appx. 30%) the following rate structure is
recommended for the slum areas. 8.3.1] Kaccha structure Rs. 30/- per structure per month. 8.3.2] Pacca structure Rs. 50/- per structure per month. 8.3.3] Double storied structure Rs. 80/- per structure per month While implementing above tax structure, it is essential on the part of NMC that corrective
measures for water supply system for slum area are under taken so that in no case water supply to a slum exceeds 70 LPCD. To achieve this, the NMC has to incur some expenditure for system corrections. After developing the revised system the probability of revenue recovery will be very high. Simultaneously water supply of the required level shall be achieved. The water as saved from slums can be diverted to other localities and corporation’s revenue enhanced multifold.

NMC, Water Audit & Leak Detection DPR, Slum Policy
Shah Technical Consultants Pvt. Ltd, Mumbai 52
Hence NMC can reduce the supply to maximum 50 MLD to slum area i.e. 10% of total 510 MLD of water with above measures & treat slum water supply system as a community water scheme with measured (ensured) water supply to each slum area & reduce the Unaccount For Water (UFW) for Nagpur City.
Water Loss at Stand Post / Illegal Connections in Slums

Sr. No.
Iden
tity
Co
de
Name of slumsOld
Code no.
Co
nst
itu
ency
Status
Pra
bh
ag 2
002
Als
o in
P
rab
hag
200
2
Zo
ne
2002
PT
S m
ap
avai
lab
le
Ho
use
Lis
t av
aila
ble
Po
pu
lati
on
No
. of
st
ruct
ure
s
So
urc
e o
f W
ater
Su
pp
ly
1 NW2302 Gaddigudam(1) 322 C Notified 14 30 10 4970 903 P/PWS/B/W
2 NW2303 East of Gaddigudam (1) 924 C Not in Masterlist `98 14 10 520 94 P/PWS/B/W
3 NW2404 Khalasi Line (1) 314 C Notified 30 10 Yes Yes 2282 415 P/PWS/B/W
4 NW2403 Lala Garden 323 C Notified 30 10 Yes Yes 440 80 P/PWS/B/W
5 NW2401 Harijan Basti 324 C Notified 30 10 555 100 P/PWS/B/W
6 NE2604 Kostipura 319 C Notified 31 9 1014 184 P/PWS/B/W
7 CE0401 Zangripura 303 C Notified 32 6 1085 197 P/PWS/B/W
8 CE0402 Bhankheda 309 CIn Masterlist but not notified
32 6 Yes 12755 2319 P/PWS/B/W
9 CE0403 Bansod Mohalla 310 CIn Masterlist but not notified
32 6 Yes 2131 387 P/PWS/B/W
10 CE0202Boriyapura part(II) (North of Crrodach road)
311 C Notified 32 6 Yes 1853 337 P/PWS/B/W
11 CE0201 Boriyapura(2) 312 C Notified 32 6 Yes Yes 5413 984 P/PWS/B/W
12 CE0101 Dobi Nagar 321 C Notified 32 6 Yes 4919 394 P/PWS/B/W
13 CE0102 East of Dobi Nagar 926 C Not in Masterlist `98 32 6 Yes 210 38 P/PWS/B/W
14 CE0704 Kumbharpura, Lodpura 299 C Notified 33 7 2144 390 P/PWS/B/W
15 CE0601 Chimabaipeth 301 C Notified 33 7 Yes Yes 1726 314 P/PWS/B/W
16 CE0501 Kosaripura 304 C Notified 33 7 2170 394 P/PWS/B/W
17 CE0502 Shobhakhet 306 C Notified 33 7 Yes Yes 3340 607 P/PWS/B/W
18 CE0602 Jagnath Budhwari Kumbharpura 317 C Notified 33 7 1241 225 P/PWS/B/W
19 CE0603 Koshthipura, Bangali Panja 298 C Notified 35 7 877 159 P/PWS/B/W
20 CE2503 Bhaldarpura(2) 290 C Notified 43 6 4438 807 P/PWS/B/W
21 CE2501 Nayapura,Bhoipura 295 C Notified 43 44 6 3041 553 P/PWS/B/W
22 CE2301 Lodhipura,Bajeria 297 C Notified 44 6 2703 491 P/PWS/B/W
23 CE0302 Diwanshah Takiya 300 C Notified 44 33 6 Yes 3250 591 P/PWS/B/W
24 CE0301 Mominpura Takiya 307 C Notified 44 6 Yes 4341 789 P/PWS/B/W
25 CE0203Boriyapura part(I) (South of Crrodach road)
311 C Notified 44 6 Yes 6043 1098 P/PWS/B/W
26 CE030102 Panaipeth Mochipura 320 CIn Masterlist but not notified
44 6 Yes 750 145 P/PWS/B/W
27 CE2302 Lodhipura 326 C Notified 44 6 3340 609 P/PWS/B/W
28 NW2301 Gaddigudam (2) 313 C Notified 14 30 10 2550 463 P/PWS/B/W
29 NW2402 Khalashi Line(2) 315 C Notified 30 10 Yes Yes 150 27 P/PWS/B/W
LIST OF SLUMS IN NAGPUR CITY
Table-A

30 NE2605 Kuraidpura 305 C Notified 31 9 839 152 P/PWS/B/W
31 CE2502 Bhaldarpura(1) 296 C Notified 43 6 3250 591 P/PWS/B/W
32 CE3001 Khapri Mohalla 291 C Notified 45 6 2703 491 P/PWS/B/W
33 CE3002 Kumbharpura Itwari 292 C Notified 45 6 2261 411 P/PWS/B/W
34 CE2901 Budhukhan Minara 293 C Notified 45 6 3249 591 P/PWS/B/W
77551 13604
1 CE1901 Minimata Nagar 027 EIn Masterlist but not notified
4 8 9532 1733 P/PWS/B/W
2 CE1601 Dy. Signal 036 E Notified 4 8 Yes Yes 11249 1729 P/PWS/B/W
3 CE2201 Punapur Village 067 E Notified 4 8 812 148 P/PWS/B/W
4 CE2101 Bharatwada Village 068 E Notified 4 8 988 180 B/W/W
5 CE1602 Sakharam Wadi 078 E Notified 4 8 Yes Yes 1144 189 B/W/W
6 CE1801 Chikhali 087 E Notified 4 8 540 98 B/W/W
7 CE1604 East of Deputy Signal 957 E Not in Masterlist `98 4 8 Yes Yes 3189 563 B/W/W
8 CE1902 Panch Zopada (Minimata Nagar) 978 E Not in Masterlist `98 4 8 Yes Yes
9 CE1605 Gopal Nagar (East of Dy. Signal) 979 E Not in Masterlist `98 4 8 716 144 B/W/W
10 CE1606 Santoshi Nagar (S-E of Dy. Siganl) 980 E Not in Masterlist `98 4 8 432 93 B/W/W
11 CE5001 Wathoda 022 E Notified 5 8 1950 354 P/PWS/B/W
12 CE4901 Bhandewadi-2 026 E Notified 5 8 Yes 4100 745 Partial
13 CE4501 Hasanbag 1&2 055 E Notified 5 21 8 Yes Yes 8180 1236 P/PWS/B/W
14 CE4601 Sonbaji Nagar 060 E Notified 5 8 786 142 Partial
15 CE4802 Old Pardi 062 E Notified 5 8 909 164 B/W/W
16 CE4404 Hiwari Nagar 064 E Notified 5 8 Yes 4028 742 P/PWS/B/W
17 CE4406 New Panther Ngr. 328 E Notified 5 8 2500 454 P/PWS/B/W
18 CE4701 Adarsha Nagar (West of ring road) 329 E Notified 5 8 550 100 Partial
19 CE4702 Adarsha Nagar (East of ring road) 329 E Notified 5 8 210 38 Partial
20 CE4704 Nehru Nagar 330 E Notified 5 8 1350 245 B/W
21 CE4401 Jai Bajrang Nagar 332 E Notified 5 8 Yes Yes 660 120 B/W/W
22 CE4405 Hiwari Nagar,Padole Nagar-2 351 E Notified 5 8 2100 382 P/PWS/B/W
23 CE5101 Sangharsh Nagar 353 E Notified 5 8 2000 364 B/W/W
24 CE5201 Shivankar Nagar 354 E Notified 5 8 1800 327 P/PWS/B/W
25 CE4801 NITE12:Chandra Nagar Near Nallah 367 EIn Masterlist but not notified
5 8 468 85 B/W/W
26 CE4703 Prajapati Nagar 400 EIn Masterlist but not notified
5 8 1378 250 B/W/W
27 CE5002 North of Wathoda (Along Road) 932 E Not in Masterlist `98 5 8 200 36 Partial
28 CE4903East of Hanuman Nagar on old Pathway
933 E Not in Masterlist `98 5 8 Yes 460 83 Partial

29 SE1503 Tajbagh 002 E Notified 6 5 9000 1636 P/PWS/B/W
30 SE1301 Bidipeth 003 E Notified 6 5 1500 272 P/PWS/B/W
31 SE1502 Sindiban 005 E Notified 6 5 800 145 P/PWS/B/W
32 CE5301 Dighori 021 E Notified 6 5 1040 189 P/PWS/B/W
33 SE1601 Yaseen Plot 054 E Notified 6 5 1800 327 Partial
34 SE1202 Sewadal Nagar 065 E Notified 6 5 Yes 4737 861 P/PWS/B/W
35 CE5401 Harpur Nagar 082 E Notified 6 5 1105 200 P/PWS/B/W
36 SE1501 Tajjamma Colony 083 E Notified 6 5 500 91 P/PWS/B/W
37 SE1602 Nirala (Gausia Plot) 085 E Notified 6 5 1000 182 P/PWS/B/W
38 SE1603 Azad colony 953 E Not in Masterlist `98 6 5 2500 454 P/PWS/B/W
39 SE1504 Auwaliya Nagar 964 E Not in Masterlist `98 6 5 400 73 Partial
40 SE1505 NW of sindiban 965 E Not in Masterlist `98 6 5 400 70 P/PWS/B/W
41 SE1801 Sanjay Nagar (North of ring road) 007 E Notified 7 3 918 167 P/PWS/B/W
42 SE1402 NITE40: Kh.No.82/2 Mz.Sakkardara 396 EIn Masterlist but not notified
7 3 975 177 P/PWS/B/W
43 SE1802Sanjay Gandhi Nagar (South of ring road)
402 E Notified 7 3 1606 292 P/PWS/B/W
44 SE1803 New Nehru Nagar 927 E Not in Masterlist `98 7 3 3000 545 P/PWS/B/W
45 CE1509 Shanti Nagar-1 029 E Notified 19 7 9883 1796 P/PWS/B/W
46 CE1510 Shanti Nagar-2 030 E Notified 19 7 Yes Yes 1430 122 P/PWS/B/W
47 CE1503 Shanti Nagar-3 031 E Notified 19 7 Yes Yes 1410 114 P/PWS/B/W
48 CE1504 Shanti Nagar-4 032 E Notified 19 7 539 98 P/PWS/B/W
49 CE1505 Shanti Nagar-5 033 E Notified 19 7 2112 384 P/PWS/B/W
50 CE1506 Shanti Nagar CRPR colony 034 E Notified 19 7 546 99 P/PWS/B/W
51 CE1508 Jagruti Nagar 035 E Notified 19 7 1085 197 P/PWS/B/W
52 CE1507 Shanti Nagar 057 EIn Masterlist but not notified
19 7 2112 384 P/PWS/B/W
53 CE1502 Zopadpatti near Kuttewala B. M. 069 EIn Masterlist but not notified
19 7 90 16 P/PWS/B/W
54 CE4402 Gorakumbharpura 024 E Notified 20 8 Yes Yes 2975 475 P/PWS/B/W
55 CE1701 Mehatarpura 038 E Notified 20 8 Yes Yes 1092 198 P/PWS/B/W
56 CE1702 Sudarshan Nagar 039 E Notified 20 8 Yes Yes 754 137 P/PWS/B/W
57 CE1703NITE16: Plot No.50, Small factory area
371 EIn Masterlist but not notified
20 8 1000 182 P/PWS/B/W
58 CE4301 Nandanvan-1 023 E Notified 21 5 Yes Yes 14420 2403 P/PWS/B/W
59 CE4302 Nandanvan - 2 056 EIn Masterlist but not notified
21 5 Yes Yes P/PWS/B/W
60 CE4003 Juni Shukrawari 018 E Notified 22 5 1715 311 P/PWS/B/W
61 CE4001 Kunbipura 019 EIn Masterlist but not notified
22 5 3898 709 P/PWS/B/W
62 CE4201 Gayatri Nagar 079 E Notified 22 5 Yes Yes 1070 185 P/PWS/B/W

63 SE1203 Sakkardara 001 E Notified 23 5 Yes Yes 2703 491 P/PWS/B/W
64 SE1201NITE39: Kh.No.25,36/2 Mz.Sakkardara
395 EIn Masterlist but not notified
23 5 1650 350 P/PWS/B/W
65 SE1303 East of Rajeev Nagar 934 E Not in Masterlist `98 23 5 100 18 P/PWS/B/W
66 CE4202Along Nagnallah side of Keshav Nagar
943 E Not in Masterlist `98 23 5 Yes Yes 40 7 P/PWS/B/W
67 CE1301 Telipura-1 050 E Notified 35 7 1949 354 P/PWS/B/W
68 CE1304 Bhamti pura 086 E Notified 35 7 1325 241 P/PWS/B/W
69 CE1303 Slum Near Tumaniya Masjid 327 E Notified 35 7 700 127 P/PWS/B/W
70 CE1302 Boudhapura 408 E Notified 35 7 1100 200 P/PWS/B/W
71 CE4104 Gujar Nagar 028 E Notified 36 8 Yes Yes 916 123 P/PWS/B/W
72 CE3401 Garoba Maidan -1 041 E Notified 36 8 Yes Yes 845 154 P/PWS/B/W
73 CE3103 Chinteshwar 047 E Notified 36 8 3249 591 P/PWS/B/W
74 CE3101 Bairagipura 048 E Notified 36 8 2976 541 P/PWS/B/W
75 CE3003 Ganga Jamuna,Koshthipura 052 E Notified 36 8 221 40 P/PWS/B/W
76 CE1401 Satranjipura-1 053 E Notified 36 8 3249 591 P/PWS/B/W
77 CE3104 Rampeth 059 E Notified 36 8 1332 242 P/PWS/B/W
78 CE4105 Shivaji Nagar 010 EIn Masterlist but not notified
37 38 8 5471 995 P/PWS/B/W
79 CE4103 Bhuteshwar colony 011 E Notified 37 8 Yes Yes 9162 1666 P/PWS/B/W
80 CE4102 Nandaji Nagar 012 E Notified 37 8 1066 194 P/PWS/B/W
81 CE4101 Gondapura, Shivaji 013 E Notified 37 8 2274 413 P/PWS/B/W
82 CE3302 Hattinallah-1 044 E Notified 37 8 Yes Yes 9552 1736 P/PWS/B/W
83 CE3301 Hattinallah-2 045 E Notified 37 8 Yes Yes 7648 1390 P/PWS/B/W
84 CE3303 Dhivarpura 058 E Notified 37 8 Yes Yes 2372 431 P/PWS/B/W
85 CE3201 Deoghare(Mataghare) Mohalla 071 E Notified 37 8 2600 472 P/PWS/B/W
86 CE3304 Boudha Mohalla 081 E Notified 37 8 Yes Yes 1995 363 P/PWS/B/W
87 CE3901 Killa 009 E Notified 38 6 4873 886 P/PWS/B/W
88 CE3902 Alimia Chawl 014 E Notified 38 6 2007 364 P/PWS/B/W
89 CE3703 Tulsibagh 015 E Notified 38 6 Yes 3249 591 P/PWS/B/W
90 CE3701 Rahatekar wadi 016 E Notified 38 42 6 Yes 1852 337 P/PWS/B/W
91 CE4002 Malipura 020 EIn Masterlist but not notified
38 6 3249 591 P/PWS/B/W
92 CE3903 Zopadatti on Shukrawari road 075 EIn Masterlist but not notified
38 6 442 80 P/PWS/B/W
93 CE3702 Chandani Mohalla 017 EIn Masterlist but not notified
42 4 Yes 632 115 P/PWS/B/W
94 CE3502 Habeeb ka akhada 008 E Notified 45 6 1592 290 P/PWS/B/W
95 CE4403 Kumbhartoli-2 331 E Notified 20 8 Yes Yes 340 62 P/PWS/B/W
96 SE1302 Rajiv Nagar 006 E Notified 23 5 260 47 P/PWS/B/W

97 CE3102 Kumbharpura GangaJamuna 046 E Notified 36 8 1358 247 P/PWS/B/W
98 CE3305 Chinchpura 042 E Notified 37 8 Yes Yes 1520 276 P/PWS/B/W
99 CE2001 Bhandewadi-3 061 E Notified 4 8 2313 421 B/W/W
100 CE1603 Punjaram wadi 077 E Notified 4 8 Yes Yes 1265 250 B/W/W
101 CE3004 Koshthipura, Hamalpura 049 E Notified 45 6 2170 394 P/PWS/B/W
102 CE4902 Hanuman Nagar 084 E Notified 5 8 Yes 3132 569 P/PWS/B/W
103 SE1401 Adiwasi Nagar 004 E Notified 7 3 1500 272 P/PWS/B/W
219331 38728
1 NW2101 Bhim Nagar 909 N Not in Masterlist `98 1 10 815 148 P/PWS/B/W
2 NE0601 Indora (3) 195 N Notified 2 9 Yes Yes 1557 253 P/PWS/B/W
3 NE0603 Indora (4) 196 N Notified 2 15 9 Yes Yes 4561 776 P/PWS/B/W
4 NE0604 New Indora Zopda 197 N Notified 2 9 Yes Yes 433 64 P/PWS/B/W
5 NE0102 Nara village 212 N Notified 2 9 Yes Yes 1989 362 P/PWS/B/W
6 NE0201 Nari village 213 N Notified 2 9 1352 246 P/PWS/B/W
7 NE0401 Kasturba Nagar 218 N Notified 2 9 Yes Yes 943 171 P/PWS/B/W
8 NE1002 Pili Nadi (2) 219 N Notified 2 9 722 131 P/PWS/B/W
9 NE1001 Bh.Anand Kausalyayan Nagar 337 N Notified 2 9 2340 425 P/PWS/B/W
10 NE0202 Takshashila 338 N Notified 2 9 828 168 P/PWS/B/W
11 NE0801 Ramaai Nagar 339 N Notified 2 16 9 962 175 P/PWS/B/W
12 NE0402NITE 36: Kh.No.57,58/2 Mz.-Mankapur
392 NIn Masterlist but not notified
2 9 1748 318 P/PWS/B/W
13 NE0301NITE 37:(Kh.No.25/1-2-3 Mz.-Indora) / Martin Nagar
393 NIn Masterlist but not notified
2 9 Yes Yes 431 128 P/PWS/B/W
14 NE0302 Indira Nagar 410 NIn Masterlist but not notified
2 9 Yes Yes 1323 367 P/PWS/B/W
15 NE0101 East of Nara Village 901 N Not in Masterlist `98 2 9 150 27 B/W/W
16 NE0204South of Taxshashila (Along Nari Road)
902 N Not in Masterlist `98 2 9 140 20 P/PWS/B/W
17 NE0203South of Nari Village (Along Nari Road)
903 N Not in Masterlist `98 2 9 50 6 P/PWS/B/W
18 NE1003 Between Old & New Kamptee Road 911 N Not in Masterlist `98 2 9 610 87 P/PWS/B/W
19 NE2001 Sanjay Nagar 182 N Notified 3 9 Yes Yes 2631 470 P/PWS/B/W
20 NE2007 Dhammadeep Nagar 211 N Notified 3 9 Yes Yes 1950 373 P/PWS/B/W
21 NE1101 Pili Nadi (1) 214 N Notified 3 9 2626 477 P/PWS/B/W
22 NE2101 Kalamna Village 215 N Notified 3 9 990 141 B/W/W
23 NE1202 Wanjara (wasti) village 222 N Notified 3 9 Yes Yes 657 119 B/W/W
24 NE1401 Wanjri 229 NIn Masterlist but not notified
3 9 884 160 P/PWS/B/W
25 NE2004 Anand Nagar, Gondpura 237 N Notified 3 9 Yes Yes 761 138 P/PWS/B/W
26 NE2005 Indira Mata Nagar 241 N Notified 3 9 Yes Yes 1709 310 P/PWS/B/W

27 NE2010 Dhammadeep Nagar - 2 345 N Notified 3 9 Yes Yes 1209 215 P/PWS/B/W
28 NE2008NITE 31: Kh.No. 92/1-2-3 Mz.-Binaki
386 NIn Masterlist but not notified
3 9 0 0 P/PWS/B/W
29 NE1501 Santosh Nagar (NIT Land) 387 N Notified 3 9 1800 253 P/PWS/B/W
30 NE1301 Garib Nawaz Nagar (NIT Land) 389 N Notified 3 9 6460 1174 P/PWS/B/W
31 NE1302NITE34: b)Kh.No.Abdul Hameed Nagar
390 NIn Masterlist but not notified
3 9 600 109 P/PWS/B/W
32 NE1201 Wanjra ( North Along Road) 912 N Not in Masterlist `98 3 9 750 105 P/PWS/B/W
33 NE2003North of Chamar Nallah/Sanjay Nagar
913 N Not in Masterlist `98 3 9 399 72 P/PWS/B/W
34 NE2009 South of Dhammadeep Nagar 914 N Not in Masterlist `98 3 9 550 78 P/PWS/B/W
35 NE2006 South of Indira Mata Nagar 930 N Not in Masterlist `98 3 9 651 93 P/PWS/B/W
36 NE1102 South of pili nadi (1) 961 N Not in Masterlist `98 3 9 325 59 P/PWS/B/W
37 NE1103 Matoshree Ramai Nagar 962 N Not in Masterlist `98 3 9 639 115 PWS/B/W
38 NE1104 Bhimwadi 963 N Not in Masterlist `98 3 9 750 136 PWS/B/W
39 NE2102 Nagraj Nagar (NE of Kalamna) 970 N Not in Masterlist `98 3 9 250 45 PWS/B/W
40 NE3302 Aayesha Nagar 975 N Not in Masterlist `98 3 9 674 122 P/PWS/B/W
41 NE2201 Bezanbagh (2) 201 N Notified 14 10 1900 271 P/PWS/B/W
42 NW2102 Adiwasi Nagar (2) 203 N Notified 14 10 1955 355 B/W
43 NE2202 Mekosabagh 204 NIn Masterlist but not notified
14 10 581 83 P/PWS/B
44 NW2201 Gadheghat chhawani 205 N Notified 14 10 Yes Yes 920 167 B/W
45 NW2204 Goa Colony 221 N Notified 14 10 1135 206 P/PWS/B
46 NE2205 Dilip Nagar, Mukund Nagar 224 N Notified 14 10 868 124 P/PWS/B
47 NE2204 Lumbini Nagar 239 N Notified 14 10 2919 417 P/PWS/B/W
48 NE2203 Angulimal Nagar 240 NIn Masterlist but not notified
14 10 560 80 P/PWS/B/W
49 NW2202 Navin Basti Chhawani 407 N Notified 14 10 2825 513 P/PWS/B/W
50 NE2504 West of Noga Factory 955 N Not in Masterlist `98 14 10 770 110 P/PWS/B/W
51 NE2506South of Punjabi Line (Near hanuman Temple)
967 N Not in Masterlist `98 14 10 345 62 P/PWS/B/W
52 NE0605 Indora (2) 194 N Notified 15 10 Yes Yes 4269 780 P/PWS/B/W
53 NE0501 Jaripatka 199 N Notified 15 10 3249 590 P/PWS/B/W
54 NE2301 Bezanbag (1) 200 N Notified 15 10 Yes Yes 1521 276 P/PWS/B/W
55 NE0606South of Indora (2) Triangular Portion
908 N Not in Masterlist `98 15 10 Yes Yes 150 27 P/PWS/B/W
56 NE3401Old Jaripatka & Matoshree Ramai Nagar
954 N Not in Masterlist `98 15 10 1939 212 P/PWS/B
57 NE3402Ambedkar Nagar Zopadpatti (East of Mahavir Nagar,Jaripatka)
968 N Not in Masterlist `98 15 10 300 54
58 NE1602 Rahul Nagar, Azad Nagar 180 N Notified 16 9 Yes Yes 3899 710 P/PWS/B/W
59 NE1601 Habib Nagar 210 N Notified 16 9 Yes Yes 2925 531 P/PWS/B/W
60 NE0901 Manav Nagar 243 N Notified 16 9 Yes 2255 410 P/PWS/B/W

61 NE0903 Shende Nagar 340 N Notified 16 9 2405 437 P/PWS/B/W
62 NE0902 N-W Corner of Shende Nagar 910 N Not in Masterlist `98 16 9 150 27 P/PWS/B/W
63 NE1904Along Chamar Nallah (North of Khobragade Nagar)
956 N Not in Masterlist `98 16 9 42 6 P/PWS/B/W
64 NE1901 Panchsheel Nagar (1) 175 N Notified 17 9 Yes Yes 3697 617 P/PWS/B/W
65 NE3003 Binaki (1) 176 N Notified 17 9 4614 838 P/PWS/B/W
66 NE3002 Binaki (2) 177 N Notified 17 9 689 125 P/PWS/B/W
67 NE3004 New Mangalwari 178 N Notified 17 9 1410 201 P/PWS/B/W
68 NE1801 Panchsheel Nagar (2) 207 N Notified 17 9 Yes Yes 1073 195 P/PWS/B/W
69 NE1701 BabaBoudha Nagar,Taj Nagar 208 N Notified 17 9 Yes Yes 5199 945 P/PWS/B/W
70 NE1903 Khobragade Nagar 220 N Notified 17 9 Yes Yes 1300 236 P/PWS/B/W
71 NE3001 Binaki (3) 228 NIn Masterlist but not notified
17 9 533 97 P/PWS/B/W
72 NE2901 Panchakua Kumbhar Basti 232 N Notified 17 9 1151 209 P/PWS/B/W
73 NE2802 Bapukuti 238 N Notified 17 9 660 120 P/PWS/B
74 NE2002 NITE17: Kh. No. 21/1 Mz. - Binaki 372 NIn Masterlist but not notified
17 9 1000 182 P/PWS/B/W
75 NE1902Area Bet.Tajnagar, Chamarnallah & Panchsheel nagar
929 N Not in Masterlist `98 17 9 Yes Yes 700 129 P/PWS/B/W
76 NE2803South of Vaishali Nagar along Calcutta Rly. Line
971 N Not in Masterlist `98 17 9 1000 182 P/PWS/B/W
77 CE1102 Bahuli Vihir 165 NIn Masterlist but not notified
18 7 2274 413 P/PWS/B/W
78 CE1101 Gondpura,Prem Nagar (1) 170 N Notified 18 7 4808 874 P/PWS/B/W
79 NE3102 Bokade Mohalla 171 NIn Masterlist but not notified
18 7 1110 160 P/PWS/B/W
80 NE2903 Joshipura 179 N Notified 18 7 839 152 P/PWS/B/W
81 NE2904 Binaki Tekada 209 N Notified 18 7 572 104 P/PWS/B/W
82 NE2902 Sonartoli 216 N Notified 18 7 Yes Yes 1631 296 P/PWS/B/W
83 NE3202 Kundanlal Gupta Nagar 227 N Notified 18 7 5420 774 P/PWS/B/W
84 NE3201 Indira Nagar 235 NIn Masterlist but not notified
18 7 2184 311 P/PWS/B/W
85 NE3103 Janta Nagar( Jamdarwadi) 344 N Notified 18 7 665 95 P/PWS/B/W
86 NE3101 North of Bokade Mohalla 931 N Not in Masterlist `98 18 7 1368 194 P/PWS/B/W
87 CE1201 Gujri Lalganj 161 N Notified 19 7 988 180 P/PWS/B/W
88 CE1202 Kumbharpura,Musalmanpura 162 N Notified 19 7 2600 473 P/PWS/B/W
89 CE1501 Kawarapeth 172 N Notified 19 7 1780 323 P/PWS/B/W
90 CE1203 Kumbharpura, Musalmanpura 174 NIn Masterlist but not notified
19 7 1689 307 P/PWS/B/W
91 NE2501 Bhoslewadi-1 188 N Notified 31 9 4049 736 P/PWS/B/W
92 NE2603 Lashkaribagh-1 189 N Notified 31 9 1638 298 P/PWS/B/W
93 NE2602 Lashkaribagh-2 234 N Notified 31 9 1424 259 P/PWS/B/W
94 NE2401 Indira Jyoti Nagar 242 N Notified 31 9 865 159 P/PWS/B/W

95 NE2701 NITE 25: Unit No.2 380 NIn Masterlist but not notified
31 9 293 53 P/PWS/B/W
96 NE2601 NITE39: Unit 1 394 NIn Masterlist but not notified
31 9 0 0 P/PWS/B/W
97 NE2502 Slum Near Noga Factory 406 N Notified 31 9 806 146 P/PWS/B/W
98 NE2503 South of Noga Factory 925 N Not in Masterlist `98 31 9 700 100 P/PWS/B/W
99 NE2505 Matatoli (Motibagh) Basor Basti 966 N Not in Masterlist `98 31 9 110 20 P/PWS/B/W
100 NE2606South of Lashkaribagh (Calcutta Rly.Line)
976 N Not in Masterlist `98 31 10 500 70 P/PWS/B/W
101 CE1004 Bairagipura 166 N Notified 34 7 1520 276 P/PWS/B/W
102 CE0801 Tandapeth 167 N Notified 34 7 16245 2953 P/PWS/B/W
103 CE1003 Khairipura 168 N Notified 34 7 2938 716 P/PWS/B/W
104 CE0901 Naikwadi, Lendi Talao 183 N Notified 34 7 2599 472 P/PWS/B/W
105 CE0902 Ram Nagar 184 N Notified 34 7 1053 191 P/PWS/B/W
106 NE2801 Balabhaupeth 190 NIn Masterlist but not notified
34 9 Yes Yes 5017 912 P/PWS/B/W
107 CE0701 Thakkargram (1) 191 N Notified 34 33 7 Yes Yes 1657 301 P/PWS/B/W
108 CE0702 Thakkargram (2) 192 N Notified 34 7 Yes Yes 1703 310 P/PWS/B/W
109 CE0802 Chandrabhaga Nagar 206 N Notified 34 7 5211 947 P/PWS/B/W
110 CE1005 Bairagipura (2) 231 NIn Masterlist but not notified
34 7 Yes 5075 992 P/PWS/B/W
111 CE0703 East of Thakkargram 928 N Not in Masterlist `98 34 7 900 163 P/PWS/B/W
112 NE0502 Bada Indora 198 N Notified 15 10 806 146 P/PWS/B/W
113 NE0904 Devi Nagar 336 N Notified 16 9 592 107 P/PWS/B/W
114 NE0602 Shravasti Nagar 217 N Notified 2 9 Yes Yes 1707 287 P/PWS/B/W
115 NE3301 Rajeev Gandhi Nagar 181 N Notified 3 9 2150 307 P/PWS/B/W
116 CE1002 Bangla Desh (1) 225 N Notified 34 7 Yes Yes 7150 1300 P/PWS/B/W
117 CE1001 Bangla Desh (2) 226 N Notified 34 7 Yes Yes 637 115 P/PWS/B/W
193065 33890
1 SE1701 Manewada village 280 S Notified 7 8 3 Yes Yes 1700 309 P/PWS/B/W
2 SE0703 Jogi Nagar 271 S Notified 8 3 5000 910 P/PWS/B/W
3 SE2001 Mang Garodi Toli 281 S Notified 8 3 1800 327 P/PWS/B/W
4 SE0701 Dhadiwal Nagar 288 S Notified 8 3 1500 273 P/PWS/B/W
85 SE1102 Rahul Nagar 405 S Notified 8 3 300 55 P/PWS/B/W
6 SE2002 Rahate Nagar 945 S Not in Masterlist `98 8 3 1200 218 P/PWS/B/W
7 SE2003 Ramteke Nagar 946 S Not in Masterlist `98 8 3 2200 400 P/PWS/B/W
8 SE2201 Sonaji Kaikadi Nagar 973 S Not in Masterlist `98 8 3 1000 182
9 SE0609 Babulkheda 245 SIn Masterlist but not notified
24 3 5426 986 P/PWS/B/W
10 SE0607 Ambedkar Nagar 268 S Notified 24 3 169 35 P

11 SE1002 Savatribai Fuley Nagar 276 S Notified 24 3 Yes Yes 4500 818 P
12 SE0608 Kunjilal Peth 283 S Notified 24 3 3000 545 P/PWS/B/W
13 SE1101 Vasant Nagar 284 SIn Masterlist but not notified
24 3 1832 333 P/PWS/B/W
14 SE1001 Ramamai Nagar 346 S Notified 24 3 400 73 P/PWS/B/W
15 SE1003 Bajrang Nagar 347 S Notified 24 3 300 55 P/PWS/B/W
16 SE0603 New Babulkheda 255 S Notified 25 4 Yes Yes 1845 329 P/PWS/B/W
17 SE0605 Joshiwadi 262 S Notified 25 4 650 118 P/PWS/B/W
18 SE0702 Bhim Nagar 264 S Notified 25 4 1925 350 P/PWS/B/W
19 SE0606 Jaibhim Nagar 289 S Notified 25 4 10000 1818 P/PWS/B/W
20 SE0602 Kausalya Nagar 404 S Notified 25 4 Yes Yes 2708 492 P/PWS/B/W
21 SE0501 Sayyad Baba Dargah 941 S Not in Masterlist `98 25 4 Yes Yes 350 64 P/PWS/B/W
22 CE3704 Gulab baba Zopadpatti 270 S Notified 38 6 364 66 P/PWS/B/W
23 SE0801 Vakilpeth 265 S Notified 39 3 Yes Yes 3000 545 P/PWS/B/W
24 SE0902 Adiwasi Gondtoli 269 S Notified 39 3 500 90 P/PWS/B/W
25 SE0302 Rambagh 244 S Notified 40 3 Yes Yes 2805 510 P/PWS/B/W
26 SE0201 Kafala Basti 267 S Notified 40 3 Yes Yes 600 74 P/PWS/B/W
27 SE0403 Jattarodi 272 S Notified 40 3 Yes Yes 3802 725 P/PWS/B/W
28 SE0401 Borkar Nagar,Basod Mahalla 274 S Notified 40 3 Yes Yes 1500 117 P/PWS/B/W
29 SE0303 Imamwada - 1 282 SIn Masterlist but not notified
40 3 Yes Yes 2177 396 P/PWS/B/W
30 SE0402 Indira Nagar Jattarodi (2) 348 S Notified 40 3 Yes Yes 3600 283 P/PWS/B/W
31 SE0202 Jat Tarodi Behind Kundanlal Lib. 349 S Notified 40 3 230 42 P/PWS/B/W
32 SE0404 Jat Tarodi - 2 350 S Notified 40 3 Yes Yes 2000 255 P/PWS/B/W
33 SE0101 Timber Market Sweeper Colony 398 SIn Masterlist but not notified
40 3 1052 191 P/PWS/B/W
34 SE0203 East of Kafla Bastee 958 S Not in Masterlist `98 40 3 Yes Yes 231 47 P/PWS/B/W
35 SE0405 North of Borkar Nagar 977 S Not in Masterlist `98 40 3 Yes Yes 736 99 P/PWS/B/W
36 SW0904 Takiya Dhantoli 246 S Notified 41 4 Yes Yes 707 128 P/PWS/B/W
37 SW0601 Kumbhartoli (1) 249 S Notified 41 4 Yes Yes 2247 408 P/PWS/B/W
38 SW0301 Gavalipura Tekadi 250 S Notified 41 4 4669 850 P/PWS/B/W
39 SW0401 Anand Nagar 252 S Notified 41 4 Yes 1001 181 P/PWS/B/W
40 SW0901 Takiya Dhantoli(2)Saraswati Nagar 258 S Notified 41 4 Yes Yes 1430 260 P/PWS/B/W
41 SW0902 Takiya Dhantoli (3) Saraswati Nagar 259 S Notified 41 4 Yes Yes 2380 386 P/PWS/B/W
42 SW3501 Choti Dhantoli 260 S Notified 41 4 546 100 P/PWS/B/W
43 SW0503 Netaji Market 266 S Notified 41 4 Yes 392 70 P/PWS/B/W
44 SW0501 Zopadpatti near Yeshwant Stadium 286 SIn Masterlist but not notified
41 4 Yes 952 173 P/PWS/B/W

45 SW0602North of Kumbhartoli Toli (Chandani Nagar)
938 S Not in Masterlist `98 41 4 Yes 532 97 P/PWS/B/W
46 SW0903 S-E of Takiya Dhantoli (3) 939 S Not in Masterlist `98 41 4 Yes 70 12 P/PWS/B/W
47 SW0502 Sangam 950 S Not in Masterlist `98 41 4 Yes 308 56 P/PWS/B/W
48 CE3501 Gadikhana 248 S Notified 42 4 Yes 3847 700 P/PWS/B/W
49 CE2801 Zopadpatti near new S.T.stand 275 S Notified 42 4 364 66 P/PWS/B/W
50 CE3601 Karnalbagh - 2 279 SIn Masterlist but not notified
42 4 143 26 P/PWS/B/W
51 CE2401 Adarsh Indiramata Nagar 409 SIn Masterlist but not notified
43 6 526 96 P/PWS/B/W
52 SE0601 Kukde Layout 253 S Notified 25 4 Yes Yes 2068 376 P/PWS/B/W
53 SE0604 Chaudhari Mohalla 261 S Notified 25 4 Yes Yes 1500 196 P/PWS/B/W
54 CE3801 Siraspeth,Saraipeth 247 S Notified 38 6 7810 1420 P/PWS/B/W
55 SE0901 Somwaripeth (2) 251 S Notified 39 3 Yes Yes 968 158 P/PWS/B/W
56 SE0301 Imamwada-1 254 S Notified 40 3 Yes Yes 1100 162 P/PWS/B/W
57 CE3602 Karnalbagh 257 S Notified 42 4 4224 768 P/PWS/B/W
58 CE2601 Sindikhana, Mangpura 263 S Notified 42 4 2495 454 P/PWS/B/W
59 CE2701 Gujarwadi 277 S Notified 42 4 1657 301 P/PWS/B/W
85516 14829
1 NW0401 Borgaon Gittikhadan 091 W Notified 1 10 Yes Yes 1725 313 P/PWS/B/W
2 NW0701 Zingabai Takli 132 W Notified 1 10 Yes Yes 910 165 P/PWS/B/W
3 NW0101 Gorewada Village 133 W Notified 1 10 1745 317 P/PWS/B/W
4 NW0901 Mankapura Village 134 WIn Masterlist but not notified
1 10 260 47 P/PWS/B/W
5 NW0402 Adiwasinagar(Borgaon) 152 W Notified 1 10 Yes Yes 430 78 P/PWS/B/W
6 NW1101 Mankapur Zopadpatti 399 W Notified 1 10 3210 583 B/W
7 NW0801 South of Zingabai Takli 904 W Not in Masterlist `98 1 10 365 66 P/B/W
8 NW0102 North of Gorewada Village 905 W Not in Masterlist `98 1 10 630 114 P/PWS
9 NW1001 North of Mankapur Zopadpatti 906 W Not in Masterlist `98 1 10 550 101
10 NW0602 Sonpur Village 907 W Not in Masterlist `98 1 10 266 36 B/W
11 NW1801 North of Raj Nagar 920 W Not in Masterlist `98 1 10 1795 326 B/W
12 NW0702 Zingabai Takli (North) 952 W Not in Masterlist `98 1 10 Yes Yes 3000 545 P/PWS/B/W
13 SW3101 Somalwada-1 109 W Notified 9 2 Yes Yes 4396 571 P/PWS/B/W
14 SW2702 Ramabai Ambedkar Nagar 127 W Notified 9 2 3458 628 P/PWS/B/W
15 SW3401 Shivangaon Village 140 WIn Masterlist but not notified
9 2 3402 618 B/W/W
16 SW3001 Sonegaon 141 WIn Masterlist but not notified
9 2 1162 211 B/W/W
17 SE1901 Chinchbhawan 142 WIn Masterlist but not notified
9 2 1500 272 B/W/W
18 SW2701 Jaitala Village 145 WIn Masterlist but not notified
9 2 6013 1093 P/PWS/B/W

19 SW2601 Ekatmata Nagar 343 W Notified 9 2 Yes Yes 4564 586 B/W/W
20 SW3601 Shivpuri 923 W Not in Masterlist `98 9 2 266 48
21 SW3002 Rahmat Nagar 942 W Not in Masterlist `98 9 2 231 42 P/PWS/B
22 SE2101 New Vaishali Nagar 949 W Not in Masterlist `98 9 2 Yes Yes 488 111 P/PWS/B/W
23 SW2703 South West of Jaitala Village 959 W Not in Masterlist `98 9 2 168 31
24 SW2601 East of Ekatmata Nagar 960 W Not in Masterlist `98 9 2 Yes 26 6 B/W/W
25 SE1902Shantiniketan Nagar (West of Chinchbhavan)
969 W Not in Masterlist `98 9 2 Yes Yes 285 59 P/PWS/B/W
26 SW1503 Kamgar Nagar 107 W Notified 10 2 Yes Yes 4060 503 P/PWS/B/W
27 SW1502 Tukdoji Nagar 108 W Notified 10 2 Yes Yes 3689 440 P/PWS/B/W
28 SW1701 Gopal Nagar, Vijay Nagar 111 W Notified 10 2 Yes Yes 511 55 P/PWS/B/W
29 SW1501 Subhash Nagar 137 WIn Masterlist but not notified
10 2 1295 235 P/PWS/B/W
30 SW1601 Parsodi Village 138 WIn Masterlist but not notified
10 2 959 174 P/PWS/B/W
31 SW2801 Bhamti 143 W Notified 10 2 700 127 P/PWS/B/W
32 SW1301 Takli Seem 144 WIn Masterlist but not notified
10 2 1638 298 P/PWS/B/W
33 SW1401 NITE4: Kh.No.42/3Takliseem 359 WIn Masterlist but not notified
10 2 105 20 P/PWS/B/W
34 SW1505 Ambedkar Nagar 403 W Notified 10 2 Yes Yes 245 45 P/PWS/B/W
35 SW1504 East of Kamgar Colony 940 W Not in Masterlist `98 10 2 455 62 P/PWS/B/W
36 NW2504 Futala Basti Juni 096 W Notified 11 1 Yes Yes 2045 253 P/PWS/B/W
37 NW2502 New Futala Basti-1 098 W Notified 11 1 Yes Yes 2513 457 P/PWS/B/W
38 NW2503 New Futala Basti 101 W Notified 11 1 Yes Yes 990 180 P/PWS/B/W
39 SW1107 Ambazari Pandharabodi 105 W Notified 11 1 Yes Yes 5040 591 P/PWS/B/W
40 SW1201Ambazari Pandhrabodi (West of Gandhinagar layout)
105 W Notified 11 1 5397 981 P/PWS/B/W
41 SW1101 New Pandhrabodi 116 W Notified 11 1 Yes Yes 1995 249 P/PWS/B/W
42 SW1106 Sewa Nagar 123 W Notified 11 1 Yes Yes 1133 261 P/PWS/B/W
43 SW1003 Sanjay Nagar 136 W Notified 11 1 Yes Yes 4123 586 P/PWS/B/W
44 SW1104 Sudamnagri 157 WIn Masterlist but not notified
11 1 3185 579 P/PWS/B/W
45 SW1108 Jyoti Nagar 158 WIn Masterlist but not notified
11 1 434 78 P/PWS/B/W
46 SW1702 Joshiwadi 160 W Notified 11 1 273 50 P/PWS/B/W
47 SW1105 NITE5: Kh.No.53/1J Mz.-Ambazari 360 WIn Masterlist but not notified
11 1 252 46 P/PWS/B/W
48 SW1103NITE 11: Kh. No. 49 Mz.- Pandhrabodi
366 WIn Masterlist but not notified
11 1 0 0 P/PWS/B/W
49 SW1001N-W of Sanjay Nagar Along University Campus Compound Wall
947 W Not in Masterlist `98 11 1 Yes 28 9 P/PWS/B/W
50 SW1002North of Sanjay Nagar Along LIT Compound Wall
948 W Not in Masterlist `98 11 1 Yes 91 17 P/PWS/B/W
51 NW1601 Gittikhadan 090 W Notified 12 13 1 Yes Yes 3445 626 P/PWS/B/W
52 NW1201 Dabha Basti 097 W Notified 12 1 Yes Yes 1065 193 P/PWS/B/W
53 NW2701 Kachimet Wadi (Village Abadi) 099 W Notified 12 1 Yes Yes 1205 219 B/W

54 NW1402 Hajari Pahad 100 W Notified 12 1 Yes Yes 1585 288 P/PWS/B/W
55 NW1602 Rajeev Gandhi Nagar 113 W Notified 12 1 Yes Yes 1015 184 P/PWS/B/W
56 NW1501 Surendragarh 112 W Notified 12 1 Yes Yes 7690 1398 P/PWS/B/W
57 NW1603 Vishwas Nagar 114 W Notified 12 1 Yes Yes 1225 223 P/PWS/B/W
58 NW0202 Makardhokda 124 W Notified 12 1 Yes Yes 575 104 P/PWS/B/W
59 NW1701 Manavta Nagar 153 W Notified 12 1 1935 352 P/PWS/B/W
60 NW0201 Jagadish Nagar 333 W Notified 12 1 2260 410 B/W/W
61 NW0301 Bornala 334 W Notified 12 1 190 34
62 NW1502 Pannalal Deshraj Nagar 341 W Notified 12 1 Yes Yes 3335 606 P/PWS/B/W
63 NW1702 Vikas Nagar 355 W Notified 12 1 Yes Yes 295 53
64 NW1202 West of Bhivsenkhori Notified Area 915 W Not in Masterlist `98 12 1 Yes Yes 2345 426 P/PWS/B/W
65 NW1301 Ganga Nagar 916 W Not in Masterlist `98 12 1 1820 330 B/W
66 NW1401 North of Hazari Pahad 917 W Not in Masterlist `98 12 1 Yes Yes 525 95 P/PWS/B/W
67 NW1403 South of Hazari Pahad 918 W Not in Masterlist `98 12 1 Yes Yes 1220 221 P/PWS/B/W
68 NW1604 South of Rajeev Nagar 919 W Not in Masterlist `98 12 1 85 15 P/PWS/B/W
69 NW2501 North of New Futala Basti 935 W Not in Masterlist `98 12 1 Yes Yes 645 117 P/PWS/B/W
70 NW1703 Ramgiri Zopadpatti 972 W Not in Masterlist `98 12 1 300 54 P/PWS/B/W
71 NW0502 Gittikhadan 092 WIn Masterlist but not notified
13 10 Yes Yes 2144 362 P/PWS/B/W
72 NW1605 Krishna Nagar, Azad Nagar 093 W Notified 13 10 Yes Yes 5950 1082 P/PWS/B/W
73 NW2002 Sadar Mahapura 094 WIn Masterlist but not notified
13 10 Yes Yes 2660 483 P/PWS/B/W
74 NW2001 Sadar Dhobipuda 095 W Notified 13 10 Yes Yes 1310 238 P/PWS/B/W
75 NW1903 Gondpura Tiger Gap 115 W Notified 13 10 Yes Yes 1715 312 P/PWS/B/W
76 NW0501 Dashrath Nagar 147 W Notified 13 10 Yes Yes 1570 257 P/PWS/B/W
77 NW0601 Police Line Takli 159 W Notified 13 10 455 82 P/PWS/B/W
78 NW1902North of Gondpura (Tigergap) Adjoining School
921 W Not in Masterlist `98 13 10 Yes Yes 130 23 P/PWS/B/W
79 NW1901West of Gondpura (Tigergap) Around Ground
922 W Not in Masterlist `98 13 10 Yes Yes 995 181 P/PWS/B/W
80 NW0503Adiwasi Nagar (south of yogendra Nagar)
974 W Not in Masterlist `98 13 10 Yes Yes 400 79 P/B/W
81 NW2203 Mangalwari Bazar Zopadpatti 230 WIn Masterlist but not notified
14 10 380 69 P/PWS/B/W
82 SW2303 Ajani Old Abadi 088 W Notified 26 2 Yes Yes 1820 330 P/PWS/B/W
83 SW2301 Ajani Chuna Bhatti 089 WIn Masterlist but not notified
26 2 1113 202 P/PWS/B/W
84 SW2302 Ambika Nagar 118 W Notified 26 2 Yes Yes 448 61 P/PWS/B/W
85 SW2402 Sahakar Nagar 119 W Notified 26 2 Yes Yes 1043 141 P/B/W
86 SW2401 Rajeev Nagar 128 W Notified 26 2 Yes Yes 805 107 B/W
87 SW2502 Priyanka wadi 150 W Notified 26 2 Yes Yes 525 95 B/W
88 SW3201 Mahatma Phule Nagar 335 W Notified 26 2 301 55

89 SW2501 Rahul Nagar 352 W Notified 26 2 Yes Yes 1064 158 B/W
21 SW3301 Panchadeep Nagar 944 W Not in Masterlist `98 26 2 287 52 B/W
90 SW2903 Khamla 106 WIn Masterlist but not notified
27 2 1512 275 P/PWS/B/W
91 SW2001 Shiv Nagar 110 W Notified 27 2 Yes Yes 616 76 P/PWS/B/W
92 SW2901 Changdeo Nagar 126 W Notified 27 2 Yes Yes 217 27 P/PWS/B/W
93 SW1901 Shyam Nagar 129 W Notified 27 2 Yes Yes 693 97 P/PWS/B/W
94 SW2002 Gautam Nagar (Khamla) 130 W Notified 27 2 Yes Yes 308 40 P/PWS/B/W
95 SW2101 Danteshwari 131 W Notified 27 2 Yes Yes 2072 178 P/PWS/B/W
96 SW2902 Khamla Zopadpatti 139 WIn Masterlist but not notified
27 2 2198 400 P/PWS/B/W
97 SW2201 Kaikadi Nagar 149 W Notified 27 2 Yes Yes 287 35 P/PWS/B/W
98 SW2102 Danteshwari 342 W Notified 27 2 Yes Yes 371 68 P/PWS/B/W
99 SW2103 Dalpetshah Nagar 401 W Notified 27 2 Yes Yes 581 61 P/PWS/B/W
100 SW0701 Kachipura-1 103 W Notified 28 2 1400 254 P/PWS/B/W
101 SW0801 Kachipura-2 104 W Notified 28 2 Yes Yes 1862 338 P/PWS/B/W
102 SW1801 Laxmi Nagar Zopadpatti 125 W Notified 28 2 Yes Yes 644 103 P/PWS/B/W
103 SW0702 Central Part of Kachipura 936 W Not in Masterlist `98 28 2 406 74 P/PWS/B/W
104 SW0802 West of Kachipura - 2 951 W Not in Masterlist `98 28 2 Yes Yes 210 38 P/PWS/B/W
105 SW0101 Gond Toli, Marar Toli 102 W Notified 29 1 Yes Yes 3325 600 P/PWS/B/W
106 SW0202 Gadga Zopadpatti 155 WIn Masterlist but not notified
29 1 742 135 P/PWS/B/W
107 SW0201S-W of Gadga Zopadpatti (Dr. Ambedkar Nagar)
937 W Not in Masterlist `98 29 1 195 35 P/PWS/B/W
108 NW2601 Mariyam Nagar 122 W Notified 30 10 1085 197 P/PWS/B/W
109 SW0203 Gaulipura behind Dick Dispensary 135 WIn Masterlist but not notified
30 10 525 95 P/PWS/B/W
110 SW0204 Indira Nagar(near football ground) 154 WIn Masterlist but not notified
30 10 1827 332 PWS/BW
138962 23223
TOTAL 714425 124274

NMC, Water Audit & Leak Detection DPR, Slum Policy
Shah Technical Consultants Pvt. Ltd, Mumbai 66
Table-B
ABSTRACT OF FLOW STUDIES CARRIED OUT IN RAMBAGH SLUMS
Sr. No.
Location of Meter Flow Per Day
i) 3” size meter near Sarla Bhavan (only 10% flow considered) major flow in Imambada slum.
30,520 Litrs.
ii) 2” size meter near Adarsh Electricals 1,05,200 Ltrs.
iii) 4” size meter in front of Gawali’s House 5,82,700 Ltrs.
iv) 2” size meter near Mukesh Furnitures 1,78,866 Ltrs.
v) 6” size meter in front of 1st Flight Courier 98,000 Ltrs.
vi) 4” size meter near 1st Flight Courier 1,75,000 Ltrs.
vii) 4” size meter opposite 1st Flight Courier (only 2/3 flow considered as it served the H.B. Colony also)
1,46,666 Ltrs.
viii) 4” size meter near Baidyanath Square 53,500 Ltrs.
TOTAL 13,70,452 Ltrs.
Population of slum 2455 13,70,452 ∴ LPCD _________
2455 = 558

NMC, Water Audit & Leak Detection DPR, Slum Policy
Shah Technical Consultants Pvt. Ltd, Mumbai 67
Table-C
ABSTRACT OF FLOW STUDIES CARRIED OUT IN PANDHARABODI AND ALLIED SLUMS
Sr. No.
Location of Meter Flow Per Day
i) Inlet near P.S. Shende’s House 2,03,472 Litrs.
ii) 6” size connection near kalimata Mandir 32,000 Ltrs.
iii) 4” size @ Seva Nagar 4,000 Ltrs.
iv) 4” size near Rajat Kirana Stores 84,780 Ltrs.
v) 6” size near Trust Layout 2,06,660 Ltrs.
vi) 4” size near Piyush Jwellers 65,000 Ltrs.
TOTAL 5,95,912 Ltrs.
Population of slum 6392 (year Sept., 2002) 5,95,912 ∴ LPCD _________
6392 = 93.22 Ltrs.

NMC, Water Audit & Leak Detection DPR, Slum Policy
Shah Technical Consultants Pvt. Ltd, Mumbai 68
Table-D
CPHEEO Norms Regarding Water Supply
2.2.8.3 RECOMMENDATIONS For communities with population upto 20,000. a) Water Supply
through stand post 40 LPCD (min.)
i)
b) Water Supply through house service connection 70 to 100 LPCD
ii) For communities with population 20,000 to 1,00,000
100 to 150 LPCD
For communities with population above 1,00,000
The Environmental Hygiene Committee suggested certain optimum rates for communities based on population groups. In the Code of Basic Requirements of Water Supply, Drainage and Sanitation (IS:1172-1983) as well as the National Building Code a minimum of 135 LPCD has been recommended for all residences provided with full flushing system for excreta disposal. However the Manual on Sewerage and Sewage Treatment recommends a minimum supply of 150 LPCD wherever sewerage is contemplated. After reviewing the recommendations on requirements for domestic, non-domestic, fire demand and industrial needs made in the earlier manuals, considering the prevailing practices and trends in the other countries and taking into account the feasibility and minimum needs, the following recommendations are made.
iii)
150 to 200 LPCD (a) Domestic and Non-Domestic Needs While a minimum of 70 to 100 LPCD may be considered adequate for the domestic needs of urban communities, the non-domestic needs listed above would vary with their size and economic importance, requiring from 25 to 100 LPCD in addition. As a general rule, the following rates per capita per day are considered minimum for domestic and non-domestic needs.
Further, the requirements of each case will have to be studied with reference to local factors governing the different non-domestic needs before the optimum rate of supply for the community is decided upon.

ANNEXURES

Annexure-1 (Cost of Water Rated Capacity of 470 mld)

NMC, Water Audit & Leak Detection DPR, Annexure-1
Shah Technical Consultants Pvt. Ltd, Mumbai 69
Annexure-1
Cost of Water for Rated Capacity of 470 Mld (Based on 2003-2004 revised budget)
Fixed Cost
Establishment Expenses 5.50 Crore
O & M Expenses 7.02 Crore
Loan Repayment 26.20 Crore
TOTAL 38.72 Crore Rs. 2.25/Unit
Variable Cost 34.36 Crore Rs. 2.00/Unit
Development Cost* 22.13 Crore Rs. 1.30/Unit
Net TOTAL 95.21 Crore
Total cost on rated capacity of WTP Rs. 5.55/Unit
*Development cost taken in line of sinking fund / Depreciation. 470 Cost of water on billed = 5.55 X = 10.82/Unit 241

Annexure-2 (Major Leak Detection)

STC, Mumbai NMC, Water Works Dept., Nagpur
Sr. No.
Description Life of
Leakage [Years]
Supply Hrs.
Water Loss in
MLD
Annual Loss @ Rs. 5.55 /
Unit
Page No.
1Near Godhani [ Bypass Pump Station Road] [Air Valve]
1 24 0.0094 19078 L-1
2Gorewada Tank Seapage + PWTM Leakages
>15 24 4.7389 9599893 L-2
3Pench - I [Gorewada, Back Wash Water of Sand Filters at WTP]
>15 24 3.4878 7065499 L-4
4Pench - II [Gorewada, Back Wash Water of Sand Filters at WTP]
>15 24 3.0647 6208348 L-5
5Backwash Water Leakage at WTP, Pench -II [Lead Joint Leakage]
1/12 24 0.4032 67133 L-7
6Pench - III [Gorewada, Back Wash Water of Sand Filters at WTP]
>3 24 0.5561 1126560 L-8
7Kanhan- old [Back Wash Water of Sand Filters at WTP]
>15 24 2.6301 5327928 L-10
8Kanhan-New [Back Wash Water of Sand Filters at WTP]
>15 24 3.3521 6790601 L-12
9WTP Leakage, Other then Backwash [Kanhan River ]
1 24 4.5519 9599893 L-13
10Kanhan Line [Air Valve Leakage Infront of Fookat Nagar,Chamar Nallah]
1 24 0.0751 434563 L-14
11Pure Water Rising Main, From WTP to Seminery Hills.Gorewada, [Sluice Valve Leakage]
1 24 0.0610 123547 L-15
12Seminary Hills MBR [Pench-II] Air Valve Leakage
5 24 0.0691 140020 L-16
13Pure Water Supply Main, From Seminary Hills, Lourd Mata Mandir [Pipe Leakage]
1 24 0.0599 121259 L-17
14Seminary Hills [MBR Seepage, Near Mini Railway Track]
20 24 0.4680 1896219 L-18
15Loha Pulliya [Lead Joint Leakage at Wanjari Nagar ESR Feeder]
1 24 0.2145 434563 L-19
16Opp. Arun Automobile [Air Valve Leakage, Ghat Road]
1 24 0.0123 24854 L-20
17 Murgiwala Valve [Near Tukdoji Putla] 3 5 0.0120 24309 L-2118 Evaporative Loss at Gorewada Tank >15 24 4.3800 8872785 L-2219 Seepage loss at Fort GSR >15 24 0.1486 301026 L-23
28.2949 5817807620 General Leakages Observed L-24
LIST OF DISCOVERED LEAKAGES & MAJORED WATER LOSSES
Total
MAJOR LEAK DETECTION PLANANNEXURE - 2
SUMMARY SHEET
Water Audit, Leak Detection Plan L1 Studied By:- DINESH RATHI ASSOCIATES

STC, Mumbai NMC, Water Work Dept., Nagpur
SR. NO.1234
DETAILS OF SURVEY
SR. NO.1234
SR. NO. Time in Sec.Loss of water due to leakage
Liters.
FLOW LPS
1 184 20.00 0.1092 182 20.00 0.1103 182 20.00 0.110
0.109
Life of Leakage 1 Years
24 Hrs.
9460 Lits/day
0.0095 MLD
3452938 Lits/Annum
3453 Units/annum
Cost of Water per Unit 5.55 Rs. / Unit
Cost of Leakage per Annum 19164 Rs. / Annum
Pl. Note: Nearby Shephard are using this water for drinking.
LEAK DETECTION PLAN
Dinesh Rathi & Associates, Nagpur
Total Vol. of Water lost per Day
Total Vol. of Water lost per Annum
Total Unit of Water lost per Annum
FLOW READING DETAILS.
Supply Hours
Total Vol. of Water lost per Day
Measurement Method Bucket Filling Method
Average Flow in LPS
5 Leak Detection Team Members 1. Deepak Shiv2. Manish Doye3. Diman Biswas
Name of AgencyDate of Testing 5th March 2004Time 11:50 A.M. to 12:10 P.M.
1300 mmAir Valve Size 100 mm
DETAILS DESCRIPTION
LEAK DETECTION TEST
DETAILS OF LEAKAGEDETAILS DESCRIPTION
Location Near Godhani [ Bypass Pump Station Road]Type of leakage Air ValveMain Pipe Dia.
Water Audit, Leak Detection Plan [L-1] Studied By :- DINESH RATHI & ASSOCIATES

STC, Mumbai NMC, Water Work Dept., Nagpur
LEAK DETECTION TEST
SR. NO.
1
23 0.457 m
DETAILS OF SURVEY
SR. NO.
1 Dinesh Rathi & Associates, Nagpur23
24 hrs.
1 No.
0.45 m
0.225 m
0.225 m
To Calculate è
Dim A 0.225 m
Dim B 0.000 m
è 1.571 radians
Wetted Area A = R2( è - ( (sin(2è)) / 2 ) 0.079522 m2
To Calculate Velocity
Length of Pipe (L) 2.438 m
Time in secs (T) 4 sec
Velocity V = L / T 0.6095 m/s
= A x V 0.04847 m3/Sec
4187669 Lits/day
4.1877 MLD
1528499251 Lit / Annum
1528499 Unit / Annum
5.55 Rs./Unit
Cost of Leakage per Annum 8483171 Rs./Annum
LEAK DETECTION PLAN
DESCRIPTION
2. Arun Kumar Shah3. Diman Biswas
DETAILS
5 th January 2005Time 12:30
Name of Agency
1. Rajendra Jagtap
Date of Testing
DETAILS DESCRIPTION
Pipe Dia.
Type of LeakageGorewada Tank seepage & Old Gorewada Pure Water Rising Main Leakage)
Location Gorewada
DETAILS OF LEAKAGE
Water Depth From Top edge of Pipe
4 Leak Detection Team Members
Dia. D
Radius R
Flow Reading Details
5. Sunil Madavi4. Ravi Aloni
Duration of Flow
No. of Pipes
Total Vol. of Lost per Annum
Total Unit. of Lost per Annum
Cost of Water per Unit
Volume of Water Lost Q
Total Vol. of water lost per Day
Total Vol. of water lost per Day
Water Audit, Leak Detection Plan [L-2] Studied By :- DINESH RATHI & ASSOCIATES

STC, Mumbai NMC, Water Work Dept., Nagpur
5 Lit / Sec
432000 Lits/day
0.4320 MLD
157680000 Lit / Annum
157680 Unit / Annum
5.55 Rs./Unit
Cost of Leakage per Annum 875124 Rs./Annum
Combined Loss of Water 4619669 Lits/day
4.620 MLD
1686179251 Lit / Annum
1686179 Unit / Annum
5.55 Rs./Unit
Combined Cost 9358295 Rs./Annum
Total Vol. of water lost per Day
Total Vol. of water lost per Day
Total Vol. of Lost per Annum
Total Unit. of Lost per Annum
Cost of Water per Unit
Volume of Water Pumped to Fetry Village
Total Vol. of water lost per Day
Total Vol. of water lost per Day
Total Vol. of Lost per Annum
Total Unit. of Lost per Annum
Water Audit, Leak Detection Plan [L-3] Studied By :- DINESH RATHI & ASSOCIATES
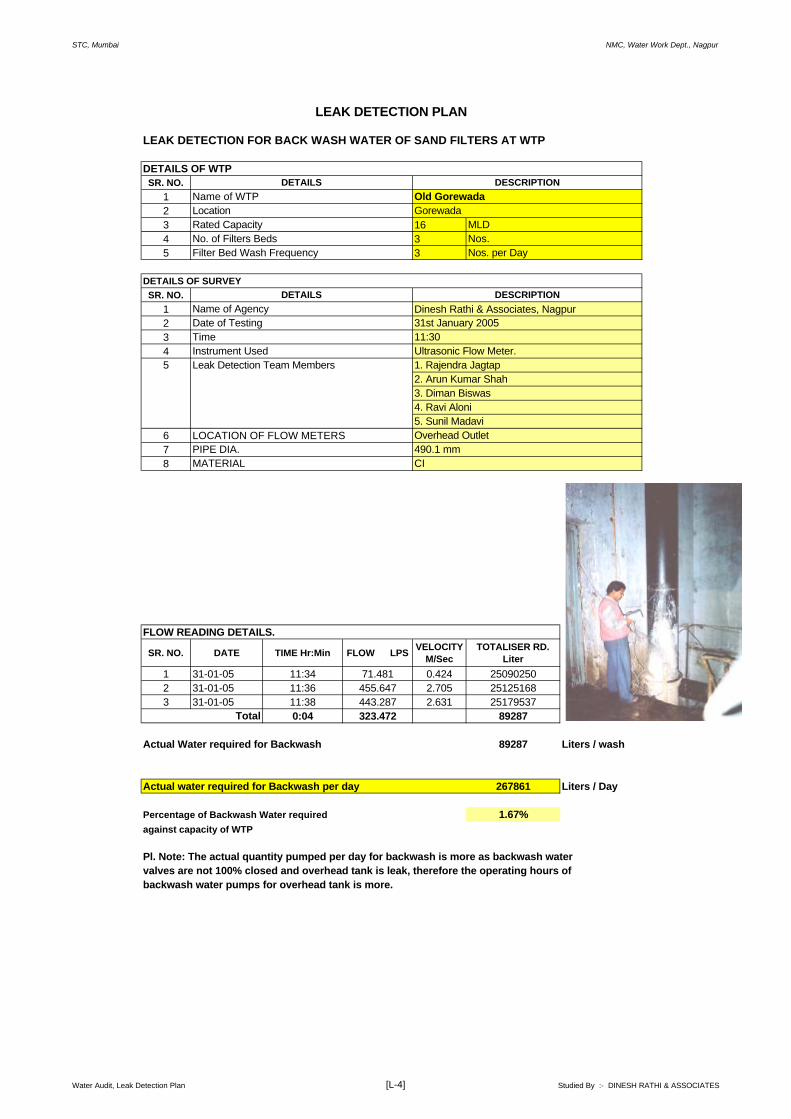
STC, Mumbai NMC, Water Work Dept., Nagpur
LEAK DETECTION FOR BACK WASH WATER OF SAND FILTERS AT WTP
DETAILS OF WTPSR. NO.
123 164 35 3
DETAILS OF SURVEY
SR. NO.
1 Dinesh Rathi & Associates, Nagpur234
6 LOCATION OF FLOW METERS78
FLOW READING DETAILS.
SR. NO. DATE TIME Hr:Min FLOW LPSVELOCITY
M/SecTOTALISER RD.
Liter
1 31-01-05 11:34 71.481 0.424 250902502 31-01-05 11:36 455.647 2.705 251251683 31-01-05 11:38 443.287 2.631 25179537
0:04 323.472 89287
Actual Water required for Backwash 89287 Liters / wash
Actual water required for Backwash per day 267861 Liters / Day
Percentage of Backwash Water required 1.67%against capacity of WTP
Pl. Note: The actual quantity pumped per day for backwash is more as backwash water valves are not 100% closed and overhead tank is leak, therefore the operating hours of backwash water pumps for overhead tank is more.
LEAK DETECTION PLAN
MATERIAL
11:30
Total
Ultrasonic Flow Meter.
Nos.Nos. per Day
5. Sunil Madavi
490.1 mmCI
Instrument Used
PIPE DIA.
Leak Detection Team Members5
Filter Bed Wash Frequency
1. Rajendra Jagtap
DETAILS
3. Diman Biswas
Date of TestingTime
4. Ravi Aloni
31st January 2005Name of Agency
DESCRIPTION
Old GorewadaGorewada
MLD
DETAILS
Name of WTPLocationRated CapacityNo. of Filters Beds
2. Arun Kumar Shah
Overhead Outlet
DESCRIPTION
Water Audit, Leak Detection Plan [L-4] Studied By :- DINESH RATHI & ASSOCIATES
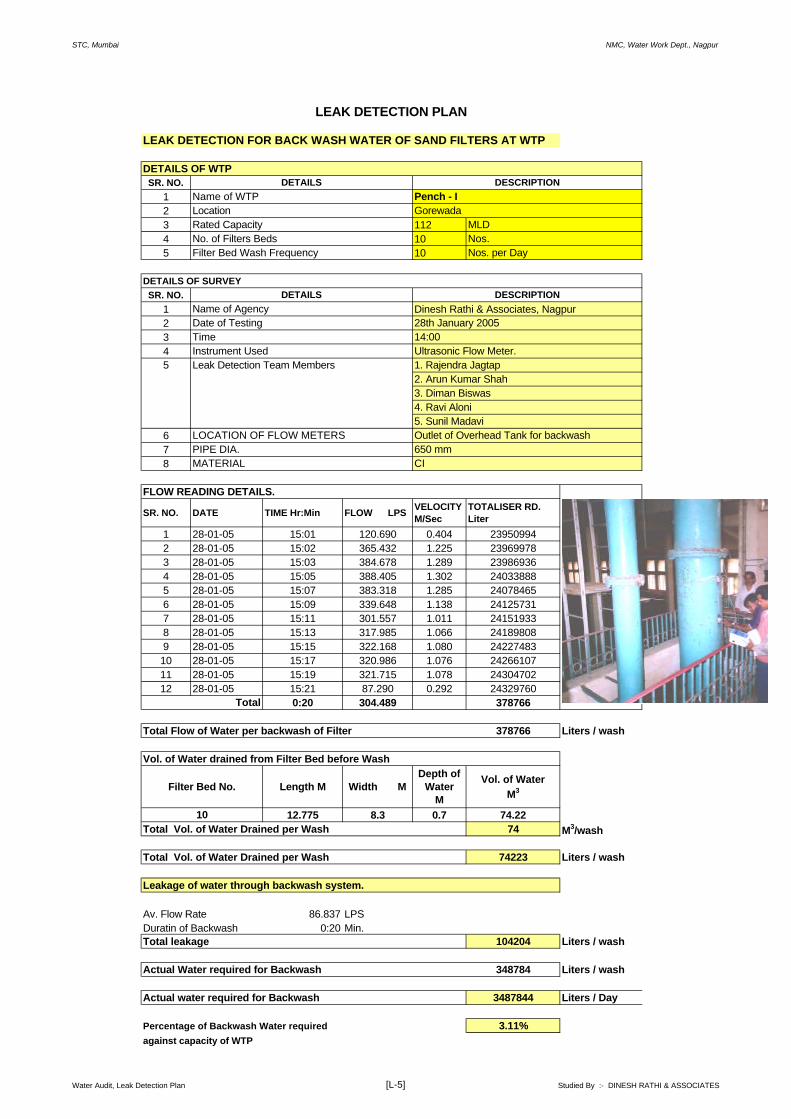
STC, Mumbai NMC, Water Work Dept., Nagpur
LEAK DETECTION FOR BACK WASH WATER OF SAND FILTERS AT WTP
DETAILS OF WTPSR. NO.
123 1124 105 10
DETAILS OF SURVEY
SR. NO.
1 Dinesh Rathi & Associates, Nagpur234
678
FLOW READING DETAILS.
SR. NO. DATE TIME Hr:Min FLOW LPSVELOCITY M/Sec
TOTALISER RD. Liter
1 28-01-05 15:01 120.690 0.404 239509942 28-01-05 15:02 365.432 1.225 239699783 28-01-05 15:03 384.678 1.289 239869364 28-01-05 15:05 388.405 1.302 240338885 28-01-05 15:07 383.318 1.285 240784656 28-01-05 15:09 339.648 1.138 241257317 28-01-05 15:11 301.557 1.011 241519338 28-01-05 15:13 317.985 1.066 241898089 28-01-05 15:15 322.168 1.080 2422748310 28-01-05 15:17 320.986 1.076 2426610711 28-01-05 15:19 321.715 1.078 2430470212 28-01-05 15:21 87.290 0.292 24329760
0:20 304.489 378766
Total Flow of Water per backwash of Filter 378766 Liters / wash
Vol. of Water drained from Filter Bed before Wash
12.775 8.3 0.7 74.22Total Vol. of Water Drained per Wash 74 M3/wash
Total Vol. of Water Drained per Wash 74223 Liters / wash
Leakage of water through backwash system.
Av. Flow Rate 86.837 LPSDuratin of Backwash 0:20 Min.Total leakage 104204 Liters / wash
Actual Water required for Backwash 348784 Liters / wash
Actual water required for Backwash 3487844 Liters / Day
Percentage of Backwash Water required 3.11%against capacity of WTP
LEAK DETECTION PLAN
10
Filter Bed No. Length M Width M
MATERIAL
Date of TestingTime
Leak Detection Team Members5
Total
Ultrasonic Flow Meter.
5. Sunil Madavi
650 mmCI
Instrument Used
PIPE DIA.
1. Rajendra Jagtap
LOCATION OF FLOW METERS
DETAILS
Name of WTPLocationRated Capacity
DETAILS
Name of Agency
Pench - IGorewada
MLD
DESCRIPTION
Filter Bed Wash FrequencyNo. of Filters Beds Nos.
Nos. per Day
Outlet of Overhead Tank for backwash
2. Arun Kumar Shah3. Diman Biswas4. Ravi Aloni
Vol. of Water M3
Depth of Water
M
14:0028th January 2005
DESCRIPTION
Water Audit, Leak Detection Plan [L-5] Studied By :- DINESH RATHI & ASSOCIATES

STC, Mumbai NMC, Water Work Dept., Nagpur
Pl. Note: The actual quantity pumped per day for backwash is more as backwash water
valves are not 100% closed, and therefore the operating hours of backwash water pumps
for overhead tank is 22 hrs. and at the average flowrate of 86.837 lps therefore it resuts
in extra pumping of 4.13 MLD
Water Audit, Leak Detection Plan [L-6] Studied By :- DINESH RATHI & ASSOCIATES

STC, Mumbai NMC, Water Work Dept., Nagpur
LEAK DETECTION FOR BACK WASH WATER OF SAND FILTERS AT WTP
DETAILS OF WTPSR. NO.
123 1354 125 12
DETAILS OF SURVEY
SR. NO.
1 Dinesh Rathi & Associates, Nagpur234
6 LOCATION OF FLOW METERS78
FLOW READING DETAILS.
SR. NO. DATE TIME Hr:Min FLOW LPSVELOCITY
M/SecTOTALISER RD.
Liter
1 29-01-05 16:13 180.011 1.168 248737412 29-01-05 16:15 159.556 1.036 248935843 29-01-05 16:17 151.563 0.984 249122774 29-01-05 16:19 153.929 0.999 249305715 29-01-05 16:21 154.846 1.005 249493246 29-01-05 16:23 146.804 0.953 249677857 29-01-05 16:25 68.785 0.446 249812948 29-01-05 16:27 64.258 0.417 249838209 29-01-05 16:29 64.145 0.416 2499359810 29-01-05 16:31 142.099 0.922 2500142111 29-01-05 16:33 136.557 0.886 2502917012 29-01-05 16:35 141.350 0.917 2504594213 29-01-05 16:37 142.295 0.924 2506311514 29-01-05 16:39 62.191 0.403 2507684315 29-01-05 16:41 61.759 0.401 25084544
0:28 122.010 210803
Vol. of Water drained from Filter Bed before Wash
9.8 9.1 0.5 44.59Total Vol. of Water Drained per Wash 45 M3/wash
Total Vol. of Water Drained per Wash 44590 Liters / wash
Actual Water required for Backwash 255393 Liters / wash
Actual water required for Backwash per day 3064716 Liters / Day
Percentage of Backwash Water required 2.27%against capacity of WTP
Pl. Note: Actual quantity of water pumped during backwash is more as the backwash valves of other filters are not 100% closed due to wear and tear.
LEAK DETECTION PLAN
DETAILS
Name of WTPLocationRated Capacity
5
Filter Bed Wash FrequencyNo. of Filters Beds
DETAILS
Date of TestingTimeInstrument UsedLeak Detection Team Members 1. Rajendra Jagtap
2. Arun Kumar Shah3. Diman Biswas
5. Sunil Madavi
PIPE DIA.MATERIAL
Filter Bed No. Length M Width MDepth of
Water M
Vol. of Water M3
Total
12
Name of Agency
CI464.6 mmPump outlet
Pench - II
4. Ravi Aloni
Ultrasonic Flow Meter.
Gorewada
29th January 2005
Nos.Nos. per Day
MLD
DESCRIPTION
16:00
DESCRIPTION
Water Audit, Leak Detection Plan [L-7] Studied By :- DINESH RATHI & ASSOCIATES

STC, Mumbai NMC, Water Work Dept., Nagpur
LEAK DETECTION FOR BACK WASH WATER OF SAND FILTERS AT WTP
DETAILS OF WTPSR. NO.
123 1354 125 12
DETAILS OF SURVEYSR. NO.
1 Dinesh Rathi & Associates, Nagpur234
6 LOCATION OF FLOW METERS78
FLOW READING DETAILS.SR. NO. DATE TIME Hr:Min
FLOW LPS
VELOCITY M/Sec
TOTALISER RD. Liter
1 29-01-2005 16:13 180.011 1.168 248737412 29-01-2006 16:15 159.556 1.036 248935843 29-01-2007 16:17 151.563 0.984 249122774 29-01-2008 16:19 153.929 0.999 249305715 29-01-2009 16:21 154.846 1.005 249493246 29-01-2010 16:23 146.804 0.953 249677857 29-01-2011 16:25 68.785 0.446 249812948 29-01-2012 16:27 64.258 0.417 249838209 29-01-2013 16:29 64.145 0.416 2499359810 29-01-2014 16:31 142.099 0.922 2500142111 29-01-2015 16:33 136.557 0.886 2502917012 29-01-2016 16:35 141.350 0.917 2504594213 29-01-2017 16:37 142.295 0.924 2506311514 29-01-2018 16:39 62.191 0.403 2507684315 29-01-2019 16:41 61.759 0.401 25084544
0:28 122.010 210803
Actual Water required for Backwash 210803 Liters / wash
Actual water required for Backwash per day 2529636 Liters / Day
Percentage of Backwash Water required 1.87%against capacity of WTP
Pl. Note: Actual quantity of water pumped during backwash is more as the backwash valves of other filters are not 100% closed due to wear and tear.
LEAK DETECTION PLAN
Total
PIPE DIA.MATERIAL
DETAILSName of WTPLocationRated Capacity
Pump outlet
No. of Filters Beds
Leak Detection Team Members
4. Ravi Aloni
Nos.Nos. per Day
DETAILS
3. Diman Biswas
DESCRIPTION
29th January 2005
5
Name of Agency
MLD
Time
1. Rajendra Jagtap
Filter Bed Wash Frequency
16:00Date of Testing
Instrument Used
5. Sunil Madavi
CI464.6 mm
2. Arun Kumar Shah
Ultrasonic Flow Meter.
GorewadaPench - II
DESCRIPTION
Water Audit, Leak Detection Plan [L-8] Studied By :- DINESH RATHI & ASSOCIATES

STC, Mumbai NMC, Water Work Dept., Nagpur
LEAK DETECTION TEST
DETAILS OF LEAKAGESR. NO.
123
DETAILS OF SURVEY
SR. NO.1 Dinesh Rathi & Associates, Nagpur234
SR. NO. Time in Sec.Loss of water due to leakage
FLOW LPS
1 48 224.00 4.6672 48 224.00 4.6673 48 224.00 4.667
4.667
Life of Leakage 1 Months
24 Hrs.
403200 Lits/day
0.4032 MLD
147168000 Lits/Annum
147168 Units/annum
Cost of Water per Unit 5.55 Rs. / Unit
Cost of Leakage per Annum 67133 Rs. / Annum
Pl. Note: The loss of water more during backwash as the line is more pressurised.
LEAK DETECTION PLAN
Total Vol. of Water lost per Day
Total Vol. of Water lost per Annum
Total Unit of Water lost per Annum
FLOW READING DETAILS.
Average Flow in LPS
Supply Hours
5 Leak Detection Team Members
Name of AgencyDate of TestingTimeMeasurement Method
Type of leakageMain Pipe Dia.
DETAILS
DETAILSLocation
Total Vol. of Water lost per Day
Bucket Filling Method1:3028th January 2005
1. Rajendra Jagtap2. Arun Kumar Shah3. Diman Biswas4. Ravi Aloni5. Sunil Madavi
DESCRIPTION
429.6 mmLead Joint LeakageBackwash Header Leakage at WTP, Pench -2
DESCRIPTION
Water Audit, Leak Detection Plan [L-9] Studied By :- DINESH RATHI & ASSOCIATES

STC, Mumbai NMC, Water Work Dept., Nagpur
LEAK DETECTION FOR BACK WASH WATER OF SAND FILTERS AT WTP
DETAILS OF WTPSR. NO.
123 1004 105 2
DETAILS OF SURVEY
SR. NO.
1 Dinesh Rathi & Associates, Nagpur234
6 LOCATION OF FLOW METERS78
FLOW READING DETAILS.SR. NO. DATE TIME Hr:Min
FLOW LPS
VELOCITY M/Sec
TOTALISER RD. Liter
1 29-01-05 13:50 721.695 3.627 246472142 29-01-05 13:51 713.071 3.584 246871373 29-01-05 13:53 697.749 3.507 247705294 29-01-05 13:55 658.370 3.309 24845264
0:05 697.721 198050
Vol. of Water drained from Filter Bed before Wash
12.7 9 0.7 80.01Total Vol. of Water Drained per Wash 80 M3/wash
Total Vol. of Water Drained per Wash 80010 Liters / wash
Actual Water required for Backwash 278060 Liters / wash
Actual water required for Backwash per day 556120 Liters / Day
Percentage of Backwash Water required 0.56%against capacity of WTP
Pl. Note: Actual Quantity is more as feed water is also released during Back wash.
LEAK DETECTION PLAN
10
MATERIAL
13:30Date of TestingTime
Total
Leak Detection Team Members
Filter Bed No. Length M Width M
Pench - IIIGorewada
MLD
DETAILS
Name of WTPLocationRated Capacity
DESCRIPTION
DETAILS
Ultrasonic Flow Meter.
Nos.Nos. per DayFilter Bed Wash Frequency
Name of AgencyDESCRIPTION
5Instrument Used
PIPE DIA. 531.5 mmCI
5. Sunil Madavi4. Ravi Aloni
Vol. of Water M3
No. of Filters Beds
Overhead Tank Outlet
Depth of Water
M
3. Diman Biswas2. Arun Kumar Shah1. Rajendra Jagtap
29th January 2005
Water Audit, Leak Detection Plan [L-10] Studied By :- DINESH RATHI & ASSOCIATES

STC, Mumbai NMC, Water Work Dept., Nagpur
LEAK DETECTION FOR BACK WASH WATER OF SAND FILTERS AT WTP
DETAILS OF WTPSR. NO.
123 1004 125 2
DETAILS OF SURVEY
SR. NO.1 Dinesh Rathi & Associates, Nagpur234
6 LOCATION OF FLOW METERS78
FLOW READING DETAILS.SR. NO. DATE TIME Hr:Min
FLOW LPS
VELOCITY M/Sec
TOTALISER RD. Liter
1 29-01-2005 13:50 721.695 3.627 246472142 29-01-2006 13:51 713.071 3.584 246871373 29-01-2007 13:53 697.749 3.507 247705294 29-01-2008 13:55 658.370 3.309 24845264
0:05 697.721 198050
Actual Water required for Backwash 198050 Liters / wash
Actual water required for Backwash per day 396100 Liters / Day
Percentage of Backwash Water required 0.40%against capacity of WTP
Pl. Note: Actual Quantity is more as feed water is also released during Back wash.
LEAK DETECTION PLAN
MLD
Leak Detection Team Members
DETAILS
TimeInstrument Used
Name of AgencyDate of Testing
Total
PIPE DIA.MATERIAL CI
1. Rajendra Jagtap2. Arun Kumar Shah3. Diman Biswas
Overhead Tank Outlet
4. Ravi Aloni
5
Filter Bed Wash Frequency
DETAILSName of WTPLocationRated CapacityNo. of Filters Beds Nos.
Nos. per Day
DESCRIPTION
29th January 200513:30Ultrasonic Flow Meter.
5. Sunil Madavi
531.5 mm
GorewadaPench - III
DESCRIPTION
Water Audit, Leak Detection Plan [L-11] Studied By :- DINESH RATHI & ASSOCIATES

STC, Mumbai NMC, Water Work Dept., Nagpur
LEAK DETECTION FOR BACK WASH WATER OF SAND FILTERS AT WTP
DETAILS OF WTPSR. NO.
123 63.64 75 12
DETAILS OF SURVEY
SR. NO.
1 Dinesh Rathi & Associates, Nagpur234
678
FLOW READING DETAILS.
SR. NO. DATE TIME Hr:Min FLOW LPSVELOCITY M/Sec
TOTALISER RD. Liter
1 05-02-05 9:55 29.632 0.273 253653292 05-02-05 9:57 245.033 2.278 253832643 05-02-05 9:59 259.943 2.417 254145074 05-02-05 10:01 258.253 2.401 254457525 05-02-05 10:03 259.755 2.415 254770236 05-02-05 10:05 261.734 2.434 255078917 05-02-05 10:07 261.458 2.431 255394388 05-02-05 10:09 207.833 1.932 255696739 05-02-05 10:11 37.548 0.349 25583923
0:16 202.354 218594
Total Flow of Water per backwash of Filter 218594 Liters / wash
Vol. of Water drained from Filter Bed before Wash
11 7.5 1.03 84.98Total Vol. of Water Drained per Wash 85 M3/wash
Total Vol. of Water Drained per Wash 84975 Liters / wash
Leakage of water through backwash system.
Av. Flow Rate 25.2332 LPSDuratin of Backwash 0:16 Min.Total leakage 24224 Liters / wash
Actual Water required for Backwash 279345 Liters / wash
Actual water required for Backwash 3352141.536 Liters / Day
Percentage of Backwash Water required 5.27%against capacity of WTP
Pl. Note: The actual quantity pumped per day for backwash is more as backwash water
valves are not 100% closed, and therefore the operating hours of backwash water pumps
for overhead tank is 24 hrs. and at the average flowrate of 25.233 lps therefore it results
in extra pumping of 2.18 MLD
LEAK DETECTION PLAN
LOCATION OF FLOW METERS
MATERIAL
5
DETAILS
Name of WTP
Filter Bed Wash Frequency
PIPE DIA.
Ultrasonic Flow Meter.1. Rajendra Jagtap
394.6 mm
3. Sunil Madavi
Leak Detection Team Members
Name of AgencyDate of TestingTimeInstrument Used
LocationRated CapacityNo. of Filters Beds
DETAILS
Total
Filter Bed No. Length M Width MVol. of Water
M3
2
Outlet of Overhead Tank for backwash
2. Arun Kumar Shah
Depth of Water
M
CI
9:305th February 2005
Kanhan- Old WTPDESCRIPTION
Kanhan H.W.MLD
DESCRIPTION
Nos.Nos. per Day
Water Audit, Leak Detection Plan [L-12] Studied By :- DINESH RATHI & ASSOCIATES

STC, Mumbai NMC, Water Work Dept., Nagpur
LEAK DETECTION FOR BACK WASH WATER OF SAND FILTERS AT WTP
DETAILS OF WTPSR. NO.
123 63.64 75 12
DETAILS OF SURVEY
SR. NO.
1 Dinesh Rathi & Associates, Nagpur234
678
FLOW READING DETAILS.
SR. NO. DATE TIME Hr:Min FLOW LPSVELOCITY M/Sec
TOTALISER RD. Litre
1 05-02-05 9:32 131.775 1.225 251964662 05-02-05 9:34 264.751 2.462 252112973 05-02-05 9:36 260.342 2.421 252425344 05-02-05 9:38 260.653 2.424 252738555 05-02-05 9:40 261.842 2.435 253048146 05-02-05 9:42 229.090 2.130 253359127 05-02-05 9:44 27.816 0.258 253486518 05-02-05 9:45 24.964 0.232 25350348
0:13 182.654 153882
Total Flow of Water per backwash of Filter 153882 Liters / wash
Vol. of Water drained from Filter Bed before Wash
11 7.5 1.03 84.98Total Vol. of Water Drained per Wash 85 M3/wash
Total Vol. of Water Drained per Wash 84975 Liters / wash
Leakage of water through backwash system.
Av. Flow Rate 25.2332 LPSDuratin of Backwash 0:13 Min.Total leakage 19682 Liters / wash
Actual Water required for Backwash 219175 Liters / wash
Actual water required for Backwash 2630101.248 Liters / Day
Percentage of Backwash Water required 4.14%against capacity of WTP
Pl. Note: The actual quantity pumped per day for backwash is more as backwash water
valves are not 100% closed, and therefore the operating hours of backwash water pumps
for overhead tank is 24 hrs. and at the average flowrate of 25.233 lps therefore it results
in extra pumping of 2.18 MLD
in extra pumping of 2.18 MLD
LEAK DETECTION PLAN
DETAILS
Kanhan H.W.MLD
DESCRIPTION
Filter Bed Wash Frequency
LocationRated CapacityNo. of Filters Beds Nos.
Nos. per Day
DETAILS
Length M
5
5th February 20059:30
Date of TestingTime
Leak Detection Team MembersInstrument Used
1. Rajendra Jagtap
Name of Agency
Ultrasonic Flow Meter.
CI394.6 mm
LOCATION OF FLOW METERS
MATERIALPIPE DIA.
Outlet of Overhead Tank for backwash3. Sunil Madavi2. Arun Kumar Shah
Width MDepth of
Water M
Name of WTP
Total
Vol. of Water M3
5
Filter Bed No.
Kanhan- old WTPDESCRIPTION
Water Audit, Leak Detection Plan [L-13] Studied By :- DINESH RATHI & ASSOCIATES

STC, Mumbai NMC, Water Work Dept., Nagpur
LEAK DETECTION FOR BACK WASH WATER OF SAND FILTERS AT WTP
DETAILS OF WTPSR. NO.
123 45.44 65 9
DETAILS OF SURVEY
SR. NO.
1 Dinesh Rathi & Associates, Nagpur234
678
FLOW READING DETAILS.
SR. NO. DATE TIME Hr:Min FLOW LPSVELOCITY M/Sec
TOTALISER RD. Liter
1 05-02-05 10:43 42.891 0.398 256052732 05-02-05 10:45 240.396 2.235 256225613 05-02-05 10:47 297.460 2.766 256570924 05-02-05 10:49 311.133 2.893 256925735 05-02-05 10:51 288.018 2.678 257271036 05-02-05 10:53 55.081 0.512. 25733713
0:10 205.830 2.194 128440
Total Flow of Water per backwash of Filter 128440 Liters / wash
Vol. of Water drained from Filter Bed before Wash
10.75 7.65 0.82 67.43Total Vol. of Water Drained per Wash 67 M3/wash
Total Vol. of Water Drained per Wash 67435 Liters / wash
Actual Water required for Backwash 195875 Liters / wash
Actual water required for Backwash 1762872.75 Liters / Day
Percentage of Backwash Water required 3.88%against capacity of WTP
Pl. Note: The actual quantity pumped per day for backwash is more as backwash water
valves are not 100% closed, and therefore the operating hours of backwash water pumps
for overhead tank is 24 hrs. and at the average flow rate of 25.233 lps therefore it results
in extra pumping of 2.18 MLD
No. of Filters Beds
DETAILS
Instrument Used
Nos.Nos. per Day
5th February 2005
DESCRIPTION
MATERIAL
Total
5
Filter Bed Wash Frequency
PIPE DIA.
Leak Detection Team Members
LOCATION OF FLOW METERS
TimeDate of TestingName of Agency
DESCRIPTION
Kanhan- new WTPKanhan H.W.
1
Filter Bed No.
3. Sunil Madavi2. Arun Kumar Shah1. Rajendra Jagtap
Vol. of Water M3Length M Width M
Depth of Water
M
Outlet of Overhead Tank for backwash
CI394.6 mm
Ultrasonic Flow Meter.10:30
LEAK DETECTION PLAN
MLD
DETAILS
Name of WTPLocationRated Capacity
Water Audit, Leak Detection Plan [L-14] Studied By :- DINESH RATHI & ASSOCIATES

STC, Mumbai NMC, Water Work Dept., Nagpur
LEAK DETECTION TEST
DETAILS OF LEAKAGESR. NO.
123 m4
DETAILS OF SURVEY
SR. NO.
1 Dinesh Rathi & Associates, Nagpur23
FLOW READING DETAILSTime of Flow 24 hrs.
No. of Pipes 2 Nos.
0.9 m
0.45 m
0.77 m
To Calculate è
Dim A 0.13 m
Dim B 0.32
è 0.780 radians
Wetted Area A = R2( è - ( (sin(2è)) / 2 ) = 0.057 m2
Velocity
Length of Pipe (L) 4.65 m
Time in secs (T) 5 sec
Velocity V = L / T 0.93 m/s
Flow rate Q = A x V 0.05268 m3/Sec
4551911 Lits/day
4.5519 MLD
1661447671 Lit / Annum
1661448 Unit / Annum
5.55 Rs./Unit
Cost of Leakage per Annum 9221035 Rs./Annum
Pl. Note Above Leakage Includes following
1. Over flow of Pure Water Sump
2. Seepage
3. Leakage from Filter Bed.
4. General Leakage from Valves, Pipes etc.
Cost of Water per Unit
Radius R
DETAILS
Total Vol. of water lost per Day
Total Vol. of Lost per Annum
Total Unit. of Lost per Annum
DETAILS
Type of LeakageLocation
Pipe Material
Water Depth From Top edge of Pipe
Leak Detection Team Members
Dia. D
5. Sunil Madavi
LEAK DETECTION PLAN
DESCRIPTION
AC PipePipe Dia.
WTP LeakageDESCRIPTION
Total Vol. of water lost per Day
Name of AgencyDate of Testing 5 th February 2005Time 12:30
4 1. Rajendra Jagtap
0.9Kanhan River
2. Arun Kumar Shah3. Diman Biswas4. Ravi Aloni
Water Audit, Leak Detection Plan [L-15] Studied By :- DINESH RATHI & ASSOCIATES

STC, Mumbai NMC, Water Work Dept., Nagpur
LEAK DETECTION TEST
DETAILS OF LEAKAGESR. NO.
1234
DETAILS OF SURVEY
SR. NO.1 Dinesh Rathi & Associates, Nagpur234
SR. NO. Time in Sec.Loss of water due to leakage
FLOW LPS
1 23 20.00 0.8702 23 20.00 0.8703 23 20.00 0.870
0.870
Life of Leakage 1 Years
24 Hrs.
75130 Lits/day
27422609 Lits/Annum
27423 Units/annum
Cost of Water per Unit 5.55 Rs. / Unit
Cost of Leakage per Annum 152195 Rs. / Annum
Pl. Note: Nearby Residential area are using this water for daily use.
Total Vol. of Water lost per Day
Total Vol. of Water lost per Annum
Total Unit of Water lost per Annum
FLOW READING DETAILS.
Average Flow in LPS
Supply Hours
5 Leak Detection Team Members
Name of AgencyDate of TestingTimeMeasurement Method
Type of leakageMain Pipe Dia.Air Valve Size
DETAILS
Bucket Filling Method15:2009th Feb. 2005
1. Rajendra Jagtap2. Arun Kumar Shah3. Diman Biswas4. Ravi Aloni
DESCRIPTION
100 MM1300 MMAir Valve
Kanhan Line [Infront of Fookat Nagar,Chamar Nallah]
DESCRIPTION
LEAK DETECTION PLAN
DETAILSLocation
Water Audit, Leak Detection Plan [L-16] Studied By :- DINESH RATHI & ASSOCIATES

STC, Mumbai NMC, Water Work Dept., Nagpur
LEAK DETECTION TEST
DETAILS OF LEAKAGESR. NO.
1234
DETAILS OF SURVEY
SR. NO.1 Dinesh Rathi & Associates, Nagpur234
SR. NO. Time in Sec.Loss of water due to leakage
FLOW LPS
1 17 12.00 0.7062 17 12.00 0.7063 17 12.00 0.706
0.706
Life of Leakage 1 Years
24 Hrs.
60988 Lits/day
22260706 Lits/Annum
22261 Units/annum
Cost of Water per Unit 5.55 Rs. / Unit
Cost of Leakage per Annum 123547 Rs. / Annum
Pl. Note: Nearby Residential area are using this water for daily use.
4. Ravi Aloni
Total Vol. of Water lost per Annum
Supply Hours
Total Unit of Water lost per Annum
Total Vol. of Water lost per Day
Average Flow in LPS
FLOW READING DETAILS.
DETAILSLocationType of leakageMain Pipe Dia.
Name of Agency
Leak Detection Team Members5
Air Valve Size
DETAILS
Date of TestingTimeMeasurement Method Bucket Filling Method
DESCRIPTION
31th January 200512:30
1. Rajendra Jagtap2. Arun Kumar Shah3. Diman Biswas
100 mm1300 mmSluice Valve of Air Valve
Pure Water Rising Main, From WTP to Seminery Hills.Gorewada,
DESCRIPTION
LEAK DETECTION PLAN
Water Audit, Leak Detection Plan [L-17] Studied By :- DINESH RATHI & ASSOCIATES

STC, Mumbai NMC, Water Work Dept., Nagpur
LEAK DETECTION TEST
DETAILS OF LEAKAGESR. NO.
1234
DETAILS OF SURVEY
SR. NO.1 Dinesh Rathi & Associates, Nagpur234
SR. NO. Time in Sec.Loss of water due to leakage
FLOW LPS
1 25 20.00 0.8002 25 20.00 0.8003 25 20.00 0.800
0.800
Life of Leakage 5 Years
24 Hrs.
69120 Lits/day
25228800 Lits/Annum
25229 Units/annum
Cost of Water per Unit 5.55 Rs. / Unit
Cost of Leakage per Annum 140020 Rs. / Annum
Pl. Note: The loss of water more during leakages as the line is more pressurised.
LEAK DETECTION PLAN
Bucket Filling Method12:3009th Feb. 2005
DESCRIPTION
100 mm1300 mm Air ValveSeminary Hills MBR [Pench-II]
Total Vol. of Water lost per Day
5 Leak Detection Team Members
Type of leakageMain Pipe Dia.Air Valve Size
DETAILS
Total Vol. of Water lost per Annum
Total Unit of Water lost per Annum
FLOW READING DETAILS.
Average Flow in LPS
Supply Hours
Name of AgencyDate of TestingTimeMeasurement Method
1. Rajendra Jagtap2. Arun Kumar Shah3. Diman Biswas4. Ravi Aloni
DETAILSLocation
DESCRIPTION
Water Audit, Leak Detection Plan [L-18] Studied By :- DINESH RATHI & ASSOCIATES

STC, Mumbai NMC, Water Work Dept., Nagpur
LEAK DETECTION TEST
DETAILS OF LEAKAGESR. NO.
123
DETAILS OF SURVEY
SR. NO.1 Dinesh Rathi & Associates, Nagpur234
SR. NO. Time in Sec.Loss of water due to leakage
FLOW LPS
1 18 12.00 0.6672 17 12.00 0.7063 17 12.00 0.706
0.693
Life of Leakage 1 Years
24 Hrs.
59859 Lits/day
21848471 Lits/Annum
21848 Units/annum
Cost of Water per Unit 5.55 Rs. / Unit
Cost of Leakage per Annum 121259 Rs. / Annum
LEAK DETECTION TEST
DETAILS OF LEAKAGESR. NO.
1234
DETAILS OF SURVEY
SR. NO.1 Dinesh Rathi & Associates, Nagpur234
LEAK DETECTION PLAN
LEAK DETECTION PLAN
1300 mmSeepage Water of MBR, Seminary Hills
Pure Water Supply Main, From Seminary Hills, Lourd Mata Mandir
DESCRIPTION
MBR Seepage WaterSeminary Hills [Near Mini Railway Track]
DESCRIPTION
DESCRIPTION
7-Mar-2005
3. Diman Biswas
2. Arun Kumar Shah1. Rajendra JagtapBucket Filling Method13:4427th Nov. 2004
DESCRIPTION
100 mm716.10 mm
DETAILS
5. Manish Doye4. Ravi Aloni3. Diman Biswas
Main Pipe Dia.
DETAILS
LocationType of leakage
Name of AgencyDate of TestingTime 11.45 A.M to 12.15 P.M.
Average Flow in LPS
Measurement Method Bucket Filling Method5 Leak Detection Team Members 1. Dipak Shiv
2. Manish Doye
Total Vol. of Water lost per Day
Total Vol. of Water lost per Annum
Total Unit of Water lost per Annum
FLOW READING DETAILS.
Supply Hours
DETAILS
Main Pipe Dia.Air Valve Size
LocationType of leakage
TimeMeasurement Method
DETAILSName of AgencyDate of Testing
5 Leak Detection Team Members
Water Audit, Leak Detection Plan [L-19] Studied By :- DINESH RATHI & ASSOCIATES

STC, Mumbai NMC, Water Work Dept., Nagpur
SR. NO. Time in Sec.Loss of water due to leakage
FLOW LPS
1 4 25.00 6.2502 5 25.00 5.0003 5 25.00 5.000
5.417
Life of Leakage 20 Years
24 Hrs.
468000 Lits/day
0.468 MLD
170820000 Lits/Annum
170820 Units/annum
Cost of Water per Unit 5.55 Rs. / Unit
Cost of Leakage per Annum 948051 Rs. / Annum
Pl. Note: Nearby Residential and Commercial, area are using this water for daily use.
FLOW READING DETAILS.
Average Flow in LPS
Supply Hours
Total Vol. of Water lost per Day
Total Vol. of Water lost per Annum
Total Unit of Water lost per Annum
Total Vol. of Water lost per Day
Water Audit, Leak Detection Plan [L-20] Studied By :- DINESH RATHI & ASSOCIATES

STC, Mumbai NMC, Water Work Dept., Nagpur
LEAK DETECTION TEST
DETAILS OF LEAKAGESR. NO.
123 m4
DETAILS OF SURVEY
SR. NO.
1 Dinesh Rathi & Associates, Nagpur23
FLOW READING DETAILSTime of Flow 24 hrs.
No. of Pipes 1 Nos.
0.45 m
0.225 m
0.425 m
To Calculate è
Dim A 0.025 m
Dim B 0.2 m
è 0.476 radians
Wetted Area A = R2( è - ( (sin(2è)) / 2 ) = 0.003 m2
Velocity
Length of Pipe (L) 4.65 m
Time in secs (T) 5 sec
Velocity V = L / T 0.93 m/s
Flow rate Q = A x V 0.00323 m3/Sec
279304 Lits/day
0.2793 MLD
101946112 Lit / Annum
101946 Unit / Annum
5.55 Rs./Unit
Cost of Leakage per Annum 565801 Rs./Annum
Cost of Water per Unit
Total Vol. of water lost per Day
Total Vol. of water lost per Day
Total Vol. of Lost per Annum
Total Unit. of Lost per Annum
4 Leak Detection Team Members Bucket Filling Method1. Rajendra Jagtap2. Arun Kumar Shah3. Ravi Aloni4. Manish Doye
Name of AgencyDate of Testing 27th Nov. 2004Time 13:44
Pipe Material AC Pipe
DETAILS DESCRIPTION
Loha PulliyaLocation
Lead Joint Leakage at Wanjari Nagar ESR Feeder
Pipe Dia. 0.45
Type of Leakage
LEAK DETECTION PLAN
DETAILS DESCRIPTION
Dia. D
Radius R
Water Depth From Top edge of Pipe
Water Audit, Leak Detection Plan [L-21] Studied By :- DINESH RATHI & ASSOCIATES

STC, Mumbai NMC, Water Work Dept., Nagpur
LEAK DETECTION TEST
DETAILS OF LEAKAGESR. NO.
1234
Dinesh Rathi & Associates, NagpurDETAILS OF SURVEY
SR. NO.1234
SR. NO. Time in Sec.Loss of water due to leakage
FLOW LPS
1 142 20.00 0.1412 141 20.00 0.1423 141 20.00 0.142
0.142
Life of Leakage 1 Years
24 Hrs.
12269 Lits/day
4478112 Lits/Annum
4478 Units/annum
Cost of Water per Unit 5.55 Rs. / Unit
Cost of Leakage per Annum 24854 Rs. / Annum
Pl. Note: Nearby Residential and Commercial, area are using this water for daily use.
DESCRIPTION
LEAK DETECTION PLAN
LocationType of leakage
DETAILS 716.10 mmAir ValveOpp. Arun Automobile [Ghat Road]
DETAILSName of AgencyDate of Testing
Main Pipe Dia.Air Valve Size
Supply Hours
5 Leak Detection Team Members
1. Rajendra Jagtap2. Arun Kumar Shah3. Diman Biswas4. Ravi Aloni5. Manish Doye
TimeMeasurement Method
DESCRIPTION
100 mm
Total Vol. of Water lost per Day
Total Vol. of Water lost per Annum
Total Unit of Water lost per Annum
FLOW READING DETAILS.
Average Flow in LPS
Bucket Filling Method13:4427th Nov. 2004
Water Audit, Leak Detection Plan [L-22] Studied By :- DINESH RATHI & ASSOCIATES

STC, Mumbai NMC, Water Work Dept., Nagpur
LEAK DETECTION TEST
DETAILS OF LEAKAGESR. NO.
12
Dinesh Rathi & Associates, NagpurDETAILS OF SURVEY
SR. NO.1234
SR. NO. Time in Sec.Loss of water due to leakage
FLOW LPS
1 30 20.00 0.6672 30 20.00 0.6673 30 20.00 0.667
0.667
Life of Leakage 3 Years
5 Hrs.
12000 Lits/day
0.012 MLD
4380000 Lits/Annum
4380 Units/annum
Cost of Water per Unit 5.55 Rs. / Unit
Cost of Leakage per Annum 24309 Rs. / Annum
Pl. Note: Nearby Residential and Commercial, area are using this water for daily use.
Total Vol. of Water lost per Day
Total Vol. of Water lost per Annum
Total Unit of Water lost per Annum
FLOW READING DETAILS.
Total Vol. of Water lost per Day
Measurement Method
Average Flow in LPS
Supply Hours
5 Leak Detection Team Members
1. Rajendra Jagtap2. Arun Kumar Shah3. Diman Biswas4. Ravi Aloni
DETAILSName of AgencyDate of TestingTime
LocationType of leakage
DETAILS
DESCRIPTION
Bucket Filling Method17:1509th Feb. 2005
DESCRIPTION
Leakage
LEAK DETECTION PLAN
Murgiwala Valve [Near Tukdoji Putla]
Water Audit, Leak Detection Plan [L-23] Studied By :- DINESH RATHI & ASSOCIATES

STC,Mumbai NMC, Water Works Dept., Nagpur
ESR Fort GSR 1 Date Reading taken by1) Anurag Mate
Time Interval Reading Reading Water Level Side of Side of ESR Deductions for columns Net ESR Flow Flow Flowmin in sec one M two Ht rise Section Section filled cap B D A No V capacity total cap per sec per min per hour
M M M M M M3 mm mm M2 M3 M3 M3 M3/Sec M3/Min M3/Hr12.20pm Start 5.700 2.250 3.450 0.000 37.800 25.025 0.000 220 220 0.048 87 0.00 0.00 0.00 0 0 0
12.25pm 300 5.700 2.120 3.580 0.130 37.800 25.025 122.973 220 220 0.048 87 0.55 122.43 122.425 0.408 24.485 1469.105
12.30pm 300 5.700 1.940 3.760 0.180 37.800 25.025 170.270 220 220 0.048 87 0.8 169.51 291.938 0.565 33.902 2034.146
12.35pm 300 5.700 1.780 3.920 0.160 37.800 25.025 151.351 220 220 0.048 87 0.67 150.68 442.615 0.502 30.135 1808.130
12.40pm 300 5.700 1.600 4.100 0.180 37.800 25.025 170.270 220 220 0.048 87 0.76 169.51 612.127 0.565 33.902 2034.146
12.45pm 300 5.700 1.450 4.250 0.150 37.800 25.025 141.892 220 220 0.048 87 0.63 141.26 753.387 0.471 28.252 1695.122
12.50pm 300 5.700 1.300 4.400 0.150 37.800 25.025 141.892 220 220 0.048 87 0.63 141.26 894.647 0.471 28.252 1695.122
12.55pm 300 5.700 1.150 4.550 0.150 37.800 25.025 141.892 220 220 0.048 87 0.63 141.26 1035.908 0.471 28.252 1695.122
1.00pm 300 5.700 0.980 4.720 0.170 37.800 25.025 160.811 220 220 0.048 87 0.72 160.09 1196.002 0.534 32.019 1921.138
1.05pm 300 5.700 0.800 4.900 0.180 37.800 25.025 170.270 220 220 0.048 87 0.76 169.51 1365.515 0.565 33.902 2034.146
1.10pm 300 5.700 0.600 5.100 0.200 37.800 25.025 189.189 220 220 0.048 87 0.84 188.35 1553.861 0.628 37.669 2260.162
1.15pm 300 5.700 0.500 5.200 0.100 37.800 25.025 94.595 220 220 0.048 87 0.42 94.17 1648.035 0.314 18.835 1130.081
1.20pm 300 5.700 0.370 5.330 0.130 37.800 25.025 122.973 220 220 0.048 87 0.55 122.43 1770.460 0.408 24.485 1469.105
1.25pm 300 5.700 0.360 5.340 0.010 37.800 25.025 9.459 220 220 0.048 87 0.04 9.42 1779.878 0.031 1.883 113.008
1.35pm 600 5.700 0.370 5.330 0.010 37.800 25.025 9.459 220 220 0.048 87 0.04 9.42 1789.295 0.016 0.942 56.504
1.45pm 600 5.700 0.380 5.320 0.010 37.800 25.025 9.459 220 220 0.048 87 0.04 9.42 1798.712 0.016 0.942 56.504
1.55pm 600 5.700 0.380 5.320 0.000 37.800 25.025 0.000 220 220 0.048 87 0.00 0.00 1798.712 0.000 0.000 0.000
2.05pm 600 5.700 0.390 5.310 0.010 37.800 25.025 9.459 220 220 0.048 87 0.04 9.42 1808.130 0.016 0.942 56.504
2.15pm 600 5.700 0.380 5.320 -0.010 37.800 25.025 -9.459 220 220 0.048 87 -0.04 0.00 1808.130 0.000 0.000 0.000
2.25pm 600 5.700 0.380 5.320 0.000 37.800 25.025 0.000 220 220 0.048 87 0.00 0.00 1808.130 0.000 0.000 0.000
2.35pm 600 5.700 0.390 5.310 0.010 37.800 25.025 9.459 220 220 0.048 87 0.04 9.42 1817.547 0.016 0.942 56.504
2.45pm 600 5.700 0.390 5.310 0.000 37.800 25.025 0.000 220 220 0.048 87 0.00 0.00 1817.547 0.000 0.000 0.0008100 1525.61
Note :- The inlet was open full & outlet closed Level rise during an hour = 1.880 Mtr Flow per hour = 1770.46 Cum/hr
m Cum / Hr
WATER AUDIT, LEAK DETECTION PLAN
Level dropped during an hour
0.040
Leak detection
SEEPAGE WATER AT FORT GSR
Loss of water in MLD (Annual Average)
Loss of water per Day Cum/Day
148.61 0.1486
Outflow due to tank leakage
01-01-2004
37.67
Loss of water per year Cum/year
54243.89
Av. Days of Over flow for year
60Water Audit, Leak Detection Plan L-23 Studied By: DINESH RATHI & ASSOCIATES

Annexure-3 (144 Test Zone Consumer Survey)

STC, Mumbai NMC, Water Works Dept. Nagpur
1/2" 2" 3" 4" 5" 6" 8" 10"
1 Dharampeth 6325 1187 1058 54 9 15 51 0 2445 734 4303 156 1405 0 0 9043
2 Laxmi Nagar 7151 1251 1194 19 29 1 8 0 597 576 5933 0 2558 0 0 9664
3 Hanuman Nagar 3467 784 620 98 20 9 37 0 238 1802 4375 0 79 0 0 6494
4 Dhantoli 5241 898 818 60 7 0 13 0 694 2724 2648 0 626 0 0 6692
5 Nehru Nagar 9194 1829 1236 480 8 20 85 0 1568 214 16447 0 2562 903 0 21694
6Gandhibagh (Sokta Bhavan)
5555 1162 880 143 100 0 39 0 871 1799 2934 341 535 581 0 7061
7 Satranjipua 5668 975 370 356 214 1 34 0 388 763 3096 0 634 0 0 4881
8 Lakadganj 5231 974 508 150 197 16 103 171 0 0 4182 0 562 58 0 4973
9 Ashi Nagar 12075 2380 612 1307 404 7 50 0 2197 0 10596 0 2337 1044 0 16174
10 Mangalwari 2622 466 346 48 43 19 10 0 1094 322 1422 0 382 0 0 3220
62529 11906 7642 2715 1031 88 430 171 10092 8934 55936 497 11680 2586 0 89896
64.19% 22.80% 8.66% 0.74% 3.61%
ILGL Billing
Total
No. of Consumer
Legal IllegalTotal
Population
Annexure-3
Sr. No.
No BillingLength of Pipe Lines in Meter Total
Pipe Length
Zone
TOTAL PERCENTAGE OF CONSUMER SUMMARY
SUMMARY OF CONSUMER SURVEY FOR WATER AUDIT, LEAK DETECTION WORK
No Connectio
n
CONSUMER SUMMARY FOR SELECTED 144 TEST ZONES
Legal, 64.19%
Illegal, 22.80%
No Connection, 8.66%
ILGL Billing , 0.74%
No Billing, 3.61%
Water Audit, Leak Detection Plan

STC, Mumbai NMC, Water Works Dept., Nagpur
Water Audit, Leak Detection Plan Studied By :- DINESH RATHI & ASSOCIATES
CONSUMER SUMMARY OF DHARAMPETH ZONE {I}
4.30%1.26%0.76%
4.55%
89.13%
0.00%
10.00%
20.00%
30.00%
40.00%
50.00%
60.00%
70.00%
80.00%
90.00%
100.00%
Legal Connection ILGL Connection No Connection ILGL Billing No Billing

STC, Mumbai NMC, Water Works Dept. Nagpur
1/2" 2" 3" 4" 5" 6" 8" 10"
Bajiprabhu Nagar Ram Nagar 365 80 65 15 1096 690 1786
Ambazari Layout Ram Nagar 486 63 63 813 813
Friends Colony Gittikhadan 452 102 101 1 517 283 800
Tilak NagarRam Nagar / Rifle Line
1275 204 204 920 410 174 1504
Gajanan Nagar Seminary Hills 109 38 27 7 4 455 455
Giripeth Ram Nagar 814 106 106 266 183 258 707
Manohar Vihar Seminary Hills 511 130 130 465 465
Trust Layout Ram Nagar 369 80 70 4 1 5 67 173 117 357
Ambedkar NagarRam Nagar / Rifle Line
816 151 138 7 1 5 551 151 156 858
Surendra Garh Seminary Hills 560 108 80 14 14 227 227
Vishwas Nagar Seminary Hills 321 63 36 21 6 122 59 181
Seva Nagar Ram Nagar 172 46 28 4 14 371 371
Kachipura- 2Ram Nagar / Rifle Line
75 16 10 4 2 519 519
6325 1187 1058 54 9 15 51 0 2445 734 4303 156 1405 0 0 9043
89.13% 4.55% 0.76% 1.26% 4.30%Percentage
Dharampeth
SLUM
MIG
LIG
HIG
Length of Pipe Lines in Meter
IllegalILGL
Billing
Total Populati
on
No. of Consum
er
No Connect
ion
No Billing
Legal
CONSUMER SUMMARY OF SELECTED TEST ZONES FOR WATER AUDIT, LEAK DETECTION PLAN
Total Length of Pipe
ESR Command
Area
Sr. No.
Zone Category Test Zone
Sub Total
1
Water Audit, Leak Detection Plan

STC, Mumbai NMC, Water Works Dept., Nagpur
Water Audit, Leak Detection Plan Studied By :- DINESH RATHI & ASSOCIATES
CONSUMER SUMMARY OF LAXMI NAGAR ZONE {II}
0.64%0.08%2.32%1.52%
95.44%
0.00%
20.00%
40.00%
60.00%
80.00%
100.00%
120.00%
Legal Connection ILGL Connection No Connection ILGL Billing No Billing

STC, Mumbai NMC, Water Works Dept. Nagpur
1/2" 2" 3" 4" 5" 6" 8" 10"
Length of Pipe Lines in Meter
IllegalILGL
Billing
Total Populati
on
No. of Consum
er
No Connect
ion
No Billing
Legal
CONSUMER SUMMARY OF SELECTED TEST ZONES FOR WATER AUDIT, LEAK DETECTION PLAN
Total Length of Pipe
ESR Command
Area
Sr. No.
Zone Category Test Zone
Nelco Society Gayatri Nagar 454 38 35 3 240 250 490
Friend SocietyLaxmi Nagar Old
171 36 36 186 538 724
Congress Nagar Dhantoli 710 94 93 1 47 127 476 650
Prasad Nagar Takliseem 472 74 74 753 753
Guddhe LayoutLaxmi Nagar New
159 31 31 387 387
Vijay Nagar Gayatri Nagar 235 46 46 365 12 365 742
NIT Layout Gittikhadan
Laxmi Nagar New
574 100 100 0
Milind Nagar Khamla 427 52 52 421 421
Adhyapak Nagar Takliseem 413 86 86 244 409 653
Kamgar Nagar Gayatri Nagar 422 83 80 1 2 397 210 607
Dhangarpura Laxmi Nagar 251 37 37 275 462 737
Savitri ViharLaxmi Nagar New
862 200 199 1 482 264 746
Laxmi NagarLaxmi Nagar Old
264 51 48 3 80 256 336
Bhamptee VillageLaxmi Nagar New
225 45 27 1 16 1 105 179 284
Tukdoji Nagar Gayatri Nagar 569 111 90 8 13 291 291
Takliseem Takliseem 247 45 42 3 211 189 400
Takiya Dhantoli 293 48 45 2 1 325 325
Panchdeep Nagar
Khamla 284 48 48 701 701
Nagbhoomi Layout
Khamla 119 26 25 1 295 122 417
7151 1251 1194 19 29 1 8 0 597 576 5933 0 2558 0 0 9664
95.44% 1.52% 2.32% 0.08% 0.64%Percentage
LIG
SLUM
Sub Total
HIG/MIG
Laxmi Nagar2
HIG
MIG
Water Audit, Leak Detection Plan

STC, Mumbai NMC, Water Works Dept., Nagpur
Water Audit, Leak Detection Plan Studied By :- DINESH RATHI & ASSOCIATES
CONSUMER SUMMARY OF HANUMAN NAGAR ZONE {III}
79.08%
12.50%
2.55% 1.15%4.72%
0.00%
10.00%
20.00%
30.00%
40.00%
50.00%
60.00%
70.00%
80.00%
90.00%
Legal Connection ILGL Conection No Connection ILGL Billing No Billing

STC, Mumbai NMC, Water Works Dept. Nagpur
1/2" 2" 3" 4" 5" 6" 8" 10"
Length of Pipe Lines in Meter
IllegalILGL
Billing
Total Populati
on
No. of Consum
er
No Connect
ion
No Billing
Legal
CONSUMER SUMMARY OF SELECTED TEST ZONES FOR WATER AUDIT, LEAK DETECTION PLAN
Total Length of Pipe
ESR Command
Area
Sr. No.
Zone Category Test Zone
HIG Banerjee Layout Omkar Nagar 494 89 87 1 1 704 704
MIGMahatma Fule Nagar
Omkar Nagar 296 66 55 3 2 6 694 694
Bajrang NagarWanjari Nagar Old
156 25 20 3 2 453 453
Shivraj NagarWanjari Nagar Old
264 51 49 1 1 981 981
Vinkar Colony Omkar Nagar 780 171 145 24 2 1116 1116
Chandramani Nagar
Wanjari Nagar Old
12 77 67 9 1 158 117 79 354
Bhim Nagar Omkar Nagar 442 87 47 16 15 1 8 80 387 467
Sanjay Gandhi Nagar
Hudkeshwar 571 135 77 40 1 7 10 716 716
HIG/MIG Kukade LayoutWanjari Nagar Old
278 41 40 1 363 363
MIG/LIG Shiv Shakti Nagar Hudkeshwar 174 42 33 1 2 6 646 646
3467 784 620 98 20 9 37 0 238 1802 4375 0 79 0 0 6494
79.08% 12.50% 2.55% 1.15% 4.72%Percentage
Hanuman Nagar
3
LIG
SLUM
Sub Total
Water Audit, Leak Detection Plan

STC, Mumbai NMC, Water Works Dept., Nagpur
Water Audit, Leak Detection Plan Studied By :- DINESH RATHI & ASSOCIATES
CONSUMER SURVEY OF DHANTOLI ZONE {IV}
91.09%
1.45%0.00%0.78%
6.68%
0.00%
10.00%
20.00%
30.00%
40.00%
50.00%
60.00%
70.00%
80.00%
90.00%
100.00%
Legal Connection ILGL Conection No Connection ILGL Billing No Billing

STC, Mumbai NMC, Water Works Dept. Nagpur
1/2" 2" 3" 4" 5" 6" 8" 10"
Length of Pipe Lines in Meter
IllegalILGL
Billing
Total Populati
on
No. of Consum
er
No Connect
ion
No Billing
Legal
CONSUMER SUMMARY OF SELECTED TEST ZONES FOR WATER AUDIT, LEAK DETECTION PLAN
Total Length of Pipe
ESR Command
Area
Sr. No.
Zone Category Test Zone
MIG Trikoni MaidanWanjari Nagar Old
464 82 82 164 162 587 913
Somwari Quarter Reshim Bagh 277 58 48 6 4 205 205
VakilpethWanjari Nagar Old
254 51 44 3 1 3 90 336 426
Rajabaksha Direct Tapping 825 110 102 1 3 4 65 490 300 855
Ganeshpeth Direct Tapping 231 47 47 109 230 339
PTS Colony Direct Tapping 1021 207 200 7 143 1116 90 1349
Juni Shukrawari Reshim Bagh 202 39 39 139 139
SiraspethWanjari Nagar Old
0
Kurnel Bagh Direct Tapping 186 36 36 214 214
Rambagh Direct Tapping 303 59 18 41 156 156
Vakilpeth Direct Tapping 125 26 25 1 293 96 389
Reshimbagh Reshim Bagh 392 64 62 1 1 173 275 201 649
Hanuman NagarWanjari Nagar Old
961 119 115 3 1 721 337 1058
5241 898 818 60 7 0 13 0 694 2724 2648 0 626 0 0 6692
91.09% 6.68% 0.78% 0.00% 1.45%Percentage
LIG
4
SLUM
HIG/MIG
Dhantoli
Sub Total
Water Audit, Leak Detection Plan

STC, Mumbai NMC, Water Works Dept., Ngapur
Water Audit, Leak Detection Plan Studied By :- DINESH RATHI & ASSOCIATES
CONSUMER SUMMARY OF NEHRU NAGAR ZONE {V}
67.58%
26.24%
4.65%
1.09%0.44%
0.00%
10.00%
20.00%
30.00%
40.00%
50.00%
60.00%
70.00%
80.00%
Legal Connection ILGL Conection No Connection ILGL Billing No Billing
STC, Mumbai NMC, Water Works Dept. Nagpur
1/2" 2" 3" 4" 5" 6" 8" 10"
Length of Pipe Lines in Meter
IllegalILGL
Billing
Total Populati
on
No. of Consum
er
No Connect
ion
No Billing
Legal
CONSUMER SUMMARY OF SELECTED TEST ZONES FOR WATER AUDIT, LEAK DETECTION PLAN
Total Length of Pipe
ESR Command
Area
Sr. No.
Zone Category Test Zone
Surve Nagar Sakkardara 656 124 100 7 17 848 464 275 1587
Sanmarg Nagar Hudkeshwar 211 45 38 7 35 285 320
Pragati Colony Dighori 287 66 66 1129 50 1179
Gurudeo Nagar Nandanvan 703 150 136 9 1 4 2357 2357
MHADA Colony Nandanvan 113 28 28 115 210 325
Ayodhya Nagar,Ram Mandir
Sakkardara 213 40 31 2 7 398 398
Ayodhya Nagar,Thakur Chakki
Sakkardara 148 26 21 5 205 115 320
New Malgi Hudkeshwar 1530 307 281 12 14 2771 708 3479
Old Malgi Hudkeshwar 685 165 147 7 11 2827 364 226 3417
Sai Nagar Dighori 138 31 10 21 312 268 580
Telephone Nagar Dighori 151 35 30 5 336 336
Shakti Mata Nagar
Nandanvan 273 56 36 20 669 40 709
Shri Krishna Nagar
Nandanvan 257 48 44 1 3 830 830
Rajiv Gandhi Nagar
Sakkardara 438 98 26 72 544 544
Raghuji Nagar Sakkardara 396 92 85 4 3 831 173 1004
Adarsh Nagar Dighori 251 56 53 1 2 575 575
Auliya Nagar Nandanvan 318 52 0 51 1 832 832
Dighori Village Dighori 416 94 87 1 1 5 483 480 402 1365
Hasan Bagh Slum Nandanvan 1459 252 0 252 1131 1131
Nandanvan Slum Nandanvan 222 44 0 44 192 192
HIG/MIG Dattatrya Nagar Sakkardara 329 20 17 1 2 214 214
9194 1829 1236 480 8 20 85 0 1568 214 16447 0 2562 903 0 21694
67.58% 26.24% 0.44% 1.09% 4.65%Percentage
Sub Total
SLUM
5
HIG
MIG
LIG
Nehru Nagar
Water Audit, Leak Detection Plan

STC, Mumbai NMC, Water Works Dept., Nagpur
Water Audit, Leak Detection Plan Studied By :- DINESH RATHI & ASSOCIATES
CONSUMER SUMMARY OF GANDHIBAGH ZONE {VI}
75.73%
3.36%
0.00%
8.61%
12.31%
0.00%
10.00%
20.00%
30.00%
40.00%
50.00%
60.00%
70.00%
80.00%
Legal Connection ILGL Conection No Connection ILGL Billing No Billing

STC, Mumbai NMC, Water Works Dept. Nagpur
1/2" 2" 3" 4" 5" 6" 8" 10"
Length of Pipe Lines in Meter
IllegalILGL
Billing
Total Populati
on
No. of Consum
er
No Connect
ion
No Billing
Legal
CONSUMER SUMMARY OF SELECTED TEST ZONES FOR WATER AUDIT, LEAK DETECTION PLAN
Total Length of Pipe
ESR Command
Area
Sr. No.
Zone Category Test Zone
HIG Queta Colony Lakadganj 944 128 127 1 716 215 931
MIG Hansapuri Bhoipura 126 107 19 122 215 151 244 732
LIG Ganjipeth Sitabuldi Fort 117 17 7 2 8 102 102
Bhoipura Bhoipura 318 54 24 13 15 2 305 305
Chitnavis Pura Sitabuldi Fort 828 152 64 75 13 69 357 166 592
Namak Factory Bhoipura 103 91 12 95 56 384 535
Killa Mahal Kill Mahal 505 69 52 10 7 19 201 208 428
Satranjipura Lakadganj 259 40 25 3 12 208 208
HIG/MIG Mahal Sitabuldi Fort 444 73 63 4 6 168 86 92 346
Gandhi Grain Market
Lakadganj 399 101 88 1 7 5 411 445 856
Adarsh Nagar Lakadganj 1741 299 232 34 32 1 467 45 1127 126 90 171 2026
5555 1162 880 143 100 0 39 0 871 1799 2934 341 535 581 0 7061
75.73% 12.31% 8.61% 0.00% 3.36%Percentage
6
SLUM
MIG/LIG
Sub Total
Gandhibagh
Water Audit, Leak Detection Plan

STC, Mumbai NMC, Water Works Dept., Nagpur
Water Audit, Leak Detection Plan Studied By :- DINESH RATHI & ASSOCIATES
CONSUMER SUMMARY OF SATRANJIPURA ZONE {VII}
0.10%
21.95%
3.49%
36.51%37.95%
0.00%
5.00%
10.00%
15.00%
20.00%
25.00%
30.00%
35.00%
40.00%
Legal Connection ILGL Conection No Connection ILGL Billing No Billing

STC, Mumbai NMC, Water Works Dept. Nagpur
1/2" 2" 3" 4" 5" 6" 8" 10"
Length of Pipe Lines in Meter
IllegalILGL
Billing
Total Populati
on
No. of Consum
er
No Connect
ion
No Billing
Legal
CONSUMER SUMMARY OF SELECTED TEST ZONES FOR WATER AUDIT, LEAK DETECTION PLAN
Total Length of Pipe
ESR Command
Area
Sr. No.
Zone Category Test Zone
Loha OliGoverner House
107 28 18 10 142 142
Kashmiri Galli Indora Tapping 406 52 45 2 4 1 101 322 423
Timki Governer House
143 26 14 7 4 1 111 111
Nawa Nakasha Indora Tapping 370 52 9 41 2 175 175
Tulsi NagarKalmana Tapping
190 40 39 1 0
Ladpura Indora Tapping 367 61 19 28 14 243 237 480
Vinkar Colony Indora Tapping 383 64 49 14 1 445 445
Vinoba Bhave Nagar
Subhan Nagar 397 87 20 51 10 6 540 540
Timki Governer House
306 43 2 41 44 411 455
ParwarpuraGoverner House
252 41 39 2 274 150 424
Kundanlal Gupta Slum
Kalmana Tapping
701 118 2 107 9 260 132 392
Rajiv Gandhi Nagar
Kalmana Tapping
1204 203 1 54 123 25 64 64
Bangde LayoutKalmana Tapping
188 36 15 2 18 1 135 135
Barse Nagar Indora Tapping 191 33 7 9 17 318 318
Shanti NagarKalmana Tapping
463 91 91 425 352 777
5668 975 370 356 214 1 34 0 388 763 3096 0 634 0 0 4881
37.95% 36.51% 21.95% 0.10% 3.49%Percentage
MIG
LIG
SLUM
MIG/LIG
Sub Total
Satranjipura7HIG
Water Audit, Leak Detection Plan

STC, Mumbai NMC, Water Works Dept., Nagpur
Water Audit, Leak Detection Plan Studied By :- DINESH RATHI & ASSOCIATES
CONSUMER SUMMARY OF LAKADGANJ ZONE {VIII}
52.16%
10.57%
1.64%
20.23%
15.40%
0.00%
10.00%
20.00%
30.00%
40.00%
50.00%
60.00%
Legal Connection ILGL Conection No Connection ILGL Billing No Billing

STC, Mumbai NMC, Water Works Dept. Nagpur
1/2" 2" 3" 4" 5" 6" 8" 10"
Length of Pipe Lines in Meter
IllegalILGL
Billing
Total Populati
on
No. of Consum
er
No Connect
ion
No Billing
Legal
CONSUMER SUMMARY OF SELECTED TEST ZONES FOR WATER AUDIT, LEAK DETECTION PLAN
Total Length of Pipe
ESR Command
Area
Sr. No.
Zone Category Test Zone
Deshpande Layout
Bharatwadi 392 80 66 11 3 194 194
H. B. Town Subhan Nagar 406 40 13 17 10 227 227
Jalaram NagarMini Mata Nagar
220 27 21 1 3 2 353 101 454
Trimurti Nagar Bharatwadi 413 89 63 4 17 5 468 468
Gangabagh Pardi Subhan Nagar 439 94 55 15 13 11 411 411
Shikshak NagarMini Mata Nagar
127 27 15 9 3 224 224
Deshpande Layout
Bharatwadi 321 59 37 3 16 3 192 192
Vinobha Bhave Nagar
Subhan Nagar 792 147 87 16 31 2 11 601 138 739
Janki NagarMini Mata Nagar
340 74 59 1 12 2 171 132 246 549
Prajapati Nagar Bharatwadi 550 96 45 36 14 1 752 58 810
Bhandewadi Slum Subhan Nagar 748 152 46 58 29 19 435 435
Punjoram WadiMini Mata Nagar
483 89 1 16 39 33 193 77 270
5231 974 508 150 197 16 103 171 0 0 4182 0 562 58 0 4973
52.16% 15.40% 20.23% 1.64% 10.57%Percentage
MIG
LIG
Sub Total
Lakadganj8
HIG
SLUM
Water Audit, Leak Detection Plan

STC, Mumbai NMC, Water Works Dept., Nagpur
Water Audit, Leak Detection Plan Studied By :- DINESH RATHI & ASSOCIATES
CONSUMER SUMMARY OF ASHI NAGAR ZONE {IX}
2.10%0.29%
16.97%
25.71%
54.92%
0.00%
10.00%
20.00%
30.00%
40.00%
50.00%
60.00%
Legal Connection ILGL Conection No Connection ILGL Billing No Billing

STC, Mumbai NMC, Water Works Dept. Nagpur
1/2" 2" 3" 4" 5" 6" 8" 10"
Length of Pipe Lines in Meter
IllegalILGL
Billing
Total Populati
on
No. of Consum
er
No Connect
ion
No Billing
Legal
CONSUMER SUMMARY OF SELECTED TEST ZONES FOR WATER AUDIT, LEAK DETECTION PLAN
Total Length of Pipe
ESR Command
Area
Sr. No.
Zone Category Test Zone
Yashodeep Nagar Binaki 204 45 36 4 2 3 426 426
New Thaware Nagar
Jaripatka 457 102 70 19 3 1 9 495 115 214 307 1131
Bhole Nagar Binaki 284 50 8 26 2 14 74 238 312
Boudha Nagar, Indora Sq.Indora Tapping 210 56 47 6 3 255 255
Boudha Nagar, Zone Office
Indora Tapping 299 44 23 20 1 252 252
Siddarth Nagar Indora Tapping 82 18 14 4 146 146
Yogi Arvind Nagar Binaki 2440 454 5 438 10 1 2930 2930
Jaripatka, Chaodhari Sq.
Bezanbagh 370 73 58 6 5 4 52 273 325
Sant Lahanuji Nagar
Jaripatka 196 39 9 24 4 2 315 315
Kabeer Nagar Nari 1149 271 103 138 23 2 5 1392 258 1650
Rani Durgawati Nagar
Binaki 246 58 52 1 3 1 1 452 452
Devi Nagar Indora Tapping 289 58 48 8 2 337 192 529
Hemu Colony Bezanbagh 456 67 56 2 8 1 336 336
Pilli Nadi Uppalwadi 1194 261 261 191 191
Wanjara Village Uppalwadi 557 92 8 72 12 1237 1237
Maya Nagar Jaripatka 372 71 28 39 3 1 120 110 230
Nara Village Uppalwadi 87 1285 1372
Nari Basti Nari 271 16 399 686
Chawk's Colony Indora Tapping 474 104 17 83 4 312 115 427
Sugat Nagar Jaripatka 227 44 20 12 9 3 180 180
Kamgar Nagar Nari 2569 473 10 405 56 1 1 2454 338 2792
12075 2380 612 1307 404 7 50 0 2197 0 10596 0 2337 1044 0 16174
25.71% 54.92% 16.97% 0.29% 2.10%Percentage
Ashi Nagar9HIG
MIG
MIG/LIG
Sub Total
LIG
SLUM
Water Audit, Leak Detection Plan

STC, Mumbai NMC, Water Works Dept., Nagpur
Water Audit, Leak Detection Plan Studied By :- DINESH RATHI & ASSOCIATES
CONSUMER SUMMARY OF MANGALWARI ZONE {X}
74.25%
10.30% 9.23%
2.15%4.08%
0.00%
10.00%
20.00%
30.00%
40.00%
50.00%
60.00%
70.00%
80.00%
Legal Connection ILGL Conection No Connection ILGL Billing No Billing
`

STC, Mumbai NMC, Water Works Dept. Nagpur
1/2" 2" 3" 4" 5" 6" 8" 10"
Length of Pipe Lines in Meter
IllegalILGL
Billing
Total Populati
on
No. of Consum
er
No Connect
ion
No Billing
Legal
CONSUMER SUMMARY OF SELECTED TEST ZONES FOR WATER AUDIT, LEAK DETECTION PLAN
Total Length of Pipe
ESR Command
Area
Sr. No.
Zone Category Test Zone
Geeta Nagar Gittikhadan 379 56 43 2 7 4 283 73 356
Mohan NagarGoverner House
258 53 53 214 214
MHADA ColonyGoverner House
150 31 31 200 200
LIG Patel Nagar Gittikhadan 354 61 56 5 284 384 668
Borgaon SlumGoverner House
142 30 23 2 4 1 53 162 215
New Basti SlumGoverner House
295 46 24 19 3 223 223
HIG/MIG Byramji TownGoverner House
160 29 23 2 4 186 382 568
Shiela Nagar Gittikhadan 402 64 49 1 13 1 322 322
Shri Krishna Nagar
Governer House
482 96 44 19 18 15 288 166 454
2622 466 346 48 43 19 10 0 1094 322 1422 0 382 0 0 3220
74.25% 10.30% 9.23% 4.08% 2.15%Percentage
Sub Total
Mangalwari10
MIG/LIG
MIG
SLUM
Water Audit, Leak Detection Plan

STC, Mumbai NMC, Water Work Dept., Nagpur
1/2" 2" 3" 4" 5" 6" 8"
1 Dharampeth 2578 449 433 0 0 15 0 920 410 2426 0 1147 0 4903
2 Laxmi Nagar 1738 242 237 0 0 5 0 47 186 1901 0 848 0 2982
3 Hanuman Nagar 772 130 127 2 0 1 0 0 704 363 0 0 0 1067
4 Dhantoli 1353 183 177 1 3 2 0 173 996 538 0 0 0 1707
5 Nehru Nagar 2299 433 385 9 8 30 0 0 214 4484 0 1009 275 5982
6Gandhibag (Sokta Bhavan)
1388 201 190 5 6 0 0 168 802 92 215 0 0 1277
7 Satranjipura 513 80 63 2 14 1 0 101 0 464 0 0 0 565
8 Lakadganj 1018 147 100 1 31 15 0 0 0 774 0 101 0 875
9 Ashi Nagar 661 147 106 23 5 12 0 495 0 541 0 214 307 1557
10 Mangalwari 160 29 23 0 2 4 0 186 0 0 0 382 0 568
12480 2041 1841 43 69 85 0 2090 3312 11583 215 3701 582 21483
90.20% 2.11% 3.38% 4.16%Percentage
Total
Zone No. of Consumer LegalSr. No.
Total Length of Pipe
Length of Pipe Lines in MeterTotal
PopulationIllegal
No Connection
No Billing
CONSUMER SUMMARY OF SELECTED HIG TEST ZONES FOR WATER AUDIT, LEAK DETECTION PLAN
CONSUMER SUMMARY OF HIG TEST ZONE
Legal, 90.20%
Illegal, 2.11%No Billing, 4.16% No Connection, 3.38%
Legal
Illegal
No Connection
No Billing
Water Audit, Leak Detection Plan Studied By :- DINESH RATHI & ASSOCIATES

STC, Mumbai NMC, Water Work Dept., Nagpur
1/2" 2" 3" 4" 5" 6" 8" 10"
Bajiprabhu Nagar Ram Nagar 365 80 65 0 0 15 0 0 0 1096 0 690 0 0 1786
Ambazari Layout Ram Nagar 486 63 63 0 0 0 0 0 0 813 0 0 0 0 813
Friends Colony Gittikhadan 452 102 101 0 0 0 0 0 0 517 0 283 0 0 800
Tilak NagarRam Nagar / Rifle Line
1275 204 204 0 0 0 0 920 410 0 0 174 0 0 1504
2578 449 433 0 0 15 0 920 410 2426 0 1147 0 0 4903
Nelco Society Gayatri Nagar 454 38 35 0 0 3 0 0 0 240 0 250 0 0 490
Friend SocietyLaxmi Nagar Old
171 36 36 0 0 0 0 0 186 538 0 0 0 0 724
Congress Nagar Dhantoli 710 94 93 0 0 1 0 47 0 127 0 476 0 0 650
Panchdeep Nagar Khamla 284 48 48 0 0 0 0 0 0 701 0 0 0 0 701
Nagbhoomi Layout Khamla 119 26 25 0 0 1 0 0 0 295 0 122 0 0 417
1738 242 237 0 0 5 0 47 186 1901 0 848 0 0 2982
Banerjee Layout Omkar Nagar 494 89 87 1 0 1 0 0 704 0 0 0 0 0 704
Kukade LayoutWanjari Nagar Old
278 41 40 1 0 0 0 0 0 363 0 0 0 0 363
772 130 127 2 0 1 0 0 704 363 0 0 0 0 1067
Reshimbagh Reshim Bagh 392 64 62 1 0 1 0 173 275 201 0 0 0 0 649
Hanuman NagarWanjari Nagar Old
961 119 115 0 3 1 0 0 721 337 0 0 0 0 1058
1353 183 177 1 3 2 0 173 996 538 0 0 0 0 1707Sub Total
Sub Total
4 Dhantoli
HIG
Hanuman Nagar
Sub Total
2 Laxmi Nagar
HIG
HIG
CONSUMER SUMMARY OF SELECTED HIG TEST ZONES FOR WATER AUDIT, LEAK DETECTION PLAN
Sr. No.
Zone Category Test ZoneESR
Command Area
Total Population
No Connect
ion
No. of Consumer
LegalNo
Billing
Length of Pipe Lines in Meter Total Length of Pipe
1 Dharampeth HIG
Illegal
Sub Total
3
Water Audit, Leak Detection Plan Studied By :- DINESH RATHI & ASSOCIATES

STC, Mumbai NMC, Water Work Dept., Nagpur
Surve Nagar Sakkardara 656 124 100 0 7 17 0 0 0 848 0 464 275 0 1587
Sanmarg Nagar Hudkeshwar 211 45 38 0 0 7 0 0 0 35 0 285 0 0 320
Pragati Colony Dighori 287 66 66 0 0 0 0 0 0 1129 0 50 0 0 1179
Gurudeo Nagar Nandanvan 703 150 136 9 0 4 0 0 0 2357 0 0 0 0 2357
MHADA Colony Nandanvan 113 28 28 0 0 0 0 0 0 115 0 210 0 0 325
Dattatrya Nagar Sakkardara 329 20 17 0 1 2 0 0 214 0 0 0 0 0 214
2299 433 385 9 8 30 0 0 214 4484 0 1009 275 0 5982
Queta Colony Lakadganj 944 128 127 1 0 0 0 0 716 0 215 0 0 0 931
Mahal Sitabuldi Fort 444 73 63 4 6 0 0 168 86 92 0 0 0 0 346
1388 201 190 5 6 0 0 168 802 92 215 0 0 0 1277
Loha OliGoverner House
107 28 18 0 10 0 0 0 0 142 0 0 0 0 142
Kashmiri GalliIndora Tapping
406 52 45 2 4 1 0 101 0 322 0 0 0 0 423
513 80 63 2 14 1 0 101 0 464 0 0 0 0 565
Deshpande Layout Bharatwadi 392 80 66 0 11 3 0 0 0 194 0 0 0 0 194
H. B. Town Subhan Nagar 406 40 13 0 17 10 0 0 0 227 0 0 0 0 227
Jalaram NagarMini Mata Nagar
220 27 21 1 3 2 0 0 0 353 0 101 0 0 454
1018 147 100 1 31 15 0 0 0 774 0 101 0 0 875
Yashodeep Nagar Binaki 204 45 36 4 2 3 0 0 0 426 0 0 0 0 426
New Thaware Nagar
Jaripatka 457 102 70 19 3 9 0 495 0 115 0 214 307 0 1131
661 147 106 23 5 12 0 495 0 541 0 214 307 0 1557
10 MangalwariHIG Byramji Town
Governer House
160 29 23 0 2 4 0 186 0 0 0 382 0 0 568
160 29 23 0 2 4 0 186 0 0 0 382 0 0 568Sub Total
Sub Total
Sub Total
8 Lakadganj
HIG
Sub Total
9 Ashi Nagar
HIG
Sub Total
7 Satranjipura
HIG
Sub Total
6 Gandhibagh
5 Nehru Nagar
HIG
HIG
Water Audit, Leak Detection Plan Studied By :- DINESH RATHI & ASSOCIATES

STC, Mumbai NMC, Water Work Dept., Nagpur
1/2" 2" 3" 4" 5" 6" 8"
1 Dharampeth 923 144 133 0 7 4 0 266 0 638 0 258 0 1162
2 Laxmi Nagar 2280 389 389 0 0 0 0 365 0 1817 0 774 0 2956
3 Hanuman Nagar 470 108 88 4 4 12 0 0 0 1340 0 0 0 1340
4 Dhantoli 464 82 82 0 0 0 0 164 162 587 0 0 0 913
5 Nehru Nagar 2714 569 490 45 0 18 0 205 0 6423 0 1340 226 8194
6Gandhibag (Sokta Bhavan)
2140 526 427 35 39 25 0 589 671 1278 126 535 415 3614
7 Satranjipura 1357 242 160 57 24 0 0 0 318 711 0 352 0 1381
8 Lakadganj 979 210 133 19 39 19 0 0 0 1103 0 0 0 1103
9 Ashi Nagar 4145 789 139 556 68 25 0 74 0 3837 0 115 338 4364
10 Mangalwari 1671 300 220 22 38 5 0 571 322 653 0 0 0 1546
17143 3359 2261 738 219 108 0 2234 1473 18387 126 3374 979 26573
67.31% 21.97% 6.52% 3.22%
Total
Percentage
Legal IllegalNo
ConnectionNo
Billing
Length of Pipe Lines in Meter Total Length of Pipe
CONSUMER SUMMARY OF SELECTED MIG TEST ZONES FOR WATER AUDIT, LEAK DETECTION PLAN
Sr. No.
ZoneTotal
PopulationNo. of Consumer
CONSUMER SUMMARY OF MIG TEST ZONE
No Billing, 3.22% No Connection, 6.52%
Illegal, 21.97%
Legal, 67.31%
Legal
Illegal
No Connection
No Billing
Water Audit, Leak Detection Plan Studied By :- DINESH RATHI & ASSOCIATES

STC, Mumbai NMC, Water Work Dept., Nagpur
1/2" 2" 3" 4" 5" 6" 8" 10"
Gajanan NagarSeminary Hills
109 38 27 0 7 4 0 0 0 455 0 0 0 0 455
Giripeth Ram Nagar 814 106 106 0 0 0 0 266 0 183 0 258 0 0 707
923 144 133 0 7 4 0 266 0 638 0 258 0 0 1162
Prasad Nagar Takliseem 472 74 74 0 0 0 0 0 0 753 0 0 0 0 753
Guddhe LayoutLaxmi Nagar New
159 31 31 0 0 0 0 0 0 387 0 0 0 0 387
Vijay NagarGayatri Nagar
235 46 46 0 0 0 0 365 0 12 0 365 0 0 742
NIT Layout Gittikhadan
Laxmi Nagar New
574 100 100 0 0 0 0 0 0 0 0 0 0 0 0
Milind Nagar Khamla 427 52 52 0 0 0 0 0 0 421 0 0 0 0 421
Adhyapak Nagar Takliseem 413 86 86 0 0 0 0 0 0 244 0 409 0 0 653
2280 389 389 0 0 0 0 365 0 1817 0 774 0 0 2956
Mahatma Fule Nagar
Omkar Nagar
296 66 55 3 2 6 0 0 0 694 0 0 0 0 694
Shiv Shakti NagarHudkeshwar
174 42 33 1 2 6 0 0 0 646 0 0 0 0 646
470 108 88 4 4 12 0 0 0 1340 0 0 0 0 1340
4 DhantoliMIG Trikoni Maidan
Wanjari Nagar Old
464 82 82 0 0 0 0 164 162 587 0 0 0 0 913
464 82 82 0 0 0 0 164 162 587 0 0 0 0 913Sub Total
2 Laxmi Nagar
MIG
Sub Total
Sub Total
3 Hanuman Nagar
MIG
No Billing
Length of Pipe Lines in Meter
Dharampeth MIG
No Connecti
on
No. of Consumer
Legal Illegal
1
Sr. No.
Zone Category Test ZoneESR
Command Area
Total Populatio
n
Sub Total
CONSUMER SUMMARY OF SELECTED MIG TEST ZONES FOR WATER AUDIT, LEAK DETECTION PLAN
Total Length of Pipe
Water Audit, Leak Detection Plan Studied By :- DINESH RATHI & ASSOCIATES

STC, Mumbai NMC, Water Work Dept., Nagpur
Ayodhya Nagar,Ram
Sakkardara 213 40 31 0 0 7 0 0 0 398 0 0 0 0 398
Ayodhya Nagar,Thakur
Sakkardara 148 26 21 5 0 0 0 205 0 115 0 0 0 0 320
New Malgi Hudkeshwar
1530 307 281 12 0 0 0 0 0 2771 0 708 0 0 3479
Old Malgi Hudkeshwar
685 165 147 7 0 11 0 0 0 2827 0 364 226 0 3417
Sai Nagar Dighori 138 31 10 21 0 0 0 0 0 312 0 268 0 0 580
Telephone Nagar Dighori 151 35 30 0 0 5 0 336 0 0 0 0 0 0 336
Shakti Mata Nagar Nandanvan 273 56 36 0 0 20 0 0 0 669 0 40 0 0 709
Shri Krishna Nagar
Nandanvan 257 48 44 1 0 3 0 0 0 830 0 0 0 0 830
2714 569 490 45 0 18 0 205 0 6423 0 1340 226 0 8194
Hansapuri Bhoipura 0 126 107 0 0 19 0 122 215 151 0 0 244 0 732
Gandhi Grain Market
Lakadganj 399 101 88 1 7 5 0 0 411 0 0 445 0 0 856
Adarsh Nagar Lakadganj 1741 299 232 34 32 1 0 467 45 1127 126 90 171 0 2026
2140 526 427 35 39 25 0 589 671 1278 126 535 415 0 3614
Timki Governer House
143 26 14 7 4 0 0 0 0 111 0 0 0 0 111
Nawa NakashaIndora Tapping
370 52 9 41 2 0 0 0 0 175 0 0 0 0 175
Tulsi NagarIndora Tapping
190 40 39 0 1 0 0 0 0 0 0 0 0 0 0
Barse NagarIndora Tapping
191 33 7 9 17 0 0 0 318 0 0 0 0 0 318
Shanti NagarKalmana Tapping
463 91 91 0 0 0 0 0 0 425 0 352 0 0 777
1357 242 160 57 24 0 0 0 318 711 0 352 0 0 1381
Trimurti Nagar Bharatwadi 413 89 63 4 17 5 0 0 0 468 0 0 0 0 468
Gangabagh PardiSubhan Nagar
439 94 55 15 13 11 0 0 0 411 0 0 0 0 411
Shikshak NagarMini Mata Nagar
127 27 15 0 9 3 0 0 0 224 0 0 0 0 224
979 210 133 19 39 19 0 0 0 1103 0 0 0 0 1103Sub Total
MIG
Sub Total
7 Satranjipura
MIG
Sub Total
8 Lakadganj
Sub Total
6 Gandhibag (Sokta Bhavan)
5 Nehru Nagar
MIG
MIG
Water Audit, Leak Detection Plan Studied By :- DINESH RATHI & ASSOCIATES

STC, Mumbai NMC, Water Work Dept., Nagpur
Bhole Nagar Binaki 284 50 8 26 2 14 0 74 0 238 0 0 0 0 312
Boudha Nagar, Indora Sq.Indora Tapping 210 56 47 6 0 3 0 0 0 255 0 0 0 0 255
Boudha Nagar, Zone Office
Indora Tapping 299 44 23 20 1 0 0 0 0 252 0 0 0 0 252
Siddarth Nagar Indora Tapping 82 18 14 4 0 0 0 0 0 146 0 0 0 0 146
Chawk's Colony Indora Tapping 474 104 17 83 0 4 0 0 0 312 0 115 0 0 427
Sugat Nagar Jaripatka 227 44 20 12 9 3 0 0 0 180 0 0 0 0 180
Kamgar Nagar Nari 2569 473 10 405 56 1 0 0 0 2454 0 0 338 0 2792
4145 789 139 556 68 25 0 74 0 3837 0 115 338 0 4364
Geeta Nagar Gittikhadan 379 56 43 2 7 4 0 283 0 73 0 0 0 0 356
Mohan NagarGoverner House
258 53 53 0 0 0 0 0 0 214 0 0 0 0 214
MHADA ColonyGoverner House
150 31 31 0 0 0 0 0 0 200 0 0 0 0 200
Shiela Nagar Gittikhadan 402 64 49 1 13 1 0 0 322 0 0 0 0 0 322
Shri Krishna Nagar
Governer House
482 96 44 19 18 0 0 288 0 166 0 0 0 0 454
1671 300 220 22 38 5 0 571 322 653 0 0 0 0 1546Sub Total
MIG
9 Ashi Nagar
MIG
Sub Total
10 Mangalwari
Water Audit, Leak Detection Plan Studied By :- DINESH RATHI & ASSOCIATES

STC, Mumbai NMC, Water Audit, Leak Detection Plan
1/2" 2" 3" 4" 5" 6" 8"
1 Dharampeth 1696 361 338 11 2 10 0 618 324 582 156 0 0 1680
2 Laxmi Nagar 1535 320 316 2 0 2 0 0 0 1154 0 936 0 2090
3 Hanuman Nagar 1200 247 214 27 0 5 0 0 981 1569 0 0 0 2550
4 Dhantoli 2608 473 441 17 4 11 0 143 1271 1230 0 530 0 3174
5 Nehru Nagar 1403 298 164 128 0 4 0 544 0 2238 0 173 0 2955
6Gandhibag (Sokta Bhavan)
117 17 7 2 8 0 0 0 0 102 0 0 0 102
7 Satranjipura 1147 212 88 93 24 7 0 243 445 777 0 0 0 1465
8 Lakadganj 1453 280 183 20 59 16 171 0 0 925 0 384 0 1480
9 Ashi Nagar 4155 837 175 606 42 11 0 0 0 4689 0 531 0 5220
10 Mangalwari 354 61 56 5 0 0 0 284 0 384 0 0 0 668
15668 3106 1982 911 139 66 171 1832 3021 13650 156 2554 0 21384
63.81% 29.33% 4.48% 2.12%Percentage
Total
Legal IllegalNo
Connection
CONSUMER SUMMARY OF SELECTED LIG TEST ZONES FOR WATER AUDIT, LEAK DETECTION PLAN
No Billing
Length of Pipe Lines in Meter Total Length of Pipe
Sr. No.
ZoneTotal
PopulationNo. of Consumer
CONSUMER SUMMARY OF LIG TEST ZONE
Legal, 63.81%
No Billing, 2.12% No Connection, 4.48%
Illegal, 29.33%
Legal
Illegal
No Connection
No Billing
Water Audit, Leak Detection Plan Studied By :- DINESH RATHI & ASSOCIATES

STC, Mumbai NMC, Water Audit, Leak Detection Plan
1/2" 2" 3" 4" 5" 6" 8" 10"
Manohar ViharSeminary Hills
511 130 130 0 0 0 0 0 0 465 0 0 0 0 465
Trust Layout Ram Nagar 369 80 70 4 1 5 0 67 173 117 0 0 0 0 357
Ambedkar NagarRam Nagar / Rifle Line
816 151 138 7 1 5 0 551 151 0 156 0 0 0 858
1696 361 338 11 2 10 0 618 324 582 156 0 0 0 1680
Kamgar Nagar Gayatri Nagar 422 83 80 1 0 2 0 0 0 397 0 210 0 0 607
Dhangarpura Gayatri Nagar 251 37 37 0 0 0 0 0 0 275 0 462 0 0 737
Savitri ViharLaxmi Nagar New
862 200 199 1 0 0 0 0 0 482 0 264 0 0 746
1535 320 316 2 0 2 0 0 0 1154 0 936 0 0 2090
Bajrang NagarWanjari Nagar Old
156 25 20 3 0 2 0 0 0 453 0 0 0 0 453
Shivraj NagarWanjari Nagar Old
264 51 49 0 0 1 0 0 981 0 0 0 0 0 981
Vinkar Colony Omkar Nagar 780 171 145 24 0 2 0 0 0 1116 0 0 0 0 1116
1200 247 214 27 0 5 0 0 981 1569 0 0 0 0 2550
Somwari Quarter Reshim Bagh 277 58 48 6 0 4 0 0 0 205 0 0 0 0 205
VakilpethWanjari Nagar Old
254 51 44 3 1 3 0 0 90 336 0 0 0 0 426
RajabakshaDirect Tapping
825 110 102 1 3 4 0 0 65 490 0 300 0 0 855
Ganeshpeth Direct Tapping
231 47 47 0 0 0 0 0 0 109 0 230 0 0 339
PTS ColonyDirect Tapping
1021 207 200 7 0 0 0 143 1116 90 0 0 0 0 1349
2608 473 441 17 4 11 0 143 1271 1230 0 530 0 0 3174
No Billing
Length of Pipe Lines in Meter
1 Dharampeth LIG
Legal Illegal
Sub Total
Total Length of Pipe
Sr. No.
Zone Category Test ZoneESR
Command Area
Total Populati
on
No Connecti
on
No. of Consumer
2 Laxmi Nagar
LIG
Sub Total
3 Hanuman Nagar
LIG
Sub Total
4 Dhantoli
LIG
Sub Total
CONSUMER SUMMARY OF SELECTED LIG TEST ZONES FOR WATER AUDIT, LEAK DETECTION PLAN
Water Audit, Leak Detection Plan Studied By :- DINESH RATHI & ASSOCIATES

STC, Mumbai NMC, Water Audit, Leak Detection Plan
Rajiv Gandhi Nagar
Sakkardara 438 98 26 72 0 0 0 544 0 0 0 0 0 0 544
Raghuji Nagar Sakkardara 396 92 85 4 0 3 0 0 0 831 0 173 0 0 1004
Adarsh Nagar Dighori 251 56 53 1 0 0 0 0 0 575 0 0 0 0 575
Auliya Nagar Nandanvan 318 52 0 51 0 1 0 0 0 832 0 0 0 0 832
1403 298 164 128 0 4 0 544 0 2238 0 173 0 0 2955
6 Gandhibag (Sokta Bhavan
LIG Ganjipeth Sitabuldi Fort 117 17 7 2 8 0 0 0 0 102 0 0 0 0 102
117 17 7 2 8 0 0 0 0 102 0 0 0 0 102
LadpuraIndora Tapping
367 61 19 28 14 0 0 243 0 237 0 0 0 0 480
Vinkar ColonyIndora Tapping
383 64 49 14 0 1 0 0 445 0 0 0 0 0 445
Vinoba Bhave Nagar
Subhan Nagar
397 87 20 51 10 6 0 0 0 540 0 0 0 0 540
1147 212 88 93 24 7 0 243 445 777 0 0 0 0 1465
Deshpande Layout
Bharatwadi 321 59 37 3 16 3 0 0 0 192 0 0 0 0 192
Vinobha Bhave Nagar
Subhan Nagar
792 147 87 16 31 11 0 0 0 601 0 138 0 0 739
Janki NagarMini Mata Nagar
340 74 59 1 12 2 171 0 0 132 0 246 0 0 549
1453 280 183 20 59 16 171 0 0 925 0 384 0 0 1480
Yogi Arvind Nagar Binaki 2440 454 5 438 10 0 0 0 0 2930 0 0 0 0 2930
Jaripatka, Chaudhari Sq.
Bezanbagh 370 73 58 6 5 4 0 0 0 52 0 273 0 0 325
Sant Lahanuji Nagar
Jaripatka 196 39 9 24 4 2 0 0 0 315 0 0 0 0 315
Kabeer Nagar Nari 1149 271 103 138 23 5 0 0 0 1392 0 258 0 0 1650
4155 837 175 606 42 11 0 0 0 4689 0 531 0 0 5220
10 MangalwariLIG Patel Nagar Gittikhadan 354 61 56 5 0 0 0 284 0 384 0 0 0 0 668
354 61 56 5 0 0 0 284 0 384 0 0 0 0 668
Sub Total
5 Nehru Nagar
LIG
Sub Total
7 Satranjipura
LIG
Sub Total
8 Lakadganj
LIG
Sub Total
9 Ashi Nagar
LIG
Sub Total
Sub Total
Water Audit, Leak Detection Plan Studied By :- DINESH RATHI & ASSOCIATES

STC,Mumbai NMC,Water Works Dept. Nagpur
1/2" 2" 3" 4" 5" 6" 8" 10"
1 Dharampeth 233 154 43 0 22 18.45 641 0 657 0 0 0 0 1298 1298
2 Laxmi Nagar 300 252 17 29 1 5.67 185 390 1061 0 0 0 0 1636 1636
3Hanuman Nagar
299 191 65 16 19 21.74 0 238 117 1103 0 79 0 0 1537
4 Dhantoli 160 118 42 0 0 26.25 0 214 295 293 0 96 0 0 898
5 Nehru Nagar 390 87 297 0 5 76.15 0 483 0 1803 0 0 402 0 2688
6Gandhibag (Sokta Bhavan)
477 329 91 36 21 19.08 0 122 1000 915 215 0 410 0 2662
7 Satranjipura 441 59 204 152 26 46.26 0 44 0 1144 0 282 0 0 1470
8 Lakadganj 337 92 110 68 53 32.64 0 0 0 1380 0 77 58 0 1515
9 Ashi Nagar 607 192 122 289 2 20.10 0 1628 87 1442 1285 192 399 1372 6405
10 Mangalwari 76 47 21 3 1 27.63 0 53 0 385 0 0 0 0 438
3320 1521 1012 593 150 30.48 826 3172 3217 8465 1500 726 1269 4306 20547
45.81% 30.48% 17.86% 4.52%
Total
Percenatge
IllegalNo
Connection
No Billing
CONSUMER SUMMARY OF SELECTED SLUM TEST ZONES FOR WATER AUDIT, LEAK DETECTION PLAN
Percentage of Illegal
Length of Pipe Lines in Meter Total Length of Pipe
Sr. No.
ZoneNo. of
ConsumerLegal
CONSUMER SUMMARY OF SLUM TEST ZONE
Legal, 45.81%
No Billing, 4.52%
No Connection, 17.86%
Illegal, 30.48%
Legal
Illegal
No Connection
No Billing
Water Audit, Leak Detection Plan Studied By :- DINESH RATHI & ASSOCIATES

STC,Mumbai NMC,Water Works Dept. Nagpur
1/2" 2" 3" 4" 5" 6" 8" 10"
Surendra GarhSeminary Hills
108 80 14 0 0 12.96 0 0 0 227 0 0 0 0 227
Vishwas NagarSeminary Hills
63 36 21 0 6 33.33 0 122 0 59 0 0 0 0 181
Seva Nagar Ram Nagar 46 28 4 0 14 8.70 0 0 0 371 0 0 0 0 371
Kachipura- 2Ram Nagar / Rifle Line
16 10 4 0 2 25.00 0 519 0 0 0 0 0 0 519
233 154 43 0 22 18.45 0 641 0 657 0 0 0 0 1298
Laxmi Nagar Laxmi Nagar Old 51 48 3 0 0 5.88 0 80 0 256 0 0 0 0 336
Bhamptee VillageLaxmi Nagar New 45 27 1 16 0 2.22 0 105 179 0 0 0 0 0 284
Tukdoji Nagar Gayatri Nagar 111 90 8 13 0 7.21 0 0 0 291 0 0 0 0 291
Takliseem Takliseem 45 42 3 0 0 6.67 0 0 211 189 0 0 0 0 400
Takiya Dhantoli 48 45 2 0 1 4.17 0 0 0 325 0 0 0 0 325
300 252 17 29 1 5.67 0 185 390 1061 0 0 0 0 1636
Chandramani Nagar
Wanjari Nagar Old77 67 9 0 1 11.69 0 158 117 0 0 79 0 0 354
Bhim Nagar Omkar Nagar 87 47 16 15 8 18.39 0 80 0 387 0 0 0 0 467
Sanjay Gandhi Nagar
Hudkeshwar 135 77 40 1 10 29.63 0 0 0 716 0 0 0 0 716
299 191 65 16 19 21.74 0 238 117 1103 0 79 0 0 1537
Juni Shukrawari Reshim Bagh 39 39 0 0 0 0.00 0 0 139 0 0 0 0 0 139
Siraspeth Wanjari Nagar Old 0
Kurnel Bagh Direct Tapping 36 36 0 0 0 0.00 0 214 0 0 0 0 0 0 214
Rambagh Direct Tapping 59 18 41 0 0 69.49 0 0 156 0 0 0 0 0 156
Vakilpeth Direct Tapping 26 25 1 0 0 3.85 0 0 0 293 0 96 0 0 389
160 118 42 0 0 26.25 0 214 295 293 0 96 0 0 898
SLUM
Sub Total
SLUM
3 Hanuman Nagar
Total Length of Pipe
CONSUMER SUMMARY OF SELECTED SLUM TEST ZONES FOR WATER AUDIT, LEAK DETECTION PLAN
No Billing
Length of Pipe Lines in MeterIllegalLegal
No. of Consumer
Test ZoneCategoryZone
SLUM
(% age) of Illegal
4 Dhantoli
SLUM
No Connecti
on
Dharampeth
Sr. No.
ESR Command
Area
Sub Total
2
1
Laxmi Nagar
Sub Total
Sub Total
Water Audit, Leak Detection Plan Studied By :- DINESH RATHI & ASSOCIATES

STC,Mumbai NMC,Water Works Dept. Nagpur
Dighori Village Dighori 94 87 1 0 5 1.06 0 483 0 480 0 0 402 0 1365
Hasan Bagh SlumNandanvan 252 0 252 0 0 100.00 0 0 0 1131 0 0 0 0 1131
Nandanvan SlumNandanvan 44 0 44 0 0 100.00 0 0 0 192 0 0 0 0 192
390 87 297 0 5 76.15 0 483 0 1803 0 0 402 0 2688
Bhoipura Boipura 128 127 1 0 0 0.78 0 0 716 0 215 0 0 0 931
Chitnavispura Sitabuldi Fort 126 107 0 0 19 0 122 215 151 0 0 244 0 732
Namak Factory Boipura 17 7 2 8 0 11.76 0 0 0 102 0 0 0 0 102
Killa Mahal Kill Mahal 54 24 13 15 2 24.07 0 0 0 305 0 0 0 0 305
Satranjipura Lakadganj 152 64 75 13 0 49.34 0 0 69 357 0 0 166 0 592
477 329 91 36 21 19.08 0 122 1000 915 215 0 410 0 2662
Timki Governer House 43 2 41 0 0 95.35 0 44 0 411 0 0 0 0 455
Parwarpura Governer House 41 39 0 2 0 0.00 0 0 0 274 0 150 0 0 424
Kundanlal Gupta Slum
Kalmana Tapping 118 2 107 9 0 90.68 0 0 0 260 0 132 0 0 392
Rajiv Gandhi Nagar
Kalmana Tapping 203 1 54 123 25 26.60 0 0 0 64 0 0 0 0 64
Bangade LayoutKalmana Tapping 36 15 2 18 1 5.56 0 0 0 135 0 0 0 0 135
441 59 204 152 26 46.26 0 44 0 1144 0 282 0 0 1470
Prajapati Nagar Bharatwadi 96 45 36 0 1 37.50 0 0 0 752 0 0 58 0 810
Bhandewadi SlumSubhan Nagar 152 46 58 29 19 38.16 0 0 0 435 0 0 0 0 435
Punjoram WadiMini Mata Nagar 89 1 16 39 33 17.98 0 0 0 193 0 77 0 0 270
337 92 110 68 53 32.64 0 0 0 1380 0 77 58 0 1515
Sub Total
8
Sub Total
Sub Total
Sub Total
7 Satranjipura
Lakadganj
SLUM
6 Gandhibag (Sokta Bhavan)
SLUM
5 Nehru Nagar
SLUM
SLUM
Water Audit, Leak Detection Plan Studied By :- DINESH RATHI & ASSOCIATES

STC,Mumbai NMC,Water Works Dept. Nagpur
Rani Durgawati
Binaki 58 52 1 3 1 1.72 0 0 0 452 0 0 0 0 452
Devi Nagar Indora Tapping 58 48 8 2 0 13.79 0 0 0 337 0 192 0 0 529
Hemu Colony Bezanbagh 67 56 2 8 1 2.99 0 0 0 336 0 0 0 0 336
Pilli Nadi Uppalwadi 261 0 0 261 0 0.00 0 0 0 191 0 0 0 0 191
Wanjra Village Uppalwadi 92 8 72 12 0 78.26 0 1237 0 0 0 0 0 0 1237
Maya Nagar Jaripatka 71 28 39 3 0 54.93 0 120 0 110 0 0 0 0 230
Nara Village Uppalwadi 0 0 0 0 0 0 0 0 87 0 1285 0 0 1372 2744
Nari Basti Nari 0 0 0 0 0 0 271 0 16 0 0 399 0 686
607 192 122 289 2 20.10 0 1628 87 1442 1285 192 399 1372 6405
Borgaon Slum Governer House 30 23 2 0 1 6.67 0 53 0 162 0 0 0 0 215
New Basti SlumGoverner House 46 24 19 3 0 41.30 0 0 0 223 0 0 0 0 223
76 47 21 3 1 27.63 0 53 0 385 0 0 0 0 438Sub Total
9 Ashi Nagar
SLUM
10 Mangalwari
SLUM
Sub Total
Water Audit, Leak Detection Plan Studied By :- DINESH RATHI & ASSOCIATES

Annexure-4 (Analysis of Maintenance Record)

STC, Mumbai NMC, Water Works Dept., Nagpur
12" 10" 8" 6" 5" 4" 3" 2" 1" 1/2" 12" 10" 8" 6" 5" 4" 3" 2" 1" 1/2" 12" 10" 8" 6" 5" 4" 3" 2" 1" 1/2"
Dharampeth 2 3 2 22 0 48 70 9 0 0 156 2 1 2 18 0 37 29 71 25 95 280 13 15 8 41 1 51 14 0 0 0 143 579
Laxmi Nagar 10 19 12 53 5 148 60 3 0 3 313 3 4 2 6 1 27 14 17 6 147 227 7 19 13 51 0 74 8 5 1 1 179 719
Hanuman Nagar
2 4 17 50 5 160 54 14 0 0 306 1 0 8 11 1 55 23 26 2 0 127 3 10 22 31 0 32 6 0 0 0 104 537
Dhantoli 4 7 3 55 33 191 150 16 0 0 459 1 3 3 9 4 34 25 85 5 279 448 7 15 17 43 16 105 12 0 0 0 215 1122
Nehru Nagar 12 8 8 33 0 98 58 18 0 0 235 8 9 8 8 0 64 25 33 0 23 178 14 8 9 18 0 79 34 0 0 0 162 575
Gandhibagh 7 2 10 35 15 79 77 7 0 0 232 4 10 3 21 3 49 23 89 12 57 271 7 7 31 24 5 65 34 1 1 0 175 678
Satranjipura 6 9 8 27 1 46 33 28 3 10 171 3 2 11 14 5 69 31 108 46 206 495 10 8 52 87 2 155 38 9 0 1 362 1028
Total 47 54 69 291 59 804 527 95 3 13 1962 22 33 44 103 14 361 181 430 96 807 2091 73 89 162 310 24 591 150 15 2 2 1418 5471
Pipe ValveZonesTotal Total
ANNEXURE-4
ANALYSIS OF MAINTENANCE RECORD
SUMMARY SHEET
Types of Maintenance
Grand TotalTotal
Joint
JOINT FAILURE(Year 2003-2004)
47 54 69
291
59
804
527
95
3 13
0
100
200
300
400
500
600
700
800
900
12" 10" 8" 6" 5" 4" 3" 2" 1" 1/2"
PIPE SIZE (INCH)
NO
. OF
FALI
UR
E R
EPO
RTE
D
PIPE FAILURE(Year 2003-2004)
22 33 44
103
14
361
181
430
96
807
0
100
200
300
400
500
600
700
800
900
12" 10" 8" 6" 5" 4" 3" 2" 1" 1/2"
PIPE SIZE (INCH)
NO
. OF
FA
ILU
RE
RE
PO
RT
ED
VALVE FAILURE(Year 2003-2004)
7389
162
310
24
591
150
15 2 20
100
200
300
400
500
600
700
12" 10" 8" 6" 5" 4" 3" 2" 1" 1/2"
VALVE SIZE (INCH)
NO
. OF
FA
ILU
RE
RE
PO
RT
ED
Water Audit, Leak Detection Plan Studied By :- DINESH TATHI & ASSOCIATES

Annexure-5 (Details of Public Stand Post)

STC, Mumbai NMC, Water Works Dept., Nagpur
Zone No.
Zone Nos. of Stand Post
1 Dharampeth Zone 8
2 Laxmi Nagar Zone 3
3 Hanuman Nagar Zone 4
4 Dhantoli Zone 12
5 Nehru Nagar Zone 3
6 Gandhibagh Zone 24
7 Satranjipura Zone 16
8 Lakadganj Zone 3
9 Ashi Nagar Zone 19
10 Mangalwari Zone 9
101Total Numbers of StandPost
DETAILS OF PUBLIC STAND POST [PWR] IN SELECTED TEST ZONE
ANNEXURE - 5
Public Standpost in Selected Zones
9
19
3
1624
3
12
43
8
0
5
10
15
20
25
30
Dh
ara
mp
eth
Zo
ne
Laxm
iN
ag
ar
Zo
ne
Ha
nu
ma
nN
ag
ar
Zo
ne
Dha
ntol
iZ
on
e
Neh
ruN
ag
ar
Zo
ne
Ga
nd
hib
ag
hZ
on
e
Sat
ranj
ipur
aZ
on
e
La
kad
ga
nj
Zo
ne
Ash
i Na
ga
rZ
on
e
Man
galw
ari
Zo
ne
1 2 3 4 5 6 7 8 9 10
Water Audit, Leak Detection Plan Studied By :- DINESH RATHI & ASSOCIATES

Annexure-6 (Average Flow Rate at Public Stand Post)

1 I Dharampeth Zone 0.229 1.294 10
2 II Laxmi Nagar Zone 0.189 1.068 2
3 III Hanuman Nagar Zone 0.164 0.928 2
4 IV Dhantoli Zone 0.285 1.615 6
5 V Nehru Nagar Zone 0.076 0.430 2
6 VI Gandhibagh Zone 0.147 0.552 5
7 VII Satranjipura Zone 0.213 1.208 2
8 VIII Lakadganj Zone 0.282 0.820 2
9 IX Ashi Nagar Zone 0.311 1.762 14
10 X Mangalwari Zone 0.168 0.951 4
0.220 1.063 5
Pl. Note:1. The Kachipura slum is getting water for 24 Hrs.2. The Test zone of Ashinagar Zone is on Kanhan Rising Main and hence the flow rate and supply hours are more
Annexure-6
Total
Av. Supply Hours
AVERAGE FLOW RATE AT PUBLIC STAND POST
Av. Flow Rate LPS
Av. Velocity M/SEC
Sr.No.Zone No.
Zone Name

Annexure-7 (Average Flow Rate at Consumer End)

1 I Dharampeth Zone 11 22 0.204 1.154 7
2 II Laxmi Nagar Zone 4 7 0.167 0.947 3
3 III Hanuman Nagar Zone 3 6 0.104 0.590 2
4 IV Dhantoli Zone 9 17 0.207 1.171 4
5 V Nehru Nagar Zone 4 8 0.076 0.430 2
6 VI Gandhibagh Zone 4 8 0.196 0.971 4
7 VII Satranjipura Zone 8 15 0.152 0.860 3
8 VIII Lakadganj Zone 6 10 0.184 0.781 2
9 IX Ashi Nagar Zone 4 8 0.206 1.168 3
10 X Mangalwari Zone 7 14 0.154 0.870 3
60 115 0.165 0.894 3
Zone Name
Annexure-7
Total
Av. Supply Hours
AVERAGE FLOW RATE AT CONSUMER ENDNo. of Test Zone
No. of Consumer
Av. Flow Rate LPS
Av. Velocity M/SEC
Sr. No.
Zone No.

Annexure-8 (Water Tariff Structure)

NMC, Water Audit & Leak Detection DPR, Annexure-8
Shah Technical Consultants Pvt. Ltd, Mumbai
Annexure-8 (Water Tariff Structure)