Australian stingless bees improve greenhouse Capsicum production
Upload
khangminh22Category
view
1download
0
The Stop Signal of Honey Bees: Reconsidering Its MessageAuthor(s): James C. NiehSource: Behavioral Ecology and Sociobiology, Vol. 33, No. 1 (1993), pp. 51-56Published by: SpringerStable URL: http://www.jstor.org/stable/4600847Accessed: 19/01/2010 17:05
Your use of the JSTOR archive indicates your acceptance of JSTOR's Terms and Conditions of Use, available athttp://www.jstor.org/page/info/about/policies/terms.jsp. JSTOR's Terms and Conditions of Use provides, in part, that unlessyou have obtained prior permission, you may not download an entire issue of a journal or multiple copies of articles, and youmay use content in the JSTOR archive only for your personal, non-commercial use.
Please contact the publisher regarding any further use of this work. Publisher contact information may be obtained athttp://www.jstor.org/action/showPublisher?publisherCode=springer.
Each copy of any part of a JSTOR transmission must contain the same copyright notice that appears on the screen or printedpage of such transmission.
JSTOR is a not-for-profit service that helps scholars, researchers, and students discover, use, and build upon a wide range ofcontent in a trusted digital archive. We use information technology and tools to increase productivity and facilitate new formsof scholarship. For more information about JSTOR, please contact [email protected].
Springer is collaborating with JSTOR to digitize, preserve and extend access to Behavioral Ecology andSociobiology.
http://www.jstor.org
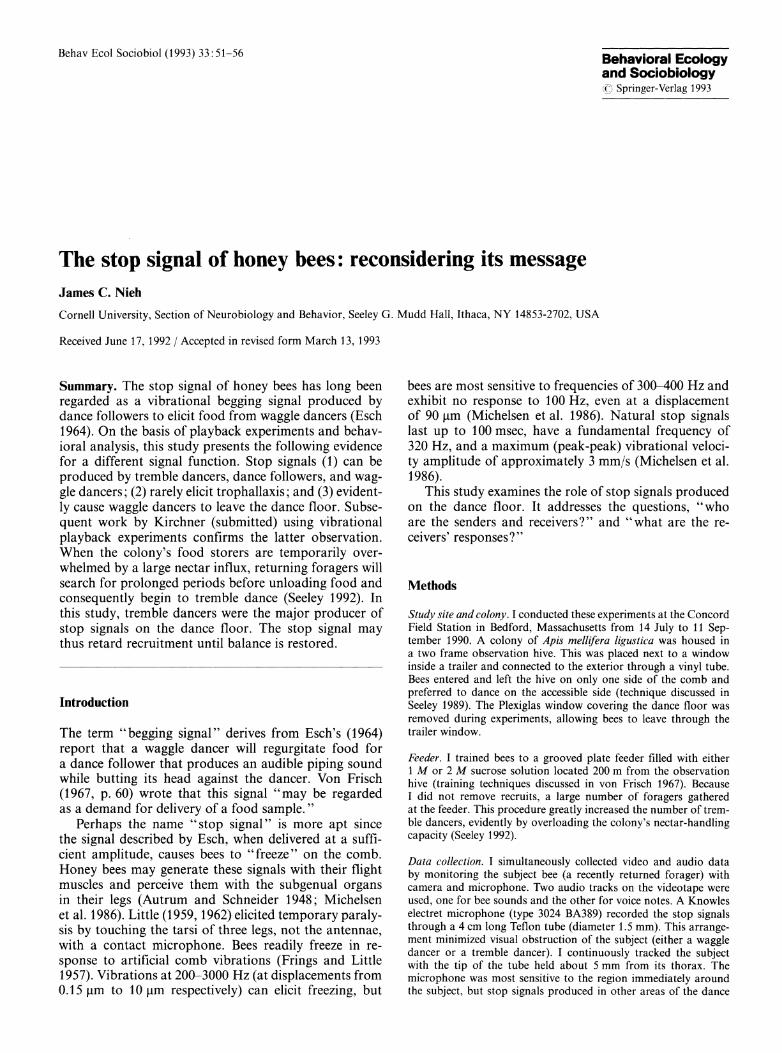
Behav Ecol Sociobiol (1993) 33:51-56 Behavioral Ecology and Sociobiology (O Springer-Verlag 1993
The stop signal of honey bees: reconsidering its message James C. Nieh
Cornell University, Section of Neurobiology and Behavior, Seeley G. Mudd Hall, Ithaca, NY 14853-2702, USA
Received June 17, 1992 / Accepted in revised form March 13, 1993
Summary. The stop signal of honey bees has long been regarded as a vibrational begging signal produced by dance followers to elicit food from waggle dancers (Esch 1964). On the basis of playback experiments and behav- ioral analysis, this study presents the following evidence for a different signal function. Stop signals (1) can be produced by tremble dancers, dance followers, and wag- gle dancers; (2) rarely elicit trophallaxis; and (3) evident- ly cause waggle dancers to leave the dance floor. Subse- quent work by Kirchner (submitted) using vibrational playback experiments confirms the latter observation. When the colony's food storers are temporarily over- whelmed by a large nectar influx, returning foragers will search for prolonged periods before unloading food and consequently begin to tremble dance (Seeley 1992). In this study, tremble dancers were the major producer of stop signals on the dance floor. The stop signal may thus retard recruitment until balance is restored.
Introduction
The term "begging signal" derives from Esch's (1964) report that a waggle dancer will regurgitate food for a dance follower that produces an audible piping sound while butting its head against the dancer. Von Frisch (1967, p. 60) wrote that this signal "may be regarded as a demand for delivery of a food sample."
Perhaps the name "stop signal" is more apt since the signal described by Esch, when delivered at a suffi- cient amplitude, causes bees to "freeze" on the comb. Honey bees may generate these signals with their flight muscles and perceive them with the subgenual organs in their legs (Autrum and Schneider 1948; Michelsen et al. 1986). Little (1959, 1962) elicited temporary paraly- sis by touching the tarsi of three legs, not the antennae, with a contact microphone. Bees readily freeze in re- sponse to artificial comb vibrations (Frings and Little 1957). Vibrations at 200-3000 Hz (at displacements from 0.15 gum to 10 IOm respectively) can elicit freezing, but
bees are most sensitive to frequencies of 300-400 Hz and exhibit no response to 100 Hz, even at a displacement of 90 ilm (Michelsen et al. 1986). Natural stop signals last up to 100 msec, have a fundamental frequency of 320 Hz, and a maximum (peak-peak) vibrational veloci- ty amplitude of approximately 3 mm/s (Michelsen et al. 1986).
This study examines the role of stop signals produced on the dance floor. It addresses the questions, "who are the senders and receivers?" and "what are the re- ceivers' responses?"
Methods
Study site and colony. I conducted these experiments at the Concord Field Station in Bedford, Massachusetts from 14 July to 11 Sep- tember 1990. A colony of Apis mellifera ligustica was housed in a two frame observation hive. This was placed next to a window inside a trailer and connected to the exterior through a vinyl tube. Bees entered and left the hive on only one side of the comb and preferred to dance on the accessible side (technique discussed in Seeley 1989). The Plexiglas window covering the dance floor was removed during experiments, allowing bees to leave through the trailer window.
Feeder. I trained bees to a grooved plate feeder filled with either 1 M or 2 M sucrose solution located 200 m from the observation hive (training techniques discussed in von Frisch 1967). Because I did not remove recruits, a large number of foragers gathered at the feeder. This procedure greatly increased the number of trem- ble dancers, evidently by overloading the colony's nectar-handling capacity (Seeley 1992).
Data collection. I simultaneously collected video and audio data by monitoring the subject bee (a recently returned forager) with camera and microphone. Two audio tracks on the videotape were used, one for bee sounds and the other for voice notes. A Knowles electret microphone (type 3024 BA389) recorded the stop signals through a 4 cm long Teflon tube (diameter 1.5 mm). This arrange- ment minimized visual obstruction of the subject (either a waggle dancer or a tremble dancer). I continuously tracked the subject with the tip of the tube held about 5 mm from its thorax. The microphone was most sensitive to the region immediately around the subject, but stop signals produced in other areas of the dance

52
floor were also audible. Approximately 21 x 17 cm of the dance floor was visible through the video camera. Filming started when a newly returned forager began to unload and ended when this forager left the dance floor. Since most foragers flew out through the open trailer window, foragers returning to the feeder were easily distinguished from foragers who simply retreated to an inaccessible portion of the hive. Occasionally, tremble and waggle dancers would leave the dance floor and move into other areas of the hive. I filmed both outcomes and differentiated them with recorded voice notes at the time of departure.
Classification. I used the following criteria to classify bees: Senders produce the acoustic component of the stop signal while lunging forward and butting their heads up against the receiver (Esch 1964). Head-butting alone without an acoustic signal was not considered a stop signal. Senders may also angle their wings in a V formation (Esch 1964). These physical displays enable the easy identification of signal targets.
Receivers are identified by the lunge of the sender. They are the targets of the head-butting and presumably of the acoustic signal. Receivers generally freeze in response to the stop signal, although they may remain in motion if the signal is weak.
I grouped senders and receivers by their behavior at the moment of signal production into the following categories: 1. Waggle dancers: bees performing the waggle dance (see von Frisch 1967) 2. Dance followers: bees following waggle dancers, presumably to learn the location of the feeder 3. Tremble dancers. bees moving with sustained, randomly ori- ented, trembling and shaking movements (see Seeley 1992) 4. Food exchangers. bees involved in the regurgitation or intake of food 5. Other bees: bees standing relatively motionless on the dance floor and not involved in any of the above behaviors
Stop signal receivers exhibited the following behaviors:
1. Departure (DEP): the receiver leaves the dance floor and flies out the observation window 2. Food exchange with sender (FE-S). the receiver participates in food exchange with the sender 3. Food exchange with other (FE-O). the receiver participates in food exchange with a bee other than the sender 4. Pausing (PA U): the receiver discontinues its pre-signal behavior and pauses, standing motionless, for at least one second after re- ceiving a stop signal. The receiver may then resume its previous behavior or remain inactive 5. No response (NR). the receiver resumes its pre-signal behavior after freezing during the stop signal 6. Trembling (TRE): the receiver begins to tremble dance
I scored changes in the behavior of stop signal receivers only if they occurred within 1 s after signal receipt. However, waggle dancers that had received a stop signal were monitored for the entire duration of their dances to observe if they ever exchanged food with the signal sender. I chose a narrow time window to minimize the probability of erroneously scoring independent be- haviors as responses to signals. The smallest time window that I could reliably score was 1 s. I weighted all stop signals equally. Some bees received multiple signals before exhibiting a behavioral change. However, stop signals do not appear to have a cumulative influence (data presented in this paper).
Playbacks
I used a probe producing natural and 350 Hz synthesized stop signals to study signal effects. Natural and synthesized sine wave signals were digitized with the MacAudios model 411 (GW Instru- ments), processed with MacSpeechLab vl.0 on a Macintosh 512KE computer, and recorded on cassette tape (Sony WM-D6C cassette player). Digitized control signals consisted of 0-20 kHz white noise
(1390-B Random Noise Generator, General Radio Company) and 100 Hz sine waves (which do not evoke the freezing response, Mi- chelsen et al. 1986). I equalized all playback pulses in voltage, in duration (0.12 s), and in spacing (0.5 s). During playbacks, the signal amplitude was monitored with an oscilloscope and main- tained at a constant level. The vibrational velocity of the signals was approximately 3.0 mm/s, as measured with a Briiel & Kjaer 4393 accelerometer connected to a B&K 2609 microphone supply and calibrated with a B&K 4294 vibrational calibrator. For mea- surement, the probe tip was held against an accelerometer embed- ded in a honeycomb. When the probe was held against the abdo- men of a bee directly above the embedded accelerometer, the vibra- tional velocity amplitude was approximately 2.7 mm/s RMS (root mean square amplitude). However, the actual vibrational velocity may have varied since it was not measured during the playbacks.
The probe consisted of a bee's head at the tip of a 6 cm long rigid paper rod (2 mm diameter) glued to the dome of an 8Q speak- er (5.7 cm diameter, Radio Shack 9865T) and held rigid with a paper cone glued to the periphery of the speaker dome. The probe was connected to the audio output channel of a Sony WM-D6C cassette player. A momentary switch enabled me to open and close the audio circuit and thus regulate the number of signals delivered. I touched the vibrating tip of the probe against the abdomen or thorax of the bee to deliver the signal.
Hypothesis testing
For these experiments, I only studied dance floor events. In this region, under the experimental conditions previously described, tremble dancers produce the majority of stop signals.
. The targeting of tremble dancer stop signals. I identified five receiver groups: waggle dancers, tremble dancers, food exchangers, dance followers, and "other bees". The distribution of stop signals among these groups could indicate selection by the tremble dancer or be the outcome of randomly directed signals. HO: Tremble dancers give stop signals to randomly chosen bees on the dance floor. HI: Tremble dancers direct stop signals at specific types of bees on the dance floor.
HO predicts equality between the observed proportions of receiver groups and their dance floor representation (fobs =df). H1 predicts that the observed proportions are greater for targeted groups (fobs >fdf) and less for non-targeted groups (fobs <df).
Censusing. To distinguish between these hypotheses, I followed tremble dancers producing stop signals and classified all receivers and all behavioral outcomes, including the absence of behavioral change (NR). Only stop signals produced by continuously moni- tored tremble dancers were considered. In other experiments, addi- tional data was obtained by monitoring waggle dancers that re- ceived stop signals from tremble dancers. Thus the data testing the targeting of tremble dancer stop signals (n=411) is a subset of the total data on stop signals delivered by tremble dancers (n = 1114).
The expected distribution of stop signal receiver groups can be approximated by their proportions on the dance floor. The tremble dancer moves rapidly in erratic directions (Seeley 1992). Thus a census of the area containing its path gives the expected frequency of receiver groups (based on HO). I censused all bees in a 21 x 17 cm section of the dance floor each time the subject produced a stop signal (approximately 35 bees in each survey, total 14500 bees), summed the censuses for each day, and com- pared the expected distribution with the observed distribution of signal recipients.
II. The effect of stop signals on waggle dancers. Waggle dancers exhibited five basic responses to the stop signal. The following hypotheses consider the departure response.

53
40
30
0 20
z 10
10 aii ii I I
0 .1 .2 .3
Probability of Departure
Fig. 1. Total distribution of probabilities for waggle dancer depar- ture (n = 338 dances observed during 15 days). Probabilities were calculated for a 1-s interval. Each bar represents a probability inter- val of 0.005. For this distribution: arithmetic mean = 0.053 + 0.049 (mean + SD), median = 0.037 + 0.049 (median + SD)
HO: Stop signals do not change a waggle dancer's probability of leaving the hive. HI: Stop signals increase the probability that a waggle dancer will leave the hive.
I calculated the random probability of a dancer leaving the hive within a 1-s interval and compared this with the observed probability of departure in the 1-s interval following stop signal receipt. I only considered dancers that were monitored continuous- ly during their stay in the hive. By randomly sampling all complete, stop-signal-free waggle dances for a given day, one can calculate the random probability of departure in a 1-s interval. Each random sample would constitute one trial and a departure would be scored only if the bee left within the chosen 1-s interval:
Prandom = number of departures/number of samples
For a dance n seconds long, there are n 1-s intervals that begin at:
0, 1,2,3, ..., n- s
Departure would only be scored if the last interval were randomly chosen. Thus for any particular waggle dance:
P'random = 1/n
By considering all complete, stop-signal-free waggle dances, one obtains a distribution of Prandoms. Over 15 days, I measured 338 complete, stop-signal-free waggle dances (average of 23 dances/ day). The number of such dances was small because many waggle dancers received at least one stop signal.
I compared a single probability expressing the central tendency of the distribution of PrandomS with the observed probability of
departure (taken from pooled data). As this distribution is skewed
(Fig. 1), I used the median as a measure of central tendency. Using the mean gave an equivalent result.
For each experiment (each day), I compared Prandom median (the median of that day's distribution of P'randomS) with Pobserved (the proportion of cases in which waggle dancers received stop signals and left the hive within 1 s) and tested the following predictions:
HO: Pobserved = P'random median
HI: Pobserved > P'random median
Statistical tests
All statistical comparisons were made using G-tests. I calculated G values for each experiment and pooled these over all experiments for a total comparison of significance (Sokal and Rohlf 1981). Average values are reported as mean + SD.
Results
Who sends stop signals?
Three types of bees produced stop signals. Tremble dancers produced 85.2%, dance followers produced 14.2%, and waggle dancers produced 0.5% of 1307 ob- served stop signals (Table 1).
Tremble dancers move throughout the hive with un- oriented, often vigorous, shaking and trembling move- ments, but they do not recruit foragers. Periodically, they may leave to forage. I only monitored tremble dances on the dance floor. On average, they danced for 57 + 56.8 s and produced 4.7 + 3.9 stop signals before moving off the dance floor.
Waggle dancers producing stop signals incorrectly oriented their waggle runs and usually began to tremble dance.
Who receives stop signals?
Waggle dancers, tremble dancers, food exchangers, dance followers, and "other bees" receive stop signals (Table 1). Tremble dancers signaled all five groups. Dance followers and waggle dancers only signaled wag- gle dancers.
Waggle dancers received 44.1% of all observed stop signals. Tremble dancers delivered the majority of stop signals received by waggle dancers (66.5%), only 32.3% and 1.2% came from dance followers and waggle dancers respectively.
Table 1. The number of stop signals produced and received by the sender and receiver groups in all 16 experiments
Receivers
Waggle dancers Tremble dancers Food exchangers Dance followers Other bees Total
Senders Tremble dancers 383 324 99 24 284 1114 Dance followers 186 0 0 0 0 186 Waggle dancers 7 0 0 0 0 7
Total 576 324 99 24 284 1307

54
.8 Waggle Dancers
.4
0 .02 .04
.8 Tremble Dancers
.4 * t
0 .1 .2
. .8 Food Exchangers o ? C'
C .4 0 0l **.
0
a. 0 .05 .1 .15
.8 Dance Followers
.4
0 .1 .2
Other Bees
.8 * 8signaled-
*.4
.7 .8 .9 1 0 .5 1
Proportion on dance floor (ff ) Average proportions
Fig. 2. Targeting of stop signals from tremble dancers among five receiver groups (n = 411 stop signals produced by specifically moni- tored tremble dancers). The lines drawn on the scatter plots show the null hypothesis prediction (fobs=fdf). The targeting hypothesis predicts that points for targeted groups will lie above the line (fobs > fdf), and points for untargeted groups will lie below this line (fobs <
fdf). The scale of the x-axis varies because these groups were present in different proportions. Waggle dancers were signaled by tremble dancers at high rates even when they made up only 2% of the dance floor bees. Extrapolation of the data suggests that "other bees" would not be signaled by tremble dancers at all if they made up less than 70% of the dance floor bees. The averaged proportions for all trials are given by the horizontal bars. White bars indicate the average proportion signaled; black bars indicate the average proportion on the dance floor. The error bars show 1 SD. The deviations are large because the normal proportions of each group on the dance floor were variable. However, the ratio fobs/fdf was relatively constant for some groups, as revealed in the scatter plots
The largest share of signals produced by tremble dancers (34.4%) were directed at waggle dancers. The remainder of these tremble dancer signals were divided among the following receivers: tremble dancers (29.1%),
"other bees" (25.5%), food exchangers (8.9%), and dance followers (2.2%).
Do tremble dancers direct their stop signals?
Such a distribution of stop signal recipients might arise through random interactions between bees on the dance floor, but this evidently does not occur (Fig. 2).
I tested the overall distribution for significant differ- ences and then examined individual classes. Out of 1114 stop signals produced by tremble dancers, I observed 411 during 16 days while monitoring 92 tremble dances on the dance floor, a total dance time of 110 min. On 3 days, no waggle dancers were present when I followed tremble dancers. The data for these three trials were excluded from this analysis due to the incomplete repre- sentation of the major receiver groups.
Tremble dancers did not randomly deliver stop sig- nals (reject HO). When the data from 13 trials were pooled, HO was rejected with P 0.001 (Gpooled 416.9, 39 df, n=411 stop signals).
Tremble dancers targeted waggle dancers, tremble dancers, and food exchangers (fobs >fdf, P < 0.001 in each case). "Other bees" were significantly non-targeted (fobs <fdf, P< 0.001). The number of waggle dancers de- creased as the number of tremble dancers increased. Thus waggle dance followers were present in only one trial of this analysis. In this trial, tremble dancers sig- naled dance followers (DF) at the random level (ob- served proportions: 4 DF, 36 non-DF; expected: 3.3 DF, 36.7 non-DF; P>0.65, G=0.15, 1 df). Dance fol- lowers received only 2% of the stop signals produced by tremble dancers. In most of these cases, they appeared to have intercepted signals directed at the waggle dancer.
Behavioral responses to stop signals
Departure was the dominant behavioral change ob- served in waggle dancers: 16% and 13% departed within 1 s after receiving a stop signal from a tremble dancer or a dance follower respectively. The average waggle dance lasted 32.2 +24.6 s.
The stop signal does not appear to be a food-begging signal. The sender rarely receives food. Dance followers were never observed to receive food after signaling a waggle dancer (n= 186 stop signals). Tremble dancers received food only once (out of 383 stop signals delivered to waggle dancers). Non-specific food exchange (FE-O) was rare: 6% and 8% for dance follower and tremble dancer signals respectively.
Natural and synthesized stop signals significantly (P<0.001) increased the probability of waggle dancer departure (Table 2). The data for natural stop signals combine data for stop signals produced by tremble dancers and dance followers. When separately analyzed, these data yielded the same significant results.
Departure was a dominant and significant response to sine wave and digitized playbacks (22% departed, P<0.005, n=491). No waggle dancers departed when

55
Waggle Dancers 5 (signals from dance followers)
n=186
1
Waggle Dancers 5 (signals from tremble dancers)
n=383 o
Tremble Dancers n=324
Food Exchangers 5 n=99
Dance Followers U n=24
I1
Other Bees n=284
0 -- -- " --
NR DEP FE-O PAU TRE
Fig. 3. Responses to the stop signal within 1 s of signal receipt. The first chart shows the responses of waggle dancers to signals produced by dance followers. All other charts show responses to signals produced by tremble dancers. Values are presented as pro- portions. The white bars indicate dominant behavioral changes. NR = no response; DEP = departs; FE-O = begins to food exchange with a bee other than the stop signal sender; PAU=pauses for 1 s and then resumes the previous behavior; and TRE=begins to tremble dance. Food exchange with the sender (FE-S) is not shown on these plots because this response was observed only once. Categories were left blank where they corresponded to the defining behavior of the receiver. For example, "other bees" that received stop signals and exhibited no behavioral change were scored NR (no response), not PAU (pauses) because they were defined as bees standing still on the dance floor
prodded by the probe without a sound playback (n = 8). Only one waggle dancer departed in response to white noise or 100 Hz playbacks (n = 13), although this experi- ment was only conducted once. This response rate (8%) was not significantly greater than expected (P>0.50). Departure was a specific waggle dancer response. Trem- ble dancers are also foragers, but none (0%) departed in response to stop signal playbacks (n = 19).
No significant difference was found between the probability of departure for waggle dancers that received multiple signals or only one signal (G=0.57, P>0.40, 1 df, n = 28).
Natural stop signals interrupted trophallaxis in 15 food exchanges (15.2%). In 13 cases (13.1%), one of the food exchanging bees began to tremble dance. "Other bees" were not specific targets. They exhibited almost no response to stop signals (Fig. 3).
Discussion
Stop signals evidently cause waggle dancers to leave the dance floor under conditions in which a large number of tremble dancers are present. Stop signals may there- fore reduce recruitment. Artificial comb vibrations at the frequency, intensity, and duration of natural stop signals are apparently sufficient to shorten dance times and reduce the number of recruits (Kirchner, submitted).
In this study, tremble dancers produced the majority of stop signals. Since an increase in tremble dancing is closely associated with a sudden influx of nectar that temporarily overwhelms the colony's food storers (See- ley 1992), the stop signal may provide negative feedback stemming a further rise in foraging. These conditions could occur when nectar is suddenly available after a period of dearth.
Dance followers and waggle dancers also produced stop signals, but these bees may have been foragers that stopped tremble dancing but did not lose their motiva- tion to produce stop signals. I occasionally observed a tremble dancer stop its characteristic shaking motions and begin to follow a waggle dancer. Similarly, waggle dancers producing stop signals tended to alternate be-
Table 2. Results of G-tests evaluating the significance of waggle dancer departure as a response to stop signals
Type of signal Observed Expected (if random) Gtotal P Trials n probability probability (combined (playbacks) of departure of departure experiments)
Natural stop signals 0.151 +0.079 0.039 + 0.013 98.5 <0.001 15 467 Playbacks 0.214 + 0.096 0.046 +0.022 29.8 < 0.001 4 491 (digitized and sine wave) Control playbacks 0.076 0.031 0.63 >0.50 1 13 (100 Hz and white noise)
The stop signal evidently causes waggle dancers to depart. The G values test H1 (Pobserved> P'random). The control playbacks did not significantly elicit departure, although a strong conclusion can-
not be made on the basis of this one experiment. The listed proba- bilities of departure are averages of the probabilities calculated for each separate experiment (mean + SD)

56
tween waggle runs and the disoriented shaking motions of the tremble dance.
Stop signals are apparently not food-begging signals. However, other functions are possible. Tremble dancers received 29% of stop signals produced by tremble dancers, almost equal to the proportion received by wag- gle dancers (34%) and significantly greater than one would expect from random signaling (P<0.001). Trem- ble dancers froze in response to stop signals, but dis- played almost no other behavioral changes. Occasional- ly, tremble dancers appeared to set off chain reactions of signaling among each other when massed on the dance floor. Perhaps stop signals also prolong tremble dancing or encourage reciprocal signaling - thus acting to reinforce and amplify the inhibition of recruitment.
Acknowledgements. I wish to thank Evan Balaban and Donald Griffin for contributing their time, facilities, and funds in support of this research. I am grateful to Tom Seeley and Will Towne for valuable discussions that initially led to this reexamination of the stop signal; to Wolfgang Kirchner for assistance with calibrat- ing my playback apparatus; to Tom Sisson for his practical experi- ence in the art of beekeeping; and especially to Tom Seeley for many meticulous readings of my manuscripts. The Ford Founda- tion supported this study.
References
Autrum H, Schneider W (1948) Vergleichende Untersuchungen uber den Erschiitterungssinn der Insekten. Z Vergl Physiol 31:77-88
Esch H (1964) Beitrage zum Problem der Entfemungsweisung in den Schwanzeltanzen der Honigbienen. Z Vergl Physiol 48: 534- 546
Frings H, Little F (1957) Reactions of honeybees in the hive to simple sounds. Science 125:122
Frisch K von (1967) The dance language and orientation of bees. (Translated by Leigh E. Chadwick). Belknap Press of Harvard University Press, Cambridge, Massachusetts
Kirchner W (1993) The tremble dance of the honeybee. Behav Ecol Sociobiol (submitted)
Little HF (1959) Reactions of honeybees to oscillations of known frequency. Anat Rec 134:601
Little HF (1962) Reactions of the honey bee Apis mellifera L. to artificial sounds and vibrations of known frequencies. Ann En- tomol Soc Am 55:82-89
Michelsen A, Kirchner W, Lindauer M (1986) Sound and vibra- tional signals in the dance language of the honeybee, Apis melli- fera. Behav Ecol Sociobiol 18:207-212
Seeley TD (1989) Social foraging in honeybees: how nectar foragers assess their colony's nutritional status. Behav Ecol Sociobiol 24:181-199
Seeley TD (1992) The tremble dance of the honey bee: message and meanings. Behav Ecol Sociobiol 31:375-384
Sokal R, Rohlf FJ (1981) Biometry, 2nd edn. WH Freeman, New York
Copyright © 2022 FDOKUMEN