The use of high performance liquid chromatography–quadrupole time-of-flight mass spectrometry...
7
Analytica Chimica Acta 685 (2011) 45–51 Contents lists available at ScienceDirect Analytica Chimica Acta journal homepage: www.elsevier.com/locate/aca The use of high performance liquid chromatography–quadrupole time-of-flight mass spectrometry coupled to advanced data mining and chemometric tools for discrimination and classification of red wines according to their variety Lukas Vaclavik a , Ondrej Lacina a , Jana Hajslova a,∗ , Jerry Zweigenbaum b a Institute of Chemical Technology Prague, Faculty of Food and Biochemical Technology, Department of Food Chemistry and Analysis, Technicka 5, 16628 Prague 6, Czech Republic b Agilent Technologies, 2850 Centerville Road, Wilmington, DE 19808, USA article info Article history: Received 22 June 2010 Received in revised form 7 November 2010 Accepted 9 November 2010 Available online 16 November 2010 Keywords: Food metabolomics Wine Liquid chromatography–quadrupole-time- of-flight mass spectrometry Multivariate data analysis abstract In this study, the potential of high performance liquid chromatography coupled to quadrupole time-of- flight mass spectrometry (HPLC–QTOFMS) for metabolomic profiling of red wine samples was examined. Fifty one wines representing three varieties (Cabernet Sauvignon, Merlot, and Pinot Noir) of various geographical origins were sourced from the European and US retail market. To find compounds detected in analyzed samples, an automated compound (feature) extraction algorithm was employed for processing background subtracted single MS data. Stepwise reduction of the data dimensionality was followed by principal component analysis (PCA) and partial least square-discriminant analysis (PLS-DA) which were employed to explore the structure of the data and construct classification models. The validated PLS-DA model based on data recorded in positive ionization mode enabled correct classification of 96% of samples. Determination of molecular formula and tentative identification of marker compound was carried out using accurate mass measurement of full single MS spectra. Additional information was obtained by correlating the fragments obtained by MS/MS accurate mass spectra using the QTOF with collision induced dissociation (CID) of precursor ions. © 2010 Elsevier B.V. All rights reserved. 1. Introduction Wine is a widely consumed beverage throughout the world and as such undoubtedly represents an important food commodity of relatively high commercial value. Therefore, wine authenticity con- trol, mainly in terms of varieties, geographical origin and/or age, is continuously required to detect any adulteration and to maintain wine quality [1]. Wine is a complex matrix and its major com- ponents are water, alcohol and sugars; additionally it contains a wide range of minor organic and inorganic constituents. The con- centration levels of these compounds are significantly influenced by many factors including grape variety, climate, wine-growing area, and, last but not least, the winemaking process. Numerous studies have been published on this topic describing the applica- tions of instrumental techniques for the analysis of various groups of compounds, which, after statistical treatment of the obtained data, enable wine authenticity assessment. Gas chromatography coupled to mass spectrometry (GC–MS) is a frequently employed tool for profiling of volatile compounds [2–4], which are either isolated from the liquid sample or extracted by means of solid- ∗ Corresponding author. Tel.: +420 220 443 185; fax: +420 220 443 184. E-mail address: [email protected] (J. Hajslova). phase microextraction (SPME) from the heads-space. Alternatively, mass spectrometry-based electronic nose (MS e-nose) [5] and head-space mass spectrometry (HS-MS) [6] can be used to rapidly obtain characteristic volatile patterns of examined wines. High performance liquid chromatography (HPLC) with various types of detection, including mass spectrometry, is usually used for analysis of rather polar compounds, such as amino acids and phenolic com- pounds [7–9]. Analyses of multiple elements, results of which are usable for wine geographic origin determination, are performed by means of atomic absorption spectrometry (AAS) [10,11] or induc- tively coupled plasma-mass spectrometry (ICP-MS) [12]. In the few past years, the emerging field of metabolomics has become an important strategy in many research areas such as dis- eases diagnostics [13], drug discovery [14], human nutrition [15], and also, as recently reviewed [16], in the food science, where it was used for informative, discriminative, and for predictive pur- poses associated with food quality and safety. Metabolomic based studies aim at the comprehensive analysis of numerous targeted or non-targeted metabolites (low molecular compounds, with molec- ular weight typically below 1000 Da) in a biological sample. As the respective metabolites significantly differ in both physico-chemical properties and abundance, these types of analyses represent a dif- ficult task, which require sophisticated analytical technologies. The techniques most widely used in metabolomics employ HPLC–MS, 0003-2670/$ – see front matter © 2010 Elsevier B.V. All rights reserved. doi:10.1016/j.aca.2010.11.018
-
Upload
independent -
Category
Documents
-
view
0 -
download
0
Transcript of The use of high performance liquid chromatography–quadrupole time-of-flight mass spectrometry...

Tmd
La
b
a
ARRAA
KFWLosM
1
artcwpwcbastodcti
0d
Analytica Chimica Acta 685 (2011) 45–51
Contents lists available at ScienceDirect
Analytica Chimica Acta
journa l homepage: www.e lsev ier .com/ locate /aca
he use of high performance liquid chromatography–quadrupole time-of-flightass spectrometry coupled to advanced data mining and chemometric tools for
iscrimination and classification of red wines according to their variety
ukas Vaclavika, Ondrej Lacinaa, Jana Hajslovaa,∗, Jerry Zweigenbaumb
Institute of Chemical Technology Prague, Faculty of Food and Biochemical Technology, Department of Food Chemistry and Analysis, Technicka 5, 16628 Prague 6, Czech RepublicAgilent Technologies, 2850 Centerville Road, Wilmington, DE 19808, USA
r t i c l e i n f o
rticle history:eceived 22 June 2010eceived in revised form 7 November 2010ccepted 9 November 2010vailable online 16 November 2010
eywords:
a b s t r a c t
In this study, the potential of high performance liquid chromatography coupled to quadrupole time-of-flight mass spectrometry (HPLC–QTOFMS) for metabolomic profiling of red wine samples was examined.Fifty one wines representing three varieties (Cabernet Sauvignon, Merlot, and Pinot Noir) of variousgeographical origins were sourced from the European and US retail market. To find compounds detected inanalyzed samples, an automated compound (feature) extraction algorithm was employed for processingbackground subtracted single MS data. Stepwise reduction of the data dimensionality was followed by
ood metabolomicsine
iquid chromatography–quadrupole-time-f-flight masspectrometryultivariate data analysis
principal component analysis (PCA) and partial least square-discriminant analysis (PLS-DA) which wereemployed to explore the structure of the data and construct classification models. The validated PLS-DAmodel based on data recorded in positive ionization mode enabled correct classification of 96% of samples.Determination of molecular formula and tentative identification of marker compound was carried outusing accurate mass measurement of full single MS spectra. Additional information was obtained bycorrelating the fragments obtained by MS/MS accurate mass spectra using the QTOF with collision induced
ursor
dissociation (CID) of prec. Introduction
Wine is a widely consumed beverage throughout the world ands such undoubtedly represents an important food commodity ofelatively high commercial value. Therefore, wine authenticity con-rol, mainly in terms of varieties, geographical origin and/or age, isontinuously required to detect any adulteration and to maintainine quality [1]. Wine is a complex matrix and its major com-onents are water, alcohol and sugars; additionally it contains aide range of minor organic and inorganic constituents. The con-
entration levels of these compounds are significantly influencedy many factors including grape variety, climate, wine-growingrea, and, last but not least, the winemaking process. Numeroustudies have been published on this topic describing the applica-ions of instrumental techniques for the analysis of various groupsf compounds, which, after statistical treatment of the obtained
ata, enable wine authenticity assessment. Gas chromatographyoupled to mass spectrometry (GC–MS) is a frequently employedool for profiling of volatile compounds [2–4], which are eithersolated from the liquid sample or extracted by means of solid-∗ Corresponding author. Tel.: +420 220 443 185; fax: +420 220 443 184.E-mail address: [email protected] (J. Hajslova).
003-2670/$ – see front matter © 2010 Elsevier B.V. All rights reserved.oi:10.1016/j.aca.2010.11.018
ions.© 2010 Elsevier B.V. All rights reserved.
phase microextraction (SPME) from the heads-space. Alternatively,mass spectrometry-based electronic nose (MS e-nose) [5] andhead-space mass spectrometry (HS-MS) [6] can be used to rapidlyobtain characteristic volatile patterns of examined wines. Highperformance liquid chromatography (HPLC) with various types ofdetection, including mass spectrometry, is usually used for analysisof rather polar compounds, such as amino acids and phenolic com-pounds [7–9]. Analyses of multiple elements, results of which areusable for wine geographic origin determination, are performed bymeans of atomic absorption spectrometry (AAS) [10,11] or induc-tively coupled plasma-mass spectrometry (ICP-MS) [12].
In the few past years, the emerging field of metabolomics hasbecome an important strategy in many research areas such as dis-eases diagnostics [13], drug discovery [14], human nutrition [15],and also, as recently reviewed [16], in the food science, where itwas used for informative, discriminative, and for predictive pur-poses associated with food quality and safety. Metabolomic basedstudies aim at the comprehensive analysis of numerous targeted ornon-targeted metabolites (low molecular compounds, with molec-
ular weight typically below 1000 Da) in a biological sample. As therespective metabolites significantly differ in both physico-chemicalproperties and abundance, these types of analyses represent a dif-ficult task, which require sophisticated analytical technologies. Thetechniques most widely used in metabolomics employ HPLC–MS,
4 Chim
Gncwrumopeplnnp
r(awvmttsi
2
2
abAasfa
2
McSBMtaado
2
Sdt6J
b(S
6 L. Vaclavik et al. / Analytica
C–MS, capillary electrophoresis–mass spectrometry (CE–MS) anduclear magnetic resonance (NMR) [17]. For processing of largehromatographic and/or spectral data sets typically generatedithin metabolomic analyses, effective software tools capable of
apid data mining procedures and aligning algorithms have to besed [18–20]. To maximally utilize information present in obtainedultivariate records, advanced chemometric tools for reduction
f data dimensionality are often employed. While principal com-onent analysis (PCA) represents one of the common approachesmployed for initial exploration of data internal structure and sam-le clustering, supervised pattern recognition methods, such as
inear discriminant analysis (LDA), partial least squares discrimi-ant analysis (PLS-DA), support vector machine (SVM) or artificialeural networks (ANNs) enable construction of classification andrediction models [21].
In the current study, high performance liquid chromatog-aphy coupled to quadrupole time-of-flight mass spectrometryHPLC–QTOFMS) has been used for non-targeted metabolomicnalysis of red wine. A commercially available software packageas employed for automatic data processing (extraction of input
ariables, alignment of retention times/mass-to-charge ratios) andultivariate statistical analysis (PCA, PLS-DA) to obtain a predic-
ive model for classification of examined wine samples accordingo their variety. Additionally, the potential of accurate tandem masspectra (MS/MS) for elemental formulae estimation and tentativedentification of marker compounds has been explored.
. Experimental
.1. Chemicals
HPLC grade methanol was purchased from Honeywell Burdicknd Jackson (Muskegon, MI, USA), deionized water was producedy a Milli-Q purification system (Millipore, Bedford, MA, USA).mmonium formate, ammonium acetate, acetic acid, and formiccid, used as mobile phase additives (each of purity ≥ 99%), wereupplied GFS Chemicals (Powell, OH, USA) using doubly distilledormic acid, acidic acid and ammonium hydroxide at the appropri-te concentrations.
.2. Samples
In total 45 red wine samples of Cabernet Sauvignon (CS, n = 15),erlot (ME, n = 16), and Pinot Noir (PN, n = 14) varieties were pur-
hased from reliable sources at Czech and U.S. retail markets.amples represented wines of various geographic origin (Australia,ulgaria, Czech Republic, France, Germany, Hungary, Chile, Italy,akedonia, Slovakia, Spain and USA), and vintage (2004–2008);
hus a very variable sample set was obtained. Wines were uncorkednd an aliquot of sample was transferred into a 2-mL autosamplermber vial (filled to its capacity). Samples were stored in dark andry at 2 ◦C, until HPLC–QTOFMS measurements. The in-batch orderf all samples analyzed in this study was random.
.3. HPLC–QTOFMS
The HPLC–QTOFMS instrument used in this study was an Agilenteries 1200 SL rapid resolution LC system (consisting of vacuumegasser, cooled autosampler, rapid resolution binary pump, andhermostatted column compartment) hyphenated to an Agilent530 accurate-mass QTOFMS with electrospray ionization (ESI) via
et Stream Technology (Agilent Technologies, Santa Clara, CA, USA).Chromatographic separation was performed using a Zor-ax Eclipse Plus reversed phase C18 analytical column100 mm × 2.1 mm i.d., 1.8 �m particle size (Agilent Technologies,anta Clara, CA, USA) kept at a temperature of 40 ◦C. The injected
ica Acta 685 (2011) 45–51
sample volume was 2 �L in positive and 5 �L in negative ionizationmode, respectively. The aqueous constituent of the mobile phase(eluent A) differed depending on ionization polarity setting; 5 mMammonium formate (pH = 3.8) and 5 mM ammonium acetate(pH = 4.5) were used in positive and negative modes, respectively.The organic modifier of the mobile phase was methanol (eluentB). The following gradient elution was carried out: eluent B 5–65%from 0 to 13 min; eluent B 65–100% from 13 to 16 min; eluent B100% from 16 to 20 min; eluent B 5% from 20 to 24 min (columnequilibration). A flow rate of 0.3 mL min−1 was used for elution,but during column equilibration it was increased to 0.5 mL min−1.
The mass spectrometer was operated either in positive ornegative mode, parameter settings used for the measurementwere as follows: capillary voltage: 4.5 kV (positive ion mode) and3.0 kV (negative ion mode); nebulizer pressure: 40 psi; dryinggas: 11 L min−1; gas temperature: 300 ◦C; skimmer voltage: 65 V;octapole DC1: 47 V; octapole RF: 250 V; dielectric capillary exit(fragmentor voltage): 125 V. The instrument was calibrated andtuned according to procedures recommended by the manufacturer.Accurate mass spectra were acquired in the m/z range 100–1100 atan acquisition rate of 1.4 spectra s−1. The instrument gave typicalresolution 12,000 FWHM (full width at half maximum) at m/z 200.To assure the desired mass accuracy of recorded ions, continuousinternal calibration was performed during analyses with the useof signals at m/z 121.0509 (protonated purine) and m/z 922.0098[protonated hexakis(1H, 1H, 3H-tetrafluoropropoxy)phosphazineor HP-921] in positive ion mode; in negative ion mode ions withm/z 119.0362 (proton abstracted purine) and m/z 980.0164 (acetateadduct of HP-921) were used. For this purpose, the reference solu-tion was introduced into the ESI source via a T-junction using anAgilent Series 1200 isocratic pump (Agilent Technologies, SantaClara, CA, USA) set at a flow rate of 20 �L min−1.
During experiments employing in-cell collision induced frag-mentation, MS/MS spectra were recorded simultaneously at a rate1.4 spectra s−1. In order to filter selected precursor ions and theirisotopes for MS/MS, an isolation window of 4.0 amu was set for thequadrupole.
2.4. Data processing and statistical analysis
MassHunter Workstation software (version 3.01 QualitativeAnalysis, Agilent Technologies, Santa Clara, CA, USA) was used forprocessing of both raw HPLC–QTOFMS full single MS and MS/MSdata, i.e. for data mining and for selected marker compounds molec-ular formulae estimation based on fragment pattern, respectively.Within the algorithm employed for full single MS data, ions withidentical elution profiles and related m/z values (representing dif-ferent adducts or isotopes of the same compound) were extractedas molecular features (MFs) characterized by retention time (RT),intensity in apex of chromatographic peak, and accurate mass. Vari-ous intensity threshold settings ranging from 5000 to 15,000 countsper second (cps) were tested for the MFs extraction in the RT rangefrom 1 to 24 min. To perform subtraction of MFs from the back-ground, such as plasticizers and other contaminating compounds,analysis of blank sample (deionized water) was carried out underidentical instrument settings and background MFs were removed.Using background subtracted data; files in compound exchangeformat (.cef files) were created for each sample and exported intothe Mass Profiler Professional (MPP) software package (version 2.0,Agilent Technologies, Santa Clara, CA, USA) for further process-ing. In the next step, alignment of RT and m/z values was carried
out across the sample set using a tolerance window of 0.3 minand 20 mDa, respectively. Stepwise reduction of MFs number wasperformed based on frequency of occurrence, abundance of therespective MFs in classes (varieties) and results of one-way analysisof variance (ANOVA). MPP software also enabled PCA and PLS-DA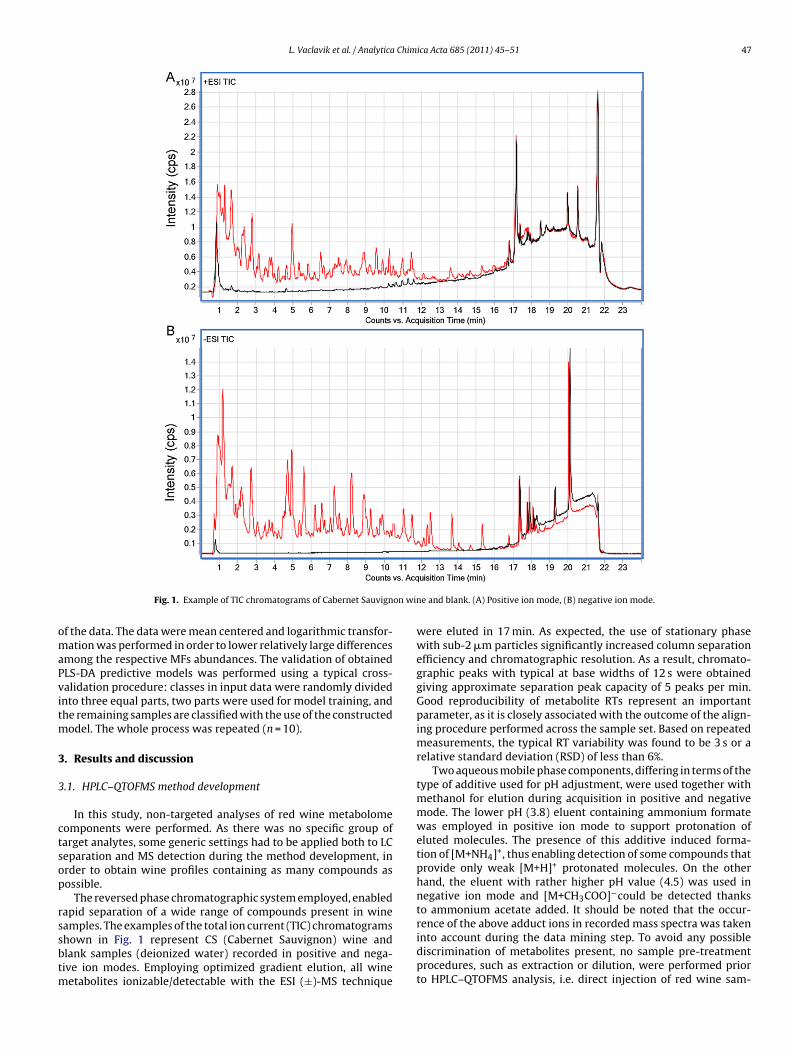
L. Vaclavik et al. / Analytica Chimica Acta 685 (2011) 45–51 47
on win
omaPvitm
3
3
ctsop
rssbtm
Fig. 1. Example of TIC chromatograms of Cabernet Sauvign
f the data. The data were mean centered and logarithmic transfor-ation was performed in order to lower relatively large differences
mong the respective MFs abundances. The validation of obtainedLS-DA predictive models was performed using a typical cross-alidation procedure: classes in input data were randomly dividednto three equal parts, two parts were used for model training, andhe remaining samples are classified with the use of the constructed
odel. The whole process was repeated (n = 10).
. Results and discussion
.1. HPLC–QTOFMS method development
In this study, non-targeted analyses of red wine metabolomeomponents were performed. As there was no specific group ofarget analytes, some generic settings had to be applied both to LCeparation and MS detection during the method development, inrder to obtain wine profiles containing as many compounds asossible.
The reversed phase chromatographic system employed, enabledapid separation of a wide range of compounds present in wine
amples. The examples of the total ion current (TIC) chromatogramshown in Fig. 1 represent CS (Cabernet Sauvignon) wine andlank samples (deionized water) recorded in positive and nega-ive ion modes. Employing optimized gradient elution, all wineetabolites ionizable/detectable with the ESI (±)-MS technique
e and blank. (A) Positive ion mode, (B) negative ion mode.
were eluted in 17 min. As expected, the use of stationary phasewith sub-2 �m particles significantly increased column separationefficiency and chromatographic resolution. As a result, chromato-graphic peaks with typical at base widths of 12 s were obtainedgiving approximate separation peak capacity of 5 peaks per min.Good reproducibility of metabolite RTs represent an importantparameter, as it is closely associated with the outcome of the align-ing procedure performed across the sample set. Based on repeatedmeasurements, the typical RT variability was found to be 3 s or arelative standard deviation (RSD) of less than 6%.
Two aqueous mobile phase components, differing in terms of thetype of additive used for pH adjustment, were used together withmethanol for elution during acquisition in positive and negativemode. The lower pH (3.8) eluent containing ammonium formatewas employed in positive ion mode to support protonation ofeluted molecules. The presence of this additive induced forma-tion of [M+NH4]+, thus enabling detection of some compounds thatprovide only weak [M+H]+ protonated molecules. On the otherhand, the eluent with rather higher pH value (4.5) was used innegative ion mode and [M+CH3COO]−could be detected thanksto ammonium acetate added. It should be noted that the occur-
rence of the above adduct ions in recorded mass spectra was takeninto account during the data mining step. To avoid any possiblediscrimination of metabolites present, no sample pre-treatmentprocedures, such as extraction or dilution, were performed priorto HPLC–QTOFMS analysis, i.e. direct injection of red wine sam-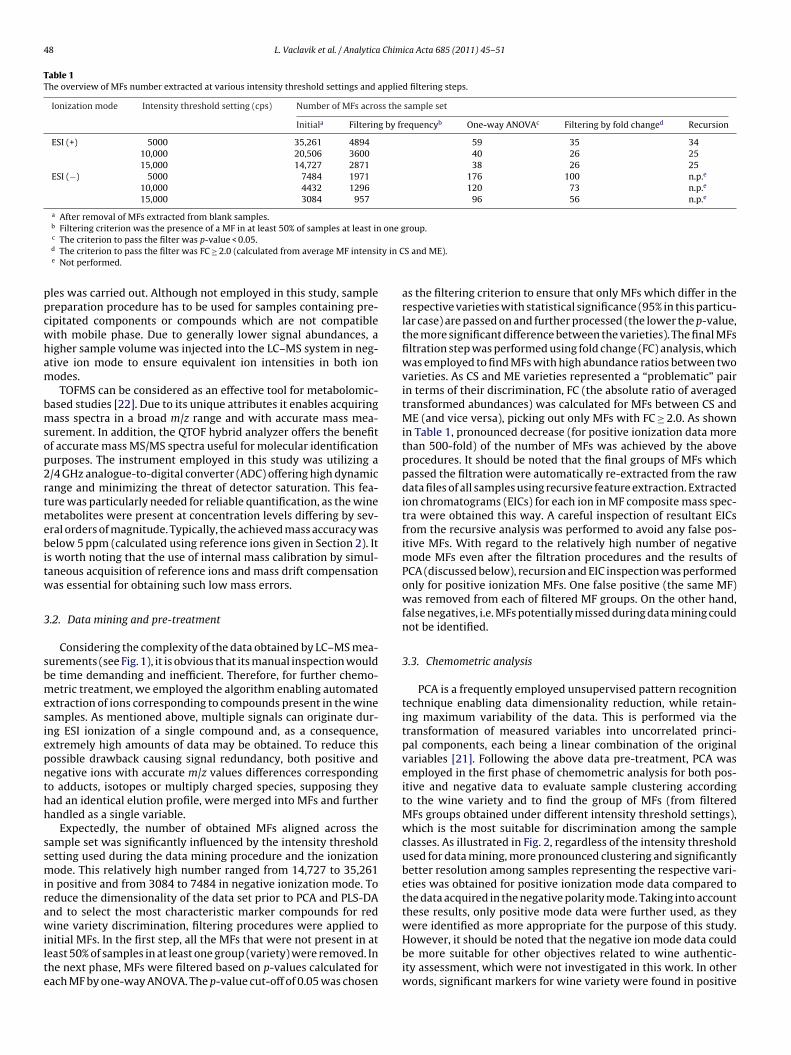
48 L. Vaclavik et al. / Analytica Chimica Acta 685 (2011) 45–51
Table 1The overview of MFs number extracted at various intensity threshold settings and applied filtering steps.
Ionization mode Intensity threshold setting (cps) Number of MFs across the sample set
Initiala Filtering by frequencyb One-way ANOVAc Filtering by fold changed Recursion
ESI (+) 5000 35,261 4894 59 35 3410,000 20,506 3600 40 26 2515,000 14,727 2871 38 26 25
ESI (−) 5000 7484 1971 176 100 n.p.e
10,000 4432 1296 120 73 n.p.e
15,000 3084 957 96 56 n.p.e
a After removal of MFs extracted from blank samples.one g
ty in C
ppcwham
bmsop2rtmebitw
3
sbmesiepnthh
ssmirawilte
b Filtering criterion was the presence of a MF in at least 50% of samples at least inc The criterion to pass the filter was p-value < 0.05.d The criterion to pass the filter was FC ≥ 2.0 (calculated from average MF intensie Not performed.
les was carried out. Although not employed in this study, samplereparation procedure has to be used for samples containing pre-ipitated components or compounds which are not compatibleith mobile phase. Due to generally lower signal abundances, aigher sample volume was injected into the LC–MS system in neg-tive ion mode to ensure equivalent ion intensities in both ionodes.TOFMS can be considered as an effective tool for metabolomic-
ased studies [22]. Due to its unique attributes it enables acquiringass spectra in a broad m/z range and with accurate mass mea-
urement. In addition, the QTOF hybrid analyzer offers the benefitf accurate mass MS/MS spectra useful for molecular identificationurposes. The instrument employed in this study was utilizing a/4 GHz analogue-to-digital converter (ADC) offering high dynamicange and minimizing the threat of detector saturation. This fea-ure was particularly needed for reliable quantification, as the wine
etabolites were present at concentration levels differing by sev-ral orders of magnitude. Typically, the achieved mass accuracy waselow 5 ppm (calculated using reference ions given in Section 2). It
s worth noting that the use of internal mass calibration by simul-aneous acquisition of reference ions and mass drift compensationas essential for obtaining such low mass errors.
.2. Data mining and pre-treatment
Considering the complexity of the data obtained by LC–MS mea-urements (see Fig. 1), it is obvious that its manual inspection woulde time demanding and inefficient. Therefore, for further chemo-etric treatment, we employed the algorithm enabling automated
xtraction of ions corresponding to compounds present in the wineamples. As mentioned above, multiple signals can originate dur-ng ESI ionization of a single compound and, as a consequence,xtremely high amounts of data may be obtained. To reduce thisossible drawback causing signal redundancy, both positive andegative ions with accurate m/z values differences correspondingo adducts, isotopes or multiply charged species, supposing theyad an identical elution profile, were merged into MFs and furtherandled as a single variable.
Expectedly, the number of obtained MFs aligned across theample set was significantly influenced by the intensity thresholdetting used during the data mining procedure and the ionizationode. This relatively high number ranged from 14,727 to 35,261
n positive and from 3084 to 7484 in negative ionization mode. Toeduce the dimensionality of the data set prior to PCA and PLS-DAnd to select the most characteristic marker compounds for red
ine variety discrimination, filtering procedures were applied tonitial MFs. In the first step, all the MFs that were not present in ateast 50% of samples in at least one group (variety) were removed. Inhe next phase, MFs were filtered based on p-values calculated forach MF by one-way ANOVA. The p-value cut-off of 0.05 was chosen
roup.
S and ME).
as the filtering criterion to ensure that only MFs which differ in therespective varieties with statistical significance (95% in this particu-lar case) are passed on and further processed (the lower the p-value,the more significant difference between the varieties). The final MFsfiltration step was performed using fold change (FC) analysis, whichwas employed to find MFs with high abundance ratios between twovarieties. As CS and ME varieties represented a “problematic” pairin terms of their discrimination, FC (the absolute ratio of averagedtransformed abundances) was calculated for MFs between CS andME (and vice versa), picking out only MFs with FC ≥ 2.0. As shownin Table 1, pronounced decrease (for positive ionization data morethan 500-fold) of the number of MFs was achieved by the aboveprocedures. It should be noted that the final groups of MFs whichpassed the filtration were automatically re-extracted from the rawdata files of all samples using recursive feature extraction. Extractedion chromatograms (EICs) for each ion in MF composite mass spec-tra were obtained this way. A careful inspection of resultant EICsfrom the recursive analysis was performed to avoid any false pos-itive MFs. With regard to the relatively high number of negativemode MFs even after the filtration procedures and the results ofPCA (discussed below), recursion and EIC inspection was performedonly for positive ionization MFs. One false positive (the same MF)was removed from each of filtered MF groups. On the other hand,false negatives, i.e. MFs potentially missed during data mining couldnot be identified.
3.3. Chemometric analysis
PCA is a frequently employed unsupervised pattern recognitiontechnique enabling data dimensionality reduction, while retain-ing maximum variability of the data. This is performed via thetransformation of measured variables into uncorrelated princi-pal components, each being a linear combination of the originalvariables [21]. Following the above data pre-treatment, PCA wasemployed in the first phase of chemometric analysis for both pos-itive and negative data to evaluate sample clustering accordingto the wine variety and to find the group of MFs (from filteredMFs groups obtained under different intensity threshold settings),which is the most suitable for discrimination among the sampleclasses. As illustrated in Fig. 2, regardless of the intensity thresholdused for data mining, more pronounced clustering and significantlybetter resolution among samples representing the respective vari-eties was obtained for positive ionization mode data compared tothe data acquired in the negative polarity mode. Taking into accountthese results, only positive mode data were further used, as they
were identified as more appropriate for the purpose of this study.However, it should be noted that the negative ion mode data couldbe more suitable for other objectives related to wine authentic-ity assessment, which were not investigated in this work. In otherwords, significant markers for wine variety were found in positive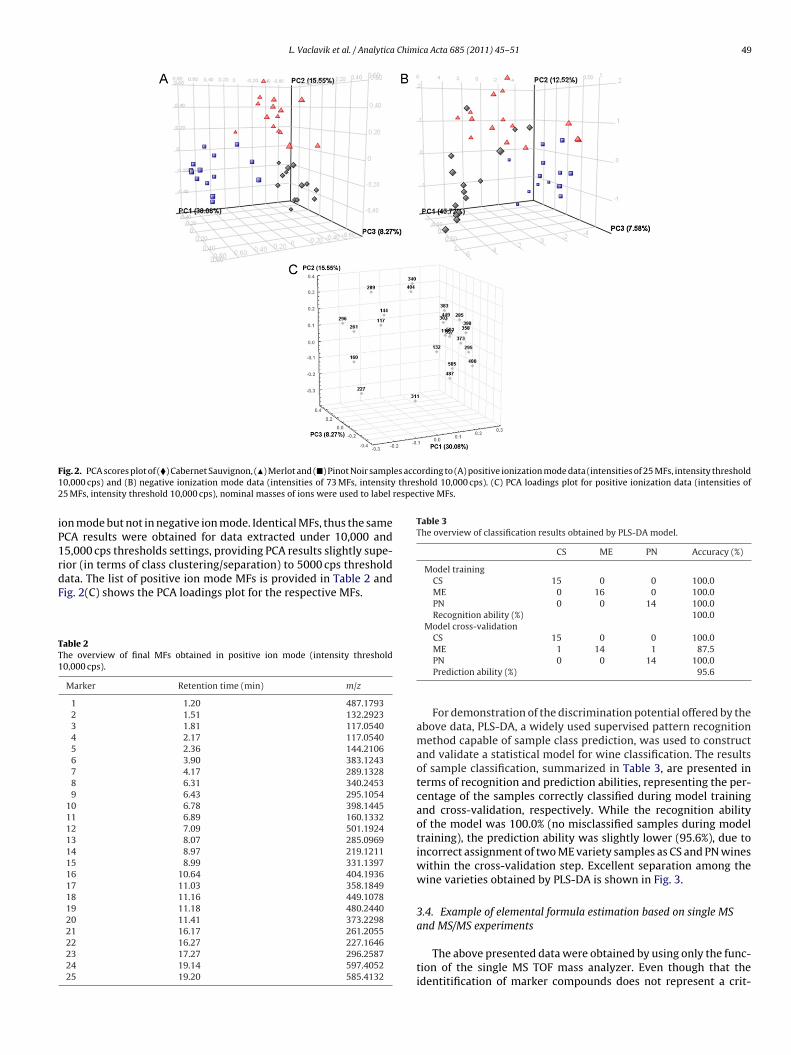
L. Vaclavik et al. / Analytica Chimica Acta 685 (2011) 45–51 49
F es according to (A) positive ionization mode data (intensities of 25 MFs, intensity threshold1 threshold 10,000 cps). (C) PCA loadings plot for positive ionization data (intensities of2 respective MFs.
iP1rdF
TT1
Table 3The overview of classification results obtained by PLS-DA model.
CS ME PN Accuracy (%)
ig. 2. PCA scores plot of (�) Cabernet Sauvignon, (�) Merlot and (�) Pinot Noir sampl0,000 cps) and (B) negative ionization mode data (intensities of 73 MFs, intensity5 MFs, intensity threshold 10,000 cps), nominal masses of ions were used to label
on mode but not in negative ion mode. Identical MFs, thus the sameCA results were obtained for data extracted under 10,000 and5,000 cps thresholds settings, providing PCA results slightly supe-
ior (in terms of class clustering/separation) to 5000 cps thresholdata. The list of positive ion mode MFs is provided in Table 2 andig. 2(C) shows the PCA loadings plot for the respective MFs.able 2he overview of final MFs obtained in positive ion mode (intensity threshold0,000 cps).
Marker Retention time (min) m/z
1 1.20 487.17932 1.51 132.29233 1.81 117.05404 2.17 117.05405 2.36 144.21066 3.90 383.12437 4.17 289.13288 6.31 340.24539 6.43 295.1054
10 6.78 398.144511 6.89 160.133212 7.09 501.192413 8.07 285.096914 8.97 219.121115 8.99 331.139716 10.64 404.193617 11.03 358.184918 11.16 449.107819 11.18 480.244020 11.41 373.229821 16.17 261.205522 16.27 227.164623 17.27 296.258724 19.14 597.405225 19.20 585.4132
Model trainingCS 15 0 0 100.0ME 0 16 0 100.0PN 0 0 14 100.0Recognition ability (%) 100.0
Model cross-validationCS 15 0 0 100.0
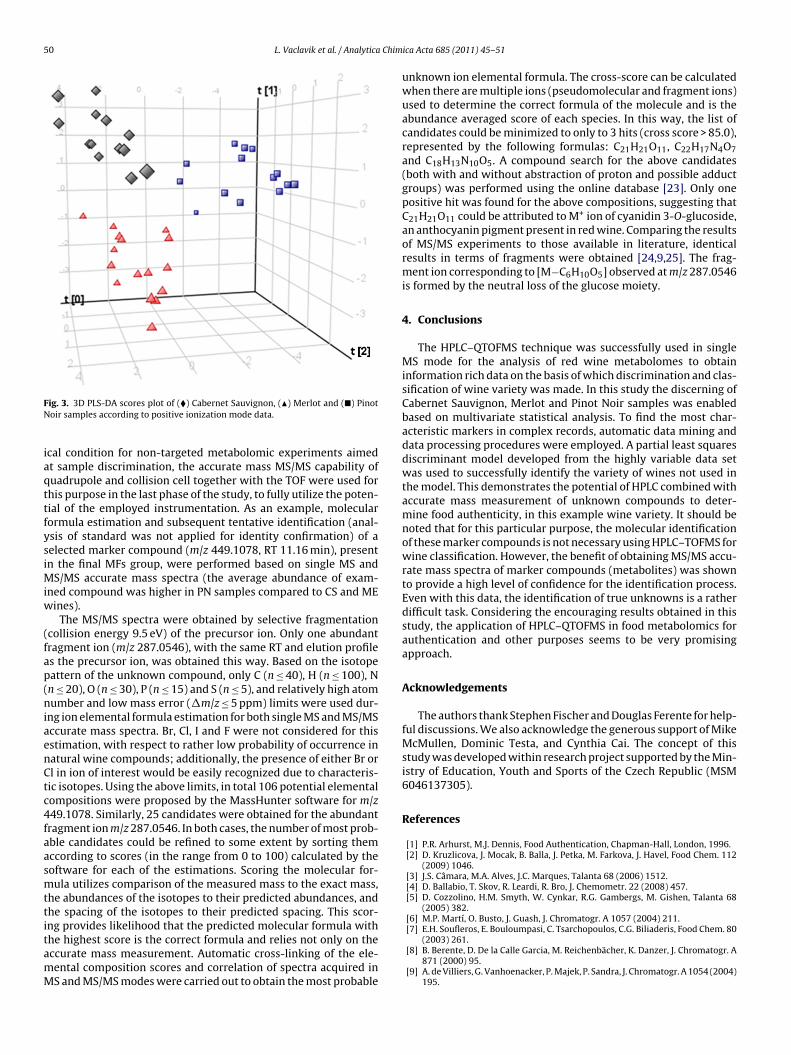
ME 1 14 1 87.5PN 0 0 14 100.0Prediction ability (%) 95.6For demonstration of the discrimination potential offered by theabove data, PLS-DA, a widely used supervised pattern recognitionmethod capable of sample class prediction, was used to constructand validate a statistical model for wine classification. The resultsof sample classification, summarized in Table 3, are presented interms of recognition and prediction abilities, representing the per-centage of the samples correctly classified during model trainingand cross-validation, respectively. While the recognition abilityof the model was 100.0% (no misclassified samples during modeltraining), the prediction ability was slightly lower (95.6%), due toincorrect assignment of two ME variety samples as CS and PN wineswithin the cross-validation step. Excellent separation among thewine varieties obtained by PLS-DA is shown in Fig. 3.
3.4. Example of elemental formula estimation based on single MSand MS/MS experiments
The above presented data were obtained by using only the func-tion of the single MS TOF mass analyzer. Even though that theidentitification of marker compounds does not represent a crit-
50 L. Vaclavik et al. / Analytica Chim
FN
iaqttfysiMiw
(fap(niaenCtc4faasmttitamM
[7] E.H. Soufleros, E. Bouloumpasi, C. Tsarchopoulos, C.G. Biliaderis, Food Chem. 80
ig. 3. 3D PLS-DA scores plot of (�) Cabernet Sauvignon, (�) Merlot and (�) Pinotoir samples according to positive ionization mode data.
cal condition for non-targeted metabolomic experiments aimedt sample discrimination, the accurate mass MS/MS capability ofuadrupole and collision cell together with the TOF were used forhis purpose in the last phase of the study, to fully utilize the poten-ial of the employed instrumentation. As an example, molecularormula estimation and subsequent tentative identification (anal-sis of standard was not applied for identity confirmation) of aelected marker compound (m/z 449.1078, RT 11.16 min), presentn the final MFs group, were performed based on single MS and
S/MS accurate mass spectra (the average abundance of exam-ned compound was higher in PN samples compared to CS and ME
ines).The MS/MS spectra were obtained by selective fragmentation
collision energy 9.5 eV) of the precursor ion. Only one abundantragment ion (m/z 287.0546), with the same RT and elution profiles the precursor ion, was obtained this way. Based on the isotopeattern of the unknown compound, only C (n ≤ 40), H (n ≤ 100), Nn ≤ 20), O (n ≤ 30), P (n ≤ 15) and S (n ≤ 5), and relatively high atomumber and low mass error (�m/z ≤ 5 ppm) limits were used dur-
ng ion elemental formula estimation for both single MS and MS/MSccurate mass spectra. Br, Cl, I and F were not considered for thisstimation, with respect to rather low probability of occurrence inatural wine compounds; additionally, the presence of either Br orl in ion of interest would be easily recognized due to characteris-ic isotopes. Using the above limits, in total 106 potential elementalompositions were proposed by the MassHunter software for m/z49.1078. Similarly, 25 candidates were obtained for the abundantragment ion m/z 287.0546. In both cases, the number of most prob-ble candidates could be refined to some extent by sorting themccording to scores (in the range from 0 to 100) calculated by theoftware for each of the estimations. Scoring the molecular for-ula utilizes comparison of the measured mass to the exact mass,
he abundances of the isotopes to their predicted abundances, andhe spacing of the isotopes to their predicted spacing. This scor-ng provides likelihood that the predicted molecular formula with
he highest score is the correct formula and relies not only on theccurate mass measurement. Automatic cross-linking of the ele-ental composition scores and correlation of spectra acquired inS and MS/MS modes were carried out to obtain the most probableica Acta 685 (2011) 45–51
unknown ion elemental formula. The cross-score can be calculatedwhen there are multiple ions (pseudomolecular and fragment ions)used to determine the correct formula of the molecule and is theabundance averaged score of each species. In this way, the list ofcandidates could be minimized to only to 3 hits (cross score > 85.0),represented by the following formulas: C21H21O11, C22H17N4O7and C18H13N10O5. A compound search for the above candidates(both with and without abstraction of proton and possible adductgroups) was performed using the online database [23]. Only onepositive hit was found for the above compositions, suggesting thatC21H21O11 could be attributed to M+ ion of cyanidin 3-O-glucoside,an anthocyanin pigment present in red wine. Comparing the resultsof MS/MS experiments to those available in literature, identicalresults in terms of fragments were obtained [24,9,25]. The frag-ment ion corresponding to [M−C6H10O5] observed at m/z 287.0546is formed by the neutral loss of the glucose moiety.
4. Conclusions
The HPLC–QTOFMS technique was successfully used in singleMS mode for the analysis of red wine metabolomes to obtaininformation rich data on the basis of which discrimination and clas-sification of wine variety was made. In this study the discerning ofCabernet Sauvignon, Merlot and Pinot Noir samples was enabledbased on multivariate statistical analysis. To find the most char-acteristic markers in complex records, automatic data mining anddata processing procedures were employed. A partial least squaresdiscriminant model developed from the highly variable data setwas used to successfully identify the variety of wines not used inthe model. This demonstrates the potential of HPLC combined withaccurate mass measurement of unknown compounds to deter-mine food authenticity, in this example wine variety. It should benoted that for this particular purpose, the molecular identificationof these marker compounds is not necessary using HPLC–TOFMS forwine classification. However, the benefit of obtaining MS/MS accu-rate mass spectra of marker compounds (metabolites) was shownto provide a high level of confidence for the identification process.Even with this data, the identification of true unknowns is a ratherdifficult task. Considering the encouraging results obtained in thisstudy, the application of HPLC–QTOFMS in food metabolomics forauthentication and other purposes seems to be very promisingapproach.
Acknowledgements
The authors thank Stephen Fischer and Douglas Ferente for help-ful discussions. We also acknowledge the generous support of MikeMcMullen, Dominic Testa, and Cynthia Cai. The concept of thisstudy was developed within research project supported by the Min-istry of Education, Youth and Sports of the Czech Republic (MSM6046137305).
References
[1] P.R. Arhurst, M.J. Dennis, Food Authentication, Chapman-Hall, London, 1996.[2] D. Kruzlicova, J. Mocak, B. Balla, J. Petka, M. Farkova, J. Havel, Food Chem. 112
(2009) 1046.[3] J.S. Câmara, M.A. Alves, J.C. Marques, Talanta 68 (2006) 1512.[4] D. Ballabio, T. Skov, R. Leardi, R. Bro, J. Chemometr. 22 (2008) 457.[5] D. Cozzolino, H.M. Smyth, W. Cynkar, R.G. Gambergs, M. Gishen, Talanta 68
(2005) 382.[6] M.P. Martí, O. Busto, J. Guash, J. Chromatogr. A 1057 (2004) 211.
(2003) 261.[8] B. Berente, D. De la Calle Garcia, M. Reichenbächer, K. Danzer, J. Chromatogr. A
871 (2000) 95.[9] A. de Villiers, G. Vanhoenacker, P. Majek, P. Sandra, J. Chromatogr. A 1054 (2004)
195.

Chim
[
[
[[
[[[
[[
[
[
[
[
L. Vaclavik et al. / Analytica
10] S. Pérez-Magarino, M. Ortega-Heras, M.L. Gonzáles-San José, Z. Boger, Talanta62 (2004) 983.
11] S. Pérez-Magarino, M. Ortega-Heras, M.L. Gonzáles-San José, Anal. Chim. Acta458 (2002) 187.
12] J. Sperkova, M. Suchanek, Food Chem. 93 (2005) 659.13] R. Kaddurah-Daouk, K.R.R. Krishnan, Neuropsychopharmacology 34 (2009)
173.
14] D.S. Wishart, Drugs R&D 9 (2008) 307.15] D.S. Wishart, Trends Food Sci. Technol. 19 (2008) 482.16] J.M. Cevallos-Cevallos, J.I. Reyes-De-Corcuera, E. Etxeberria, M.D. Danyluk, G.E.Rodrick, Trends Food Sci. Technol. 20 (2009) 557.17] W.B. Dunn, D.I. Ellis, Trends Anal. Chem. 24 (2005) 285.18] A.L. Duran, J. Yang, L.J. Wang, W.L. Sumner, Bioinformatics 19 (2003) 2283.
[
[
[
ica Acta 685 (2011) 45–51 51
19] R. Stoyanovaa, A.W. Nicholls, J.K. Nicholson, J.C. Lindon, T.R. Brown, J. Magn.Reson. 170 (2004) 329.
20] R. Goodacre, S. Vaidyanathan, W.B. Dunn, G.G. Harrigan, D.B. Kell, TrendsBiotechnol. 22 (2004) 245.
21] L.A. Berrueta, R.M. Alfonso-Salces, K. Héberger, J. Chromatogr. A 1158 (2007)196.
22] G.X. Xie, Y. Ni, M.M. Su, Y.Y. Zhang, A.H. Zhao, X.F. Gao, Z. Liu, P.G. Xiao, W. Jia,
Metabolomics 4 (2008) 248.23] The PubChem online database, http://pubchem.ncbi.nlm.nih.gov/ via the Inter-net, accessed 24 April 2010.
24] S. Pati, M.T. Liberatore, G. Gambacorta, D. Antonacci, E. La Notte, J. Chromatogr.A 1216 (2009) 3864.
25] H. Wang, E.J. Race, A.J. Shrikhande, J. Agric. Food Chem. 51 (2003) 1839.