High-Performance Liquid Chromatography–Mass ... - MDPI
18
Citation: Popova, I.; Sell, B.; Pillai, S.S.; Kuhl, J.; Dandurand, L.-M. High-Performance Liquid Chromatography–Mass Spectrometry Analysis of Glycoalkaloids from Underexploited Solanum Species and Their Acetylcholinesterase Inhibition Activity. Plants 2022, 11, 269. https://doi.org/10.3390/ plants11030269 Academic Editor: Filippo Maggi Received: 9 December 2021 Accepted: 13 January 2022 Published: 20 January 2022 Publisher’s Note: MDPI stays neutral with regard to jurisdictional claims in published maps and institutional affil- iations. Copyright: © 2022 by the authors. Licensee MDPI, Basel, Switzerland. This article is an open access article distributed under the terms and conditions of the Creative Commons Attribution (CC BY) license (https:// creativecommons.org/licenses/by/ 4.0/). plants Article High-Performance Liquid Chromatography–Mass Spectrometry Analysis of Glycoalkaloids from Underexploited Solanum Species and Their Acetylcholinesterase Inhibition Activity Inna Popova 1, * , Belinda Sell 1 , Syamkumar Sivasankara Pillai 2 , Joseph Kuhl 3 and Louise-Marie Dandurand 2 1 Department of Soil & Water Systems, University of Idaho, 875 Perimeter Drive MS 2340, Moscow, ID 83844-2340, USA; [email protected] 2 Department of Entomology, Plant Pathology & Nematology, University of Idaho, 875 Perimeter Drive MS 2340, Moscow, ID 83844-2329, USA; [email protected] (S.S.P.); [email protected] (L.-M.D.) 3 Department of Plant Sciences, University of Idaho, 875 Perimeter Drive MS 2333, Moscow, ID 83844-2340, USA; [email protected] * Correspondence: [email protected]; Tel.: +1-208-885-4953 Abstract: Solanum glycoalkaloids are gaining increased scientific attention due to their bioactive potential in the defense of plants against pests and pathogens. The comprehensive glycoalkaloid profiling from the leaves, stems, and roots of seven underexploited Solanum species (S. caripense, S. melanocerasum, S. muricatum, S. nigrum, S. quitoense, S. retroflexum, and S. sisymbriifolium) was conducted using high-performance liquid chromatography–time-of-flight mass spectrometry. A total of 51 glycoalkaloids were shared among the studied Solanum species, with concentrations ranging from 7 to 5.63 × 10 5 ng g -1 . Based on the glycoalkaloid composition, plants were separated into two clusters, Cluster 1 (S. melanocerasum, S. nigrum, and S. retroflexum) and Cluster 2 (S. caripense, S. muricatum, S. quitoense, and S. sisymbriifolium). The inhibition activity of glycoalkaloid extracts on acetylcholinesterase showed a half-maximal inhibitory concentration (IC 50 ), ranging from 0.4 (S. nigrum stems) to 344.9 μg mL -1 (S. sisymbriifolium leaves), that was not directly correlated to the total glycoalkaloid contents. This suggests that the composition of glycoalkaloids in the plant extract, rather than the total concentration, is a driver of biological activity. The study provides a framework for the bioprospecting of underexploited Solanum species for exploring bioactive glycoalkaloids and other compounds with potential pesticidal activities for the development of green bioformulation. This is the first comprehensive report on the glycoalkaloid profiles of S. retroflexum. Keywords: glycoalkaloids; Solanum caripense; S. melanocerasum; S. muricatum; S. nigrum; S. quitoense; S. retroflexum; S. sisymbriifolium; HPLC TOF MS; acetylcholinesterase inhibition 1. Introduction The plants of the Solanaceae family contain a class of biologically active compounds called glycoalkaloids, which represent a wide class of chemical compounds composed of a C27 cholestane skeleton, to which a carbohydrate moiety of one to five monosaccharides is attached [1–9]. Due to their pesticidal properties, glycoalkaloids have the potential to function well in the field of plant protection. For example, Solanum sisymbriifolium has been demonstrated to be an efficient trap crop for the control of potato cyst nematodes, making it one of the more promising feedstocks for the production of pesticides [10,11]. Glycoalkaloids are found in more than 350 plant species, and are present in all plant organs with concentrations varying depending on the plant growth stage, environmental conditions, and specific plant species, and they can range from 18 to 10,000 mg kg -1 [12,13]. While a significant effort was made to identify glycoalkaloids in commercial crops, such as tomatoes and potatoes, glycoalkaloid composition is unclear in noncommercial and weedy plants, such as S. sisymbriifolium and S. caripense [14]. Still, these underexploited plants contain many glycoalkaloids that can potentially have desirable pesticidal properties. Plants 2022, 11, 269. https://doi.org/10.3390/plants11030269 https://www.mdpi.com/journal/plants
-
Upload
khangminh22 -
Category
Documents
-
view
0 -
download
0
Transcript of High-Performance Liquid Chromatography–Mass ... - MDPI

�����������������
Citation: Popova, I.; Sell, B.; Pillai,
S.S.; Kuhl, J.; Dandurand, L.-M.
High-Performance Liquid
Chromatography–Mass Spectrometry
Analysis of Glycoalkaloids from
Underexploited Solanum Species and
Their Acetylcholinesterase Inhibition
Activity. Plants 2022, 11, 269.
https://doi.org/10.3390/
plants11030269
Academic Editor: Filippo Maggi
Received: 9 December 2021
Accepted: 13 January 2022
Published: 20 January 2022
Publisher’s Note: MDPI stays neutral
with regard to jurisdictional claims in
published maps and institutional affil-
iations.
Copyright: © 2022 by the authors.
Licensee MDPI, Basel, Switzerland.
This article is an open access article
distributed under the terms and
conditions of the Creative Commons
Attribution (CC BY) license (https://
creativecommons.org/licenses/by/
4.0/).
plants
Article
High-Performance Liquid Chromatography–Mass SpectrometryAnalysis of Glycoalkaloids from Underexploited SolanumSpecies and Their Acetylcholinesterase Inhibition ActivityInna Popova 1,* , Belinda Sell 1, Syamkumar Sivasankara Pillai 2, Joseph Kuhl 3 and Louise-Marie Dandurand 2
1 Department of Soil & Water Systems, University of Idaho, 875 Perimeter Drive MS 2340,Moscow, ID 83844-2340, USA; [email protected]
2 Department of Entomology, Plant Pathology & Nematology, University of Idaho, 875 Perimeter DriveMS 2340, Moscow, ID 83844-2329, USA; [email protected] (S.S.P.); [email protected] (L.-M.D.)
3 Department of Plant Sciences, University of Idaho, 875 Perimeter Drive MS 2333,Moscow, ID 83844-2340, USA; [email protected]
* Correspondence: [email protected]; Tel.: +1-208-885-4953
Abstract: Solanum glycoalkaloids are gaining increased scientific attention due to their bioactivepotential in the defense of plants against pests and pathogens. The comprehensive glycoalkaloidprofiling from the leaves, stems, and roots of seven underexploited Solanum species (S. caripense,S. melanocerasum, S. muricatum, S. nigrum, S. quitoense, S. retroflexum, and S. sisymbriifolium) wasconducted using high-performance liquid chromatography–time-of-flight mass spectrometry. A totalof 51 glycoalkaloids were shared among the studied Solanum species, with concentrations rangingfrom 7 to 5.63 × 10⁵ ng g−1. Based on the glycoalkaloid composition, plants were separated intotwo clusters, Cluster 1 (S. melanocerasum, S. nigrum, and S. retroflexum) and Cluster 2 (S. caripense,S. muricatum, S. quitoense, and S. sisymbriifolium). The inhibition activity of glycoalkaloid extractson acetylcholinesterase showed a half-maximal inhibitory concentration (IC50), ranging from 0.4(S. nigrum stems) to 344.9 µg mL−1 (S. sisymbriifolium leaves), that was not directly correlated to thetotal glycoalkaloid contents. This suggests that the composition of glycoalkaloids in the plant extract,rather than the total concentration, is a driver of biological activity. The study provides a frameworkfor the bioprospecting of underexploited Solanum species for exploring bioactive glycoalkaloids andother compounds with potential pesticidal activities for the development of green bioformulation.This is the first comprehensive report on the glycoalkaloid profiles of S. retroflexum.
Keywords: glycoalkaloids; Solanum caripense; S. melanocerasum; S. muricatum; S. nigrum; S. quitoense;S. retroflexum; S. sisymbriifolium; HPLC TOF MS; acetylcholinesterase inhibition
1. Introduction
The plants of the Solanaceae family contain a class of biologically active compoundscalled glycoalkaloids, which represent a wide class of chemical compounds composed of aC27 cholestane skeleton, to which a carbohydrate moiety of one to five monosaccharidesis attached [1–9]. Due to their pesticidal properties, glycoalkaloids have the potential tofunction well in the field of plant protection. For example, Solanum sisymbriifolium hasbeen demonstrated to be an efficient trap crop for the control of potato cyst nematodes,making it one of the more promising feedstocks for the production of pesticides [10,11].Glycoalkaloids are found in more than 350 plant species, and are present in all plantorgans with concentrations varying depending on the plant growth stage, environmentalconditions, and specific plant species, and they can range from 18 to 10,000 mg kg−1 [12,13].While a significant effort was made to identify glycoalkaloids in commercial crops, such astomatoes and potatoes, glycoalkaloid composition is unclear in noncommercial and weedyplants, such as S. sisymbriifolium and S. caripense [14]. Still, these underexploited plantscontain many glycoalkaloids that can potentially have desirable pesticidal properties.
Plants 2022, 11, 269. https://doi.org/10.3390/plants11030269 https://www.mdpi.com/journal/plants
Plants 2022, 11, 269 2 of 18
With the recent advance in hyphenated analytical techniques, such as high-performanceliquid chromatography–time-of-flight mass spectrometry (HPLC TOF MS), the untargetedanalysis of glycoalkaloids has become possible, and can facilitate the identification of novelor already-described glycoalkaloids in new plant species [15]. However, the data obtainedvia HPLC MS are very complex and contain a large amount of information. In combinationwith the lack of analytical and reference standards, this presents a challenge for identifyingpotential pesticidal candidates; thus, lengthy purification and isolation steps are requiredfor activities screening. One of the approaches in analyzing the large amount of dataproduced through HPLC MS is the use of chemometric tools that can significantly reducethe data set and provide maximum amount of relevant chemical information, such as asubset of critical chemical compounds or a set of molecular features.
The objective of this study was to assess the applicability of a chemometrics analysisof HPLC TOF MS data for singling out chemical compounds or groups of chemical com-pounds with specific biological properties from underexploited Solanum species. HPLCTOF MS data for glycoalkaloid extracts from the roots, stems, and leaves of seven Solanumspecies (S. caripense, S. melanocerasum, S. muricatum, S. nigrum, S. quitoense, S. retroflexum,and S. sisymbriifolium) were analyzed, and their pesticidal potentials were assessed usingthe inhibition of acetylcholinesterase (AChE, EC 3.1.1.7), an enzyme that catalyzes thehydrolysis of the neurotransmitter acetylcholine [4].
2. Results and Discussions2.1. Glycoalkaloids Assignment
Root, leaf, and stem extracts from seven Solanum species were assessed using time-of-flight MS analysis for exact molecular mass assessment, and a characteristic neutral losspattern analysis of typical sugar moieties (pentose, deoxyhexose, and hexose) for glycoal-kaloid assignment [16]. A total of 51 compounds that were assigned as glycoalkaloids wereshared among all Solanum plants and accounted for 97–99% of the peak area in the total ionchromatograms (Table 1). Chromatographic retention times for most of the glycoalkaloidsclustered at around 22–25 min, suggesting that they had closely related chemical structuresand polarities (Figure S1). The majority of the glycoalkaloids were baseline separated by theHPLC elution program; however, several coeluting or overlapping peaks were also present.In this case, mass spectra deconvolution was used to distinguish the mass spectra belongingto different compounds using the Agilent Profiler software package. For example, thespectra of two co-eluting glycoalkaloids at 25.67 min were resolved to obtain the individualfragmentation pattern of compounds 22 (m/z 1105.54) and 23 (m/z 1046.54).
Plants 2022, 11, 269 3 of 18
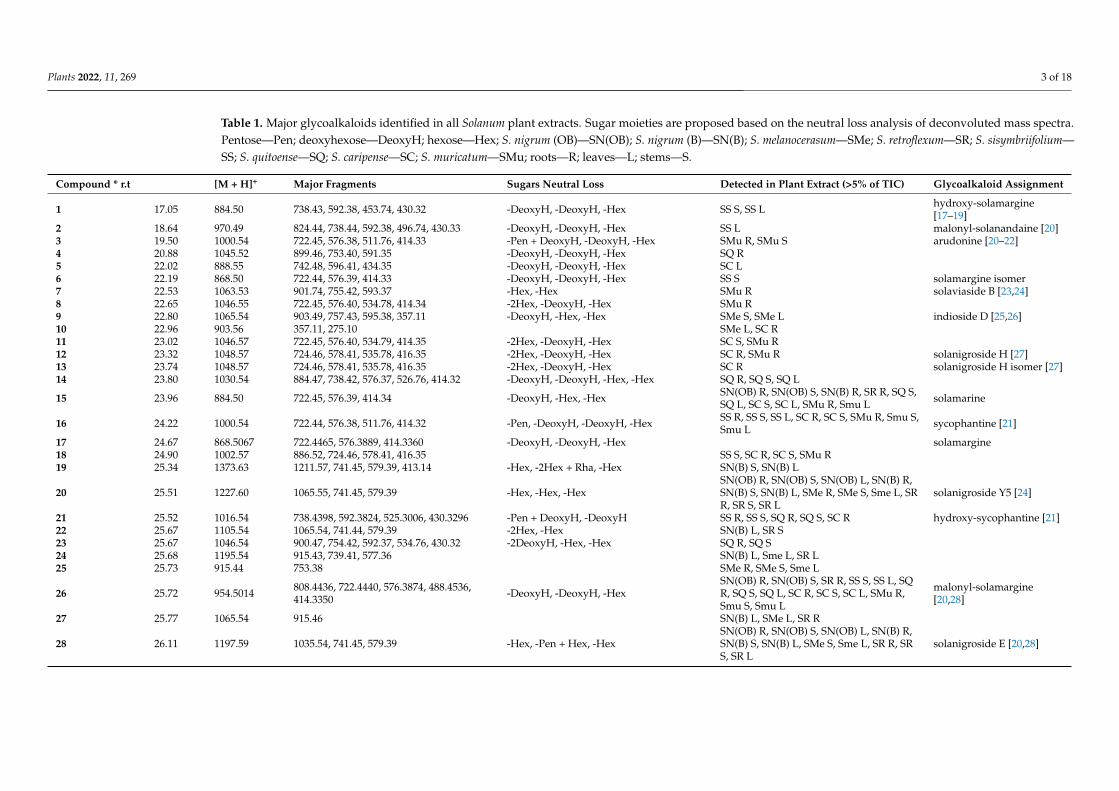
Table 1. Major glycoalkaloids identified in all Solanum plant extracts. Sugar moieties are proposed based on the neutral loss analysis of deconvoluted mass spectra.Pentose—Pen; deoxyhexose—DeoxyH; hexose—Hex; S. nigrum (OB)—SN(OB); S. nigrum (B)—SN(B); S. melanocerasum—SMe; S. retroflexum—SR; S. sisymbriifolium—SS; S. quitoense—SQ; S. caripense—SC; S. muricatum—SMu; roots—R; leaves—L; stems—S.
Compound * r.t [M + H]+ Major Fragments Sugars Neutral Loss Detected in Plant Extract (>5% of TIC) Glycoalkaloid Assignment
1 17.05 884.50 738.43, 592.38, 453.74, 430.32 -DeoxyH, -DeoxyH, -Hex SS S, SS L hydroxy-solamargine[17–19]
2 18.64 970.49 824.44, 738.44, 592.38, 496.74, 430.33 -DeoxyH, -DeoxyH, -Hex SS L malonyl-solanandaine [20]3 19.50 1000.54 722.45, 576.38, 511.76, 414.33 -Pen + DeoxyH, -DeoxyH, -Hex SMu R, SMu S arudonine [20–22]4 20.88 1045.52 899.46, 753.40, 591.35 -DeoxyH, -DeoxyH, -Hex SQ R5 22.02 888.55 742.48, 596.41, 434.35 -DeoxyH, -DeoxyH, -Hex SC L6 22.19 868.50 722.44, 576.39, 414.33 -DeoxyH, -DeoxyH, -Hex SS S solamargine isomer7 22.53 1063.53 901.74, 755.42, 593.37 -Hex, -Hex SMu R solaviaside B [23,24]8 22.65 1046.55 722.45, 576.40, 534.78, 414.34 -2Hex, -DeoxyH, -Hex SMu R9 22.80 1065.54 903.49, 757.43, 595.38, 357.11 -DeoxyH, -Hex, -Hex SMe S, SMe L indioside D [25,26]10 22.96 903.56 357.11, 275.10 SMe L, SC R11 23.02 1046.57 722.45, 576.40, 534.79, 414.35 -2Hex, -DeoxyH, -Hex SC S, SMu R12 23.32 1048.57 724.46, 578.41, 535.78, 416.35 -2Hex, -DeoxyH, -Hex SC R, SMu R solanigroside H [27]13 23.74 1048.57 724.46, 578.41, 535.78, 416.35 -2Hex, -DeoxyH, -Hex SC R solanigroside H isomer [27]14 23.80 1030.54 884.47, 738.42, 576.37, 526.76, 414.32 -DeoxyH, -DeoxyH, -Hex, -Hex SQ R, SQ S, SQ L
15 23.96 884.50 722.45, 576.39, 414.34 -DeoxyH, -Hex, -Hex SN(OB) R, SN(OB) S, SN(B) R, SR R, SQ S,SQ L, SC S, SC L, SMu R, Smu L solamarine
16 24.22 1000.54 722.44, 576.38, 511.76, 414.32 -Pen, -DeoxyH, -DeoxyH, -Hex SS R, SS S, SS L, SC R, SC S, SMu R, Smu S,Smu L sycophantine [21]
17 24.67 868.5067 722.4465, 576.3889, 414.3360 -DeoxyH, -DeoxyH, -Hex solamargine18 24.90 1002.57 886.52, 724.46, 578.41, 416.35 SS S, SC R, SC S, SMu R19 25.34 1373.63 1211.57, 741.45, 579.39, 413.14 -Hex, -2Hex + Rha, -Hex SN(B) S, SN(B) L
20 25.51 1227.60 1065.55, 741.45, 579.39 -Hex, -Hex, -HexSN(OB) R, SN(OB) S, SN(OB) L, SN(B) R,SN(B) S, SN(B) L, SMe R, SMe S, Sme L, SRR, SR S, SR L
solanigroside Y5 [24]
21 25.52 1016.54 738.4398, 592.3824, 525.3006, 430.3296 -Pen + DeoxyH, -DeoxyH SS R, SS S, SQ R, SQ S, SC R hydroxy-sycophantine [21]22 25.67 1105.54 1065.54, 741.44, 579.39 -2Hex, -Hex SN(B) L, SR S23 25.67 1046.54 900.47, 754.42, 592.37, 534.76, 430.32 -2DeoxyH, -Hex, -Hex SQ R, SQ S24 25.68 1195.54 915.43, 739.41, 577.36 SN(B) L, Sme L, SR L25 25.73 915.44 753.38 SMe R, SMe S, Sme L
26 25.72 954.5014 808.4436, 722.4440, 576.3874, 488.4536,414.3350 -DeoxyH, -DeoxyH, -Hex
SN(OB) R, SN(OB) S, SR R, SS S, SS L, SQR, SQ S, SQ L, SC R, SC S, SC L, SMu R,Smu S, Smu L
malonyl-solamargine[20,28]
27 25.77 1065.54 915.46 SN(B) L, SMe L, SR R
28 26.11 1197.59 1035.54, 741.45, 579.39 -Hex, -Pen + Hex, -HexSN(OB) R, SN(OB) S, SN(OB) L, SN(B) R,SN(B) S, SN(B) L, SMe S, Sme L, SR R, SRS, SR L
solanigroside E [20,28]
Plants 2022, 11, 269 4 of 18
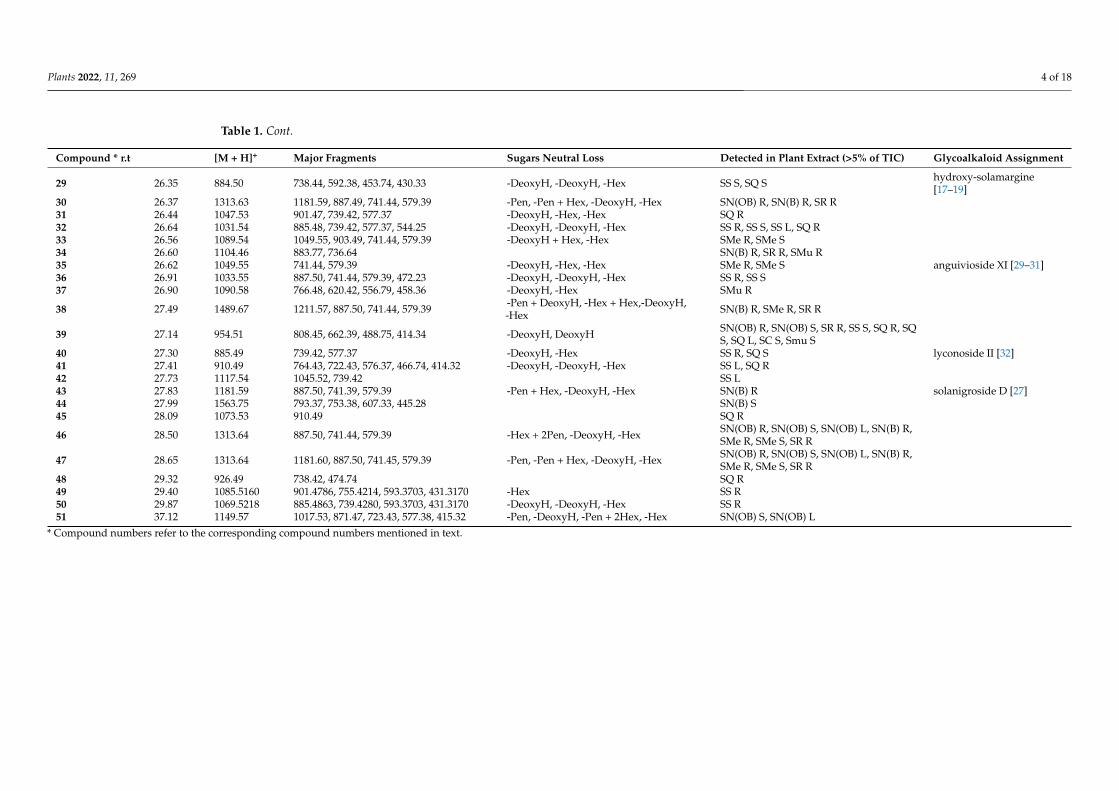
Table 1. Cont.
Compound * r.t [M + H]+ Major Fragments Sugars Neutral Loss Detected in Plant Extract (>5% of TIC) Glycoalkaloid Assignment
29 26.35 884.50 738.44, 592.38, 453.74, 430.33 -DeoxyH, -DeoxyH, -Hex SS S, SQ S hydroxy-solamargine[17–19]
30 26.37 1313.63 1181.59, 887.49, 741.44, 579.39 -Pen, -Pen + Hex, -DeoxyH, -Hex SN(OB) R, SN(B) R, SR R31 26.44 1047.53 901.47, 739.42, 577.37 -DeoxyH, -Hex, -Hex SQ R32 26.64 1031.54 885.48, 739.42, 577.37, 544.25 -DeoxyH, -DeoxyH, -Hex SS R, SS S, SS L, SQ R33 26.56 1089.54 1049.55, 903.49, 741.44, 579.39 -DeoxyH + Hex, -Hex SMe R, SMe S34 26.60 1104.46 883.77, 736.64 SN(B) R, SR R, SMu R35 26.62 1049.55 741.44, 579.39 -DeoxyH, -Hex, -Hex SMe R, SMe S anguivioside XI [29–31]36 26.91 1033.55 887.50, 741.44, 579.39, 472.23 -DeoxyH, -DeoxyH, -Hex SS R, SS S37 26.90 1090.58 766.48, 620.42, 556.79, 458.36 -DeoxyH, -Hex SMu R
38 27.49 1489.67 1211.57, 887.50, 741.44, 579.39 -Pen + DeoxyH, -Hex + Hex,-DeoxyH,-Hex SN(B) R, SMe R, SR R
39 27.14 954.51 808.45, 662.39, 488.75, 414.34 -DeoxyH, DeoxyH SN(OB) R, SN(OB) S, SR R, SS S, SQ R, SQS, SQ L, SC S, Smu S
40 27.30 885.49 739.42, 577.37 -DeoxyH, -Hex SS R, SQ S lyconoside II [32]41 27.41 910.49 764.43, 722.43, 576.37, 466.74, 414.32 -DeoxyH, -DeoxyH, -Hex SS L, SQ R42 27.73 1117.54 1045.52, 739.42 SS L43 27.83 1181.59 887.50, 741.39, 579.39 -Pen + Hex, -DeoxyH, -Hex SN(B) R solanigroside D [27]44 27.99 1563.75 793.37, 753.38, 607.33, 445.28 SN(B) S45 28.09 1073.53 910.49 SQ R
46 28.50 1313.64 887.50, 741.44, 579.39 -Hex + 2Pen, -DeoxyH, -Hex SN(OB) R, SN(OB) S, SN(OB) L, SN(B) R,SMe R, SMe S, SR R
47 28.65 1313.64 1181.60, 887.50, 741.45, 579.39 -Pen, -Pen + Hex, -DeoxyH, -Hex SN(OB) R, SN(OB) S, SN(OB) L, SN(B) R,SMe R, SMe S, SR R
48 29.32 926.49 738.42, 474.74 SQ R49 29.40 1085.5160 901.4786, 755.4214, 593.3703, 431.3170 -Hex SS R50 29.87 1069.5218 885.4863, 739.4280, 593.3703, 431.3170 -DeoxyH, -DeoxyH, -Hex SS R51 37.12 1149.57 1017.53, 871.47, 723.43, 577.38, 415.32 -Pen, -DeoxyH, -Pen + 2Hex, -Hex SN(OB) S, SN(OB) L
* Compound numbers refer to the corresponding compound numbers mentioned in text.
Plants 2022, 11, 269 5 of 18
The molecular weight of the pseudo-molecular ions for the assigned glycoalkaloidsranged from 884.50 to 1563.75 m/z, with the majority of the compounds being in the1000–1100 m/z range. Among the 51 compounds, eight isomeric pairs were identified.Similarities in fragmentation patterns and the relative abundances of fragments for themajority of isomeric pairs suggested that these are stereo rather than structural isomers.The glycoalkaloids 6 and 17 with the molecular ion [M + H]+ 868.50 detected at 22.19 and24.67 min, respectively, is one such example. Similarly, compounds 1 and 15 with themolecular ion [M + H]+ 884.5042 eluting at 17.05 and 26.35 min, respectively, with the samefragmentation pattern and fragment abundance, are likely stereoisomers. The presenceof multiple isomeric pairs is consistent with the previous findings for glycoalkaloidsin plants where multiple isomers are usually reported for the same molecular weightcompounds [33].
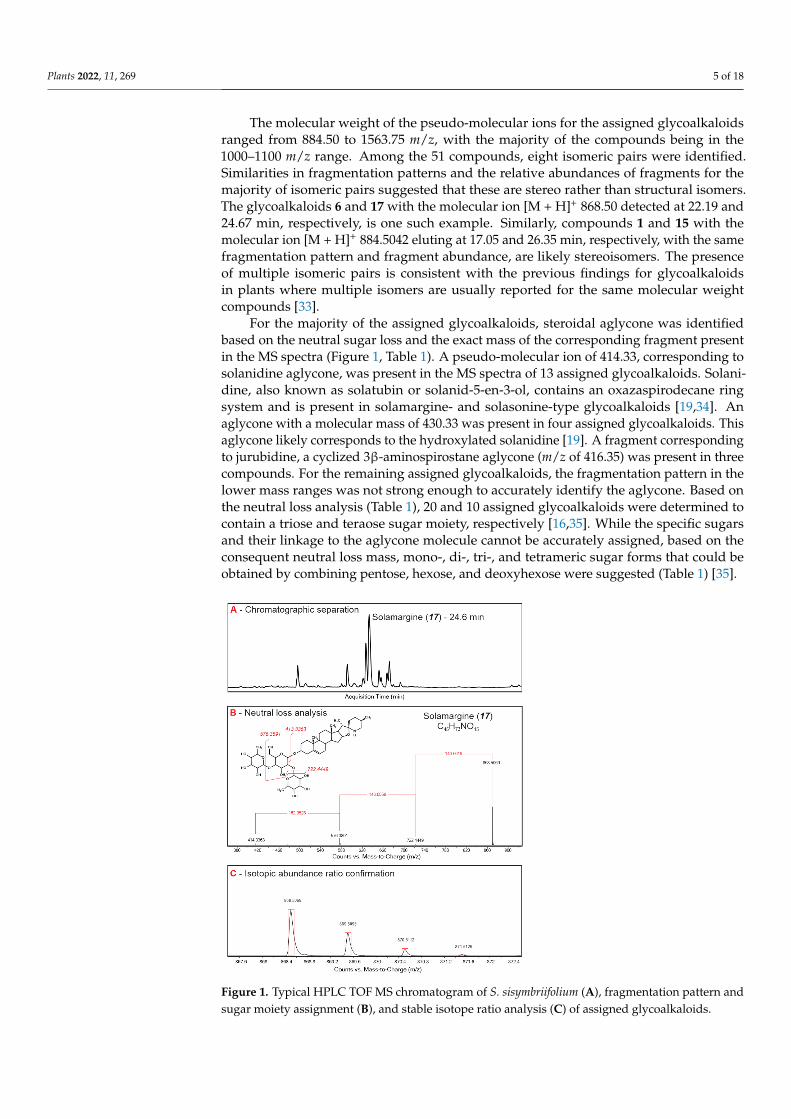
For the majority of the assigned glycoalkaloids, steroidal aglycone was identifiedbased on the neutral sugar loss and the exact mass of the corresponding fragment presentin the MS spectra (Figure 1, Table 1). A pseudo-molecular ion of 414.33, corresponding tosolanidine aglycone, was present in the MS spectra of 13 assigned glycoalkaloids. Solani-dine, also known as solatubin or solanid-5-en-3-ol, contains an oxazaspirodecane ringsystem and is present in solamargine- and solasonine-type glycoalkaloids [19,34]. Anaglycone with a molecular mass of 430.33 was present in four assigned glycoalkaloids. Thisaglycone likely corresponds to the hydroxylated solanidine [19]. A fragment correspondingto jurubidine, a cyclized 3β-aminospirostane aglycone (m/z of 416.35) was present in threecompounds. For the remaining assigned glycoalkaloids, the fragmentation pattern in thelower mass ranges was not strong enough to accurately identify the aglycone. Based onthe neutral loss analysis (Table 1), 20 and 10 assigned glycoalkaloids were determined tocontain a triose and teraose sugar moiety, respectively [16,35]. While the specific sugarsand their linkage to the aglycone molecule cannot be accurately assigned, based on theconsequent neutral loss mass, mono-, di-, tri-, and tetrameric sugar forms that could beobtained by combining pentose, hexose, and deoxyhexose were suggested (Table 1) [35].
Plants 2022, 11, x FOR PEER REVIEW 5 of 18
The molecular weight of the pseudo-molecular ions for the assigned glycoalkaloids ranged from 884.50 to 1563.75 m/z, with the majority of the compounds being in the 1000–1100 m/z range. Among the 51 compounds, eight isomeric pairs were identified. Similari-ties in fragmentation patterns and the relative abundances of fragments for the majority of isomeric pairs suggested that these are stereo rather than structural isomers. The gly-coalkaloids 6 and 17 with the molecular ion [M + H]+ 868.50 detected at 22.19 and 24.67 min, respectively, is one such example. Similarly, compounds 1 and 15 with the molecular ion [M + H]+ 884.5042 eluting at 17.05 and 26.35 min, respectively, with the same fragmen-tation pattern and fragment abundance, are likely stereoisomers. The presence of multiple isomeric pairs is consistent with the previous findings for glycoalkaloids in plants where multiple isomers are usually reported for the same molecular weight compounds [33].
For the majority of the assigned glycoalkaloids, steroidal aglycone was identified based on the neutral sugar loss and the exact mass of the corresponding fragment present in the MS spectra (Figure 1, Table 1). A pseudo-molecular ion of 414.33, corresponding to solanidine aglycone, was present in the MS spectra of 13 assigned glycoalkaloids. Sol-anidine, also known as solatubin or solanid-5-en-3-ol, contains an oxazaspirodecane ring system and is present in solamargine- and solasonine-type glycoalkaloids [19,34]. An aglycone with a molecular mass of 430.33 was present in four assigned glycoalkaloids. This aglycone likely corresponds to the hydroxylated solanidine [19]. A fragment corre-sponding to jurubidine, a cyclized 3β-aminospirostane aglycone (m/z of 416.35) was pre-sent in three compounds. For the remaining assigned glycoalkaloids, the fragmentation pattern in the lower mass ranges was not strong enough to accurately identify the agly-cone. Based on the neutral loss analysis (Table 1), 20 and 10 assigned glycoalkaloids were determined to contain a triose and teraose sugar moiety, respectively [16,35]. While the specific sugars and their linkage to the aglycone molecule cannot be accurately assigned, based on the consequent neutral loss mass, mono-, di-, tri-, and tetrameric sugar forms that could be obtained by combining pentose, hexose, and deoxyhexose were suggested (Table 1) [35].
Figure 1. Typical HPLC TOF MS chromatogram of S. sisymbriifolium (A), fragmentation pattern and sugar moiety assignment (B), and stable isotope ratio analysis (C) of assigned glycoalkaloids.
Figure 1. Typical HPLC TOF MS chromatogram of S. sisymbriifolium (A), fragmentation pattern andsugar moiety assignment (B), and stable isotope ratio analysis (C) of assigned glycoalkaloids.
Plants 2022, 11, 269 6 of 18
The assigned glycoalkaloids were tentatively identified based on reference standards,the comparison of MS spectra with those reported in the literature, accurate mass data, andthe chemical abstracts service database for the occurrence of the specific compounds [36].Compounds 15 and 17 were identified against the analytical standards for solamarine andsolamargine, respectively. Compounds 1 and 29 were identified as isomers of hydroxy-solamargine based on the molecular ion [M + H]+ of 884.50 and the aglycone fragmentof 430.33, which corresponds to hydroxylated solasodine [19]. Hydroxy-solamargine waspreviously reported in the fruits of S. nigrum, as well as in S. melongena, in correlationwith solamargine [17,18]. Compound 2 has been described in S. melongena previously asmalonyl-solanandaine [20]. The high-resolution mass spectra of compound 2 suggests thepresence of an aglycone fragment with an m/z of 430.33 that corresponds to solasodine.Compound 3 can be assigned as arudonine, which was previously detected in S. melongenaand S. arundo [20–22]. Compound 6 is structurally similar to solamargine and is likely itsstereoisomer. Compound 7, solaviaside B (C26H43O11), has been described previously inS. nigrum, as well as S. viarum [23,24]. Compound 9 is structurally similar to indioside D,which has been previously described in S. indicum and S. nigrum [25,26]. Compounds 12and 13 have been reported in S. nigrum and can be assigned as isomers of solanigrosideH [27]. Compound 16 and 21 has been reported in S. sycophanta, and were identified assycophantine and hydroxy-sycophantine, respectively [21]. Compound 20, solanigrosideY5, was previously reported in S. nigrum [24]. Based on the previously reported compositionof S. nigrum and the MS spectra of the detected compounds, compounds 26 and 28 wereassigned as malonyl-solamargine and solanigroside E, respectively [20,28]. Compound 31was described previously in the ripe fruits of S. lycocarpum; however, the structure was notassigned [37]. Compound 35 was described in S. nigrum, S. myriacanthum, and S. anguivias anguivioside XI [29–31]. A compound with the same molecular mass as compound 36was detected in S. nigrum and S. muricatum; however, no mass spectra were provided [38].Compound 40 can be assigned as lyconoside II based on the glycoalkaloid composition ofthe S. lycocarpum fruit [32]. Compound 43 is structurally similar, based on the mass spectra,to solanigroside D, which has been detected in S. nigrum previously [27].
Since the exact glycoalkaloid composition of the analyzed plants is unknown, thetotal number of glycoalkaloids in the plant extracts could be higher. However, this subsetof 51 glycoalkaloids is representative of the major glycoalkaloid constituents in the setof analyzed plants. Extracts of tested Solanum species were dominated by a small subsetof glycoalkaloids (Figure 2, Table S1). Extracts from both shoots and roots containedglycoalkaloids with a similar detection frequency (Figure 2, Table S1). The cumulativeamounts of glycoalkaloids in the shoots were significantly higher than in the roots, asreflected by total the peak areas for S. caripense, S. melanocerasum, S. muricatum, S. nigrum,S. retroflexum, and S. sisymbriifolium. For example, the amounts of glycoalkaloids in theshoots of S. sisymbriifolium and S. muricatum were 24.6- and 12-fold higher than in theroots, respectively. These data are consistent with the previously reported finding thatglycoalkaloid concentrations are the highest in leaves and fruits. Solanum quitoense was theonly species that had 30% higher total glycoalkaloid amounts present in the roots comparedto the shoots. This was likely due to the higher amounts of four major glycoalkaloidcompounds (14, 23, 31, and 32) that were detected in roots.
The major glycoalkaloid compounds detected in S. nigrum were 8, 15, 17, 19, 20, 26,28, 46, and 47 (Table 1 and Table S1). Compounds 20, 28, and 46 were present in allparts of the plant at relatively high amounts. Shoots contained compounds 19 and 20predominantly, while roots were dominated by compound 47. Solanum melanocerasum’smain glycoalkaloids were 20, 24, 25, 28, 32, 36, 38, 42, and 46, with compound 20 present inall plant parts. The roots contained only four major compounds, 20, 25, 38, and 46, while theshoots contained three major compounds, 20, 24, and 28. The major glycoalkaloids detectedin S. retroflexum were 4, 15, 17, 20, 28, 38, and 46. Consistent glycoalkaloid diversity wasobserved throughout the plant, with most of the predominant glycoalkaloids present in all
Plants 2022, 11, 269 7 of 18
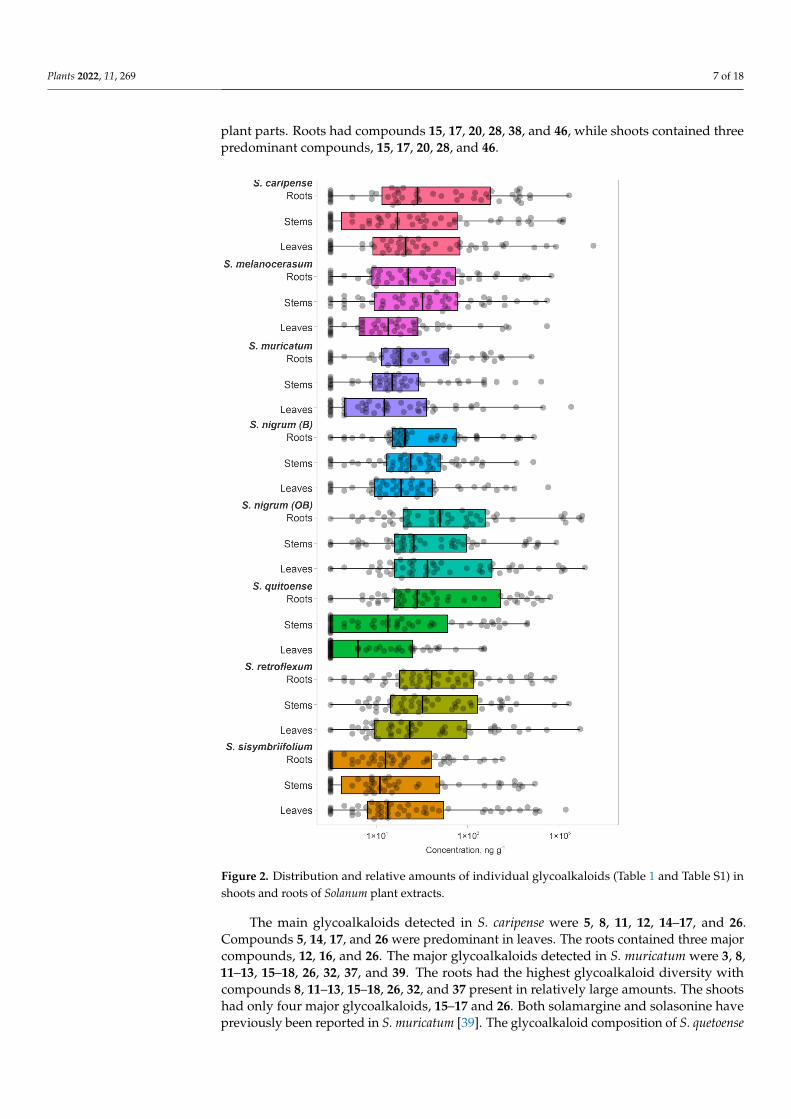
plant parts. Roots had compounds 15, 17, 20, 28, 38, and 46, while shoots contained threepredominant compounds, 15, 17, 20, 28, and 46.
Plants 2022, 11, x FOR PEER REVIEW 7 of 18
plant parts. Roots had compounds 15, 17, 20, 28, 38, and 46, while shoots contained three predominant compounds, 15, 17, 20, 28, and 46.
Figure 2. Distribution and relative amounts of individual glycoalkaloids (Tables 1 and S1) in shoots and roots of Solanum plant extracts.
The main glycoalkaloids detected in S. caripense were 5, 8, 11, 12, 14–17, and 26. Com-pounds 5, 14, 17, and 26 were predominant in leaves. The roots contained three major compounds, 12, 16, and 26. The major glycoalkaloids detected in S. muricatum were 3, 8, 11–13, 15–18, 26, 32, 37, and 39. The roots had the highest glycoalkaloid diversity with compounds 8, 11–13, 15–18, 26, 32, and 37 present in relatively large amounts. The shoots had only four major glycoalkaloids, 15–17 and 26. Both solamargine and solasonine have previously been reported in S. muricatum [39]. The glycoalkaloid composition of S. quetoense was uniform across the detected compounds, with multiple assigned
Figure 2. Distribution and relative amounts of individual glycoalkaloids (Table 1 and Table S1) inshoots and roots of Solanum plant extracts.
The main glycoalkaloids detected in S. caripense were 5, 8, 11, 12, 14–17, and 26.Compounds 5, 14, 17, and 26 were predominant in leaves. The roots contained three majorcompounds, 12, 16, and 26. The major glycoalkaloids detected in S. muricatum were 3, 8,11–13, 15–18, 26, 32, 37, and 39. The roots had the highest glycoalkaloid diversity withcompounds 8, 11–13, 15–18, 26, 32, and 37 present in relatively large amounts. The shootshad only four major glycoalkaloids, 15–17 and 26. Both solamargine and solasonine havepreviously been reported in S. muricatum [39]. The glycoalkaloid composition of S. quetoense

Plants 2022, 11, 269 8 of 18
was uniform across the detected compounds, with multiple assigned glycoalkaloids (4, 14,16, 17, 23, 26, 31, 32, 40, 41, 45, and 48) being in the same level. Unlike other plant species,the roots had the highest diversity of glycoalkaloids, with compounds 14, 16, 17, 23, 32, 41,45, and 48 being present in relatively large amounts. The major glycoalkaloids detected inS. sisymbriifolium were 1, 2, 6, 16, 17, 21, 26, 29, 32, 42, 49, and 50. The roots had four majorcompounds, 16, 32, 49, and 50. The shoots had compounds 1, 2, 16, 17, 26, and 42.
The glycoalkaloid concentrations, quantified based on the solamargine standard,were in the range of 7–5.63×10⁵ ng g−1 (DW basis) (Figure 2). For most of the plants,the median glycoalkaloid concentration was similar for shoots and roots; however, thedistribution of specific glycoalkaloid concentrations differed (Figure 2). For example, theS. sisymbriifolium median for glycoalkaloid concentrations was higher for shoots than forroots. The glycoalkaloid concentration in roots clustered close to the median, while inshoots, an additional cluster in the third quartile was observed. This is consistent withthe lower total glycoalkaloid content for S. sisymbriifolium roots. Most of the S. caripense,S. quitoense, and S. sisymbriifolium glycoalkaloids concentrations were close to the medianand third quartiles (Figure 2). The higher concentrations accounted for 97–98% of the totalglycoalkaloid content, represented by 7–17 individual glycoalkaloids. The median for S.quitoense shoots was lower than for roots due to a large number of glycoalkaloids withlow concentrations resulting in a longer plot. This is also reflected in the skewed data andrelatively low first-quartile value. For the S. quitoense roots, an opposite trend was observed,with the majority of the glycoalkaloids having concentrations above the median value andrelatively evenly distributed third and fourth quartiles.
2.2. Glycoalkaloids Clustering in Solanum Plants
The similarities among the Solanum plants’ shoot and root extracts were assessed viaPCA based on the composition and abundance of individual glycoalkaloids (Figure 3).Total variance (73%) was explained by first three principal components, with PC1, PC2,and PC3 accounting for 32, 26, and 15%, respectively. Based on the PCA loading plot, aseparation of extracts on two clusters was observed: Cluster 1 included S. melanocerasum, S.nigrum, and S. retroflexum, and Cluster 2 included S. caripense, S. muricatum, S. quitoense, andS. sisymbriifolium. For the Cluster 1 plants (S. melanocerasum, S. nigrum, and S. retroflexum),the primary glycoalkaloids present in all plants were 15, 17, 20, 28, and 46. In the Cluster2 plants, three predominant compounds (16, 17, and 26) that belong to solanidine-typeglycoalkaloids were present across all the species [19,34]. The clustering is consistent withthe fact that S. nigrum, S. retroflexum, and S. melanocerasum belong to the Morelloid cladeand have been shown to be genetically related based on morphological and moleculardata [40,41]. Cluster 2 plants do not belong to the same clade. However, S. muricatumhas been shown to be related to wild-species S. caripense, and thus can share a similarglycoalkaloid composition [42]. The basis of its relationship to other Cluster 2 plants is notclear, as S. quitoense belongs to the Lasiocarpa clade and S. sisymbriifolium appears to beclosely related to the Androceras/Crinitum clade [43,44]. While the clustering of Solanumplants based on the composition of their secondary metabolites profiles has been previouslyused for the chemotaxonomy of Solanum plants, to the best of our knowledge, the use ofglycoalkaloids for Solanum biological activity clustering has not been investigated yet forthe selected Solanum species [45].

Plants 2022, 11, 269 9 of 18Plants 2022, 11, x FOR PEER REVIEW 9 of 18
Figure 3. Principal component analysis (PCA) plots for individual glycoalkaloids in the shoots and roots of Solanum plant extracts.
To confirm the observed clustering of Solanum plants based on their glycoalkaloid content, the Pearson’s correlations of the glycoalkaloid distributions in the shoots and roots were analyzed (Table 2). Strong correlation coefficients within the two clusters sig-nify the applicability of glycoalkaloids as a chemical class for relating the species to the Solanum family. Specifically, the correlation coefficients for the Cluster 1 plants (S. mela-nocerasum, S. nigrum, and S. retroflexum) leaf glycoalkaloids ranged from 0.853 *** to 0.994 ***. For the Cluster 2 plants (S. caripense, S. muricatum, S. quitoense, and S. sisymbriifolium), the association amongst the glycoalkaloids in leaves was also strong, with coefficients rang-ing from 0.534 *** to 0.992 ***. Similarly, the association among root glycoalkaloids in the studied Solanum plants was present, though weaker, for the two identified clusters, with correlation coefficients ranging from 0.124 to 0.524 *** for Cluster 1 and from 0.037 to 0.966 *** for Cluster 2. A heat map analysis of the glycoalkaloids contributing to the Solanum spe-cies corroborate the presence of two distinct clusters (Figure 4).
Figure 4. Heat map analysis of assigned glycoalkaloids (Table 1) in the extracts of Solanum Spp, roots, stems, and leaves.
Figure 3. Principal component analysis (PCA) plots for individual glycoalkaloids in the shoots androots of Solanum plant extracts.
To confirm the observed clustering of Solanum plants based on their glycoalkaloidcontent, the Pearson’s correlations of the glycoalkaloid distributions in the shoots and rootswere analyzed (Table 2). Strong correlation coefficients within the two clusters signify theapplicability of glycoalkaloids as a chemical class for relating the species to the Solanumfamily. Specifically, the correlation coefficients for the Cluster 1 plants (S. melanocerasum,S. nigrum, and S. retroflexum) leaf glycoalkaloids ranged from 0.853 *** to 0.994 ***. Forthe Cluster 2 plants (S. caripense, S. muricatum, S. quitoense, and S. sisymbriifolium), theassociation amongst the glycoalkaloids in leaves was also strong, with coefficients rangingfrom 0.534 *** to 0.992 ***. Similarly, the association among root glycoalkaloids in thestudied Solanum plants was present, though weaker, for the two identified clusters, withcorrelation coefficients ranging from 0.124 to 0.524 *** for Cluster 1 and from 0.037 to 0.966*** for Cluster 2. A heat map analysis of the glycoalkaloids contributing to the Solanumspecies corroborate the presence of two distinct clusters (Figure 4).
Plants 2022, 11, x FOR PEER REVIEW 9 of 18
Figure 3. Principal component analysis (PCA) plots for individual glycoalkaloids in the shoots and roots of Solanum plant extracts.
To confirm the observed clustering of Solanum plants based on their glycoalkaloid content, the Pearson’s correlations of the glycoalkaloid distributions in the shoots and roots were analyzed (Table 2). Strong correlation coefficients within the two clusters sig-nify the applicability of glycoalkaloids as a chemical class for relating the species to the Solanum family. Specifically, the correlation coefficients for the Cluster 1 plants (S. mela-nocerasum, S. nigrum, and S. retroflexum) leaf glycoalkaloids ranged from 0.853 *** to 0.994 ***. For the Cluster 2 plants (S. caripense, S. muricatum, S. quitoense, and S. sisymbriifolium), the association amongst the glycoalkaloids in leaves was also strong, with coefficients rang-ing from 0.534 *** to 0.992 ***. Similarly, the association among root glycoalkaloids in the studied Solanum plants was present, though weaker, for the two identified clusters, with correlation coefficients ranging from 0.124 to 0.524 *** for Cluster 1 and from 0.037 to 0.966 *** for Cluster 2. A heat map analysis of the glycoalkaloids contributing to the Solanum spe-cies corroborate the presence of two distinct clusters (Figure 4).
Figure 4. Heat map analysis of assigned glycoalkaloids (Table 1) in the extracts of Solanum Spp, roots, stems, and leaves.
Figure 4. Heat map analysis of assigned glycoalkaloids (Table 1) in the extracts of Solanum Spp, roots,stems, and leaves.
Plants 2022, 11, 269 10 of 18
The clustering of plants based on their glycoalkaloid composition was confirmedusing a Czekanowski similarity analysis (Table 3). Several strong correlations were noted,as reflected by the correlation indices close to 1. Generally, S. nigrum, S. melanocerasum,and S. retroflexum were more closely correlated, with indices averaging at 0.33. In fact, theglycoalkaloid composition of S. melanocerasum leaves was very close to S. nigrum (B) leavesin terms of the amount and distribution of glycoalkaloids (0.83). S. nigrum (OB) leaves werevery similar to S. retroflexum leaves (0.68). Plant extracts from S. caripense, S. muricatum,S. quitoense, and S. sisymbriifolium were similar based on their glycoalkaloid composition.However, the similarity indices were lower than for the first set of plants, with the highestbeing 0.63.
2.3. Glycoalkaloids Acetylcholinesterase Inhibition Activity
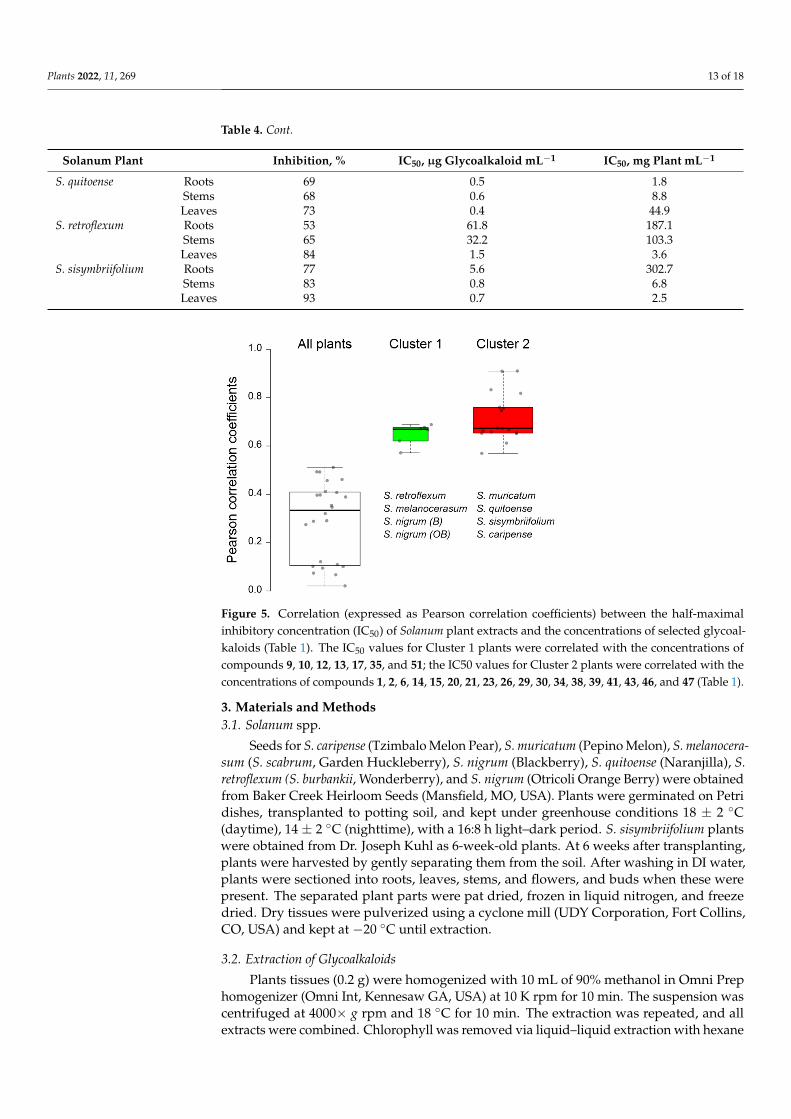
To evaluate the correlation between plant clustering, based on the glycoalkaloidcontent and composition, and the pesticidal potential, plant methanolic extracts were testedfor the inhibition of AChE (Table 4). The inhibition of AChE results in the disruption ofneurotransmission, and, in the case of nematodes, the cessation of nerve impulses and,ultimately, death [4,46]. Inhibition, as reflected by IC50 values, ranged from 39 to 93%when extracts were used at the nominal concentration of glycoalkaloids (as calculatedon a solamargine basis). The corresponding IC50, calculated on the total glycoalkaloidbasis, varied from 0.4 to 344.9 µg total glycoalkaloid mL−1. These values are in the sameorder of magnitude as for the previously reported IC50, where crude extracts of elevenSolanums spp. were tested [20,47]. Generally, the extracts of leaves exhibited the highestinhibition potential, while extracts from roots had the lowest inhibition of AChE. This trendcan partially be explained by a concentration-dependent effect because, for most of thetested species, leaves contained the highest concentrations of glycoalkaloids. However,the correlation between the total glycoalkaloid concentration in the plant tissue extractsand half-maximal inhibitory concentration (IC50) values was not strong (r = 0.1520), andas a result, the total glycoalkaloid concentration cannot be used as a predictor of thepesticidal potential (Figure 5). Separating plants into two groups (Group 1 and Group2) based on the similarity of their glycoalkaloid composition resulted in significantlybetter correlation and pesticidal potential prediction (Figure 5). Particularly, the strongcorrelation between seven major glycoalkaloids and the IC50 values was observed for S.caripense, S. muricatum, S. quitoense, and S. sisymbriifolium (Cluster 2). The concentration of19 other GAs also exhibited a strong correlation with the S. melanocerasum, S. nigrum (B),S. nigrum (OB), and S. retroflexum (Cluster 1) IC50 values. These results indicate that notall glycoalkaloids contribute equally to the overall pesticidal potential. In fact, the strongcorrelations between the IC50 values and glycoalkaloid concentrations were not observedfor the most abundant glycoalkaloid. This suggests that structure, rather than the totalamount of glycoalkaloids, plays the primary role in determining the pesticidal potential.These results are consistent with previously reported findings that both aglycone type andthe sugar moiety of glycoalkaloids have a significant effect on AChE inhibition [48]. Forexample, α-solamargine has a chacotriose sugar moiety and α-solasonine has a solatriosesugar moiety, and the inhibitory activity of α-solasonine was at least 10 times lower [48].

Plants 2022, 11, 269 11 of 18
Table 2. Pearson’s correlations for tested Solanum plant extracts based on their glycoalkaloid composition and content. * p < 0.05, ** p < 0.01, *** p < 0.001.S.
nigr
um(O
B)R
oots
Stem
s
Leav
es
S.ni
grum
(B)R
oots
Stem
s
Leav
es
S.m
elan
ocer
asum
Roo
ts
Stem
s
Leav
es
S.re
trofl
exum
Roo
ts
Stem
s
Leav
es
S.si
sym
brii
foli
umR
oots
Stem
s
Leav
es
S.qu
itoe
nse
Roo
ts
Stem
s
Leav
es
S.ca
ripe
nse
Roo
ts
Stem
s
Leav
es
S.m
uric
atum
Roo
ts
Stem
s
S. nigrum (OB)Stems 0.526 ***
Leaves 0.311 * 0.951 ***S. nigrum (B)
Roots 0.524 *** 0.508 *** 0.528 ***
Stems 0.243 0.825 *** 0.920 *** 0.460 ***Leaves 0.188 0.816 *** 0.898 *** 0.276 0.969 ***
S.melanocerasum
Roots0.124 0.166 0.192 0.332 * 0.141 0.072
Stems 0.093 0.416 ** 0.471 *** 0.224 0.494 *** 0.482 *** 0.878 ***Leaves 0.159 0.782 *** 0.853 *** 0.196 0.933 *** 0.979 *** 0.158 0.574 ***
S. retroflexumRoots 0.618 *** 0.770 *** 0.705 *** 0.679 *** 0.495 *** 0.445 ** 0.287 * 0.283 * 0.396 **
Stems 0.282 * 0.830 *** 0.917 *** 0.497 *** 0.997 *** 0.957 *** 0.149 0.491 *** 0.922 *** 0.503 ***Leaves 0.214 0.834 *** 0.903 *** 0.294 * 0.971 *** 0.994 *** 0.080 0.486 *** 0.984 *** 0.466 *** 0.962 ***
S.sisymbriifolium
Roots−0.054 −0.098 −0.107 −0.080 −0.048 −0.071 −0.086 −0.081 −0.069 −0.106 −0.079 −0.068
Stems −0.001 −0.093 −0.121 −0.103 −0.058 −0.082 −0.098 −0.096 −0.079 −0.100 −0.086 −0.076 0.658 ***Leaves 0.454 *** 0.069 −0.071 −0.049 −0.041 −0.057 −0.053 −0.069 −0.056 0.087 −0.041 −0.046 0.159 0.319 *
S. quitoenseRoots 0.032 −0.103 −0.135 −0.108 −0.100 −0.095 −0.110 −0.107 −0.09 −0.103 −0.098 −0.086 0.075 0.090 0.063
Stems 0.787 *** 0.157 −0.080 0.031 −0.066 −0.071 −0.058 −0.098 −0.069 0.184 −0.038 −0.052 0.051 0.205 0.609 *** 0.256Leaves 0.872 *** 0.197 −0.062 0.148 −0.057 −0.061 −0.045 −0.082 −0.058 0.219 −0.022 −0.039 0.027 0.115 0.534 *** 0.244 0.922 ***
S. caripenseRoots −0.001 −0.063 −0.085 −0.047 −0.022 −0.056 −0.069 −0.078 −0.056 −0.073 −0.063 −0.054 0.727 *** 0.718 *** 0.225 0.089 0.132 0.095
Stems 0.661 *** 0.126 −0.077 −0.001 −0.043 −0.065 −0.056 −0.093 −0.065 0.147 −0.041 −0.051 0.369 ** 0.441 ** 0.625 *** 0.109 0.834 *** 0.772 *** 0.551 ***Leaves 0.597 *** 0.137 −0.037 0.038 −0.024 −0.037 −0.025 −0.053 −0.037 0.158 −0.013 −0.025 0.029 0.100 0.907 *** 0.074 0.683 *** 0.654 *** 0.100 0.629 ***
S. muricatumRoots 0.065 −0.050 −0.091 −0.044 −0.026 −0.061 −0.073 −0.082 −0.060 −0.056 −0.065 −0.058 0.702 *** 0.688 *** 0.334 * 0.037 0.168 0.150 0.966 *** 0.614 *** 0.225
Stems 0.161 0.001 −0.062 −0.022 −0.007 −0.043 −0.046 −0.061 −0.044 −0.001 −0.042 −0.040 0.715 *** 0.697 *** 0.394 ** 0.059 0.285 * 0.245 0.953 *** 0.694 *** 0.284 * 0.960 ***Leaves 0.635 *** 0.150 −0.034 0.071 −0.023 −0.037 −0.023 −0.052 −0.036 0.171 −0.01 −0.023 0.039 0.099 0.894 *** 0.079 0.694 *** 0.695 *** 0.116 0.634 *** 0.992 *** 0.241 0.297 *

Plants 2022, 11, 269 12 of 18
Table 3. Czekanowski similarity coefficients for tested Solanum plant extracts based on their glycoal-kaloid composition and content.
S.ni
grum
(OB
)Roo
ts
Stem
s
Leav
es
S.ni
grum
(B)R
oots
Stem
s
Leav
es
S.m
elan
ocer
asum
Roo
ts
Stem
s
Leav
es
S.re
trofl
exum
Roo
ts
Stem
s
Leav
es
S.si
sym
brii
foli
umR
oots
Stem
s
Leav
es
S.qu
itoe
nse
Roo
ts
Stem
s
Leav
es
S.ca
ripe
nse
Roo
ts
Stem
s
Leav
es
S.m
uric
atum
Roo
ts
Stem
s
Leav
es
S. nigrum(OB) Roots 1.00
Stems 0.32 1.00Leaves 0.42 0.48 1.00
S. nigrum (B)Roots 0.09 0.36 0.15 1.00
Stems 0.06 0.24 0.10 0.39 1.00Leaves 0.10 0.37 0.18 0.28 0.65 1.00
S.melanocera-
sumRoots
0.08 0.26 0.13 0.54 0.25 0.20 1.00
Stems 0.09 0.29 0.14 0.34 0.48 0.47 0.73 1.00Leaves 0.09 0.33 0.16 0.18 0.53 0.83 0.19 0.46 1.00
S. retroflexumRoots 0.31 0.70 0.42 0.39 0.27 0.36 0.30 0.33 0.31 1.00
Stems 0.28 0.56 0.55 0.32 0.24 0.41 0.23 0.30 0.35 0.39 1.00Leaves 0.23 0.46 0.68 0.24 0.18 0.31 0.19 0.23 0.28 0.31 0.74 1.00
S. sisymbri-ifolium
Roots0.01 0.02 0.01 0.05 0.08 0.02 0.03 0.05 0.01 0.03 0.02 0.01 1.00
Stems 0.02 0.06 0.03 0.05 0.04 0.01 0.04 0.06 0.01 0.07 0.07 0.03 0.17 1.00Leaves 0.15 0.09 0.02 0.02 0.02 0.01 0.02 0.05 0.00 0.10 0.04 0.02 0.09 0.42 1.00
S. quitoenseRoots 0.04 0.11 0.05 0.07 0.03 0.01 0.03 0.04 0.01 0.12 0.08 0.04 0.09 0.27 0.17 1.00
Stems 0.06 0.21 0.05 0.15 0.05 0.02 0.05 0.02 0.01 0.23 0.10 0.05 0.15 0.26 0.18 0.28 1.00Leaves 0.01 0.04 0.02 0.13 0.05 0.02 0.07 0.01 0.01 0.05 0.04 0.03 0.16 0.09 0.03 0.06 0.23 1.00
S. caripenseRoots 0.04 0.09 0.04 0.08 0.02 0.01 0.04 0.03 0.01 0.10 0.06 0.04 0.08 0.32 0.20 0.25 0.22 0.05 1.00
Stems 0.23 0.19 0.04 0.07 0.02 0.01 0.02 0.02 0.00 0.19 0.06 0.03 0.06 0.22 0.43 0.15 0.22 0.04 0.49 1.00Leaves 0.38 0.10 0.03 0.04 0.01 0.00 0.01 0.01 0.00 0.09 0.03 0.02 0.03 0.13 0.34 0.08 0.08 0.02 0.13 0.31 1.00
S. muricatumRoots 0.01 0.05 0.02 0.10 0.09 0.03 0.05 0.05 0.02 0.06 0.05 0.03 0.29 0.40 0.22 0.13 0.21 0.19 0.28 0.22 0.10 1.00
Stems 0.02 0.10 0.03 0.09 0.06 0.02 0.05 0.01 0.01 0.10 0.06 0.04 0.18 0.46 0.24 0.17 0.33 0.19 0.36 0.29 0.12 0.63 1.00Leaves 0.27 0.16 0.03 0.09 0.02 0.01 0.02 0.00 0.00 0.15 0.05 0.03 0.06 0.12 0.52 0.11 0.17 0.04 0.15 0.44 0.54 0.15 0.18 1.00
Table 4. AChE inhibition of Solanum plants root, stem, and leaf extracts expressed as percentage, andthe half-maximal inhibitory concentration (IC50) relative to the total glycoalkaloid and plant massbasis.
Solanum Plant Inhibition, % IC50, µg Glycoalkaloid mL−1 IC50, mg Plant mL−1
S. caripense Roots 57 94.8 283.4Stems 60 120.6 261.7Leaves 80 10.5 13.8
S. melanocerasum Roots 48 62.0 438.2Stems 49 1.4 10.8Leaves 92 0.5 6.9
S. muricatum Roots 70 1.2 20.9Stems 46 2.2 32.6Leaves 87 6.3 25.4
S. nigrum (B) Roots 58 48.8 577.3Stems 39 1.0 19.3Leaves 82 0.8 8.8
S. nigrum (OB) Roots 67 344.9 238.1Stems 56 28.4 102.3Leaves 82 141.0 149.5
Plants 2022, 11, 269 13 of 18
Table 4. Cont.
Solanum Plant Inhibition, % IC50, µg Glycoalkaloid mL−1 IC50, mg Plant mL−1
S. quitoense Roots 69 0.5 1.8Stems 68 0.6 8.8Leaves 73 0.4 44.9
S. retroflexum Roots 53 61.8 187.1Stems 65 32.2 103.3Leaves 84 1.5 3.6
S. sisymbriifolium Roots 77 5.6 302.7Stems 83 0.8 6.8Leaves 93 0.7 2.5
Plants 2022, 11, x FOR PEER REVIEW 13 of 18
Stems 39 1.0 19.3 Leaves 82 0.8 8.8 S. nigrum (OB) Roots 67 344.9 238.1 Stems 56 28.4 102.3 Leaves 82 141.0 149.5 S. quitoense Roots 69 0.5 1.8 Stems 68 0.6 8.8 Leaves 73 0.4 44.9 S. retroflexum Roots 53 61.8 187.1 Stems 65 32.2 103.3 Leaves 84 1.5 3.6 S. sisymbriifolium Roots 77 5.6 302.7 Stems 83 0.8 6.8 Leaves 93 0.7 2.5
Figure 5. Correlation (expressed as Pearson correlation coefficients) between the half-maximal in-hibitory concentration (IC50) of Solanum plant extracts and the concentrations of selected glycoalka-loids (Table 1). The IC50 values for Cluster 1 plants were correlated with the concentrations of com-pounds 9, 10, 12, 13, 17, 35, and 51; the IC50 values for Cluster 2 plants were correlated with the concentrations of compounds 1, 2, 6, 14, 15, 20, 21, 23, 26, 29, 30, 34, 38, 39, 41, 43, 46, and 47 (Table 1).
3. Materials and Methods 3.1. Solanum spp.
Seeds for S. caripense (Tzimbalo Melon Pear), S. muricatum (Pepino Melon), S. mela-nocerasum (S. scabrum, Garden Huckleberry), S. nigrum (Blackberry), S. quitoense (Naran-jilla), S. retroflexum (S. burbankii, Wonderberry), and S. nigrum (Otricoli Orange Berry) were obtained from Baker Creek Heirloom Seeds (Mansfield, MO, USA). Plants were ger-minated on Petri dishes, transplanted to potting soil, and kept under greenhouse condi-tions 18 ± 2 °C (daytime), 14 ± 2 °C (nighttime), with a 16:8 h light–dark period. S. sisym-briifolium plants were obtained from Dr. Joseph Kuhl as 6-week-old plants. At 6 weeks after transplanting, plants were harvested by gently separating them from the soil. After washing in DI water, plants were sectioned into roots, leaves, stems, and flowers, and buds when these were present. The separated plant parts were pat dried, frozen in liquid nitrogen, and freeze dried. Dry tissues were pulverized using a cyclone mill (UDY Cor-poration, Fort Collins, CO, USA) and kept at −20 °C until extraction.
Figure 5. Correlation (expressed as Pearson correlation coefficients) between the half-maximalinhibitory concentration (IC50) of Solanum plant extracts and the concentrations of selected glycoal-kaloids (Table 1). The IC50 values for Cluster 1 plants were correlated with the concentrations ofcompounds 9, 10, 12, 13, 17, 35, and 51; the IC50 values for Cluster 2 plants were correlated with theconcentrations of compounds 1, 2, 6, 14, 15, 20, 21, 23, 26, 29, 30, 34, 38, 39, 41, 43, 46, and 47 (Table 1).
3. Materials and Methods3.1. Solanum spp.
Seeds for S. caripense (Tzimbalo Melon Pear), S. muricatum (Pepino Melon), S. melanocera-sum (S. scabrum, Garden Huckleberry), S. nigrum (Blackberry), S. quitoense (Naranjilla), S.retroflexum (S. burbankii, Wonderberry), and S. nigrum (Otricoli Orange Berry) were obtainedfrom Baker Creek Heirloom Seeds (Mansfield, MO, USA). Plants were germinated on Petridishes, transplanted to potting soil, and kept under greenhouse conditions 18 ± 2 ◦C(daytime), 14 ± 2 ◦C (nighttime), with a 16:8 h light–dark period. S. sisymbriifolium plantswere obtained from Dr. Joseph Kuhl as 6-week-old plants. At 6 weeks after transplanting,plants were harvested by gently separating them from the soil. After washing in DI water,plants were sectioned into roots, leaves, stems, and flowers, and buds when these werepresent. The separated plant parts were pat dried, frozen in liquid nitrogen, and freezedried. Dry tissues were pulverized using a cyclone mill (UDY Corporation, Fort Collins,CO, USA) and kept at −20 ◦C until extraction.
3.2. Extraction of Glycoalkaloids
Plants tissues (0.2 g) were homogenized with 10 mL of 90% methanol in Omni Prephomogenizer (Omni Int, Kennesaw GA, USA) at 10 K rpm for 10 min. The suspension wascentrifuged at 4000× g rpm and 18 ◦C for 10 min. The extraction was repeated, and allextracts were combined. Chlorophyll was removed via liquid–liquid extraction with hexane
Plants 2022, 11, 269 14 of 18
(10 mL) using an end-to-end shaker (10 min). The hexane fraction containing chlorophyllwas removed by aspirating the top layer after centrifuging the solution at 2400× g rpmat 18 ◦C for 5 min. The hexane extraction was repeated. The methanolic fraction of theextract was then diluted with DI water (600 mL) to obtain less than 3% methanol content.The diluted extract was subjected to solid-phase extraction on an Oasis HLB (3 mL, 60 mg,30 µm) (Waters Corp., Milford, MA, USA). The cartridges were preconditioned with 3 mLof methanol and equilibrated with 3 mL of water. The samples were loaded into the columnat 25 mm Hg negative pressure, and cartridges were washed with water and eluted with3 mL 85% methanol using gravity.
3.3. HPLC TOF MS Analysis of Glycoalkaloids
The analysis of the GAs was performed using an Agilent 1200 Series HPLC coupledto an Agilent G6230 ESI TOF MS (Agilent, Santa Clara, CA, USA). The chromatographicseparation of glycoalkaloids was performed on an Extend-C18 3.5 µm, 2.1 mm × 100 mm(Agilent Technologies Inc., Santa Clara, CA, USA) reversed-phase chromatographic column.The mobile phase consisted of 0.1% formic acid in water (solvent A) and 0.1% formic acidin acetonitrile (solvent B). The gradient program started with isocratic elution using 5%B for 2 min, followed by a linear gradient to 35% B from 2 to 35 min, followed by a lineargradient to 98% over 10 min, kept at 98% for 5 min, and re-equilibrated back to the initialmobile phase composition over 10 min. The column was maintained at 30 ◦C. The injectionvolume was 5 µL. The flow rate was 0.2 mL min−1.
Electrospray ionization was operated in positive mode. The absolute value for elec-trospray ionization potential was 3500 V. The collision-induced dissociation potential wasset at 150 and 250 V to analyze the spectra for molecular ion and fragmentation patterns,respectively. The gas temperature was 350 ◦C, the drying gas (N2) flow rate was 10 L min−1,and the nebulizer pressure was 2.4 × 10⁵ Pa. The analyses were conducted in a centroidmode within an m/z range from 100 to 1700 amu. The quantification of the total glycoalka-loid concentration was performed based on the external calibration curve constructed forsolamargine based on the pseudo-molecular ion [M + H]+.
HPLC TOF MS chromatograms were processed in MassHunter B.08.00 Agilent Profindersoftware (Agilent Technologies Inc, Santa Clara, CA, USA). The assignment of glycoal-kaloids was performed based on neutral loss analysis using fragmentation and isotopicpatterns for each compound [16,35]. Neutral loss corresponding to mono-, di-, tri-, andtetrameric sugar moieties that could be obtained by combining pentose, hexose, and deoxy-hexose units were considered to be with the error of less than 3 ppm.
3.4. Acetylcholinesterase Assay
The measurement of acetylcholinesterase (EC number 3.1.1.7) activity was conductedin a 96-well microplate format according to a method previously described, with somemodifications [49]. Different volumes (5–1000 µL) of plant extracts in 85% methanolsamples were added to microplate wells, evaporated to dryness, and reconstituted in200 µL of sodium phosphate buffer (100 mM, pH 7.4). Then, 50 µL of Ellman’s reagent(1 mM acetylthiocholine and 0.3 mM 5,5′-dithiobis (2-nitrobenzoic acid) in (100 mM pH7.4 phosphate buffer) was added to each well. Prior to start of the analysis, 50 µL ofacetylcholinesterase from Electrophorus electricus (1 unit mL−1) was added to each well.The absorbance at 405 nm was measured every minute for 15 min using SpectraMax MSeries Multi-Mode Microplate Readers (Molecular Devices, LLC., San Jose, CA, USA). Therate of the reaction was calculated as a slope of the kinetics curve over the linear range. Anegative control was run with each batch, substituting the plant extract for 85% methanoland treating it in a similar manner. The inhibition of the reaction by the plant extracts wasquantified in terms of half-maximal inhibitory concentration (IC50), i.e., the concentrationat which a substance exerts half of its maximal inhibitory effect. The IC50 was calculatedusing a four-parameter regression model: y = d + (a − d)/(1 + (x/IC50)b), where y is the
Plants 2022, 11, 269 15 of 18
response and x is the concentration, a and d are lower and upper asymptotes, respectively,and b is the steepness of the linear portion of the curve [50].
3.5. Data Analysis
All extractions and enzyme assays were performed with at least three replicates. Theheat map analysis was conducted using a ClustVis web tool for visualizing the clustering ofmultivariate data that is based on the heatmap R package (version 0.7.7) [51]. The bean plotswere generated using a BoxPlotR web tool for the generation of box plots [52]. Czekanowskisimilarity indices (sc) were calculated as the ratio of the double sum of the lesser scores ofeach glycoalkaloid to the sum of all glycoalkaloids in the specific sample and were used asa measure of similarity between two categorical distributions [53]. The correlation betweenspecific glycoalkaloids and inhibition activities were calculated using Pearson’s correlationin JASP, an open-source graphical software package for basic statistical procedures [54].
4. Conclusions
The presented study provides a framework for creating data sets for further biologi-cally active compound identification and analysis. Specifically, using this framework wewere able to demonstrate that the composition of glycoalkaloids in plant extracts ratherthan the total concentration is a driver of inhibitory activity. The S. sisymbriifolium leafextract with the highest AChE inhibition had a unique glycoalkaloid, tentatively identifiedas malonyl solanandaine, which was not identified in the other Solanum species used in thisstudy. This chemometric study will help in the bioprospecting of underexploited Solanumspecies for exploring bioactive compounds with potential biological activities for the devel-opment of green bioformulation. This, as in the case of this study, can be a useful tool forscreening for the potential pesticidal activities of plant tissues. Recently, the multivariantanalysis was identified as a critical tool in the chemotaxonomy of eggplants (S. melongena)and their wild relatives [55]. However, this is, to the best of our knowledge, the first reportof the analysis of glycoalkaloids across the seven studied Solanum species. In addition, theproposed workflow can be applied to other areas of study, such as chemophenetic analysis,which is an emerging concept relating to plant chemosystematics, and chemotaxonomy,which is based on the plant specialized metabolites profile [56].
Supplementary Materials: The following are available online at https://www.mdpi.com/article/10.3390/plants11030269/s1, Table S1: Concentrations of individual glycoalkaloids in plant extractsanalyzed. Figure S1: HPLC TOF MS chromatographic profiles of leaves, stems, and roots of studiedSolanum plants. Figure S2. Reported structures of glycoalkaloids referenced in the manuscript andidentified in Table 1.
Author Contributions: Conceptualization—L.-M.D. and I.P.; Data curation—I.P.; Formal analysis—B.S.; Funding acquisition—L.-M.D.; Investigation—I.P.; Methodology—J.K. and S.S.P.; Resources—J.K.; Visualization—I.P.; Writing—original draft—I.P.; Writing—review and editing—S.S.P., B.S.,L.-M.D., and J.K. All authors have read and agreed to the published version of the manuscript.
Funding: This research was funded by the National Institute of Food and Agriculture, 2017-51102-27271. Publication of this article was funded by the University of Idaho—Open Access PublishingFund.
Institutional Review Board Statement: Not applicable.
Informed Consent Statement: Not applicable.
Data Availability Statement: The data presented in this study are available on request from thecorresponding author.
Acknowledgments: We would like to thank Hannah Gross, Ricardo Lopez, and Anne Pollard forhelp with the growing and sampling of plants and Jing Wang for help with enzyme analysis.

Plants 2022, 11, 269 16 of 18
Conflicts of Interest: The authors declare no conflict of interest. The funders had no role in the designof the study; in the collection, analyses, or interpretation of data; in the writing of the manuscript, orin the decision to publish the results.
References1. Ginzberg, I.; Tokuhisa, J.G.; Veilleux, R.E. Potato steroidal glycoalkaloids: Biosynthesis and genetic manipulation. Potato Res.
2009, 52, 1–15. [CrossRef]2. Itkin, M.; Heinig, U.; Tzfadia, O.; Bhide, A.J.; Shinde, B.; Cardenas, P.D.; Bocobza, S.E.; Unger, T.; Malitsky, S.; Finkers, R.;
et al. Biosynthesis of antinutritional alkaloids in solanaceous crops is mediated by clustered genes. Science 2013, 341, 175–179.[CrossRef] [PubMed]
3. Friedman, M. Potato Glycoalkaloids and metabolites: Roles in the plant and in the diet. J. Agric. Food Chem. 2006, 54, 8655–8681.[CrossRef] [PubMed]
4. Milner, S.E.; Brunton, N.P.; Jones, P.W.; O’Brien, N.M.; Collins, S.G.; Maguire, A.R. Bioactivities of glycoalkaloids and theiraglycones from Solanum species. J. Agric. Food Chem. 2011, 59, 3454–3484. [CrossRef]
5. Tingley, G.A. Physical conditions and their effects upon infection by some insect parasitic nematodes. In Parasitology; CambridgeUniv Press: New York, NY, USA, 1984; Volume 89, p. R79.
6. Flanders, K.L.; Hawkes, J.G.; Radcliffe, E.B.; Lauer, F.I. Insect resistance in potatoes: Sources, evolutionary relationships,morphological and chemical defenses, and ecogeographical associations. Euphytica 1992, 61, 83–111. [CrossRef]
7. Wierenga, J.M.; Hollingworth, R.M. Inhibition of insect acetylcholinesterase by the potato glycoalkaloid α-chaconine. Nat. Toxins1992, 1, 96–99. [CrossRef]
8. Weissenberg, M.; Levy, A.; Svoboda, J.A.; Ishaaya, I. The effect of some Solanum steroidal alkaloids and glycoalkaloids on larvae ofthe red flour beetle, Tribolium castaneum, and the tobacco hornworm, Manduca sexta. Phytochemistry 1998, 47, 203–209. [CrossRef]
9. Sivasankara Pillai, S.; Dandurand, L.-M. Effect of steroidal glycoalkaloids on hatch and reproduction of the potato cyst nematodeGlobodera pallida. Plant Dis. 2021, 105, 2975–2980. [CrossRef] [PubMed]
10. Dandurand, L.M.; Zasada, I.A.; LaMondia, J.A. Effect of the trap crop, Solanum sisymbriifolium, on Globodera pallida, Globoderatabacum, and Globodera ellingtonae. J. Nematol. 2019, 51, 1–11. [CrossRef]
11. Lima, G.P.P.; Borges, C.V.; Vianello, F.; Cisneros-Zevallos, L.; Minatel, I.O. Phytochemicals in organic and conventional fruits andvegetables. Fruit Veg. Phytochemistry 2017, 3, 1305–1322.
12. Friedman, M.; Dao, L. Distribution of glycoalkaloids in potato plants and commercial potato products. J. Agric. Food Chem. 1992,40, 419–423. [CrossRef]
13. Bejarano, L.; Mignolet, E.; Devaux, A.; Espinola, N.; Carrasco, E.; Larondelle, Y. Glycoalkaloids in potato tubers: The effectof variety and drought stress on the α-solanine and α-chaconine contents of potatoes. J. Sci. Food Agric. 2000, 80, 2096–2100.[CrossRef]
14. Roddick, J.G.; Melchers, G. Steroidal glycoalkaloid content of potato, tomato and their somatic hybrids. Theor. Appl. Genet. 1985,70, 655–660. [CrossRef] [PubMed]
15. Wu, S.-B.; Meyer, R.S.; Whitaker, B.D.; Litt, A.; Kennelly, E.J. A new liquid chromatography–mass spectrometry-based strategy tointegrate chemistry, morphology, and evolution of eggplant (Solanum) species. J. Chromatogr. A 2013, 1314, 154–172. [CrossRef][PubMed]
16. Popova, I.E.; Morra, M.J. Optimization of hidden target screening for Solanum sisymbriifolium glycoalkaloids. Chromatographia2021, 84, 135–145. [CrossRef]
17. Cárdenas, P.D.; Sonawane, P.D.; Heinig, U.; Jozwiak, A.; Panda, S.; Abebie, B.; Kazachkova, Y.; Pliner, M.; Unger, T.; Wolf, D.; et al.Pathways to defense metabolites and evading fruit bitterness in genus Solanum evolved through 2-oxoglutarate-dependentdioxygenases. Nat. Commun. 2019, 10, 5169. [CrossRef] [PubMed]
18. Gu, X.-Y.; Shen, X.-F.; Wang, L.; Wu, Z.-W.; Li, F.; Chen, B.; Zhang, G.-L.; Wang, M.-K. Bioactive steroidal alkaloids from the fruitsof Solanum nigrum. Phytochemistry 2018, 147, 125–131. [CrossRef] [PubMed]
19. Zhao, D.-K.; Zhao, Y.; Chen, S.-Y.; Kennelly, E.J. Solanum steroidal glycoalkaloids: Structural diversity, biological activities, andbiosynthesis. Nat. Prod. Rep. 2021, 8, 1413–1548. [CrossRef]
20. Lelario, F.; De Maria, S.; Rivelli, A.R.; Russo, D.; Milella, L.; Bufo, S.A.; Scrano, L. A Complete survey of glycoalkaloidsusing LC-FTICR-MS and IRMPD in a commercial variety and a local landrace of eggplant (Solanum melongena L.) and theiranticholinesterase and antioxidant activities. Toxins 2019, 11, 230. [CrossRef] [PubMed]
21. Usubillaga, A.; Aziz, I.; Tettamanzi, M.C.; Waibel, R.; Achenbach, H. Steroidal alkaloids from Solanum sycophanta. Phytochemistry1997, 44, 537–543. [CrossRef]
22. Fukuhara, K.; Shimizu, K.; Kubo, I. Arudonine, an allelopathic steroidal glycoalkaloid from the root bark of Solanum arundoMattei. Phytochemistry 2004, 65, 1283–1286. [CrossRef] [PubMed]
23. Ono, M.; Kakiuchi, T.; Ebisawa, H.; Shiono, Y.; Nakamura, T.; Kai, T.; Ikeda, T.; Miyashita, H.; Yoshimitsu, H.; Nohara, T. Steroidalglycosides from the fruits of Solanum viarum. Chem. Pharm. Bull. 2009, 57, 632–635. [CrossRef] [PubMed]
24. Wang, Y.; Xiang, L.; Yi, X.; He, X. Potential Anti-inflammatory steroidal saponins from the berries of Solanum nigrum L. (Europeanblack nightshade). J. Agric. Food Chem. 2017, 65, 4262–4272. [CrossRef] [PubMed]

Plants 2022, 11, 269 17 of 18
25. Yahara, S.; Nakamura, T.; Someya, Y.; Matsumoto, T.; Yamashita, T.; Nohara, T. Steroidal glycosides, indiosides A-E, from Solanumindicum. Phytochemistry 1996, 43, 1319–1323. [CrossRef]
26. Maurya, A.; Manika, N.; Verma, R.K.; Singh, S.C.; Srivastava, S.K. Simple and reliable methods for the determination of threesteroidal glycosides in the eight species of Solanum by reversed-phase HPLC coupled with diode array detection. Phytochem.Anal. 2013, 24, 87–92. [CrossRef] [PubMed]
27. Zhou, X.; He, X.; Wang, G.; Gao, H.; Zhou, G.; Ye, W.; Yao, X. Steroidal saponins from Solanum nigrum. J. Nat. Prod. 2006, 69,1158–1163. [CrossRef]
28. Sharma, S.C.; Chand, R.; Sati, O.P.; Sharma, A.K. Oligofurostanosides from Solanum nigrum. Phytochemistry 1983, 22, 1241–1244.[CrossRef]
29. Xiang, L.; Wang, Y.; Yi, X.; He, X. Anti-inflammatory steroidal glycosides from the berries of Solanum nigrum L. (European blacknightshade). Phytochemistry 2018, 148, 87–96. [CrossRef]
30. Ono, M.; Shimode, M.; Tsutsumi, S.; Yasuda, S.; Okawa, M.; Kinjo, J.; Miyashita, H.; Ikeda, T.; Yoshimitsu, H.; Nohara, T. A newsteroidal glycoside from the fruits of Solanum myriacanthum. Nat. Prod. Res. 2020, 26, 326–333. [CrossRef]
31. Honbu, T.; Ikeda, T.; Zhu, X.-H.; Yoshihara, O.; Okawa, M.; Nafady, A.M.; Nohara, T. New steroidal glycosides from the fruits ofSolanum anguivi. J. Nat. Prod. 2002, 65, 1918–1920. [CrossRef] [PubMed]
32. Nakamura, S.; Hongo, M.; Yoshikawa, M.; Nakamura, S.; Hongo, M.; Sugimoto, S.; Matsuda, H.; Yoshikawa, M. Steroidalsaponins and pseudoalkaloid oligoglycoside from Brazilian natural medicine, “fruta do lobo” (fruit of Solanum lycocarpum).Phytochemistry 2008, 69, 1565–1572. [CrossRef] [PubMed]
33. Shakya, R.; Navarre, D.A. LC-MS analysis of solanidane glycoalkaloid diversity among tubers of four wild potato species andthree cultivars (Solanum tuberosum). J. Agric. Food Chem. 2008, 56, 6949–6958. [CrossRef]
34. Ghisalberti, E. Steroidal glycoalkaloids: Isolation, structure, analysis, and biosynthesis. Nat. Prod. Commun. 2006, 1, 859–884.[CrossRef]
35. Larcher, R.; Nardin, T. Suspect screening of glycoalkaloids in plant extracts using neutral loss—High resolution mass spectrometry.J. Chromatogr. A 2019, 1596, 59–68. [CrossRef]
36. Little, J.L.; Cleven, C.D.; Brown, S.D. Identification of “Known unknowns” utilizing accurate mass data and Chemical AbstractsService databases. J. Am. Soc. Mass Spectrom. 2011, 22, 348–359. [CrossRef] [PubMed]
37. Morais, M.G.; Saldanha, A.A.; Costa Rodrigues, J.P.; Cotta Mendes, I.; Ferreira, L.M.; Amado, P.A.; de Souza Farias, K.;Santos Zanuncio, V.S.; da Silva, D.B.; Pinto, F.C.H.; et al. Chemical composition, antioxidant, anti-inflammatory and antinocicep-tive activities of the ethanol extract of ripe fruits of Solanum lycocarpum St. Hil. (Solanaceae). J. Ethnopharmacol. 2020, 262, 113125.[CrossRef] [PubMed]
38. Ikeda, T.; Ando, J.; Miyazono, A.; Zhu, X.-H.; Tsumagari, H.; Nohara, T.; Yokomizo, K.; Uyeda, M. Anti-herpes virus activity ofsolanum steroidal glycosides. Biol. Pharm. Bull. 2000, 23, 363–364. [CrossRef]
39. Sánchez-Mata, M.-C.; Yokoyama, W.E.; Hong, Y.-J.; Prohens, J. α-Solasonine and α-solamargine contents of Gboma (Solanummacrocarpon L.) and scarlet (Solanum aethiopicum L.) eggplants. J. Agric. Food Chem. 2010, 58, 5502–5508. [CrossRef]
40. Manoko, M.L.K.; van den Berg, R.G.; Feron, R.M.C.; van der Weerden, G.M.; Mariani, C. Genetic diversity of the African hexaploidspecies Solanum scabrum Mill. and Solanum nigrum L. (Solanaceae). Genet. Resour. Crop Evol. 2008, 55, 409–418. [CrossRef]
41. Särkinen, T.; Poczai, P.; Barboza, G.E.; van der Weerden, G.M.; Baden, M.; Knapp, S. A revision of the Old World black nightshades(Morelloid clade of Solanum L., Solanaceae). PhytoKeys 2018, 106, 1–223. [CrossRef]
42. Herraiz, F.J.; Villaño, D.; Plazas, M.; Vilanova, S.; Ferreres, F.; Prohens, J.; Moreno, D.A. Phenolic profile and biological activities ofthe Pepino (Solanum muricatum) fruit and its wild relative S. caripense. Int. J. Mol. Sci. 2016, 17, 394. [CrossRef]
43. Levin, R.A.; Myers, N.R.; Bohs, L. Phylogenetic relationships among the “Spiny solanum” (Solanum subgenus Leptostemonum,Solanaceae). Am. J. Bot. 2006, 93, 157–169. [CrossRef]
44. Bohs, L. A Chloroplast DNA Phylogeny of Solanum section Lasiocarpa. Syst. Bot. 2004, 29, 177–187. [CrossRef]45. El-Shaboury, G.A.; Haroun, S.A.; Shaker, K.; Badr, A. Systematics implications of GC-MS analysis of secondary metabolites in the
ethanol extract of Solanum species from South West Saudi Arabia. Egypt. J. Bot. 2017, 57, 429–444. [CrossRef]46. Nasr, H. Toxicity and Biochemical Effect of organophosphates and bio-pesticides against Root-knot nematode, Meloidogyne
incognita. J. Pollut. Eff. Control 2015, 4, 1–9. [CrossRef]47. Niño, J.; Hernández, J.A.; Correa, Y.M.; Mosquera, O.M. In vitro inhibition of acetylcholinesterase by crude plant extracts from
Colombian flora. Mem. Inst. Oswaldo Cruz 2006, 101, 783–785. [CrossRef]48. Roddick, J.G. The acetylcholinesterase-inhibitory activity of steroidal glycoalkaloids and their aglycones. Phytochemistry 1989, 28,
2631–2634. [CrossRef]49. Ellman, G.L.; Courtney, K.D.; Andres, V.; Featherstone, R.M. A new and rapid colorimetric determination of acetylcholinesterase
activity. Biochem. Pharmacol. 1961, 7, 88–95. [CrossRef]50. Sebaugh, J.L. Guidelines for accurate EC50/IC50 estimation. Pharm. Stat. 2011, 10, 128–134. [CrossRef] [PubMed]51. Metsalu, T.; Vilo, J. ClustVis: A web tool for visualizing clustering of multivariate data using Principal Component Analysis and
heatmap. Nucleic Acids Res. 2015, 43, W566–W570. [CrossRef]52. Spitzer, M.; Wildenhain, J.; Rappsilber, J.; Tyers, M. BoxPlotR: A web tool for generation of box plots. Nat. Methods 2014, 11,
121–122. [CrossRef]53. Schubert, A.; Telcs, A. A note on the Jaccardized Czekanowski similarity index. Scientometrics 2014, 98, 1397–1399. [CrossRef]
Plants 2022, 11, 269 18 of 18
54. Love, J.; Selker, R.; Marsman, M.; Jamil, T.; Dropmann, D.; Verhagen, J.; Ly, A.; Gronau, Q.F.; Šmíra, M.; Epskamp, S.; et al. JASP:Graphical statistical software for common statistical designs. J. Stat. Softw. 2019, 88, 1–17. [CrossRef]
55. Halinski, Ł.P.; Samuels, J.; Stepnowski, P. Multivariate analysis as a key tool in chemotaxonomy of brinjal eggplant, Africaneggplants and wild related species. Phytochemistry 2017, 144, 87–97. [CrossRef]
56. Zidorn, C. Plant chemophenetics—A new term for plant chemosystematics/plant chemotaxonomy in the macro-molecular era.Phytochemistry 2019, 163, 147–148. [CrossRef]