Use of directly coupled ion-exchange liquid chromatography–mass spectrometry and liquid...
15
Journal of Chromatography B, 748 (2000) 295–309 www.elsevier.com / locate / chromb Use of directly coupled ion-exchange liquid chromatography–mass spectrometry and liquid chromatography–nuclear magnetic resonance spectroscopy as a strategy for polar metabolite identification a a a a a b G.J. Dear , R.S. Plumb , B.C. Sweatman , P.S. Parry , A.D. Roberts , J.C. Lindon , b a, * J.K. Nicholson , I.M. Ismail a LC / NMR / MS Laboratory, Discovery 2, Bioanalysis and Drug Metabolism Division, GlaxoWellcome Research and Development, Park Road, Ware, Herts. SG12 0DP , UK b Biological Chemistry, Division of Biomedical Sciences, Imperial College of Science, Technology and Medicine, Sir Alexander Fleming Building, South Kensington, London SW72AZ, UK Abstract Ion-exchange LC–MS and LC–NMR have been successfully used to identify a novel N-acetyl metabolite of a highly polar drug candidate [2-(ethanimidoylamino)ethyl]sulfonyl alanine (GW273629) under development as a therapeutic agent. This has been achieved using a simple HPLC method without the need for complicated and time consuming pre- or post-column derivatisation. Ion-exchange chromatography using simple ionic strength buffer and organic solvent mobile phases, as applied here, should be suitable for the analysis of other charged polar species. Optimisation of the system described could result in the development of a rational generic HPLC approach specifically designed for the characterisation of polar drug molecules and their metabolites. 2000 Elsevier Science B.V. All rights reserved. Keywords: Polar metabolites 1. Introduction becoming increasingly important, since this infor- mation can facilitate a metabolism-guided approach Investigation of the metabolism of potential drug to structural modification. This should enable the candidate molecules has been an essential part of the selection of new drug candidates, which are more development process for many years. It has been potent, less toxic and which have better phar- required to provide evidence that the similarity of macokinetic profiles. Success in the early discovery metabolism in humans and in the animal species stage requires metabolite identification methods to be used for toxicological evaluation results in exposure rapid because of this increased focus on accelerated to similar chemical entities. However, identification drug candidate selection and therefore generic ana- of drug metabolites earlier in the discovery process is lytical approaches are desirable in order to handle the significant increase in sample numbers [1]. Traditionally drug metabolite identification has *Corresponding author. Tel.: 144-1920-884-424; fax: 144- been based on studies using radiolabelled and un- 1920-884-374. E-mail address: [email protected] (I.M. Ismail). labelled drug both in vivo and in vitro and often 0378-4347 / 00 / $ – see front matter 2000 Elsevier Science B.V. All rights reserved. PII: S0378-4347(00)00401-1
-
Upload
independent -
Category
Documents
-
view
0 -
download
0
Transcript of Use of directly coupled ion-exchange liquid chromatography–mass spectrometry and liquid...

Journal of Chromatography B, 748 (2000) 295–309www.elsevier.com/ locate /chromb
Use of directly coupled ion-exchange liquid chromatography–massspectrometry and liquid chromatography–nuclear magneticresonance spectroscopy as a strategy for polar metabolite
identificationa a a a a bG.J. Dear , R.S. Plumb , B.C. Sweatman , P.S. Parry , A.D. Roberts , J.C. Lindon ,
b a ,*J.K. Nicholson , I.M. IsmailaLC /NMR /MS Laboratory, Discovery 2, Bioanalysis and Drug Metabolism Division, GlaxoWellcome Research and Development,
Park Road, Ware, Herts. SG12 0DP, UKbBiological Chemistry, Division of Biomedical Sciences, Imperial College of Science, Technology and Medicine,
Sir Alexander Fleming Building, South Kensington, London SW7 2AZ, UK
Abstract
Ion-exchange LC–MS and LC–NMR have been successfully used to identify a novel N-acetyl metabolite of a highly polardrug candidate [2-(ethanimidoylamino)ethyl]sulfonyl alanine (GW273629) under development as a therapeutic agent. Thishas been achieved using a simple HPLC method without the need for complicated and time consuming pre- or post-columnderivatisation. Ion-exchange chromatography using simple ionic strength buffer and organic solvent mobile phases, asapplied here, should be suitable for the analysis of other charged polar species. Optimisation of the system described couldresult in the development of a rational generic HPLC approach specifically designed for the characterisation of polar drugmolecules and their metabolites. 2000 Elsevier Science B.V. All rights reserved.
Keywords: Polar metabolites
1. Introduction becoming increasingly important, since this infor-mation can facilitate a metabolism-guided approach
Investigation of the metabolism of potential drug to structural modification. This should enable thecandidate molecules has been an essential part of the selection of new drug candidates, which are moredevelopment process for many years. It has been potent, less toxic and which have better phar-required to provide evidence that the similarity of macokinetic profiles. Success in the early discoverymetabolism in humans and in the animal species stage requires metabolite identification methods to beused for toxicological evaluation results in exposure rapid because of this increased focus on acceleratedto similar chemical entities. However, identification drug candidate selection and therefore generic ana-of drug metabolites earlier in the discovery process is lytical approaches are desirable in order to handle the
significant increase in sample numbers [1].Traditionally drug metabolite identification has*Corresponding author. Tel.: 144-1920-884-424; fax: 144-
been based on studies using radiolabelled and un-1920-884-374.E-mail address: [email protected] (I.M. Ismail). labelled drug both in vivo and in vitro and often
0378-4347/00/$ – see front matter 2000 Elsevier Science B.V. All rights reserved.PI I : S0378-4347( 00 )00401-1

296 G.J. Dear et al. / J. Chromatogr. B 748 (2000) 295 –309
relied on the comparison of the ultraviolet (UV) quantities of protonated ion-pairing agent in thespectral data and high-performance liquid chroma- mobile phase would present a significant amount oftography (HPLC) retention times of isolated ‘‘un- background signal in the NMR spectrum therebyknown’’ metabolites with those of synthetic stan- adversely affecting the NMR sensitivity and possiblydards. Such methods of detecting drug metabolites masking signals from potential metabolites.and subsequently characterising them were time- Normal-phase HPLC requires the use of organicconsuming and afforded very limited structural in- proton-rich solvents that may give rise to multipleformation [2]. In the last decade this approach has signals in the NMR spectrum. Furthermore, therebeen superseded by structurally more informative may be other problems associated with the physicalmethods such as liquid chromatography–mass spec- nature of the metabolites. The solubility of polartrometry (LC–MS), LC–MS–MS [3], LC–nuclear drug metabolites in the mobile phase is likely to bemagnetic resonance spectroscopy (LC-NMR) [4] and very low, which will limit the column loading, butmore recently LC–NMR–MS [5,6]. injecting solutions of the polarity which would be
Reversed-phase HPLC is usually the chromato- required to solubilise them would significantly affectgraphic mode of choice for bioanalysis in drug the chromatographic performance.metabolism studies because of its ability to separate Ion-exchange chromatography depends on an in-compounds with a broad range of polarities and its teraction between the analyte and the stationarycompatibility with aqueous based biological samples. phase that is ionic rather than lipophilic. The pres-Analysis based on reversed-phase LC–MS–MS has ence of a readily ionisable group within the moleculesignificantly increased the throughput in drug metab- may permit its separation in either of two modes,olism and pharmacokinetic studies [7], and has been anionic mode (where the stationary phase interactsadopted by many laboratories for their generic with negatively charged groups on the analyte, e.g.,
2systems [1]. Consequently metabolite identification –COO ) or cationic mode (where the stationaryapplications using LC–MS, LC–NMR and LC– phase interacts with positively charged groups on the
1NMR–MS have used reversed-phase HPLC as the analyte, e.g., –NH ). The mobile phase may be a4
‘‘front end’’ separation method. However, reversed- simple ionic buffer, the nature of which may bephase HPLC is not universally suitable for drug selected to avoid complications in the NMR spec-metabolism studies since highly polar compounds trum.and their metabolites will not be retained and Here we describe a successful application oftherefore elute with the solvent front, together with coupling of ion-exchange HPLC directly with MSall of the polar endogenous components found in and NMR for the identification of a polar drugbiological fluids. This makes the isolation and metabolite. This application of ion-exchange chro-characterisation of these species a difficult and time- matography coupled to MS and NMR using on-lineconsuming process. radiochemical detection is exemplified in the study
The analysis of polar compounds has been of GW273629 ([2-(ethanimidoylamino)ethyl]sulfonylachieved using other chromatographic techniques alanine) (Fig. 1).such as ion-pair [8], normal-phase [9] and ion-ex-change [10] chromatography, but these techniqueshave significant limitations in their application to the 2. Experimentalstructural elucidation of drug metabolites in bio-logical matrices. These limitations are particularly 2.1. Chemicalssevere when coupling techniques such as MS andNMR to provide unequivocal structural elucidation. HPLC-grade acetonitrile and methanol were pur-
Ion-pair HPLC involves the addition of a counter chased from Rathburn (Walkerburn, UK), whilstion, such as octane sulfonic acid to the mobile phase, HPLC-grade water and formic acid (AR grade) werewhich forms an ionic bond with the analyte ion thus obtained from Fisons (Loughborough, UK).permitting the complex to chromatograph as a neu- Deuterium oxide and Riedel-de Haen ‘‘PESTANAL’’tral species. However the presence of relatively large -grade acetonitrile were purchased from Fluorochem

G.J. Dear et al. / J. Chromatogr. B 748 (2000) 295 –309 297
counting (LSC) and HPLC with both radiochemicaland UV (215 nm) detection
2.4. Chromatography
All HPLC separations were performed on eitherone of two systems:
2.4.1. (i) Reversed-phase chromatographyA 15032.1 mm RxC8 (Hewlett-Packard, CA,
USA), packed with 5 mm Zorbax stationary phaseusing a mobile phase consisting of 0.1% (v/v)aqueous formic acid (A) and 0.1% (v/v) formic acidin acetonitrile (B). The proportion of acetonitrile wasprogrammed to increase linearly from 0% to 100% in30 min, with a flow-rate of 0.25 ml /min.
2.4.2. (ii) Ion-exchange chromatographyFig. 1. The structure of GW273629.A 25034 mm Dionex PCX-100 (Dionex, CA,
USA) packed with OmniPac PCX-100 stationary(Glossop, UK). Ammonium formate and uracil were
phase using a mobile phase consisting of 5% aque-purchased from Sigma–Aldrich (Poole, UK).
ous acetonitrile (A), 50 mM aqueous formic acid (B),14GW273629, C-GW273629 (see Fig. 1) and its N-100 mM aqueous ammonium formate (C) and 95%
acetyl metabolite (N-acetyl-3-h[2-aqueous acetonitrile (D). The gradient system used is
(ethanimidoylamino)ethyl]sulfonyljalanine) weredescribed in the table below, with a flow-rate of 1.0
synthesised by GlaxoWellcome Research and De-ml /min
velopment, Stevenage, UK.
Time Solvent (%)2.2. Samples(min)
A B C DUrine was collected from a Wistar Han rat for a
0 80 10 10 00–6 h period following a single intravenous dose of14 5 80 10 10 010 mg/kg C-GW273629 (free base) and stored
25 0 10 40 50frozen at 2208C prior to analysis.30 0 10 40 50
2.3. Sample extraction2.5. Radiochemical detection
A 1-ml aliquot of 0–6 h rat urine was extracted ona Varian 1 g C Mega-Bond Elut cartridge (Varian, In the absence of any significant UV chromophore,18
Palo Alto, CA, USA) following priming of the the presence of drug-related material was monitoredcartridge with 5 ml methanol followed by 5 ml 0.1% using radiochemical detection both off-line and on-(v /v) aqueous formic acid. The eluate together with a line. The estimation of radioactivity in fractions fromfurther 1 ml 0.1% aqueous formic acid wash were solid-phase extractions (SPEs) was achieved usingpooled and taken to dryness under a stream of dry LSC. Aliquots of the fractions were added to 10 mlnitrogen. The residue was reconstituted in water in Starscint (Packard Bioscience, Groningen, Thepreparation for analysis. Both the eluted sample and Netherlands) and counted on a Packard Tricarb LSCthe neat urine were analysed by liquid scintillation 2700TR scintillation counter (Canberra Packard,
298 G.J. Dear et al. / J. Chromatogr. B 748 (2000) 295 –309
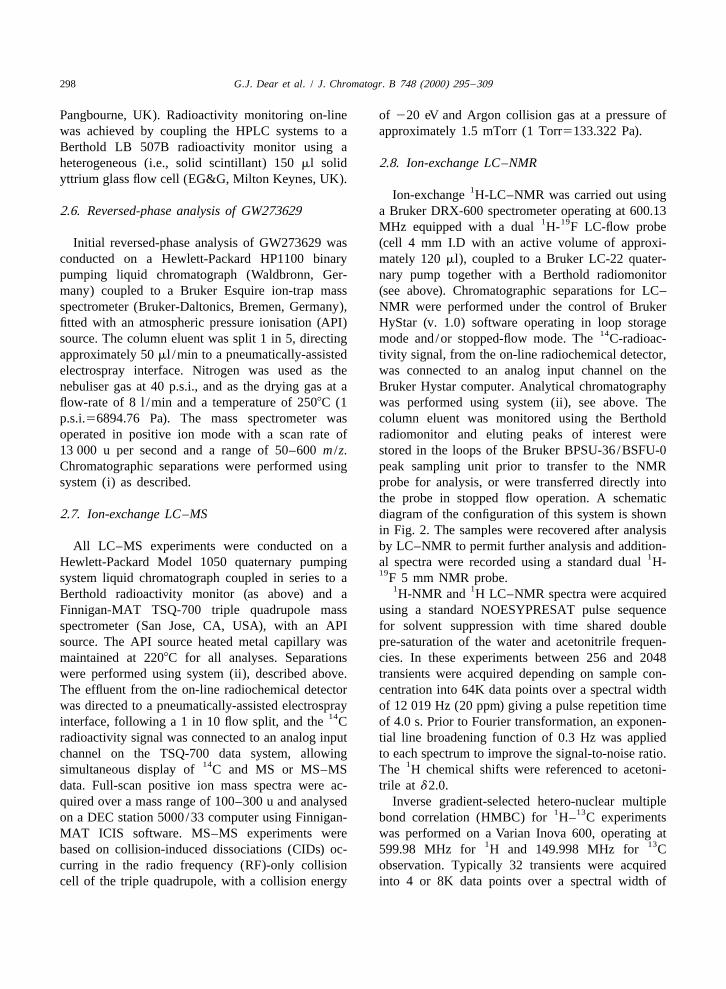
Pangbourne, UK). Radioactivity monitoring on-line of 220 eV and Argon collision gas at a pressure ofwas achieved by coupling the HPLC systems to a approximately 1.5 mTorr (1 Torr5133.322 Pa).Berthold LB 507B radioactivity monitor using aheterogeneous (i.e., solid scintillant) 150 ml solid 2.8. Ion-exchange LC–NMRyttrium glass flow cell (EG&G, Milton Keynes, UK).
1Ion-exchange H-LC–NMR was carried out using2.6. Reversed-phase analysis of GW273629 a Bruker DRX-600 spectrometer operating at 600.13
1 19MHz equipped with a dual H- F LC-flow probeInitial reversed-phase analysis of GW273629 was (cell 4 mm I.D with an active volume of approxi-
conducted on a Hewlett-Packard HP1100 binary mately 120 ml), coupled to a Bruker LC-22 quater-pumping liquid chromatograph (Waldbronn, Ger- nary pump together with a Berthold radiomonitormany) coupled to a Bruker Esquire ion-trap mass (see above). Chromatographic separations for LC–spectrometer (Bruker-Daltonics, Bremen, Germany), NMR were performed under the control of Brukerfitted with an atmospheric pressure ionisation (API) HyStar (v. 1.0) software operating in loop storage
14source. The column eluent was split 1 in 5, directing mode and/or stopped-flow mode. The C-radioac-approximately 50 ml /min to a pneumatically-assisted tivity signal, from the on-line radiochemical detector,electrospray interface. Nitrogen was used as the was connected to an analog input channel on thenebuliser gas at 40 p.s.i., and as the drying gas at a Bruker Hystar computer. Analytical chromatographyflow-rate of 8 l /min and a temperature of 2508C (1 was performed using system (ii), see above. Thep.s.i.56894.76 Pa). The mass spectrometer was column eluent was monitored using the Bertholdoperated in positive ion mode with a scan rate of radiomonitor and eluting peaks of interest were13 000 u per second and a range of 50–600 m /z. stored in the loops of the Bruker BPSU-36/BSFU-0Chromatographic separations were performed using peak sampling unit prior to transfer to the NMRsystem (i) as described. probe for analysis, or were transferred directly into
the probe in stopped flow operation. A schematic2.7. Ion-exchange LC–MS diagram of the configuration of this system is shown
in Fig. 2. The samples were recovered after analysisAll LC–MS experiments were conducted on a by LC–NMR to permit further analysis and addition-
1Hewlett-Packard Model 1050 quaternary pumping al spectra were recorded using a standard dual H-19system liquid chromatograph coupled in series to a F 5 mm NMR probe.
1 1Berthold radioactivity monitor (as above) and a H-NMR and H LC–NMR spectra were acquiredFinnigan-MAT TSQ-700 triple quadrupole mass using a standard NOESYPRESAT pulse sequencespectrometer (San Jose, CA, USA), with an API for solvent suppression with time shared doublesource. The API source heated metal capillary was pre-saturation of the water and acetonitrile frequen-maintained at 2208C for all analyses. Separations cies. In these experiments between 256 and 2048were performed using system (ii), described above. transients were acquired depending on sample con-The effluent from the on-line radiochemical detector centration into 64K data points over a spectral widthwas directed to a pneumatically-assisted electrospray of 12 019 Hz (20 ppm) giving a pulse repetition time
14interface, following a 1 in 10 flow split, and the C of 4.0 s. Prior to Fourier transformation, an exponen-radioactivity signal was connected to an analog input tial line broadening function of 0.3 Hz was appliedchannel on the TSQ-700 data system, allowing to each spectrum to improve the signal-to-noise ratio.
14 1simultaneous display of C and MS or MS–MS The H chemical shifts were referenced to acetoni-data. Full-scan positive ion mass spectra were ac- trile at d 2.0.quired over a mass range of 100–300 u and analysed Inverse gradient-selected hetero-nuclear multiple
1 13on a DEC station 5000/33 computer using Finnigan- bond correlation (HMBC) for H– C experimentsMAT ICIS software. MS–MS experiments were was performed on a Varian Inova 600, operating at
1 13based on collision-induced dissociations (CIDs) oc- 599.98 MHz for H and 149.998 MHz for Ccurring in the radio frequency (RF)-only collision observation. Typically 32 transients were acquiredcell of the triple quadrupole, with a collision energy into 4 or 8K data points over a spectral width of

G.J. Dear et al. / J. Chromatogr. B 748 (2000) 295 –309 299
positive ion electrospray ionisation. This HPLCsystem had a programmed linear increase in theorganic component of the mobile phase from 0 to100% over 30 min, thereby covering the entire rangeof analyte hydrophobicity.
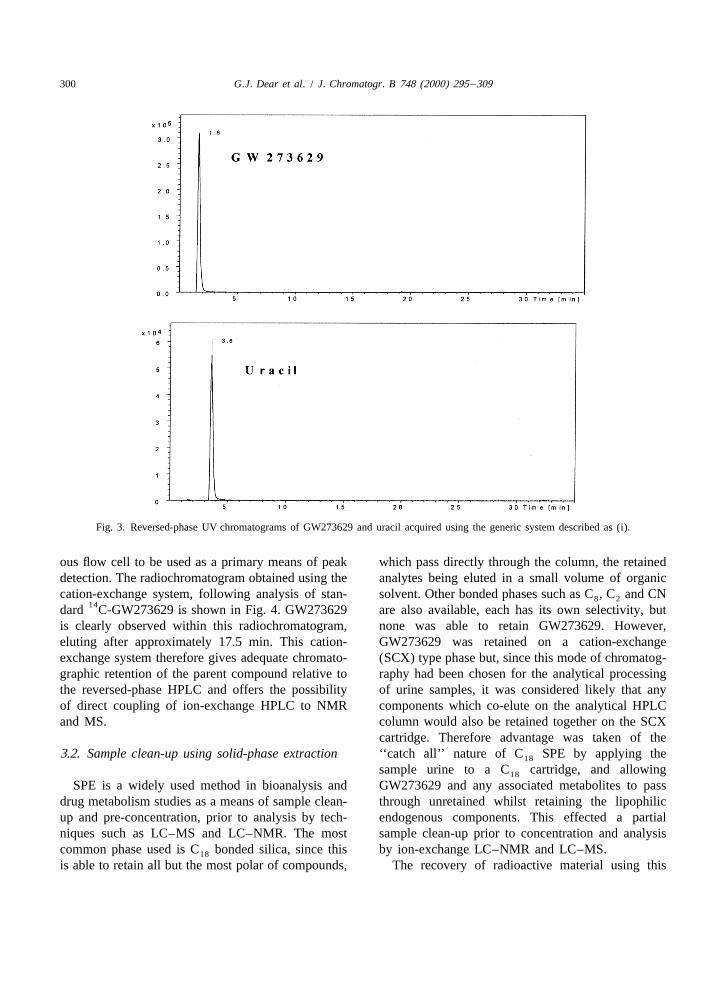
The extracted ion chromatogram obtained fromthis generic reversed-phase LC–MS analysis isshown in Fig. 3, compared with an extracted ionchromatogram of uracil acquired under identicalconditions. GW273629 eluted at 1.6 min and was
1detected as its MH ion at m /z 238, whilst uracil1eluted at 3.6 min and was observed as its MH ion
at m /z 113. This comparison was made becauseuracil is an extremely polar compound routinely usedas an unretained marker for t in reversed-phase0
HPLC analyses [11]. GW273629 eluted from thisreversed-phase HPLC system with the solvent front,exhibiting even less chromatographic retention thanuracil. Clearly GW273629, which has a log P ofapproximately 24, is not suitable for this type ofgeneric reversed-phase analysis due to its highlyhydrophilic nature.Fig. 2. Schematic diagram of LC–NMR configuration, with on-
line radiochemical detection.
3.1.2. Ion-exchange HPLC6948 Hz in the acquisition domain (F2). A total of Cation-exchange chromatography was performed128 complex increments were acquired to define the on an OmniPac PCX-100 analytical column, whichsecond hetero-nuclear dimension (F1), 200 ppm for has been developed to specifically allow the use of13C. The data was processed by application of a organic solvents in eluents for polymer-based ion-non-shifted cosine window apodisation function prior exchange separations. Since the stationary phase isto Fourier transformation in both dimensions. Refer- polymeric, ionic eluents in the pH range of 0–14 can
1ence one-dimensional H NOESYPRESAT experi- be used to alter the selectivity and convert molecularments were acquired into 98 304 data points over a species into ionic compounds. In addition, conven-spectral width of 15 009 Hz (25 ppm). A varying tional reversed-phase solvents can be used in thenumber of transients, 32 to 64 were acquired with a solvent systems to elute hydrophobic species, tomixing time of 100 ms and a total pulse repetition of dissolve certain sample matrices and to clean col-4.5 s. All proton chemical shifts were referenced to umns contaminated with organic contaminants.acetonitrile peak at 2.00 ppm. In the system used here, linear gradients of both
the organic solvent (acetonitrile) and the ionic eluent(ammonium formate and formic acid) were achieved
3. Results and discussion through the use of a quaternary pumping system.Traditionally, cation-exchange eluents have consisted
3.1. Selection of a chromatographic system for of non-volatile buffer solutions (e.g., phosphate), butanalysis of GW273629 here more volatile components such as ammonium
formate and formic acid, were employed, allowing3.1.1. Reversed-phase HPLC connection to the API interface of the mass spec-
In the absence of any significant UV chromophore, trometer without any deleterious effects (e.g., buildGW273629 standard was first analysed using a up of salts within the API interface).
14generic reversed-phase HPLC method (system (i)), The presence of a C-radiolabel in GW273629 incoupled to an ion trap spectrometer, operating with this study enabled a radiomonitor with a heterogen-
300 G.J. Dear et al. / J. Chromatogr. B 748 (2000) 295 –309
Fig. 3. Reversed-phase UV chromatograms of GW273629 and uracil acquired using the generic system described as (i).
ous flow cell to be used as a primary means of peak which pass directly through the column, the retaineddetection. The radiochromatogram obtained using the analytes being eluted in a small volume of organiccation-exchange system, following analysis of stan- solvent. Other bonded phases such as C , C and CN8 2
14dard C-GW273629 is shown in Fig. 4. GW273629 are also available, each has its own selectivity, butis clearly observed within this radiochromatogram, none was able to retain GW273629. However,eluting after approximately 17.5 min. This cation- GW273629 was retained on a cation-exchangeexchange system therefore gives adequate chromato- (SCX) type phase but, since this mode of chromatog-graphic retention of the parent compound relative to raphy had been chosen for the analytical processingthe reversed-phase HPLC and offers the possibility of urine samples, it was considered likely that anyof direct coupling of ion-exchange HPLC to NMR components which co-elute on the analytical HPLCand MS. column would also be retained together on the SCX
cartridge. Therefore advantage was taken of the3.2. Sample clean-up using solid-phase extraction ‘‘catch all’’ nature of C SPE by applying the18
sample urine to a C cartridge, and allowing18
SPE is a widely used method in bioanalysis and GW273629 and any associated metabolites to passdrug metabolism studies as a means of sample clean- through unretained whilst retaining the lipophilicup and pre-concentration, prior to analysis by tech- endogenous components. This effected a partialniques such as LC–MS and LC–NMR. The most sample clean-up prior to concentration and analysiscommon phase used is C bonded silica, since this by ion-exchange LC–NMR and LC–MS.18
is able to retain all but the most polar of compounds, The recovery of radioactive material using this

G.J. Dear et al. / J. Chromatogr. B 748 (2000) 295 –309 301
14Fig. 4. Ion-exchange radiochromatogram of C-GW273629 acquired using system (ii).
1procedure was determined to be approximately 80%. MH ions identified above are clearly discernible asSubsequent ion-exchange HPLC radiochromato- the base peak in each spectrum. The observed massgrams showed that there were no significant quali- difference of 42 between GW273629 and metabolitetative differences between the extracted and un- I is consistent with the incorporation of an acetylextracted urine. The associated UV chromatograms group (–CO-CH ) into GW273629.3
are compared in Fig. 5, and highlight the level of MS–MS spectra for GW273629 and metabolite I1sample clean-up obtained using this extraction proto- were similarly acquired, using the respective MH
col. ion as the precursor ion in each case (data notshown). Although the spectra exhibit product ions,
3.3. Ion-exchange LC–MS and LC–MS–MS which are qualitatively identical, slight differences inthe relative intensities were observed. However,
The on-line radiochromatogram obtained follow- these minor differences in the acquired MS–MSing injection of 10 ml of rat urine extract onto the spectra of GW273629 and metabolite I did notion-exchange HPLC system is shown in Fig. 6. The enable confirmation of the incorporation of an acetylpeak eluting at 19.2 min was assigned as unchanged group.GW273629, although this result differed from the
117.5 min retention time observed for GW273629 3.4. Directly coupled ion-exchange H-LC–NMRwhen injected as a standard solution (Fig. 4). Thisdifference was attributed to the buffering effect of In contrast to LC–MS, LC–NMR is a relativelythe sample matrix. The presence of a second major insensitive technique and requires microgram quan-radioactive peak at 5.9 min was assigned as a rat tities of analyte to be transferred into the probe forurine metabolite (metabolite I). This peak exhibited analysis, in order to achieve a suitable signal to noise
1an MH ion at m /z 280 which was 42 mass units in the spectrum within a reasonable time. It was1higher than the MH ion observed for standard therefore essential to scale up the amount of metabo-
GW272629. lite I that could be isolated by this chromatographicA comparison of the MS spectra of unchanged method in one single injection. However, it was
GW273629 and that of metabolite I, obtained direct- noted that when making a large injection of samplely from rat urine extract are shown in Fig. 7. The urine (.50 ml) onto the cation-exchange column the

302 G.J. Dear et al. / J. Chromatogr. B 748 (2000) 295 –309
Fig. 5. UV chromatograms (215 nm) of (a) unextracted 0–6 h rat urine and (b) extracted 0–6 h rat urine, acquired using system (ii).
Fig. 6. Ion-exchange radiochromatogram of extracted 0–6 h rat urine, acquired using system (ii).

G.J. Dear et al. / J. Chromatogr. B 748 (2000) 295 –309 303
Fig. 7. Positive ion electrospray spectra of GW273629 and metabolite I, identified in rat 0–6 h urine.
304 G.J. Dear et al. / J. Chromatogr. B 748 (2000) 295 –309
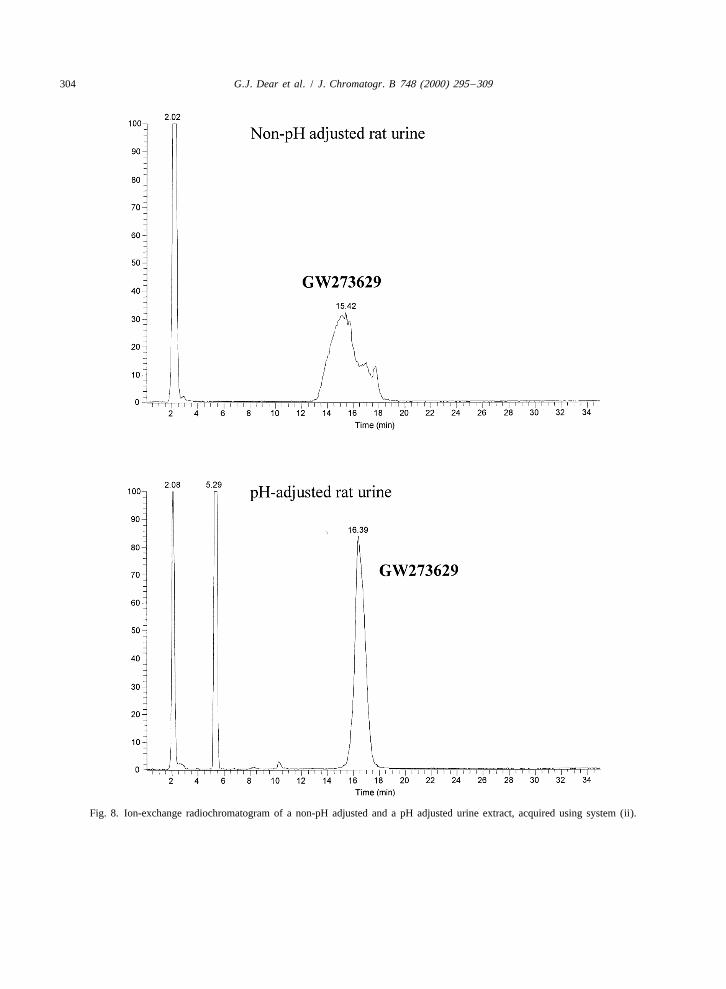
Fig. 8. Ion-exchange radiochromatogram of a non-pH adjusted and a pH adjusted urine extract, acquired using system (ii).

G.J. Dear et al. / J. Chromatogr. B 748 (2000) 295 –309 305
chromatographic performance decreased and the analytes to have an UV response in order to initiatepeak shape deteriorated. Adjustment of the pH of the actions by the controlling software. Unfortunatelyinjected sample by the addition of approximately 1% and perhaps unusually, neither GW273629 or its(v /v) formic acid was found to maintain chromato- metabolite (I), possess a chromophore and hence thegraphic performance and retain good peak shape. on-line radiomonitor was used for this purpose. It
The radiochromatograms of a non-pH adjusted and would have equally been possible to utilise the MSa pH adjusted injection of urine are shown in Fig. 8, or MS–MS response for this purpose, as we haveand clearly the peak shape of the non-pH adjusted shown in the other paper in this edition, but thesample is much broader than that of the adjusted presence of a radiolabel in GW273629 offered ansample. This observation may be attributable to the attractive alternative.
1fact that when a large injection volume (.50 ml) is The annotated H-NMR spectrum resulting frommade, the sample can account for greater than 4% of the stopped flow ion-exchange LC–NMR experimentthe column volume. As a result, for a small period of following injection of 100 ml of rat urine extract istime, the sample becomes its own mobile phase, shown in Fig. 9. The presence of drug-relatedcausing significant chromatographic band broaden- material was readily discernible and confirmed thating. the molecule was intact and without any substitution
The ion-exchange LC–NMR system shown in Fig. into the molecule. The incorporation of an N-acetyl2 relied entirely on the on-line radiochemical de- function into the molecule could not be confirmed
1tection to operate the software and stop the peak of directly from the H-NMR spectrum since the regioninterest in the NMR probe. Control of the chromato- of the spectrum where the resonance from the N-graphic system in LC–NMR usually requires the acetyl methyl protons appear are masked by the
1Fig. 9. H-LC–NMR spectrum of metabolite I in rat 0–6 h urine, acquired in stop-flow mode.

306 G.J. Dear et al. / J. Chromatogr. B 748 (2000) 295 –309
1 2Fig. 10. H-NMR spectra (in H O) of (a) authentic GW273629, (b) the authentic N-acetyl analogue and (c) metabolite I, as isolated from2
rat 0–6 h urine by LC–NMR.

G.J. Dear et al. / J. Chromatogr. B 748 (2000) 295 –309 307
Fig. 11. Assignment of the NMR proton signals of GW273629 and metabolite I (see Fig. 10).
acetonitrile peak at d 2.0, arising from the HPLC spectrum of GW273629 confirming the MS evi-mobile phase. This limitation to the application of dence.ion-exchange LC–NMR, peculiar to this specific Additionally the methine CH (proton e) observedmetabolic outcome may have been overcome with at d 4.42 in GW273629 has shifted to d 4.70 inthe development of an alternative methanol-based metabolite I. This suggests that acetylation hasseparation system, where the residual signals would occurred at the a-amine as opposed to the amidine
1have left the acetyl region free of background group. From the combined MS and H-NMR data itsignals. is possible to deduce the structure of metabolite I
A simpler more rapid solution to the problem was (see Fig. 11).to recover the peak trapped in the LC–NMR probe, Final structural confirmation was provided by
1remove the solvent under a stream of dry nitrogen comparison of the H-NMR spectrum of metabolite Iand re-suspend the residue in pure deuterium oxide. with that of authentic N-acetyl standard, where there
1The resulting H-NMR spectrum, free of masking was good agreement (Fig. 10b and c). The chemicalsignals in the acetyl region, is shown in Fig. 10c shifts and assignments for parent drug, metabolite I
1together with the H-NMR spectra of authentic and the authentic N-acetyl analogue are given inparent drug, Fig. 10a, and synthetic N-acetyl ana- Table 1. Confirmation of the structure of the N-acetyl
1 13logue Fig. 10b, acquired in the same solvent under authentic standard was obtained by a H– C inverseidentical conditions. HMBC experiment (see Fig. 12). In this experiment
1A comparison of the H-NMR spectrum of the methine CH proton (e) at d 4.70 and the methylGW273629 with that obtained for the isolated metab- proton (f) at d 2.0 gave a long-range correlation to
13olite I (Fig. 10a and c) immediately highlights the the carbonyl at d 175.2 in the C spectrum confirm-presence of the additional methyl peak of the N- ing the structure of the chemically synthesisedacetyl group at d 2.0 which is not present in the metabolite. In the metabolism of primary amines and
Table 1Chemical shifts and assignments for GW273629, metabolite I and the authentic N-acetyl analogue
a b c d e f
GW273629 2.2 3.82 3.69 3.80&3.98 4.42 –s J56.0 Hz J56.0 Hz J516.2, 3.6 and 8.4 Hz
Metabolite M1 2.2 3.79 3.58 3.61&3.8 4.70 2.0s m m J515.9, 3.6 and 9.2 Hz J53.6 and 9.2 Hz
Authentic N-acetyl standard 2.2 3.79 3.58 3.61&3.8 4.70 2.0s m m J515.9, 3.6 and 9.2 Hz J53.6 and 9.2 Hz
308 G.J. Dear et al. / J. Chromatogr. B 748 (2000) 295 –309
1 13Fig. 12. H– C inverse hetero-nuclear multiple bond correlation (HMBC) spectrum of authentic N-acetyl analogue.
secondary amines acetylation is a well-documented approach specifically designed for ionic polar drugsmetabolic transformation [12]. In particular N- and their metabolites.acetylation of S-substituted cysteines, such as S-benzyl-L-cysteine, has been shown by rat liver andkidney microsomal N-acetyltransferase preparation Acknowledgements[13], and therefore as GW273629 is an S-substitutedcysteine the formation of an N-acetyl metabolite is The authors would like to thank Dr. Peter Scott for
14consistent with the literature data. the synthesis of C-GW273629 and Drs. RichardCarr and Chris Bevan for many useful discussions.
4. ConclusionsReferences
Ion-exchange LC–MS and LC–NMR have been[1] M.S. Lee, E.H. Kerns, M.E. Hali, J. Liu, L.J. Volk, LC?GC
successfully used to identify a novel N-acetyl metab- Int. September (1997) p. 586.olite of a highly polar drug candidate molecule. The [2] M. Mitchard, in: J.W. Gorrod, A.H. Beckett (Eds.), Druguse of a simple volatile ionic strength buffer like Metabolism in Man, Taylor and Francis, London, 1978, p.
175.ammonium formate / formic acid together with an[3] T. Baille, in: Proceedings of the 42nd ASMS Conference onorganic solvent, as employed here, should be suitable
Mass Spectrometry and Applied Topics, Chicago, IL, 29for the analysis of other charged polar species. May–3 June 1994.Optimisation of the system described could result in [4] J.C. Lindon, J.K. Nicholson, U.G. Sidelmann, I.D. Wilson,the development of a high-throughput generic HPLC Drug Metab. Rev. 29 (3) (1997) 705.
G.J. Dear et al. / J. Chromatogr. B 748 (2000) 295 –309 309
[5] J.P. Shocker, S.E. Unger, I.D. Wilson, P.J. Foxall, J.K. [9] R. Schwarzenbach, J. Liq. Chromatogr. 2 (1979) 205.Nicholson, J.C. Lindon, Anal. Chem. 68 (1997) 4431. [10] A.A. Reilly, R. Bellisario, K.A. Pass, Clin. Chem. 42 (2)
[6] G.J. Dear, J. Ayrton, R. Plumb, B.C. Sweatman, I. Ismail, (1998) 317.I.J. Fraser, P.J. Mutch, Rapid Commun. Mass Spectrom. 12 [11] G. Guansajonz, G. Guiochon, J. Chromatogr. 743 (1996)(1998) 2023. 247.
[7] J. Ayrton, G.J. Dear, W.J. Leavens, D.N. Mallet, R.S. Plumb, [12] G.G. Gibson, P. Skett, Introduction to Drug Metabolism,J. Chromatogr. B 709 (1998) 243. Chapman and Hall, London, New York, 1986.
[8] Y. Yokoyama, T. Amaki, S. Horikoshi, H. Sato, Anal. Sci. 13 [13] R.M. Green, J.S. Elce, Biochem. J. 147 (1975) 283.(6) (1997) 963.