Hypnotic suggestibility, cognitive inhibition, and dissociation
Tc
PD
a
ARAA
KpGHAT
1
dfcldpcid
edt
B
nT
0h
Journal of Pharmaceutical and Biomedical Analysis 94 (2014) 180–187
Contents lists available at ScienceDirect
Journal of Pharmaceutical and Biomedical Analysis
j o ur nal ho me page: www.elsev ier .com/ lo cate / jpba
he simultaneous determination of hydrophobicity and dissociationonstant by liquid chromatography–mass spectrometry�
. Wiczling ∗, W. Struck-Lewicka, Ł. Kubik, D. Siluk, M.J. Markuszewski, R. Kaliszanepartment of Biopharmaceutics and Pharmacodynamics, Medical University of Gdansk, Gen. J. Hallera 107, 80-416 Gdansk, Poland
r t i c l e i n f o
rticle history:eceived 31 October 2013ccepted 23 January 2014vailable online 31 January 2014
eywords:H/organic modifierradient RP HPLCydrophobicitycidityhroughput analysis
a b s t r a c t
Convenient methods for testing drug candidates’ lipophilicity and acidity are highly requested in mod-ern pharmaceutical research and drug development strategies. Reversed-phase high-performance liquidchromatography (RP HPLC) might be particularly useful for the determination of both dissociation con-stant and the (pH-dependent) partition coefficient related parameters, applicable in high-throughputanalysis of multi-component mixtures. The general theory of combined pH/organic modifier gradienthas recently provided equations relating gradient retention time and pH of the mobile phase. The pur-pose of this work was to facilitate the identification of analytes in this technique by its transfer to RPHPLC coupled with time-of-flight mass spectrometry with electrospray ionization source (ESI-TOF-MS).The accuracy of the proposed methodology was assessed by analyzing a set of known drugs. The ammo-nium formate, ammonium acetate or ammonium bicarbonate buffers were used to control pH during
chromatographic analysis. In result, the pKa and hydrophobicity parameters were determined and theaccuracy of the estimated values was assessed by comparing them with literature data. The gradient RPHPLC coupled with ESI-TOF-MS methods allowed for the rapid determination of dissociation constant andhydrophobicity and was shown to be especially applicable for complex mixtures. The use of ESI-TOF-MSdetection allowed to achieve the medium-throughput screening rate (100 compounds/day) and provideda simple approach to assess pharmacokinetically important physicochemical properties of drugs.. Introduction
A large number of compounds can be synthesized during therug development process, which are then processed and screenedor specific properties of interest to obtain the best possible drugandidates. Dissociation constant, pKa, lipophilicity parameters,ike log P – logarithm of n-octanol–water partition coefficient andistribution coefficient, log D, of a drug (drug candidate) are of arimary concern in medicinal chemistry. Determination and/or cal-ulation of those parameters at the early stage of studies can helpn eliminating those molecules that are unlikely to become drugsue to their poor pharmacokinetic properties [1–5].
Lipophilicity is strictly connected with pharmacological prop-
rties of a substance, such as biological activity and toxicity. Itescribes an ability of a chemical compound to partition betweenwo-immiscible liquids and is defined as an equilibrium reaction of� Selected Paper presented at the 24th Symposium on Pharmaceutical andiomedical Analysis, Bologna, Italy, 2013.∗ Corresponding author at: Department of Biopharmaceutics and Pharmacody-amics, Medical University of Gdansk, ul. Hallera 107, 80-416, Gdansk, Poland.el.: +48 58 349 3260; fax: +48 58 349 3262.
E-mail address: [email protected] (P. Wiczling).
731-7085/$ – see front matter © 2014 Elsevier B.V. All rights reserved.ttp://dx.doi.org/10.1016/j.jpba.2014.01.038
© 2014 Elsevier B.V. All rights reserved.
this two-phase distribution. For ionizing compounds distributioncoefficient D is used to take into consideration the pH-dependenceof partitioning [6]. log P and log D can be determined for differ-ent systems, however the n-octanol/water is believed to be themost reliable one, because it is congenial to the conditions thatexist at the interface of the cell membrane [7]. The most commonmethods of log P determination are direct methods (shake-flask,slow stirring method), filter probe method, pH metric (poten-tiometric) method, calculation methods (regressions with otherproperties, theoretical calculation with fragmental approach) andreversed-phase high performance liquid chromatographic meth-ods (RP-HPLC) [8–10]. Since the partitioning of molecule dependson the charge-state of the molecule, the knowledge about the pKa
is also useful in predicting pharmacokinetic properties [11]. Themost common methods of pKa calculation are pH-metric (poten-tiometric) titration, spectrophotometric, capillary electrophoresisor RP-HPLC methods [12,13].
Currently, most desired are methods which allow for the simul-taneous determination of log P, log D and pKa with high accuracyand speed. The method that can be readily used for that purpose
is RP-HPLC. The chromatographic retention depends mostly on thehydrophobic interactions between molecule and solvent that arethe consequence of water “phobicity” to molecule (or its parts)[14,15]. Hydrophobicity is often measured as a retention factor of an
cal and
aifdbifc
baadhaafa
ymmmItrip
saopRwTasho
2
naccpppdpmGfnS((oaiot
P. Wiczling et al. / Journal of Pharmaceuti
nalyte extrapolated to neat water as an eluent, log kw. Generally, its well correlated with n-octanol/water lipophilicity although dif-erent nature of both partition systems leads to some unavoidableissimilarities [7]. The hydrogen bond acidity of a molecule haseen shown to be a major factor contributing to the differences
n lipophilicity measures observed in different biphasic systemsor example octanol/water and alkane/water or octanol/water andhromatographic one [16,17]
The hydrophobicity (log kw) and pKa values can be determinedy studying the relationship between retention times obtainedt different mobile phase compositions whenever an appropri-te mathematical model is known. The numerous models andesigns have already been proposed for the purpose of pKa andydrophobicity determination using RP-HPLC. They mostly involven isocratic and pH-gradient mode [18–28]. The high-throughputpplication of these modes is limited due to the fact that onlyew analytes can be analyzed simultaneously and a considerablemount of time is required to gather required data.
The RP-HPLC is particularly useful for multicomponent anal-sis especially when performed in an organic modifier gradientode [11,29,30]. Typically it involves a series of wide range organicodifier gradients at varying gradient duration and pH of theobile phase [11,29,31]. The Chromatographic Hydrophobicity
ndex (CHI) has been proposed in literature as a scale closely relatedo hydrophobicity [32,33]. CHI is obtained from the short-gradientetention time and scaled to lipophilicity, basing on a series of cal-bration compounds. A similar medium-to-high-throughput HPLCKa assay was proposed and used in laboratory settings [34].
Generally when applying a classical UV detection it was not pos-ible to analyze a complex mixture due to difficulties in obtaining
distinct separation of the components and proper identificationf analytes peaks and retention times at different pH. The pur-ose of this work was to apply the previously proposed gradientP HPLC method of pKa and log kw determination and combine itith electrospray ionization time-of-flight mass spectrometry (ESI-
OF-MS) detection. The use of ESI-TOF-MS detection techniquellows for an easy peak tracking, analyte identification, and in con-equence for the rapid determination of dissociation constant andydrophobicity based on the one of the currently available modelsf chromatographic retentions.
. Chemicals
The 40 reference substances (salicylic acid, paracetamol,icotine, metronidazole, theophylline, clonidine, naproxene,minophenazone, phenobarbital, lidocaine, procainamide, pro-aine, pindolol, cimetidine, diphenhydramine, nortriptyline, tetra-aine, metoprolol, chlorpheniramine, amitriptyline, imipramine,romethazine, diclofenac, metoclopramide, cocaine, warfarine,henylbutazone, chlorprotixene, chlorpromazine, quinidine, cloza-ine, papaverine, disopyramide, haloperidol, celiprolol, prazosine,iltiazem, bretylium tosylate, verapamil and ketoconazole) wereurchased from Sigma–Aldrich (St. Louis, MO, USA). HPLC-gradeethanol for LC–MS was obtained from J.T. Baker (Griesheim,ermany), formic acid 97% and acetic acid 99% were purchased
rom Alfa Aesar GMbH & Co KG (Karlsruhe, Germany), ammo-ium formate, ammonium bicarbonate, tetrahydrofuran were fromigma–Aldrich (St. Louis, MO, USA) and ammonia was from POCHGliwice, Poland). Deionized water from a Milli-Q water systemMillipore Inc., Bedford, MA, USA) was used in the preparationf the samples and buffer solutions. All the reagents and the
nalytes employed were of a highest commercially available qual-ty. The bretylium tosylate has been used to assess the repeatabilityf retention times for different pHs of the mobile phase. The ioniza-ion of either the bretylium cation or tosylate anion does not changeBiomedical Analysis 94 (2014) 180–187 181
with pH. Thus its retention should be constant at different pHs.The analytes were selected to have a “gold-standard” pKa valuesand when possible the “gold-standard” values of n-octanol/waterlog P for both ionized and nonionized form of analytes. They wereextracted from Avdeef at al. [6] and Physical/Chemical Propertydatabase [35].
2.1. HPLC equipment
The experiments were carried out using liquid chromatographytime-of-flight mass spectrometry (LC-TOF-MS) system from Agi-lent Technologies (Santa Clara, CA, USA) 1260 series, composed ofa binary pump, an autosampler, a membrane degasser and a 6224time of flight (TOF) mass spectrometer. The TOF mass spectrometerwas equipped with a dual electrospray ionization source (Dual ESI).Analyses were performed in fast polarity switching mode. The neb-ulizer pressure and capillary voltage were set at 50 psi and 4000 V,respectively. Nitrogen was used as a drying gas (11 L/min, 350 ◦C).The fragmentor, skimmer and octopole voltage was set as 84 V, 65 Vand 750 V, respectively.
For separation of the analytes an XBridge-C18 column(3 mm × 50 mm, 2.5 �m) from Wexford, Ireland) was used. Thechromatographic separation was performed using 3 differentbuffers that were used to achieve the mobile phase pH spanning awide range of pHs: from 2.50 to 10.50. Two series (I and II) of exper-iments were performed. The organic modifier gradients in series Iwas developed from 5% to 80% of methanol in buffer (v/v) from 0 till10 min and composition of the eluent was held at 80% of methanolfrom 10 till 16 min. The series II comprised gradient program thatstarted from 5% to 80% of B from 0 till 30 min and was held at 80%of methanol from 30 till 36 min. After each analysis, the 3.5 minpost-run program was started, keeping the system at initial con-ditions in order to equilibrate the analytical column for the nextanalysis. Citric acid was injected to determine the column follow-up volume, Vo, which was 0.266 mL. The system dwell volume Vdequaled 1.05 mL. The extra column volume equaled 0.020 mL. Itserved to find the extra column time that has been subtracted fromall the retention times prior to any calculation. The injection volumewas 2 �L, the flow rate (F) and the column temperature were set at0.5 mL/min and 25 ◦C, respectively. The analyses were performedin a scan mode using 50–1200 m/z range.
3. Samples and buffers preparation
Each reference substance was prepared at a concentration of1 mg/mL by diluting the weighted substance in deionized water.Those samples that had limited solubility in water, were dilutedin water with the addition of tetrahydrofuran. Subsequently, allsubstances were mixed together into one sample used for furtheranalysis. After sample preparation, it was frozen immediately andstored at −20 ◦C. Directly before analysis, sample was thawed atroom temperature. Three buffers: ammonium formate, ammoniumacetate and ammonium bicarbonate were prepared at a concen-tration of 10 mM by diluting the weighed substances in deionizedwater. The w
wpH (this symbol denotes pH measured in water with-out addition of any organic modifier) of those buffers was adjustedto span wide range of values (ammonium formate: 2.5, 3.3, 4.1,8.9, 9.7; ammonium acetate: 4.9, 5.8; and ammonium bicarbon-ate: 6.8, 10.5) by appropriate addition of formic acid, acetic acidand ammonia, respectively. After buffers’ preparation, they werefiltered using 0.40 �m nylon filters and degassed. The RP-HPLC
separation requires the use of organic modifier that is known toaffect the pH values of the buffers [36,37]. The details of proper pHmeasurements in the organic/water mobile phase are discussed byRoses [38]. Briefly, the pH of the mobile phase was measured after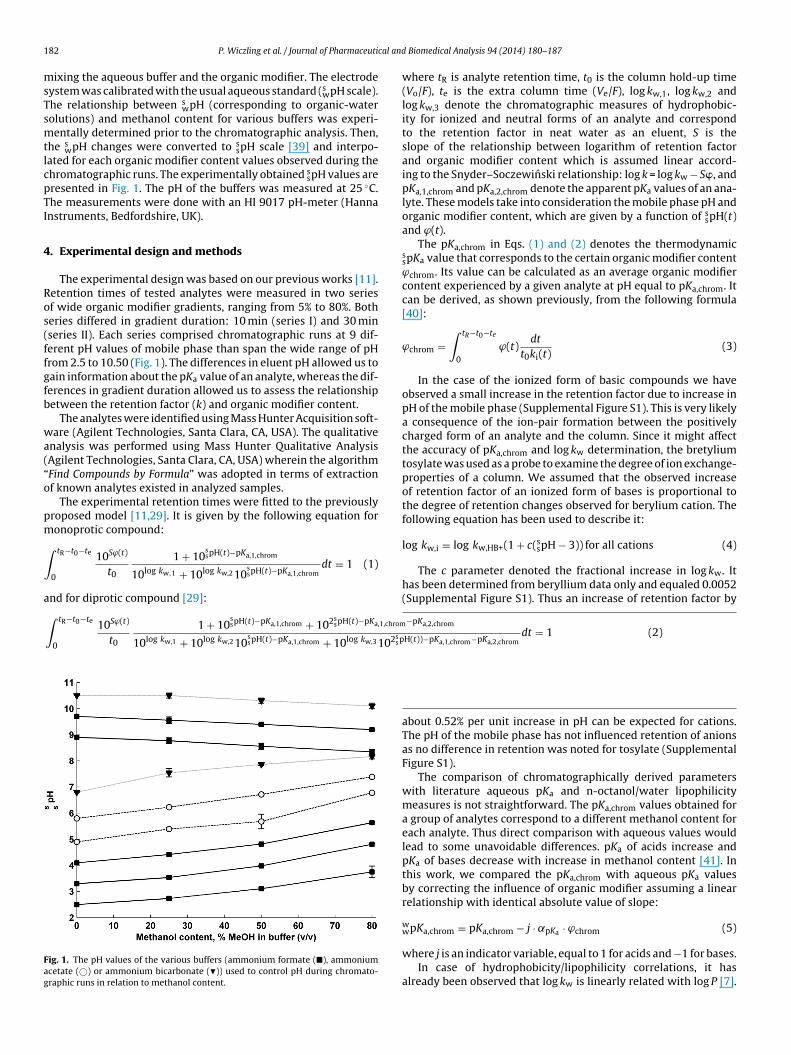
1 cal and
msTsmtlcpTI
4
Ros(ffgfb
wa(“o
pm
∫
a
Fag
82 P. Wiczling et al. / Journal of Pharmaceuti
ixing the aqueous buffer and the organic modifier. The electrodeystem was calibrated with the usual aqueous standard (s
wpH scale).he relationship between s
wpH (corresponding to organic-waterolutions) and methanol content for various buffers was experi-entally determined prior to the chromatographic analysis. Then,
he swpH changes were converted to s
spH scale [39] and interpo-ated for each organic modifier content values observed during thehromatographic runs. The experimentally obtained s
spH values areresented in Fig. 1. The pH of the buffers was measured at 25 ◦C.he measurements were done with an HI 9017 pH-meter (Hannanstruments, Bedfordshire, UK).
. Experimental design and methods
The experimental design was based on our previous works [11].etention times of tested analytes were measured in two seriesf wide organic modifier gradients, ranging from 5% to 80%. Botheries differed in gradient duration: 10 min (series I) and 30 minseries II). Each series comprised chromatographic runs at 9 dif-erent pH values of mobile phase than span the wide range of pHrom 2.5 to 10.50 (Fig. 1). The differences in eluent pH allowed us toain information about the pKa value of an analyte, whereas the dif-erences in gradient duration allowed us to assess the relationshipetween the retention factor (k) and organic modifier content.
The analytes were identified using Mass Hunter Acquisition soft-are (Agilent Technologies, Santa Clara, CA, USA). The qualitative
nalysis was performed using Mass Hunter Qualitative AnalysisAgilent Technologies, Santa Clara, CA, USA) wherein the algorithmFind Compounds by Formula” was adopted in terms of extractionf known analytes existed in analyzed samples.
The experimental retention times were fitted to the previouslyroposed model [11,29]. It is given by the following equation foronoprotic compound:
tR−t0−te
0
10Sϕ(t)
t0
1 + 10sspH(t)−pKa,1,chrom
10log kw,1 + 10log kw,2 10sspH(t)−pKa,1,chrom
dt = 1 (1)
nd for diprotic compound [29]:
∫ tR−t0−te
0
10Sϕ(t)
t0
1 + 10sspH(t)−pKa,1,chrom + 102s
spH(t)−pKa,1,chrom
10log kw,1 + 10log kw,2 10sspH(t)−pKa,1,chrom + 10log kw,3 102s
sp
ig. 1. The pH values of the various buffers (ammonium formate (�), ammoniumcetate (©) or ammonium bicarbonate (�)) used to control pH during chromato-raphic runs in relation to methanol content.
Biomedical Analysis 94 (2014) 180–187
−pKa,2,chrom
H(t))−pKa,1,chrom−pKa,2,chromdt = 1 (2)
where tR is analyte retention time, t0 is the column hold-up time(Vo/F), te is the extra column time (Ve/F), log kw,1, log kw,2 andlog kw,3 denote the chromatographic measures of hydrophobic-ity for ionized and neutral forms of an analyte and correspondto the retention factor in neat water as an eluent, S is theslope of the relationship between logarithm of retention factorand organic modifier content which is assumed linear accord-ing to the Snyder–Soczewinski relationship: log k = log kw − S�, andpKa,1,chrom and pKa,2,chrom denote the apparent pKa values of an ana-lyte. These models take into consideration the mobile phase pH andorganic modifier content, which are given by a function of s
spH(t)and ϕ(t).
The pKa,chrom in Eqs. (1) and (2) denotes the thermodynamicsspKa value that corresponds to the certain organic modifier contentϕchrom. Its value can be calculated as an average organic modifiercontent experienced by a given analyte at pH equal to pKa,chrom. Itcan be derived, as shown previously, from the following formula[40]:
ϕchrom =∫ tR−t0−te
0
ϕ(t)dt
t0ki(t)(3)
In the case of the ionized form of basic compounds we haveobserved a small increase in the retention factor due to increase inpH of the mobile phase (Supplemental Figure S1). This is very likelya consequence of the ion-pair formation between the positivelycharged form of an analyte and the column. Since it might affectthe accuracy of pKa,chrom and log kw determination, the bretyliumtosylate was used as a probe to examine the degree of ion exchange-properties of a column. We assumed that the observed increaseof retention factor of an ionized form of bases is proportional tothe degree of retention changes observed for berylium cation. Thefollowing equation has been used to describe it:
log kw,i = log kw,HB+(1 + c(sspH − 3)) for all cations (4)
The c parameter denoted the fractional increase in log kw. Ithas been determined from beryllium data only and equaled 0.0052(Supplemental Figure S1). Thus an increase of retention factor by
about 0.52% per unit increase in pH can be expected for cations.The pH of the mobile phase has not influenced retention of anionsas no difference in retention was noted for tosylate (SupplementalFigure S1).
The comparison of chromatographically derived parameterswith literature aqueous pKa and n-octanol/water lipophilicitymeasures is not straightforward. The pKa,chrom values obtained fora group of analytes correspond to a different methanol content foreach analyte. Thus direct comparison with aqueous values wouldlead to some unavoidable differences. pKa of acids increase andpKa of bases decrease with increase in methanol content [41]. Inthis work, we compared the pKa,chrom with aqueous pKa valuesby correcting the influence of organic modifier assuming a linearrelationship with identical absolute value of slope:
wpKa,chrom = pKa,chrom − j · ˛pK · ϕchrom (5)
w awhere j is an indicator variable, equal to 1 for acids and −1 for bases.In case of hydrophobicity/lipophilicity correlations, it has
already been observed that log kw is linearly related with log P [7].
P. Wiczling et al. / Journal of Pharmaceutical and Biomedical Analysis 94 (2014) 180–187 183
F se fors
Ia
woaataltlm
l
do
aiwt
5
lha2
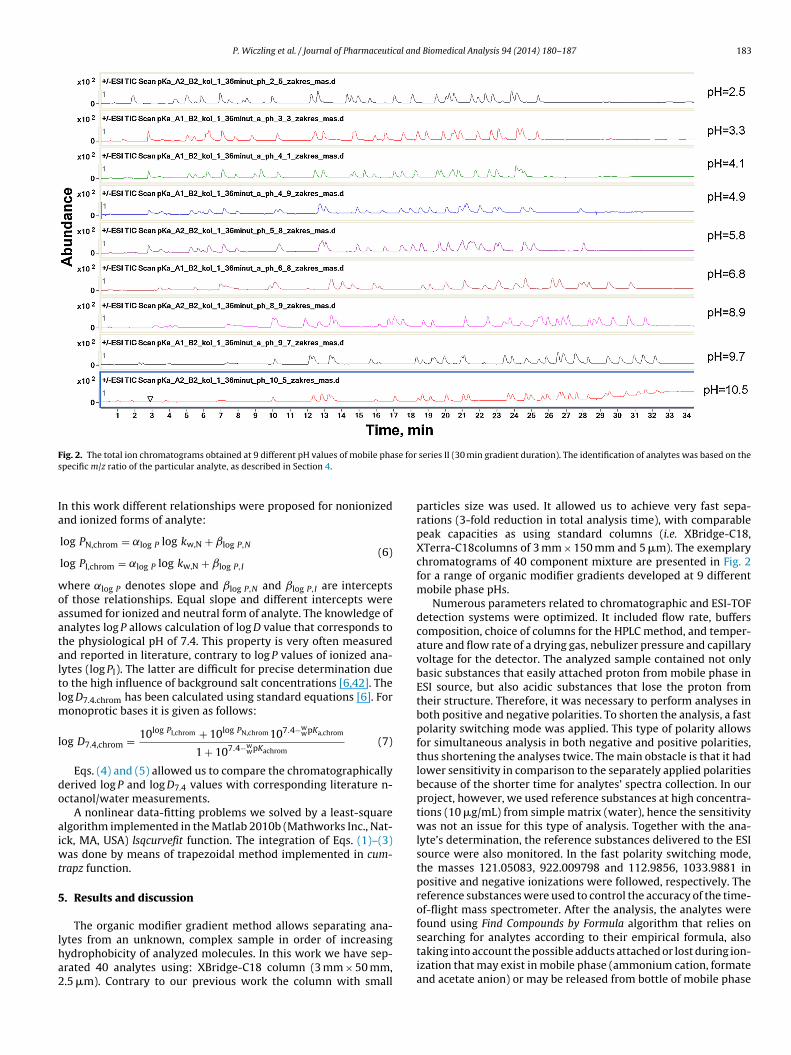
ig. 2. The total ion chromatograms obtained at 9 different pH values of mobile phapecific m/z ratio of the particular analyte, as described in Section 4.
n this work different relationships were proposed for nonionizednd ionized forms of analyte:
log PN,chrom = ˛log P log kw,N + ˇlog P,N
log PI,chrom = ˛log P log kw,N + ˇlog P,I
(6)
here ˛log P denotes slope and ˇlog P,N and ˇlog P,I are interceptsf those relationships. Equal slope and different intercepts weressumed for ionized and neutral form of analyte. The knowledge ofnalytes log P allows calculation of log D value that corresponds tohe physiological pH of 7.4. This property is very often measurednd reported in literature, contrary to log P values of ionized ana-ytes (log PI). The latter are difficult for precise determination dueo the high influence of background salt concentrations [6,42]. Theog D7.4.chrom has been calculated using standard equations [6]. For
onoprotic bases it is given as follows:
og D7.4,chrom = 10log PI,chrom + 10log PN,chrom 107.4−wwpKa,chrom
1 + 107.4−wwpKachrom
(7)
Eqs. (4) and (5) allowed us to compare the chromatographicallyerived log P and log D7.4 values with corresponding literature n-ctanol/water measurements.
A nonlinear data-fitting problems we solved by a least-squarelgorithm implemented in the Matlab 2010b (Mathworks Inc., Nat-ck, MA, USA) lsqcurvefit function. The integration of Eqs. (1)–(3)
as done by means of trapezoidal method implemented in cum-rapz function.
. Results and discussion
The organic modifier gradient method allows separating ana-
ytes from an unknown, complex sample in order of increasingydrophobicity of analyzed molecules. In this work we have sep-rated 40 analytes using: XBridge-C18 column (3 mm × 50 mm,.5 �m). Contrary to our previous work the column with smallseries II (30 min gradient duration). The identification of analytes was based on the
particles size was used. It allowed us to achieve very fast sepa-rations (3-fold reduction in total analysis time), with comparablepeak capacities as using standard columns (i.e. XBridge-C18,XTerra-C18columns of 3 mm × 150 mm and 5 �m). The exemplarychromatograms of 40 component mixture are presented in Fig. 2for a range of organic modifier gradients developed at 9 differentmobile phase pHs.
Numerous parameters related to chromatographic and ESI-TOFdetection systems were optimized. It included flow rate, bufferscomposition, choice of columns for the HPLC method, and temper-ature and flow rate of a drying gas, nebulizer pressure and capillaryvoltage for the detector. The analyzed sample contained not onlybasic substances that easily attached proton from mobile phase inESI source, but also acidic substances that lose the proton fromtheir structure. Therefore, it was necessary to perform analyses inboth positive and negative polarities. To shorten the analysis, a fastpolarity switching mode was applied. This type of polarity allowsfor simultaneous analysis in both negative and positive polarities,thus shortening the analyses twice. The main obstacle is that it hadlower sensitivity in comparison to the separately applied polaritiesbecause of the shorter time for analytes’ spectra collection. In ourproject, however, we used reference substances at high concentra-tions (10 �g/mL) from simple matrix (water), hence the sensitivitywas not an issue for this type of analysis. Together with the ana-lyte’s determination, the reference substances delivered to the ESIsource were also monitored. In the fast polarity switching mode,the masses 121.05083, 922.009798 and 112.9856, 1033.9881 inpositive and negative ionizations were followed, respectively. Thereference substances were used to control the accuracy of the time-of-flight mass spectrometer. After the analysis, the analytes werefound using Find Compounds by Formula algorithm that relies on
searching for analytes according to their empirical formula, alsotaking into account the possible adducts attached or lost during ion-ization that may exist in mobile phase (ammonium cation, formateand acetate anion) or may be released from bottle of mobile phase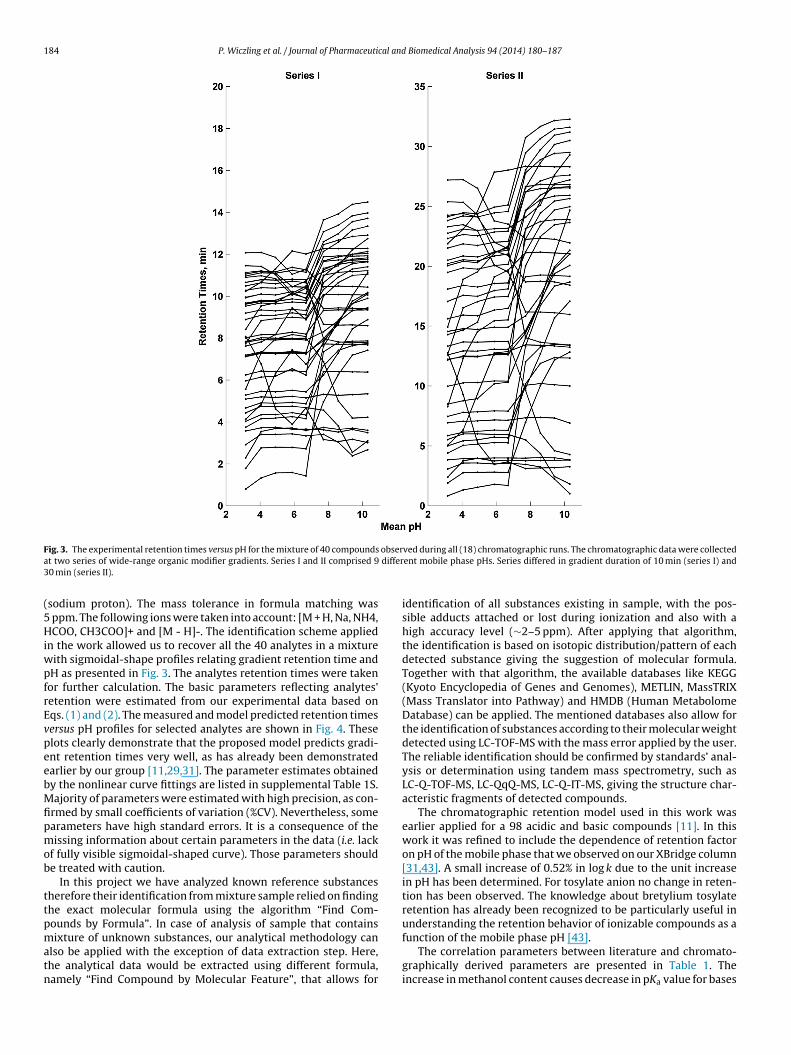
184 P. Wiczling et al. / Journal of Pharmaceutical and Biomedical Analysis 94 (2014) 180–187
F obsera differ3
(5HiwpfrEvpeebMfipmob
ttpmatn
ig. 3. The experimental retention times versus pH for the mixture of 40 compoundst two series of wide-range organic modifier gradients. Series I and II comprised 90 min (series II).
sodium proton). The mass tolerance in formula matching was ppm. The following ions were taken into account: [M + H, Na, NH4,COO, CH3COO]+ and [M - H]-. The identification scheme applied
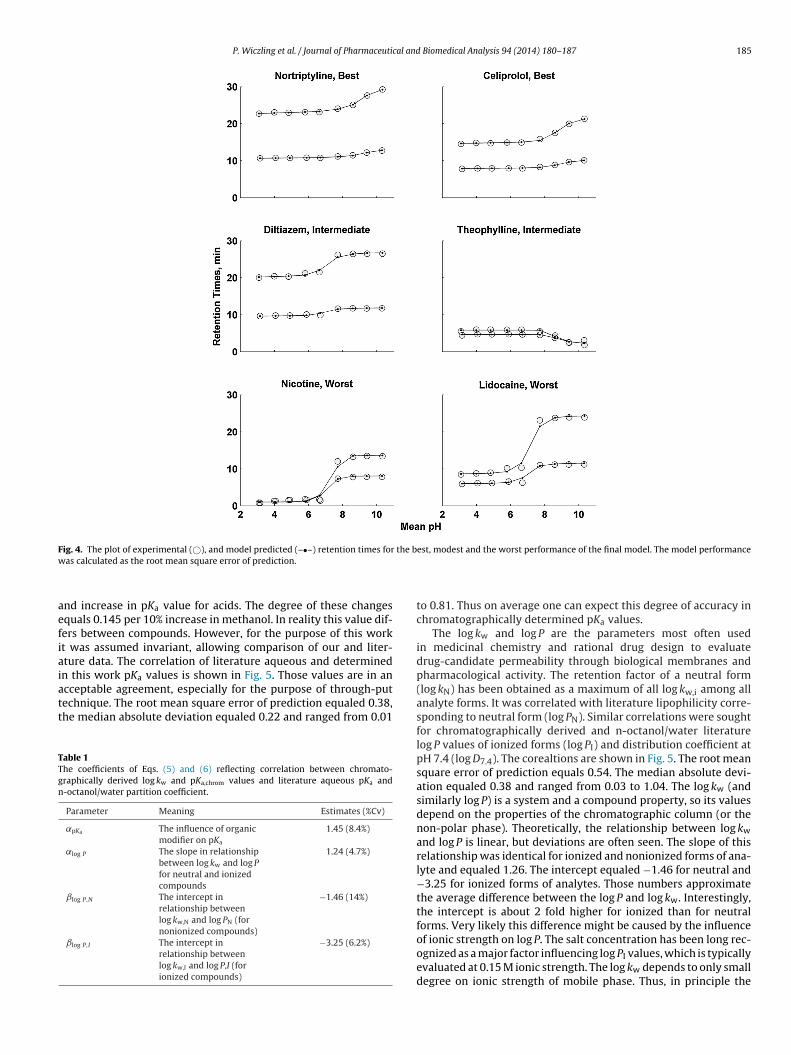
n the work allowed us to recover all the 40 analytes in a mixtureith sigmoidal-shape profiles relating gradient retention time andH as presented in Fig. 3. The analytes retention times were takenor further calculation. The basic parameters reflecting analytes’etention were estimated from our experimental data based onqs. (1) and (2). The measured and model predicted retention timesersus pH profiles for selected analytes are shown in Fig. 4. Theselots clearly demonstrate that the proposed model predicts gradi-nt retention times very well, as has already been demonstratedarlier by our group [11,29,31]. The parameter estimates obtainedy the nonlinear curve fittings are listed in supplemental Table 1S.ajority of parameters were estimated with high precision, as con-
rmed by small coefficients of variation (%CV). Nevertheless, somearameters have high standard errors. It is a consequence of theissing information about certain parameters in the data (i.e. lack
f fully visible sigmoidal-shaped curve). Those parameters shoulde treated with caution.
In this project we have analyzed known reference substancesherefore their identification from mixture sample relied on findinghe exact molecular formula using the algorithm “Find Com-ounds by Formula”. In case of analysis of sample that contains
ixture of unknown substances, our analytical methodology canlso be applied with the exception of data extraction step. Here,he analytical data would be extracted using different formula,amely “Find Compound by Molecular Feature”, that allows for
ved during all (18) chromatographic runs. The chromatographic data were collectedent mobile phase pHs. Series differed in gradient duration of 10 min (series I) and
identification of all substances existing in sample, with the pos-sible adducts attached or lost during ionization and also with ahigh accuracy level (∼2–5 ppm). After applying that algorithm,the identification is based on isotopic distribution/pattern of eachdetected substance giving the suggestion of molecular formula.Together with that algorithm, the available databases like KEGG(Kyoto Encyclopedia of Genes and Genomes), METLIN, MassTRIX(Mass Translator into Pathway) and HMDB (Human MetabolomeDatabase) can be applied. The mentioned databases also allow forthe identification of substances according to their molecular weightdetected using LC-TOF-MS with the mass error applied by the user.The reliable identification should be confirmed by standards’ anal-ysis or determination using tandem mass spectrometry, such asLC-Q-TOF-MS, LC-QqQ-MS, LC-Q-IT-MS, giving the structure char-acteristic fragments of detected compounds.
The chromatographic retention model used in this work wasearlier applied for a 98 acidic and basic compounds [11]. In thiswork it was refined to include the dependence of retention factoron pH of the mobile phase that we observed on our XBridge column[31,43]. A small increase of 0.52% in log k due to the unit increasein pH has been determined. For tosylate anion no change in reten-tion has been observed. The knowledge about bretylium tosylateretention has already been recognized to be particularly useful inunderstanding the retention behavior of ionizable compounds as a
function of the mobile phase pH [43].The correlation parameters between literature and chromato-graphically derived parameters are presented in Table 1. Theincrease in methanol content causes decrease in pKa value for bases
P. Wiczling et al. / Journal of Pharmaceutical and Biomedical Analysis 94 (2014) 180–187 185
F the bw
aefiaiatt
TTgn
ig. 4. The plot of experimental (©), and model predicted (–•–) retention times foras calculated as the root mean square error of prediction.
nd increase in pKa value for acids. The degree of these changesquals 0.145 per 10% increase in methanol. In reality this value dif-ers between compounds. However, for the purpose of this workt was assumed invariant, allowing comparison of our and liter-ture data. The correlation of literature aqueous and determinedn this work pKa values is shown in Fig. 5. Those values are in an
cceptable agreement, especially for the purpose of through-putechnique. The root mean square error of prediction equaled 0.38,he median absolute deviation equaled 0.22 and ranged from 0.01able 1he coefficients of Eqs. (5) and (6) reflecting correlation between chromato-raphically derived log kw and pKa,chrom values and literature aqueous pKa and-octanol/water partition coefficient.
Parameter Meaning Estimates (%Cv)
˛pKa The influence of organicmodifier on pKa
1.45 (8.4%)
˛log P The slope in relationshipbetween log kw and log Pfor neutral and ionizedcompounds
1.24 (4.7%)
ˇlog P,N The intercept inrelationship betweenlog kw,N and log PN (fornonionized compounds)
−1.46 (14%)
ˇlog P,I The intercept inrelationship betweenlog kw,I and log P,I (forionized compounds)
−3.25 (6.2%)
est, modest and the worst performance of the final model. The model performance
to 0.81. Thus on average one can expect this degree of accuracy inchromatographically determined pKa values.
The log kw and log P are the parameters most often usedin medicinal chemistry and rational drug design to evaluatedrug-candidate permeability through biological membranes andpharmacological activity. The retention factor of a neutral form(log kN) has been obtained as a maximum of all log kw,i among allanalyte forms. It was correlated with literature lipophilicity corre-sponding to neutral form (log PN). Similar correlations were soughtfor chromatographically derived and n-octanol/water literaturelog P values of ionized forms (log PI) and distribution coefficient atpH 7.4 (log D7.4). The corealtions are shown in Fig. 5. The root meansquare error of prediction equals 0.54. The median absolute devi-ation equaled 0.38 and ranged from 0.03 to 1.04. The log kw (andsimilarly log P) is a system and a compound property, so its valuesdepend on the properties of the chromatographic column (or thenon-polar phase). Theoretically, the relationship between log kw
and log P is linear, but deviations are often seen. The slope of thisrelationship was identical for ionized and nonionized forms of ana-lyte and equaled 1.26. The intercept equaled −1.46 for neutral and−3.25 for ionized forms of analytes. Those numbers approximatethe average difference between the log P and log kw. Interestingly,the intercept is about 2 fold higher for ionized than for neutralforms. Very likely this difference might be caused by the influence
of ionic strength on log P. The salt concentration has been long rec-ognized as a major factor influencing log PI values, which is typicallyevaluated at 0.15 M ionic strength. The log kw depends to only smalldegree on ionic strength of mobile phase. Thus, in principle the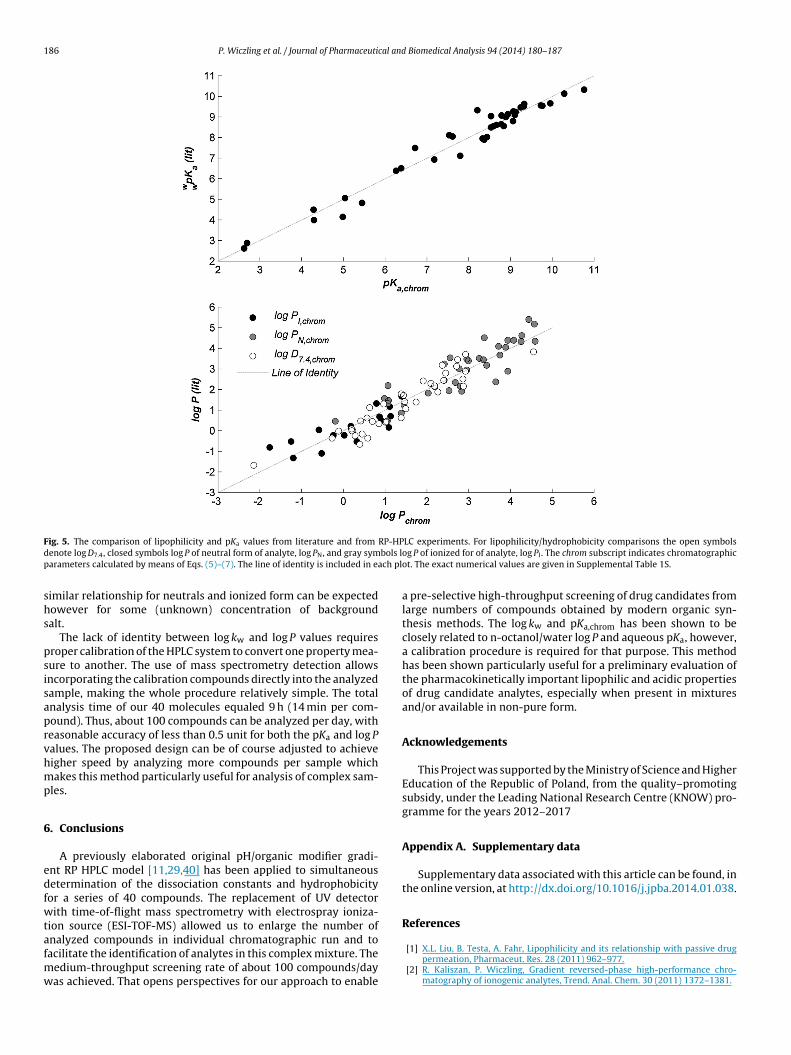
186 P. Wiczling et al. / Journal of Pharmaceutical and Biomedical Analysis 94 (2014) 180–187
F RP-HPd bols lp ach pl
shs
psisaprvhmp
6
edfwtafmw
ig. 5. The comparison of lipophilicity and pKa values from literature and from
enote log D7.4, closed symbols log P of neutral form of analyte, log PN, and gray symarameters calculated by means of Eqs. (5)–(7). The line of identity is included in e
imilar relationship for neutrals and ionized form can be expectedowever for some (unknown) concentration of backgroundalt.
The lack of identity between log kw and log P values requiresroper calibration of the HPLC system to convert one property mea-ure to another. The use of mass spectrometry detection allowsncorporating the calibration compounds directly into the analyzedample, making the whole procedure relatively simple. The totalnalysis time of our 40 molecules equaled 9 h (14 min per com-ound). Thus, about 100 compounds can be analyzed per day, witheasonable accuracy of less than 0.5 unit for both the pKa and log Palues. The proposed design can be of course adjusted to achieveigher speed by analyzing more compounds per sample whichakes this method particularly useful for analysis of complex sam-
les.
. Conclusions
A previously elaborated original pH/organic modifier gradi-nt RP HPLC model [11,29,40] has been applied to simultaneousetermination of the dissociation constants and hydrophobicityor a series of 40 compounds. The replacement of UV detectorith time-of-flight mass spectrometry with electrospray ioniza-
ion source (ESI-TOF-MS) allowed us to enlarge the number of
nalyzed compounds in individual chromatographic run and toacilitate the identification of analytes in this complex mixture. Theedium-throughput screening rate of about 100 compounds/dayas achieved. That opens perspectives for our approach to enable
LC experiments. For lipophilicity/hydrophobicity comparisons the open symbolsog P of ionized for of analyte, log PI . The chrom subscript indicates chromatographicot. The exact numerical values are given in Supplemental Table 1S.
a pre-selective high-throughput screening of drug candidates fromlarge numbers of compounds obtained by modern organic syn-thesis methods. The log kw and pKa,chrom has been shown to beclosely related to n-octanol/water log P and aqueous pKa, however,a calibration procedure is required for that purpose. This methodhas been shown particularly useful for a preliminary evaluation ofthe pharmacokinetically important lipophilic and acidic propertiesof drug candidate analytes, especially when present in mixturesand/or available in non-pure form.
Acknowledgements
This Project was supported by the Ministry of Science and HigherEducation of the Republic of Poland, from the quality–promotingsubsidy, under the Leading National Research Centre (KNOW) pro-gramme for the years 2012–2017
Appendix A. Supplementary data
Supplementary data associated with this article can be found, inthe online version, at http://dx.doi.org/10.1016/j.jpba.2014.01.038.
References
[1] X.L. Liu, B. Testa, A. Fahr, Lipophilicity and its relationship with passive drugpermeation, Pharmaceut. Res. 28 (2011) 962–977.
[2] R. Kaliszan, P. Wiczling, Gradient reversed-phase high-performance chro-matography of ionogenic analytes, Trend. Anal. Chem. 30 (2011) 1372–1381.
cal and
[
[
[
[
[
[
[
[
[
[
[
[
[
[
[
[
[
[
[
[
[
[
[
[
[
[
[
[
[
[
[
[
[42] A. Avdeef, Physicochemical profiling (solubility, permeability and charge state),Curr. Top. Med. Chem. 1 (2001) 277–351.
P. Wiczling et al. / Journal of Pharmaceuti
[3] A. Avdeef, B. Testa, Physicochemical profiling in drug research: a brief surveyof the state-of-the-art of experimental techniques, Cell Mol. Life Sci. 59 (2002)1681–1689.
[4] A. Nasal, D. Siluk, R. Kaliszan, Chromatographic retention parameters in medic-inal chemistry and molecular pharmacology, Curr. Med. Chem. 10 (2003)381–426.
[5] T. Rodgers, M. Rowland, Mechanistic approaches to volume of distribution pre-dictions: understanding the processes, Pharmaceut. Res. 24 (2007) 918–933.
[6] A. Avdeef, Absorption and Drug Development Solubility, Permeability andCharge State, Wiley-Interscience, Hoboken, NJ, 2003.
[7] C. Giaginis, A. Tsantili-Kakoulidou, Current state of the art in HPLC methodologyfor lipophilicity assessment of basic drugs. A review, J. Liq. Chromatogr. Relat.Technol. 31 (2008) 79–96.
[8] K. Valko, C. Bevan, D. Reynolds, Chromatographic hydrophobicity index by fast-gradient RP HPLC: a high-throughput alternative to log P log D, Anal. Chem. 69(1997) 2022–2029.
[9] M. Kah, C.D. Brown, LogD: lipophilicity for ionisable compounds, Chemosphere72 (2008) 1401–1408.
10] C. Hansch, A. Leo, Substituent Constants for Correlation Analysis in Chemistryand Biology, Wiley, New York, 1979.
11] P. Wiczling, P. Kawczak, A. Nasal, R. Kaliszan, Simultaneous determination ofpKa and lipophilicity by gradient RP HPLC, Anal. Chem. 78 (2006) 239–249.
12] F. Rived, I. Canals, E. Bosch, M. Roses, Acidity in methanol–water, Anal. Chim.Acta 439 (2001) 315–333.
13] A. Avdeef, K.J. Box, J.E.A. Comer, M. Gilges, M. Hadley, C. Hibbert, W. Patterson,K.Y. Tam, PH-metric log P 11. pK(a) determination of water-insoluble drugs inorganic solvent–water mixtures, J. Pharm. Biomed. Anal. 20 (1999) 631–641.
14] I. Molnar, Searching for robust HPLC methods – Csaba Horvath and the solvo-phobic theory, Chromatographia 62 (2005) S7–S17.
15] C. Horvath, W. Melander, I. Molnar, Solvophobic interactions in liquid-chromatography with nonpolar stationary phases, J. Chromatogr. 125 (1976)129–156.
16] J.M. Pallicer, R. Pascual, A. Port, M. Roses, C. Rafols, E. Bosch, The contribu-tion of the hydrogen bond acidity on the lipophilicity of drugs estimated fromchromatographic measurements, Eur. J. Pharm. Sci. 48 (2013) 484–493.
17] M.H. Abraham, H.S. Chadha, G.S. Whiting, R.C. Mitchell, Hydrogen-bonding. 32.An analysis of water–octanol and water–alkane partitioning and the delta-log-Pparameter of seiler, J. Pharm. Sci. 83 (1994) 1085–1100.
18] R. Kaliszan, P. Haber, T. Baczek, D. Siluk, Gradient HPLC in the determination ofdrug lipophilicity and acidity, Pure Appl. Chem. 73 (2001) 1465–1475.
19] R. Kaliszan, P. Haber, T. Baczek, D. Siluk, K. Valko, Lipophilicity and pKa esti-mates from gradient high-performance liquid chromatography, J. Chromatogr.A 965 (2002) 117–127.
20] R. Kaliszan, P. Wiczling, M.J. Markuszewski, pH gradient high-performance liq-uid chromatography: theory and applications, J. Chromatogr. A 1060 (2004)165–175.
21] R. Kaliszan, P. Wiczling, M.J. Markuszewski, pH gradient reversed-phase HPLC,Anal. Chem. 76 (2004) 749–760.
22] R. Berges, V. Sanz-Nebot, J. Barbosa, Modelling retention in liquid chromatog-raphy as a function of solvent composition and pH of the mobile phase, J.Chromatogr. A 869 (2000) 27–39.
23] J.E. Hardcastle, I. Jano, Determination of dissociation constants of polyproticacids from chromatographic data, J. Chromatogr. B 717 (1998) 39–56.
24] P. Nikitas, A. Pappa-Louisi, New equations describing the combined effect of pH
and organic modifier concentration on the retention in reversed-phase liquidchromatography, J. Chromatogr. A 971 (2002) 47–60.25] P. Nikitas, A. Pappa-Louisi, Retention models for isocratic and gradient elu-tion in reversed-phase liquid chromatography, J. Chromatogr. A 1216 (2009)1737–1755.
[
Biomedical Analysis 94 (2014) 180–187 187
26] S. Pous-Torres, J.R. Torres-Lapasio, J.J. Baeza-Baeza, M.C. Garcia-Alvarez-Coque,Combined effect of solvent content, temperature and pH on the chromato-graphic behaviour of ionisable compounds II: benefits of the simultaneousoptimisation, J. Chromatogr. A 1193 (2008) 117–128.
27] P. Nikitas, A. Pappa-Louisi, C. Zisi, pH-gradient reversed-phase liquid chro-matography of ionogenic analytes revisited, Anal. Chem. 84 (2012) 6611–6618.
28] C. Zisi, S. Fasoula, P. Nikitas, A. Pappa-Louisi, Retention modeling in com-bined pH/organic solvent gradient reversed-phase HPLC, Analyst 138 (2013)3771–3777.
29] P. Wiczling, M. Waszczuk-Jankowska, M.J. Markuszewski, R. Kaliszan, Theapplication of gradient reversed-phase high-performance liquid chromatog-raphy to the pK(a) and log k(w) determination of polyprotic analytes, J.Chromatogr. A 1214 (2008) 109–114.
30] P. Wiczling, R. Kaliszan, Retention time and peak width in the combinedpH/organic modifier gradient high performance liquid chromatography, J.Chromatogr. A 1217 (2010) 3375–3381.
31] P. Wiczling, A. Nasal, L. Kubik, R. Kaliszan, A new pH/organic modifier gradientRP HPLC method for convenient determination of lipophilicity and acidity ofdrugs as applied to established imidazoline agents, Eur. J. Pharm. Sci. 47 (2012)1–5.
32] K. Valko, Chromatographic hydrophobicity index by fast-gradient RP-HPLC: ahigh-throughput alternative to log P/log D, Anal. Chem. 69 (1997) 2022–2029.
33] C.M. Du, K. Valko, C. Bevan, D. Reynolds, M.H. Abraham, Rapid gradient RP-HPLCmethod for lipophilicity determination: a solvation equation based comparisonwith isocratic methods, Anal. Chem. 70 (1998) 4228–4234.
34] P.C. Chiang, C.C. Su, K.M. Block, D.K. Pretzer, Medium throughput pKa deter-mination of drugs and chemicals using an HPLC equipped with a DAD as aflow injection apparatus, J. Liq. Chromatogr. Relat. Technol. 28 (2005) 3035–3043.
35] P. Howard, W. Meylan, Physical/Chemical Property Database (PHYSPROP),Syracuse Research Corp.; Environmental Science Center, North Syracuse, NY,1999.
36] X. Subirats, E. Bosch, M. Roses, Retention of ionisable compounds on high-performance liquid chromatography XIX. pH variation in mobile phasescontaining formic acid, piperazine and Tris as buffering systems and methanolas organic modifier, J. Chromatogr. A 1216 (2009) 5445–5448.
37] X. Subirats, E. Bosch, M. Roses, Retention of ionisable compounds on high-performance liquid chromatography XVII. Estimation of the pH variation ofaqueous buffers with the change of the methanol fraction of the mobile phase,J. Chromatogr. A 1138 (2007) 203–215.
38] M. Roses, Determination of the pH of binary mobile phases for reversed-phaseliquid chromatography, J. Chromatogr. A 1037 (2004) 283–298.
39] M. Roses, E. Bosch, Influence of mobile phase acid–base equilibria on the chro-matographic behaviour of protolytic compounds, J. Chromatogr. A 982 (2002)1–30.
40] P. Wiczling, R. Kaliszan, Influence of pH on retention in linear organic modifiergradient RP HPLC, Anal. Chem. 80 (2008) 7855–7861.
41] I. Canals, K. Valko, E. Bosch, A.P. Hill, M. Roses, Retention of ionizable compoundson HPLC. 8. Influence of mobile-phase pH change on the chromatographicretention of acids and bases during gradient elution, Anal. Chem. 73 (2001)4937–4945.
43] U.D. Neue, C.H. Phoebe, K. Tran, Y.F. Cheng, Z. Lu, Dependence of reversed-phase retention of ionizable analytes on pH, concentration of organic solventand silanol activity, J. Chromatogr. A 925 (2001) 49–67.
Copyright © 2022 FDOKUMEN