collision-induced dissociation of hypersolvated lanthanide ...
7
ISSN 1144-0546 www.rsc.org/njc Volume 35 | Number 8 | August 2011 | Pages 1565–1760 New Journal of Chemistry A journal for new directions in chemistry 1144-0546(2011)35:8;1-G
-
Upload
khangminh22 -
Category
Documents
-
view
3 -
download
0
Transcript of collision-induced dissociation of hypersolvated lanthanide ...

ISSN 1144-0546
www.rsc.org/njc Volume 35 | Number 8 | August 2011 | Pages 1565–1760
V
olu
me
35
|
Nu
mb
er 8
|
20
11
N
JC
Pa
ge
s 1
56
5–
17
60
New Journal of Chemistry A journal for new directions in chemistry
1144-0546(2011)35:8;1-G
www.rsc.org/njcRegistered Charity Number 207890
ISSN 1144-0546
New Journal of Chemistry A journal for new directions in chemistry
www.rsc.org/njcA journal for new directions in chemistryEditors-in-Chief: Professor Jerry Attwood (University of Missouri, USA) Professor Mir Wais Hosseini (University of Strasbourg, France)
An international general chemistry journal reporting high quality interdisciplinary research that opens up new directions in chemistry or at the chemistry interface.
owned by CNRS and published monthly by the RSC
flexible formats provided for both reviews and original research
personal editorial service with robust refereeing procedures
Go online today
Dow
nloa
ded
by U
nive
rsity
of
Vic
tori
a on
03
Aug
ust 2
011
Publ
ishe
d on
18
Apr
il 20
11 o
n ht
tp://
pubs
.rsc
.org
| do
i:10.
1039
/C1N
J201
05K
View Online

1582 New J. Chem., 2011, 35, 1582–1587 This journal is c The Royal Society of Chemistry and the Centre National de la Recherche Scientifique 2011
Cite this: New J. Chem., 2011, 35, 1582–1587
Blurring the line between solution and the gas phase: collision-induced
dissociation of hypersolvated lanthanide trications provides insights into
solution acidity
Jennifer Pape, Keri McQuinn, Fraser Hof and J. Scott McIndoe*
Received (in Gainesville, FL, USA) 10th February 2011, Accepted 24th March 2011
DOI: 10.1039/c1nj20105k
Lanthanide ions provide a classic example of the distortion of speciation that sometimes occurs
during the electrospray ionization (ESI) process. Under normal conditions, M3+ ions are not
observed as such from aqueous solution; rather, they appear as charge-reduced species such as
[M(OH)]2+ or even [MO]+ ions. However, source conditions can be tuned to a ‘‘cold-flooding’’
mode such that [M(H2O)n]3+ ions can be readily obtained, thus providing spectra that are much
more representative of the solution speciation. Examination of heavily hydrated trications by
MS/MS enables the step-by-step progression of a small droplet to a solvated ion and eventually
to a solvent-free ion to be examined in detail, and the point at which charge reduction occurs can
be established. We find a strong correlation between the solution acidity of each lanthanide ion
and the number of water molecules at which charge reduction occurs under MS/MS conditions.
Examination of previously published data on a range of dications supports this conclusion.
So not only can ESI-MS provide an accurate picture of the solution speciation, it can also
provide insights into chemical behavior in solution.
The lanthanide elements, La through Yb (and often including
Lu and sometimes even Y; collectively abbreviated as Ln), all
have a stable +3 oxidation state in aqueous solution, and the
non-involvement of the contracted f orbitals in bonding means
that all 15 ions tend to behave rather like closed-shell ions.1
Famously, the elements exhibit the ‘‘lanthanide contraction’’,
a steady reduction in size across the period as the additional f
electrons fail to screen the outermost electrons completely
from the increasing nuclear charge. La3+ at 130.0 pm
(8 coordinate) is therefore considerably larger than Lu3+ at
111.7 pm (8 coordinate), with the sizes of the intervening
13 ions monotonously decreasing between these two.2 The
lanthanides therefore offer an opportunity, unique in the
periodic table, to study a collection of ions whose properties
change incrementally rather than abruptly across an extended
series. Even one of the more notable phenomena that involves
the lanthanides, the ‘‘gadolinium break’’, is rather subtle.3–6
Laing summarizes the gadolinium break as ‘‘the value of the
physical property for a Gd3+ species is displaced from the
smooth curve joining La3+ and Lu3+ in the direction of larger
ionic radius, weaker bonding or lower stability of the complex’’.7
A common explanation for the effect is that the solution
coordination number changes from 9 to 8 near Gd.8,9
However, more recent work has cast some doubt on this
hypothesis, with Persson et al. describing the gadolinium break
as a ‘‘myth’’,10 by using EXAFS to compare solid samples of
crystallographically characterized [Ln(H2O)n](CF3SO3)3 with
their aqueous solutions. All consisted of tricapped trigonal
prisms with varying degrees of water deficiency in a capping
site (n = 8.2 to 9), and no abrupt change in the coordination
number was observed at any point.
The lanthanide ions, while relatively large (compare Sc3+,
101.0 pm, 8-coordinate), remain hard by virtue of their high
charge and correspondingly favor hard ligands (i.e. the affinity
of lanthanides for hard bases is mainly ionic in nature).11
They are highly water soluble, and in aqueous solution water
outcompetes all other monodentate ligands and occupies all
coordination sites. Ln3+ ions are extraordinarily labile, and
water molecules in the first coordination shell exchange at
close to the diffusion rate.12 Aquated lanthanide ions are
weakly acidic, by virtue of eqn (1) (where b1*(M) = first
hydrolysis constant of M):
½M�3þ þH2OÐb1�ðMÞ
½MðOHÞ�2þ þ ½H�þ ð1Þ
The concentrations of Ln3+ and Ln(OH)2+ are equal at the
pH value corresponding to the pKa (about 7 to 9 for the
lanthanides). So even in neutral solution, we would expect to
observe some charge-reduced species present.
Electrospray ionization mass spectrometry (ESI-MS)13 is a
powerful tool for the analysis of ions dissolved in polar
solvents, and it generally does a fine job of representing the
Department of Chemistry, University of Victoria, P.O. Box 3065,Victoria, BC V8W3V6, Canada. E-mail: [email protected];Fax: +1 (250) 721-7147; Tel: +1 (250) 721-7181
NJC Dynamic Article Links
www.rsc.org/njc PAPER
Dow
nloa
ded
by U
nive
rsity
of
Vic
tori
a on
03
Aug
ust 2
011
Publ
ishe
d on
18
Apr
il 20
11 o
n ht
tp://
pubs
.rsc
.org
| do
i:10.
1039
/C1N
J201
05K
View Online
This journal is c The Royal Society of Chemistry and the Centre National de la Recherche Scientifique 2011 New J. Chem., 2011, 35, 1582–1587 1583
solution speciation of such species.14 However, for some time,
small, highly charged ions were notable failures for the
technique.15 Rather than observing the multiply charged ions,
only charge-reduced species such as solvated [M(OH)]+ ions
would be seen.16–19 This situation is particularly acute for the
triply-charged lanthanides in water, and the ESI-MS spectrum
of M3+ ions generally consists only of hydrated [M(OH)]2+,
[M(OH)2]+ and [M(O)]+ ions.20 This behaviour contrasted
sharply with what is observed in solvents other than water:
acetonitrile,21 diacetone alcohol,22 acetonitrile,23 peptides,24
dimethylsulfoxide and hexamethylphosphoramide,25 and
various sugars26 all allow observation of [M(molecule)n]3+
ions. The Williams group was the first to show that
[M(H2O)n]3+ ions could be readily produced in the gas phase,
provided that there are sufficient water molecules present
(n > 15).27 They used a custom-made nano-ESI source that
included a heated copper block coupled to a Fourier transform
ion cyclotron resonance instrument (FTICR-MS), and obtained
highly hydrated ions, with n in the hundreds. The smallest
n observed depended on the particular lanthanide ion: n
was largest for smaller, more acidic lanthanides, and less for
the larger lanthanides. They subsequently extended their
investigation of the lanthanides to the full series (with the
exception of radioactive promethium), lutetium and yttrium
(the related Group 3 metals).28 They trapped the smallest
observable [M(H2O)n]3+ ions at 220 K and allowed them to
dissociate slowly through BIRD (blackbody infrared dissocia-
tion). From these data, they established a non-integer turnover
size, the effective cluster size at which the loss of water and
charge-separation reaction rates become equal. Their findings
included a relationship between the turnover size and the
solution acidity and a change in slope in the plot which they
attributed to a gadolinium break, a lack of correspondence
between the turnover size and the third ionization energy, and
an unusually low signal intensity for ytterbium, the smallest of
the lanthanides (though larger than lutetium, which was
successfully observed).
We obtain super-hydrated cations using a commercial
hybrid quadrupole/time-of-flight instrument, by setting up
the unmodifiedMicromass Z-spray source under ‘‘cold-flooding’’
conditions: high flow rates (20–50 mL min�1) and ambient
temperatures being key to success.29 This approach works for
a variety of ions, including H+,30 Pb2+,31 and variously
methylated guanidinium ions.32 Selection of [M(H2O)n]3+
(n E 50) ions in the quadrupole and collision-induced
dissociation (CID) stripped off water molecules through
multiple collisions to the point at which proton transfer
occurred, and evaporation of a solvated proton as the Eigen
cation, [H(H2O)4]+,33 was directly observed––the first such
observation of a solvated ion evaporating from a droplet.29
We have found the minimum value of n for CID studies, nmin,
to be consistently lower than values found through other
techniques––for example, nmin for Pb2+ is 8, but when studied
using MIKES (mass analyzed ion kinetic energy spectra),
11 water molecules were required to stabilize the complex
against proton transfer.31 The difference is likely to be related
to the fact that while [Pb(H2O)11]2+ is indefinitely stable,
[Pb(H2O)n]2+ (n = 8, 9, 10) are metastable sufficiently so that
mass analysis can be completed before proton transfer can
completely occur. Here, we extend our CID investigations to
examine all the weakly acidic M3+ ions, the tricationic ions
from the lanthanide series La–Yb (excluding Pm) and the
Group 3 metals Y and Lu.
Results and discussion
The mass spectrometer was set up in a ‘‘cold-flooding’’ mode,
whereby the flow rate is high and the source and desolvation
temperatures were low (see Experimental section for details).
Under these conditions, the source becomes visually saturated
with water, with droplets forming on the baffle leading to the
exhaust. Desolvation is much reduced, but strong signals are
attained through the use of high cone voltage (in-source
collision-induced dissociation). All M3+ ions studied provided
strong series of peaks attributable to [M(H2O)n]3+, though the
signal-to-noise ratio was significantly better for those elements
with odd atomic numbers (one or two isotopes) compared to
those with even atomic numbers (many isotopes), because in
the former case the signal is concentrated at one or two values
of m/z rather than distributed over many. Nonetheless, signals
were sufficiently strong in all cases that a peak could be
selected from the numerous choices at around [Ln(H2O)n]3+
(n E 50) that provided good MS/MS data with no isobaric
interferences (Fig. 1), and the minimum cluster size, nmin, for
all 15 elements was established. Ytterbium provided the most
difficulty, as it has seven isotopes and is the second-smallest
ion investigated (and hence has a large nmin), but an extended
collection time addressed these issues.
We have already published the data for La3+, Tb3+ and
Lu3+,29 and the other 12 elements were investigated under
identical conditions. Selection of [M(H2O)n]3+ in the quadrupole
was followed by collision-induced dissociation (CID) of
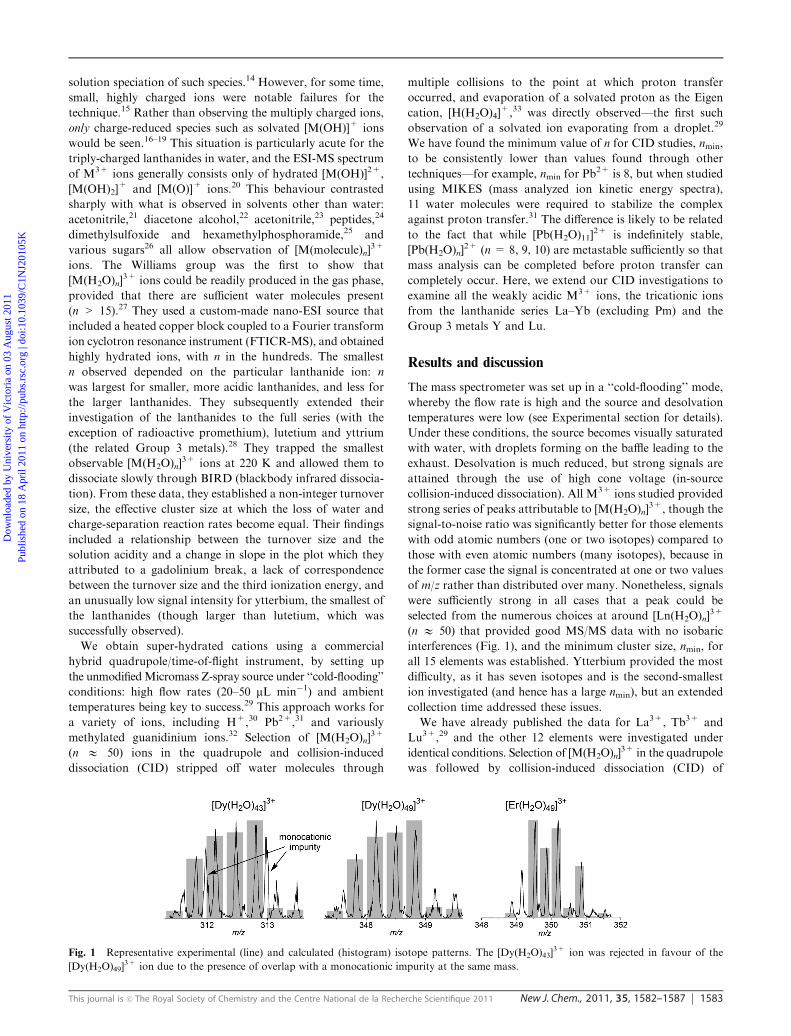
Fig. 1 Representative experimental (line) and calculated (histogram) isotope patterns. The [Dy(H2O)43]3+ ion was rejected in favour of the
[Dy(H2O)49]3+ ion due to the presence of overlap with a monocationic impurity at the same mass.
Dow
nloa
ded
by U
nive
rsity
of
Vic
tori
a on
03
Aug
ust 2
011
Publ
ishe
d on
18
Apr
il 20
11 o
n ht
tp://
pubs
.rsc
.org
| do
i:10.
1039
/C1N
J201
05K
View Online

1584 New J. Chem., 2011, 35, 1582–1587 This journal is c The Royal Society of Chemistry and the Centre National de la Recherche Scientifique 2011
the ions with argon atoms in the collision cell (pressure 2.2 �0.1 � 10�5 mbar), which has the effect of stripping off
water molecules. This process continues, through increasing
the collision voltage and hence the energy of the atom–ion
interactions, until a number of water molecules remain, nmin,
at which point no higher charge density can be tolerated so
charge reduction occurs through proton transfer from an
inner-sphere water ligand to another water molecule and the
solvated ion [H(H2O)Z 3]+ evaporates from the droplet
(Fig. 2).
An example of the data collected is presented in Fig. 3, in
an energy-dependent format (EDESI-MS/MS).34–37 In this
method of data presentation, multiple spectra are combined
into a matrix and plotted as a contour map of collision voltage
vs. m/z, where intensity is represented as the third variable. A
summation of all the spectra used to generate the map is
presented in the conventional format in the spectrum above
the map. The map made it easy for us to focus on the
particular collision voltage(s) at which nmin was most likely
to be found (for the example shown, 22 V). The value of nmin
was recorded for each [M(H2O)n]3+, as the smallest value of n
observed in any of the MS/MS product ion spectra collected
(where n E 50 for the corresponding precursor ion). We chose
a criterion for selection of the nmin ion with a signal-to-noise
ratio of at least three (any higher threw up many false
negatives for the least intense spectra, and any lower produced
many false positives, including at implausibly low values of n,
for all spectra). All data are summarized in Table 1.
When nmin is plotted against the first hydrolysis constant
(Fig. 4a)39 and the ionic radius (Fig. 4b), linear trends are
obtained. Smaller and more acidic lanthanide ions have higher
nmin. The value was quite reproducible, but is necessarily an
integer value and so the error in nmin can be regarded as �1. Itis reasonable to expect both the ionic size and first hydrolysis
constant to be related to nmin. The first hydrolysis constant
measures the same process as we observe in the gas phase as
in solution––the Brønsted acidity of the hydrated metal ion
(i.e. its propensity to release a proton), the only difference
being the size of the solvation sphere (effectively infinite in
solution, tightly circumscribed in the gas phase). For cations
of a given charge, the smallest most effectively drain electron
density from the oxygen of the bound water molecules, and
hence from the hydrogen, thus increasing the propensity of a
proton to transfer to a nearby water molecule (from which it
can receive more electron density).
The minimum n value appears to relate slightly more closely
to the first hydrolysis constant (R2 = 0.92) than to the ionic
radius (R2 = 0.86), most obviously when considering yttrium.
This element is an outlier in the ionic size plot (the agreement
improves to R2 = 0.93 when Y is excluded) but falls near the
line in the hydrolysis constant plot. Given that the resolution
in nmin has been limited to integer values, the correspondence
to a straight line is similarly good in both cases, and it is not
possible for us to say with confidence which tracks better. An
empirical approximation of the relationship between acidity
and ionic size is given by eqn (2):41
pKa = 15.14 � 88.16[Z2/r + 0.096(wP � 1.50)] (2)
Fig. 2 The process of solvent and ion evaporation through collision-induced dissociation (CID).
Fig. 3 EDESI-MS/MS for [Y(H2O)51]3+. The precursor ion at 335.9
m/z is selected in the quadrupole mass analyzer, and subjected to CID
at different collision voltages (10–39 V, y-axis). The 30 spectra are
presented in the form of a contour map, with intensity being the third
dimension. The spectrum at the top is the summation of all MS used to
generate the map. This approach is a compact way of displaying all the
information from a full CID experiment. nmin represents the lowest
value of n observed for a product ion of the type [Y(H2O)n]3+, in this
case n = 16.
Dow
nloa
ded
by U
nive
rsity
of
Vic
tori
a on
03
Aug
ust 2
011
Publ
ishe
d on
18
Apr
il 20
11 o
n ht
tp://
pubs
.rsc
.org
| do
i:10.
1039
/C1N
J201
05K
View Online

This journal is c The Royal Society of Chemistry and the Centre National de la Recherche Scientifique 2011 New J. Chem., 2011, 35, 1582–1587 1585
However, because the Pauling electronegativity (wP) of all theelements in this study is o1.3 and the modified ratio is used
only when the electronegativity of the metal exceeds 1.50, to a
good approximation the acidity (pKa) is inversely proportional
to the radius of the ion for ions of like charge, and our
observations are in agreement with this rule of thumb. There
is no correspondence between the data and the third ionization
energy of the lanthanides (Fig. 4c), a reasonable result given
that there is no change in the oxidation state during the charge
reduction process, which is a proton transfer reaction that
involves no redox chemistry.
Unlike Bush et al.,28 we did not observe any evidence
for a gadolinium break.42,43 Given the subtleties of typical
gadolinium break effects, the resolution of our data is unlikely
to be sufficient to detect the sorts of features observed in
formation constant plots. The appearance of a more dramatic
gadolinium break in the data of Bush et al. is not strictly
comparable to our results––CID is a higher-energy process
than BIRD, as manifested by appreciably lower nmin values
in our investigation of 14–18 compared to their turnover
numbers of 19–21. Kinetic shift is an issue here, because the
CID experiment captures short-lived ions.
Having established a strong correlation between acidity
(and a strong inverse correlation with ionic radius) and nmin
for these large M3+ ions, how well does the trend hold up for
the rest of the periodic table and other metal cations? As
eqn (2) indicates, the most acidic cations are those that have a
high charge and are small. Correspondingly, Group 1 metal
ions are essentially non-acidic with pKa E 14 (and being
monocationic, do not charge-reduce in the gas phase), and
the Group 2 dications are feebly acidic. Using the same
conditions and criteria as reported herein for nmin, we have
looked at Sr2+ (pKa 13.3) and Pb2+ (pKa 7.7), and obtained
nmin values of 0 and 8 for these two ions. These values are
in keeping with the general trend that the higher the acidity of
an ion, the greater the number of water molecules needed.
These data would be outliers on the plot shown in Fig. 5,
so while the linearity holds true for trications in the size range
of B120 � 10 pm, it does not appear to carry through to
dications (we would expect nmin for Pb2+ to be B17, based on
our data).
Transition metal trications such as Sc3+, Fe3+, Co3+ and
Cr3+ can all be thought of as ‘‘moderately acidic’’ (pKa E 4)
rather than ‘‘weakly acidic’’ (pKa E 8). Indeed, to keep the
hydroxides of transition metal trications dissolved, solutions
of these ions are typically kept highly acidic. Accordingly,
when neutral solutions of these metal ions are analyzed by
ESI-MS using the same conditions as for the lanthanides
(as nitrates or chlorides), we observed no tricationic species,
only charge-reduced 2+ and 1+ ions. Similarly, the moderately
acidic tetracationic actinide Th4+ (pKa 3.2) provided only 1+
and 2+ ions, and no 3+ or 4+ ions are observed. Based on
these results, we did not even attempt to investigate any
strongly acidic cations (e.g. Ti4+, Au3+, both of which have
negative pKa).
While our values of nmin are not the same as (they are always
lower than) the more usually reported ncrit, examining
published values of ncrit and comparing them to the acidity
of the ions are illustrative. Shvartsburg and Siu have
previously determined the ncrit values for a wide range of
dications,44 ranging from the small Be2+ to the much larger
Sr2+, and including a variety of transition metals. These data
were first collected by Kebarle et al.17,18,45 and have been
further developed in work by Stace et al.46–48 and Armentrout
et al.49–52 The first hydrolysis constant of these ions has
been long-established.53 The result from these published
studies is another good straight line (Fig. 5). The fit with the
first hydrolysis constant is better than with either ionic radius
or with second ionization energy. The correlation between
ionization energy and ncrit is reasonable, but it notably fails for
Be2+/Zn2+/Ni2+, which have very similar ionization energies
but very different ncrit values.
Given that both our own data on trications and reinterpre-
tation of previously published data on dications both produce
good linear fits, and superior in both cases to plots against
ionization energies, we are in agreement with the suggestion of
Williams and co-workers that it is proton transfer rather than
electron transfer, which is the key step in the charge separation
Table 1 Key parameters. XM = the element and isotope selected for MS/MS studies; rM3+ = 8-coordinate ionic radius;38 log0b1*(M) = firsthydrolysis constant;39 IE3 = 3rd ionization energy;40 precursor m/z is the mass-to-charge ratio selected (choice defined by intensity and lack ofisobaric interference); nprecursor defines the corresponding hydrated precursor ion, [Ln(H2O)n]
3+; nmin defines the smallest value of n observed fromthe CID process for an ion of the type [Ln(H2O)n]
3+
M Atomic number # Stable isotopes rM3+/pm log0b1*(M) IE3/eV Precursor m/z nprecursor nmin
89Y 39 1 115.9 �7.80 20.52 335.9 51 16139La 57 2 130.0 �8.81 19.18 334.5 48 14140Ce 58 4 128.3 �8.34 20.20 340.9 49 15141Pr 59 1 126.6 �8.32 21.62 347.2 50 15142Nd 60 7 124.9 �8.18 22.1 353.5 51 16*Pm 61 0 — — — — — —152Sm 62 7 121.9 �7.84 23.4 356.9 51 16153Eu 63 2 120.6 �7.76 24.92 357.1 51 16158Gd 64 7 119.3 �7.83 20.63 358.9 51 17159Tb 65 1 118.0 �7.64 21.91 335.1 47 17164Dy 66 7 116.7 �7.59 22.8 348.8 49 17165Ho 67 1 115.5 �7.56 22.84 355.0 50 17166Er 68 6 114.4 �7.52 22.74 373.5 53 17169Tm 69 1 113.4 �7.39 23.68 356.5 50 18174Yb 70 7 112.5 �7.24 25.05 364.2 51 18175Lu 71 2 111.7 �7.27 20.96 346.4 48 18
Dow
nloa
ded
by U
nive
rsity
of
Vic
tori
a on
03
Aug
ust 2
011
Publ
ishe
d on
18
Apr
il 20
11 o
n ht
tp://
pubs
.rsc
.org
| do
i:10.
1039
/C1N
J201
05K
View Online

1586 New J. Chem., 2011, 35, 1582–1587 This journal is c The Royal Society of Chemistry and the Centre National de la Recherche Scientifique 2011
process.54 The strong inverse correlation between ionic radius
and nmin (or ncrit) values is as expected, given the strong inverse
relationship between ionic radius and acidity.
Conclusions
The hydrated tricationic metal ions [M(H2O)n]3+ (M = Y,
La–Nd, Sm–Lu) decompose by proton transfer to form
[M(OH)(H2O)n�(x+1)]2+ and [H(H2O)x]
+ (x = 3, 4. . .) when
n is reduced below a point that correlates well to the solution
acidity of the ion in question. The minimum value of n can
be established by performing collision-induced dissociation
of [M(H2O)n]3+ (n E 50) in the collision cell of a tandem
mass spectrometer, and the resulting nmin values were found to
range from 14 for La3+, the least acidic ion, to 18 for Yb3+,
the most acidic. ESI-MS proves to not only accurately represent
solution speciation for multiply-charged metal ions if the right
source conditions are selected, but it can also provide insights
into the solution behavior through MS/MS investigations.
Experimental
Metal ions were investigated as nitrates except for La, Pr, Eu,
Tb, Ho, Tm and Lu (chlorides) and were purchased from
Aldrich. Experimental data were collected on an unmodified
Micromass Q-Tof microt with a Z-spray source. Voltage
settings ranged from 180 V to 200 V for the cone voltage
Fig. 4 Plot of nmin (minimum n for a detectable [M(H2O)n]3+ product
ion in MS/MS) vs. (a) the first hydrolysis constant; (b) the eight-
coordinate ionic radius; and (c) the 3rd ionization energy for M3+
ions. Linear regressions are (a) y = 36.7 + 2.59x; (b) y = 38.8 �0.187x; (c) y = 7.40 + 0.406x.
Fig. 5 Plot of ncrit vs. (a) the first hydrolysis constant; (b) the six-
coordinate ionic radius; and (c) the 2nd ionization energy for M2+
ions. Linear regressions are (a) y = 13.5 + 0.893x; (b) y = 12.5 �0.0836x; (c) y = �4.18 + 0.544x.
Dow
nloa
ded
by U
nive
rsity
of
Vic
tori
a on
03
Aug
ust 2
011
Publ
ishe
d on
18
Apr
il 20
11 o
n ht
tp://
pubs
.rsc
.org
| do
i:10.
1039
/C1N
J201
05K
View Online

This journal is c The Royal Society of Chemistry and the Centre National de la Recherche Scientifique 2011 New J. Chem., 2011, 35, 1582–1587 1587
and 2600 to 2900 V for the capillary. The cone and desolvation
gas flows were 0 L h�1 and 100 L h�1, respectively, while
desolvation and source temperatures were maintained at 20 1C
and 60 1C. Resolution settings and scan times were varied
based on the quality of the signal obtained. Typical values for
the low and high mass resolutions were 12.0 and 2 min for the
scan time. The ion energy was kept constant at 1 V and
adjustment of other instrumental parameters showed minimal
impact. Aqueous solutions were 5 to 15 mM and flow rates of
20 to 50 mL min�1 were used. EDESI experiments were carried
out by performing MS/MS on a selected peak and increasing
the collision voltage from one-volt increments across the
energy range of interest (typically 10–40 V). Spectra were
collected for 2–5 min at each collision voltage to obtain a
reasonable ion count. Automation of the mass spectrometer
software (MassLynxs) to carry out the EDESI experiments
(ramping of the collision voltage) was achieved using the
program Autohotkey (freely available from http://www.auto
hotkey.com/).
Acknowledgements
J. S. M. and F. H. both thank the Natural Sciences and
Engineering Research Council (NSERC) of Canada, the Canada
Foundation for Innovation (CFI) and the British Columbia
Knowledge Development Fund (BCKDF), and the University
of Victoria for instrumentation and operational funding. K. M.
thanks the University of Victoria for a graduate fellowship and the
Nora and Mark Degoutiere Memorial Scholarship. J. P. thanks
AXYS Analytical Services Ltd. and the MITACS Accelerate
Program for sponsorship. We thank Frank van Veggel and David
Berg for gifts of some of the lanthanide salts, Ori Granot for useful
discussions, and the referees for their highly valuable comments,
suggestions and corrections.
References
1 N. N. Greenwood and A. Earnshaw, Chemistry of the Elements,Butterworth-Heinemann, 1997.
2 J. E. Huheey, E. A. Keiter and R. L. Keiter, Inorganic Chemistry:Principles of Structure and Reactivity, HarperCollins, 1993.
3 S. P. Sinha, Systematics and the Properties of the Lanthanides,Kluwer Academic, 1983.
4 D. F. Peppard, C.A.A. Bloomquist, E. P. Horwitz, S. Lewey andG. W. Mason, J. Inorg. Nucl. Chem., 1970, 32, 339.
5 A. Roy and K. Nag, J. Inorg. Nucl. Chem., 1978, 40, 331.6 I. Fidelis and S. Siekiers, J. Inorg. Nucl. Chem., 1966, 28, 185.7 M. Laing, J. Chem. Educ., 2009, 86, 188.8 P. Bachurzewski and I. K. Fidelis, J. Radioanal. Chem., 1982, 74, 85.9 L. Helm and A. E. Merbach, Coord. Chem. Rev., 1999, 187, 151.
10 I. Persson, P. D’Angelo, S. De Panfilis, M. Sandstrom andL. Eriksson, Chem.–Eur. J., 2008, 14, 3056.
11 R. G. Pearson, J. Am. Chem. Soc., 1963, 85, 3533.12 N. Kaltsoyannis and P. Scott, The f elements, Oxford University
Press, 1999.13 J. B. Fenn, M. Mann, C. K. Meng, S. F. Wong and
C. M. Whitehouse, Science, 1989, 246, 64.14 R. B. Cole,Electrospray IonizationMass Spectrometry: Fundamentals,
Instrumentation and Applications, John Wiley & Sons, 1997.15 A. J. Stace, J. Phys. Chem. A, 2002, 106, 7993.16 M. K. Beyer, Mass Spectrom. Rev., 2007, 26, 517.
17 A. T. Blades, P. Jayaweera, M. G. Ikonomou and P. Kebarle, Int.J. Mass Spectrom. Ion Processes, 1990, 102, 251.
18 A. T. Blades, P. Jayaweera, M. G. Ikonomou and P. Kebarle,J. Chem. Phys., 1990, 92, 5900.
19 P. Jayaweera, A. T. Blades, M. G. Ikonomou and P. Kebarle,J. Am. Chem. Soc., 1990, 112, 2452.
20 A. T. Blades, P. Jayaweera, M. G. Ikonomou and P. Kebarle, Int.J. Mass Spectrom. Ion Processes, 1990, 101, 325.
21 T. J. Shi, A. C. Hopkinson and K. W. M. Siu, Chem.–Eur. J., 2007,13, 1142.
22 A. A. Shvartsburg, J. Am. Chem. Soc., 2002, 124, 7910.23 N. R. Walker, R. R. Wright, A. J. Stace and C. A. Woodward, Int.
J. Mass Spectrom., 1999, 188, 113.24 T. J. Shi, K. W. M. Siu and A. C. Hopkinson, J. Phys. Chem. A,
2007, 111, 11562.25 A. A. Shvartsburg, J. Am. Chem. Soc., 2002, 124, 12343.26 J. Sunner, I. B. Beech and K. Hiraoka, J. Am. Soc. Mass
Spectrom., 2006, 17, 151.27 M. F. Bush, R. J. Saykally and E. R. Williams, Int. J. Mass
Spectrom., 2006, 253, 256.28 M. F. Bush, R. J. Saykally and E. R. Williams, J. Am. Chem. Soc.,
2008, 130, 9122.29 K. McQuinn, F. Hof and J. S. McIndoe, Chem. Commun., 2007,
4099.30 K. McQuinn, F. Hof and J. S. McIndoe, Int. J. Mass Spectrom.,
2009, 279, 32.31 K. McQuinn, F. Hof, J. S. McIndoe, X. J. Chen, G. H. Wu and
A. J. Stace, Chem. Commun., 2009, 4088.32 K. McQuinn, L. S. McIndoe and F. Hof, Chem.–Eur. J., 2008, 14,
6483.33 M. Eigen, Angew. Chem., Int. Ed. Engl., 1964, 3, 1.34 E. Crawford, P. J. Dyson, O. Forest, S. Kwok and J. S. McIndoe,
J. Cluster Sci., 2006, 17, 47.35 S. L. G. Husheer, O. Forest, M. Henderson and J. S. McIndoe,
Rapid Commun. Mass Spectrom., 2005, 19, 1352.36 P. J. Dyson, A. K. Hearley, B. F. G. Johnson, J. S. McIndoe, P. R.
R. Langridge-Smith and C.Whyte,Rapid Commun. Mass Spectrom.,2001, 15, 895.
37 P. J. Dyson, B. F. G. Johnson, J. S. McIndoe and P. R.R. Langridge-Smith, Rapid Commun. Mass Spectrom., 2000, 14,311.
38 http://www.webelements.com/, last accessed 3/2/11.39 G. D. Klungness and R. H. Byrne, Polyhedron, 2000, 19, 99.40 P. F. Lang and B. C. Smith, J. Chem. Educ., 2010, 87, 875.41 G. Wulfsburg, Inorganic Chemistry, University Science Books,
2000.42 F. H. Spedding, J. E. Powell and E. J. Wheelwright, J. Am. Chem.
Soc., 1956, 78, 34.43 T. Moeller, D. F. Martin, L. C. Thompson, R. Ferrus,
G. R. Feistel and W. J. Randall, Chem. Rev., 1965, 65, 1.44 A. A. Shvartsburg and K. W. M. Siu, J. Am. Chem. Soc., 2001,
123, 10071.45 M. Peschke, A. T. Blades and P. Kebarle, Int. J. Mass Spectrom.,
1999, 185–187, 685.46 H. Cox and A. J. Stace, J. Am. Chem. Soc., 2004, 126, 3939.47 B. J. Duncombe, K. Duale, A. Buchanan-Smith and A. J. Stace,
J. Phys. Chem. A, 2007, 111, 5158.48 G. H. Wu, D. Chapman and A. J. Stace, Int. J. Mass Spectrom.,
2007, 262, 211.49 T. E. Cooper, D. R. Carl and P. B. Armentrout, J. Phys. Chem. A,
2009, 113, 13727.50 D. R. Carl, R. M. Moision and P. B. Armentrout, Int. J. Mass
Spectrom., 2007, 265, 308.51 T. E. Cooper and P. B. Armentrout, Chem. Phys. Lett., 2010,
486, 1.52 T. E. Cooper and P. B. Armentrout, J. Phys. Chem. A, 2009, 113,
13742.53 C. F. Baes and R. E. Mesmer, The Hydrolysis of Cations, Wiley-
Interscience, 1976.54 M. Beyer, E. R. Williams and V. E. Bondybey, J. Am. Chem. Soc.,
1999, 121, 1565.
Dow
nloa
ded
by U
nive
rsity
of
Vic
tori
a on
03
Aug
ust 2
011
Publ
ishe
d on
18
Apr
il 20
11 o
n ht
tp://
pubs
.rsc
.org
| do
i:10.
1039
/C1N
J201
05K
View Online