Highly Luminescent Lanthanide Complexes of 1-Hydroxy-2 ...
32
1 Highly Luminescent Lanthanide Complexes of 1-Hydroxy-2-pyridinones Evan G. Moore, Jide Xu, Christoph J. Jocher, Ingrid Castro-Rodriguez and Kenneth N. Raymond* Department of Chemistry, University of California, Berkeley, CA, 94720-1460 and Lawrence Berkeley National Laboratory, Berkeley, CA 94720. Abstract The synthesis, X-ray structure, stability, and photophysical properties of several trivalent lanthanide complexes formed from two differing bis-bidentate ligands incorporating either alkyl or alkyl ether linkages and featuring the 1-hydroxy-2-pyridinone (1,2-HOPO) chelate group in complex with Eu(III), Sm(III) and Gd(III) are reported. The Eu(III) complexes are among some of the best examples, pairing highly efficient emission ( Eu tot Φ ~ 21.5 %,) with high stability (pEu ~ 18.6) in aqueous solution, and are excellent candidates for use in biological assays. A comparison of the observed behavior of the complexes with differing backbone linkages shows remarkable similarities, both in stability and photophysical properties. Low temperature photophysical measurements for a Gd(III) complex were also used to gain insight into the electronic structure, and were found to agree with corresponding TD-DFT calculations for a model complex. A comparison of the high resolution Eu(III) emission spectra in solution and from single crystals also revealed a more symmetric coordination geometry about the metal ion in solution due to dynamic rotation of the observed solid state structure. Introduction The ability to detect analytes such as DNA 1 , proteins 2 or other biologically active molecules 3 at small concentrations and in the presence of a complicated matrix or even in vivo remains a challenging task. Many of these bioassays often rely on lanthanide fluorescence, which can furnish detection limits in the nano- and picomolar region. 4 Specifically, their sharp ‘atom-like’ emission spectra, large Stokes shift, and long lived luminescence makes trivalent lanthanide cations such as Eu(III) very attractive reporters for these assays. Using both spectral and temporal discrimination of the luminescent signal from background autofluorescence enables highly sensitive assays, 5, 6 such as the Dissociation Enhanced Lanthanide Fluoro Immuno Assay (DELFIA ® ) techniques first commercialized by Wallac ™ , which use a polyaminocarboxylate chelate of Eu(III). 7 However, the DELFIA ® format is heterogeneous and suffers from the limitation that the fluorescent signal cannot be traced until the end of the assay, when the non-fluorescent Ln(III) chelate is converted to a highly fluorescent form by the addition of a sensitizing -diketonate enhancement solution. Hence, the preparation of efficient lanthanide sensitizers which also form very stable complexes in dilute aqueous solution is an active area of research, since they can be utilized directly and/or covalently bound to a particular biomolecule for use in a less expensive and less time consuming homogenous assays formats. Some earlier examples of systems utilized in this manner and which have been very successful were based on Eu(III) cryptates originally developed by Lehn. 8 However, in these cases, optimum results often required the addition of an augmenting agent such as anionic fluoride to displace residual inner sphere water molecules, which otherwise strongly quench Eu(III) centered luminescence. 9 More recently, several relatively stable Ln(III) complexes with a tetrapodal ligand design incorporating four picolinate chelating moieties have been prepared, which were found to be quite efficient sensitizers of Tb(III), with overall luminescence quantum yield of Tb tot Φ = 45 % and, to a lesser extent, for Eu(III)
-
Upload
khangminh22 -
Category
Documents
-
view
2 -
download
0
Transcript of Highly Luminescent Lanthanide Complexes of 1-Hydroxy-2 ...

1
Highly Luminescent Lanthanide Complexes of 1-Hydroxy-2-pyridinones
Evan G. Moore, Jide Xu, Christoph J. Jocher, Ingrid Castro-Rodriguez and Kenneth N. Raymond*
Department of Chemistry, University of California, Berkeley, CA, 94720-1460 and
Lawrence Berkeley National Laboratory, Berkeley, CA 94720. Abstract
The synthesis, X-ray structure, stability, and photophysical properties of several trivalent lanthanide complexes formed from two differing bis-bidentate ligands incorporating either alkyl or alkyl ether linkages and featuring the 1-hydroxy-2-pyridinone (1,2-HOPO) chelate group in complex with Eu(III), Sm(III) and Gd(III) are reported. The Eu(III) complexes are among some of the best examples, pairing highly efficient emission ( Eu
totΦ ~ 21.5 %,) with high stability (pEu ~ 18.6) in aqueous solution, and are
excellent candidates for use in biological assays. A comparison of the observed behavior of the complexes with differing backbone linkages shows remarkable similarities, both in stability and photophysical properties. Low temperature photophysical measurements for a Gd(III) complex were also used to gain insight into the electronic structure, and were found to agree with corresponding TD-DFT calculations for a model complex. A comparison of the high resolution Eu(III) emission spectra in solution and from single crystals also revealed a more symmetric coordination geometry about the metal ion in solution due to dynamic rotation of the observed solid state structure.
Introduction The ability to detect analytes such as DNA1, proteins2 or other biologically active molecules3 at small
concentrations and in the presence of a complicated matrix or even in vivo remains a challenging task. Many of these bioassays often rely on lanthanide fluorescence, which can furnish detection limits in the nano- and picomolar region.4 Specifically, their sharp ‘atom-like’ emission spectra, large Stokes shift, and long lived luminescence makes trivalent lanthanide cations such as Eu(III) very attractive reporters for these assays. Using both spectral and temporal discrimination of the luminescent signal from background autofluorescence enables highly sensitive assays,5, 6 such as the Dissociation Enhanced Lanthanide Fluoro Immuno Assay (DELFIA®) techniques first commercialized by Wallac™, which use a polyaminocarboxylate chelate of Eu(III).7 However, the DELFIA® format is heterogeneous and suffers from the limitation that the fluorescent signal cannot be traced until the end of the assay, when the non-fluorescent Ln(III) chelate is converted to a highly fluorescent form by the addition of a sensitizing �-diketonate enhancement solution. Hence, the preparation of efficient lanthanide sensitizers which also form very stable complexes in dilute aqueous solution is an active area of research, since they can be utilized directly and/or covalently bound to a particular biomolecule for use in a less expensive and less time consuming homogenous assays formats.
Some earlier examples of systems utilized in this manner and which have been very successful were based on Eu(III) cryptates originally developed by Lehn.8 However, in these cases, optimum results often required the addition of an augmenting agent such as anionic fluoride to displace residual inner sphere water molecules, which otherwise strongly quench Eu(III) centered luminescence.9 More recently, several relatively stable Ln(III) complexes with a tetrapodal ligand design incorporating four picolinate chelating moieties have been prepared, which were found to be quite efficient sensitizers of Tb(III), with overall luminescence quantum yield of Tb
totΦ = 45 % and, to a lesser extent, for Eu(III)
2
( EutotΦ = 7.0 %).10 Conditional stability constant (pM) measurements11 showed that these water soluble
complexes possessed solution stability that exceeds that of EDTA (pEu = 15.5). However, the observed excitation maximum was quite high in energy, with a λmax at 274 nm. For biological applications, it is preferably that such complexes allow for sensitization of the metal using the lowest possible energy (longer wavelength) in order to minimize autofluorescence and to increase the penetration depth of excitation into the sample.12 Another recently described Eu(III) chelate, which has the advantage of red shifted excitation at 335 nm, was reported by Matsumoto et. al.13 This compound is a polycarboxylate derivative of a terpyridine complex, and, according to preliminary stability assessment by competition with EDTA, is several orders of magnitude more stable than the [Eu(EDTA)] complex at pH 8. However, the synthesis of the complex is quite lengthy and the intensity of the resulting Eu(III) emission remains only moderate, with Eu
totΦ = 9.1 %.
Another approach pioneered by Parker has been the covalent attachment of a variety of sensitizing chromophores to the macrocyclic DO3A platform, most recently utilizing azaxanthones and azathioxanthones as the light absorbing chromophore which has extended the absorption envelope as far as ca. 380 nm.14 While stability data were not reported, these DO3A macrocyclic based complexes are known to form stable and very kinetically inert complexes with Ln(III) cations,15 and they almost certainly possess sufficient stability for biological applications. Despite their long wavelength absorbance, these chromophores have a relatively small energy gap between their first excited singlet and the lowest energy sensitizing triplet state, which facilitated their use as sensitizer for both Tb(III) and Eu(III). However, their luminescence performance is limited by incomplete energy transfer to the metal (as evidenced by residual ligand centered emission) and, more importantly, the presence of a single water molecule in the first coordination sphere (q = 1). Nonetheless, the observed quantum yields with Eu(III) were still very good with Eu
totΦ = 8.9 %, and for Tb(III), improved values as high as TbtotΦ = 24 % were reported, remarkably high for a q = 1 complex.
The sensitization of trivalent lanthanides with the simple 1-hydroxy-2-pyridinone (1,2-HOPO) chromophore has been previously reported,16, 17 specifically focusing on the [ML3(H2O)2] or [ML4]
− complexes with Tb(III), Dy(III) and Eu(III), which were also characterized by X-ray crystallography. In those studies the focus was on Tb(III), which displayed an impressive quantum yield of Tb
totΦ = 20 % in
methanol solution, whereas the performance of the Eu(III) complex was much less striking with EutotΦ = 0.3 %. Recently, we discovered that the 6- amide derivatives of 1,2-HOPO have vastly improved
performance for Eu(III), and we have reported on their excellent sensitization efficiency.18 The tetradentate ligand, 5LIO-1,2-HOPO (H21, Chart 1), is remarkable in that its ML2 complex with Eu(III) combines both a very high quantum yield ( Eu
totΦ = 21.5 %) with exceptionally good aqueous stability
(pEu = 18.6). Indeed, a comparison of the stability data for Fe(III), Al(III), and Ga(III) complexes of 1,2-HOPO’s indicates that this group acts as a very strong chelator for Lewis acidic trivalent ions such as Ln(III),19, 20 while conversely forming significantly weaker complexes with divalent ions such as Cu(II) or Zn(II).21 Furthermore, another important advantage of using the 6-carboxy-1-hydroxy-2-pyridinone precursor is the facile preparation of multidentate 1,2-HOPO based ligands which are able to exploit the chelate effect for higher complex stabilities.22 These ligands also allow a certain measure of control over the Ln(III) coordination sphere, by providing steric bulk and helping prevent the coordination of inner sphere solvent molecules, when compared to the bidentate analogues. In this paper we elaborate on our previous communication18 to include the alkyl linked ligand 5LI-1,2-HOPO (H22, Chart 1), in complex with Eu(III) and, as a result of the now completed photophysical characterization of the chromophore, we broaden the scope to include the complexes of both ligands with Sm(III).

3
Experimental General
All solvents for reactions were dried using standard methodologies. Thin-layer chromotography (TLC) was performed using precoated Kieselgel 60 F254 plates. Flash chromatography was performed using EM Science Silica Gel 60 (230- 400 mesh). NMR spectra were obtained using either Bruker AM-300 or DRX-500 spectrometers operating at 300 (75) MHz and 500 (125) MHz for 1H (or 13C) respectively. 1H (or 13C) chemical shifts are reported in ppm relative to the solvent resonances, taken as δ 7.26 (δ 77.0) and δ 2.49 (δ 39.5) respectively for CDCl3 and (CD3)2SO while coupling constants (J) are reported in Hz. The following standard abbreviations are used for characterization of 1H NMR signals: s = singlet, d = doublet, t = triplet, q = quartet, quin = quintet, m = multiplet, dd = doublet of doublets. Fast-atom bombardment mass spectra (FABMS) were performed using 3-nitrobenzyl alcohol (NBA) or thioglycerol/glycerol (TG/G) as the matrix. Elemental analyses were performed by the Microanalytical Laboratory, University of California, Berkeley, CA.
Synthesis Detailed synthesis of several relevant precursors (see Scheme 1) including the thiazolide activated
derivative 1,2-HOPO-Bn-thiaz (6) starting from commercially available 6-bromo-picolinic acid have been described elsewhere.23 Similarly, the synthesis of 5LIO-1,2-HOPO (H21) and its’ Eu(III) complex as the pyridinium salt, C5H6N[Eu(1)2], have been previously reported.18 A detailed synthesis of 5LI-1,2-HOPO (H22) and its Eu(III) complex, C5H6N[Eu(2)2], is described below, and corresponding complexes of Sm(III) and Gd(III) were prepared using the same procedure.
5LI-1,2-HOPO-Bn (8) To a solution of 1,2-HOPO-Bn-thiaz (6) (1.22 g, 3.52 mmol) in dry CH2Cl2 (30 mL) was added neat
1,5-pentanediamine (184 mg, 1.8 mmol). The resulting mixture was left to stir overnight, and ensuing purification of the reaction mixture was realized by removal of the solvent at reduced pressure and subsequent loading of the residue onto a flash silica column. Gradient elution with 2-6 % MeOH in CH2Cl2 allowed separation of the benzyl-protected precursor, 5LI-1,2-HOPO-Bn, as a pale yellow oil (0.9 g, 92 %). 1H NMR (300 MHz, CDCl3): δ 1.18 (quin, 2H), 1.39 (quin, 4H), 3.17 (q, 4H), 5.26 (s, 4H), 6.32 (dd, 2H), 6.62 (dd, 2H), 6.78 (t, 2H), 7.26-7.45 (m, 12H). 13C NMR (75 MHz, CDCl3): δ 23.4, 27.9, 39.3, 79.1, 105.9, 123.2, 128.4, 129.2, 129.9 133.2, 138.5, 142.9, 158.5, 160.3.
5LI-1,2-HOPO (H22) 5LI-1,2-HOPO-Bn (8) (557 mg, 1.0 mmol) was dissolved in a conc. HCl/glacial AcOH mixture
(20 mL, 1:1 (v/v)), and was stirred at room temperature for 2 days. Filtration followed by removal of the solvent yielded a beige residue, which was washed with Et2O to give 5LI-1,2-HOPO as a beige powder (344 mg, 74 %). 1H NMR (300 MHz, (CD3)2SO): δ 1.35 (quin, 2H), 1.46 (quin, 4H), 3.18 (q, 4H), 6.26 (dd, 2H), 6.55 (dd, 2H), 7.37 (dd, 2H), 8.73 (t, 2H). MS (FAB+): 377 (MH+). Elemental Analysis for C17H20N4O6·2HCl·H2O (Mr = 467.30 g.mol-1), Calc’d. (Found): 43.69 (43.75), 5.17 (4.93), 11.98 (11.65).
C5H6N[Eu(5LI-1,2-HOPO)2] (C5H6N[Eu(2)2])
A solution of EuCl3·6H2O (37 mg, 0.1 mmol) in MeOH (1 mL) was added to a stirred solution of H22 (94 mg, 0.20 mmol) in MeOH (5 mL). The clear solution became turbid after 2 drops of dry pyridine was added. The mixture was heated to reflux for 6 hr under nitrogen, during which time the complex deposited as a white precipitate. This solid was isolated by filtration, rinsed with cold MeOH, and dried to give the pyridinium salt of complex (80 mg, 82 %) as a white solid. Elemental Analysis for EuC34H36N8O12⋅C5H6N (Mr = 980.77 g.mol-1)), Calc’d. (Found): C, 47.76 (47.45); H, 4.32 (4.22); N, 12.85 (12.67). MS (ES−): 900.1 (M-). Crystals of the complex suitable for X-ray diffraction studies were prepared by vapor diffusion of ether into a wet methanol solution of the complex in the presence of excess dimethylamine.

4
Physical Methods Crystallography
Crystals suitable for X-ray analysis were mounted on a Kapton loop using Paratone N hydrocarbon oil and measured at low temperature using a Siemens SMART CCD24
area detector with graphite monochromated Mo-Kα radiation. Cell constants and orientation matrices were obtained from least-squares refinement. The resulting data were integrated by the program SAINT25
and corrected for Lorentz and polarization effects. Data were also analyzed for agreement and possible absorption using XPREP.26 An empirical absorption correction based on the comparison of redundant and equivalent reflections was applied using SADABS.27 Equivalent reflections where appropriate were merged and no decay correction was applied. The structures were solved within the WinGX28 package by direct methods using SIR9229 and expanded using full-matrix least-squares techniques with SHELXL-9730. Hydrogen atoms were positioned geometrically, with C–H = 0.93 Å for CH aromatic, C–H = 0.97 Å for CH2 methylene, N–H = 0.89 Å, and C–H = 0.96 Å for CH3 methyl. Hydrogen atoms were constrained to ride on their parent atoms, with Uiso(H) values set at 1.2 times Ueq(C) for all H atoms. Resulting drawings of molecules were produced with ORTEP-3.31
Solution Thermodynamics
Experimental protocols and details of the apparatus closely followed those of a previous study for related ligands.32 The 5LI-1,2-HOPO (H22) ligand and corresponding [Eu(2)2]− complex protonation constants were examined by potentiometric titrations (pH vs total proton concentration) using Hyperquad33. Spectrophotometric titrations (absorbance vs pH) were examined using pHab34 for data analysis. Both methods result in identical pKa values within experimental error.
All experiments were performed at 25°C and with 0.1 M KCl as electrolyte. Each determination results from three independent experiments, where each experiment consists of two titrations, first against 0.1 M HCl followed by reverse titrations against 0.1 M KOH. Additionally, protonation constants of the metal complex at low pH values were measured, where each experiment consists of one titration from pH 3 to pH 1.6. A correction of the liquid-liquid junction potential was performed in the course of pH electrode calibration, as detailed elsewhere.35 Equilibration times for titrations were 150 s and 210 s for ligand only and metal complex titrations respectively. Ligand and metal concentrations were in the range of 0.1 to 0.5 mM for potentiometric titrations. For spectrophotometric titrations, the ligand and metal complex concentrations were ca. 0.01 µM.
As a result of the strength of the binding interaction, and the highly acidic nature of the ligand, the Eu(III) ML2 complex formation constants with either ligand could not be determined directly. As such, for the determination of the ML2 formation constant, β120, spectrophotometric titrations versus the known competitor, DTPA, were performed between pH 5 and 9 with competitor concentration ranging from 0.01 µM to 0.12 mM. Additional spectrophotometric titrations with differing concentrations of Eu(III) and ligand between pH 3 and 1.6 in the absence of the DTPA competitor then allowed the determination of the constants β121 and β110 from refinements with fixed β120.
Photophysics
UV-Visible absorption spectra were recorded on Cary 300 double beam absorption spectrometer using quartz cells of 1.0 cm path length. Emission spectra were acquired on a HORIBA Jobin Yvon IBH FluoroLog-3 spectrofluorimeter. Spectra were reference corrected for both the excitation light source variation (lamp and grating) and the emission spectral response (detector and grating). Quantum yields were determined by the optically dilute method36 using the following equation;
( )( )
( )( ) ⎥
⎦
⎤⎢⎣
⎡⎥⎦
⎤⎢⎣
⎡⎥⎦
⎤⎢⎣
⎡⎥⎦
⎤⎢⎣
⎡=
ΦΦ
r
x
r
x
x
r
xx
rr
r
x
DD
II
AA
2
2
ηη
λλ
λλ
where A is the absorbance at the excitation wavelength (λ), I is the intensity of the excitation light at the same wavelength, η is the refractive index and D is the integrated luminescence intensity. The

5
subscripts ‘x’ and ‘r’ refer to the sample and reference respectively. Quinine sulfate in 1.0 N sulfuric acid was used as the reference (Φr = 0.546).36
Luminescence lifetimes were determined with a HORIBA Jobin Yvon IBH FluoroLog-3 spectrofluorimeter, adapted for time resolved measurements. A sub-microsecond Xenon flash lamp (Jobin Yvon, 5000XeF) was used as the light source, coupled to a double grating excitation monochromator for spectral selection. The input pulse energy (100 nF discharge capacitance) was ca. 50 mJ, yielding an optical pulse duration of less than 300 ns at FWHM. A thermoelectrically cooled single photon detection module (HORIBA Jobin Yvon IBH, TBX-04-D) incorporating fast rise time PMT, wide bandwidth pre-amplifier and picosecond constant fraction discriminator was used as the detector. Signals were acquired using an IBH DataStation Hub photon counting module and data analysis was performed using the commercially available DAS 6 decay analysis software package from HORIBA Jobin Yvon IBH. Goodness of fit was assessed by minimizing the reduced chi squared function, χ2, and a visual inspection of the weighted residuals. Each trace contained at least 10,000 points and the reported lifetime values result from at least three independent measurements.
Typical sample concentrations for absorption and fluorescence measurements were ca. 10-5 to 10-6 M and 1.0 cm cells in quartz suprasil or equivalent were used. Solid state measurements performed for the Eu(III) complexes were accomplished by fixing a dispersion of crystalline material to a glass microscope slide with Krazy Glue® cyanoacrylate based adhesive. The luminescence spectra and lifetimes in this case were measured using front-face excitation at 22.5°. Computational Studies
Ground state density functional theory (DFT) and time-dependent DFT (TD-DFT) calculations were performed at the Molecular Graphics and Computational Facility, College of Chemistry, University of California, Berkeley. In both cases, the B3LYP/6-311G++ (d,p) basis set provided in Gaussian’03 was used, with simplified input structures derived from a previously reported18 crystal structure. All calculations were done in the gas phase and geometry optimizations were performed with no symmetry restraints.
Results and Discussion Synthesis and Structure
The first reported synthesis of a 6- amide functionalized 1-hydroxy-2-pyridinone (1,2-HOPO) chelate group appeared more than 20 years ago,37 wherein the 1-hydroxy-2-pyridinone-6-carboxylic acid (3, Scheme 1) was first activated with phosgene gas, then coupled with an amine backbone to provide an amide linked multidentate 1,2-HOPO ligand scaffold. However, this procedure is somewhat unattractive since phosgene is highly toxic and, moreover, the yields of these coupling reactions were quite low (ca. 15-30 %). Additionally, the separation and purification of the final products are sometimes difficult, in most cases requiring purification by HPLC which limits the scale of the synthesis.
A more attractive approach toward the synthesis of 1,2-HOPO derivatives has since been developed,18, 23 as illustrated in Scheme 1 for the 5LIO-1,2-HOPO (H21) and 5LI-1,2-HOPO (H22) ligands. This procedure relies on the inherently greater acidity of the N-hydroxyl group, when compared to the carboxylic acid, which allows for near quantitative and selective benzyl protection. Upon treatment with oxalyl chloride, the benzyl protected 1,2-HOPO acid (4) can be easily converted to a 1,2-HOPO acid chloride (5), which reacts with primary or secondary amines to afford amide linked benzyl protected products.
The intermediate 1,2-HOPO acid chloride (5) is a very reactive species, and should be used immediately after preparation in most cases. Alternately, the benzyl protected 1,2-HOPO acid can also be activated toward subsequent amide bond formation by various reagents such as NHS, HOBt or 2-mercaptothiazolide using DCC as the coupling agent and DMAP as a catalyst. The activated NHS ester, HOBT ester and thiazolide readily react with a large variety of backbone amines to form the desired benzyl-protected 1,2-HOPO intermediates (7, 8), which can be easily purified by flash

6
chromatography on a preparative scale. As with the 1,2-HOPO acid chloride (5), the activated NHS and HOBT ester are not isolated in pure form, but rather generated and used in situ due to their reactivity. The 1,2-HOPO-Bn-thiaz (6) is therefore of particular interest since it can be easily separated and purified by flash chromatography and can also be stored since it is not sensitive to water and does not decompose. In most case, the 1,2-HOPO-Bn-thiaz (6) selectively reacts with primary amines to afford the desired benzyl protected products in excellent yield and the loss of its characteristic yellow color can also be used as a visual indicator to determine the end point of the amide coupling reaction. The deprotection of the ligands proceeds smoothly under strongly acidic conditions to afford the desired products after removal of the solvent at reduced pressure in analytically pure form and in good yield.
X-ray quality crystals of H21 were obtained via vapor diffusion of diethyl ether into a solution of the ligand in methanol. A view of the resulting structure is shown in Figure 1, and crystal data is summarized in Table 1. Perhaps the most striking feature of this structure is the unusual geometry adopted by the ligand, likely a result of both intra- and intermolecular hydrogen bonding and also to a lesser extent π stacking between adjacent 1,2-HOPO rings (vide infra). Both of the individual 1,2-HOPO rings (defined by C1-C5 and N1, and C12-C16 and N4) are planar, with very small root mean square (rms) values (0.0032 and 0.0168 respectively), and the adjacent amide groups (defined by C6, O3, N2 and C11, O5, N3) are similarly also planar. As with similar structures reported previously,38 these amide groups are not coplanar with the adjacent 1,2-HOPO ring system, instead lying almost orthogonal with dihedral angles of ca. 88.8° and 62.2° respectively. The observed short C-O bondlengths between the C1-O2 and C16-O7 atoms at 1.26 Å and 1.27 Å respectively indicate the ligand is predominately in the ‘keto’ form. Indeed, 1,2-HOPO based ligand systems have previously been referred to as ‘cyclic hydroxamic acids’ rather than as the tautomeric conjugated aromatic ring system, based on similarity of UV-visible spectra to simpler analogs which cannot undergo this keto-enol tautomerisation.39
An examination of the crystal packing for H21 reveals a secondary arrangement of two distinct ligands to form dimers, which are held together by the π stacking of adjacent 1,2-HOPO ring systems at a separation of ca. 3.4 Å and a complex network of intra- and intermolecular hydrogen bonds. For example, the protons of the phenolic O1 and O6 atoms form complementary bifurcated intermolecular H-bonding interactions with the keto O7 (O1-H1···O7 = 1.75 Å) and neighboring phenolic O6 atom (O1-H1···O6 = 2.46 Å), and keto O2 (O6-H6···O2 = 1.57 Å) and neighboring phenolic O1 atoms (O6-H6···O1 = 2.52 Å) respectively. An additional intermolecular interaction between the amide N3 proton and keto O7 atom (N3-H3···O7 = 2.13 Å) was also noted. Lastly, the presence of a single co-crystallized solvent water molecule may also have had a significant influence on the observed ligand geometry, since this molecule makes a total of three intermolecular H-bonding contacts (N2-H2A···O1W = 2.11 Å, O1W-H1W1···O3 = 1.91 Å, O1W-H1W2···O7 = 2.12 Å,) which link adjacent dimer units.
The complexation of either the 5LIO-1,2-HOPO (H21) or 5LI-1,2-HOPO (H22) ligands with various LnCl3·6H2O salts (Ln = Eu, Sm, Gd) has been readily achieved using the appropriate 1:2 metal:ligand stoichiometry in the presence of pyridine acting as a base, and using MeOH as the solvent. After a short reflux period of ca. 4-6 hours, the desired ML2 complexes can be isolated upon cooling by filtration as the pyridinium salts in excellent yield and in analytically pure form. As detailed in the preceding communication,18 dissolving the isolated pyridinium salts of these complexes in an organic solvent such as MeOH or DMF in the presence of a smaller monocationic species such as tetramethylammonium or dimethylammonium followed by vapor diffusion with diethyl ether facilitated ready isolation of X-ray quality crystals and we previously reported18 the structure of the C4H12N
+[Eu(1)2]– complex. Herein,
X-ray quality crystals were also obtained for the following complexes; C4H12N+[Sm(1)2]
–·CH3OH·H2O, C4H12N
+[Gd(1)2]–, C2H8N
+[Eu(2)2]–·(DMF)2, and C2H8N
+[Sm(2)2]−·(DMF)1.5 where C4H12N
+ and C2H8N
+ are the tetramethylammonium or dimethylammonium cations respectively. For completeness, the crystal data for the previously reported and new complexes are both summarized in Table 1, and corresponding views of these complexes are shown in Figures 2-4.
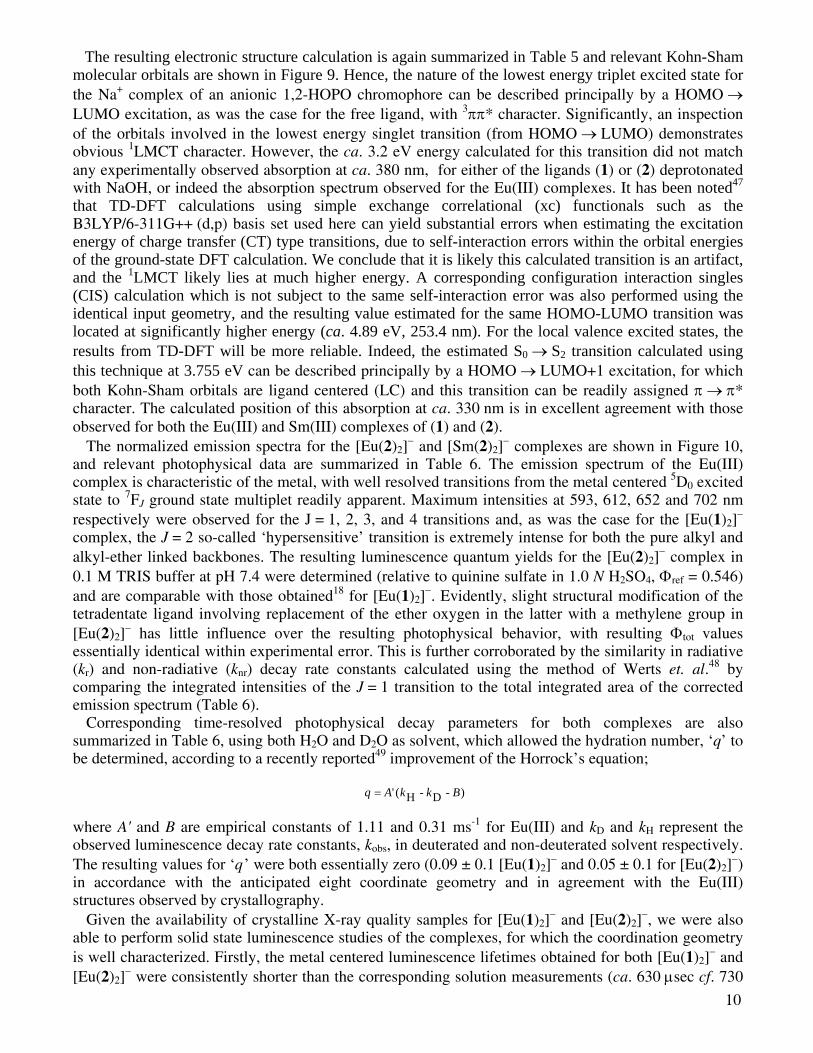
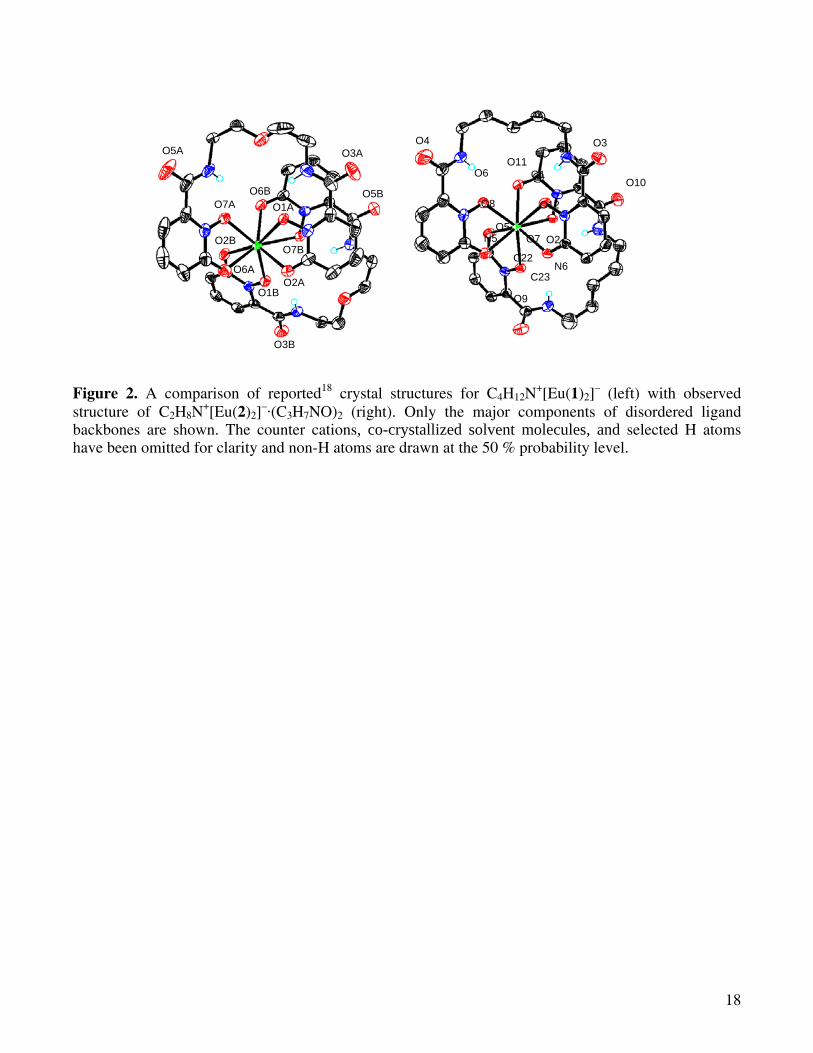
The [Eu(2)2]– complex anion is shown in Figure 2, where the striking similarity to the previously
reported [Eu(1)2]– structure is also clearly evident. Relevant bond lengths are also summarized in
Table 2. For both these structures, the oxophilic Eu(III) cation is surrounded by a total of eight oxygen donors, four from each of the two bis-bidentate ligands, with average Eu-O bond lengths of ca. 2.40 Å.

7
In both complexes, a commonly observed feature are the strong intramolecular hydrogen bonding interactions between the amide proton and the adjacent coordinated N-hydroxyl oxygen atoms, with an average distance of 1.93 Å for [Eu(1)2]
– and 1.90 Å for [Eu(2)2]–. For the latter, only three of the four
maximum possible interactions of this type were observed, as one of the amide groups in this complex lies twisted out of plane to the adjacent 1,2-HOPO ring systems (N6-C23-C22-N5 dihedral angle, θ = 84°). Significantly, this seemingly large distortion seems to have had little effect on the overall morphology of the final structure. For the [Eu(1)2]
– structure, the central ether oxygen of each ligand backbone is also involved in an intramolecular hydrogen bonding interaction with the amide protons. Lastly, it is relevant to note the orientation of each of the tetradentate ligands with respect to the other is almost identical between the two complexes, as shown in Figure 2.
The corresponding crystal structures for the ML2 complexes of H21 and H22 with Sm(III) are shown in Figure 3 and relevant bond lengths are again summarized in Table 2. As was the case with Eu(III), each Sm(III) metal centre is overall eight coordinate in each of the complex anions, with four donor atoms provided per ligand. The average Sm-O bond lengths are essentially identical, at ca. 2.41 Å, which are slightly larger when compared to the corresponding Eu(III) complexes (as expected due to the familiar lanthanide contraction40). A closer analysis of Figure 3 reveals a major and very significant difference between the [Sm(1)2]
– and [Sm(2)2]– structures. In the latter case, the orientation of each of
the tetradentate ligands with respect to each other is essentially identical to that observed for both Eu(III) complexes (see Figure 2) whereas for [Sm(1)2]
–, the orientation of the two bis-bidentate ligands are quite different. Hence, for this complex, the two five atom linkages between each 1,2-HOPO chelate can be described as being located on the same ‘face’ of the complex (forming a ca. -55° dihedral angle, as viewed down an imaginary rotational axis including the metal center and lying perpendicular to the page as drawn in Figure 3). By contrast, for the other three complexes discussed thus far, the five atom linker between each 1,2-HOPO chelate are offset by ca. 120° such that they lie almost on the opposite ‘face’ of the complex. As evidenced by the similarity in coordinate bondlengths, however, this striking difference in orientation of the ligand backbones has little influence over the final structure of the complex. Nonetheless, it does serve to illustrate that each bis-bidentate chelate group is free to rotate with respect to the other, and it is likely the complexes will display fluxional behavior in solution.
Lastly, a view of the structure obtained for the [Gd(1)2]– complex anion is shown in Figure 4, and
relevant bond lengths are summarized in Table 2. Unfortunately, the quality of the crystal obtained for this complex was quite low, resulting in relatively poor diffraction data compared to the other complexes, but nonetheless a tenable solution was obtained. In keeping with the expected lanthanide contraction, the smaller Gd(III) metal centre exhibits slightly shorter Gd-O bondlengths, averaging 2.32 Å. The hydrogen bonding pattern observed for the Eu(III) and Sm(III) complexes between amide N-H protons adjacent to the 1,2-HOPO ring system and the coordinated hydroxyl oxygen atom are maintained for the Gd(III) complex, as are the intramolecular H bonds to the central ether oxygen of the ligand. Lastly, the orientation of each ligand backbone with respect to the other again mimics that seen in both the Eu(III) complexes and also the structure of [Sm(2)2]
–, where each of the five atom linkages are on opposite faces of the structure, offset by a torsional angle of ca. 125°.
An important structural parameter which can also be obtained from the crystallographic data is the shape measure, SM,41, 42 defined as:
⎥⎥⎦
⎤
⎢⎢⎣
⎡−= ∑
=
m
iiim
SM1
2)(1min θδ
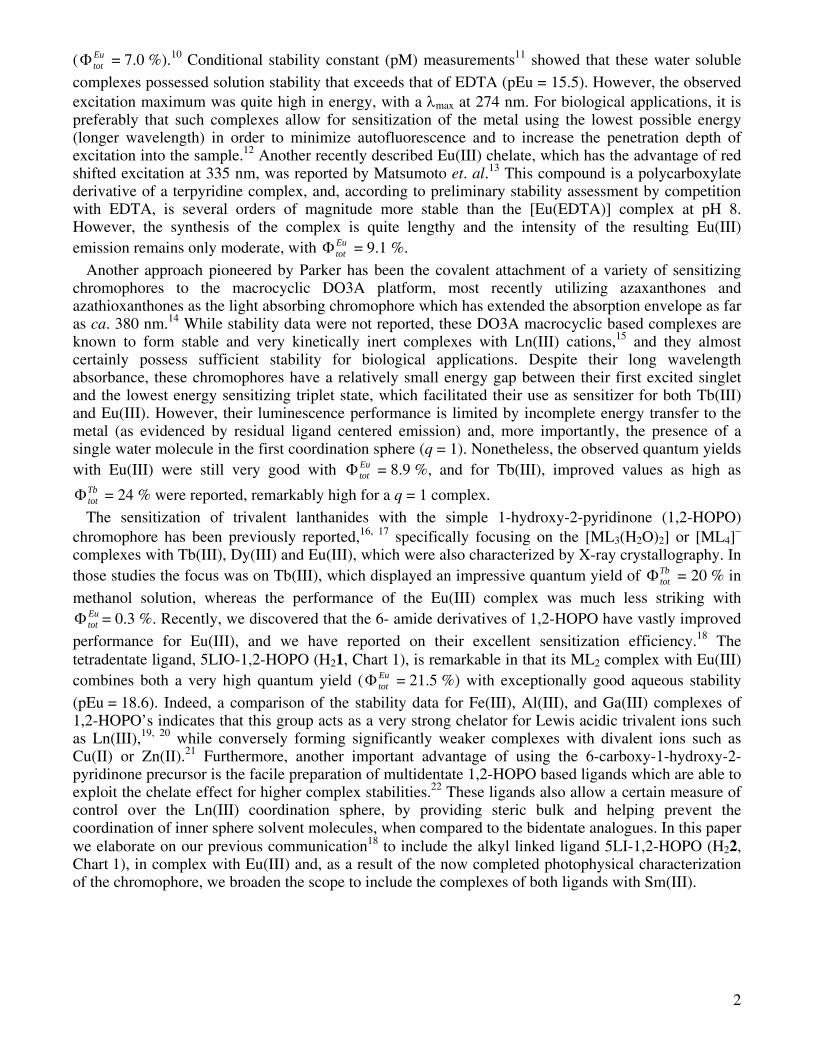
This is a measure of the agreement in the variance of dihedral angles along all edges between the polyhedron derived from the crystal structure and the idealized cases. For the eight coordinate geometry, the three most common idealized coordination polyhedra are shown in Figure 5, and correspond to the bicapped trigonal prismatic (C2v), square antiprismatic (D4d) and trigonal dodecahedral (D2d) geometries. The lowest value of SM for the three pairs represents the best fit to the closest idealized geometry, and resulting shape measure calculations for the five complexes studied herein are summarized in Table 3. It is readily apparent the closest match for most of the complexes was

8
the bicapped trigonal prismatic (C2v) geometry, with all but the [Sm(1)2]– complex displaying this as the
closest corresponding ideal coordination polyhedron. Notably, it was for only this complex that the orientation of the five atom linkages between 1,2-HOPO chelate groups differed with respect to each other (vide supra), and this structural difference is also likely the cause of the differing shape measure result.
Solution Thermodynamics The protonation constants of 5LI-1,2-HOPO (H22) were determined by potentiometry, with resulting
parameters as summarized in Table 4. These values were also confirmed by spectrophotometric titrations, and were subsequently used to determine the calculated molar absorbance of the neutral H22, anionic H2−, and dianionic 22− forms of the ligand as shown in Figure 7. These can be compared directly to those previously reported18 for 5LIO-1,2-HOPO (H21). As anticipated, the differing five carbon atom linkage has only a slight effect on the acidities of the two ligands.
It has been shown elsewhere43 that the difference between pKa1 and pKa2 of a diprotic ligand can be used as a measure of the average separation between protonation sites. Applied to the current situation, the difference in pKa values is slightly lower for H22 at 1.13 compared to H21 at 1.60 as shown in Table 4. Since both the 5LI- and 5LIO- backbones span approximately the same distance when fully elongated, it is reasonable that the differing protonation behavior as expressed by the difference in pKa values can be attributed to the presence of the central ether oxygen atom of the latter, resulting in a closer intermolecular distance on average between protonation sites. This can be rationalized by the presence of an intervening hydrogen bonding network, as drawn in Chart 1, involving the amide protons and the central ether oxygen, which ensures the two N-hydroxamate functional groups remain in close proximity, and may also preorganize the 5LIO-1,2-HOPO ligand for metal chelation. The presence of this hydrogen bonding network for 5LIO-1,2-HOPO may also account for the slight difference in pKa’s observed between the two differing ligands.
From the sum of pKa values (equivalent to the overall ligand acidity), it can be anticipated that H22, as the more basic ligand, will form a more stable ML2 complex than H21. Unfortunately, the cumulative formation constants with Eu(III) could not be measured directly, since Eu(III) was not released at pH values as low as 1.6 under the experimental conditions utilized. Hence, competition titration experiments as described elsewhere18 using DTPA as a known competitor were required to experimentally determine β120, and this number was then fixed in subsequent refinements of potentiometric low pH titration data to obtain β110 and β121, with the resulting parameters as summarized in Table 4. While the β120 (and pEu values) are quite similar, a close inspection of this data reveals the expected improvement in ML2 complex stability for the H22 ligand was not borne out experimentally, instead revealing the H21 ligand forms the more stable ML2 chelate, with pEu = 18.65 (10) for [Eu(1)2]
– versus pEu = 18.35 (5) for [Eu(2)2]–. As a rationale for this apparent
inconsistency in chelate strengths, again, a consideration of the hydrogen bonding network operant between the two 1,2-HOPO units, and hence the rigidity of the backbone is instructive.
In the present case, hydrogen bonding interactions between the amide protons and the ether oxygen were observed crystallographically and it can be assumed that these hydrogen bond interactions will persist in solution. The effect of these interactions would be to rigidify the ligand and hence confer a slightly improved chelate effect, therefore increasing the stability for the ensuing H21 based complexes. For the aminocarboxylate ligands EEDTA and PeDTA (Chart 2), conditional stability measurements yielded pM values of 15.73 and 8.07 respectively with Gd(III).35, 44 In this case, it was presumed that the ether oxygen atom of EEDTA is also coordinated to the metal ion, which would contribute ca. 1.6 log units per oxygen atom coordinated. The remaining difference in stability of ca. 4 log units was attributed to the effect of rigidifying the scaffold. In the present case, the less pronounced difference observed in Eu(III) complex stability between H21 or H22 is most likely due to a less optimal geometry for these intramolecular hydrogen bonding interactions.
Lastly, as further evidence of the [Eu(1)2]– and [Eu(2)2]
– complex stabilities, a comparison with ethylenediaminetetraacetic acid (EDTA) can be made. EDTA is a common assay component used in

9
biological samples (usually for the removal of Fe(III) or other interfering metal cations) which also forms relatively strong octadentate complexes with the oxophilic Ln(III) cation (eg. pEu = 15.48). It is worthy then to note that, under pM conditions, the present [Eu(1)2]
− or [Eu(2)2]− complexes can tolerate
as much as a 1000 fold excess of EDTA relative to Eu(III), even though they are only tetradentate ligands, with no significant impact on the speciation and consequent luminescence intensity (< 7 % decrease) as demonstrated in Figure 6. Photophysics
The absorption spectra of the ligand H22 in its various protonation states are shown in Figure 7, together with that of the [Eu(2)2]
− complex. Notably, the absorption spectrum of H22 is essentially identical to that reported previously for H21.18 Specifically, either ligand with the 5LI- or 5LIO- backbones yield a broad electronic envelope in the near UV assigned to a transition with mixed n → π*, π → π* parentage (vide infra) with an apparent maxima at ca. 305 nm (ε ~ 12,400 M-1 cm-1). Upon deprotonation of either ligand to form the dianionic species, this band shifts to ca. 345 nm and is reduced slightly in intensity (ε ~ 8, 900 M-1 cm-1).
Corresponding electronic structure calculations using TD-DFT were also performed using Gaussian’0345 in order to further characterize the excited state of the 1,2-HOPO chromophore. As a simplified model, only the 6- methyl amide of 1,2-HOPO was used as the input structure, and this was first geometry optimized with no symmetry constraints to give the relaxed output geometry shown in Figure 8. The output geometry obtained is reasonable, with all non-H atoms lying essentially in a single plane. The calculated structure also reproduced the expected strong H bonding interactions between the N-hydroxyl proton and adjacent keto oxygen (O1-H⋅⋅⋅O2 = 1.79 Å) and similarly, between the amide proton and the N-hydroxyl oxygen atom (N2-H⋅⋅⋅O1 = 1.89 Å).
A summary of the electronic structure calculation is given in Table 5 and consideration of these results revealed the nature of the first excited singlet state of the 1,2-HOPO chromophore can be described principally by a HOMO → LUMO excitation, with a smaller contribution from the HOMO-4 → LUMO+1 excitation. Inspection of the relevant Kohn-Sham molecular orbitals also shown in Figure 8 reveal these transitions to be mixed π-π* and n-π* respectively. Similarly, the nature of the of the lowest triplet state (T0) can be described principally by a HOMO → LUMO excitation, i.e. a 3ππ* transition.
The absorption spectrum of [Eu(2)2]− is also shown in Figure 7, and is again almost identical to that
previously observed18 for [Eu(1)2]− (Table 6). Specifically, the ML2 complexes for either (1) or (2) with
both Eu(III) or Sm(III) gave essentially identical absorption profiles, with an apparent maxim at ca. 330 nm (εmax = 9,200 M-1 cm-1) assigned to a transition with mixed n → π* and π → π* parentage.
A second TD-DFT calculation was also performed using Gaussian’0345 in order to further characterize the excited state of the anionic 1,2-HOPO chromophore in complex with a metal cation. However, rather than performing computationally expensive calculations involving a trivalent lanthanide, we have adopted an approach analogous to that reported46 previously by Picard et. al., in this case replacing the N-hydroxyl proton with a monovalent Na+ cation, and adopting a bidentate chelating mode for the oxygen atoms in order to mirror the binding mode of a trivalent Ln(III) cation. While this is undoubtedly a crude model, we have found this approach to be quite useful as a tool for understanding the electronic structure. It must also be stressed that the goal of this ‘calculation’ is not to determine the electronic states of the Ln(III) cation, but rather to approximate the energy for the lowest excited singlet and triplet states of the ligand.
The resulting output geometry shown in Figure 9 where it is evident that all non-H atoms are essentially lying in a plane, and also the Na+ cation has retained its bidentate coordination mode upon energy minimization. Bond lengths obtained between the sodium and O1 and O2 respectively were 2.16 Å and 2.14 Å respectively, slightly smaller than those observed with Eu(III) by X-ray crystallography. Nonetheless, the geometries are very similar and a common feature of both the Na+ model and the Eu(III) X-ray structures is the conserved intramolecular H-bonding interaction between the amide proton and N-hydroxyl oxygen atom.
10
The resulting electronic structure calculation is again summarized in Table 5 and relevant Kohn-Sham molecular orbitals are shown in Figure 9. Hence, the nature of the lowest energy triplet excited state for the Na+ complex of an anionic 1,2-HOPO chromophore can be described principally by a HOMO → LUMO excitation, as was the case for the free ligand, with 3ππ* character. Significantly, an inspection of the orbitals involved in the lowest energy singlet transition (from HOMO → LUMO) demonstrates obvious 1LMCT character. However, the ca. 3.2 eV energy calculated for this transition did not match any experimentally observed absorption at ca. 380 nm, for either of the ligands (1) or (2) deprotonated with NaOH, or indeed the absorption spectrum observed for the Eu(III) complexes. It has been noted47 that TD-DFT calculations using simple exchange correlational (xc) functionals such as the B3LYP/6-311G++ (d,p) basis set used here can yield substantial errors when estimating the excitation energy of charge transfer (CT) type transitions, due to self-interaction errors within the orbital energies of the ground-state DFT calculation. We conclude that it is likely this calculated transition is an artifact, and the 1LMCT likely lies at much higher energy. A corresponding configuration interaction singles (CIS) calculation which is not subject to the same self-interaction error was also performed using the identical input geometry, and the resulting value estimated for the same HOMO-LUMO transition was located at significantly higher energy (ca. 4.89 eV, 253.4 nm). For the local valence excited states, the results from TD-DFT will be more reliable. Indeed, the estimated S0 → S2 transition calculated using this technique at 3.755 eV can be described principally by a HOMO → LUMO+1 excitation, for which both Kohn-Sham orbitals are ligand centered (LC) and this transition can be readily assigned π → π* character. The calculated position of this absorption at ca. 330 nm is in excellent agreement with those observed for both the Eu(III) and Sm(III) complexes of (1) and (2).
The normalized emission spectra for the [Eu(2)2]− and [Sm(2)2]
− complexes are shown in Figure 10, and relevant photophysical data are summarized in Table 6. The emission spectrum of the Eu(III) complex is characteristic of the metal, with well resolved transitions from the metal centered 5D0 excited state to 7FJ ground state multiplet readily apparent. Maximum intensities at 593, 612, 652 and 702 nm respectively were observed for the J = 1, 2, 3, and 4 transitions and, as was the case for the [Eu(1)2]
− complex, the J = 2 so-called ‘hypersensitive’ transition is extremely intense for both the pure alkyl and alkyl-ether linked backbones. The resulting luminescence quantum yields for the [Eu(2)2]
− complex in 0.1 M TRIS buffer at pH 7.4 were determined (relative to quinine sulfate in 1.0 N H2SO4, Φref = 0.546) and are comparable with those obtained18 for [Eu(1)2]
−. Evidently, slight structural modification of the tetradentate ligand involving replacement of the ether oxygen in the latter with a methylene group in [Eu(2)2]
− has little influence over the resulting photophysical behavior, with resulting Φtot values essentially identical within experimental error. This is further corroborated by the similarity in radiative (kr) and non-radiative (knr) decay rate constants calculated using the method of Werts et. al.48 by comparing the integrated intensities of the J = 1 transition to the total integrated area of the corrected emission spectrum (Table 6).
Corresponding time-resolved photophysical decay parameters for both complexes are also summarized in Table 6, using both H2O and D2O as solvent, which allowed the hydration number, ‘q’ to be determined, according to a recently reported49 improvement of the Horrock’s equation;
)-D-H(' BkkAq =
where A' and B are empirical constants of 1.11 and 0.31 ms-1 for Eu(III) and kD and kH represent the observed luminescence decay rate constants, kobs, in deuterated and non-deuterated solvent respectively. The resulting values for ‘q ’ were both essentially zero (0.09 ± 0.1 [Eu(1)2]
− and 0.05 ± 0.1 for [Eu(2)2]−)
in accordance with the anticipated eight coordinate geometry and in agreement with the Eu(III) structures observed by crystallography.
Given the availability of crystalline X-ray quality samples for [Eu(1)2]− and [Eu(2)2]
−, we were also able to perform solid state luminescence studies of the complexes, for which the coordination geometry is well characterized. Firstly, the metal centered luminescence lifetimes obtained for both [Eu(1)2]
− and [Eu(2)2]
− were consistently shorter than the corresponding solution measurements (ca. 630 μsec cf. 730

11
μsec in H2O), which may be attributed to a self-quenching mechanism operant in the closely packed solid (Eu···Eu ~ ca. 9 Å) as seen elsewhere for other Ln(III) systems.50 Of considerable more interest, however, was a closer inspection of the solid state compared with solution spectra in the region of the 5D0 → 7F0,1 and 5D0 → 7F2 transitions from 575-600 nm and 600-640 nm respectively.
Importantly, for both complexes, a single 5D0 → 7F0 transition is observed, indicative of a single emitting species present in solution, and enabling site symmetry determination.51 For the 5D0 → 7F1 transition, crystal field splitting of the J = 1 level results in a maximum of three (2J + 1) peaks in a low symmetry environment (eg. C2v) versus only two peaks for the hexagonal, trigonal or tetragonal point groups (eg. D2d, D4d). The expected transitions derived from their principal character (either magnetic or electrical dipole) are shown in Table 7 for the three most common eight coordinate Ln(III) geometries that were shown previously in Figure 5.
As shown in the inset of Figure 10, three peaks are clearly evident in the 5D0 → 7F1 region of the luminescence spectrum for a microcrystalline sample of [Eu(2)2]
−, with maxima at 587.7, 591.6 and 594.1 nm. While the limited resolution (ca. 0.3 nm) of the fluorescence spectrometer precludes a definitive determination of the exact point group of the complex, the data in Table 7 show that for the three most common coordination polyhedra, the best match to the observed luminescence spectra is obtained for the bicapped trigonal prism (C2v) geometry. It is certainly notable that this result agrees with the structure from X-ray crystallography, which shape analysis showed to be closest to C2v geometry.
By contrast, the corresponding emission spectrum from aqueous solution of [Eu(2)2]− gave only two
discernable peaks at 587.7 and 593.5 nm, behavior indicative of a solution structure with higher symmetry than that observed in the solid state. Again, the data in Table 7 imply D4d or D2d symmetries, and further analysis of the band shape for the J = 2 band at ca. 610 nm shows a distinct splitting of this band into two components (a smaller shoulder evident to lower energy), suggesting D2d symmetry as the closest match between the three idealized coordination polyhedra. Returning to the results from shape analysis for the [Sm(1)2]
− complex, it was noted that this complex had the closest match to D2d site symmetry, and in this case the ligand scaffolds were located on the same ‘face’ of the complex. As such, we may tentatively correlate this change in symmetry upon dissolution to the presence of an ensemble of emitting species, most with predominantly D2d symmetry. This differing symmetry when compared to the solid state structure can be realized in solution by free rotation of one ligand with respect to the other (about the central metal ion), although, given the millisecond lifetime of the Eu(III) luminescence, it is not possible to determine whether this change in symmetry occurs prior to or subsequent to formation of the excited state.
Metal centered luminescence was also seen as a faint pink emission upon UV irradiation from the Sm(III) complexes of (1) and (2), with several apparent maxima evident at ca. 563, 599, 646, and 710 nm corresponding to transitions from the 4G5/2 excited state to lower 6FJ and 6HJ levels. As shown in Figure 10, the most intense of these was the 4F9/2 → 6H9/2 apparent at ca. 646 nm. As was the case for the Eu(III) complexes, the spectra of either complex with (1) or (2) are essentially identical and the corresponding luminescence quantum yields and lifetimes are also summarized in Table 6. Notably, the Sm(III) spectra are less amenable to structural interpretation due to increased degeneracy of the states involved compared with Eu(III), and hence the corresponding solid state experiments were not performed.
The potential for ML2 complexes of (1) and (2) to sensitize other visible emitting lanthanide cations, notably Dy(III) and Tb(III), was also evaluated, however, metal centered luminescence was only noted for the Eu(III) and Sm(III) complexes. This behavior can be rationalized by a comparison and analysis of the room temperature and low temperature (77 K) phosphorescence spectra for the [Gd(1)2]
− complex (which lacks a low energy metal centered acceptor level) in a 1:1 EtOH:MeOH (v/v) glassing solvent, shown in Figure 11. At room temperature, relative ligand centered emission from the Gd(III) complex is very weak, with a faint signal attributed to singlet emission from the ligand apparent at ca. 400 nm. However, upon cooling to 77 K, this singlet emission is enhanced and a much more intense band appears from 450-600 nm, which can be attributed to phosphorescence from the ligand T0 state. While

12
this band displayed a poorly resolved vibronic progression, the v00 electronic origin could not be unambiguously assigned. Rather, the lowest T0 energy was estimated by spectral deconvolution of the 77 K luminescence signal into several overlapping Gaussian functions to approximate an unresolved vibrational progression of ca. 1000-1100 cm-1. The resulting T0 energy was evaluated to be ca. 21,260 cm-1, which is remarkably similar to the value estimated using TD-DFT methods for the [Na(6-MeAmide-1,2-HOPO)] complex of 21,365 cm-1.
From the experimentally observed triplet energy, the sensitizing properties of the 1,2-HOPO chromophore can be readily understood in terms of the so-called energy gap law,52, 53 since the energy of this level is located ca. 2230 cm-1 and 3980 cm-1 higher in energy than the potential 5D1 and 5D0 accepting levels in Eu(III), which facilitates efficient energy transfer. Similarly, for Sm(III), the T0 energy of the ligand is ca. 3360 cm-1, 2360 cm-1 and 1210 cm-1 higher than the corresponding 4G5/2, 4F3/2, and 4G7/2 levels. By contrast, the lowest energy Tb(III) and Dy(III) acceptor levels are at 20,400 cm-1 (5D4) and 21,100 cm-1 (4F9/2), both of which are only slightly lower in energy than the T0 state, and much less than the ca. 2500 cm-1 energy gap necessary to promote efficient sensitization of these metal centres.52, 53
Conclusions
The 1-hydroxy-2-pyridinone chelate group has proven to be a remarkably efficient sensitizer for Eu(III), which also forms extremely stable complexes in aqueous solution. The resistance to decomplexation of compounds of the type described herein, despite the presence of strong competitors such as EDTA, will be essential for their practical usage in bioanalytical applications. Furthermore, this chelate group can now be readily accessed, and the synthetic intermediates outlined herein allow for ease of systematic variations in the backbone connecting bis-bidentate ligands, and also allow for the preparation of more complex hexa- and octadentate derivatives.
A thorough investigation of the photophysical properties for these Eu(III) 1,2-HOPO complexes, including the location of the lowest energy triplet state, prompted our investigation with Sm(III) and has elucidated a more complete understanding of the sensitization process in terms of the energy gap between the excited singlet and triplet levels. Similarly, the results gained from TD-DFT calculations were advantageous in deciphering the electronic structure, and agreed well with the experimental data, despite the obvious simplicity of the model. Indeed, these results may prove useful as a predictive tool to guide synthetic efforts, at least in as far as ligand centered transitions can be predicted with a high level of accuracy.
Acknowledgements
This work was partially supported by the NIH (Grant HL69832) and supported by the Director, Office of Science, Office of Basic Energy Sciences, and the Division of Chemical Sciences, Geosciences, and Biosciences of the U.S. Department of Energy at LBNL under Contract No. DE-AC02-05CH11231. This technology is licensed to Lumiphore, Inc. in which some of the authors have a financial interest. Financial support was provided to C.J.J. by the German Research Foundation (DFG). The authors thank Dr. Kathleen Durkin and Ms. Amanda Samuel for assistance with the TD-DFT calculations.
Supporting Information Available. X-ray crystallographic files (in CIF format) and Gaussian’03 output from TD-DFT and CIS
calculations (in ASCII format). This material is available free of charge via the Internet at http://pubs.acs.org.
References
1. Vitzthum, F.; Bernhagen, J., Rec. Res. Dev. Anal. Biochem. 2002, 2, 65-93.

13
2. Leca-Bouvier, B.; Blum, L. J., Anal. Lett. 2005, 38, 1491-1517. 3. Kimura, H.; Matsumoto, K.; Mukaida, M., J. Anal. Toxicol. 2005, 29, 799-805. 4. Jones, S. G.; Lee, D. Y.; Wright, J. F.; Jones, C. N.; Teear, M. L.; Gregory, S. J.; Burns, D. D., J.
Fluorescence 2001, 11, 13-21. 5. Handl, H. L.; Gillies, R. J., Life Sci. 2005, 77, 361-371. 6. Petoud, S.; Cohen, S. M.; Bünzli, J.-C. G.; Raymond, K. N., J. Amer. Chem. Soc. 2003, 125,
13324-13325. 7. Hemmila, I.; Dakubu, S.; Mukkala, V. M.; Siitari, H.; Lovgren, T., Anal. Biochem. 1984, 137,
335-43. 8. Alpha, B.; Balzani, V.; Lehn, J. M.; Perathoner, S.; Sabbatini, N., Angew. Chem. 1987, 99, 1310-
11. 9. Mathis, G., Clin. Chem. 1993, 39, 1953-9. 10. Chatterton, N.; Bretonniere, Y.; Pecaut, J.; Mazzanti, M., Angew. Chem. Int. Ed. 2005, 44, 7595-
7598. 11. pM = -log10[M]free. Defined as the negative log of the free metal (M) concentration under pH 7.4
conditions with 10 μM [L]total and 1 μM [M]total. 12. Weissleder, R.; Ntziachristos, V., Nat. Med. 2003, 9, 123-8. 13. Nishioka, T.; Yuan, J.; Yamamoto, Y.; Sumitomo, K.; Wang, Z.; Hashino, K.; Hosoya, C.;
Ikawa, K.; Wang, G.; Matsumoto, K., Inorg. Chem. 2006, 45, 4088-4096. 14. Atkinson, P.; Findlay, K. S.; Kielar, F.; Pal, R.; Parker, D.; Poole, R. A.; Puschmann, H.;
Richardson, S. L.; Stenson, P. A.; Thompson, A. L.; Yu, J., Org. & Biomol. Chem. 2006, 4, 1707-1722.
15. Kumar, K.; Chang, C. A.; Francesconi, L. C.; Dischino, D. D.; Malley, M. F.; Gougoutas, J. Z.; Tweedle, M. F., Inorg. Chem. 1994, 33, 3567-75.
16. Tedeschi, C.; Azema, J.; Gornitzka, H.; Tisnes, P.; Picard, C., Dalton Trans. 2003, 1738-1745. 17. Tedeschi, C.; Picard, C.; Azema, J.; Donnadieu, B.; Tisnes, P., New J. Chem. 2000, 24, 735-737. 18. Moore, E. G.; Xu, J.; Jocher, C. J.; Werner, E. J.; Raymond, K. N., J. Amer. Chem. Soc. 2006,
128, 10648-10649. 19. Clarke, E. T.; Martell, A. E.; Reibenspies, J., Inorg. Chim. Acta 1992, 196, 177-83. 20. Li, Y. J.; Martell, A. E., Inorg. Chim. Acta 1993, 214, 103-11. 21. Farkas, E.; Kozman, E.; Petho, M.; Herlihy, K. M.; Micera, G., Polyhedron 1998, 17, 3331-
3342. 22. Moore, E. G.; Jocher, C. J.; Xu, J.; Werner, E. J.; Raymond, K. N., Inorg. Chem. 2007, 46, 5468-
5470. 23. Xu, J.; Churchill, D. G.; Botta, M.; Raymond, K. N., Inorg. Chem. 2004, 43, 5492-5494. 24. SMART, Version 5.059: Area-Detector Software Package; Bruker Analytical X-ray Systems,
Inc.: Madison, WI, 1999. 25. SAINT, Version 7.07B: SAX Area-Detector Integration Program; Siemens Industrial
Automation, Inc.: Madison, WI, 2005. 26. XPREP, Version 6.12: Part of the SHELXTL Crystal Structure Determination Package; Bruker
AXS Inc.: Madison, WI, 1995. 27. Sheldrick, G. SADABS, Version 2.10: Siemens Area Detector Absorption Correction Program;
University of Göttingen: Göttingen, Germany, 2005. 28. WinGX 1.70.01: Farrugia, L. J. J. Appl. Crystallogr. 1999, 32, 837-838. 29. SIR92: Altomare, A.; Cascarano, G.; Giacovazzo, C.; Guagliardi, A. J. Appl. Crystallogr. 1993,
26, 343-350. 30. Sheldrick, G. M. SHELX97 - Programs for Crystal Structure Analysis; Institut fur Anorganische
Chemie der Universitat:Gottingen, Germany, 1998. 31. ORTEP-3 for Windows: Farrugia, L. J. J. Appl. Crystallogr. 1997, 30, 565. 32. Johnson, A. R.; O'Sullivan, B.; Raymond, K. N., Inorg. Chem. 2000, 39, 2652-2660. 33. Gans, P.; Sabatini, A.; Vacca, A., Talanta 1996, 43, 1739-1753.

14
34. Gans, P.; Sabatini, A.; Vacca, A., Annali di Chimica (Rome) 1999, 89, 45-49. 35. Martell, A. E.; Smith, R. M.; Editors, Critical Stability Constants, Vol. 1. 1974; p 263-270. 36. Crosby, G. A.; Demas, J. N., J. Phys. Chem. 1971, 75, 991-1024. 37. White, D. L.; Durbin, P. W.; Jeung, N.; Raymond, K. N., J. Med. Chem. 1988, 31, 11-8. 38. Scarrow, R. C.; Riley, P. E.; Abu-Dari, K.; White, D. L.; Raymond, K. N., Inorg. Chem. 1985,
24, 954-67. 39. Cunningham, K. G.; Newbold, G. T.; Spring, F. S.; Stark, J., J. Chem. Soc. 1949, 2091-4. 40. Seitz, M.; Oliver, A. G.; Raymond, K. N., J. Amer. Chem. Soc. 2007, 129, 11153-11160. 41. Porai-Koshits, M. A.; Aslanov, L. A., Zhurnal Strukturnoi Khimii 1972, 13, 266-76. 42. Kepert, D. L., Prog. Inorg. Chem. 1978, 24, 179-249. 43. Adams, E. Q., J. Amer. Chem. Soc. 1916, 38, 1503-10. 44. Bianchi, A.; Calabi, L.; Corana, F.; Fontana, S.; Losi, P.; Maiocchi, A.; Paleari, L.; Valtancoli,
B., Coord. Chem. Rev. 2000, 204, 309-393. 45. Gaussian 03, Revision C.02, Frisch, M. J.; Trucks, G. W.; Schlegel, H. B.; Scuseria, G. E.;
Robb, M. A.; Cheeseman, J. R.; Montgomery, Jr., J. A.; Vreven, T.; Kudin, K. N.; Burant, J. C.; Millam, J. M.; Iyengar, S. S.; Tomasi, J.; Barone, V.; Mennucci, B.; Cossi, M.; Scalmani, G.; Rega, N.; Petersson, G. A.; Nakatsuji, H.; Hada, M.; Ehara, M.; Toyota, K.; Fukuda, R.; Hasegawa, J.; Ishida, M.; Nakajima, T.; Honda, Y.; Kitao, O.; Nakai, H.; Klene, M.; Li, X.; Knox, J. E.; Hratchian, H. P.; Cross, J. B.; Bakken, V.; Adamo, C.; Jaramillo, J.; Gomperts, R.; Stratmann, R. E.; Yazyev, O.; Austin, A. J.; Cammi, R.; Pomelli, C.; Ochterski, J. W.; Ayala, P. Y.; Morokuma, K.; Voth, G. A.; Salvador, P.; Dannenberg, J. J.; Zakrzewski, V. G.; Dapprich, S.; Daniels, A. D.; Strain, M. C.; Farkas, O.; Malick, D. K.; Rabuck, A. D.; Raghavachari, K.; Foresman, J. B.; Ortiz, J. V.; Cui, Q.; Baboul, A. G.; Clifford, S.; Cioslowski, J.; Stefanov, B. B.; Liu, G.; Liashenko, A.; Piskorz, P.; Komaromi, I.; Martin, R. L.; Fox, D. J.; Keith, T.; Al-Laham, M. A.; Peng, C. Y.; Nanayakkara, A.; Challacombe, M.; Gill, P. M. W.; Johnson, B.; Chen, W.; Wong, M. W.; Gonzalez, C.; and Pople, J. A.; Gaussian, Inc., Wallingford CT, 2004.
46. Gutierrez, F.; Tedeschi, C.; Maron, L.; Daudey, J.-P.; Azema, J.; Tisnes, P.; Picard, C.; Poteau, R., Theochem 2005, 756, 151-162.
47. Dreuw, A.; Head-Gordon, M., J. Amer. Chem. Soc. 2004, 126, 4007-4016. 48. Werts, M. H. V.; Jukes, R. T. F.; Verhoeven, J. W., Phys. Chem. Chem. Phys., 2002, 4, 1542-
1548. 49. Supkowski, R. M.; Horrocks, W. D., Jr., Inorg. Chim. Acta 2002, 340, 44-48. 50. Muller, G.; Schmidt, B.; Jiricek, J.; Hopfgartner, G.; Riehl, J. P.; Bünzli, J.-C. G.; Piguet, C., J.
Chem. Soc., Dalton Trans., 2001, 2655-2662. 51. Lanthanide Probes in Life, Chemical and Earth Sciences: Theory and Practice. Bünzli, J-C. G.
Choppin, G. R.: 1989. 52. Latva, M.; Takalo, H.; Mukkala, V.-M.; Matachescu, C.; Rodriguez-Ubis, J. C.; Kankare, J., J.
Lumin., 1997, 75, 149-169. 53. Arnaud, N.; Georges, J., Spectrochim Acta A, Mol Biomol. Spectrosc., 2003, 59, 1829-40.

15
Chart 1. Tetradentate 1,2-HOPO based ligands for sensitization of Eu(III) and Sm(III).
NO
O
O N HO
NH O
N
O
OH H N
O
O
O N HC
NH O
N
O
OH H
H2
5LIO-1,2-HOPO (H21) 5LI-1,2-HOPO (H22)
Chart 2. Structural analogues of the ligand scaffolds for the 1,2-HOPO ligands.
ON N
O
OHHO
O
OHO HO O
CH2
N N
O
OHHO
O
OHO HO O
EEDTA PeDTA

16
N
O
OH
O OH
N
O
OBn
O OH
N
O
OBn
O Cl
N
O
OH
O NHX
HN O
N
O
HO
(ii) (iii)
(iv)
N
O
OBn
O N
SS
K2CO3
N
O
OBn
O NHX
HN O
N
O
BnO
(i)
(v)
Cl
Cl
OO
Cl
H2NX
NH2
SHN
S
HCl/HOAc
(3) (4) (5) (6)
(7) 5LIO-1,2-HOPO-Bn, X=O(8) 5LI-1,2-HOPO-Bn, X=CH2
(H21) 5LIO-1,2-HOPO, X=O(H22) 5LI-1,2-HOPO, X=CH2
X = O, CH2
Scheme 1. Synthesis of 5LIO-1,2-HOPO (H21) and 5LI-1,2-HOPO (H22) via the readily accessible 1,2-HOPO-Bn-thiaz (6).

17
Figure 1. Two views of the crystal structure of (H21) that illustrate the intermolecular hydrogen bonding network (dashed lines - atoms labeled in parenthesis are symmetry related) and π stacking interactions which link each molecule into dimers in the unit cell packing. Selected H atoms have been omitted for clarity and non-H atoms are drawn at the 50 % probability level.
O7
O6
C16
N4C12
C11
O5
N3
O4
N2 O3 C6
C5 N1 O1
O2 C1
O1W
(O7′)
(O3′)
18
Figure 2. A comparison of reported18 crystal structures for C4H12N+[Eu(1)2]
– (left) with observed structure of C2H8N
+[Eu(2)2]–·(C3H7NO)2 (right). Only the major components of disordered ligand
backbones are shown. The counter cations, co-crystallized solvent molecules, and selected H atoms have been omitted for clarity and non-H atoms are drawn at the 50 % probability level.
O1A O6B
O2A
O7A
O6A
O7B O2B
O1B
O3B
O5A O3A
O5B
O4 O3
O9
O10
O2 O7
O11 O1
O12
O6
O8
O5
C23 N6
N5
C22

19
Figure 3. A comparison of observed structures for the C4H12N+[Sm(1)2]
–·CH3OH·H2O (left) and C2H8N
+[Sm(2)2]−·(C3H7NO)1.5 (right) complexes. Only the major components of disordered ligand
backbones are shown. The counter cations, co-crystallized solvent molecules, and selected H atoms have been omitted for clarity and non-H atoms are drawn at the 50 % probability level.
O2A O2B
O6A
O1B
O7A O7B
O1A
O6B
O3B
O5A
O5B
O3A
O3A O4A
O4B
O3B
O1B O5A
O6B
O6A
O5B
O1A
O2B
O2A

20
Figure 4. The C4H12N+[Gd(1)2]
– complex structure. The tetramethylammonium counter cation and selected H atoms have been omitted for clarity and non-H atoms are drawn at the 50 % probability level.
O3B O5B
O5A
O3A
O1A O6B
O7A
O7B
O6A O1B
O2A
O2B

21
Figure 5. The three differing ideal coordination polyhedra of donor atoms (white spheres) for an eight coordinate Ln(III) metal centre (green) are, from left to right, the bicapped trigonal prism (C2v), the square antiprism (D4d) and the trigonal dodecahedron (D2d).

22
Figure 6. Speciation diagram for [Eu(2)2]
− under pM conditions (1 μM Eu(III), 10 μM ligand) in the presence of 1000 fold excess of EDTA.
100
80
60
40
20
0Perc
ent F
orm
atio
n R
elat
ive
to E
u(III
)
9876543pH
[Eu(2)2]− = ————
[Eu(H2)(2)] = − — − —
[Eu(2)(H2O)x]+ = − − — − −
[Eu(EDTA)] = − − − − −

23
20x103
15
10
5
0
Mol
ar E
xtin
ctio
n C
oeff
icie
nt (M
-1cm
-1)
380360340320300280wavelength (nm)
Figure 7. Absorption spectra for the 5LI-1,2-HOPO ligand, H22 (−⋅−⋅−), its monoanion H21- (−⋅⋅−) and dianion 22- (⎯ ⋅⋅) and the corresponding spectra observed for the ([Eu(2)2]
− = ⎯) complex in 0.1 M TRIS buffer at pH 7.4.
H22
H21-
[Eu(2)]−
22-

24
Figure 8. Calculated output geometry obtained from static B3LYP/6-311G++ (d,p) geometry optimization and corresponding molecular orbital diagrams from TD-DFT electronic structure calculations for a model 6-MeAmide-1,2-HOPO chromophore.
N1
N2
O2
O1
O3
Output geometry
HOMO-4 (n=40)
HOMO (n=44)
LUMO (n=45)
LUMO+1 (n=46)

25
Figure 9. Calculated output geometry obtained from static B3LYP/6-311G++ (d,p) geometry optimization and corresponding molecular orbital diagrams from TD-DFT electronic structure calculations for a model [Na(6-MeAmide-1,2-HOPO)] complex. The metal centered character of the LUMO is an artifact of the B3LYP functional calculation (see text).
Output geometry
O3 N2
N1 O1
O2 Na
HOMO-1 (n=48)
HOMO (n=49)
LUMO (n=50)
LUMO+1 (n=51)
LUMO+5 (n=55)

26
1.0
0.8
0.6
0.4
0.2
0.0Emiss
ion
Inte
nsity
(arb
. uni
ts)
750700650600550wavelength (nm)
595590585
Figure 10. Normalized emission spectra (λex = 330 nm) for 1 × 10⁻⁶ M solutions of the Eu(III) (red) and Sm(III) (black) ML2 complexes of (2) in 0.1 M TRIS buffer at pH 7.4 (λex = 330 nm). Inset: A comparison of solid state (black) and solution (red) emission spectra for the [Eu(2)2]
− complex in the 5D0 → 7F1 spectral region.

27
25x106
20
15
10
5
0
Emis
sion
Inte
nsity
(arb
. uni
ts)
28x103 24 22 20 18 16wavenumber (cm-1)
Figure 11. Comparison of room temperature (× 100, black) and 77 K (red) emission spectra of the [Gd(1)]− complex, with spectral deconvolution (blue) of the latter into a vibronic progression of several overlapping Gaussian functions with separations of ca. 1000-1100 cm-1 to determine v00 of the T0 energy.
× 100
v00 ~ 21,260 cm-1

28
Table 1. Summary of crystal data obtained for 5LIO-1,2-HOPO (H21) and 5LI-1,2-HOPO (H22) with several Ln(III) complexes. H21·H2O C4H12N[Eu(1)2]
C4H12N[Sm(1)2]·CH3OH·H2O C4H12N[Gd(1)2] C2H8N[Eu(2)2]
·(C3H7NO)2 C2H8N[Sm(2)2]
·(C3H7NO)1.5 empirical formula C16H20N4O8 C36H44N9O14Eu C37H50N9O16Sm C36H44N9O4Gd C42H57N11O14Eu C40.5H54.5N10.5O13.5Sm mol. wt. [g.mol-1] 396.36 978.76 1027.21 984.05 1091.95 1054.8 crystal system monoclinic monoclinic monoclinic monoclinic monoclinic monoclinic space group P21/n P21/n P21/c P21/c P21/n P21/n a [Å] 15.272 (13) 10.0579 (16) 8.6048 (5) 10.028 (5) 17.3141 (19) 17.3156 (18) b [Å] 6.836 (6) 17.848 (3) 18.4988 (11) 17.771 (5) 13.1648 (14) 13.1786 (14) c [Å] 17.852 (15) 22.642 (4) 26.6387 (16) 22.564 (5) 22.461 (2) 22.469 (2) α [deg.] 90 90 90 90 90 90 β [deg.] 108.307 (11) 92.781 (2) 90.6180(5) 111.087 (19) 112.104 (1) 112.105 (1) γ [deg.] 90 90 90 90 90 90 volume [Å3] 1769 (3) 4059.8 (12) 4240.1 (4) 3752.0 (2) 4743.4 (9) 4750.4(9) Z 4 4 4 4 4 4 density, ρ [g cm-3] 1.488 1.601 1.609 1.742 1.529 1.475 absorption coefficient, μ [mm-1] 0.121 1.623 1.467 1.852 1.399 1.309 F(000) 832 1992 2100 1996 2244 2146 crystal size [mm3] 0.18 × 0.14 × 0.03 0.40 × 0.20 × 0.07 0.30 × 0.20 × 0.02 0.18 × 0.14 × 0.02 0.18 × 0.12 × 0.12 0.15 × 0.14 × 0.09 temperature [C] -145 (2) -138 (2) -155 (2) -145 (2) -145 (2) -149 (2) Wavelength 0.71073 0.71073 0.71073 0.71073 0.71073 0.71073 θ range for data collection [deg] 3.29 to 24.71 3.46 to 26.40 2.30 to 26.39 4.08 to 23.26 3.25 to 26.36 3.42 to 25.35
limiting indices -17 < h < 15, -8 < k < 6, -20 < l < 20
-12 < h < 12, -22 < k < 12, -27 < l < 27
10 < h < 10, -21 < k < 21, -33 < l < 30
-11 < h < 11, -19 < k < 16, -25 < l < 19
-21 < h < 15, -16 < k < 14, -27 < l < 27
-17 < h < 20, -15 < k < 15, -27 < l < 17
measured reflections 7387 19141 23946 14912 22425 20540 independent reflections 2962 (Rint = 0.0372) 7783 (Rint = 0.0208) 8544 (Rint = 0.0339) 5335 (Rint = 0.0908) 9029 (Rint = 0.0199) 8466 (Rint = 0.0265) completeness to θ 98.6 93.3 98.4 99.0 93.1 97.5
refinement method full-matrix least-squares on F2
full-matrix least-squares on F2
full-matrix least-squares on F2
full-matrix least-squares on F2
full-matrix least-squares on F2
full-matrix least-squares on F2
data / restraints / parameters 2962 / 0 / 265 7783 / 4 / 565 8544 / 0 / 577 5335 / 0 / 541 9029 / 0 / 611 8466 / 0 / 645 goodness-of-fit on F2 1.000 1.137 1.0036 1.149 1.023 1.055
final R indices [I>2ρ(I)] R1 = 0.0314, wR2 = 0.0497
R1 = 0.0366, wR2 = 0.0843
R1 = 0.0342, wR2 = 0.0710
R1 = 0.0776, wR2 = 0.1715
R1 = 0.0322, wR2 = 0.0773
R1 = 0.0359, wR2 = 0.0916
R indices (all data) R1 = 0.0575, wR2 = 0.0518
R1 = 0.0437, wR2 = 0.0867
R1 = 0.0502, wR2 = 0.0752
R1 = 0.1396, wR2 = 0.1899
R1 = 0.0458, wR2 = 0.0832
R1 = 0.0489, wR2 = 0.0968
largest diff. peak and hole [eÅ-3] 0.165 and –0.185 0.985 and –0.542 0.739 and –0.713 2.101 and -0.771 0.929 and –0.586 1.116 and –0.531 a) Data taken from Ref. 18.
Table 2. Table of selected bond lengths for Ln(III) complexes of 5LIO-1,2-HOPO (H21) and 5LI-1,2-HOPO (H22). [Eu(1)2]
– Eu-O1 (hydroxyl) 2.457 Eu-O2 (keto) 2.385 O1A-H2AB (Amide) 1.926 Eu-O7A(hydroxyl) 2.371 Eu-O6A (keto) 2.394 O1B-H2B1 (Amide) 1.917 Eu-O1B (hydroxyl) 2.372 Eu-O2B (keto) 2.383 O7A-H3AA (Amide) 1.934 Eu-O7B (hydroxyl) 2.434 Eu-O6B (keto) 2.380 O7B-H3BA (Amide) 1.938 [Eu(2)2]
– Eu-O1 (hydroxyl) 2.400 Eu-O2 (keto) 2.387 O1-H4 (amide) 1.893 Eu-O6 (hydroxyl) 2.373 Eu-O5 (keto) 2.413 O7-H22 (amide) 3.189 Eu-O7 (hydroxyl) 2.422 Eu-O8 (keto) 2.382 O6-H15 (amide) 1.882 Eu-O12 (hydroxyl) 2.375 Eu-O11 (keto) 2.380 O12-H41 (amide) 1.926

29
[Sm(1)2]– Sm-O1A (hydroxyl) 2.429 Sm-O2A (keto) 2.423 O1-H104 (amide) 1.982
Sm-O7A (hydroxyl) 2.368 Sm-O6A (keto) 2.427 O1B-H204 1.917 Sm-O1B (hydroxyl) 2.435 Sm-O2B (keto) 2.381 O7A-H113 (amide) 1.904 Sm-O7B (hydroxyl) 2.394 Sm-O6B (keto) 2.421 O7B-H213 2.011 [Sm(2)2]
– Sm-O1A (hydroxyl) 2.387 Sm-O2A (keto) 2.427 O1A-H104 (amide) 1.874 Sm-O6A (hydroxyl) 2.405 Sm-O5A (keto) 2.398 O1B-H204 (amide) 3.253 Sm-O1B (hydroxyl) 2.432 Sm-O2B (keto) 2.398 O6A-H115 (amide) 1.895 Sm-O6B (hydroxyl) 2.383 Sm-O5B (keto) 2.396 O6B-H223 (amide) 1.926 [Gd(1)2]
– Gd-O1A (hydroxyl) 2.343 Gd-O2A (keto) 2.268 O1A-H4 (amide) 1.896 Gd-O7A (hydroxyl) 2.332 Gd-O6A (keto) 2.331 O1B-H2 (amide) 1.961 Gd-O1B (hydroxyl) 2.328 Gd-O2B (keto) 2.295 O7A-H5 (amide) 1.825 Gd-O7B (hydroxyl) 2.327 Gd-O6B (keto) 2.318 O7B-H3 (amide) 1.875

30
Table 3. Shape measure analyses of Ln(III) complexes with 5LIO-1,2-HOPO (H21) and 5LI-1,2-HOPO (H22). Comple
x
square antiprism (D4d)
bicapped trigonal prism (C2v)
trigonal dodecahedron (D2d)
[Eu(1)2]– 19.21 17.24 20.37
[Eu(2)2]– 17.79 11.53 14.06
[Sm(1)2]– 28.43 27.82 24.73
[Sm(2)2]– 17.83 11.48 14.22
[Gd(1)2]– 18.24 13.60 19.06
Table 4. Summary of pKa values and Eu(III) binding constants for tetradentate 1,2-HOPO ligands.
5LIO-1,2-HOPO* (H21) 5LI-1,2-HOPO (H22)
pKa1 4.19 (3) 4.52 (3)
pKa2 5.79 (1) 5.65 (1)
ΣpKa 9.98 10.17
pKa2 – pKa1 1.60 1.13
log10β110 12.46 (2) 12.33 (1)
log10β120 22.85 (10) 22.56 (5)
log10β121 25.21 (3) 25.40 (1)
pEu† 18.64 (10) 18.35 (5)
† At pH = 7.4, [L] = 10-5 M, [Eu] = 10-6 M. * Data taken from Ref. 18.

31
Table 5. Summary of electronic structure calculations for 1,2-HOPO chromophore and Na+ complex.
Excited State
Multiplicity
Energy
(eV)
Wavelength
(nm)
Oscillator Strength
Orbital(s) Involved (n → n')
Transition Coefficient
1 T0 2.542 487.72 0.0000 44 → 45 0.7764
2 T1 3.529 351.37 0.0000 43 → 45 43 → 46 43 → 52
0.7083 -0.1733 -0.2036
3 T2 3.706 334.55 0.0000
41 → 45 42 → 45 42 → 46 42 → 52
0.1085 0.6903 -0.1149 -0.1241
4 T3 3.708 334.38 0.0000 40 → 45 44 → 46 44 → 52
0.4211 0.6292 -0.1300
6-MeAmide-1,2-HOPO
5 S1 3.8185 324.69 0.1395 40 → 46 44 → 45
-0.1235 0.6385
1 T0 2.649 468.05 0.0000 49 → 51 0.7643 2 T1 3.186 389.15 0.0000 49 → 50 0.7035 3 S1 3.205 386.85 0.0060 49 → 50 0.7039
4 T2 3.2404 382.62 0.0000
47 → 51 48 → 51 49 → 53 49 → 55
0.2295 0.6406 -0.1884 0.3529
[Na(6-MeAmide-1,2-HOPO)]
5 S2 3.755 330.18 0.1066 48 → 55 49 → 51
-0.1331 0.6356

32
Table 6. Summary of photophysical data for complexes of tetradentate 1,2-HOPO ligands.
Complex
λmax (nm)
ε (M-1cm-1)
Φtot (%)
τ (μsec)
kr (calc’d)‡ (ms-1)
knr (calc’d)‡ (ms-1)
[Eu(5LIO-1,2-HOPO)2]−* 332.7 19,250 21.5 727 (1012)† 0.61 0.81
[Eu(5LI-1,2-HOPO)2]− 331.4 18,800 20.7 737
(996.2)† 0.62 0.74
[Sm(5LIO-1,2-HOPO)2]− 333.0 19,200 0.44 13.4 N/A N/A
[Sm(5LI-1,2-HOPO)2]− 331.3 19,400 0.44 10.7 N/A N/A
Data taken from Ref. 18. † Corresponding value obtained with D2O as solvent. ‡ Calculated from the ratio of the integrated area for the J = 1 transition compared to the total integrated area as per the method described in Ref. 48.
Table 7. Analysis of crystal field splitting under various site symmetries for the most common eight co-ordinate Ln(III) geometries, and separation into corresponding symmetry allowed electronic transitions. ED and MD in parenthesis indicate the principal character and hence selection rules used for each transition, which are either induced electrical dipole or magnetic dipole respectively.
CN = 8
Site
Symmetry
5D0→7F0 (ED)
5D0→7F1 (MD)
5D0→7F2 (ED)
Bicapped Trigonal Prism C2v A1 A2, B1, B2 2A1, B1, B2 Square Antiprism D4d none A2, E3 E1 Trigonal Dodecahedron D2d none A2, E B2, E