
Thermal, Structural and Luminescent Properties of Long After ...
220
Thermal, Structural and Luminescent Properties of Long After-Glow MAl x O y :Eu 2+ ,Dy 3+ (M: Sr, Ba) Phosphors By Barasa Daniel Bem A thesis submitted in partial fulfillment of the requirements for the degree Doctor of Philosophy (Ph.D.) in the Department of Physics Faculty of Natural and Agricultural Sciences at the University of the Free State Republic of South Africa Promoter: Prof. F.B. Dejene Co-promoters: Prof. H.C. Swart Prof. A.S. Luyt November 2010
-
Upload
khangminh22 -
Category
Documents
-
view
2 -
download
0
Transcript of Thermal, Structural and Luminescent Properties of Long After ...

Thermal, Structural and Luminescent Properties of Long After-Glow
MAlxOy:Eu2+,Dy3+ (M: Sr, Ba) Phosphors
By
Barasa Daniel Bem
A thesis submitted in partial fulfillment of the requirements for the degree
Doctor of Philosophy (Ph.D.)
in the
Department of Physics
Faculty of Natural and Agricultural Sciences
at the
University of the Free State
Republic of South Africa
Promoter: Prof. F.B. Dejene Co-promoters: Prof. H.C. Swart
Prof. A.S. Luyt
November 2010

ii
Research institutions
The research described in this thesis was carried out at various institutions: The
University of the Free State [Qwa Qwa and Bloemfontein campuses], the Council for Scientific
and Industrial Research (CSIR)–Pretoria, and the Nelson Mandela Metropolitan University
(NMMU)–Port Elizabeth. The project was financially supported by the National Research
Foundation (NRF)–South Africa and the University of the Free State. Special acknowledgement
goes to Kenyatta University, Nairobi, Kenya, for the award of the study leave.

iii
To my parents Ellam Wekhwela Nambuwani, my father, and Rhodah Nyangweso, my mother, – my ultimate
role models. Obe le bophelo bo botle, lerato le thabo dilemong tsohle.

iv
Acknowledgements I wish to express my heartfelt gratitude to the following people:
Prof. Dejene, F.B. my promoter; for his support and particularly for being
instrumental in making it happen.
Prof. Swart, H.C. my co-promoter; for his continuous support, guidance and special
understanding of my circumstances.
Prof Luyt, A.S. my co-promoter; for his encouragement, inspiration and willingness
to go the extra mile for his students.
Staff of the Department of Physics, University of the Free State. For the positive
interactions and support: Mrs Cronje, K. Mr Dolo, J.J. Ms Lebeko, K.M. Dr Mothudi,
B.M. Dr Msomi, J.Z. Mrs Pretorius, E. Dr Ocaya, R.O. to mention but a few.
Fellow researchers: Mr Ahmad, E.M. Mr Ali, A.G. Dr Coetsee, E. Dr Dlamini, M.S.
Mrs Duvenhage, M.M. Miss Foka, K.E. Mr Koao, L.F. Miss Lephoto, M.A. Miss
Mofokeng, J.P. Mr Mokhoto. Mr Motloung, J.S. Dr Kebede, M. Dr Molefi, J.M. Dr
Ngaruiya, J.M. Mr Nsimama, P. Dr Roro, R. (NMMU), Mr Sefadi. Miss Tshabalala,
M.A. among others.
Prof Van Wyk, P.W.J. and Janecke, B. of the Centre of Microscopy for their support
and advice during SEM measurements. Ms Lombard and Ms Huibrie (HCF) Joubert,
Department of Geology (UFS), for their assistance with XRD measurements. Prof.
J.R. Botha, for permission to use his PL system.
My family: My wife, Mary – for the absolute sacrifice and selflessness; my children; Ruth, Ken, Fiona, and Oscar – I am setting the lower threshold. My brothers: Moses, David and Peter, and my sister, Alice.
I am grateful for the financial support from the South African National Research
Foundation, and the University of the Free State as well as Kenyatta University for the grant of
study leave.
I bow before Almighty God for giving me the strength and courage to pursue this study

v
Abstract The optimization of properties for new and potentially useful materials becomes a
continuous and sometimes a lifelong process if future applications are anticipated. Research on
luminescent materials is a good example of this statement and rare earth-doped alkaline earth
aluminates is at the epicentre of this focus due to the anticipated superior qualities, vis a vis those
of classical sulphide phosphorescent materials. The focus in these developments has been to
produce a phosphor with high emission intensity, high colour purity, longer afterglow and that is
safe and chemically stable. To address some of the issues in these efforts, this study had three
major aims: (1) The investigation of the surface morphology, crystallinity, particle size,
luminescence, and thermal properties of commercial phosphors by various techniques. (2) The
preparation and characterization of two types of phosphors by standard techniques. (3) The
preparation and characterization of phosphor/polymer composites.
The first commercial phosphor was a green-emitting aluminate phosphor. The properties
of this phosphor as well as those of LDPE/phosphor and PMMA/phosphor composites were
studied. Polymer/phosphor composite samples were prepared with phosphor concentrations
ranging from 1 to 5 volume% and subsequently hot-melt-pressed. Sharp and broad XRD peaks
were observed for the LDPE and PMMA composites respectively, reflecting configuration
characteristics similar to those of the respective pure polymers. TEM micrographs show a
transition from nanosized particles to cluster formation with increase in phosphor concentration.
PL was observed in the composites of both polymers for phosphor volume concentrations above
1.0% for PMMA and above 0.5% for LDPE. For each of these samples, a broad PL peak at about
505 nm wavelength was observed after excitation at 350 nm with a xenon lamp. For the LDPE
composites, the DSC results show that the presence of the phosphor in the polymer had no major
influence on either the melting temperature or enthalpy values of the polymer. LDPE/phosphor
composite samples, based on blue-emitting commercial aluminate phosphor, were similarly
prepared and characterized for structural, luminescent and thermal properties. XRD analysis
revealed the presence of the Sr4Al14O25 phase in the composites. PL spectra have two sets of
peaks, major broad bands peaking at about 486 nm and minor ones between 412 nm and 418 nm,
attributed to the 4f–5d transition of Eu2+. DSC and TGA results show that the introduction of the

vi
phosphor in LDPE matrix caused a slight reduction in the crystallinity of LDPE but a strong
increase in the stability of the composites.
SrAlxOy:Eu2+,Dy3+ phosphor was synthesized by a combustion method and characterized
for luminescent and thermal properties. Phosphor nanocrystallites with high brightness were
obtained. The average crystallite sizes, calculated from the Scherrer equation ranged between 34
and 43 nm. Emissions arising from transitions between the 5d and 4f orbital gaps of Eu2+ are
manifested in the broad-band excitation and emission spectra with major peaks at 360 and 515
nm, respectively. The decay curves and half-life times show a clear trend in the influence of the
phosphor in the improvement of the initial brightness and the afterglow times, which are ascribed
to the presence of shallow and deep traps. Thermal results indicate that the phosphor
nanoparticles acted as nucleating agents and improved the overall crystallinity in the LDPE/
SrAlxOy:Eu2+,Dy3+ phosphor system.
The temperature-dependence of the structural and luminescent properties of sol-gel
derived SrAlxOy:Eu2+,Dy3+ phosphor was investigated. Calculations based on XRD results, by
means of the Scherrer equation showed the average crystallite sizes increasing from about 42 to
47 nm. Reflections corresponding to both SrAl2O4 and Sr2Al3O6 phases were observed at the
various annealing temperatures but with a diminishing contribution from the Sr2Al3O6 phase. PL
characterization also shows temperature-dependence through variation of both the peak position
and intensity, which indicate emission at low and high annealing temperatures originating from
Eu2+ and Eu3+ ions respectively.
BaAlxOy:Eu2+,Dy3+ was the second phosphor synthesized by a combustion method. PL
results indicate that the LDPE/BaAlxOy:Eu2+,Dy3+ interface, which is considered to have an
influence on the composite behaviour, did not significantly change the spectral positions of the
phosphor materials, whose major emission peaks occurred at about 505 nm. The improved
afterglow results for the composites are probably due to morphological changes due to the
increased surface area and defects. Thermal results indicate that the BaAlxOy:Eu2+,Dy3+ particles
acted as nucleating centres and enhanced the overall crystallinity in the LDPE nanocomposite
while preventing lamellar growth, hence reducing the crystallite sizes in LDPE.

vii
Key words Alkaline earth aluminates BaAlxOy:Eu2+,Dy3+
Combustion method
Composites
DSC
LDPE
Long-afterglow
Phosphorescence
Photoluminescence
Rare earth ions
Sol- gel method
SrAl2O4:Eu2+Dy3+
Sr4Al14O25:Eu2+Dy3+
SrAlxOy:Eu2+,Dy3+TGA

viii
Acronyms AFM Atomic Force Microscopy CB Conduction Band
CCD Charge Coupled Device
BaAlxOy Barium aluminate
BaMgAl10O17 Barium magnesium aluminate
BeO Beryllium oxide
BN boron nitride
Ce Cerium
CERN European Organization for Nuclear Research (French:
`Organisation Européenne pour la Recherche Nucléaire)
Co Cobalt
CO2 Carbon dioxide
CRT Cathode Ray Tube
CTS Charge Transfer States
CTAB Cetyl TrimethylAmmonium Bromide
Cu Copper
DSC Differential Scanning Calorimetry
Dy Dysprosium
EDS Energy Dispersive Spectroscopy
Eu Europium
Fe Iron
FED Field Emission Display
FWHM Full Width at Half Maximum
H2O Water
He-Cd Helium Cadmium laser
HRTEM High Resolution Transmission Electron Microscopy
LED Light Emitting Diode
LHPG Laser Heated Pedestal Growth
LDPE Low Density Polyethylene
Mg4(F)GeO6 Magnesium Fluorogermanate

ix
MgTe Magnesium Telluride
MRI Magnetic Resonance Imaging
NaCl Sodium Chloride
Nd Neodymium
NdP5O14 Neodymium phosphate
Ni Nickel
PL Photoluminescence
PMMA Poly(methylmethacrylate)
QD Quantum Dot
QE Quantum Efficiency
QY Quantum Yield
RE Rare earth
SEM Scanning Electron Microscopy
SrxAlyOz Strontium aluminate
SrxMgSiyOz Strontium magnesium silicate
STM Scanning Tunneling Microscopy
Tb Terbium
TEM Transmission Electron Microscopy
TGA Thermogravimetric Analysis
TiO2 Titanium dioxide
Tl Thallium
TL Thermoluminescence
TSL Thermally Stimulated Luminescence
UV Ultraviolet
VB Valence Band
Xe Xenon
XRD X-Ray Diffraction
Y2O2S Yttrium orthosulphide
Y2O3 Yttrium oxide
Y3Al5O12 Yttrium aluminate
YVO4 Yttrium orthovanadate

x
ZnO Zinc oxide
Zn2SiO4 Zinc silicate
ZnS Zinc Sulphide

xi
Contents Title page…………………………………………………………………………………….........i
Research/funding institutions…………………………………………………………...............ii
Dedication………………………………………………………………………………………..iii
Acknowledgements………………………………………………………………………...........iv
Abstract……………………………………………………………………………………...........v
Keywords…………………………………….…………………………………………….........vii
Acronyms……………………………………………………….………………………………viii
List of figures ………………………………………………………………………………….xvii
List of tables…………………………………………………………………………………...xxii
Chapter 1: Aims and outline of thesis………………………………………….....................1
1.1 General background………………………………………….....................1
1.2 An overview of past phosphor research……………………….…………..2
1.3 The novelty and issues in nanostructured luminescent systems…………..4
1.4 The novelty and issues in nanocomposite structures….…………………..6
1.5 The persistent luminescence phenomenon: Issues and perspectives……...7
1.6 Motivation……………………………………………................................9
1.7 Description of the research problem……………………………………..10
1.8 Aims of the research……………………………………………………..12
1.9 Research objectives………………………………………………………12
1.10 Thesis outline……….……………………….……………………….......14
1.11 References…………………………………………………………..........17
Chapter 2: An overview of the theoretical background on luminescent materials……...20
2.1 Introduction………………………………………………………………20
2.2. Characteristics of luminescence……………………….............................21
2.2.1 Luminescence power………………………………………….....21
2.2.2 Luminescence spectrum………………………………………….22
2.2.3 Luminescence polarization..…………………..…………………22
2.2.4 Optical indicatrix………………………………………………...22

xii
2.2.5 Stokes’ and anti-Stokes’ shift ……...............................................22
2.2.6 Luminescence rise and decay...…………………………………..24
2.2.7 Light sum………………………………………………………...25
2.2.8 Thermoluminescence.……………………………….……...........25
2.2.9 Phosphor efficiency………………………………………...........25
2.2.10 Transient characteristics of luminescence……………….............26
2.3 Non-radiative transitions…………………………………………………27
2.3.1 The decay of luminescence………………………………………27
2.3.2 Relaxation processes……………………………………………..28
2.3.2.1 Thermal activation……………………………………….28
2.3.2.2 Multiphonon emission…………………………...............29
2.3.3 Energy transfer…………………….……………………..............30
2.3.4 Sensitization of luminescence…….………………………...........30
2.3.5 Concentration quenching………………..……………………….31
2.3.6 Quenching traps………………………………………………….32
2.3.7 Luminescence quantum yield and quenching processes…………33
2.4 Physical principles of luminescence…………………….……………….33
2.4.1 Basics of luminescence……………………..……………………33
2.4.2 Luminescence in phosphors……………………………………...35
2.5 Electronic processes leading to luminescence…………………………...36
2.5.1 4f energy levels and relaxation………………………………….36
2.5.2 4fn–15d1 states and charge-transfer states (CTS)…...…………….37
2.5.3 Electronic transitions involved in europium luminescence...........37
2.6 Luminescence of transition metal ions…………………………………..39
2.6.1 Introduction………………………………………………………39
2.6.2 Luminescence of some rare earth ions…………………………...39
2.6.2.1 Introduction……………………............…………………39
2.6.2.2 The f-f transition of Eu3+…………………………………40
2.6.2.3 The d-f transition of Eu2+…………….…………………..42
2.6.2.4 The f-h transition of Dy3+………………………………..43
2.7 Excitation mechanisms of luminescence centres………………………...43
xiii
2.7 1 Introduction………………………………………………………43
2.7.2 Centre luminescence……………………………………………..45
2.7.3 Charge transfer luminescence……………………………………46
2.7.4 Donor-acceptor pair luminescence………………………………47
2.8 Traps and phosphorescence………………………………………...........48
2.8.1 Introduction………………………………………………………48
2.8.2 Trap processes………...………………………………………….48
2.8.3 The decay rate equation………………………………………….50
2.9 Factors determining the emission colour…………………………...........52
2.10 References………………………………………………………………..57
Chapter 3: Literature review……………………………………………………………….61
3.1 Introduction………………………………………………………………61
3.2 Synthesis…………………………………………………………………62
3.2.1 Tungstates………………………………………………………..62
3.2.2 Vanadates………………………………………………………...62
3.2.3 Trivalent antimony (Sb3+)………………………………………..62
3.2.4 Red bismuth luminescence………………………………………63
3.2.5 Bismuth ganate (Bi4Ge3O12)……………………………………..63
3.2.6 Copper (Cu+)………………………………………………..........63
3.2.7 Silicates (M2MgSi2O7)……………………………………… …....64
3.2.8 Aluminates……………………………………………………….64
3.2.9 Sulphides…………………………………………………………66
3.2.10 Phosphates………………………………………………………..67
3.3 Persistent luminescence mechanisms……………………………………68
3.3.1 Introduction……………………………………………………....68
3.3.2 The Matsuzawa model…………………………………………...69
3.3.3 The Aitasalo model…….………………………………………...70
3.3.4 The Dorenbos model…………………………..…………………71
3.3.5 The Clabau model………………………………………………..73
3.3.6 Revised models…………………………………………………..75

xiv
3.4 The SrAl2O4 phase……………………………………………………….77
3.4.1 Structural characteristics of SrAl2O4…………….………………77
3.4.2 Dopant and co-dopant sites………………………...…………….78
3.4.3 Probable vacancies……………………………………………….78
3.5 References………………………………………………………………..79
Chapter 4: Characterization and synthesis techniques…………………………………...84
4.1 Introduction………………………………………………………………84
4.2 Scanning Electron Microscopy (SEM) and Energy Dispersive
X-ray Spectroscopy (EDXS)……………………………………..............86
4.3 X-Ray Diffractometry (XRD)……………………………………………88
4.4 Transmission Electron Microscopy (TEM)……………………………...89
4.5 Photoluminescence Spectroscopy (PL)……………………………..……92
4.6 Thermal analysis techniques……………………………………………..95
4.6.1 Differential Scanning Calorimetry (DSC)……………………….96
4.6.1.1 Quantitative DTA (Heat-Flux DSC)……………………..96
4.6.1.2 Power compensation differential scanning
calorimetry (DSC)………………………………………..98
4.6.2 Thermogravimetric Analysis (TGA)……………………………100
4.7 Synthesis techniques……………………………………………………102
4.7.1 Sol-gel…………………………………………………………..102
4.7.2 Combustion synthesis…………………………………………..103
4.8 References………………………………………………………………106
Chapter 5: Properties of the green commercial SrAl2O4 phosphor in LDPE
and PMMA Polymers…………………………….…………………………...108
5.1 Introduction……………………………………………………………..108
5.2 Experimental……………………………………………………………110
5.2.1 Materials…………………………………………………..........110
5.2.2 Sample preparation…….……………………………….............110
5.2.3 Morphology and structural analysis…………………………….111

xv
5.2.4 Photoluminescence measurements………………………...........111
5.2.5 Thermal analysis…………………………………………..........111
5.3 Results and Discussion…………………………………………………112
5.4 Conclusions………………………………………………………..........121
5.5 References………………………………………………………………123
Chapter 6: Structural, luminescent and thermal properties of blue Sr4Al14O25:Eu2+,Dy3+
phosphor-filled low density polyethylene composites………….....................124
6.1 Introduction………………………………………………………..........124
6.2 Materials and Methods…………………………………………….........125
6.2.1 Materials………………………………………………………..125
6.2.2 Sample preparation……………………………………………..125
6.2.3 Morphology and structural analysis……………………….........126
6.2.4 Photoluminescence (PL) measurements………………………..126
6.2.5 Thermal analysis………………………………………………..126
6.3 Results and discussion………………………………………….............127
6.3.1 X-Ray Diffraction (XRD)………………………………............127
6.3.2 Photoluminescence spectra……………………………………..128
6.3.3 Thermal properties……………………………………………...131
6.4 Conclusions……………………………………………………………..134
6.5 References…………………………………………………………........136
Chapter 7: Characterization of luminescent and thermal properties of long afterglow
SrAlxOy:Eu2+,Dy3+ phosphor synthesized by combustion method…………138
7.1 Introduction……………………………………………………………..138
7.2 Experimental……………………………………………………………140
7.3 Results and discussion……….…………………………………………142
7.4 Conclusions……………………………………………………………..154
7.5 References……………..………………………………………………..155

xvi
Chapter 8: Temperature dependence of the structural and luminescent properties
of long-lasting afterglow SrAlxOy:Eu2+,Dy3+ phosphor……………………..157
8.1 Introduction…………..…………………………………………………157
8.2 Experimental procedure………………………………………………...159
8.3 Results and discussion……….…………………………………………160
8.4 Conclusions……………..………………………………………………167
8.5 References……………………......……………………………………..169
Chapter 9: Characterization of luminescent and thermal properties of long-lasting
BaAlxOy:Eu2+,Dy3+ nanoparticles and polymer composites….......................171
9.1 Introduction……………………………………………………………..171
9.2 Experimental section……………………………………………….. …..172
9.2.1 Synthesis of the BaAlxOy:Eu2+,Dy3+ phosphor samples……......172
9.2.2 Preparation of BaAlxOy:Eu2+,Dy3+-LDPE nanocomposites... …..173
9.2.3 Morphology and structural analysis…………………………….173
9.2.4 Photoluminescence (PL) measurements…..……………………174
9.2.5 Thermal analysis…….………………………………………….174
9.3 Results and discussion………………………………………………….174
9.3.1 SEM micrographs and EDS spectra…………………………….174
9.3.2 X-Ray Diffraction (XRD)………………………………………176
9.3.3 Photoluminescence spectra………………..……………………177
9.3.4 Decay curves……………………………………………………181
9.3.5 Thermal properties……………………………………………...184
9.4 Conclusions……………………………..………………………………188
9.5 References................................................................................................189
Chapter 10: Summary and outlook………………………………………………………...192
10.1 Summary………………………………………………………………..192
10.2 Outlook…………………………………………………………………194
Publications:...............................................................................................................................197

xvii
Appendix: PL intensities for commercial and the as-synthesized phosphors...…………..........198
List of Figures
Figure 1.1: The luminescence spectra of the blue-emitting Sr2MgSi2O7: Eu2+,Dy3+,
Green-emitting SrAl2O4: Eu2+,Dy3+ and red emitting Y2O2S: Eu3+,Mg2+,
TiIV phosphors after UV excitation………………………………………………..8
Figure 2.1: Two mechanisms responsible for anti-Stokes’ luminescence: (a) After
being excited from the valence band Ev to the conduction band Ec an
electron receives additional energy as a result of its interaction with the
crystal lattice. (b) An electron is excited to the high-energy level 2 by
two-photon absorption……………………...………….……...…………………23
Figure 2.2: (a) Two-level model for non-persistent materials. (b) Three-level
model for long persistent materials…………...………………………………….24
Figure 2.3: Configurational coordinate models of nonradiative relaxation processes:
thermal activation type (a), and multiphonon type (b)……………..………........29
Figure 2.4: Activator concentration dependence of the cathode-luminescence
intensities of Y2O2S: Eu3+ and ZnS:Cu……...……………………………...........32
Figure 2.5: Jablonski energy level diagram showing the luminescence process…………….34
Figure 2.6: Configuration co-ordinate diagram………………………………………………36
Figure 2.7: Energy level diagram of Eu3+ and Eu2+………………………………………….38
Figure 2.8: Rare earth and transition metal ion atomic structure…………………….............40
Figure 2.9: Configurational coordinate model of Y2O2S:Eu3+………………………….........41
Figure 2.10: Schematic diagram of the energies of 4f7 and 4f65d1 levels in Eu2+
influenced by crystal field ...……………………………………………….. ……42
Figure 2.11: (a) Luminescent material containing activator ions and sensitizing ions………..44
Figure 2.11: (b) Diagramatic representation of the role in the luminescence process
of a sensitizer and its relationship to an activator and the host lattice...................45
Figure 2.12: Potential energy curves illustrating an electronic transition from the
ground to the excited state..……………………………………………………...46
Figure 2.13: Processes leading to donor-acceptor pair luminescence…………………………47

xviii
Figure 2.14: Luminescence after-glow process via a trap in an energy band scheme…...........50
Figure 2.15: (a) Zinc-blende structure…………………………………………………………53
Figure 2.15: (b) Wurtzite structure……………………………………………………………54
Figure 2.15: (c) NaCl structure………………………………………………………………...55
Figure 2.16: The effect of crystal field strength on the energy levels and emission colour
of the Eu2+ ion in solid state. The arrows indicate different emission colours……..56
Figure 3.1: Phosphorescence mechanism proposed by Matsuzawa et al. for SrAl2O4:
Eu2+,Dy3+…………………………………………………………………...........69
Figure 3.2: Phosphorescence mechanism proposed by Aitasalo et al. for CaAl2O4:
Eu2+,Nd3+………………………………………………………...........................71
Figure 3.3: Phosphorescence mechanism proposed by Dorenbos et al. for aluminate
and silicate compounds………………….…….…………………………………72
Figure 3.4: Phosphorescence mechanism proposed by Clabau et al. for SrAl2O4: Eu2+,
Dy3+,B3+………………………………………………………………………….73
Figure 3.5: Clabau’s et. al. phosphorescence mechanism as modified by Ngaruiya
et al…………………………………………………………………………….....75
Figure 3.6: Phosphorescence mechanism proposed in 2006 by Aitasalo et al. for
CaAl2O4:Eu2+,Dy3+………………………………………………………………76
Figure 3.7: Schematic views of the monoclinic phase of SrAl2O4 along the a- and c-
directions…………………………………………………………………………77
Figure 4.1: The SEM equipment coupled with EDS: SHIMADZU Superscan model
SSX-550………………………………………………………………………….87
Figure 4.2: The X-ray diffractometer used in this study is a Bruker AXS Discover
diffractometer………………………………………………………………. ……88
Figure 4.3 (a): Schematic diagram of a transmission electron microscope…………............90
Figure 4.3: (b): JEOL JEM-2100 model transmission electron microscope…………… ……91
Figure 4.4: Typical experimental set up for PL measurements………………………………92
Figure 4.5: (a) The He-Cd laser equipment…………………………………………......……94
Figure 4.5: (b) The Cary Eclipse Fluorescence Spectrophotometer system…………………92
Figure 4.6: Typical components of a TA instrument………………………………………...95

xix
Figure 4.7: (a) The structure of a quantitative DTA system [Seiko Instruments
design]……………………………………………………………………………97
Figure 4.7 (b) Schematic of a heat-flux DSC Cell……………………………...…...............97
Figure 4.7: (c) Schematic diagram of power compensation DSC system……………………98
Figure 4.7: (d) The Perkin-Elmer DSC7 thermal analyzer used in this study……….............99
Figure 4.8: (a) Schematic of a TGA furnace………………………...……………………...101
Figure 4.8: (b) Image of the TGA apparatus used in this project……..………….…............102
Figure 4.9: Sequence of events during combustion synthesis………………………………103
Figure 5.1: Crystal structure of SrAl2O4 at 1073 K, viewed along (001)……………...........108
Figure 5.2: SEM images of (a) 97/3 v/v LDPE/ SrAl2O4:Eu2+,Dy3+ (b) 97/3 v/v
PMMA/- SrAl2O4:Eu2+,Dy3+ ...…………….......………..……………...............112
Figure 5.3: Point EDS results of 97/3 v/v LDPE/ SrAl2O4:Eu2+,Dy3+……………………...113
Figure 5.4: (a) XRD spectra of LDPE and LDPE/SrAl2O4:Eu2+Dy3+….…………...………114
Figure 5.4: (b) XRD spectra of PMMA/SrAl2O4:Eu2+Dy3+……………………….………..115
Figure 5.4: (c) XRD spectra of green-emitting SrAl2O4:Eu2+Dy3+-phosphor……….……...115
Figure 5.5: TEM micrographs of 5% SrAl2O4:Eu2+,Dy3+ in (a) LDPE (b) PMMA…..…….116
Figure 5.6: (a) PL spectra for LDPE/SrAl2O4:Eu2+,Dy3+composites………………….........117
Figure 5.6: (b) PL spectra for PMMA/SrAl2O4:Eu2+,Dy3+composites………………..……117
Figure 5.7: Concentration-dependence of the PL emission peaks of the LDPE- and
PMMA/SrAl2O4: Eu2+,Dy3+ composites.……………….....…............................118
Figure 5.8: (a) DSC heating curves of LDPE and LDPE/SrAl2O4:Eu2+,Dy3+……………...118
Figure 5.8: (b) DSC cooling curves of LDPE and LDPE/SrAl2O4:Eu2+,Dy3+……...…........119
Figure 5.9: TGA curves for LDPE and LDPE/SrAl2O4:Eu2+,Dy3+…….……………...........120
Figure 6.1: XRD spectra of (a) LDPE and (b) the composite sample with 5%
Sr4Al14O14: Eu2+,Dy3+..........................................................................................127
Figure 6.2: (a) PL spectra for LDPE and LDPE/ Sr4Al14O25:Eu2+,Dy3+................................128
Figure 6.2: (b) Deconvolution of the PL spectrum of the 99.0/1.0 v/v LDPE/Sr4Al14O14:
Eu2+,Dy3+ composite………………………………………..129
Figure 6.2: (c) Deconvolution of the PL spectrum of the 95.0/5.0 v/v LDPE/Sr4Al14O14:
Eu2+,Dy3+ composite……………………………………....................................129

xx
Figure 6.2: (d) Deconvolution of the PL spectrum of 97.0/3.0 v/v LDPE/Sr4Al14O14:
Eu2+,Dy3+ composite……………………………………....................................130
Figure 6.3: Concentration-dependence of the luminescence of LDPE/ Sr4Al14O14:
Eu2+,Dy3+………………………………….........................................................130
Figure 6.4: (a) DSC heating curves of LDPE and LDPE/Sr4Al14O14: Eu2+,Dy3+…………..132
Figure 6.4: (b) DSC cooling curves of LDPE and LDPE/Sr4Al14O14: Eu2+,Dy3+..................132
Figure 6.5: TGA curves of. LDPE and LDPE/Sr4Al14O25:Eu2+,Dy3+………………………134
Figure 7.1: SEM image of the SrAlxOy:Eu2+,Dy3+sample having a 1:2 molar ratio of
Eu2+:Dy3+ with (a) 3000 magnification (b) 6000 magnification……….……142
Figure 7.2: Point EDS results of the SrAlxOy:Eu2+,Dy3+sample having a 1:2 molar
ratio of Eu2+:Dy3+…..........................................………………………………...143
Figure 7.3: (a) XRD patterns at two dopancy levels of the synthesized SrAlxOy: Eu2+,
Dy3+ powder and [Inset: XRD pattern of a commercial phospher]..…….……..143
Figure 7.3: (b) XRD patterns of LDPE/SrAlxOy:Eu2+, Dy3+ composites for the 1:2
Molar ratio sample……………………………………………………………...144
Figure 7.4 TEM micrographs of the samples having, (a) 1:0.3 molar ratio (b) 1:10
molar ratio of Eu2+:Dy3+………………………….………………….…………145
Figure 7.5: Excitation spectra of SrAlxOy: Eu2+, Dy3+, for the samples with 1:0.3 to
1:10 molar ratio of Eu2+:Dy3+………………………………………………......146
Figure 7.6: (a) Emission spectra of (a) SrAlxOy:Eu2+, Dy3+, for the samples with
1:0.3 to 1:10 molar ratio of Eu2+:Dy3+-…………………………………………147
Figure 7.6: (b) Emission spectra of LDPE/SrAlxOy: Eu2+,Dy3+ composites for
different concentrations of the phosphor sample with 1:2 Eu2+:Dy3+
molar ratio…………………………………………………………..…………..148
Figure 7.7: Decay curves for the phosphor samples with 1:0.3 to 1:10 molar ratio of
Eu2+:Dy3+………………………………………………………………….........148
Figure 7.8: Emission intensity of the phosphor at 515 nm as a function of Eu2+:Dy3+
molar ratio; excitation = 340 nm…………………………………………….........149
Figure 7.9: DSC heating curves of LDPE and LDPE/SrAlxOy:Eu2+,Dy3+ composites……..152
Figure 7.10: TGA curves for LDPE and its composites……………………………….……..153

xxi
Figure 8.1: SEM images of the 1000 ˚C sample of SrAlxOy:Eu2+, Dy3+ with (a) 500
magnification, (b) 5000 magnification………………………………………..160
Figure 8.2: EDS results of the unannealed and 1000 C annealed samples of SrAlxOy:
Eu2+,Dy3+……………………………………………………………….............161
Figure 8.3: (a) XRD spectra of the samples at the various temperature values…….............162
Figure 8.3: (b) XRD maximum intensity peaks (32.6<2<33.6)…………………...…….163
Figure 8.4: Excitation spectra of SrAlxOy:Eu2+,Dy3+ for samples at various temperature
values……………………………………………………………………….......164
Figure 8.5: Emission spectra of SrAlxOy:Eu2+,Dy3+ samples for the various annealing
temperature values……………………………………………………………...165
Figure 8.6: Decay curves of SrAl2O4:Eu2+,Dy3+ phosphors annealed at different
temperature values after exciting for 5 min………………………..…………...165
Figure 9.1: BaAl2O4 structure viewed along [0001]…………………………………..........172
Figure 9.2: 10000 magnification SEM micrograph of as-synthesized BaAlxOy:
Eu2+,Dy3+ with Eu2+:Dy3+ ratio = (a) 10:1 (b) 1:10………………..……………175
Figure 9.3: EDS spot analysis results for the BaAlxOy:Eu2+,Dy3+ powder sample
with 10:1 Eu2+:Dy3+ ratio………………………………………………….........175
Figure 9.4: (a) XRD spectra of BaAlxOy:Eu2+,Dy3+ powder samples for various
Eu2+:Dy3+ ratios………………………………………………………...............176
Figure 9.4: (b) XRD spectra of BaAlxOy:Eu2+,Dy3+ phosphor sample with Eu2+:
Dy3+ molar ratio = 2:1, and composite of LDPE with 10% BaAlxOy:
Eu2+,Dy3+……………………………………….………………………………177
Figure 9.5: PL (a) excitation (λem= 505 nm) and (b) emission (λexc= 340 nm), spectra
of BaAlxOy:Eu2+,Dy3+ phosphor for Eu2+:Dy3+ ratio = 10:1–1:10………...........178
Figure 9.6: PL (a) excitation (λem= 500 nm), and (b) emission (λexc= 340 nm), spectra
of LDPE/BaAlxOy:Eu2+,Dy3+ composites for Eu2+:Dy3+ ratio:1:2……………..180
Figure 9.7: (a) Decay curves of BaAlxOy:Eu2+,Dy3+ phosphor for the samples with
Eu2+:Dy3+ molar ratios = 10:1–1:10……………………………………………182
Figure 9.7: (b) Decay curves of pure LDPE, LDPE/BaAlxOy: Eu2+,Dy3+ nano-composites
for phosphor vol.% = 0.4–10 and BaAlxOy: Eu2+,Dy3+ phosphor sample
with Eu2+:Dy3+ molar ratio = 2:1……...……………………...............................183

xxii
Figure 9.8: (a) DSC heating curves of LDPE and LDPE/BaAlxOy: Eu2+,Dy3+
nanocomposites…………………………………………………………………185
Figure 9.8: (b) DSC cooling curves of LDPE and LDPE/BaAlxOy:Eu2+,Dy3+
nanocomposites…………………………………………………………………185
Figure 9.9: TGA curves for LDPE and LDPE/ BaAlxOy:Eu2+,Dy3+ nanocomposites……...187
List of Tables
Table 5.1: DSC data of LDPE and LDPE/SrAl2O4:Eu2+,Dy3+………..……………….. …..120
Table 6.1: DSC data of LDPE and LDPE/SrAl2O4:Eu2+,Dy3+…..…………………….. …..133
Table 7.1: Results for fitted decay curves of SrAlxOy:Eu2+,Dy3+……………….................151
Table 7.2: DSC and TGA data of LDPE and LDPE/SrAlxOy:Eu2+,Dy3+……………… …..152
Table 8.1: Full width at half maximum (FWHM) values of the XRD spectra for
SrAlxOy:Eu2+,Dy3+ for reflections at 33…..….………………………………..163
Table 8.2: Results for fitted decay curves of SrAlxOy:Eu2+,Dy3+ at different
temperatures…………………………………………………………………….167
Table 9.1: (a) Results for fitted decay curves of BaAlxOy:Eu2+,Dy3+ ……………………..182
Table 9.1: (b) Results for fitted decay curve of the 0.4 vol.% LDPE/BaAlxOy:
Eu2+,Dy3+ composite – taken from sample with 1:2, Eu2+:Dy3+ ratio…………..184
Table 9.2: DSC data of LDPE and its LDPE/BaAlxOy:Eu2+,Dy3+ composites……….........186
1
Chapter 1 Aims and Outline of Thesis
1.1 General background
According to the US Department of Energy [1], illumination accounts for 14% of the
total energy used in the United States and 21% of the electricity consumed in the building
sector. With the emphasis on reducing lighting energy use and concurrently reducing
pollution from fossil fuel power plants, there is an interest in improved general purpose
illumination technologies.
The goal to produce efficient phosphors for lighting applications has been a long
standing one for researchers working on luminescent materials. The quantum efficiencies
of the phosphor coatings in current ‘‘state-of-the-art’’ fluorescent lamps generally exceed
90%. Further major improvements in fluorescent lighting efficiency may be sought in the
development of more efficient means of generating visible photons from phosphors. The
development of practical multiphoton-emitting phosphors, which produce more than one
visible photon per incident ultraviolet photon using a controlled photon cascade process,
can significantly improve the overall energy conversion of fluorescent lamps.
Potential applications of phosphors are numerous, especially in the areas of safety
improvement and energy saving. These applications may be broadly classified as: (1)

2
light sources represented by fluorescent lamps, (2) display devices represented by
cathode-ray tubes, (3) detector systems represented by x-ray screens and scintillators, and
(4) other applications, such as luminous paint with long persistent phosphorescence;
nanophosphors of ZnO and TiO2 in cosmetics, which have increased absorption of
ultraviolet rays from the sun; bacteria-mediated delivery of nanophosphors and cargo into
cells of live animals; use of nanophosphors as new contrast agents for tumour imaging,
etc [2,3]. Research and development on these materials requires the use of a number of
fields in science and technology such as physical and inorganic chemistry, solid-state
physics, electronics, illuminating, and image engineering. Therefore, research and
technology in phosphors require a unique combination of interdisciplinary methods and
techniques, which forms a fusion of the above mentioned fields. The focus in these
research efforts has been to seek to understand the mechanisms underlying the
luminescent processes such as trapping and de-trapping, in order to develop more
efficient phosphorescent materials for various applications. Of special attraction are
phosphors prepared on the nanometre scale, in which case the method of synthesis
becomes an important aspect, since variations in the synthesis process conditions can
create a significant change in the morphological, structural, optical, and other properties
of nanomaterials. The special functionality of materials on the nano scale has been known
for some time.
1.2 An overview of past Phosphor research
The scientific research on phosphors has a long history going back more than 100
years. A prototype of the ZnS-type phosphors, an important class of phosphors for
television tubes, was first prepared by Théodore Sidot, a young French chemist, in 1866
rather accidentally. It seems that this marked the beginning of scientific research and
synthesis of phosphors [1].
From the late 19th century to the early 20th century, Philip E.A. Lenard and co-
workers in Germany performed active and extensive research on phosphors, and achieved
impressive results. They prepared various kinds of phosphors based on alkaline earth

3
chalcogenides (sulfides and selenides) and zinc sulfide, and investigated their
luminescence properties. They established the principle that phosphors of these
compounds are synthesized by introducing metallic impurities into the materials by
firing. Lenard and co-workers tested not only heavy metal ions but various rare-earth ions
as potential activators.
P. W. Pohl and co-workers in Germany investigated Tl+-activated alkali halide
phosphors in detail in the late 1920s and 1930s. They grew single-crystal phosphors and
performed extensive spectroscopic studies. In co-operation with F. Seitz in the U.S. they
introduced the configurational co-ordinate model of luminescence centres and established
the basis of present-day luminescence physics.
Humbolt Leverenz and co-workers at Radio Corporation of America (U.S.) also
investigated many practical phosphors with the purpose of obtaining materials with
desirable characteristics to be used in television tubes. Detailed studies were performed
on ZnS type phosphors.
Since the end of World War II, research on phosphors and solid-state
luminescence has evolved dramatically. This has been supported by progress in solid-
state physics, especially semiconductor and lattice defect physics. Advances in the
understanding of the optical spectroscopy of solids, especially that of transition metal
ions in general and rare-earth ions in particular, have also helped in these developments.
The concept of the configurational coordinate model of luminescence centres was
established theoretically. Spectral shapes of luminescence bands were explained on the
basis of this model. The theory of excitation energy transfer successfully interpreted the
phenomenon of sensitized luminescence. Optical spectroscopy of transition metal ions in
crystals clarified their energy levels and luminescence transition on the basis of crystal
field theory. In the case of trivalent rare-earth ions in crystals, precise optical
spectroscopy measurements made possible the assignment of complicated energy levels
and various luminescence transitions.

4
Advances in studies of band structures and excitons in semiconductors and ionic
crystals contributed much to the understanding of luminescence properties of various
phosphors using these materials as hosts. The concept of direct and indirect transition
types of semiconductors helped not only to find efficient luminescence routes in indirect
type semiconductors, but also to design “efficient” materials for light-emitting diodes and
semiconductor lasers. The concept of donor-acceptor pair luminescence in
semiconductors was proposed and used to produce luminescence semiconductor
phosphors of better efficiency.
1.3 The novelty and issues in nanostructured luminescent systems
In a narrow sense, the word phosphor is used to mean inorganic luminescent
materials, usually those in powder form and synthesized for the purpose of practical
applications. Phosphors with one dimension less than 100 nm are called nanophosphors
and may be described as nanostructured, inorganic, insulating solid materials that
efficiently emit light under energetic particle and electromagnetic radiation.
Though the investigation of nanophosphors is a nascent field [2-6] there is
observably a growing interest in the investigation, design and manufacturing of
nanostructured materials. The first report on the effects of nanostructuring on the optical
properties of materials dates from 1990, when strong visible luminescence emission from
porous Si was announced [7]. Since then, an intense research effort to investigate and
explore these effects has been in progress, mostly focused on semiconductor
nanostructures (quantum dots). These materials possess properties, such as optical,
magnetic, and structural properties, among other characteristics, that are often uniquely
different from those exhibited by their macroscopic counterparts. This change in
behaviour is partly attributed to perturbations of the electronic distribution induced by
reduced dimensionality, i.e. the large increase in the surface-to-volume ratio, i.e. the
relative dominance of surface atoms and thus the enhanced role of the surface energy [8].
Apart from surface influences, the change in the electronic structure of a material, due to
quantum confinement effects play another significant role in changing properties. As the

5
particle size decreases, the quantum confinement effects begin to occur [9,10]. These
alterations can be explored to create materials with new properties tailored for specific
applications that offer superior performance to existing ones.
A recent development, which has further stimulated research on luminescent
materials is the use of phosphors as the light-emitting components in flat panel displays
(FPDs) such as field emission displays (FEDs). Unlike conventional phosphor particles,
luminescent nanostructured materials are attractive for field-emission display (FED)
applications because their small size allows complete penetration by the low-voltage
electrons for efficient material utilization [11]. However, unlike cathode ray tube (CRT)
displays, which use highly energetic electrons and substantial beam currents to excite
phosphor emission, design constraints in flat panel displays severely limit the amount of
excitation power available to excite phosphors. Consequently, the emission efficiency of
phosphor materials becomes an issue of major concern in the design of flat panel
displays. Unfortunately, the emission efficiency of rare-earth-activated phosphors appears
to be limited by concentration quenching of activators [12] and other effects [13]. The
quenching effects are aggravated when low-voltage electrons are used for excitation [14].
Compared to microscale particles, the main drawback of nanoscale phosphors is
their lower quantum efficiency. This is attributed to the large surface area, which
amplifies quenching processes. Therefore, research activities aiming at the application of
these materials concentrate on the deactivation of surface quenching, which might be
achieved by coordinating the surface to ligands having low-phonon frequencies or by the
application of a passivating shell. It is, therefore, important to understand the mechanisms
of quenching in phosphors in order to design effective methods to overcome quenching
limitations of phosphor efficiency.
From a more fundamental standpoint, the lanthanide dopant can serve as a
sensitive probe of the chemistry and structure of its host. Nanostructured materials can
provide model systems to study surfaces using tools such as photoluminescence (PL)
spectrometry whose utility is derived from its unique sensitivity to discrete electronic

6
states, many of which lie near surfaces and interfaces. The high surface-to-volume ratio
of nanocrystalline particles results in a significant fraction of all atoms in the particle
being at or near a surface. Consequently, doping lanthanide ions in nanocrystals of these
dimensions places a sensitive probe at the particle surface. In contrast to nanostructured
materials, it is difficult to study the luminescence of dopant ions located at the surface of
micron-sized particles because the large signal from ions in the interior of the particles
obscures any signal from ions at the surface.
Investigating and understanding nanoscale host materials will be important for
optimizing their emissive properties for technological applications in future lighting,
communication and display devices. Preparing optically active nanostructures has the
potential for discovering and investigating materials that exhibit unexpected and unique
optical phenomena, such as possible enhanced coupling of the localized centres to
electromagnetic radiation [15] or other confinement effects [16]. Preparing lanthanide-
doped nanostructures also provides a new method to develop and study transparent
composite materials. The reduced optical scattering of nanometre-sized particles allows
the preparation and use of nanocrystals embedded in an amorphous matrix in applications
such as lasers and amplifiers, which usually require high-quality crystals or glasses [17].
Using nanostructured composites (nanocomposites) in optical applications could simplify
material preparation or allow the use of new host materials for which good crystals
cannot be grown.
1.4 The novelty and issues in nanocomposite structures
Recent technological breakthroughs and the desire for new functions generate an
enormous demand for novel materials. On their own, many of the well-established
materials cannot fulfill all technological desires for the various new applications.
Scientists and engineers realized early on that mixtures of materials can show superior
properties compared with their pure counterparts. One of the most successful examples is
the group of composites which are formed by the incorporation of a basic structural

7
material into a second substance. Most of the resulting materials show improved
properties and a well-known example is inorganic/polymer composites.
Composite materials consisting of inorganic/organic components, of which one
of the phases is present in dimensions that are nanoscale or smaller [18] are of
considerable interest. Significant variations in the properties of these materials, which
can differ greatly from the components in their pure form or from composites in which
both of the phases have macroscopic dimensions, are expected. For example, in the case
where silica constitutes the inorganic phase, many of these studies have focused on the
dramatic enhancement in mechanical properties that is realized for organic polymers in
which silicate nanoparticles have been dispersed [19]. Another example is the enhanced
stability imparted in magnetic recording media from the distribution of magnetic
nanoparticles in a diamagnetic matrix [19,20].
A key aspect of applying nanomaterials in technological applications is protecting
them from degradation. The high surface area of nanocrystals compared with
micrometre-size particles results in high reactivity and accelerated rates of reaction with
water, oxygen, and CO2. For instance, approximately 50% reduction in the luminescence
intensity of Y2O3:Eu3+ nanocrystals has been observed over a period of several months
when stored in a laboratory desiccator. Similarly, the luminescence of many sulfide and
selenide quantum dots have been observed to decrease rapidly if they are not capped or
protected to prevent oxidation [17]. Passivating the surfaces of nanoparticles can be
accomplished by using chemical reactions to coat or disperse the particles in a polymer or
glass matrix.
1.5 The persistent luminescence phenomenon: Issues and perspectives
Persistent luminescence is a phenomenon where the material is emitting, usually
in the visible range, for hours after the excitation source has been switched off [21]. The
excitation used may be visible light or UV, x-ray, or gamma radiation. Persistent
luminescence has been and still is, unfortunately in a misleading manner, called

8
phosphorescence because of the long emission time. Phosphorescence may be an
appropriate term to be used in the context of luminescence from organic compounds
involving triplet-to-singlet transitions. These are forbidden with a long decay time but are
otherwise perfectly natural. The long decay time of persistent luminescence, however, is
due to the storage of the excitation energy by traps and is released from them with
thermal energy. Thus the term thermally stimulated luminescence (TSL) is appropriate.
Although the quest for new persistent luminescent materials has now resulted in
several blue and green emitting persistent phosphors that remain visible for many hours,
practically nothing, neither in understanding the phenomenon nor in developing new
materials, took place before the mid 1990s. The expectation for the discovery of new and
even better persistent luminescent materials was heightened following the discovery of
SrAl2O4:Eu2+,Dy3+ and Sr2MgSi2O7:Eu2+,Dy3+. The brightness and lifetime of these two
phosphors completely overshadows that of their most important predecessor, ZnS:Cu,Co.
However, a survey of the output in the past 16 years, of the research done on luminescent
materials, shows that only a handful of phosphors are bright enough to consider their use
Figure 1.1: The luminescence spectra of the blue-emitting Sr2MgSi2O7:Eu2+,Dy3+, green emitting SrAl2O4:Eu2+,Dy3+ and red emitting Y2O2S:Eu3+,Mg2+,TiIV phosphors after UV excitation [22].

9
in practical applications. And yet the ultimate goal in the search for lighting phosphors
would be the production of white light. The idea of making a white-emitting persistent
light source by combining the three individual blue-, green-, and red-emitting phosphors,
in a way similar to the tri-colour fluorescent tubes, seems possible when the emission
spectra of these phosphors are considered separately (Fig. 1.1). The feasibility of this
novel idea lies in the ability to synchronize the duration of the three colours. The
luminescent characteristics of rare earth ions can go a long way in the achievement of this
goal since many radiative electronic transitions in these ions occur in the visible region.
This phenomenon, once understood, opens up the possibility to tailor the emissions to
specific requirements.
Besides lighting applications, there are other attractive current and potential
phosphor applications. These include the use of phosphors as sensors, examples of which
include temperature sensing and also the sensing of changes in pressure (on airplane
wings, for example). The use of nanoparticulate persistent luminescence materials for
biomedical applications with direct in situ imaging sounds both interesting and feasible.
Though not as exciting, the use of persistent luminous paints adds a great deal to the
inspiration in this research area that is increasingly being commercialized.
1.6 Motivation
Commercially available phosphors are proprietary materials and hence the exact
composition and phase responsible for their luminescent characteristics such as intensity
and persistence time are not known. These conventional phosphors are usually obtained
by the solid state sintering method, whose products are normally in micrometre scale and
are characterized by strong light scattering at grain boundaries leading to a reduction in
light output as well as a lower concentration quenching threshold due to non-uniform
doping. Alternative synthesis techniques such as the conventional sol-gel methods are
expensive due to the low solubility of metal alkoxides and the large amounts of vapour
produced by the organic solvents may also be a source of environmental problems.

10
Consequently, it is necessary to identify a more appropriate synthesis procedure, which
avoids these negative aspects while optimizing phosphor production.
Ideally the requirement for obtaining high photoluminescence nanophosphor
particles should involve the absorption of large amounts of excitation energy by the
activator ions followed by the simultaneous return of excitons to the ground state by the
radiative process. To achieve these processes, experimental investigations should address
the key material parameters required to understand, control, and correlate material
properties with optical performance. These parameters include the average particle
diameter, and particle-size distribution, surface morphology, concentration quenching,
crystallinity, as well as the underlying phosphorescence mechanisms. Although the
elaboration of persistent luminescence mechanisms has been advancing at a rapid pace,
the refinement of the details is still needed.
On the other hand, phosphor nano-composites can potentially be used to produce
low-energy consumption and high efficiency illumination for long hours. Progress in
these areas depends on the ability to selectively and controllably deposit nano-particles,
and to uniformly disperse the phosphors in a host matrix, to create a strong and stable
three dimensional network.
Finally, although research in nanostructured materials is beginning to produce a
clear picture of these materials, the current theories and experimental databases are
inadequate for a full understanding of the optical properties of luminescent
nanostructures. It is therefore imperative to build an elaborate theoretical and
experimental data base to facilitate the synthesis of tailor-made luminescent materials
(phosphors). The alternative approach, which seems to largely inform the current
investigations, is to adopt a laborious, inefficient, ‘trial and error’ approach that is not
cost-effective and that is reliant on luck for advancement.

11
1.7 Description of the research problem
The alkaline earth aluminates, doped by divalent europium (Eu2+), have the
potential to be a class of materials with persistent luminescence and high quantum
efficiency in the visible region [23], which can provide durable properties with ultraviolet
irradiation [24]. However, their very low persistence luminescence inhibits further
progress in their applications [25]. Similarly, although the Eu2+,R3+ (R: rarae-earth ion)
co-doped barium aluminates as BaAlxOy:Eu2+,Dy3+ have been studied only infrequently,
they have the potential for persistence luminescence. The reasons may be due to its rather
complicated structural chemistry as well as the considerable size mismatch between the
Ba2+ ion and the activator (Eu2+) cations.
Generally, aluminate phosphors have widely been investigated due to their several
advantages over other phosphors. In particular, rare earth ions co-doped strontium
aluminate (SrAl2O4:Eu2+,Dy3+) phosphors have been extensively researched and
developed following their invention in 1993 [26]. Due to their properties, this class of
phosphors are commercially used in a broad range of applications for which ZnS:Cu,Co
phosphors cannot. In spite of the extensive investigations there is a paucity of work done
on phosphor hosts, particularly for outdoor applications, an area that is finding increasing
applications for these materials. For example, though a lot of effort has been devoted to
the development of the syntheses [27-31] and mechanisms [32-35] of phosphorescence of
these phosphors, little attention has been paid to the well-known drawback of weak
resistance to water. Hence, the degradation of these phosphors due to weak resistance to
water or even moisture remains an unresolved issue. Approaches that have been
employed so far, [36-42] involve complex processes that require elaborate equipment, but
still tend to compromise the luminescence intensity of the phosphors. Therefore, cheaper
and more effective intervention techniques are needed.

12
1.8 Aims of the research
Generation of a broad impact on nano-particle fabrication, with a wide application
potential by making high energy-efficient rare earth doped strontium and barium
aluminate nano-phosphors, which will significantly improve the energy efficiency
of various applications including lighting sources as well as detector and display
systems.
Identification of a polymer matrix that will enable the creation of a strong and
stable three dimensional network when it acts as a host for the phosphor particles.
This is intended to extenuate the moisture-induced degradation, which has
continued to characterize phosphors. The lower density of polymers, compared to
metals and ceramics, as well as resistance to atmospheric and other forms of
corrosion, informed their choice.
Investigation of the morphology, structure, photoluminescence intensity, and
afterglow characteristics of the as-prepared phosphors, as well as the composites
of the phosphors with the PMMA and LDPE polymers, based on SEM imaging,
EDS spectra, TEM imaging and diffractometry, x-ray diffraction, luminescence
spectroscopy as well as DSC and TGA analyses on the composites.
1.9 Research objectives
To:
Investigate the morphological, compositional, structural and photoluminescent
properties of commercially prepared, green-emitting, SrAl2O4:Eu2+,Dy3+
phosphor powder.
Uniformly disperse the commercially prepared, green-emitting, SrAl2O4:
Eu2+,Dy3+ phosphor into matrices of LDPE and PMMA polymers, in order to
create a strong and stable three dimensional network and to subsequently
investigate the mixing conditions, luminescence as well as thermal properties of
the resultant composites. The characterization of the properties was intended to

13
elucidate information to identify suitable materials to hybridize with luminescent
materials in order to minimize their moisture-induced degradation rates.
Investigate the morphological, compositional, structural and photoluminescent
properties of commercially prepared, blue-emitting, Sr4Al14O25:Eu2+,Dy3+
phosphor powder.
Introduce the commercially produced, blue-emitting, Sr4Al14O25:Eu2+,Dy3+
phosphor into the LDPE polymer matrix and to characterize the structural,
luminescence and thermal properties of the resultant polymer/phosphor
composites.
Prepare nanophase SrAlxOy:Eu2+,Dy3+ phosphor powders by means of a
combustion technique at a relatively low temperature and to study the
morphological, structural and photoluminescent properties of the powder
products.
Introduce the combustion-synthesized SrAlxOy:Eu2+,Dy3+ phosphor powders in
the LDPE polymer and to investigate the morphological, structural,
photoluminescent and thermal properties of the polymer/phosphor composite
system as a precursor to the determination of a strong and stable composite
network, with a view to addressing negative environmental effects, such as
moisture that compromise phosphor potency.
Use the sol-gel method to synthesize nanophase SrAlxOy:Eu2+,Dy3+ phosphor
powders and to study the influence of annealing temperature on the crystallinity,
phase composition and luminescence properties of the phosphor material.
Prepare powders of BaAlxOy:Eu2+,Dy3+ materials with different Eu2+ and Dy3+
concentrations, by the combustion method and to study the influence of
concentration on the structure, homogeneity, persistent luminescence as well as
phase stability.
Prepare BaAlxOy:Eu2+,Dy3+/LDPE composites of well-defined composition and
to study their photoluminescent and thermal properties.

14
1.10 Thesis outline A summary of the contents in each chapter of this thesis is provided below.
Chapter 1
In this chapter the background information, overview of research contributions on
classical phosphors, rationale and aims of the research project are given. The issues,
perspectives and general advantages of nanostructured as well as inorganic/organic
nanocomposite systems are briefly discussed. Finally, a summary of the subjects treated
in the succeeding chapters of this thesis, is presented.
Chapter 2
In this chapter, the theoretical basis of the luminescent phenomenon is provided.
A concise description of the key terminology employed in discussing luminescence is
given, with emphasis on the sensitization, concentration quenching as well as transient
characteristics of luminescence. This is followed by a summary of the physical principles
involved in the luminescence process. Finally, descriptions of the mechanisms underlying
the phenomenon are given, ending with a discussion of the factors, which determine the
emission colour in luminescent materials.
Chapter 3
This chapter is dedicated to a detailed assessment of the relevant literature, which
is divided into two parts: (i) The review of the literature on the synthesis and
characterization. (ii) An analysis of some of the prominent mechanisms, which have been
proposed for the photoluminescence phenomenon, particularly long afterglow
luminescence.
Chapter 4
This is also a two-part chapter devoted to the discussion of the experimental
techniques: (i) The presentation of the relevant characterization techniques, with
emphasis on those that were employed in this study. (ii) The description of the two

15
synthesis procedures, i.e. the sol-gel process and the combustion reaction method, that
were used in this work.
Chapter 5
In this chapter investigations of the morphological, compositional, structural and
photoluminescent properties of the commercially prepared, green-emitting,
SrAl2O4:Eu2+,Dy3+ phosphor are described both for the as-prepared powder and for the
composites of the phosphor in PMMA and LDPE polymers. A discussion of the thermal
properties of the composites, based on DSC and TGA results, is also given.
Chapter 6
The investigations on the effects of adding the commercial blue-emitting
Sr4Al14O25:Eu2+,Dy3+ phosphor in low-density polyethylene are described in this chapter.
Chapter 7
This chapter considers the characteristics of the europium and dysprosium co-
doped strontium aluminate green phosphor, which was synthesized by a combustion
method using urea as reducer and fuel. The results of the characterization of the
morphology, particle size and structure, by the usual techniques, are presented. Further,
the same properties, including thermal stability, are also discussed for the composites of
the phosphor when it acts as a filler in the LDPE polymer.
Chapter 8
The strontium aluminate system exists in various crystalline phases. In particular,
the SrAl2O4 phase is known to have two crystallographic polymorphs: monoclinic and
hexagonal, which exist at low and high temperatures, respectively. The polymorphic
behaviour in phosphors have an implication on their properties. These characteristics and
the issues revolving around them, are discussed in this chapter, on the basis of the sol-gel
synthesized SrAlxOy:Eu2+,Dy3+ phosphor.

16
Chapter 9
In this chapter, the characterization of the luminescent and thermal properties of
the blue-green BaAlxOy:Eu2+,Dy3+ phosphor, synthesized by a combustion reaction
method, as well as those of composites of the phosphor with the LDPE polymer, are
discussed. An analysis is provided of the morphology, particle size, phase structure and
thermal stability of the products, which were characterized by the usual standard
techniques.
Chapter 10
The conclusions of the work described in the previous chapters of this thesis are
summarized and compared with the project aims, in this chapter. In addition, several
issues and perspectives, which can be useful in the design, synthesis, and application of
phosphors, are mentioned.

17
1.11 References
1. Srivastava, A.M. Ronda, C.R. Luminescence from Theory to Applications. Ronda,
C. (Ed.), Wiley-VCH, Germany, Chap. 4, (2008).
2. Cooke, D.W. Lee, J. K. Bennett, B.L. Groves, J.R. Jacobsohn, L.G. McKigney,
E.A. Muenchausen, R.E. Nastasi, M. Sickafus, K.E. Tang, M. Valdez, J.A. App.
Phys. Lett., 88: 103, (2006).
3. Erdei, S. Roy, R. Harshe, G. Juwhari, H. Agrawal, D. Ainger, F.W. White, W.B.
Mater. Res. Bul., 30: 745, (1995).
4. Goldburt, E.T. Kulkarni, B. Bhargava, R.N. Taylor, J. Libera, M. J. Lumin., 72–
74: 190, (1997).
5. Meltzer, R.S. Feofilov, S.P. Tissue, B. Yuan, H.B. Phys. Rev. B., 60: R14012,
(1999).
6. Chander, H. Mat. Sci. and Eng., R49: 113, (2005).
7. Canham, L.T. Wire Appl. Phys. Lett., 57: 1046, (1990).
8. Edelstein, A.S. Cammarata, R.C. (Eds.) Institute of Physics Publishing, Bristol,
Chap. 2, (1996).
9. Navrotsky, A. Geochem. Trans., 4: 34, (2003).
10. Chen, X.Y. Zhuang, H.Z. Liu, G.K. Li, S. Niedbala, R. J. Appl. Phys., 94: 5559,
(2003).
11. Schwoebel, P.R. Brodie, I.J. Vac. Sci. Technol. B., 13(4): 1391, (1995).
12. Ozawa, L. Mechanisms. J. Electrochem. Soc., 126(1): 106, (1979).
13. Vater, U. Kunzler, G. Tews, W. J. Fluores., 4: 79, (1994).
14. Seager, C.H. Tallant, D.R. J. Appl. Physics., 87: 4264, (2000).
15. Bhargava, R.N. J. Lumin., 70: 85, (1996).
16. Tissue, B.M. Bihari, B. J. Fluores., 8(4): 289, (1998).
17. Barber, D.B. Pollock, C.R. Beecroft, L.L. Ober, C.K. Opt. Lett., 22(16): 1247,
(1997).
18. Mackenzie, J.D. Hybrid Organic-Inorganic Composites; American Chemical
Society: Washington, DC, 585: 226. Chap. 17, 226, (1995).
19. Mark, J.E. Polym. Eng. Sci., 36: 2905, (1996).

18
20. Moser, A. Takano, K. Margulies, D.T Albrecht, M. Sonobe, Y. Ikeda Y. Sun S.H.
J. Phys. D-App. Phys., 35(19): R157, (2002).
21. Harvey, E.N. A. Amer. Phil. Soc., Philadelphia, 305, (1957).
22. Holsa, J. The Electrochemical Society Interface, 42, (2009).
23. Zuoling, F. Shihong, Z. Yingning, Y. Siyuan, Z. Chem. Phys. Lett., 395: 285,
(2004).
24. Yamamoto, H. Fundamentals of Luminescence. CRC Press: New York, Chap. 2,
(2007).
25. González, R.M.L. González-Calbet, J.M. Vallet-Regí, M. Cordoncillo, E.
Escribano, P. Carda, J. B. Marchal, M. J. Mater. Chem., 12: 1128, (2002).
26. Yen, W.M. Shionoya, S. Yamamoto, H. Phosphor Handbook, CRC Press, Boca
Raton, 790, (2006).
27. Matsuzawa, T. Aoki, Y. Takeuchi, N. Murayama, Y. J. Electrochem. Soc.,
143(8): 2670, (1996).
28. Katsumata, T. Sakai, R. Komuro, S. Morikawa, T. Kimura, H. J. Cryst. Growth.,
198/199(I): 869, (1999).
29. Liu, Y. Xu, C.N. J. Phys. Chem. B., 107: 3991, (2003).
30. Ye, C.H. Bando, Y. Shen, G.Z. Golberg, D. Chem., 118: 5044, (2006).
31. Han, S.D. Singh, K.C. Cho, T.Y. Lee, H.S. Jakhar, D. Hulme, J.P. Han, C.H.
Kim, J.D. Chun, I.S. Gwak, J. J. Lumin., 128: 301, (2008).
32. Yamamoto, H. Matsuzawa, T. J. Lumin., 72–74: 287, (1997).
33. Aitasalo, T. Hölsä, J. Jungner, H. Lastusaari, M. Niittykoski, J. J. Lumin., 94–95:
59, (2001).
34. Clabau, F. Rocquefelte, X. Jobic, S. Deniard, P. Whangbo, M.H. Garcia, A.
Mercier, T.L. Mater., 17: 3904, (2005).
35. Clabau, F. Rocquefelte, X. Jobic, S. Deniard, P. Whangbo, M.H. Garcia, A.
Mercier, T.L. Solid State Sci., 9: 608, (2007).
36. Han, S.D. Singh, K.C. Cho, T.Y. Lee, H.S. Jakhar, D. Hulme, J.P. Han, C.H.
Kim, J.D. Chun, I.S. Gwak, J. J. Lumin., 128: 301, (2008).
37. Glasser, F.P. Glasser, L.S.D. J. Am. Ceram. Soc., 46(8): 377, (1963).
38. Masumi, I. Hidehiko, K. Takuya, O. Tomoya, S. JP. Patent., 316: 433, (1997).

19
39. Lu, X.D. Zhong, M.J. Shu, W.G. Yu, Q.M. Xiong, X.Q. Wang, R.Q. Powder
Technol., 177: 83, (2007).
40. Guo, C.F. Luan, L. Huang, D.X. Su, Q. Lu, Y.H. Mater. Chem. Phys., 106: 268,
(2007).
41. Wu, S.L. Zhang, S.F. Liu, Y. Yang, J.Z. Mater. Lett., 61: 3185, (2007).
42. Zhu, Y. Zeng, J. Li W. Xu, L. Guan, O. Liu, Y. Appl. Surf. Sci., 255: 7580,
(2009).

20
Chapter 2 An Overview of the Theoretical Background on
Luminescent Materials
2.1 Introduction
In a broad sense, the word phosphor is synonymous with a solid luminescent
material, i.e., a material that converts absorbed energy into visible light, without
undergoing incandescence. In a narrow sense the word simply refers to inorganic
luminescent materials. As already mentioned, phosphors with one dimension less than
100 nm are called nanophosphors and may be described as nanostructured, inorganic,
insulating solid materials that efficiently emit light under energetic particle and
electromagnetic radiation [1]. Light emission from a phosphor is referred to as either
fluorescence or phosphorescence. Light emission during the time when a substance is
exposed to the exciting radiation is called fluorescence, while the after-glow if detectable
by the human eye after the cessation of excitation is referred to as phosphorescence.
However, in organic molecules, the two terms are distinguished by whether the transition

21
to emit light is allowed or forbidden by spin selection rules. Light emission due to an
allowed transition is called fluorescence, while that due to a forbidden transition is called
phosphorescence [2]. The term luminescence, which includes both fluorescence and
phosphorescence, is used to describe the non-equilibrium emission of radiation. Three
processes are involved in the luminescence process: excitation, energy transfer and
radiative transition of the electrons. When light is absorbed as the excitation, the
luminescence process is called photoluminescence (PL).
An overview of the terminology employed in characterizing luminescent
properties is given below.
2.2 Characteristics of luminescence
The most important characteristics of luminescence are; power, emission and
excitation spectra, polarization, rise and decay time, light sum, energy/quantum
efficiency. A brief description of these and other terms follows.
2.2.1 Luminescence power
Luminescence power refers to the amount of radiant energy of luminescence
released by matter per unit time. If the unit volume of the substance is taken into account,
one speaks of the specific power of luminescence. The spectral density Wl() and the
luminescence power Wl are related by the equation [3],
0
dWW ll (2.1)
where the integration is carried out over the entire spectrum of luminescence. If the
radiation spectrum consists of one band or line, then instead of Eq. (2.1) one can write Wl
= Wl(), where is the effective bandwidth. By definition, only the part of
spontaneous radiation specific power Wsp that exceeds the thermal emission background
pertains to luminescence.

22
2.2.2 Luminescence spectrum Graphs showing the dependence of luminescence power on the wavelength,
frequency, or energy of radiation quanta are called luminescence spectra. The
dependence of photoluminescence power on the frequency or wavelength of exciting
light Wl() with its constant intensity at all frequencies is referred to as the excitation
spectrum.
2.2.3 Luminescence polarization
As with other kinds of radiation, the polarization of luminescence consists of
anisotropy of the electromagnetic oscillation distribution in the plane perpendicular to the
beam [3].
2.2.4 Optical indicatrix
The graph of the dependence of the electromagnetic radiation energy flux on the
direction of its propagation is called the radiation indicatrix [3], and it is used mainly for
describing elementary radiators.
2.2.5 Stokes’ and anti-Stokes’ shift
Stokes’ law states the fact that the energy of absorption in luminescent materials,
is higher than that of emission in most cases. The energy difference between the two is
called the Stokes’ shift [2]. Phosphors that show an emission with a large Stokes’ shift
usually exhibit a low quenching-temperature, which is disadvantageous for many
applications [4]. Luminescent materials based on lanthanide ions circumvent this problem
because the actual luminescent process is largely independent of its environment.
Anti-Stokes’ luminescence refers to luminescent radiation whose wavelength is
shorter than that of the exciting light [3]. This phenomenon is used in infrared ray
counters and light-emitting diodes for obtaining radiation in the visible region [5,6].

23
(a)
EC
EV
(b)
hex he
hex
he
hex
2
1
Several reasons may be advanced to explain the occurrence of the anti-Stokes’
phenomenon [3]:
Due to energy exchange with other particles or with the crystal lattice, the
electron that has been promoted to an excited state under the action of the light
quantum hex can receive additional energy and move to a higher level (Fig. 2.1).
The transition of the electron from this level back to its original state leads to the
light quantum hehex.
Figure 2.1: Two mechanisms responsible for anti-Stokes’ luminescence: (a) After being excited from the valence band Ev to the conduction band Ec, an electron receives additional energy as a result of its interaction with the crystal lattice. (b) An electron is excited to the high-energy level 2 by two-photon absorption [3].
When the transition of electrons to higher states originates from an excited, rather
than the usual ground state, this may lead to a cascade of transitions to levels
whose energies are considerably greater than hex [7].
At large excitation densities a nonlinear optical process of two-photon absorption
is possible. The substance is excited to levels whose energy is equal to 2hex.
An accumulation of absorbed energy in one centre may take place as a result of
the interaction between the excited centres.

24
2.2.6 Luminescence rise and decay
Usually, for non-persistent phosphors, a two level model can be used to explain
the luminescence process (Fig. 2.2(a)) [8]. Fig. 2.2(b) is the three-level model illustrating
long persistent phosphorescence, which includes a ground state, an excited state and a
metastable trapping state for the active electron. The ground state electrons are pumped
up to the excited state at a rate Rex, and then decay back to the ground state with a
transition rate Rem. Ct and Cd are trapping and detrapping rates respectively.
Figure 2.2: (a) Two-level model for non-persistent materials. (b) Three-level model for long persistent materials [8].
Increases in the luminescence intensity with time I(t) occur in accordance with
certain laws. In the simplest case of a two-level system, I(t) is given by the equations [9],
,exp1)(
tItI st
l 0 t t1 (2.2)
0
111 exp)()(
tttItI = ,exp
0
0
tI l t t1 (2.3)
where stlI is the luminescence intensity in a stationary regime, t = 0 and t = t1 are the
moments of switching on and off of the time-invariant intensity of excitation. The
A – Ground State
B - Excited State
C - Trap
Rem
Rex1
Rem2
Rex
Ct Cd - B - Excited State
A – Ground State
(a) (b)

25
parameters and 0 determine the mean time of luminescence rise and decay; decreases
with increasing excitation energy density.
2.2.7 Light sum
Light sum () is defined as the number of light quanta N(t) emitted by a crystal
phosphor after the illumination has ceased and is given by the equation [3],
0
dttN l . (2.4)
The afterglow of crystal phosphors partially compensates for the deficiency of
luminescence quanta d in the luminescence rise portion as compared with the steady-
state regime. The ratio /d depends on the excitation intensity and can be greater or less
than unity because of the change in the quantum yield of luminescence that takes place
during the excitation process.
2.2.8 Thermoluminescence
When the stimulation of an electron from a metastable level to the conduction
band, to facilitate recombination with a hole, is achieved by warming, then the process is
referred to as thermoluminescence. Thermoluminescence is important since the study of
the temperature dependence of the afterglow intensity and spectrum permits one to draw
conclusions about the depths at which impurity levels lie in solids [10,11].
2.2.9 Phosphor efficiency
Phosphor efficiency may be expressed either in terms of energy or quantum yield.
Energy efficiency (yield) of luminescence is the ratio of the luminescence energy to the
absorbed excitation energy [3] while quantum efficiency is the ratio of the number of
luminescence quanta to the number of absorbed quanta [12]. The concept of the
luminescence yield was introduced into the literature by Vavilov [13]. The theory of
injection luminescence distinguishes between internal and external quantum of
luminescence. The internal yield is equal to the ratio of the number of emitted radiation

26
quanta to the number of recombinations of electrons and holes [3]. The external yield
takes into account only those radiation quanta that are emitted by, say, the light-emitting
diode and can be recorded by a detector. As a rule, due to the small angle of total internal
reflection at the crystal-air boundary and the higher absorption coefficient of edge
luminescence, the external quantum yield of injection luminescence is much smaller than
the internal quantum yield. Since recombination radiation propagates in all directions, a
major portion of it is reflected back from the crystal surface and is absorbed in the device
[3].
2.2.10 Transient characteristics of luminescence
Light emission from solids has been studied mainly for two reasons: (1) As a
technique for investigating the energy levels giving rise to radiative transitions and the
corresponding transition probabilities. (2) As a way of developing light emitters for many
practical applications. The main focus of investigations has been in two directions:
(i) The spectral response under various temperatures and intensities of excitation.
(ii) The time dependence of the decay of luminescence.
Of these two, the time dependence of luminescent relaxation has received the least
rigorous treatment [14], both as regards the range of times investigated and as regards the
theoretical interpretation of the observed behaviour.
Phosphorescence is a transient luminescent phenomenon, i.e. a time-dependent
emission process that is related to a quasistable state in a luminescent centre or an
electron or hole trap. The classical law governing the decay in a monomolecular
recombination process, for example that involving an excited free carrier and a bound
centre, is an exponential time dependence of the form [14],
tTL exp)( (2.5)

27
where is a suitable time constant. Consequently, there is a tendency to anticipate
exponential processes. For a bimolecular process, the expected classical law is of the
form [14],
L(T) (t + t0)-2 (2.6)
where to is a characteristic time constant. However, it is accepted by several workers
[14,15] that the prevailing form of time dependence in response to excitation of duration
short in comparison with the time of measurement is a power law of the form,
L(T) t-5 (2.7)
and those workers plot their results in the log L-log t representation which brings out
these relations. The prevalence of power laws in the context of luminescence becomes
especially interesting in the light of the fact that very similar power laws are known to be
very generally applicable to dielectric relaxation [16] and are also known in
recombination in semiconductors and semi-insulators 17]. The fact that many different
materials show luminescence decays which are well described by power laws strongly
suggests the applicability of some very general common principles. However, the validity
of power laws in the interpretation of luminescence decay still requires to pass the
universality test.
2.3 Non-radiative transitions
In addition to the radiative emissions from an excited luminescent centre, there is
the possibility of non-radiative de-excitation processes taking place. A discussion of
some of these processes follows.
2.3.1 The decay of luminescence
The general representation of the emission decay process of the luminescence
intensity I(t) after the termination of excitation is an exponential function of the form
[18],
tItI exp)( 0 , (2.8)

28
where τ is the decay time constant of the emission, although the emission decay curve of
non-localized centres, is not always represented in the exponential form of this equation.
Since the emission intensity is proportional to the number of excited luminescence
centres in a unit volume, the decay time of the after-glow in Eq. 2.8 is equal to the
lifetime of the centre and may be expressed as,
1 NRR WW (2.9)
where WR and WNR are the radiative and nonradiative transition probabilities,
respectively. Consequently, it can be shown that the luminescence efficiency of the centre
is given by,
NRR
R
WWW
(2.10)
The non-radiative transition probability WNR is generally ruled by thermal
relaxation processes. However, it can also be increased by the effect of resonant energy
transfer between optical centres.
2.3.2 Relaxation processes
2.3.2.1 Thermal activation
The thermal relaxation in a luminescence centre can be divided into two types of
mechanisms as shown by the two configurational coordinate diagrams (a) and (b) in Fig.
2.3 [18]. In the first type (a), the centre is thermally activated from point A, the point of
the lowest energy on the excited state II, to the crossing point C where the electronic
states of the excited and ground states are intermixed, and then thermally released from C
to B on the ground state I. The energy ε necessary to excite the centre from A to C is
called the thermal activation energy. The probability that the centre will make the
transition from state II to state I by thermal activation via point C is generally given by:
kTsa exp . (2.11)
Therefore, the nonradiative transition probability by thermal activation is given by,

29
kTsWNR
exp , (2.12)
Figure 2.3: Configurational coordinate models of nonradiative relaxation processes: (a) Thermal activation type. (b) Multiphonon type. [19]
where s is the frequency factor and k is the Boltzmann constant. This type of non-
radiative transition is strongly dependent on temperature, resulting in thermal quenching,
that is, the decrease of emission efficiency and shortening of the emission decay time at
high temperature, as may be deduced from the equations, 1 NRR WW and
1 NRRR WWW for the lifetime and luminescence efficiency of the centre,
respectively.
2.3.2.2 Multiphonon emission
The second type of nonradiative transition is a multiphonon process shown in Fig.
2.4(b). This is the most important non-radiative de-excitation process that competes with
radiative de-excitation and is often observed in the relaxation between the 4f excited
levels of rare-earth ions [18], where no cross-point exists between curves I and II in the
configuration coordinate diagram because of the similarity of the electronic states. The
transition between states I and II occurs at point A, where an energy gap ΔE exists
between the states: namely, the transition from the pure electronic state of II to the
electron-phonon-coupled state of I, with n phonons, takes place at A, which is followed
by the instantaneous transfer to point C and relaxation to B. The nonradiative transition
(a) (b)

30
probability is, therefore, dependent on ΔE or n, the number of phonons necessary to fill
the energy gap, since ΔE = nωp, where ωp is the largest phonon energy. The nonradiative
multiphonon transition probability is then given by [20],
ENRNR eWEW )0()( (2.13)
where α depends on the character of the phonon (lattice vibration). Since the process is
mainly due to the spontaneous emission of phonons, the temperature dependence of the
probability is small.
2.3.3 Energy transfer
Energy transfer is the migration of the excitation energy between pairs of
luminescent centres. The ions involved can either be identical or of different species. The
excitation residing in an ion can migrate to another identical ion that is in the ground state
as a result of resonant energy transfer when they are located close to each other [21].
Energy migration processes increase the probability that the optical excitation is trapped
at defects or impurity sites, enhancing non-radiative relaxation. However, in some
compounds such as NdP5O14, the lattice sites occupied by Nd are separated from each
other by a relatively large distance (5.6 Å), and a high luminescence efficiency is
achieved even when all the sites are occupied by activator ions (Nd) [22]. The energy
transfer between different ion species can also take place when they have closely
matched energy levels. The energy transfer results either in the enhancement (e.g.,
Ce3+Tb3+) or in the quenching (e.g., Eu3+Nd3+) of emission. Energy transfer between
4f levels has been shown to originate from the electric-dipole electric-quadrupole
interaction using glass samples [21]. Besides the energy transfer arising from the
interaction between ions, the process can also occur from a host crystal to activators
leading to host-excited luminescence [21].
2.3.4 Sensitization of luminescence
The term sensitized luminescence in crystalline phosphors refers to the
phenomenon whereby an impurity (activator or emitter) is enabled to luminesce upon the

31
absorption of light in a different type of centre (sensitizer, or absorber) and upon the
subsequent radiationless transfer of energy from the sensitizer to the activator. Energy
transfer processes are often used in practical phosphors in order to enhance the emission
efficiency [18]. While the energy transfer from a donor to an emitting centre causes
sensitization of luminescence, the transfer from an emitting centre to a nonradiative
centre causes the quenching of luminescence. A very small amount (~10 ppm) of Fe, Co,
and Ni in ZnS phosphors, for example, appreciably quenches the original emission as a
result of this type of energy transfer [23]. Although these ions (referred to as killer or
quencher ions) are normally undesirable, they are, in some phosphors, intentionally added
for the purpose of reducing the emission decay time, thereby obtaining a fast-decay
phosphor at the expense of emission intensity [24].
2.3.5 Concentration quenching
Concentration quenching of luminescence is the reduction in the emission of a
phosphor when the activator concentration surpasses a certain critical value as shown in
Fig. 2.4. The origin of this effect is thought to be one of the following [18]:
o Cross-relaxation between the activators results in the loss of excitation
energy from the emitting state.
o Increased activator concentration facilitates migration of excitation energy
to remote killers.
o The pairing or coagulation of activator ions converts them into quenching
centres.
The emission colour of a phosphor can change with the increase in activator
concentration when the concentration quenching due to cross-relaxation occurs on a
particular level among several emitting levels. An example is provided by Tb3+-activated
phosphors. At concentrations below 0.1%, the emission colour of these phosphors is
blue-white due to mixing of blue emission from the 5D3 emitting level and green emission
from the 5D4 level. At concentrations above 0.1%, the colour changes to green. This

32
change is attributed to cross-relaxation [18] between the 5D3 and 5D4 emitting levels,
which diminishes the population of Tb3+ ions in 5D3 state while increasing the ions in the 5D4 state.
Figure 2.4: Activator concentration dependence of the cathode-luminescence intensities of Y2O2S:Eu3+ and ZnS:Cu [25].
2.3.6 Quenching traps
Impurities can either improve or reduce the luminescence efficiency of a host
matrix. For example, the luminescence efficiency of ZnS phosphors has been known to
be drastically reduced by contamination with very small amounts of the iron group
elements [23]. Ions that cause this quenching effect are referred to as killers or quenching
traps of luminescence and may be defined as defects caused by incidental impurities or
that are inherent to the lattice. The kind and quantity of the ions that change phosphor
characteristics differ from one phosphor to another [26]. Consequently, it is very
important to remove such impurities and defects, from host lattices, in the manufacturing
processes of phosphors. There are two proposed mechanisms for the occurrence of this
phenomenon; (1) the killers may give rise to deep levels in the forbidden band, which act

33
as nonradiative recombination centres for free electrons in the conduction band and holes
in the valence band or, (2) the excitation energy absorbed by the luminescence centre is
transferred nonradiatively to the killer ions [27].
2.3.7 Luminescence quantum yield and quenching processes
Due to the energy loss processes, which take place in luminescent materials, not
all phosphors have a quantum efficiency of one. In addition, the degradation processes in
luminescent materials do occur quite frequently during the operation of devices utilizing
phosphors. The influence of these processes on device performance can be considerable;
30-50% loss in the case of cathode ray tubes [28]. The energy efficiency of these
processes is given by [28]:
escactt
hr
1 (2.14)
in which r is the backscatter coefficient, h is the mean energy of the photons emitted,
is the energy needed to generate a thermalized electron-hole pair, t is the transfer
efficiency of electron-hole pairs to activators or sensitizers, act is the quantum efficiency
of the activator ions and, esc is the escape probability. Eq. (2.14) can be used to deduce
loss processes [28] when,
the absorbed energy does not reach the luminescent ions (t),
the absorbed energy reaches the luminescent ions but there are
nonradiative channels to the ground state (act),
the luminescence generated is absorbed by the luminescent material (esc).
2.4 Physical principles of luminescence 2.4.1 Basics of luminescence
The phenomena of fluorescence and phosphorescence are best explained with the
help of the Jablonski energy-level diagram (Fig. 2.5). For any particular molecule, there

34
are a combination of singlet (S) and triplet (T) states. Excitation (e.g. S0 to S1, S2) involves
the absorption of sufficient energy to raise a molecule’s electrons into electronic states of
S1 or S2. However, excitation is not a continuous process and the energy absorbed by the
molecule has to ultimately be released, which may occur by one or a combination of the
following events [29];
Figure 2.5: Jablonski energy level diagram showing the luminescence process [30]
o emissions of photons equal to the energy-level difference
o energy transfer via quantized vibrational exchange (phonons) in the
material
o other complex energy transfer mechanisms
These energy transfers are further classified as, vibrational relaxation, internal conversion,
quenching, intersystem crossing, and delayed fluorescence.

35
The above descriptions give the impression that every atom has the potential to
exhibit luminescence. According to Sant and Merienne [31] practically all existing
materials are luminescent. However, luminescent behaviour depends on relative
probabilities of alternative processes by which excited atoms can return to the ground
state. Further, according to Heyes [32] the persistence of phosphorescence implies that
electrons occupy excited energy levels for extended periods. This allows interactions
between excited atoms and the surroundings to have an influence on the nature of the
emission.
2.4.2 Luminescence in phosphors
The configurational coordinate diagram (Fig. 2.6) can be used to explain the
influence on the processes of absorption and emission in a phosphor. Though simple, the
model can illustrate several physical phenomena including Stokes’ shift, absorption and
emission band widths and can assist in understanding thermal quenching [30].
After excitation, electrons occupying an upper vibrational level of an excited state
(B) will relax to the ground vibrational level of that state (C) losing energy via the release
of phonons [32]. Following radiative emission, the electrons reaching a higher vibrational
level of the ground state (D) will further lose energy (phonons) on their return to their
ground state equilibrium (A). The difference in excitation and emission energy levels can
be seen in the diagram illustrating Stokes’ shift (Fig. 2.1) [30].
A non-radiative emission may occur if the temperature is high enough. In such a
condition, electrons in the excited state can intersect the ground state curve (E) allowing
vibrational relaxation via phonon release to the ground state. Ranson [33] describes this
as the absorption of thermal energy (phonon) from point C, which excites the electrons to
the intersection point E. Since non-radiative processes can now also take place, the
observed luminescence intensity from a large quantity of excited ions will diminish. An
increase in temperature will result in electrons spreading over a number of vibrational
levels in the excited state. Since radiative transitions can take place between any of the

36
vibrational states in the excited and ground states, a broadening of the emission lines is
expected [32].
Figure 2.6: Configuration coordinate diagram [30].
2.5 Electronic processes leading to luminescence
2.5.1 4f Energy levels and relaxation
In contrast to other transition metal ions, the 4f electronic energy levels of
lanthanide ions are not heavily affected by the environment or crystal electric field
because the 4f electrons are shielded from external electric fields by the outer 5s2 and 5p6
electrons [22]. Due to the crystal field, the Stark effect splits each level into a number of
sublevels as determined by the symmetry of the crystal field surrounding the rare-earth
ion.
In a luminescent material, the excited states relax either by light or phonon
emission. The rate of phonon emission, , depends on the number of phonons emitted
simultaneously to bridge the energy gap and is expressed as [22],
max
exp
h
Ek , (2.15)

37
where E is the energy gap to the nearest lower level and hmax is the maximum energy
of phonons coupled to the emitting states. The following information can be deduced
from equation 2.15:
(1) The rate of phonon emission, , decreases rapidly with an increase in E, so
that the competitive radiative process becomes dominant [34].
(2) Large values of hmax quench light emission. This is demonstrated by the fact
that luminescence of Eu3+ in aqueous solution is almost quenched, but begins
to appear if H2O is replaced by D2O [35].
2.5.2 4fn–15d1 States and charge-transfer states (CTS)
Two additional kinds of electronic states exist in the energy region spanned by 4f
levels. These states have different characters from 4f levels [22]. They are the 4fn–15d1
states and the charge transfer states (CTS). In the former, one of the 4f electron(s) is
transferred to a 5d orbital and, in the latter case, electrons in the neighbouring anions are
transferred to a 4f orbital. Both of these processes are allowed and result in strong optical
absorptions. They are observed as broadband excitation spectra around 300 nm [22].
Optical absorptions due to f-d transitions are found for Pr3+ and Tb3+; those due to a
charge-transfer transition are found in Eu3+. Luminescence due to the transition from
CTS has also been reported for Yb3+ [36].
Unlike the energies of 4f states, the energies of the 4fn–15d1 and CTSs are more
dependent on their environments. However, the relative order of energies of these states
are found to be the same for the whole series of rare-earth ions in any host materials [22].
2.5.3 Electronic transitions involved in europium luminescence
Europium ions play an important role in phosphors for the lighting and display
industry [28]. Fig. 2.7 displays the energy level diagram of these ions. An understanding

38
of the spectral properties associated with the emission spectra is crucial for phosphor
development. In the diagram, the energy axis is representative of ions in oxidic lattices.
Horizontal lines represent narrow energy states of 4f levels. Shaded areas represent broad
charge transfer states in the case of Eu3+ and 4f65d1 states for Eu2+. Triangles indicate
Figure 2.7: Energy level diagram of Eu3+ and Eu2+ [28]
levels from which radiative transitions can occur. For Eu2+ the 5d band covers almost all
4f levels, leading to a broad emission spectrum. The emission wavelength is determined
by the position of the 4f 65d1 levels, which is a function of the crystal field [28].

39
2.6 Luminescence of transition metal ions
2.6.1 Introduction
The electronic configuration in transition metal ions consists of optically active
unfilled outer 3d shells, while that in rare earth ions has unfilled optically active 4f
electrons screened by outer electronic filled shells. The unfilled shells cause the ions to
present quite unique features.
The ionic radii of divalent transition metal ions with 3dn electron configurations
are close to those of the cations of IIb-VIb compounds [28]. Hence, these transition metal
ions can be easily introduced into IIb-VIb compounds. In contrast to divalent ions,
trivalent rare-earth ions are difficult to introduce into IIb-VIb compounds in high
concentrations. This is because the valence of the trivalent ions is different from the host
cations and the chemical properties are also quite different [37]. This is one of the reasons
that bright luminescence from trivalent rare-earth ions in ZnS is rather difficult to obtain,
though exceptionally bright and highly efficient luminescence has been observed in
ZnS:Tm3+. This phosphor shows bright blue luminescence under cathode-ray excitation
[37].
2.6.2 Luminescence of some rare earth ions
2.6.2.1 Introduction
The rare earth ions, either in their divalent or trivalent charge states, form a very
important class of luminescence activators in phosphors and single crystals [38]. The
activator ions in phosphors are usually derived from these atoms. In spite of their scarcity
and difficulty in obtaining, the rare earths are highly valued for their unique properties,
especially as optically active elements in their ionized state. The atomic structure of rare
earth ions in the lanthanide series and transition metal ions of the iron group are shown in
Fig. 2.8. All lanthanide ions are characterized by a Xe core, an unfilled 4ƒ shell, and

40
Figure 2.8: Rare Earth and Transition metal ion atomic structure [39].
some outer shells that screen the 4ƒ shell from outside perturbing influences [39]. This
screening effect protects the optically active electrons to some extent from the influence
of the crystal field, giving the lanthanides their characteristic sharp and well defined
spectral features. In other words they are very similar to free ion spectra. This is in
contrast to other transition metals where the unfilled 3d shell is not as well screened due
to only a single outer shell.
2.6.2.2 The f-f transition of Eu3+
The outer electronic configuration in trivalent lanthanide ions is 5s25p64fn, where
n indicates the number of electrons in the unfilled 4f shell while the 4fn electrons are the
valence electrons that are responsible for the optical transitions [40].

41
Figure 2.9: Configurational co-ordinate model of Y2O2S:Eu3+ [41]
The luminescence from Eu3+ usually consists of narrow lines in the red spectral
range. Most of the lines belong to transitions from the 5D0 level to the 7FJ (J = 0, 1, 2, 3, 4,
5, 6) levels, although transitions from other 5D-levels are frequently observed [22]. The 5D07FJ transitions are ideally suited for determination of the lattice site symmetry. For a
position with inversion symmetry, electric dipole transitions between the 4f levels are
strictly forbidden. Without inversion symmetry, electric dipole transitions become
allowed and some transitions with J = 0, 2 appear and dominate the spectrum for even
small deviations from inversion symmetry [28].
Eu3+ emission is characterized by quenching, magnetic, and electric dipole
transitions, respectively. The emissions from 5D2 and 5D1 are quenched, with an increase
in the Eu3+ concentration due to a cross-relaxation process, (5DJ5D0)(7F07FJ) [22].
The emission in the vicinity of 600 nm is due to the magnetic dipole transition 5D07F1,

42
which is insensitive to the site symmetry. The emission around 610–630 nm is due to the
electric dipole transition of (5D07F2), induced by the lack of inversion symmetry at the
Eu3+ site, and is much stronger than that of the transition to the 7F1 state.
The configurational co-ordinate model shown in Fig. 2.9, can be used to explain
the luminescence process in Y2O2S:Eu3+. The excitation of Eu3+ takes place from the
bottom of the 7F0 curve, rising along the straight vertical line, until it crosses the charge-
transfer state (CTS). Relaxation occurs along the CTS curve [41]. Near the bottom of the
CTS curve, the excitation is transferred to 5DJ states. Relaxation to the bottom of the 5DJ
states is followed by light emission downward to 7FJ states.
2.6.2.3 The d-f transition of Eu2+
Similar to the trivalent (RE3+) ions, divalent rare earth (RE2+) ions have an outer
electronic configuration of 4fn. However, unlike that of RE3+ ions, the 4f(n−1)5d excited
configuration of RE2+ ions is not far from the 4fn fundamental configuration [40]. As a
Figure 2.10: Schematic diagram of the energies of 4f7 and 4f65d1 levels in Eu2+
influenced by crystal field Δ [42] result, 4fn → 4f(n−1)5d transitions can possibly occur in the optical range for divalent rare
earth ions. They lead to intense (parity-allowed transitions) and broad absorption and
emission bands.
4f65d1
4f7
6pJ
8SJ
4f7
UV blue yellow

43
The emission bands of Eu2+ are usually broad due to f-d transitions [22]. The
wavelength positions of the emission bands depend very much on hosts, changing from
the near- UV to the red. This dependence is interpreted as due to the crystal field splitting
of the 5d level, as shown schematically in Fig. 2.10 [42]. With increasing crystal field
strength, the emission bands shift to longer wavelength. The luminescence peak energy of
the 5d-4f transitions of Eu2+ and Ce3+ are affected most by crystal parameters denoting
electron-electron repulsion; on this basis, a good fit of the energies can be obtained [43].
2.6.2.4 The f-h transition of Dy3+
Dy3+ emits in two spectral regions: (1) 470 to 500-nm region due to the 4F9/26H15/2 transition. (2) 570 to 600-nm region due to the 6F15/26F11/2 transition [44].
However, the direct UV excitation of this ion is not effective due to the relatively large
energy of both the charge transfer as well as the 4f85d1, states. Excitation by means of
host complex ions may be achievable by an energy transfer process [45].
2.7 Excitation mechanisms of luminescence centres
2.7.1 Introduction
Inorganic phosphors are composed of a host lattice doped with a small amount of
impurity ions that activate luminescence (Fig. 2.11) [28]. The absorption of energy,
which is used to excite the luminescence, takes place by either the host lattice or the
doped impurities. In most cases the emission takes place on the impurity ions, which
when they also generate the desired emission are called activator ions. Hence, the
luminescence processes of a phosphor can be divided into the processes mainly related to
the host and those that occur around and within the activator [28].
The activator ions possess energy levels that can be populated either by direct
excitation or indirectly by energy transfer. Generally, two types of activator ions can be

44
distinguished. In the first type the energy levels of the activator ion involved in the
emission process show only weak interactions with the host lattice [4]. The second type
of activator ions strongly interact with the host lattice. The strong coupling of the
electronic states with vibrational modes of the lattice mainly leads to more or less broad
bands in the spectrum [4].
Figure 2.11(a): Luminescent material containing activator ions A and sensitizing ions S. Redrawn from [28].
The absorption efficiency of an activator can be increased by adding a second
kind of impurity (sensitizer). A sensitizer is a foreign ion incorporated into a host lattice
and that is capable of transferring its energy of excitation to a neighbouring ion
(activator), thus inducing luminescence (Fig. 2.11(b)) [4].To avoid the occurrence of the
transient decay processes such as concentration quenching, which diminish the efficiency
of the luminescence process, the impurity concentrations used are usually low.
The luminescence of inorganic solids can be traced to two mechanisms:
luminescence of localized centres and luminescence of semiconductors [47,47]. A brief
account of the mechanisms involved in these luminescence processes is given below.
S
Excitation energy
S S
A
A
S A
A
A
Emission
Emission
S

45
Figure 2.11(b): Diagrammatic representation of the role in the luminescence process of a sensitizer (S) and its relationship to an activator (A) and the host lattice (H) [4]. .2.7.2 Centre luminescence
In this mechanism, the emission is generated on an optical centre, in contrast to,
e.g., emission, which results from optical transitions between host lattice band states or
from a transition between two centres [28]. The resulting characteristic luminescence
occurs in the visible part of the electromagnetic spectrum and may consist of either sharp
or broad emission bands [28]. Sharp bands arise from purely electronic transitions while
broad bands originate from the simultaneous transitions of both electronic and vibrational
systems [48]. Broad bands are observed when the character of the chemical bonding, in
the ground and excited states, differs considerably. This goes hand in hand with a change
in equilibrium distance between the emitting ion and its immediate chemical environment
and is commonly explained with the configuration coordinate diagram shown in Fig. 2.12
[49]. In the diagram,
rg
and re represent the metal-ligand distances in the ground and excited states,
respectively.
Ea and Ee are the energies at which the absorption and emission bands have their
maximum intensity, respectively.

46
is the energy of the so called zero phonon line; this transition involves
completely relaxed excited and ground states, and no excited phonon states are
involved – hence the name of this kind of transitions.
g and e give the phonon frequencies in the ground and excited states,
respectively.
Figure 2.12: Potential energy curves illustrating an electronic transition from the ground to the excited state. The Stokes’ shift comprises of the terms eeS and
ggS . Redrawn from [4]. Se and Sg are the Huang-Rhys factors in the ground and excited states,
respectively. They give the mean number of phonons involved in the absorption
and emission processes, respectively.
2.7.3 Charge transfer luminescence
The optical transition in the charge transfer process takes place between different
kinds of orbitals or between electronic states of different ions [28]. This kind of
excitation has a very strong influence on the charge distribution on the optical centre.
eeS e
ggS g
Ea Ee
rg re
Ene
rgy
e
g
r

47
Hence, there is considerable change in the chemical bonding and the corresponding
emission spectra are expected to be very broad.
2.7.4 Donor-acceptor pair luminescence
The luminescence transitions in this mechanism involves electron transfer from
the excited state of donors to the ground state of acceptors. This mechanism was
recognized earlier on [50] as a basis for understanding semiconductor luminescence. The
Figure 2.13: Processes leading to donor-acceptor pair luminescence [28]
model illustrated in Fig. 2.13 depicts the excitation of electrons into the conduction band.
The electrons are in turn captured by ionized donors, while the resulting holes in the
valence band are captured by ionized acceptors. Electron transfer between neutral donors
and neutral acceptors leads to emission. The final state (with ionized donors and
acceptors) is Coulomb stabilized. Therefore, the spectral position of the emission
generated on a donor-acceptor pair depends on the distance between the donor and the
acceptor in a pair [28]. The energy (E) involved in the overall luminescence process may
be expressed as [28],

48
E = R
eEEE DAg 0
2
4 , (2.16)
in which Eg is the band gap energy, EA is the energy required for neutralization of the
ionized acceptor, ED is the energy required for neutralization of the ionized donor, and R
is the distance between the donor and acceptor involved in the emission process. The
Coulomb term originates from the electrostatic interaction between ionized donor and
acceptor.
2.8 Traps and phosphorescence
2.8.1 Introduction
A trap can be considered as a localized electronic state which captures charge
carriers. One of the main properties of traps is their depth, i.e. the activation energy
needed to release a captured charge carrier. Shallow traps (with a depth lower than
around 0.4 eV) [51] are fully emptied at low temperatures, and do not actively take part
in processes at room temperature. Very deep traps (around 2 eV or deeper) [52], on the
other hand, require more energy to be emptied than is available at room temperature. To
observe persistent luminescence at room temperature, the traps should have an
appropriate activation energy somewhere between these two extremes (a trap depth
around 0.65 eV is considered to be optimal) [53]. Trap processes may cause
phosphorescence when charge carriers are thermally reactivated into the conduction band
(valence band) and then radiatively recombined at an emitting center [18].
2.8.2 Trap processes
Unlike the band levels that extend throughout the whole crystal, the trap levels
exist only in relatively small regions of space around the trap potential. If the state is
highly localized so that an electron bound to the trap potential has a wavefunction that
extends only as far as the nearest neighbours, the uncertainty in location is small. Such a
trap potential is known as a deep trap. The energy level for a deep trap in an E vs k

49
diagram, therefore, extends over a wide range of k values. For shallow traps, the
uncertainty in location is large, and therefore the corresponding uncertainty in momentum
is small. Such localized trap potentials may be caused by imperfections in the material,
surface related states or self-trapped states [54].
o Imperfections: In general, there are three types of imperfections; point
imperfections due to defects, point imperfections due to impurities, and large
structural imperfections such as imperfection complexes, dislocation or grain
boundaries [54].
o Surface-related states: The high surface-to-volume ratio of nanostructured
materials means that the surface properties should have a significant role on their
optical properties. Surface-related states are energetically positioned within the
band gap of the materials [55,58]. These surface traps are associated with surface
reconstruction in the atomic positions, stoichiometric defects, dangling bonds,
external adatoms (like oxygen) associated with contamination or
chemical/physical changes in the exposed surface and interfacial defects due to
lattice mismatch [57].
o Self-trapped states: A charge inside a dielectric matrix produces a polarization in
the dielectric as a consequence of its Coulomb field [58]. In turn, the polarized
surroundings will produce a reaction field at the location of the charge. The
interaction of the charge with this reaction field stabilizes the charge in the
dielectric matrix. This is known as self-trapping. Self-trapped states have been
employed to explain trapping in size-quantized systems in which the carriers are
considered to be most likely trapped in the states localized at the quantum
dot/matrix interface [59,60] or outside the quantum dot in the surrounding matrix
[61,62]. The self-trapped states are significant when trapping of carriers in the
surrounding matrix, for example polymers occurs. Charges injected into polymers
induce localized acceptor states. These acceptor states are characterized by atomic
and electronic relaxations of the molecular moiety on which the charge is
localized and of the polymer matrix surrounding the charge. These kinds of
energetically relaxed states are not the intrinsic states of a neutral polymer.

50
The crucial parameters describing the process of localization and trapping is the
relation between the spatial overlap of the electron/hole wavefunction with that of trap
potential as well as the depth of local potential fluctuations. The trapping process
decreases the overlap of the electron/hole wavefunction and therefore increases the
recombination time. Apart from changing the recombination process, trapping can also
cause lattice distortion, alternate the potential barrier or active chemical reaction [63].
2.8.3 The decay rate equation
Two scenarios may be encountered in deriving the decay rate equation of a
phosphor. The first one presumes the existence of only one kind of trap and leads to the
development of the simple model shown in Fig. 2.14, and consequently the deduction of
Figure 2.14: Luminescence after-glow process via a trap in an energy band scheme
[18]
the decay rate equations for two reaction types; monomolecular and bimolecular. The
second scenario considers the more realistic situation of the presence of more than one
type of trap in a phosphor.
Conduction Band
Recombination Centre
Trap
Valence Band

51
For the one trap condition the parameters are defined as follows; N is the trap
concentration, nc and nt are the number of electrons per unit volume in the conduction
band and trap states, respectively, p is the number of holes and is equal to (nc + nt). Then,
the rate equation representing the decaying processes of the concentration of electrons
and holes after the termination of excitation is [18],
cttt nnNban
dtdn )( (2.17)
crpndtdp
(2.18)
where a is the probability per second for a trapped electron to be thermally excited into
the conduction band, b and r are the probabilities that a free electron in the conduction
band will be captured by a trap or will recombine with a hole. It is supposed that the
number of the electrons nc in the conduction band in the after-glow process is so small
that p nt and dp/dt dnt/dt. Then, the above two equations give [18],
tt
tt
nNrbn
andt
dn
2
(2.19)
Equation 2.19 can be solved analytically for two cases: b r and b r to yield the final
two equations.
For b r, which presumes that the electrons once released from traps are
not re-trapped in the after-glow process, Eq. 2.19 can be simplified to,
tt an
dtdn
(2.20)
Since the emission intensity is given by I(t) ∝ dp/dt and dp/dt dnt/dt,
then the exponential decay of after-glow is given by the equation,
)exp()( 0 atItI . (2.21)
Equation 2.21 is referred to as the first-order or monomolecular reaction
equation.
In the case b r, which means that the traps and emitting centres have
nearly equal capturing cross-sections, Eq. 2.19 can be simplified to,

52
2t
t nNa
dtdn
(2. 22)
and then the number of trapped electrons per unit volume is given by,
tan
N
nn
t
tt
0
0
1. (2. 23)
Approximating I(t) ∝ dnt/dt as before, the decay curve of the after-glow is
obtained as [18],
2
0
1)(
tI
tI
,
tanN . (2.24)
This form is called the second-order or bimolecular reaction type, where
the decay curve is changed by excitation intensity as well as by
temperature.
However, the real phosphors may have several kinds of traps of different depths.
For example, in SrAl2O4:Eu2+, Dy3+, there are three kinds of traps; 0.57, 0.41 and 0.19 eV
[64]. The three traps represent defect-related shallow traps such as Sr–vacancy defects,
and deep traps such as Dy3+ related hole-traps [64]. Therefore, in many real cases, the
after-glow decay curve is not represented simply by a monomolecular or bimolecular
reaction curve. In the second scenario, the decay curves are often fitted with equations of
the form,
nt
ItI
1
)( 0 , (2.25)
where n ranges between 0.5 and 2 [18].
2.9 Factors determining the emission colour
The colour of the emitted light in rare-earth doped luminescent materials depends
on the activator species as well as host composition. For example, using UV or VUV as
the excitation source, the following results have been obtained in phosphor materials used
for practical applications:

53
Red phosphor can be obtained by doping Y2O3 cubic structure with
europium [65,66].
Green colour is generated when Zn2SiO4 is doped with Mn [67,68].
Blue emission is derived from Eu-doped BaMgAl10O17 [69,70].
Ce-doped Y3Al5O12 produces yellow light [71,72].
Figure 2.1 5(a): Zinc-blende structure
The dependence of the emission colour on the two factors originates in the crystal
structure adopted by IIa-VIb compounds. Except for MgTe, which crystallizes in the
zinc-blende structure (Fig. 2.15(a)) and BeO, which favours the wurtzite lattice (Fig.
2.15(b)), most of the IIa-VIb family have NaCl-type structures (Fig. 2.15(c)) [73]. The
compounds in the NaCl-type structure can form solid solutions in a wide range of
compositions. As a consequence, the emission colour can be varied by changing the host
composition as well as the activator species and concentration. Such diversity is one of
the advantageous features of the IIa-VIb compounds. For the rare earth ions, many
radiative electronic transitions occur in the visible region while retaining their atomic-like

54
spectra in a wide range of host materials. This phenomenon, once understood, opens up
the possibility to tailor the emission colour to specific applications.
In the specific case of the aluminate phosphors, the phosphorescence from the
aluminates is believed to be caused by the 4f–5d transition of the Eu2+ ions in the crystals
[52,74,75]. This electron transition has been reported to be affected by the electrical
environment around the Eu2+ ions. Therefore, the colour of the phosphor is expected to
vary with the crystal structure of the mother phases.
Figure 2.15(b): Wurtzite structure
In cases where at least one of the electronic states is involved in the chemical
bonding, the coupling to the lattice has to be taken into account. This situation is
encountered for many transition metal ions, for the s2 ions, and for rare-earth ions
showing df emission. In Fig. 2.16, this situation is illustrated for df optical
transitions on Eu2+. Other rare-earth ions showing df emission are Ce3+, Pr3+, Nd3+ and
Er3+ [49].
The energy difference between the d- and f-electrons is modified by the covalence
of the Eu2+-ligand bond and the crystal field strength. An increase of the covalence of the

55
Eu2+-ligand bond results in a lower energy difference of the 4f-5d energy separation (due
to the nephelauxetic effect). This treatment considers the shift of the centre of gravity
Figure 2.15(c): NaCl structure
(also called barycenter) of the d-electron level (also called centroid shift), i.e. any
splitting is not yet taken into account [76]. The extent to which the crystal field
interaction splits the d-level depends on the symmetry and the strength of the crystal
field. In this way, e.g., for Eu2+, emission can be obtained extending from the UV part of
the optical spectrum to the red part [76]. Both are easily accessible by choosing
appropriate host lattices, and for this reason broad-band emitters can in general be tuned
within a large spectral range and can be adapted to the application needs.
The spectral position of the emission lines due to transitions between f-electronic
states does not vary very much on changing the host lattice. However, the relative
emission intensity of the several possible optical transitions does vary considerably. In
general, it can be stated that in cases where the rare-earth ion occupies a site with
inversion symmetry, the selection rule states: J = 0, 1. In cases where J = 0, any
transition to another state with J = 0 is forbidden as well. In such a case, J is
necessarily [76]. These are all magnetic dipole transitions. In lattices without inversion
symmetry there is also electric dipole emission.

56
For these transitions, the selection rule is: J 6. Here again, for initial or final
states with J = 0, other selection rules are operative. In such a case, for electric dipole
transitions, J = 2, 4, or 6. It is observed that the presence of an inversion centre opens
up the possibility to tune the emission spectrum to a small extent. For Eu3+ with excited
state 5D0, the emission can be tuned from orange (590 nm, with inversion symmetry,
Figure 2.16: The effect of crystal field strength on the energy levels and emission colour of the Eu2+ ion in solid state. The arrows indicate different emission colours [76] 5D07F1 transition) to red (610 nm, without inversion symmetry, 5D07F2 transition). A
more general description of these effects is provided by the Judd-Ofelt theory [77,78].
As has already been stated, in the donor-acceptor pair luminescence mechanism,
both the donors and the acceptors and the magnitude of the band gap strongly influence
the spectral position, and hence the emission colour to be obtained. This characteristic is
adequately illustrated by the blue- and green-emitting ZnS:Ag and ZnS:Cu,Au phosphors,
respectively [78].
4f65d1
4f7
6pJ
8SJ
Covalency ligand field
4f7
Activator-ligand interactions
line emission

57
2.10 References
1. Shionoya, S. Phosphor Handbook. CRC Press, Boca Raton, Chap.1, (2007).
2. Yamamoto, H. Fundamentals of luminescence. CRC Press: New York, Chap. 2,
(2007).
3. Gribkovskii, V.P. Theory of Luminescence. Plenum Press, New York, (1998)
4. Justel, T. Nikol, H. Ronda, C. Angew. Chem. Int. (Ed.), WILEY-VCH Verlag
GmbH, D-69451 Weinheim, 37: 3084, (1998).
5. Galginaitis, S.V. Met. Trans., 2(3): 757, (1971).
6. Bergh, A.A. Dean P.J. Proc. IEEE, 60: 156, (1972).
7. Auzel, F. Chen, Y, Meichenin, D. J. Lumin., 60-61: 692, (1994).
8. Jia, D. Opti. Mater., 22: 65, (2003). 9. Stepanov, B.I. Gribkovskii, V.P. Theory of Luminescence. ILIFFE Books, London.
(1963).
10. Levshin, V.L. Photoluminescence of Solid and Liquid Substances. GITTL,
Moscow, Leningrad, (1959).
11. Henisch, H.K. Electroluminescence. Pergamon, Oxford, (1962).
12. Adachi, C. Tsutsui, T. Fundamentals of Luminescence. CRC Press, Taylor &
Francis Group, LLC, Chap. 2. (2007)
13. Levshin, V.L. J. Sov. Phys., 4(5): 747, (1962).
14. Jonscher, A.K. Polignac, A.J. Phys. C: Solid State Phys., 17: 6493, (1984).
15. Debye, P.J. Edwards, J.D. J. Chem. Phys., 20: 236, (1952).
16. Jonscher, A.K. J. Mater. Sci., 16: 2037, (1983).
17. Jonscher, A.K. Li, J-R. J. Phys. C: Solid State Phys., 16(32): L1159, (1983).
18. Nakazawa, E. Fundamentals of Luminescence. CRC Press: New York, Chap. 2,
(2007).
19. Nakazawa, E. J. Lumin., 18/19(1): 272, (1979).
20. Pelle, F. Auzel, F. J. Alloys Comp., 300–301: 131, (2000).
21. Nakazawa, E. Shionoya, S. J. Chem. Phys., 47: 3211, (1967).
22. Kano, T. Principal Phosphor Materials and Their Optical Properties. CRC Press:
New York, Chap. 3, (2007).

58
23. Tabei, M. Shionoya, S. Jpn. J. App. Phys., 14: 240, 240, (1975).
24. Suzuki, A. Yamada, H. Uchida, Y. Kohno, H. Yoshida, M. Tech. Digest Phosphor
Res. Soc. 197th Meeting, (1983).
25. Kuboniwa, S. Kawai, H. Hoshina, T. Jpn. J. Appl. Phys., 19: 1647, (1980).
26. Narita, K. Practical Applications of Phosphors. Yen, W.M. Shionoya, S.
Yamamoto, H. (Eds.), CRC Press: New York, Chap. 1, (2006).
27. Godlewski, M. Skowronski, M. Phys. Rev. B., 32(6): 4007, (1985).
28. Ronda, C. R. Luminescence from Theory to Applications. Ronda, C. R. (Ed.). Chap.
1. Willy-VCH, Germany, (2008).
29. Allison, S.W. Gillies, G.T. Review of Scientific Instruments. 68(7): 2615-2650,
(1997).
30. Khalid, A.H. Kontis, K. Principles, Current State of the Art and Recent
Applications of Sensors. 8: (2008).
31. Sant, Y.L. Merienne, M.C. Aerospace Sci. Technol., 9(3): 285, (2005).
32. Heyes, A.L. Advanced Measurement Techniques for Aeroengines and Stationary
Gas Turbines. Von Karmen Institute for Fluid Dynamics. March 1, (2004).
33. Ranson, R.M., PhD Thesis. Nottingham Trent University, (1999).
34. Riseberg, L.A. Moos, H.W. Phys. Rev., 174(2): 429, (1968).
35. Kropp, J. L. Windsor, M.W. J. Phys. Chem., 71(3): 477, (1967).
36. Turro, N.J. Modern Molecular Photochemistry. Benjamin/Cummings, Menlo Park,
CA, (1978).
37. Hoshina, T. Imanaga, S. Yokono, S. J. Lumin., 15: 455, (1977).
38. Blasse, G. Grabmaier, B.C. Luminescent Materials. Springer-Verlag, Berlin,
(1994).
39. Walsh, B.M. Advances in Spectroscopy for Lasers and Sensing. Bartolo, B.D. Forte,
O. (Eds.), Springer, Netherlands, (2006).
40. Sole, J.G. Bausa, L.E. Jaque, D. An Introduction to the Optical Spectroscopy of
Inorganic Solids. John Wiley & Sons Ltd. The Atrium, Southern Gate, Chichester,
West Sussex, England, Chap. 6, (2005).
41. Struck, C.W. Fonger, W.H. J. Lumin., 1-2: 456, (1970).

59
42. Blasse, G.: Luminescence of Inorganic Solids. DiBartolo, B., Plenum Press, 457,
(1978).
43. Van Uitert, L.G. J. Lumin., 29: 1, (1984).
44. Sommerdijik, J.L. Bril, A. J. Electrochem. Soc., 122, 952, (1975).
45. Sommerdijik, J.L Bril, A. Hoex-Strik, F.M.J.H. Philips Res. Rept., 32: 149, (1977).
46. Blasse, G. Grabmaier, B.C. Luminescent Materials. Springer-Verlag, Berlin,
(1994).
47. Blasse, B. Bril, A. Philips Tech. Report, 10: 370, (1970)
48. Martienssen, W. Warlimont, H. Handbook of Condensed Matter and Data
Materials. Springer, USA, (2005).
49. Dexter, D.L. A J. Chem. Phys., 21: 836, (1953).
50. Prener, J.S. Williams, F.E. J. Electrochem. Soc., 103: 342, (1956).
51. Chen, R. McKeever, S.W.S. World Scientific: Singapore; xiii: 559, (1997).
52. Dorenbos, P.J. Electrochem. Soc. 152: H107, (2005).
53. Matsuzawa, T. Aoki, Y. Takeuchi, N. Murayama, Y. J. Electrochem. Soc., 143:
2670, (1996).
54. Bube, R.H. Electrons in solids, 2nd Ed. Academic Press, San Diego, (1987).
55. Hache, F. Klein, M.C. Ricard, D. Flytzanis, C. J. Opt. Soc. Am. B, 8(9): 1802,
(1991).
56. Lueth, H. Solid Surfaces, Interfaces and Thin Films. Springer-Verlag, Berlin,
(2001).
57. Nemec, P. Maly, P. J. Appl. Phys., 87: 3342 (2000).
58. Tian, Y. Wu, C. Fendler, J.H. J. Phys. Chem., 98: 4913, (1994).
59. Wang, Y. J. Phys. Chem., 95: 1119, (1991).
60. Zhang, J.Z. O'Neil, R.H. Roberti, T.W. McGowen, J.L. Evans, J.E. Chem. Phys.
Lett., 218: 479, (1994).
61. MacDonald, R.L. Lawandy, N.M. Phys. Rev. B., 47: 1961, (1993).
62. Woggon, U. Rückmann, I. Kornack, J. Müller, M. Cesnulevicius, J. Petrauskas, M.
Kolenda, J. J. Cryst. Growth., 117: 608, (1992).
63. Kaschke, M. Ernsting, N.P. Müller, U. Weller, H. Chem. Phys. Lett., 168(6): 543,
(1990).

60
64. Yuan H. Ph.D. Thesis, University of Georgia, 73, (1998).
65. Konrad, A. Fries, T. Gahn, A. Kummer, F. Herr, U. Tidecks, R. Samwer, K. J.
Appl. Phys., 86(6): 3129, (1999).
66. He, C. Guan, Y. Yao, L. Cai, W. Li, X. Yao, Z. Mater. Res. Bull., 38: 973, (2003).
67. Morimo, R. Matae, K. Mater. Res. Bull., 24: 175 (1989).
68. Miyata, T. Minami, T. Saikai, K. Takata, S. J. Lumin., 60-61: 926, (1994).
69. Jung, K.Y. Kang, Y.C. Mat. Lett., 58: 2161, (2004).
70. Chang, H. Lenggoro, I.W. Ogi, T. Okuyama, K. Mat. Lett., 59: 1183, (2005).
71. Rosario, G.D. Ohara, S. Mancic, L. Milosevic, O. App. Surf. Sci., 238: 469, (2004).
72. Kottaisamy, M. Thiyagarajan, P. Mishra, J. Rao, M.S.R. Mat. Res. Bul. 43: 1657,
(2008).
73. Krebs, H. Fundamentals of Inorganic Crystal Chemistry. McGraw-Hill, London,
159, (1968).
74. Pallila, F.C. Levine, A.K. Tomkus, M.R. J. Electrochem. Soc., 115: 642, (1968).
75. Abbruscato, V. J. Electrochem. Soc., 118: 930, (1971).
76. Meijerink, A. Nuyten, J. Blasse, G. J. Lumin., 44: 19, (1989).
77. Ofelt, G.S. J. Chem. Phys., 37: 511, (1962).
78. Judd, B.R. Phys. Rev., 127: 750, (1962).

61
Chapter 3
Literature Review
3.1 Introduction
Luminescent materials are mostly solid inorganic materials consisting of a host
lattice, usually intentionally doped with impurities [1]. Most of these materials are
oxides, sulfides, fluorides, halides, and oxysulfides doped with transition metal ions or
rare-earth ions. They are generally characterized by the emission of light with energy
beyond thermal equilibrium [2]. Recently, with the advent of solid-state lighting
technologies as well as the development of plasma and field emission display panels, a
great number of traditional phosphors cannot meet the requirements for new applications,
for example; (1) excitation by near-ultraviolet (UV) or visible light, (2) efficient emission
of appropriate colours and (3) survival in adverse environments. Therefore, novel
phosphors with superior luminescent properties are being sought.
Quite a number of unresolved problems may be identified even among the so
called classical phosphors. Hence, this will be a good starting point in this review. The
term classical may be used to refer to luminescent materials which are applied in classical
applications, i.e. applications which have been known for a long time. Examples of such
applications include x-ray imaging, luminescent lighting and cathode-ray tubes

62
(television). This category roughly includes the tungstates (MWOx), vanadates (MVOx),
trivalent antimony (Sb3+), red bismuth ganate (Bi4Ge3O12), and copper (Cu+).
3.2 Synthesis
3.2.1 Tungstates
Following Rontgen’s invention of x-rays, a search for phosphors which were able
to absorb x-rays and to convert the absorbed energy efficiently into light was started [3].
As early as 1896, Pupin proposed calcium tungstate (CaWO4) for this purpose. In spite of
having served for more than 90 years in x-ray intensifying screens, there are still issues
regarding the nature of the emission transition and the quenching temperature of the
luminescence in this material.
3.2.2 Vanadates
The nowadays overwhelming role of rare-earth ion luminescence in commercial
phosphors [3], started in 1964 with the successful proposition of europium-doped yttrium
vanadate (YVO4:Eu3+) as a red phosphor for colour television tubes and later also for
luminescent lamps [4]. While the luminescence of Eu3+ in YVO4 has been investigated
thoroughly and satisfactorily understood, the vanadate 34VO group luminescence is less
well understood. On the whole, this class of materials is yet to be satisfactorily
understood.
3.2.3 Trivalent antimony (Sb3+)
The Sb3+ luminescence is fairly well understood. It can be described in terms of
transitions between the 5s2 ground configuration and the 5s5p excited configuration, as
shown by Oomen et al. [5] using the halide elpasolites as a model host lattice. The Sb3+
ion in apatite: Ca5S(PO4(F,Cl)):Sb3+,Mn2+ [3] was the best lamp phosphor for decades.
However, the high efficiency of the Sb3+ emission in apatite has not yet been well
understood. The Stokes’ shift is some 19,000 cm-1, half of the value of the first excitation

63
band maximum [6]. According to an old criterium by Dexter et al. [7], this means that the
emission cannot be efficient. Though this material has been applied for decades in many
millions of luminescent lamps, the constitution of the Sb3+ centre in apatite [3] is not yet
clear.
3.2.4 Red bismuth luminescence (BaSO4:Bi)
The efficient red luminescence for bismuth doped barium sulphate (BaSO4:Bi)
was reported in 1886. However, it was not until half a century later that this was
confirmed, while a satisfactory explanation came another half century later [8].
3.2.5 Bismuth ganate (Bi4Ge3O12)
Due to its excellent scintillation properties, the compound Bi4Ge3O12 has been put
to various applications, the most prominent of which is in the electromagnetic calorimeter
of CERN (Geneva) [3]. However, the nature of the emission transition in this material is
still unclear. It has a very large Stokes’ shift, which for many years was considered to be
a 6s26s6p Bi3+ transition. It took quite some time for the proposition to be made that
the emission originated in the D level, which is essentially a charge transfer level [9]. The
difficulty in understanding the emission is attributed to the complicated nature of the
composition of the emitting level in Bi4Ge3O12.
3.2.6 Copper (Cu+)
The Cu+ ion (3d10 configuration) is known to emit efficiently in many host
lattices. The emission is usually ascribed to a 3d94s 3d10 transition. However, optically
detected paramagnetic resonance on NaF:Cu+ shows that in the emitting state the spin
density in the Cu 4s orbital is very small [10]. This implies that also here the emitting
state is more complicated than originally thought.

64
3.2.7 Silicates (M2MgSi2O7)
The most widely studied persistent luminescent silicates consist of the materials
M2MgSi2O7 (M = Ca,Sr,Ba), that play a role similar to that of MAl2O4 in the aluminate
group. Of these, the best known compound is Sr2MgSi2O7:Eu2+,Dy3+, first reported by
Lin et al. in 2001 [11]. The most common method for preparation of these materials
(M2MgSi2O7) is the solid-state reaction technique at 1200–1400 °C. Other methods that
have recently been successfully employed include sol-gel [12], co-precipitation [13], and
combustion [14,15]. A huge enhancement of the afterglow in nearly all co-doped
aluminates and silicates has usually been observed. For example, Sr2MgSi2O7:Eu2+,Dy3+
[16] and Ba2MgSi2O7:Eu2+,Tm3+ [17] have a much brighter and longer afterglow than
their non-co-doped variants. However, contrary results were reported by Hölsä and co-
workers who found that, with the exception of Tb3+, which had a weak positive influence,
the afterglow in Ca2MgSi2O7:Eu2+ was significantly reduced upon addition of trivalent
rare-earth ions [18]. Another remarkable observation of Ca2MgSi2O7:Eu2+ was in
disagreement on the emission spectrum. Blasse [19] and Hölsä [18] found an emission
maximum around 535 nm, whereas Mao and co-workers reported an emission band
centred around 515 nm when co-doping with Dy and Nd [20,21,22]. Using a sol-gel
method, Wang et al. [23] prepared Sr2ZnSi2O7:Eu2+,Dy3+. By applying different synthesis
temperatures, they were able to obtain grains of various sizes and they showed that a
smaller grain size enhanced both the brightness and lifetime of the afterglow.
3.2.8 Aluminates
The group of compounds consisting of Eu2+ doped and rare-earth (R3+) co-doped
alkaline earth aluminates (MAl2O4:Eu2+,R3+; M: Ca, Sr, Ba) are by far the most studied
family of persistent luminescent materials and are considered the first generation of the
modern persistent luminescence materials [24]. This classification was a culmination of
the developments emanating from the breakthrough reported in the article by Matsuzawa
et al. on SrAl2O4:Eu2+,Dy3+ [24]. Since then the aluminates have been at the centre of
attention in persistent luminescent research. Some of the specific outstanding

65
achievements of this era include the bright green luminescence of the monoclinic [25]
SrAl2O4:Eu2+, which was discovered in 1966 [26] and described by Blasse and Bril two
years later, together with that of CaAl2O4:Eu2+ and BaAl2O4:Eu2+ [27].
The promising results exemplified by these phosphors led to a search for a
method to synthesize co-doped MAl2O4:Eu2+ in an efficient, cheap and simple way. The
methods include, solid-state reaction combustion [28-32], Pechini [28], microwave [33],
laser heated pedestal growth (LHPG) [34], and sol-gel [35-38], which have been used to
varying degrees of satisfaction. These investigations revealed that not all the techniques
lead to identical crystallographic and luminescent properties. For example,
SrAl2O4:Eu2+,Dy3+ prepared by microwave synthesis shows a decreased initial brightness
of the afterglow, together with a small blue shift of the emission spectrum, possibly due
to the small grain size [33]. A similar blue shift has been reported for sol-gel prepared
SrAl2O4:Eu2+,Dy3+ [36-38]. During the preparation of CaAl2O4 by combustion or a sol-
gel method, Hölsä and co-workers obtained an unusual hexagonal crystal structure
instead of the expected monoclinic one [28,35]. Other researchers have been able to
create grains with orthorombic structure [31]. These observations imply that care should
be taken when comparing luminescence of compounds prepared using different
procedures. Similarly, the exact composition of the starting mixture has important
consequences for the afterglow behaviour. A deficit of alkaline earths has been found to
enhance the afterglow [39], while an excess of barium in BaAl2O4:Eu2+,Dy3+ has been
observed to completely annihilate the persistent luminescence in the phosphor [40].
The influence of the borate (B2O3) on SrAl2O4:Eu2+,Dy3+ has been the subject of
interest to various researchers. Though this material is usually added to the starting
mixture as a fluxing agent [24], it has been observed to have other influences. For
example, samples prepared without borate showed only very weak [36,41] or no
persistent luminescence at all [42] even though perfect SrAl2O4 phase formation was
achieved. A probable explanation for this effect is that the boron is incorporated in the
host as BO4, where it forms substitutional defect complexes with Dy3+ [42]. This

66
decreases the depth of the charge traps in SrAl2O4 from 0.79 eV to 0.65 eV, making it
suitable for persistent luminescence at room temperature [41].
The aluminate phase Sr4Al14O25:Eu2+,Dy3+, is a blue-emitting persistent phosphor
with emission around 490 nm and an afterglow that has been reported to remain visible
for over 20 hours [43,44]. A small deficit of strontium enhances the persistent
luminescence [43,44], and preparation without borate strongly reduced the afterglow
[41]. The addition of silver (Ag+) ions in this phosphor has been observed to have a
positive effect on the afterglow, and has been attributed to an increase in the trap density
[45].
Other interesting results on aluminates involve the Sr3Al2O6:Eu2+,Dy3+ phase. The
emission colour from the triboluminescence [47] and photoluminescence [48]
measurements on this phosphor is bright green with a spectrum peaking around 510 nm.
However, when the same material was prepared using either microwave or sol-gel
processes [49,50], red Eu2+-emission around 612 nm was observed. These conflicting
reports have led to the emission colour of Sr3Al2O6:Eu2+,Dy3+ being indicated as
‘disputed’.
3.2.9 Sulfides
Sulfide phosphors are among the oldest classes of luminescent materials as
exemplified by the ZnS-type phosphors [51]. ZnS-type phosphors have played a very
important role in cathode-ray tubes and have a history of more than 130 years. Despite
their long history, progress in understanding the fundamental physical properties for these
phosphors has been quite slow. This has been attributed to two main reasons: (1) These
materials are hygroscopic and produce toxic H2S when placed in contact with moisture.
(2) Their luminescence properties are sensitive to impurities and nonstoichiometry, which
make it difficult to obtain controlled reproducibility in performance [52].
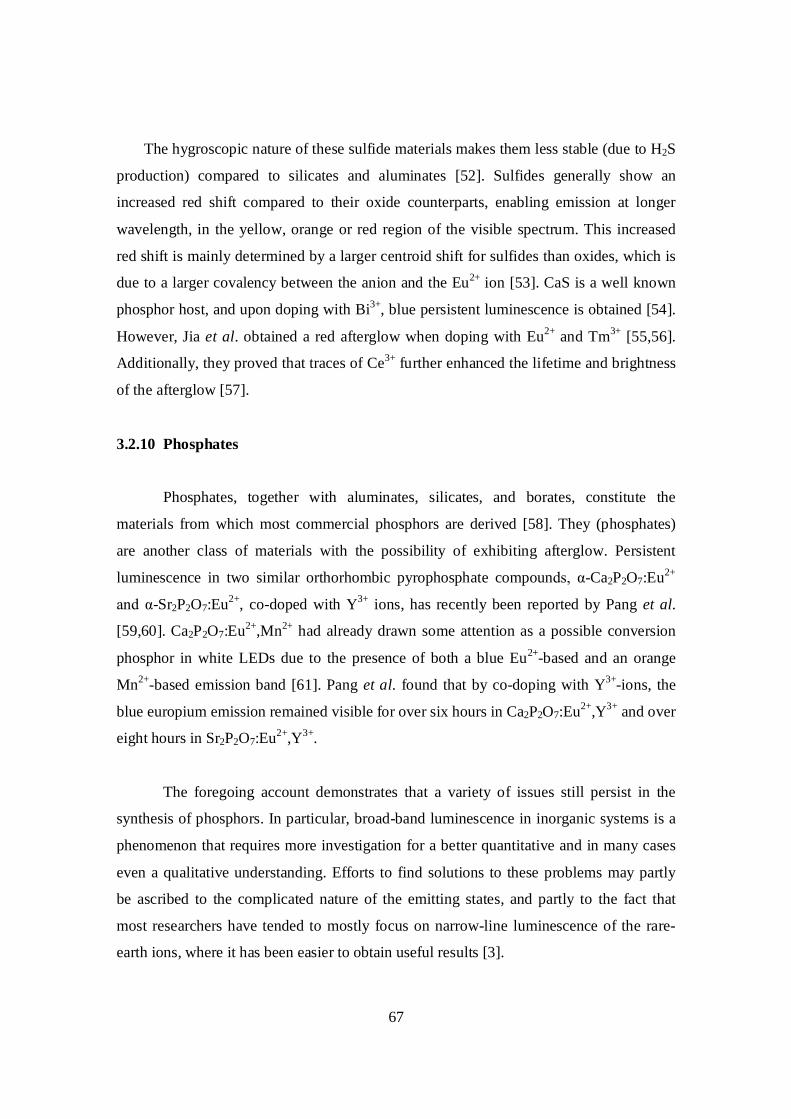
67
The hygroscopic nature of these sulfide materials makes them less stable (due to H2S
production) compared to silicates and aluminates [52]. Sulfides generally show an
increased red shift compared to their oxide counterparts, enabling emission at longer
wavelength, in the yellow, orange or red region of the visible spectrum. This increased
red shift is mainly determined by a larger centroid shift for sulfides than oxides, which is
due to a larger covalency between the anion and the Eu2+ ion [53]. CaS is a well known
phosphor host, and upon doping with Bi3+, blue persistent luminescence is obtained [54].
However, Jia et al. obtained a red afterglow when doping with Eu2+ and Tm3+ [55,56].
Additionally, they proved that traces of Ce3+ further enhanced the lifetime and brightness
of the afterglow [57].
3.2.10 Phosphates
Phosphates, together with aluminates, silicates, and borates, constitute the
materials from which most commercial phosphors are derived [58]. They (phosphates)
are another class of materials with the possibility of exhibiting afterglow. Persistent
luminescence in two similar orthorhombic pyrophosphate compounds, α-Ca2P2O7:Eu2+
and α-Sr2P2O7:Eu2+, co-doped with Y3+ ions, has recently been reported by Pang et al.
[59,60]. Ca2P2O7:Eu2+,Mn2+ had already drawn some attention as a possible conversion
phosphor in white LEDs due to the presence of both a blue Eu2+-based and an orange
Mn2+-based emission band [61]. Pang et al. found that by co-doping with Y3+-ions, the
blue europium emission remained visible for over six hours in Ca2P2O7:Eu2+,Y3+ and over
eight hours in Sr2P2O7:Eu2+,Y3+.
The foregoing account demonstrates that a variety of issues still persist in the
synthesis of phosphors. In particular, broad-band luminescence in inorganic systems is a
phenomenon that requires more investigation for a better quantitative and in many cases
even a qualitative understanding. Efforts to find solutions to these problems may partly
be ascribed to the complicated nature of the emitting states, and partly to the fact that
most researchers have tended to mostly focus on narrow-line luminescence of the rare-
earth ions, where it has been easier to obtain useful results [3].

68
3.3 Persistent luminescence mechanisms
3.3.1 Introduction
Knowledge of inorganic luminescent materials can be traced to approximately the
tenth century in Japan and China as well as since the end of the middle edges in Europe
[62,63]. The first scientifically documented observation of the persistent luminescence
phenomenon associated with these materials dates back to the beginning of the 17th
century [64] when the Italian shoemaker, V. Casciarolo, observed strong luminescence
from the famous Bologna stone. In the 20th century, applications of this phenomenon
were put to use [65], in spite of the lack of a satisfactory explanation. A renewed search
for the underlying mechanisms was spurred by the discovery of the persistent
luminescent properties of SrAl2O4:Eu2+,Dy3+ by Matsuzawa et al. [24]. It was generally
agreed that after excitation, charge carriers can be captured by traps, then gradually
released followed by a return to the activators while simultaneously producing the
luminescence [66]. A significant amount of research has also been done on
thermoluminescence glow curves and how to extract information about trap depth from
them [67]. However, details such as the nature and origin of the traps and the charge
carriers are still unclear. Since 1996, different mechanisms have been suggested, ranging
from very basic conceptual models to complex systems with multiple charge traps of
various types and depths [66,67]. In particular, a mechanism of persistent luminescence
that was proposed in 1996 for SrAl2O4:Eu2+;Dy3+ has been widely adopted to explain
afterglow in many Eu2+ and Dy3+ co-doped aluminates and silicates. The mechanism
involves the thermally activated release of a hole from Eu2+ in its excited 5d state to the
valence band which is subsequently trapped by Dy3+. However, the true mechanism in
the persistent luminescence of these phosphors is still a disputed matter. To arrive at
plausible mechanisms or to discard implausible ones, it is necessary to know the absolute
energy level locations [68]. Following is a concise overview of some of the prominent
luminescence mechanisms, which have been proposed.

69
3.3.2 The Matsuzawa model
Following their discovery of the SrAl2O4:Eu2+,Dy3+ phosphor, Matsuzawa et al.
[24] also proposed a mechanism to explain the origins of the extraordinary persistent
luminescence. The mechanism relies largely on the photoconductivity study of powder
SrAl2O4:Eu2+ samples [69]. A schematic picture of their model is shown in Fig. 3.1. In
this model, holes are assumed to be the main charge carriers. This assumption is based on
earlier measurements by Abbruscato on non codoped SrAl2O4:Eu2+, which also shows a
weak afterglow. From his results obtained by Hall measurements, Abbruscato concluded
that holes in the valence band had to be the main charge carriers [69]. He suspected that
Sr2+ vacancies acted as traps for these holes. Additionally, Matsuzawa et al. performed
non-uniform illumination photoconductivity measurements, which also suggested that
holes are the main charge carriers [24].
Figure 3.1: Phosphorescence mechanism proposed by Matsuzawa et al. for SrAl2O4:Eu2+,Dy3+ [24].
The Matsuzawa model modified Abbruscato’s assumptions in order to explain the
influence of rare earth co-doping. When an Eu2+ ion is excited by an incident photon,
there is a possibility that a hole escapes to the valence band, thereby leaving behind a Eu+
ion. The hole is then captured by a trivalent rare earth ion, such as Dy3+, thus creating a
Dy4+ ion.

70
16*272 544 dfEuhfEu
/7216*2 454 hfEudfEu
Dy3+ (4f9) + h+ Dy4+ (4f8)
After a while, thermal energy causes the trapped hole to be released into the valence band
again. From there it can move back to a Eu+ ion, allowing it to return to the Eu2+ ground
state with emission of a photon [24]. In their mechanism, Matsuzawa et al. made two
crucial assumptions: (1) The fundamental level of the 4f7 configuration of Eu2+ is close in
energy to the top of the valence band. (2) The Eu2+ ion, excited by irradiation, becomes
an excited Eu+* ion upon electron capture, Eu2+* (4f65d1) + e- Eu+* (4f75d1). The
Matsuzawa model quickly gained recognition [40,42,70], and was frequently used to
explain observed phosphorescence behaviour in newly discovered compounds [20,43,71].
Various thermoluminescence [34,72,73,74], photoconductivity [70], and electron
paramagnetic resonance [66] measurements were performed to confirm the validity of the
model. However, the results of these experiments were often inconclusive and no hard
evidence for the model could be found. For example, the generation of the Eu+* and Dy4+
species, under a UV or visible excitation was considered to be highly unlikely.
Furthermore, electronic band structure calculations carried out for SrAl2O4:Eu2+ had
shown that the Eu d-block bands lie just below the conduction band bottom [76].
3.3.3 The Aitasalo model
The phosphorescence mechanism of Aitasalo et al. proposed in 2003 for
CaAl2O4:Eu2+,Nd3+ differed considerably from the Matsuzawa model [68]. The
mechanism (Fig. 3.2) is based on the realization that the formation of the highly unstable
species Eu+* under UV or visible irradiation is highly unlikely. The reduction of Eu3+ into
Eu2+ in oxides already requires a high energy (~3.7 eV), and the further reduction of Eu2+
should require a much higher energy [3]. To retain the hole trapping process suggested
from the photoconductivity experiments, Aitasalo et al. assumed the occurrence of
energy transfer to Eu2+ and proposed that the UV excitation promotes an electron from
the valence band to a discrete level of unknown origin, while the hole created in the
valence band is trapped by an alkaline earth vacancy level VCa. Then, Aitasalo et al.

71
assumed that the thermal energy allows the transfer of the electron from the discrete level
of unknown origin to an oxygen vacancy level VO, from which a recombination takes
Figure 3.2: Phosphorescence mechanism proposed by Aitasalo et al. for CaAl2O4: Eu2+,Nd3+ [68].
place toward the VCa level. The energy released is then transferred to an Eu2+ ion, which
is excited and then is de-excited instantaneously. However, EPR measurements of
SrAl2O4:Eu2+,Dy3+, which showed that the concentration of Eu2+ decreases during the UV
excitation and increases when the excitation is stopped until the extinction of
phosphorescence [43], seem to contradict this assertion. This observation indicates that
Eu2+ ions participate in the trapping process and, hence, do not support the idea of energy
transfer to Eu2+ after the trapping, as suggested by Aitasalo et al. In this mechanism, Nd3+
co-doping is considered to serve the role of increasing the number of cation vacancies.
3.3.4 The Dorenbos model
The Dorenbos mechanism is basically the same as the Matsuzawa model but it
does not require the existence of Eu+ and RE4+(RE = tetravalent rare earth ions). Hence, it
is in agreement with the Aitasalo model with regard to the improbable existence of Eu+
and Dy4+ ions (in aluminate and silicate compounds) [68]. Dorenbos pointed out that the
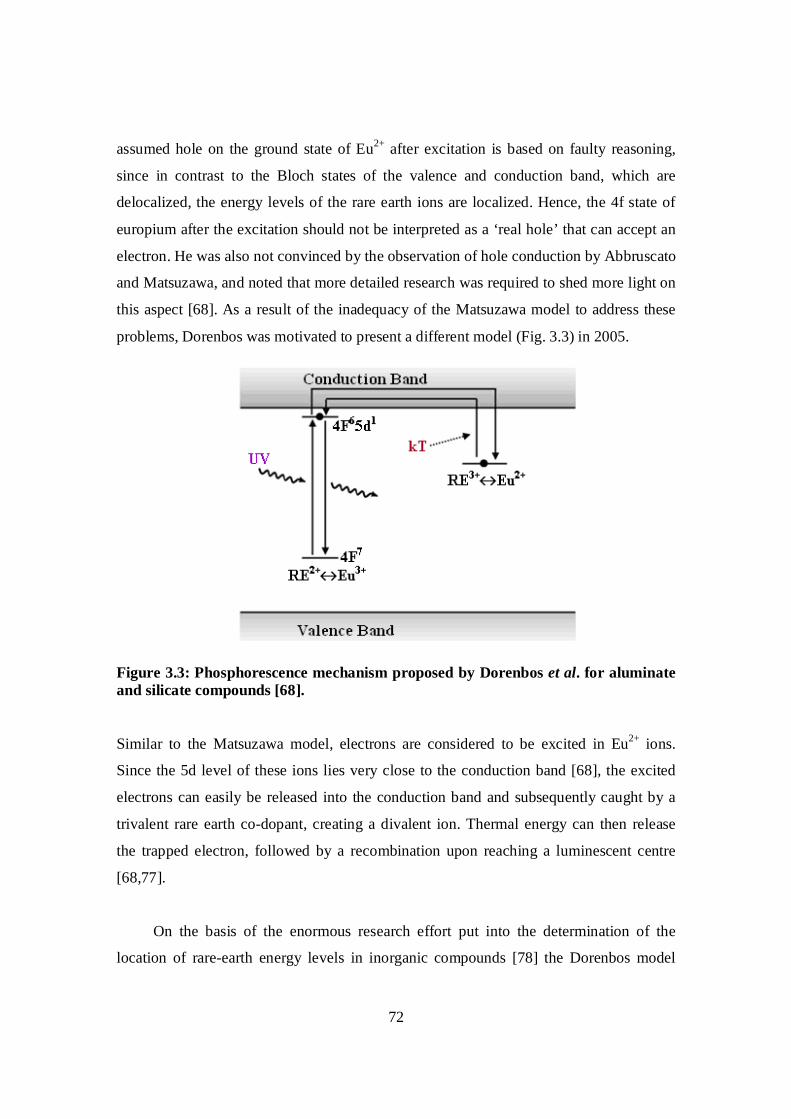
72
assumed hole on the ground state of Eu2+ after excitation is based on faulty reasoning,
since in contrast to the Bloch states of the valence and conduction band, which are
delocalized, the energy levels of the rare earth ions are localized. Hence, the 4f state of
europium after the excitation should not be interpreted as a ‘real hole’ that can accept an
electron. He was also not convinced by the observation of hole conduction by Abbruscato
and Matsuzawa, and noted that more detailed research was required to shed more light on
this aspect [68]. As a result of the inadequacy of the Matsuzawa model to address these
problems, Dorenbos was motivated to present a different model (Fig. 3.3) in 2005.
Figure 3.3: Phosphorescence mechanism proposed by Dorenbos et al. for aluminate and silicate compounds [68]. Similar to the Matsuzawa model, electrons are considered to be excited in Eu2+ ions.
Since the 5d level of these ions lies very close to the conduction band [68], the excited
electrons can easily be released into the conduction band and subsequently caught by a
trivalent rare earth co-dopant, creating a divalent ion. Thermal energy can then release
the trapped electron, followed by a recombination upon reaching a luminescent centre
[68,77].
On the basis of the enormous research effort put into the determination of the
location of rare-earth energy levels in inorganic compounds [78] the Dorenbos model

73
could be used to make two significant explanations: (1) His infererence that the energy
level of Dy2+ (i.e., Dy3+ after capture of an electron) in SrAl2O4 lies approximately 0.9 eV
below the conduction band [68]. This value is of the same order as the trap depth found in
SrAl2O4:Eu2+,Dy3+ [24,72,79]. (2) The model can be used to explain why Sm3+ and Yb3+
ions strongly reduce the afterglow. Previous work by Dorenbos had revealed that the
relevant levels of Sm2+ and Yb2+ are located much lower than those of the other divalent
rare-earth ions such as Dy2+ and Nd2+ [80]. Hence, the resulting traps are too deep to be
emptied at room temperature. The existence of intrinsic persistent luminescence in non-
codoped materials can however not be explained by this model.
3.3.5 The Clabau model
The model by Clabau et al. is probably one of the most comprehensive
mechanisms proposed for the persistence luminescence phenomenon in rare-earth-doped
aluminate phosphors. Fig. 3.4 depicts the schematic illustration of the mechanism, which
Figure 3.4: Phosphorescence mechanism proposed by Clabau et al. for SrAl2O4: Eu2+,Dy3+,B3+ [67].

74
was proposed for SrAl2O4:Eu2+,Dy3+,B3+. Its deduction was based on three facts: (1) The d
orbitals of Eu2+ are located near the conduction band bottom of the host SrAl2O4. (2) The
Eu2+ concentration decreases under UV excitation. (3) The phosphor samples always
have a small quantity of remnant Eu3+ ions because it is impossible to reduce all Eu3+
ions into Eu2+ ions under the synthetic conditions employed [67].
The model proposes that under UV irradiation electrons are promoted from the
occupied 4f levels of Eu2+ to the empty 5d levels and from the valence band top to the
unoccupied 4f levels of residual Eu3+ (i.e., charge transfer). The electrons promoted to the
5d levels can be trapped at the VO defects located in the vicinity of the photogenerated
Eu3+ cations while the holes created in the valence band can be trapped either at the VSr
or VAl levels. Due to these trapping processes, Eu2+ is oxidized to Eu3+, while residual
Eu3+ is reduced to Eu2+. The thermal energy at ambient temperature causes the detrapping
of the trapped electrons directly to the 5d levels of Eu3+, hence leading to the 4f65d14f7
green phosphorescence. The 450 nm blue emission, observed only at low temperatures
(below 150 K), is attributed to the charge transfer from the fundamental level of the 4f7
configuration of Eu2+ to the valence band and is associated with a hole de-trapping
mechanism [67]. This model is similar to the Dorenbos model, but differs on some
important points. The first difference arises from the assertion that there is no migration
of electrons through the conduction band. The transport of electrons between the traps
and the luminescent centres is believed to occur through direct transfer, which requires
close proximity between the europium ions and the lattice defects [67]. Clabau et al.
arrived at this conclusion on the basis of analysis of results from measurements of the
temperature-dependence of photoconductivity as well as thermoluminescence (TL),
which indicate that detrapped electrons do not migrate in the conduction band. This
observation is reinforced by results of their evolution of TL curves of the alkaline-earth
aluminate (AAl2O4) series (A = Ca, Sr, Ba), which suggest that electron detrapping, from
the oxygen vacancy levels, occurs towards the 5d orbitals of Eu2+ rather than to the
conduction band [67].

75
The second difference is based on the nature of the traps. By comparing glow
curves of nonco-doped and Dy3+-co-doped SrAl2O4:Eu2+, Clabau et al. noticed that the
relevant peaks differed in size and location, but were very similar in shape. From this,
they concluded that the chemical nature of the trap was not influenced under co-doping.
This led them to the idea that lattice defects, namely oxygen vacancies, must act as traps
in SrAl2O4:Eu2+,RE3+ [81]. The influence of the rare-earth ions as co-dopants is explained
by their stabilizing influence on the oxygen vacancies. The ionization potentials of the
rare-earths can be used as a measure of the extent of this stabilization, since a lower
ionization potential will cause the codopant to attract oxygen vacancies more strongly,
thereby increasing the trap depth [82]. It has actually been observed that when
SrAl2O4:Eu2+ is co-doped with different rare earth ions, with an increasing ionization
potential, the duration of the afterglow is shortened [67].
3.3.6 Revised models
The 2005 model by Clabau et al. attributed the two observed Eu2+ emissions to the Eu2+
ions occupying the two Sr2+ sites in the SrAl2O4 lattice. This assertion was challenged by
Ngaruiya et al. [83] on account of the chemical indistinguishability of the two sites as
well as their similarity in abundance. In 2008, they postulated the preferential alignment
Figure 3.5: Clabau’s et. al. [67] phosphorescence mechanism as modified by Ngaruiya et al. [83]
Conduction Band
4f (Eu3+) 4f (Eu2+)
Sr-Vacancy
O-Vacancy kT
kT
430 nm
510 nm
570 nm
UV
Non-radiative decay
Valence Band
UV
5d (Eu2+)

76
of one of the 5d-orbitals of the Eu2+ ion to modify the Clabau et al. model (Fig. 3.5). The
crux of the revision is on alignment as one of the factors that influence Eu2+ emissions.
Ba and Sr ions are reported to form linear chains in the lattices of BaAl2O4 and SrAl2O4
[84]. An Eu2+ ion in these chains experiences, in addition to the negative charges of the
nearest anion neighbours, positive charges due to cation neighbours in the chain
direction. The positive charges can orient one d-orbital preferentially, thereby lowering
its energy and therefore result in Eu2+ emitting at longer wavelengths [83].
Figure 3.6: Phosphorescence mechanism proposed in 2006 by Aitasalo et al. for CaAl2O4:Eu2+,Dy3+ [57].
Fig. 3.6 shows the model by Aitasalo et al. [57], which was developed in 2006 by
incorporating ideas from both the Dorenbos and Clabau models. In the new mechanism,
electrons that are excited in the Eu2+ luminescent centres can easily escape into the
conduction band. Both oxygen vacancies and trivalent codopant ions introduce trap
levels. The captured electrons can escape again into the conduction band and recombine
in a luminescent centre when enough thermal energy is made available. However, the
exact nature of the traps was not clarified from the reasoning that the defects involved
can interact with each other and form complex aggregates [57].
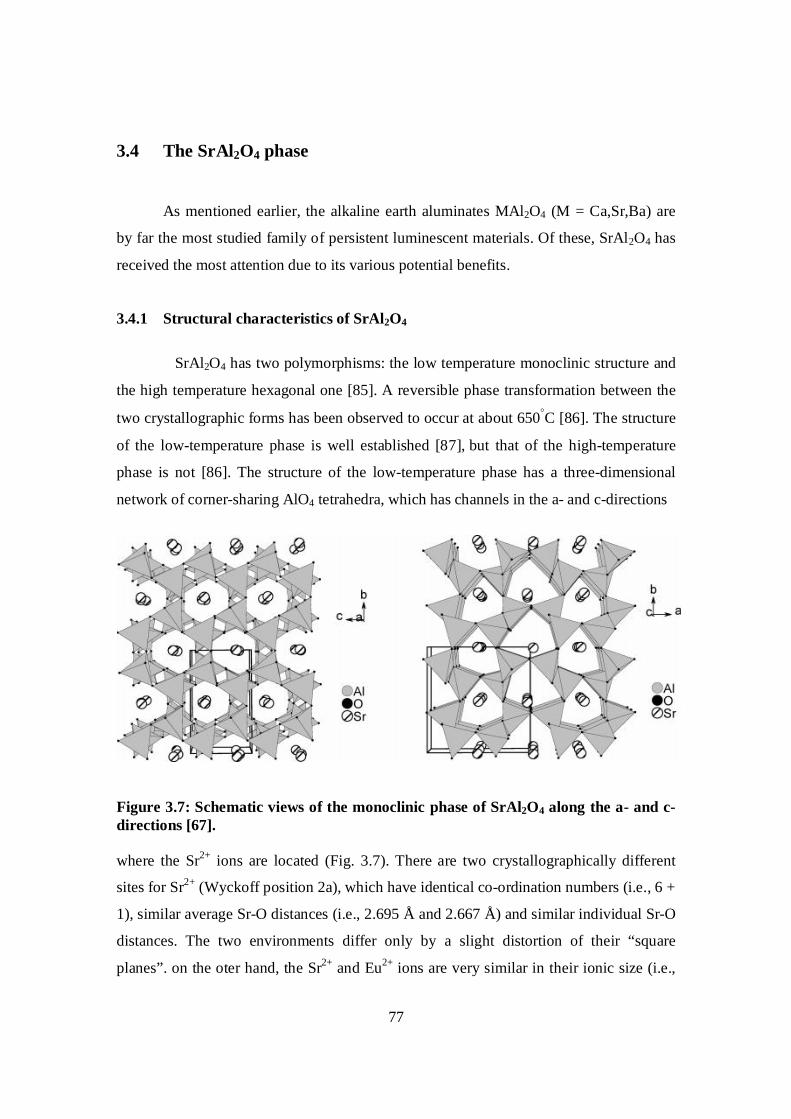
77
3.4 The SrAl2O4 phase
As mentioned earlier, the alkaline earth aluminates MAl2O4 (M = Ca,Sr,Ba) are
by far the most studied family of persistent luminescent materials. Of these, SrAl2O4 has
received the most attention due to its various potential benefits.
3.4.1 Structural characteristics of SrAl2O4
SrAl2O4 has two polymorphisms: the low temperature monoclinic structure and
the high temperature hexagonal one [85]. A reversible phase transformation between the
two crystallographic forms has been observed to occur at about 650C [86]. The structure
of the low-temperature phase is well established [87], but that of the high-temperature
phase is not [86]. The structure of the low-temperature phase has a three-dimensional
network of corner-sharing AlO4 tetrahedra, which has channels in the a- and c-directions
Figure 3.7: Schematic views of the monoclinic phase of SrAl2O4 along the a- and c-directions [67]. where the Sr2+ ions are located (Fig. 3.7). There are two crystallographically different
sites for Sr2+ (Wyckoff position 2a), which have identical co-ordination numbers (i.e., 6 +
1), similar average Sr-O distances (i.e., 2.695 Å and 2.667 Å) and similar individual Sr-O
distances. The two environments differ only by a slight distortion of their “square
planes”. on the oter hand, the Sr2+ and Eu2+ ions are very similar in their ionic size (i.e.,

78
1.21 and 1.20 Å, respectively). Consequently, when occupied by Eu2+ ions, the two
different Sr2+ sites will have a quite similar local distortion, so that the Eu2+ ions located
at the two different Sr2+ sites will have very similar local environments. The
phosphorescence in the monoclinic phase of the SrAl2O4:Eu2+ phosphor has been
observed when prepared in the form of a thin layer [88] or a crystal [89,90], by solid-state
reactions (at 1300 C during few hours) [24], a sol-gel route (at 1150 C) [38], a
microwave route [90], and a combustion method [91]. Europium is usually introduced in
the reaction mixture in its oxidized state Eu3+ (Eu2O3), and phosphorescence appears only
after a reducing treatment (in situ or afterwards) [92]. Luminescence measurements show
that after this reducing treatment, europium is mainly present in the reduced form Eu2+
[24], but Mossbauer measurements have shown that there remains roughly 5 to 10% of
Eu3+ [76].
3.4.2 Dopant and co-dopant sites
The sites of the dopants and co-dopants of SrAl2O4 are dictated by their ionic
radii. The Eu2+ (1.20 Å), Eu3+ (1.01 Å), and Dy3+ (0.97 Å) ions can readily occupy the
Sr2+ (1.21 Å) ion sites, as confirmed by EPR measurements [93]. The two
crystallographically different Sr2+ sites are very similar, so it is expected that the
luminescent ions (Eu2+) are present at both sites. This expectation is corroborated by EPR
measurements [94]. The fact that Sr2+ and Eu2+ ions have very close ionic radii explains
why Eu3+ ions introduced in the Sr2+ sites of SrAl2O4 are easily reduced to Eu2+ [92].
3.4.3 Probable vacancies
The formation of the by-product Sr3Al2O6 during the synthesis of SrAl2O4 [92] as
well as the thermoluminescence (TL) measurements carried out for the stoichiometric
and nonstoichiometric samples of SrAl2O4: Eu2+ [69] indicate that SrAl2O4 tends to have
strontium vacancies (VSr), and hence oxygen vacancies (VO) due to the requirement of
charge neutrality. Aluminum vacancies (VAl) might exist as well, but would be
energetically unfavourable to form because the Al-O bonds are short and strong.

79
3.5 References
1. Ronda, C.R. Luminescence from Theory to Applications. Wiley-VCH, Germany,
3, (2008).
2. Feldmann, C. Justel, T. Ronda, C.R. Schmidt, P.J. Functional Materials. 13(7):
WILEY-VCH, Verlag GmbH & Co KGaA, Weinheim, (2003)
3. Blasse, G. Grabmaier, B.C. Luminescent Materials. Springer, Berlin, (1994).
4. Folkerts, H.F. Blasse, G. Chem. Mater., 6(7): 969, (1994).
5. Oomen, E.W.J.L. Dirksen, G.J. Smit, W.M.A. Blasse, G. J. Phys., C 20(8): 1161,
(1987).
6. Oomen, E.W.J.L. Smit, W.M.A. Blasse, G. Mat. Chem. Phys., 19(4): 357, (1988).
7. Dexter, D.L. Klick, C.C. Russell, G.A. Phys. Rev., 100: 603, (1955).
8. Hamstra, M.A. Folkerts, H.F. Blasse, G.J. Mater. Chem., 4: 1349, (1994).
9. Folkerts, H.F. Ghianni, F. Blasse, G. J. Phys. Chem. Solids., 57: 1659, (1996).
10. Van To1, J. Van der Waals, J.H. Chem. Phys. Lett., 194(4-6)b: 288, (1992).
11. Lin, Y. Tang, Z. Zhang, Z. Wang, X. Zhang, J. J. Mater. Sci. Lett., 20: 1505,
(2001).
12. Ji, H. Xie, G. Lv, Y. Lu, H. J. Sol-Gel Sci. Technol., 44: 133, (2007).
13. Pan, W. Ning, G. Zhang, X. Wang, J. Lin, Y. Ye, J. J. Lumin., 128: 1975, (2008).
14. Song, F. Donghua, C. Yuan, Y. J. Alloy. Compd., 458: 564, (2008).
15. Xu, Y. Chen, D. Ceram. Int., 34: 2117, (2008).
16. Toda, K. Imanari, Y. Nonogawa, T. Miyoshi, J. Uematsu, K. Sato, M. J. Ceram.
Soc. Jpn., 110: 283, (2002).
17. Aitasalo, T. Hölsä, J. Laamanen, T. Lastusaari, M. Lehto, L. Niittykoski, J. Pellé,
F. Ceram.-Silikáty., 49: 58, (2005).
18. Aitasalo, T. Hölsä, J. Kirm, M. Laamanen, T. Lastusaari, M. Niittykoski, J. Raud,
J. Valtonen, R. Radiat. Meas., 42: 644, (2007).

80
19. Blasse, G. Wanmaker, W.L. Ter Vrugt, J.W. Bril, A. Philips Res. Rep., 23: 189,
(1968).
20. Jiang, L. Chang, C. Mao, D. J. Alloy. Compd., 360: 193, (2003).
21. Fei, Q. Chang, C. Mao, D. J. Alloy. Compd., 390: 133, (2005).
22. Jiang, L. Chang, C. Mao, D. Feng, C. Opt. Mater., 27: 51, (2004).
23. Wang, X.J. He, Z.Y. Jia, D. Strek, W. Pazik, R. Hreniak, D. Yen, W.M.
Microelectron. J., 36: 546, (2005).
24. Matsuzawa, T. Aoki, Y. Takeuchi, N. Murayama, Y. J. Electrochem. Soc., 143:
2670, (1996).
25. Chander, H. Haranath, D. Shanker, V. Sharma, P. J. Cryst Growth., 271: 307,
(2004).
26. Lange, H. US patent 3, 294, 699, (1966).
27. Blasse, G. Bril, A. Philips Res. Rep., 23: 201, (1968).
28. Aitasalo, T. Hölsä, J. Jungner, H. Lastusaari, M. Niittykoski, J. Parkkinen, M.
Valtonen, R. Opt. Mater., 26: 113, (2004).
29. Chen, R. Wang, Y. Hu, Y. Hu, Z. Liu, C. J. Lumin., 128: 1180, (2008).
30. Peng, T. Yang, H. Pu, X. Hu, B. Jiang, Z. Yan, C. Mater. Lett., 58: 352, (2004).
31. Qiu, Z. Zhou, Y. Lü, M. A. Zhang, Ma, Q. Acta Mater., 55: 2615, (2007).
32. Zhao, C. Chen, D. Mater. Lett., 61: 3673, (2007).
33. Geng, J. Wu, Z. J. Mater. Synth. Proces., 10: 245, (2002).
34. Jia, W. Yuan, H. Lu, L. Liu, H. Yen, W.M. J. Cryst. Growth., 200: 179, (1999).
35. Aitasalo, T. Hölsä, J. Jungner, H. Lastusaari, M. Niittykoski, J. J. Alloy. Compd.,
341: 76, (2002).
36. Chen, I.C. Chen, T.M. J. Mater. Res., 16: 644, (2001).
37. Peng, T. Huajun, L. Yang, H. Yan, C. Mater. Chem. Phys., 85: 68, (2004).
38. Tang, Z. Zhang, F. Zhang, Z. Huang, C. Lin, Y. J. Eur. Ceram. Soc., 20: 2129,
(2000).
39. Katsumata, T. Nabae, T. Sasajima, K. Komuro, S. Morikawa, T. J. Electrochem.
Soc., 144: L243, (1997).
40. Sakai, R. Katsumata, T. Komuro, S. Morikawa, T. J. Lumin., 85: 149, (1999).
41. Nag, A. Kutty, T.R.N. Mater. Res. Bull., 39: 331, (2004).

81
42. Nag, A. Kutty, T.R.N. J. Alloy. Compd., 354: 221, (2003).
43. Lin, Y. Tang, Z. Zhang, Z. Mater. Lett., 51: 14, (2001).
44. Lin, Y. Tang, Z. Zhang, Z. Nan, C.W. Appl. Phys. Lett., 81: 996, (2002).
45. Suriyamurthy, N. Panigrahi, B.S. J. Lumin., 128: 1809, (2008).
46. Yuan, Z. Chang, C. Mao, D. Ying, W. J. Alloy. Compd., 377: 268, (2004).
47. Akiyama, M. Xu, C. Nonaka, K. Watanabe, T. Appl. Phys. Lett., 73: 3046,
(1998).
48. Chang, C. Li, W. Huang, X. Wang, Z. Chen, X. Qian, X. Guo, R. Ding, Y. Mao,
D. J. Lumin., 130: 347, (2010).
49. Zhang, P. Xu, M. Zheng, Z. Sun, B. Zhang, Y. Mater. Sci. Eng. B Solid State
Mater. Adv. Technol., 136: 159, (2007).
50. Zhang, P. Li, L. Xu, M. Liu, L. J. Alloy. Compd., 456: 216, (2008).
51. Lenard, P., Schmidt, F., and Tomascheck, R. Handb. Exp. Phys., 23, Akadem.
Verlagsges, Leipzig, (1928).
52. Shionoya, S. Phosphor Handbook, Yen, W.M. Shionoya, S. Yamamoto, H.
(Eds.), CRC Press, Boca Raton, Chap.3, (2007).
53. Dorenbos, P. J. Lumin., 104: 239, (2003).
54. Jia, D. Zhu, J. Wu, B. J. Lum., 91: 59, (2000).
55. Jia, D. Jia, W. Evans, D.R. Dennis, W.M. Liu, H. Zhu, J. Yen, W.M. J. Appl.
Phys., 88: 3402, (2000).
56. Jia, D. Zhu, J. Wu, B. J. Electrochem. Soc., 147: 386–389, (2000).
57. Jia, D. J. Electrochem. Soc., 153: H198, (2006).
58. Jia, W. Jia, D. In: Phosphor Handbook, Yen, W.M. Shionoya, S. Yamamoto, H.
(Eds.), CRC Press, Boca Raton, Chap.4, (2007).
59. Pang, R. Li, C. Shi, L. Su, Q. J. Phys. Chem. Solids., 70: 303, (2009).
60. Pang, R. Li, C. Zhang, S. Su, Q. Mater. Chem. Phys., 113: 215, (2009).
61. Hao, Z. Zhang, J. Zhang, X. Sun, X. Luo, Y. Lu, S. Wang, X. Appl. Phys. Lett.,
90: 261113, (2007).
62. Shionoya, S. Yen, W. Phosphor Handbook; CRC Press: New York, (1999).
63. Harvey, E. N. Amer. Phil. Soc., Philadelphia, 18, (1957).

82
64. Murayama, Y. Phosphor Handbook, Shionoya, Y. Yen, Y. (Eds.), CRC Press,
Boca Raton (1999).
65. Holsa, J. The Electrochemical Society Interface., 42, (2009).
66. Eeckhout, K.V.D. Smet, P.F. Poelman, D. Mater., 3: 2536, (2010)
67. Clabau, F. Rocquefelte, X. Jobic, S. Deniard, P. Whangbo, M.H. Garcia, A. Le
Mercier, T. Chem. Mat., 17, 3904, (2005).
68. Dorenbos, P. J. Electrochem. Soc., 152, H107, (2005).
69. Abbruscato, V. J. Electrochem. Soc., 118: 930, (1971).
70. Yuan, H.B. Jia, W. Basun, S.A. Lu, L. Meltzer, R.S. Yen, W.M. J. Electrochem.
Soc., 147: 3154, (2000).
71. Lin, Y. Zhang, Z. Tang, Z. Wang, X. Zhang, J. Zheng, Z.J. Eur. Ceram. Soc., 21:
683, (2001).
72. Nakazawa, E. Mochida, T. J. Lumin., 72–74: 236, (1997).
73. Kato, K. Tsutai, I. Kamimura, T. Kaneko, F. Shinbo, K. Ohta, M. Kawakami, T.
J. Lumin., 82: 213, (1999).
74. Yamamoto, H. Matsuzawa, T. J. Lumin., 72–74: 287, (1997).
75. Nakamura, T. Kaiya, K. Takahashi, N. Matsuzawa, T. Ohta, M. Rowlands, C.C.
Smith, G.M. Riedi, P.C. Phys. Chem. Chem. Phys., 3: 1721, (2001).
76. Clabau, F. Thesis. Universite´ de Nantes, Nantes, France, (2005).
77. Dorenbos, P. Phys. Status Solidi B-Basic Solid State Phys., 242: R7, (2005).
78. Dorenbos, P. J. Lumin., 108: 3015, (2004).
79. Aitasalo, T. Hölsä, J. Jungner, H. Krupa, J.C. Lastusaari, M. Legendziewicz, J.
Niittykoski, J. Radiat. Meas., 38: 727, (2004).
80. Dorenbos, P. J. Phys.-Condens. Matter., 15: 8417, (2003).
81. Clabau, F. Rocquefelte, X. Jobic, S. Deniard, P. Whangbo, M.H. Garcia, A. Le
Mercier, T. Solid State Sci., 9: 608, (2007).
82. Clabau, F. Rocquefelte, X. Le Mercier, T. Deniard, P. Jobic, S. Whangbo, M.H.
Chem. Mater., 18: 3212, (2006).
83. Ngaruiya, J.M. Nieuwoudt, S. Ntwaeaborwa, O.M. Terblans, J.J. Swart, H.C.
Mater. Lett., 62: 3192, (2008).

83
84. Poort, S.H.M. Reijnhoudt, H.M. Van der Kuip, H.O.T. Blasse, G. J. Alloys
Compd., 241: 75, (1996).
85. Lee, J.S. Kim, Y.J. Thin Solid Films., 518: 149, (2010)
86. Jia, W. Yuan, H. Lu, L. Liu, H. Yen, W.M. J. Lumin., 76-77: 424, (1998).
87. Schulze, A. Mueller-Buschbaum, H.Z. Anorg. Allg. Chem., 475: 205, (1981).
88. Kato, K. Tsutai, I. Kamimura, T. Kaneko, F. Shinbo, K. Ohta, M. Kawakami, T.
J. Lumin., 82(3): 213, (1999).
89. Katsumata, T. Nabae, T. Sasajima, K. Matsuzawa, T. J. Cryst. Growth, 183: 361,
(1998).
90. Geng, J. Wu, Z. J. Mater. Synth. Proc., 10: 245, (2002).
91. Peng, T. Yang, H. Pu, X. Hu, B. Jiang, Z. Yan, C. Mater. Lett., 58: 352, (2004).
92. Beauger, C. Thesis. University of Nice, Nice, France, (1999).
93. Nakamura, T. Kaiya, K. Takahashi, T. Matsuzawa, T. Ohta, M. Rowlands, C.
Smith, G. Riedi, P. Chem. Phys., 3: 1721, (2001).
94. Kaiya, K. Takahashi, N. Nakamura, T. Matsuzawa, T. Smith, G. Riedi, P. J.
Lumin., 87-89: 1073, (2000).

84
Chapter 4
Characterization and Synthesis Techniques
4.1 Introduction
The key material parameters required to understand, control, and correlate
material properties with optical performance include the average particle diameter and
particle-size distribution, crystallinity and material shape or morphology. Characterizing
particle or feature size for nanocrystals and nanostructures is done routinely using
scanning transmission electron microscopy (STEM), high-resolution transmission
electron microscopy (HRTEM), scanning electron microscopy (SEM), scanning
tunneling microscopy (STM), and atomic force microscopy (AFM) [1]. TEM methods
usually require dispersion of the particles, but, of all the microscopy methods listed here,
HRTEM can provide the best spatial resolution of better than 0.2 nm [2]. Furthermore,
the high resolution imaging can identify defects and surface structures. An important
aspect of the direct imaging methods is that they will reveal the shapes of nanomaterials,
which can affect the optical characteristics of many types of materials [3]. AFM is being
used more frequently, although preparing atomically thin AFM tips to image particles or
features less than 10 nm can be very difficult. AFM has the potential to provide spatially
resolved chemical information [4]. The main advantage of SEM, STM, and AFM
methods is that they can be used to study the morphology of as-prepared nanoparticles
and nanocomposites. Direct size measurements obtained from images are often used in
conjunction with other measurements such as powder x-ray diffraction (XRD).

85
For a complete picture of the crystal phase, average particle diameter, particle-
size distribution and the morphology of the samples, it is necessary to combine
diffraction and imaging characterization tools. Crystal phase confirmation and purity can
be obtained by using powder XRD [5] and selected-area electron diffraction (SAED).
SAED can analyze single nanoparticles that are 10 nm and larger [6]. Similarly, using
electron diffraction patterns in TEM or the interference fringes in HRTEM images can
also confirm the crystal phase of individual nanoparticles. In some cases, it is possible to
correlate the phase and structural information obtained from microscopy and diffraction
measurements with the optical properties [7].
The complete characterization of a whole material requires elemental analysis,
which is often performed in an electron microscope using energy-dispersive x-ray
spectrometry (EDXS) or by surface analytical techniques such as x-ray fluorescence,
Auger electron spectroscopy (AES), and x-ray photoelectron spectroscopy (XPS). XPS,
extended x-ray absorption fine structure (EXAFS), and electron energy loss spectroscopy
(EELS) can provide further details about the surface chemistry, structure, and local
environment [8]. Elemental and qualitative analytical techniques are also necessary to
identify intentional adsorbates or unintentional contaminants on a particle surface.
Molecular spectroscopy such as Raman spectroscopy and Fourier transform infrared
(FTIR) spectroscopy can characterize materials and help identify any surface
contaminants or intentional capping agents.
Luminescence is an appropriate tool for characterizing the structures and
performance of phosphors due to the strong optical emission of these materials. Optical
spectroscopy can provide a sensitive measure of particle size, size distribution, and
particle shapes for quantum dots and metals. Complementary information for
characterizing multiple phases, defects, quenching, and environmental effects can be
obtained from lifetime measurements [9]. Luminescence spectra, lifetimes, and quantum-
efficiency measurements can be made with laboratory-scale spectrometers utilizing
optical photons, electrons or x-rays, as excitation sources. However, detailed studies
using vacuum-UV excitation may require sophisticated excitation sources. Optical
86
spectroscopic measurements are quite important to determine colour purity and quantum
efficiency of phosphor materials.
In the case of inorganic/organic composites, the range of characterization methods
used in the analysis of the composition, the molecular and nanometre structure as well as
the physical properties of these materials is quite large. Many of the methods are specific
for particular material compositions [10]. Compared with classical inorganic materials,
hybrids are often amorphous so well-established characterization techniques such as x-
ray diffraction are limited. Many methods used are more related to the characterization of
amorphous organic polymers. The heterogeneous nature of these materials means that
generally a variety of analytical techniques has to be used to get a satisfactory answer to
structure– property relationships.
4.2 Scanning electron microscopy (SEM) and energy dispersive x-ray
spectroscopy (EDXS)
Scanning electron microscopy is an imaging technique, which is capable of
producing high resolution images of a sample surface. SEM images have a characteristic
three-dimensional appearance and are useful for judging the surface structure of a sample
[11]. Electron microscopy became one of the most important techniques to characterize
the materials morphology on the nanometre and nowadays even on the atomic scale [12].
Electron microscopy takes advantage of the wave nature of rapidly moving electrons. In
the microscope, a beam of electrons is generated in a vacuum. The beam is collimated by
electromagnetic condenser lenses, focused by an objective lens, and then scanned across
the surface of the sample by electromagnetic deflection coils. The primary imaging
method is by collecting secondary electrons that are released by the sample. The electrons
are detected by a scintillation material that produces flashes of light from the electrons.
The light flashes are then detected and amplified by a photomultiplier tube. By
correlating the sample scan position with the resulting signal, an image can be formed
that is strikingly similar to what would be seen through an optical microscope [13].

87
Beside the emitted electrons, x-rays are also produced by the interaction of
electrons with the sample. These x-rays are characteristic of the elements present in the
sample and can be detected in a scanning electron microscope coupled with an x-ray
analyzer such as the energy dispersive x-ray spectrometer (EDXS) [14]. Different
Figure 4.1: The SEM equipment coupled with EDS: SHIMADZU Superscan model SSX-550
detection modes can be applied such as the detection of backscattered electrons or the
electron backscatter diffraction (EBSD) which gives crystallographic information about
the sample. SEM is very versatile in having many other imaging modes available that
provide specialized information. However, in the analysis of SEM micrographs, one has
to be aware of some limiting aspects such as [13]:
All specimens are in high vacuum and probably have another shape in a liquid or
gel-like surrounding.
The images reveal only a small fragment of the whole sample raising the
possibility that the region analyzed may not be characteristic of the whole sample.
The high energy electron beam incident on the sample may probably change it.

88
In general electron microscopy results should always be confirmed by other
techniques.
In this study, the surface morphology and elemental composition of the phosphor
powders were investigated using a Shimadzu Superscan SSX-550 electron microscope
(SEM) coupled with an energy dispersive x-ray spectroscope (EDS). For SEM
measurements, the probe size was 3.0 nm, the probe current 0.02 nA, and the accelerating
voltage 5.0 keV. The probe size for EDS analysis was 4 nm, specimen current 1.00 nA,
and accelerating voltage 15.0 keV. The set up used in this work is shown in Fig. 4.1.
4.3 X-ray diffractometry (XRD)
The object of x-ray diffractometry is in two main areas; fingerprint
characterization, and the determination of structural properties of crystalline materials.
Hence, this technique, which is nondestructive, is suitable for identifying major
constituents of a mixture and is also an effective tool for determining the phase,
Figure 4.2: The X-ray diffractometer used in this study is a Bruker AXS Discover diffractometer

89
crystallinity, and purity of samples prepared under various conditions. It has a detection
limit of 5 percent [15].
When the positions and intensities of the diffraction pattern of a sample are taken
into account, the pattern is unique for a single substance. The x-ray pattern is like a
fingerprint and mixtures of different crystallographic phases can be easily distinguished
by comparison with reference data. Usually electronic databases such as the International
Centre for Diffraction Data (ICDD) are employed for this comparison. The major
information one gets from this method is the crystalline composition and the phase purity.
In the case of semicrystalline or amorphous materials, broad humps are observed in the
diffractogram. Therefore the degree of crystallinity can be qualitatively estimated. If the
crystallites of the powder are very small the peaks of the pattern will be broadened. From
this broadening it is possible to determine an average crystallite size by the Debye–
Scherrer equation,
20
2cos
kd (3.1)
where d denotes the average size of the crystallites, k is a factor which is usually set to
0.9, θ is the Bragg angle, β is the broadening of the diffraction line measured at half of its
maximum intensity (radians), β0 represents the scan aperture of the diffractometer, and λ
is the x-ray radiation wavelength. An error for the crystallite size by this formula can be
up to 50% [15]. The system employed in this study (Fig. 4.2) is a Bruker D8 (Bruker
Corporation of Germany) x-ray diffractometer in which the source of the x-ray radiation
is CuK with a wavelength of 1.5406 Ǻ and was operating at 40 kV and 40 mA, with a
scan step of 0.02° in 2 and a scan speed of 4°/min. The divergence slit (DS) was set
equal to the scatter slit (SS) at a value of 1°, while the receiving slit (RS) was 0.15 mm.
4.4 Transmission electron microscopy (TEM)
Transmission electron microscopy is an imaging technique in which a beam of
electrons is focused onto a specimen causing an enlarged image to either appear on a

90
fluorescent screen or layer of photographic film, or to be detected by a CCD camera [16].
Fig. 4.3 shows the basic construction of a transmission electron microscope as well as a
photograph of the system employed in this work.
The source radiation is generated using an electron gun and the resulting beam of
electrons is focused into a tight, coherent beam by multiple electromagnetic lenses and
apertures. The lens system is designed to eliminate the loss of electrons as well as to
control and focus the electron beam. The corrected beam is then focused onto the
Figure 4.3(a): Schematic diagram of a transmission electron microscope [18]

91
sample. The beam has enough energy for the electrons to be transmitted through the
sample. The transmitted electron signal is greatly magnified by a series of
electromagnetic lenses. The magnified transmitted signal may be observed in either an
electron diffraction mode or direct imaging mode. Data is accumulated from the beam
after it passes through the sample. The electron diffraction mode is employed for
crystalline structure analysis, while the image mode is used for investigating the
microstructure, e.g. the grain size and lattice defects [17]. A modern high-resolution TEM
goes down to a resolution <100 pm.
Figure 4.3(b): JEOL JEM-2100 model transmission electron microscope
While the ability to get atomic-scale resolutions from transmission electron
microscopy is of great advantage, TEM is a relatively expensive equipment. It requires
extensive sample preparation, which makes it a relatively time-consuming technique with
a low throughput of samples.

92
The TEM results in this project were obtained using a JEOL JEM-2100
transmission electron microscope operating at 200 kV. The system is available at the
Council for Scientific and Industrial Research (CSIR), nanomaterials laboratory. Sample
preparation involved suspending particles in ethanol by ultrasonification and drying a
drop of the suspension on a carbon-coated copper grid.
4.5 Photoluminescence spectroscopy (PL)
The luminescence properties of a phosphor can be characterized by its emission
spectrum, brightness, and decay time [19]. Additional information pertaining to both the
basic luminescence mechanisms and their practical application can be obtained from the
absorption and reflectance spectra.
The photoluminescence technique is a nondestructive and contactless
spectroscopic method of probing the electronic structures of materials [20]. The
excitation energy and intensity are chosen to probe different regions and excitation
Figure 4.4: Typical experimental set up for PL measurements [21]

93
concentrations in the sample. The light emitted in PL can be collected and analyzed to
yield a wealth of information about the photoexcited material. The PL spectrum provides
the transition energies, which can be used to determine the electronic energy levels [20].
The spectrum is obtained using a monochromator equipped with an appropriate light
detector. A typical PL set-up is shown in Fig. 4.4. A detailed description of its operation
can be found elsewhere [21].
The PL intensity and spectral content is a measure of various important material
properties such as chemical composition, structure, impurities, kinetic processes and
energy transfer [21]. Variation of the PL intensity with external parameters like
Figure 4.5(a): The He-Cd laser equipment
temperature and applied voltage can be used to characterize further the underlying
electronic states and bands [19]. Additionally, one of the characteristics of PL is that it
has a unique sensitivity to discrete electronic states. Since many of these states lie near
surfaces and interfaces, PL becomes an important tool for obtaining detailed information
about the nature of the states. When the states serve as long-lived traps, the depth of the

94
traps can be determined by observing thermal activation in temperature-dependent PL
[20].
Compared with other optical methods of characterization like reflection and
absorption, the PL technique has various advantages: It is simple, versatile,
nondestructive and the measurement does not rely on electrical excitation or detection, so
Figure 4.5(b): The Cary Eclipse fluorescence spectrophotometer system
that sample preparation is minimal. PL can be used to study virtually any surface in any
environment. The main drawback of PL analysis is that the sample under investigation
must emit light and the difficulty in estimating the density of interface and impurity states
constitutes another shortcoming [20].
In this study, two systems were employed for PL characterization; a SPEX 1870
0.5m spectrometer system, equipped with a He–Cd laser lamp as the excitation source
and a Cary Eclipse fluorescence spectrophotometer (Model: LS 55). Samples for the laser
system were excited at 325 nm and emission observed in the wavelength range 400 to

95
600 nm at room temperature. The Cary Eclipse spectrophotometer is equipped with a 150
W monochromatic xenon lamp as the excitation source and a grating to select a suitable
wavelength for excitation. Each sample was loaded into a circular holder and excited with
340 nm radiation from the pulsed xenon lamp. The emission spectra were scanned in the
range of wavelengths from 360 to 750 nm. To measure the excitation spectra, the
analyzer monochromator was set to the maximum wavelength of the emission spectra and
then an excitation monochromator was scanned in the range of 250 to 450 nm. The same
system (Cary Eclipse) was used to investigate the phosphorescence decay curves of the
phosphors in air at room temperature. The two systems are shown in Fig. 4.5.
4.6 Thermal analysis (TA) techniques The term thermal analysis (TA) refers to a variety of analytical experimental
techniques in which a property of a sample is continuously measured as the sample is
programmed through a predetermined temperature profile. Fig. 4.6 shows a schematic of
a TA instrument. Among the most common TA techniques are differential scanning
calorimetry (DSC) and thermal gravimetric analysis (TGA).
Figure 4.6: Typical components of a TA instrument

96
4.6.1 Differential scanning calorimetry (DSC)
Differential scanning calorimetry is a thermoanalytical technique, which measures
the heat flow associated with thermally induced transitions in polymeric materials [22].
The measurement is carried out by comparing the difference in the amount of heat
required to increase the temperature of a sample and a reference, whose heat capacity is
well defined over the range of temperatures to be scanned. The DSC can give
thermodynamic information about properties such as glass transitions, phase changes,
melting, crystallization, product stability, and oxidative stability [23].
The basic principle underlying this technique is that when the sample undergoes a
physical transformation such as a phase transition or thermal decomposition, more or less
heat is required, compared with the reference, to maintain both at the same temperature.
Whether more or less heat must flow to the sample depends on whether the process is
exothermic or endothermic. An exothermic or endothermic event in the sample results in
a deviation between the two heat flows and results in a peak in the DSC curve (plot of
heat flow against temperature/time). The difference in heat flow between the sample and
reference also delivers the quantitative amount of energy absorbed or released during
such transitions. The experiments can be carried out under oxygen and other atmospheres
such as an inert gas [24]. Two widely used DSC designs are the quantitative DTA (Heat-
Flux DSC) and the power compensation DSC.
4.6.1.1 Quantitative DTA (Heat-Flux DSC)
The term heat-flux differential scanning calorimeter is widely used by
manufacturers to describe commercial quantitative DTA instruments [25]. In quantitative
DTA, the temperature difference between the sample and reference is measured as a
function of temperature or time, under controlled temperature conditions. The
temperature difference is proportional to the change in the heat flux (energy input per unit
time). The structure of a quantitative DTA system is shown in Figure 4.7(a). The
conformation of the sample holder assembly is different from that in a classical DTA set-

97
up. The thermocouples are attached to the base of the sample and reference holders. A
second series of thermocouples measures the temperature of the furnace and of the heat-
sensitive plate. During a phase change heat is absorbed or emitted by the sample, altering
the heat flux through the heat-sensitive plate. The variation in heat flux causes an
incremental temperature difference to be measured between the heat-sensitive plate and
the furnace. The heat capacity of the heat-sensitive plate as a function of temperature is
measured by adiabatic calorimetry during the manufacturing process allowing an estimate
Figure 4.7(a): The structure of a quantitative DTA system [Seiko Instruments
design] [25]
Figure 4.7(b): Schematic of a heat-flux DSC Cell [18]
T

98
of the enthalpy of transition to be made from the incremental temperature fluctuation.
The sample and reference materials are placed in sample vessels and inserted into the
sample and reference holders. For optimum performance of a quantitative DTA system
the sample should weigh less than 10 mg, be as flat and thin as possible and be evenly
placed on the base of the sample vessel. The maximum sensitivity of a quantitative DTA
instrument is typically 35 µW [25]. In the most popular design, two separate pans sit on a
pair of identically positioned platforms connected to a furnace by a common heat flow
path (Fig. 4. 7a). A sample is placed in one of the pans while the other one is left empty
and serves as a reference. The instrument furnace, which is computer-operated, is
switched on and in turn heats the two pans at a specific rate, usually anywhere between 5-
20 oC per minute. The instrument makes absolutely sure that the heating rate stays
exactly the same throughout the experiment. But more importantly, it makes sure that the
two pans are heated at the same rate so that both are maintained at nearly the same
temperature.
4.6.1.2 Power compensation differential scanning calorimetry (DSC) The structure of a power compensation-type DSC instrument is shown in Fig.
4.7(b). Its operating principle is different from that of DTA systems. The base of the
sample holder assembly is placed in a reservoir of a coolant. The sample and reference
Figure 4.7(c): Schematic diagram of power compensation DSC system [25]

99
holders are individually equipped with a resistance sensor, which measures the
temperature of the base of the holder, and a resistance heater. If a temperature difference
is detected between the sample and reference, due to a phase change in the sample,
energy is supplied until the temperature difference is less than a threshold value, typically
less than 0.01 K. The energy input per unit time is recorded as a function of temperature
or time. A simplified consideration of the thermal properties of this configuration shows
that the energy input is proportional to the heat capacity of the sample. The maximum
sensitivity of this instrument is 35 µW [25].
The temperature range of a power compensation DSC system is between 110 and
1000 K depending on the model of sample holder assembly chosen. Some units are only
designed to operate above 290 K, whereas others can be used over the entire temperature
range. The heater of a power compensation type DSC instrument is smaller than that of a
quantitative DTA apparatus, so that the temperature response is quicker and higher
Figure 4.7(d): The Perkin-Elmer DSC7 thermal analyzer used in this study
scanning rates can be used. Instruments display scanning rates from 0.3 to 320 K/min on
heating and cooling. The maximum reliable scanning rate is 60 K/min. Isothermal
experiments, annealing (single- and multi-step) and heat capacity measurements can be

100
performed more readily using the power compensation-type instrument. Maintaining the
instrument baseline linearity is a problem at high temperatures or in the sub-ambient
mode. Moisture condensation on the sample holder must be avoided during sub-ambient
operation.
In both DTA and compensation techniques, a plot is made as the temperature
increases. Generally, the temperature program for the DSC analysis is designed such that
the sample holder temperature increases linearly as a function of time. In this work, a
compensation type (Perkin-Elmer DSC 7) differential scanning calorimeter, under
flowing nitrogen, was employed for the DSC analyses. The system was interfaced to a
computer, which was used for calculations by means of the Pyris Software. Calibration of
the system was based on the onset temperatures of melting of indium and zinc standards,
as well as the melting enthalpy of indium. Samples of masses ranging from seven to ten
milligrams were sealed in aluminium pans and heated from 25 to 160 °C at a heating rate
of 10 °C min-1, and immediately cooled at the same rate to 25 °C. For the second scan,
the samples were heated and cooled under the same conditions. Peak temperatures of
melting and crystallization, as well as melting and crystallization enthalpies, were
determined from the second scan. Three measurements, from which average temperature
and enthalpy values were calculated, were performed on each sample.
4.6.2 Thermogravimetric analysis (TGA)
Thermogravimetric analysis is an analytical technique used to determine the
thermal stability and the fraction of volatile components in a material by monitoring the
weight change that occurs as a specimen is heated [26]. The measurement is normally
carried out in air or in an inert atmosphere, such as helium or argon, and the weight is
recorded as a function of increasing temperature. The measurement is occasionally
performed in a lean oxygen atmosphere, of 1 to 5% O2 in N2 or He, to slow down
oxidation. TGA instruments can be divided into two general types: vertical and horizontal
balance. Vertical balance instruments generally have a single specimen pan hanging from
the balance or located above the balance on a sample stem. Calibration of these

101
instruments is necessary in order to compensate for buoyancy effects due to the variation
in the density of the purge gas with temperature, as well as the type of gas. Unlike
vertical balance instruments, horizontal balance TGA instruments normally have two
pans for the sample and reference, respectively, and can therefore also perform DTA and
DSC measurements. They are considered free from buoyancy effects but require
calibration to compensate for differential thermal expansion of balance arms.
Figure 4.8(a): Schematic of a TGA furnace [18]
In the present work, the vertical type TGA instrument was used. The schematic
diagram and photograph of the instrument used in this analysis are shown in Fig. 4.7. The
instrument is a Perkin-Elmer TGA7 thermogravimetric analyzer. The samples, each
having a mass between 6 and 10 mg were placed into a sample pan which is attached to a
sensitive microbalance assembly, as shown in Fig. 4.7(a). The sample holder portion of
the TGA balance assembly was subsequently placed into a high temperature furnace. The
samples were subsequently heated from 25 to 600C at a rate of 10Cmin-1 in a flowing
nitrogen atmosphere (flow rate 20 mL min-1). The balance assembly measures the initial
sample weight at room temperature and then continuously as the temperature increases.
The samples lost weight as species decomposed or evaporated. These changes were

102
detected by the analytical balance from which the samples were suspended. The data
were plotted with weight percent on the y-axis and temperature on the x-axis.
Figure 4.8(b): Image of the TGA apparatus used in this project
4.7 Synthesis techniques
4.7.1 Sol-gel
The sol-gel method is one of the traditional wet chemical techniques for
producing metal oxide nanoparticles through chemical processes; hydrolysis, gelation,
followed by drying, and finally thermal treatment [27,28]. In general, the sol is defined as
colloidal particles suspended in a liquid solvent from which a gel can be formed. On the
other hand, a gel is a three dimensionally interconnected rigid network, having
submicrometre pores and a polymeric chain whose average length is of the order of
microns. In sol-gel processing, metal alkoxides are used as a reactive metal precursor and
hydrolyzed with water. By adding appropriate reagents, homogeneous gels from the
mixture of alkoxides can be produced through the processes of hydrolysis and gelation.
After gelation, the precipitate is subsequently washed, dried, and then sintered at an

103
elevated temperature to obtain crystalline metal oxide nanoparticles [27,29]. The
advantages of the sol–gel method include easier composition control, better homogeneity
and a lower reaction temperature which is better suited to synthesizing high purity, fine
powders. In addition, the particle size of the final product can be easily controlled by
changing the initial concentration of the starting sols and intermediate processing
conditions such as gelation, drying, calcination, and rates of cooling. Although the sol-gel
method can be used to produce nanophosphors or metal-oxide nanoparticles [30,31], this
technique has some significant disadvantages. These include; (1) the requirement for the
drying and annealing processes to be deliberately slow to avoid the formation of cracks
and striations, (2) the difficulty in removing the residual hydroxyls, making it necessary
to anneal the samples at high temperatures (above 1000C), which may result in
undesirable side effects.
4.7.2 Combustion synthesis
Rare-earth doped phosphors are mainly synthesized by the solid-state reaction
method. This technique has several shortcomings such as prolonged reaction time, larger
Add to
Add to
X g CO(NH2)2
mix and mill in a mortar using a pestle
thick white paste
X g Eu(NO3)3.6H2O+
Xg Dy(NO3)3.5H2O
X g M(NO3)3.4H2O
+
X g Al(NO3)2.9H2O
heat in a muffle furnace at 500 oC
fluffy product ready for characterization grind to make fine powders
Composite Preparation Brabender Plastograph chamber Hot melt-pressed into thin slabs
Figure 4.9: Sequence of events during combustion synthesis

104
grain growth, poor homogeneity, and it could be mitigated by alternate routes offered by
wet-chemistry. Sol-gel methods have also been employed to synthesize nanophosphors
by many researchers [30-33]. However, the as-prepared powders obtained from the sol-
gel method have low crystallinity and often require post-treatment at high temperature,
which results in severe agglomerations.
Combustion synthesis has emerged as an important technique for the synthesis
and processing of various types of materials, which include nanomaterials [34]. It is
based on the concept that once initiated locally by means of a thermal source of short-
term service, highly exothermic reactions can become self-sustaining in the form of a
combustion wave and yield the final product progressively without requiring additional
heat. For any combustion reaction to take place, a fuel and an oxidizer are necessary.
Different fuels may be used but they all serve two purposes [35]: (i) They are the source
of C and H, which on combustion form CO2 and H2O and liberate heat. (ii) They form
complexes with the metal ions, facilitating homogeneous mixing of the cations in
solution. When the mixture of fuel and oxidizer is heated, the mixture grows into a frothy
foam which may occupy the entire reaction vessel and then gets self-ignited followed by
combustion. It is an exothermic reaction that occurs with evolution of heat. Once ignited
the energy necessary for combustion reaction is then supplied from the reaction itself,
hence it is referred to as self-propagating high temperature synthesis. The combustion
method of preparing nanocrystalline materials, although it appears to be a breaking down
(physicist’s approach) process, is in fact, a building-up (chemist’s approach) process as
the product nuclei are formed initially and then grow [35].
Phosphors prepared by the combustion method have low density and appear
fluffy. Ultra fine particles are produced through this process due to the evolution of gases.
As more gases are released the agglomerates are either not formed or they are
disintegrated into fine particles. Combustion synthesis processes are characterized by
high-temperatures, fast heating rates, and short reaction times. These features make
combustion synthesis an attractive method for the manufacture of technologically useful
materials at lower costs compared to conventional ceramic processes. Some other

105
advantages of this method are; (a) use of relatively simple equipment, (b) formation of
high-purity products, (c) stabilization of metastable phases and, (d) formation of products
of virtually any size and shape.
The sequence of events in the combustion process used in this work is shown in Fig. 4.8.

106
4.8 References
1. García, M.F. Arias, A.M. Hanson, J.C. Rodriguez, J. AChem. Rev., 104: 4063,
(2004).
2. Smith, D.J. Rep. Prog. Phys., 60: 1513, (1997).
3. E. Hao, G.C. Schatz, Hupp, J.T. J. Fluoresc., 14, 331, (2004.)
4. Wan, J.X. Wang, Z. Chen, X. Mu, L. Qian, Y. Eur. J. Inorg. Chem., 20:, 4031,
(2005).
5. Zhang, H.Z. Banfield, J.F. J. Phys. Chem. B., 104: 3481, (2000).
6. Liu, J.Y. J. Electr. Micros., 54: 251, (2005).
7. Dinsmore, A.D. Hsu, D.S. Qadri, S.B. Cross, J.O. Kennedy, T.A. Gray, H.F.
Ratna, B.R. J. Appl. Phys., 88(9): 4985, (2000).
8. Tao, Y. Zhao, G. Ju, X. Shao, X. Zhang, W. Xia, S. Mater. Lett., 28: 137-140,
(1996).
9. Wegh, R.T. Meijerink, A. Lamminmäki, R-J. Hölsä, J. J. Lumin., 87–89: 1002,
(2000).
10. Kickelbick, G. Hybrid Materials. Synthesis, Characterization, and Applications.
Kickelbick, G. (Ed.) Wiley-VCH Verlag GmbH & Co. KGaA, Weinheim, (2007).
11. Kalaitzidis, S. Christanis, K.Int. J. Coal Geo., 54(1-2): 69, (2003).
12. Ebert, M. Inerle-Hof, M. Weinbruch, S. Atmospheric Environment, 36(39-40):
5909, (2002).
13. Goldstein, J.I. Scanning Electron Microscopy and X-ray Microanalysis. Plennum
Press, New York, (1981).
14. Yacobi, B.G. Holt, D.B. Kazmerski, L.L. Microanalysis of Solids. New York,
Plenum Press, (1994).
15. Cullity, B.D. Stock, S.R. Elements of X-Ray Diffraction. 3rd Edition, Prentice-Hall
Inc. New Jersey. (2001)
16. Kuno, M. Introduction to Nanosciene and Nanotechnology: A Workbook. Notre
Dame, (2005)

107
17. Kohler, M. Fritzsche, W. Nanotechnology: An Introduction-Nanostructuring
Techniques. Wiley-VCH, (2003).
18. Giunta, P.R..PhD Dissertation. The Florida State University of Arts and Sci.
(2005).
19. Yen, W. M. Shionoya, S. Yamamoto, H. Measurement of Phosphor Properties.
CRC Press, Taylor & Francis Group, LLC, Chap. 1, (2007).
20. Gfroerer, T.H. Encyclopedia of Analytical Chemistry. R.A. Meyers (Ed.), John
Wiley & Sons Ltd, Chichester, 9209, (2000).
21. Yoshioka, T. Ogawa, M. Measurements of luminescence properties of phosphors.
CRC Press: New York, Chap. 14, (2007).
22. Danley, R.L. Thermochimica Acta., 395(1-2): 201, (2002).
23. Pabdn, C.V. Frutos, P. Lastres, J.L Frutos, G. J. Pharm. and Biom. Anal., 15:131,
(1996).
24. Maria, G. Heinzle, E.J. Loss Prev. Proc. Indus., 11: 187, (1998).
25. Hatakeyama, T. Quinn, F.X. Thermal Analysis: Fundamentals and Applications
to Polymer Science. ,John Wiley & Sons Ltd. Baffins Lane, Chichester, West
Sussex PO19 IUD, England, Chap. 2, (1999)
26. Galíková, A. Pola, J. Thermochimica Acta., 473(1-2): 54, (2008).
27. Yen, W.M. Weber, M.J. Inorganic Phosphors. CRC Press, Boca Raton, (2004).
28. Elliot, S. The Physics and Chemistry of Solids. John Willey and Sons, New York,
(1998)
29. Gogotsi, Y. Nanomaterials Handbook. CRC Press, Boca Raton, (2006).
30. Fadlalla, H.M.H. Tang, C.C. Elssfah, E.M. Shi, F. Mater. Chem. Phys., 109(2-3):
436, (2008).
31. Lin, C.C. Lin, K.M. Li, Y.Y.J. Lumin., 126(2): 795, (2007).
32. Hsu, W.H. Sheng, M.H. Tsai, M.S. J. Alloys Compd., 467: 491, (2009).
33. Zhou, L. Yan, B. J. Phys. Chem. Sol., 69: 2877, (2008).
34. Patil, K.C. Aruna, S.T. Ekambaram, S. Curr. Opin. Solid State Mater. Sci., 2:
158, (1997).
35. Patil, K.C. Aruna, S.T. Mimani, T. Curr. Opin. in Solid State and Mater. Sci. 6:
507, (2002)

108
Chapter 5 Properties of the Green Commercial SrAl2O4:Eu2+,Dy3+
Phosphor in LDPE and PMMA Polymers
5.1. Introduction
The recognition of the size-dependence of the physical properties of materials has
led to vigorous exploration of nanophase materials [1-4]. Nanophase materials are
materials in the 1 to 100 nm range and exhibit greatly altered properties compared to
their normal, large-grained counterparts with the same chemical composition. Phosphors
constitute one of the categories of materials that show promising properties when
synthesized in the nanophase. Strontium aluminate (SrAl2O4–Fig. 5.1) is a solid,
odourless, nonflammable pale yellow powder. When activated with a suitable dopant,
Figure 5.1: Crystal structure of SrAl2O4 at 1073 K, viewed along (001) [5]

109
e.g. europium or neodymium, it acts as a photoluminescent material with long
persistence of phosphorescence. Europium-activated strontium aluminate is a vastly
superior phosphor than its predecessor, copper-activated zinc sulphide; it is about 10
times brighter, 10 times longer glowing, but 10 times more expensive than ZnS:Cu. The
material is very hard, causing abrasion to machinery handling it; coating the particles
with a suitable lubricant is usually used when strontium aluminate is added to plastics.
These phosphors find a wide range of applications such as in defence, domestic,
commercial as well as in the scientific domains. These include use in luminous paints, as
safety indicators in emergency cases, and in display devices (e.g. field emission displays
and toys). Green-emitting SrAl2O4 phosphors co-doped with europium (Eu) and
dysprosium (Dy) have been focused on as high brightness and long afterglow
characteristic materials.
Various mechanisms have been developed in an effort to explain the trapping and
de-trapping mechanisms in these materials. A mechanism based on hole trapping created
by Dy3+ ions co-doped into the host was developed on the long afterglow characteristics
[2-5]. On the basis of some incompleteness in the prediction of certain experimental and
theoretical phenomena, Clabau et al. [8] have more recently proposed a model of
phosphorescence in terms of trapping of electrons only. Phosphor nano-composites can
potentially be used to produce low-energy consumption and high efficiency illumination
for long hours. Progress in each of these areas depends on the ability to selectively and
controllably deposit nano-particles, and to uniformly disperse the phosphors in the host
matrix, to create a strong and stable three dimensional network. Though rare-earth ion-
doped alkaline earth aluminate phosphors have been extensively investigated [1,6,7],
there is a lack of work done on phosphor hosts, particularly for outdoor applications, an
area that finds increasing use for these materials. Exposure to moisture and other
environmental factors have the potential to cause accelerated degradation in luminance.
This chapter deals with the mixing conditions, luminescence as well as thermal
properties of the newly developed SrAl2O4:Eu2+,Dy3+ phosphor introduced into two

110
polymer matrices, namely poly(methylmethacrylate) (PMMA) and low-density
polyethylene (LDPE). The characterized properties are also discussed. The lower density
of polymers, compared to metals and ceramics, as well as resistance to atmospheric and
other forms of corrosion, render them more suitable for these applications.
5.2. Experimental
5.2.1 Materials
Commercially produced strontium aluminate powder from Phosphor Technology
in the UK was used. It has a density of 3.67 gcm-3 and a melting point of 1200 ºC.
PMMA has a melt flow index (MFI) of 0.8 g/10 min, a melting point of 135 ºC, and a
density of 1.19 gcm-3. LDPE has an MFI of 2.0 g/10 min, a melting point of 110 ºC, and a
density of 0.922 gcm-3. LDPE was supplied by Sasol Polymers, South Africa.
5.2.2 Sample preparation
The preparation of SrAl2O4:Eu phosphor has already been reported elsewhere
[9,10]. Polymer-phosphor composites were produced by melt-mixing the green-emitting
strontium aluminate phosphor into poly(methylmethacrylate) and low-density
polyethylene, respectively at volume ratios ranging from 0.05% to 5% calculated from
the equation,
1
11
m
ffcf
VV
VM (5.1)
where Vc = volume of the mixing chamber (50 cm3), m = density of the matrix (polymer
= 1.19 gcm-3), and f = density of the filler (phosphor = 3.67 gcm-3). Samples were
weighed according to the required ratios and mixed using a volume of 50 cm3 in a
Brabender Plastograph mixing chamber at a speed of 30 rpm for 15 minutes. The mixing
was carried out at 160 °C and 180 °C for PMMA and LDPE, respectively. The samples,

111
whose average thickness was 0.43 ± 0.08 mm, were extruded at 200 °C and 250 °C for
PMMA and LDPE, respectively.
5.2.3 Morphology and structural analysis
The microstructure and elemental composition of the samples were investigated
using a scanning electron microscope (SEM) (Shimadzu model ZU SSX–550 Superscan)
coupled with an energy dispersive X-ray spectrometer (EDS). The as-prepared samples
were directly cut into pieces of appropriate sizes. Prior to the SEM analyses and EDS
measurements, the samples were gold-sputter-coated to facilitate electron conduction.
The samples were then mounted on aluminium stubs with conductive double sticking
tape. The tape is made of carbon material to facilitate the conduction of electrons and is
double sticking in order to hold the sample on the one side and to stick on the sample
holder stubs on the other. The morphology and particle size of the composites were
observed by transmission electron microscopy (TEM). TEM images were recorded on a
JEOL-JEM 200CX transmission electron microscope. To study the crystalline/amorphous
structures of the products, XRD measurements were carried out at room temperature.
XRD scans of the samples were performed with a Bruker AXS Discover diffractometer
with CuK radiation of wavelength 1.5406 Å.
5.2.4 Photoluminescence measurements PL measurements were made on a Carry Eclipse fluorescence spectrophotometer
system, equipped with a 150 W xenon lamp as the excitation source. Samples were
excited at 350 nm and emission observed in the wavelength range 400 to 600 nm at room
temperature.
5.2.5 Thermal analysis
A Perkin-Elmer DSC 7 differential scanning calorimeter, under flowing nitrogen,
was employed for the DSC analyses. The system was interfaced to a computer, which
was used for calculations by means of the Pyris software. Calibration of the system was

112
based on the onset temperatures of melting of indium and zinc standards, as well as the
melting enthalpy of indium. Samples of masses ranging from seven to ten milligrams
were sealed in aluminium pans and heated from 25 to 160 °C at a heating rate of 10 °C
min-1, and immediately cooled at the same rate to 25 °C. For the second scan, the
samples were heated and cooled under the same conditions. Peak temperatures of
melting and crystallization, as well as melting and crystallization enthalpies, were
determined from the second scan. Thermogravimetric analyses (TGA) were performed in
a Perkin-Elmer TGA7 thermogravimetric analyzer in a flowing nitrogen atmosphere
(flow rate 20 mL min-1). The samples, each having a mass between 6 and 10 mg, were
heated from 25 to 600 C at a rate of 10 Cmin-1. For both DSC and TGA analyses three
measurements were performed on each sample composition, from which average
temperature and enthalpy values were calculated.
5.3. Results and discussion
Fig. 5.2 shows the SEM micrographs of the polymer composites. Two types of
morphology can be observed. The first consists of large and small particles (lumps)
superimposed on an otherwise smooth surface (Fig. 5.2a). Most probably, these lumps are
non-dispersed phosphor particles. However, EDS point analysis confirmed the
distribution of phosphor particles throughout the whole polymer surface for the different
Figure 5.2: SEM images of (a) 97/3 v/v LDPE/SrAl2O4:Eu2+,Dy3+ [100 magnification], (b) 97/3 v/v PMMA/ SrAl2O4:Eu2+,Dy3+ [100 magnification]
(a) (b)

113
concentrations. The second type of morphology observed consists of leaflet-like
structures (Fig. 5.2b). Based on available results, these patterns are most probably the
result of the mechanical sample manufacturing process. The EDS results, shown in Fig.
5.3, show the presence of the expected elements, i.e., strontium, aluminium, oxygen and
carbon. On the basis of several spot analyses results on the samples, it was found that for
each of the respective phosphor concentrations the distribution of the elements,
strontium, aluminium, and oxygen, in the polymer matrices was fairly uniform.
Figure 5.3: Point EDS results of 97/3 v/v LDPE/SrAl2O4:Eu2+,Dy3+
Typical XRD patterns recorded for the composites of LDPE and PMMA, as well
as the SrAl2O4:Eu2+Dy3+ powder, are displayed in Fig. 5.4. The SrAl2O4 crystal is
characterized by planes having diffraction peaks of (011), (020), (-211), (220), (211),
(031), and (400). The measurements displayed here have visible peaks at 20, 30, and
35, corresponding to the planes (020), (220) and (031). The peaks indicate the presence
of SrAl2O4. The absence of the other expected phosphor peaks in the XRD spectra may
be due to the low concentration of the phosphor in the polymer matrix. It is observed that
as the phosphor concentration in LDPE increases, there are no changes in either the peak

114
positions, sizes, or shapes. These results indicate that the introduction of the phosphor did
not significantly change the general structure of the polymer. Crystallite sizes calculated
from Scherrer’s equation have a wide range, but in the nanometre range, averaging 70 ±
23 nm.
10 20 30 40 500
200004000060000
2(deg)
LDPE pure
95/5 v/v LDPE/phosphor
0200004000060000
99.95/0.05 v/v LDPE/phosphor
0200004000060000
99.9/0.1 v/v LDPE/phosphor
0200004000060000
In
tens
ity(a
.u.)
99.5/0.5 v/v LDPE/phosphor
0200004000060000
99/1 v/v LDPE/phosphor
0200004000060000
97/3 v/v LDPE/phosphor
0200004000060000
(031
)
(220
)
Figure 5.4(a): XRD spectra of LDPE and LDPE/SrAl2O4:Eu2+Dy3+

115
20 40 60 80
100
200
300
400
Inte
nsity
(a.u
.)
2 (deg)
95/5 v/v PMMA/phosphor
Figure 5.4(b): XRD spectra of PMMA/SrAl2O4:Eu2+Dy3+
10 20 30 40 50 60 700
100
200
300
400
500
600
700
(031
)(2
11)
(-21
1)(2
20)
(020
)
Inte
nsity
(a.u
.)
2 (deg.)
Commercial SrAl2O4:Eu2+,Dy3+
Figure 5.4(c): XRD spectrum of the green-emitting SrAl2O4:Eu2+Dy3+

116
Fig. 5.5 shows the TEM micrographs of the composites containing 5% phosphor
in LDPE and PMMA.. The image shows the basic morphology of the phosphor particles
and their distribution at the low phosphor concentration. The particles are fairly
monodisperse in size and isotropic in shape.
Figure 5.5: TEM micrographs of 5% SrAl2O4:Eu2+,Dy3+ in (a) LDPE (b) PMMA
The LDPE composites with a phosphor concentration greater than 0.5% and
PMMA composites with a concentration greater than 1.0% show an intense green
emission, as seen in Fig. 5.6. The PL spectrum corresponding to each concentration is
composed of a broad PL band peaking near 510 nm. This green photoluminescence has
been attributed to the 4f 6 5d 14f 7 electronic transition of the divalent europium ion
(Eu 2 ) in the SrAl2O4:Eu2+ bulk phosphors, as reported earlier [2,3]. The PL peaks for
LDPE shift to higher wavelengths with increasing phosphor concentration. Higher
phosphor concentration favours the excitation of the green luminescence wavelength (520
nm) which is attributed to the Eu2+ emission centre.
(a) (b)

117
425 450 475 500 525 550 575 600
0.0
0.5
1.01.5
2.0
2.5
3.0
3.54.0
4.5 99/1 v/v LDPE/phosphor 97/3 v/v LDPE/phosphor 95/5 v/v LDPE/phosphor
PL in
tens
ity (a
.u.)
Wavelength (nm)
99.95/0.05 v/v LDPE/phosphor 99.5/0.5 v/v LDPE/phosphor 99/1 v/v LDPE/phosphor
Figure 5.6(a): PL spectra for LDPE/SrAl2O4:Eu2+,Dy3+composites
450 475 500 525 550 575 600
0.000
0.625
1.250
1.875
PL In
tens
ity (a
.u.)
Wavelength (nm)
95/5 v/v PMMA/phosphor 99/1 v/v PMMA/phosphor 100/0 v/v PMMA/phosphor
Figure 5.6(b): PL spectra for PMMA/SrAl2O4:Eu2+,Dy3+composites
Fig. 5.7 correlates the photoluminescence intensity with the phosphor
concentration. The superiority in luminescence displayed by LDPE is probably a
consequence of a polaronic effect in which phosphor particles may be responsible for an

118
0 1 2 3 4 50.0
0.5
1.0
1.5
2.0
2.5
3.0
3.5
4.0
PMMA
LDPE
PL In
tens
ity (a
.u.)
Phosphor concentration (%)
LDPE PMMA
Figure 5.7: Concentration-dependence of the PL emission peaks of the LDPE- and PMMA/SrAl2O4: Eu2+,Dy3+ composites
50 75 100 125 150
5.2
5.6
6.0
6.4
Endo
Nor
mal
ised
hea
t flo
w (J
g-1)
Temperature (oC)
95/5 v/v LDPE/phosphor 97/3 v/v LDPE/phosphorPure LDPE
Figure 5.8(a): DSC heating curves of LDPE and LDPE/SrAl2O4:Eu2+,Dy3+

119
alteration in the polymer bond geometry, giving rise to the creation of an “excited state”
(polaron), which on being relaxed may lead to the energy being emitted radiatively. The
transparency and resistance of the polymer matrix for UV radiation are also possible
contributing factors.
50 75 100 125 150
2
3
4
5Pure LDPE
95/5 v/v LDPE/phosphor
Nor
mal
ised
hea
t flo
w (J
g-1)
Temperature (oC)
97/3 v/v LDPE/phosphor
Figure 5.8(b): DSC cooling curves of LDPE and LDPE/SrAl2O4:Eu2+,Dy3+
The DSC curves for LDPE and its composites are shown in Fig. 5.8. The average
values of the peak temperatures of melting, as well as the melting and crystallization
enthalpy values, are summarized in Table 1. The heating curves in Fig. 5.8(a) show
endothermic peaks at about 112 C, with no significant peak shifts, suggesting that the
phosphor content did not have an appreciable effect on the melting temperature of LDPE.
The comparison between the observed and expected enthalpies (calculated taking into
account the weight fraction of LDPE in the samples, and assuming that the LDPE
crystallization mechanism does not change in the presence of the phosphor particles)
shows lower than expected enthalpies for the composites at low phosphor contents, but at
higher phosphor concentrations the experimentally observed enthalpies are higher. This
behaviour may be explained by the fact that the particles are not agglomerated at low
contents, and therefore there are large interfacial areas between the nano-particles and the

120
Table 5.1: DSC data of LDPE and LDPE/SrAl2O4:Eu2+,Dy3+
Hm and Hc - melting and crystallization enthalpies; Tm and Tc - peak temperatures of melting
and crystallization
Vol.%
phosphor
Tm / C
H obsm / J g-1
H calm /J g-1
Tc / C
H obsm / J g-1
H calc / J g-1
0.00 112.5 0.3 80.7 6.4 - 99.1 0.1 -61.8 4.5 -
0.05 112.5 0.4 62.7 2.0 80.5 99.2 0.1 -52.9 2.2 -61.7
0.10 112.3 0.3 76. 6 2.1 80.4 99.2 0.4 -56.7 2.7 -61.6
0.50 112.1 0.0 72.2 6.0 79.2 98.8 0.0 -55.1 6.7 -60.6
1.00 112.4 0.2 70.6 0.3 77.6 98.7 0.1 -58.8 3.5 -59.3
3.00 112.2 0.6 75.5 0.2 72.1 98.7 0.2 -58.7 6.4 -55.0
5.00 112.3 0.3 75.9 0.3 67.4 98.7 0.9 -54.2 4.3 -51.3
100 200 300 400 500 6000
20
40
60
80
100
Mas
s(%
)
Temperature (oC)
95/5 v/v LDPE/phosphor 97/3 v/v LDPE/phosphor Pure LDPE
Figure 5.9: TGA curves for LDPE and LDPE/SrAl2O4:Eu2+,Dy3+

121
polymer. This will result in immobilization of the polymer chains and accompanying
decrease in crystallinity. At high phosphor contents there is particle agglomeration which
probably gives rise to epitaxial crystallization of LDPE on the phosphor surfaces.
The TGA results (Fig. 5.9) show that the composites start decomposing at higher
temperatures than pure LDPE. The main degradation for the pure polymer starts at about
380 C and leaves a residue at 496 C, while the corresponding values for the composites
are 402 C and 501 C respectively. This indicates that the phosphor particles increased
the thermal stability of the polymer. Considering values of the weight loss over the two
temperature ranges, i.e. 380 C to 496 C and 402 C and 501 C, LDPE degrades over a
wider temperature change (116 C) compared to the composites (99 C). Hence, the rates
of degradation for the composites are higher than that of pure LDPE. The residual mass
corresponds to the amount of phosphor initially mixed with the polymer. An observation
similar to this, made for LDPE-copper composites [11], was attributed to the relatively
higher heat capacity and thermal conductivity values of copper, which caused it to
preferentially absorb the heat. In view of the higher values of the heat capacities and
thermal conductivities for ceramics, the increased stability in the LDPE-phosphor
composites may similarly be explained. However, extended heat absorption by the
phosphor particles, may cause these particles to reach a higher temperature than the
surrounding matrix resulting in a more rapid degradation of the polymer. Alternatively,
the phosphor particles may temporarily trap the volatile degradation products, which will
escape at a faster rate as soon as they acquire enough energy at higher temperatures.
5.4. Conclusions
This study has provided some insight into the ability to controllably mix nano- to
micro-sized phosphor particles into, and to uniformly disperse them in both semi-
crystalline and amorphous polymer matrices. To elucidate this information, the
morphology, photoluminescence, and thermal properties of the polymer composites were
investigated. SEM micrographs and EDS spectra showed generally smooth morphologies
and a fairly uniform distribution of phosphor particles in the polymer matrices. XRD

122
peaks for the composites of the polymers are similar to those of the pure polymers,
manifesting a close resemblance in the configurations of the pure polymers and their
phosphor composites. TEM micrographs reveal monodispersed, nanosized phosphor
particles. A characteristic green emission peak at about 505 nm wavelength was exhibited
by the composites. Peak intensities of the PL emission spectra monotonously increased
with an increase in phosphor concentration. The higher intensity values in LDPE are
probably due to a polaronic effect. The DSC results for LDPE do not show a major
influence of the phosphor content on either the melting temperature or enthalpy of the
polymer. These results demonstrate that LDPE can be employed to create a suitable
three-dimensional phosphor network for practical luminescence applications.

123
5.5 References
1. Murayama, Y. Takeuchi, N. Aoki, Y. Matsuzawa, T. Phosphorescent Phosphor. US
Patent, 006: 5, 424, (1995).
2. Matsuzawa, T. Aoki, Y. Takeuchi, N. Murayama, Y. J. Electrochem. Soc., 143:
2670, (1996).
3. Katsumata, T. Sakai, R. Komuro, V. Morikawa, T. J. Electrochem. Soc., 150:
H111, (2003).
4. Qiu, J. Gaeta, V. Hirao, V. Chem. Phys. Lett., 333: 236, (2001)
5. Fukuda, K. Fukushima, K.J. Solid State Chem., 178: 2709, (2005).
6. Katsumata, T. Sakai, R. Komuro, S. Morikawa, T. Kimura, H. J. Cryst. Growth.,
198/199: 869, (1999).
7. Shionoya, S. Yen, W.M. (Eds.) Phosphor Handbook. CRC Press, Boca Raton, FL,
USA, 651, (1999).
8. Nakamura, T. Kaiya, K. Takahashi, N. Matsuzawa, T. Rowlands, C.C. Beltran-
Lopez, V. Smith, G.M. Riedi, P.C. J. Mater. Chem., 10: 2566, (2000).
9. Clabau, F. Rocquefelte, X. Jobic, S. Deniard, P. Whangbo, M.H. Garcia, A.
Mercier, T.L. Chem. Mater., 17: 3904, (2005).
10. Tsutai, H. Shimizu, I. Kawakami, T. Shinbo, K. Kato, K. Kaneko, Ohta, F. M. Tech.
Rep. of IEICE CPM., 13: 95, (1995).
11. Tsutai, T. Kamimura, I. Kato, K. Kaneko, F. Shinbo, K. Ohta, M. Kawakami, T.
Tech. Rep. of IEICE CPM., 55: 97, (1997).
12. Luyt, A.S. Molefi J.A. Krump, H. Polym. Degrad. Stab., 91: 1629, (2006).

124
Chapter 6 Structural, Luminescent, and Thermal Properties of
Blue Sr4Al14O25:Eu2+,Dy3+ Phosphor-Filled Low Density Polyethylene Composites
6.1 Introduction
Strontium aluminate phosphors activated by europium and dysprosium have
attracted much attention because of their excellent properties [1-3]. Compared with
classical sulfide phosphorescent materials, aluminates have several valuable properties
[4-6]; high radiation intensity, colour purity, longer afterglow, chemically stable, safe and
require no additional radiation from a radioactive source. The origin of the extremely
long persistent luminescence has tentatively been attributed to alkaline earth metal
vacancies [7].
One of the undesirable consequenses of producing nano-sized phosphors is the
degradation resulting from accelerated rates of reaction with environmental factors such
as water, oxygen, and CO2. Consequently, in technological applications, protecting
nanomaterials from degradation becomes one of the important considerations.
125
Passivating the surfaces of nanoparticles can be accomplished using chemical reactions
to coat or disperse the particles in a polymer or glass matrix [8].
The purpose of the work done in this chapter was to investigate the mixing
conditions, structural, luminescence as well as thermal properties of the
Sr4Al14O25:Eu2+,Dy3+ phosphor introduced into a low-density polyethylene (LDPE)
matrix. The properties are characterized for the purpose of elucidating information for
identifying suitable materials for hybridization with phosphors to minimize their
degradation rates while sustaining their luminance in practical applications.
6.2 Materials and methods
6.2.1 Materials
Commercially produced strontium aluminate powder from Phosphor Technology
in the UK was used. It has a density of 3.67 gcm-3 and a melting point of 1200ºC. The
average crystallite size of the powder, as determined from the Scherrer equation, is 48
16 nm. LDPE has a melt flow index (MFI) of 2.0 g/10 min, which was determined by
preheating a sample of the polymer at 190 C for 5 minutes followed by a shear analysis
on a 2.16 kg mass. It has a melting point of 110 ºC, and a density of 0.922 gcm-3. The
polymer was supplied by Sasol Polymers, South Africa.
6.2.2 Sample preparation
The phosphor was prepared by a conventional high temperature processing
method [9]. Polymer/phosphor composites were produced by melt-mixing the blue-
emitting strontium aluminate phosphor into low-density polyethylene at volume ratios
ranging from 1% to 5%. Samples were weighed according to the required ratios and
mixed using a volume of 50 cm3 in a Brabender Plastograph mixing chamber at a speed
of 30 rpm for 15 minutes. The mixing was carried out at 160°C. The samples were hot

126
melt-pressed into slabs of average thickness 0.98 ± 0.05 mm, at 160°C. This technique is
different from the previous one (chapter 5) and was preffered due to its simplicity.
6.2.3 Morphology and structural analysis
To study the structure of the samples, XRD scans were performed at room
temperature with a Bruker AXS Discover diffractometer with CuK radiation of
wavelength 1.5406 Å.
6.2.4 Photoluminescence (PL) measurements
The phosphorescence spectra were measured on a SPEX 1870 0.5m spectrometer
system, equipped with a He–Cd laser lamp as the excitation source. Samples were excited
at 325 nm and emission observed in the wavelength range 350 to 700 nm at room
temperature. The He–Cd laser is considered to excite the electrons to the 5d states of Eu2+
ions because the wavelength (325 nm) is close to the peak wavelength of a broadband
absorption from 250 to 420 nm seen in the excitation spectra from Sr4Al14O25:Eu2+,Dy3+
crystals. The excitation energy of the He–Cd laser is thought to be smaller than the band
gap energy of the specimen [10].
6.2.5 Thermal analysis
A Perkin-Elmer DSC7 differential scanning calorimeter, under flowing nitrogen
(20 mL min-1), was employed for the DSC analyses. The calculations were done by
means of Pyris software. Samples of masses ranging from 7 to 10 mg were sealed in
aluminium pans and heated from 25 to 160 °C at a heating rate of 10 °C min-1, and
immediately cooled at the same rate to 25 °C. For the second scan, the samples were
heated and cooled under the same conditions. Peak temperatures of melting and
crystallization, as well as melting and crystallization enthalpies, were determined from
the second scan. Thermogravimetric analyses (TGA) were performed in a Perkin-Elmer
TGA7 thermogravimetric analyzer in a flowing nitrogen atmosphere (20 mL min-1). The

127
samples, each having a mass between 6 and 10 mg, were heated from 25 C to 600 C at
a rate of 10 C min-1. For both DSC and TGA analyses three measurements were
performed on each sample composition, from which average temperature and enthalpy
values were calculated.
6.3 Results and discussion
6.3.1 X-ray diffraction (XRD)
The peaks of the (020), (-211), (220), (211), and (031) planes that characterize the
Sr4Al14O25:Eu2+,Dy3+ crystal (JCPDS data No. 34-0379) [3] can be observed in Fig. 6.1
for LDPE. This indicates that LDPE is a suitable host for the phosphor. No other products
are observed, implying that the Sr4Al14O25 phase composition of the phosphor [11] is well
preserved within the polymer.
10 20 30 40 50
0
10000
20000
30000
40000
(b)
(a)
(031
)
240
210
(211
)(2
20)
(-211
)
(020
)
Inte
nsity
(a.u
.)
2 (0)
95/5 v/v LDPE/phosphor 100/0 v/v LDPE/phosphor
Figure 6.1: XRD spectra of (a) LDPE and (b) the composite sample with 5% Sr4Al14O14: Eu2+,Dy3+
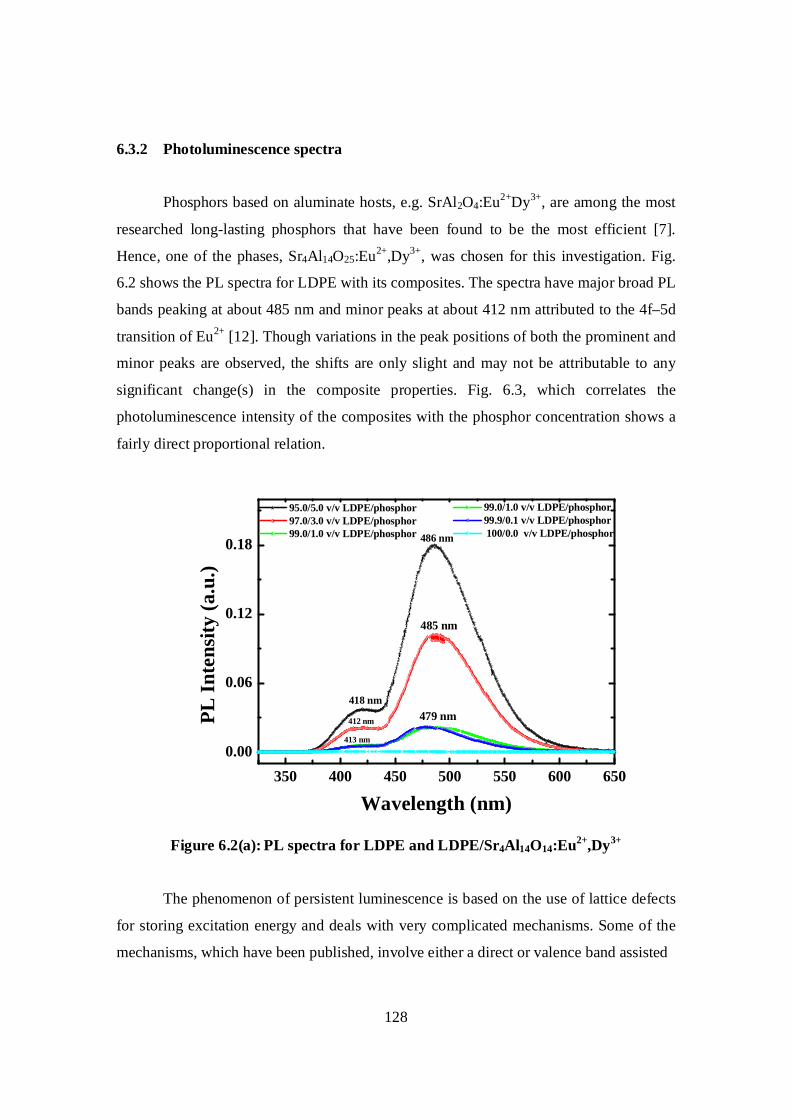
128
6.3.2 Photoluminescence spectra
Phosphors based on aluminate hosts, e.g. SrAl2O4:Eu2+Dy3+, are among the most
researched long-lasting phosphors that have been found to be the most efficient [7].
Hence, one of the phases, Sr4Al14O25:Eu2+,Dy3+, was chosen for this investigation. Fig.
6.2 shows the PL spectra for LDPE with its composites. The spectra have major broad PL
bands peaking at about 485 nm and minor peaks at about 412 nm attributed to the 4f–5d
transition of Eu2+ [12]. Though variations in the peak positions of both the prominent and
minor peaks are observed, the shifts are only slight and may not be attributable to any
significant change(s) in the composite properties. Fig. 6.3, which correlates the
photoluminescence intensity of the composites with the phosphor concentration shows a
fairly direct proportional relation.
350 400 450 500 550 600 6500.00
0.06
0.12
0.18
95.0/5.0 v/v LDPE/phosphor 97.0/3.0 v/v LDPE/phosphor 99.0/1.0 v/v LDPE/phosphor
413 nm
412 nm 479 nm
485 nm
486 nm
418 nm
PL In
tens
ity (a
.u.)
Wavelength (nm)
99.0/1.0 v/v LDPE/phosphor 99.9/0.1 v/v LDPE/phosphor 100/0.0 v/v LDPE/phosphor
Figure 6.2(a): PL spectra for LDPE and LDPE/Sr4Al14O14:Eu2+,Dy3+
The phenomenon of persistent luminescence is based on the use of lattice defects
for storing excitation energy and deals with very complicated mechanisms. Some of the
mechanisms, which have been published, involve either a direct or valence band assisted
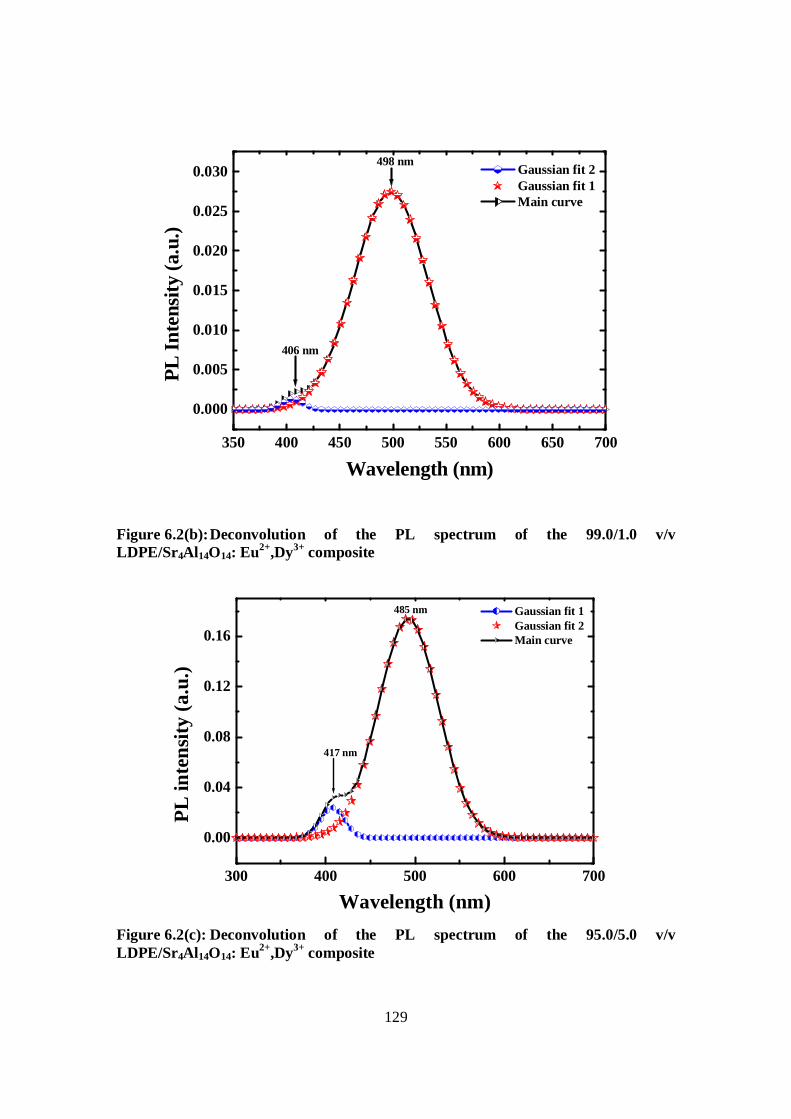
129
350 400 450 500 550 600 650 700
0.000
0.005
0.010
0.015
0.020
0.025
0.030
406 nm
498 nm
PL In
tens
ity (a
.u.)
Wavelength (nm)
Gaussian fit 2 Gaussian fit 1 Main curve
Figure 6.2(b): Deconvolution of the PL spectrum of the 99.0/1.0 v/v LDPE/Sr4Al14O14: Eu2+,Dy3+ composite
300 400 500 600 700
0.00
0.04
0.08
0.12
0.16
485 nm
417 nm
PL in
tens
ity (a
.u.)
Wavelength (nm)
Gaussian fit 1 Gaussian fit 2 Main curve
Figure 6.2(c): Deconvolution of the PL spectrum of the 95.0/5.0 v/v LDPE/Sr4Al14O14: Eu2+,Dy3+ composite

130
350 400 450 500 550 600 650 700
0.000
0.005
0.010
0.015
0.020
406 nm
486 nm
PL In
tens
ity (a
.u.)
Wavelength (nm)
Gaussian fit 2 Gaussian fit 1 Main curve
Figure 6.2(d): Deconvolution of the PL spectrum of 97.0/3.0 v/v LDPE/Sr4Al14O14: Eu2+,Dy3+ composite
0 1 2 3 4 5
0.00
0.04
0.08
0.12
0.16
0.20 Major peaks Minor peaks
Inte
nsity
(a.u
.)
Phosphor concentration (volume %)
Figure 6.3: Concentration-dependence of the luminescence of LDPE/Sr4Al14O14: Eu2+,Dy3+
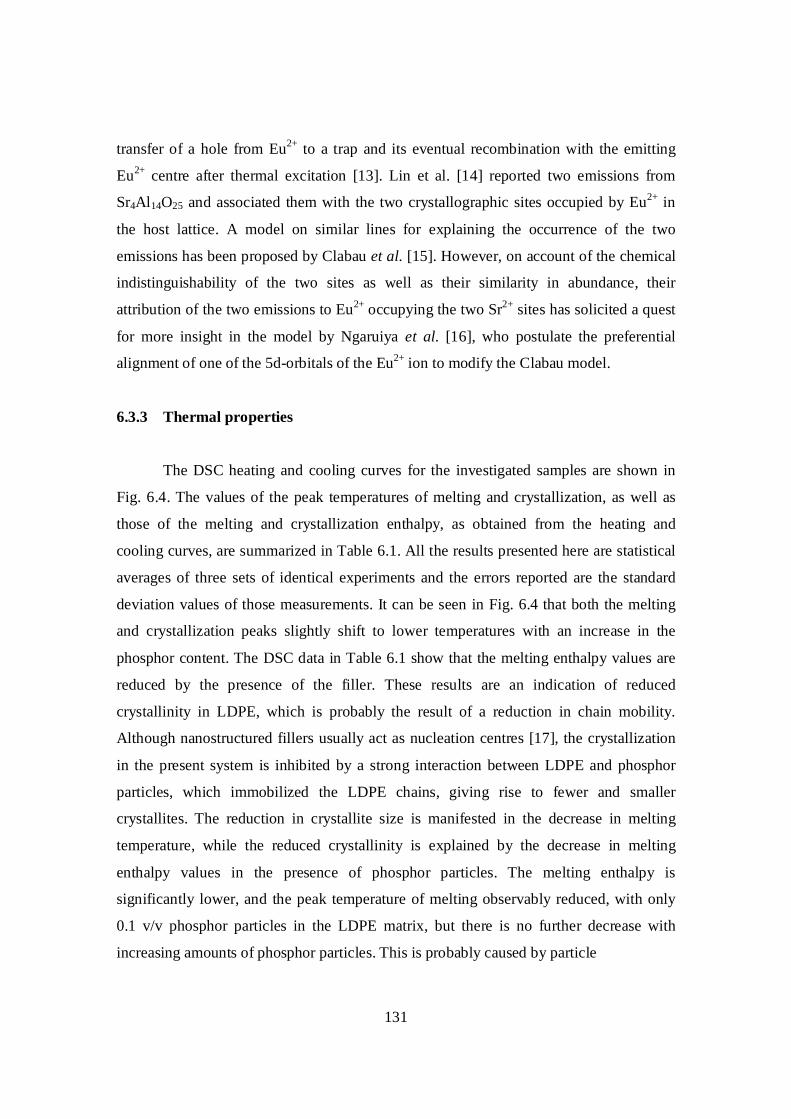
131
transfer of a hole from Eu2+ to a trap and its eventual recombination with the emitting
Eu2+ centre after thermal excitation [13]. Lin et al. [14] reported two emissions from
Sr4Al14O25 and associated them with the two crystallographic sites occupied by Eu2+ in
the host lattice. A model on similar lines for explaining the occurrence of the two
emissions has been proposed by Clabau et al. [15]. However, on account of the chemical
indistinguishability of the two sites as well as their similarity in abundance, their
attribution of the two emissions to Eu2+ occupying the two Sr2+ sites has solicited a quest
for more insight in the model by Ngaruiya et al. [16], who postulate the preferential
alignment of one of the 5d-orbitals of the Eu2+ ion to modify the Clabau model.
6.3.3 Thermal properties
The DSC heating and cooling curves for the investigated samples are shown in
Fig. 6.4. The values of the peak temperatures of melting and crystallization, as well as
those of the melting and crystallization enthalpy, as obtained from the heating and
cooling curves, are summarized in Table 6.1. All the results presented here are statistical
averages of three sets of identical experiments and the errors reported are the standard
deviation values of those measurements. It can be seen in Fig. 6.4 that both the melting
and crystallization peaks slightly shift to lower temperatures with an increase in the
phosphor content. The DSC data in Table 6.1 show that the melting enthalpy values are
reduced by the presence of the filler. These results are an indication of reduced
crystallinity in LDPE, which is probably the result of a reduction in chain mobility.
Although nanostructured fillers usually act as nucleation centres [17], the crystallization
in the present system is inhibited by a strong interaction between LDPE and phosphor
particles, which immobilized the LDPE chains, giving rise to fewer and smaller
crystallites. The reduction in crystallite size is manifested in the decrease in melting
temperature, while the reduced crystallinity is explained by the decrease in melting
enthalpy values in the presence of phosphor particles. The melting enthalpy is
significantly lower, and the peak temperature of melting observably reduced, with only
0.1 v/v phosphor particles in the LDPE matrix, but there is no further decrease with
increasing amounts of phosphor particles. This is probably caused by particle

132
80 90 100 110 1202.6
2.8
3.0
3.2
3.4
3.6
3.8
4.0
4.2
Endo
Nor
mal
ised
heat
flow
(W g
-1)
Temperature (oC)
100/0.0 v/v LDPE/phosphor 99.9/0.1 v/v LDPE/phosphor 99.0/1.0 v/v LDPE/phosphor 97.0/3.0 v/v LDPE/phosphor 95.0/5.0 v/v LDPE/phosphor
Figure 6.4(a): DSC heating curves of LDPE and LDPE/Sr4Al14O14: Eu2+,Dy3+
40 60 80 100 120 140 1600
1
2
3
4
5
Endo
Nor
mal
ised
heat
flow
(W g
-1)
Temperature (oC)
100/0.0 v/v LDPE/phosphor 99.9/0.1 v/v LDPE/phosphor 99/1.0 v/v LDPE/phosphor 97/3.0 v/v LDPE/phosphor 95/5.0 v/v LDPE/phosphor
Figure 6.4(b). DSC cooling curves of LDPE and LDPE/Sr4Al14O14: Eu2+,Dy3+

133
agglomeration. The actual nature of the polymer/phosphor interaction may be rooted in
the size effects of the nanoparticles. Phosphor synthesis methods that yield particles in
the micro or nano range, i.e., solid-state reaction or combustion techniques, are usually
high temperature procedures. Due to the high temperatures, many different agents are
prone to condensation on the particle while they cool down and are exposed to different
ambient atmospheres. These changes mean that complex surface chemical processes are
to be expected.
Table 6.1: DSC data of LDPE and LDPE/Sr4Al14O14: Eu2+,Dy3+
Hm and Hc - melting and crystallization enthalpies; Tm and Tc - peak temperatures
of melting and crystallization
Vol. %
phosphor
Tm / ºC H obsm / g-1 H cal
m /
J g-1
Tp,c/ ºC H obsc /Jg 1 H cal
c /
Jg-1
0.0 112.7 0.4 70.2 3.3 70.2 99.2 0.1 -60.7 1.2 -60.7
0.1 108.2 0.6 50.7 0.6 70.0 95.6 0.2 -54.5 2.1 -60.5
1.0 109.1 0.4 48.7 0.5 67.4 96.2 0.4 -50.8 0.3 -58.3
3.0 108.2 0.1 48.4 3.4 62.5 96.4 0.1 -47.2 3.2 -54.0
5.0 108.4 0.2 51.8 2.1 58.3 96.4 0.3 -48.7 2.0 -50.4
The TGA curves of pure LDPE and the LDPE/Sr4Al14O14: Eu2+,Dy3+ composites
with different phosphor contents are shown in Fig. 6.5. The incorporation of the phosphor
particles significantly improved the thermal stability of the LDPE matrix. The thermal
decomposition of LDPE is shifted towards higher temperatures by about 33°C in the
presence of the phosphor particles. For LDPE, the thermal degradation starts with free
radical formation at weak points or chain ends. The radicals then induce further chain
fragmentation processes followed by the transfer of the radicals to adjacent chains
through interchain actions [18]. The improved thermal stability can be explained through
the reduced mobility of the LDPE chains in the nanocomposite. Because of the reduced
chain mobility, the chain transfer reaction will be suppressed, and consequently the

134
degradation process will be slowed and decomposition will occur at higher temperatures.
Another possible reason is the difference between the thermal conductivity values of
LDPE (0.3 Wm-1K-1) and ceramics (3-150 Wm-1K-1). This wide difference in thermal
conductivity values, as well as the expected relatively higher heat capacities of ceramics,
may provide an alternative explanation for the improved thermal stability in
LDPE/phosphor composites similar to an observation made for LDPE/copper composites
[19]. In that case the shift in decomposition to higher temperatures was attributed to the
relatively higher heat capacity and thermal conductivity values of copper, which caused it
to preferentially absorb heat. It was also observed that after decomposition of the
composites, the residual mass is slightly higher than the original content of phosphor.
This observation is characteristic of polymers filled with inorganic particles [20].
100 200 300 400 500 6000
20
40
60
80
100
Endo
Mas
s (%
)
Temperature (oC)
95/5 v/v LDPE/phosphor 99/1 v/v LDPE/phosphor 100/0 v/v LDPE/phosphor
Figure 6.5: TGA curves for LDPE and LDPE/Sr4Al14O14: Eu2+,Dy3+
6.4 Conclusions
It has been demonstrated that various loadings of blue-emitting
Sr4Al14O25:Eu2+,Dy3+ phosphor can be incorporated into low density polyethylene
(LDPE) matrices. The results have highlighted the capacity of the polymer to act as a host

135
for the purpose of addressing the sensitivity to environmental factors such as moisture,
and hence enhancing the capability of the phosphor. The results are summarized as
follows:
1. XRD peaks display planes corresponding to the Sr4Al14O25 monoclinic phase.
2. The PL spectra have two sets of peaks, a major broad band peaking at about 486
nm and a minor one at a wavelength of about 412 nm, attributed to the 4f–5d
transitions of Eu2+.
3. The presence of phosphor particles in LDPE slightly reduced the crystallinity
but strongly improved the thermal stability of the polymer, attributed to
immobilization of polymer chains and the relatively higher thermal conductivity
and heat capacity of the phosphor.

136
6.5 References
1. Jia, W. Yuan, H. Lu, L. J. Cryst. Growth., 200: 179, (1999).
2. Blasse, G. Wanmaker, W.L. Bril, A. Philips Res. Rep., 23: 201, (1968).
3. Haranath, D. Shanker, V. Chander, H. Sharma, P. J. Phys. D: Appl. Phys., 36: 2244,
(2003).
4. Nag, A.T.R. Kutty, N.J. J. Alloys Comp., 354: 221, (2003).
5. Peng, M. Pei, Z. Hong, G. Su, Q. Chem. Phys. Lett., 371(1-2): 1, (2003).
6. Holsa, J. Hogne, J. Lastusaari, M. Niittykoski, J. J. Alloys Comp., 323-324: 326,
(2001).
7. Matsuzawa, T. Aoki, Y. Takeuchi, N. Murayama, Y. J. Electrochem. Soc., 143:
2670, (1996).
8. Yen, W.M. Shionoya, S. Yamamoto, H. Practical Applications of Phosphors, 2nd
Ed., CRC, London, (2006).
9. Tsutai, I. Shimizu, H. Kawakami, T. Shinbo, K. Kato, K. Kaneka, F. Ohta, M. Tech.
Rep. of IEICE CPM., 13: 95, (1995).
10. Katsumata, T. Kasajima, K. Nabe, T. Komuro, S. Morikawa, T. J. Am. Ceram. Soc.,
81: 413, (1998).
11. Lin, Y. Zhang, Z. Zhang, F. Tang, Z. Chen, Q. Mater. Chem. Phys., 65: 103,
(2000).
12. Geng, J. Wu, Z. J. Mater. Synth. Proc., 10: 245, (2002).
13. Kato, K. Tsutai, I. Kamimura, T. Kaneko, F. Shinbo, K. Ohta, M. Kawakami, T. J.
Lumin., 82: 213, (1999).
14. Lin, Y. Tang, Z. Zhang, Z. Mater. Lett., 51: 14, (2001).
15. Clabau, F. Rocquefelte, X. Jobic, S.M. Deniard, P. Whangbo, M.H. Garcia, A.
Mercier, T.L. Chem. Mater., 17: 3909, (2005).
16. Ngaruiya, J.M. Nieuwoudt, S. Ntwaeaborwa, O.M. Terblans, J.J. Swart, H.C.
Mater. Lett., 62: 3192, (2008).
17. Ning, N.Y. Yin, Q.J. Luo, F. Zhang, Q. Du, R. Fu, Q. Polym., 4: 7374, (2007).
18. Allen, N.S. Edge, M. Fundamentals of Polymer Degradation and Stabilization, 2nd
Ed., Elsevier, London, (1992).

137
19. Luyt, A.S. Molefi, J.A. Krump, H. J. Polym. Degrad. Stab., 91: 1629, (2006).
20. Dragana, S. Zoran, V.S. Nikola, C. Milena, M. Jovan, M.N. Chem. Phys. Lett., 329:
168, (2000).

138
Chapter 7 Characterization of Luminescent and Thermal Properties of
Long Afterglow SrAlxOy:Eu2+,Dy3+ Phosphor Synthesized by Combustion Method
7.1 Introduction
The special long afterglow phenomena [1] in rare earth-doped phosphors as well as
high quantum efficiency in the visible region [2] have significantly motivated research on
this class of materials. The suitability of strontium aluminate (SrAl2O4) as a host is on
account of its efficiency, as well as its capacity for broad band emissions [3]. Doped with
Eu2+, it provides typical emission bands in the blue and green regions of the
electromagnetic spectrum. The phosphorescence of Eu2+ in most hosts is believed to be
caused by the 4f65d1→4f7 transition. The peak position in the emission spectra strongly
depends on the nature of the Eu2+ surroundings, and therefore Eu2+ ion can emit different
visible wavelengths in various crystal fields. Its luminescence spectra have emission
wavelengths extending from the UV to the red portions of the spectrum [1,4]. The
afterglow lifetime and intensity of these phosphors can be enhanced by co-doping with a
second rare-earth ion [5] such as Dy3+. These phosphors exhibit a rapid initial decay from
the Eu2+ ion followed by a long persistence due to the Dy3+ ion when it acts as a trap for
holes [6,7].
Over the years, the variety of methods that have been employed in the synthesis of
SrxAlyOz:Eu2+,Dy3+ phosphors have included co-precipitation [8], sol–gel [1] microwave
[9] solid-state reaction [10], detonation [11], and combustion synthesis techniques [12].

139
The combustion process has distinguished itself as a safe, instantaneous and energy
saving technique due to the possibility of using relatively low temperatures and the short
duration of the reaction process. Its other advantages include the use of relatively simple
equipment, formation of high-purity products, stabilization of metastable phases, and
formation of virtually any size and shape of products.
The class of strontium aluminate phosphors has widely been investigated due to its
several advantages over other phosphors. However, degradation of these phosphors due
to weak resistance to water or even moisture remains an unresolved issue. This lack of
resistance originates in the nature of the structure of the low temperature phase of
SrAl2O4. SrAl2O4 belongs to the distorted stuffed tridymite type structure, which adopts
the monoclinic structure (space group P21, a = 8.447, b = 8.816, and c = 5.163 Å) that
consists of a three-dimensional network of corner-sharing AlO4 tetrahedron containing
connected open channels [13,14]. Water molecules can enter the channels, and the strong
polarity of the water breaks the bonds of O–Sr–O [17]. Consequently, the
SrAl2O4:Eu2+,Dy3+ phosphor is inclined to hydrolyze and deteriorate. Various
intervention techniques have been attempted, to varying degrees of success in terms of
cost effectiveness and side effect on phosphor output. Currently, SiO2 [16], Al2O3 [17],
SrF2 [18], BN [16] compounds, and organic ligands [19] are being used for
encapsulation. Other efforts involve the use of inorganic layers for phosphor
encapsulation and surface treatment using phosphoric acid (H3PO4) in ethanol [20]. These
approaches involve complex processes that require elaborate equipment, but still tend to
compromise the luminescence intensity of the phosphors.
In the work reported here, the combustion synthesis method was used to prepare
nanophase SrAlxOy:Eu2+,Dy3+ phosphor powders, which were subsequently mixed in
low-density polyethylene (LDPE). Results indicate the dominance of the low-temperature
monoclinic phase of SrAl2O4 in the synthesized phosphor powder. The
photoluminescence intensity as well as afterglow of the obtained phosphor compares well
with that of commercial powders.

140
The work presented in this chapter is intended to assess the performance of the
polymer/phosphor composite system, as a precursor to the determination of a strong and
stable composite network, with a view to addressing environmental factors, such as
moisture, that may compromise phosphor potency.
7.2 Experimental
Strontium aluminate phosphor (SrAlxOy:Eu2+,Dy3+) was prepared by a combustion
synthesis method. High purity (Aldrich make, 99.99%) raw materials, strontium nitrate
(Sr(NO3)3.4H2O), aluminum nitrate (Al(NO3)2.9H2O), europium nitrate
(Eu(NO3)3.6H2O), dysprosium nitrate (Dy(NO3)3.5H2O) and urea (CO(NH2)2), were used
for preparation of the charge. The materials were weighed in stoichiometric ratios and
mixed thoroughly in an agate mortar. The precursors for each phosphor were mixed and
milled in a mortar using a pestle and the resulting thick white paste was transferred into a
china crucible, which was then introduced into a muffle furnace maintained at 500 oC.
This synthesis technique makes use of the heat energy liberated by the redox exothermic
reaction between metal nitrates and urea at a relatively low igniting temperature (500 oC).
Urea serves as the source of carbon and hydrogen, which on combustion form carbon
dioxide and water, and liberate heat. It also forms complexes with the metal ions
facilitating homogeneous mixing of the cations. Urea’s popularity as a fuel in combustion
techniques is probably due to its ready availability and high exothermicity.
The surface morphology and elemental composition of the phosphor powders
were investigated using a Shimadzu Superscan SSX-550 electron microscope (SEM)
coupled with an energy dispersive x-ray spectroscope (EDS). For SEM measurements,
the probe size was 3.0 nm, the probe current 0.02 nA, and the accelerating voltage 5.0
keV. The probe size for EDS analysis was 4 nm, specimen current 1.00 nA, and
accelerating voltage 15.0 keV. Phase and crystallinity were investigated by powder XRD
using a Bruker D8 (Bruker Co., Germany) x-ray diffractometer with CuK ( = 1.5406
Ǻ). For microstructure and crystallinity analysis using a transmission electron microscope
(TEM), sample preparation involved suspending particles in ethanol by ultrasonification

141
and drying a drop of the suspension on a carbon-coated copper grid. A JEOL JEM-2100
transmission electron microscope operating at 200 kV was employed for this
investigation. The system is available at the CSIR nanomaterials laboratory. The
photoluminescence (PL) excitation and emission spectra were taken on a Cary Eclipse
fluorescence spectrophotometer equipped with a monochromatic xenon lamp. Each
sample was loaded into a circular holder and excited with 340 nm radiation from a pulsed
xenon lamp. The emission spectra were scanned in the range of wavelengths from 360 to
750 nm. To measure the excitation spectra, the analyzer monochromator was set to the
maximum wavelength of the emission spectra and then an excitation monochromator was
scanned in the range of 250 to 450 nm. The same system (Cary Eclipse) was used to
investigate the phosphorescence decay curves of the phosphors in air at room
temperature.
Polymer/phosphor composites were prepared by mechanically mixing the
synthesized phosphor powder with low-density polyethylene (LDPE) (supplied by Sasol
Polymers, South Africa, melt flow index 2.0 g/10 min, melting point 110ºC, and density
0.922 g cm-3). Samples, containing phosphor volume ratios ranging from 0.4% to 10%,
were weighed according to the required ratios and mixed using a volume of 50 cm3 in a
Brabender Plastograph mixing chamber at a speed of 30 rpm for 15 minutes. The mixing
was carried out at 160 °C. The samples were hot melt-pressed into slabs of average
thickness 0.98 ± 0.05 mm, at 160 °C.
A Perkin-Elmer DSC7 differential scanning calorimeter, under flowing nitrogen
(20 mL min-1), was employed for the DSC analyses. The system is interfaced to a
computer, which was used for calculations by means of Pyris software. Samples of
masses ranging from 7 to 10 mg were sealed in aluminum pans and heated from 25 to
160 °C at a heating rate of 10 °C min-1, and immediately cooled at the same rate to 25 °C.
For the second scan, the samples were heated and cooled under the same conditions.
Peak temperatures of melting and crystallization, as well as melting and crystallization
enthalpies, were determined from the second scan. Thermogravimetric analyses (TGA)
were performed in a Perkin-Elmer TGA7 thermogravimetric analyzer in a flowing

142
nitrogen atmosphere (20 mL min-1). The samples, each having a mass between 6 and 10
mg, were heated from 25C to 600C at a rate of 10 C min-1. For both DSC and TGA
analyses three measurements were performed on each sample composition, from which
average temperature and enthalpy values were calculated.
7.3 Results and discussion
The representative SEM micrographs of SrAlxOy:Eu2+Dy3+ phosphor for 3000×
and 6000× magnifications are shown in Fig. 7.1. The characteristic foamy
Figure 7.1: (a) SEM images of the SrAlxOy:Eu2+,Dy3+ sample having a 1:2 molar ratio of Eu2+:Dy3+ with (a) 3000 magnification (b) 6000 magnification
structure that reflects the inherent nature of the reaction is clearly visible. Results for the
elemental analysis by EDS are shown in Fig. 7. 2 which, apart from the carbon that
originates from the sample-holding tape, displays the presence of the expected elements,
i.e., oxygen, aluminum, and strontium, in proportions commensurate with the initially
measured masses.
Fig. 7.3 shows the powder XRD patterns for the SrAlxOy:Eu2+,Dy3+ with low and high
Dy(NO3)3 concentrations. The monoclinic phase diffraction peaks of SrAl2O4 are
dominant in these patterns and match well with SrAl2O4 standard values given in the
International Centre for Diffraction Data (ICDD) No. 34-0379 files. However, there are
also a few other peaks, which may be ascribed to impurities such as SrAl12O19, or

143
0 2 4 6 8 10
0
10
20
30
40
50
60
O
% (Weight) C: 14.1 O: 47.6Al: 21.5Sr: 10.9Dy: 5.8
Al
Dy
SrC
Cou
nts (
a.u.
)
Energy (KeV)
Figure 7.2: Point EDS results of the SrAlxOy:Eu2+,Dy3+ sample having a 1:2 molar ratio of Eu2+:Dy3+
Figure 7.3(a): XRD patterns at two dopancy levels of the synthesized SrAlxOy: Eu2+,Dy3+ powder and [Inset: XRD pattern of a commercial phosphor]

144
unreacted precursor powders [21]. The effect of the doped rare-earth active ions Eu2+ and
Dy3+ on the basic crystal structure of the end product is negligible. The average crystallite
sizes were calculated using powder x-ray diffraction data by means of the Debye-
Scherrer equation (6.1),
D = K/cos, (6.1)
where D is the average diameter of the particles, K is the Scherrer constant equal to 0.89,
is the wavelength of the CuK radiation = 1.5406 nm, is the corrected full width at
half-maximum (FWHM), and is the Bragg angle. The calculated average crystallite
sizes of the phosphor powder vary between 34 7 and 43 7 nm. The XRD patterns of
Figure 7.3(b): XRD patterns of LDPE/SrAlxOy:Eu2+,Dy3+ composites for the 1:2 molar ratio sample
the pure LDPE and LDPE/phosphor composites over diffraction angles of 10 2 68
are shown in Fig. 7.3(b). The origin of the prominent peak at 21, which dwarfs the peaks
corresponding to the phosphor planes, is clearly that of the LDPE polymer matrix.
Otherwise, and particularly for the 10% concentration spectrum, peaks corresponding to
the planes of the phosphor are clearly discernible, indicating that the absence of the

145
expected phosphor peaks in the other spectra is due to their low concentrations. It is
observed that as the phosphor concentration increases, there are no changes in the peak
positions. Thus the introduction of the phosphor in LDPE did not alter the crystal
structure of the polymer.
Figure 7.4: TEM micrographs of the SrAlxOy:Eu2+,Dy3+ samples having, (a) 1:0.3 molar ratio (b) 1:10 molar ratio of Eu2+:Dy3+
Transmission electron microscopy is capable of providing useful information
regarding the local structure and particle size of a material. It is therefore an apt tool for
investigating the current material in view of the various possible aluminate phases that
can result from the synthesis process, as well as the crystallographic transformation from
the high temperature hexagonal phase to the low temperature monoclinic phase, which
occurs at about 650 C. The representative high-resolution transmission electron
micrographs (HRTEM) for the low and high Dy concentration samples, are shown in Fig.
7.4(a) and (b). In HRTEM imaging the spacing of a set of fringes is proportional to the
lattice spacing when the corresponding lattice planes meet the Bragg condition. In this
study the value of the interplanar spacing, calculated from the visible fringes (Fig.
7.4(a)), was found to be 1.25 nm. The clarity of the micrographs shows that the

146
synthesized SrAlxOy:Eu2+Dy3+ phosphor crystallizes almost in single phase and the
presence of secondary phases is minimal. This result is supportive of the XRD results,
which point to the dominance of the monoclinic () phase in the synthesized product.
The differences in intensity may be attributed to variations in particle sizes, which occur
on the nanometre scale.
Figure 7.5: Excitation spectra of SrAlxOy:Eu2+, Dy3+, for the samples with 1:0.3 to 1:10 molar ratio of Eu2+:Dy3+
The excitation and emission spectra for SrAlxOy:Eu2+,Dy3+ with various Dy3+
concentrations are shown in Figs. 7.5 and 7.6, respectively. The excitation spectra show
one broad band from 255 to 375 nm with a shoulder at about 375 nm corresponding to
the crystal field splitting of the Eu2+ d-orbital. The prepared phosphor compositions
exhibit emission in the green region. This is a strong indication that the Eu ion is in a
divalent (Eu2+, green emission) rather than trivalent (Eu3+, red emission) state. It is to be
noted that this result was obtained in the absence of any deliberately designed reducing
environment. The emission band is symmetrical at about 515 nm which is attributed to
the typical 4f65d1→4f7 transition of the Eu2+ ion. The 515 nm emission wavelength
indicates the dominance of the monoclinic, green-emitting phase of the aluminate

147
phosphor. Two other, minor peaks, at 615 and 683 nm indicate the presence of more than
one luminescent centre and may be due to remnants of Eu3+ ions as a result of incomplete
reduction during sample preparation [22]. The emission spectra have the highest intensity
for a Eu2+:Dy3+ mole ratio of 1:2. According to Lin and Tang [23], under UV irradiation,
an Eu2+ ion, which is placed at a specific energy level of the 4f7(8S7/2) ground state
Figure 7.6(a): Emission spectra of SrAlxOy:Eu2+,Dy3+, for the samples with 1:0.3 to 1:10 molar ratio of Eu2+:Dy3+
between the valence and conduction bands, is excited and an electron-hole pair is created.
The excited electron is transferred to the 4f65d1 excited state while the hole is transferred
to the valence band. After removing the UV exposure source, the excited electron tends
to stay at a lower energy level. Energy decrease may have occurred in two steps; firstly
releasing part of the energy (usually thermally) after relaxing to the metastable state,
followed by transferring electrons from the metastable state to the ground state while
recombining with the hole accompanied with light emission. However, there is a
probability that after the initial transition, energy can be trapped in lattice defects or
impurities. The long-lasting persistence afterglow of the phosphors arises from these
processes. The observed reduction in emission intensity above the 1:2 molar ratio may

148
Figure 7.6(b): Emission spectra of LDPE/SrAlxOy:Eu2+,Dy3+ composites for different concentrations of the phosphor sample with 1:2 Eu2+,Dy3+ molar ratio
Figure 7.7: Emission intensity of the SrAlxOy:Eu2+,Dy3+ phosphor at 515 nm as a function of Eu2+:Dy3+ molar ratio; excitation = 340 nm

149
be explained in terms of the existence of a critical (optimum) number of Dy3+ ions for
luminescence emission. On exceeding this number, the ions produce more crystalline
defects apart from the traps. These defects neutralize the electron-hole recombination
processes, thereby reducing the emission intensity as well as traps responsible for the
long persistence.
The PL emission spectra for three phosphor concentrations in LDPE are shown in
Fig. 7.7. Except for a slight red-shift, as phosphor concentration increases, the emission
spectra generally replicate the phosphor powder emission behaviour. At the higher
phosphor concentration, particle agglomeration is possible and may lead to the reduction
in the kinetic energy of the electrons, resulting in a reduced band gap. A smaller band gap
would require less energy to excite the phosphor and hence lead to the emission
maximum shifting to longer wavelengths [9].
Figure 7.8: Decay curves for the phosphor SrAlxOy:Eu2+,Dy3+ samples with 1:0.3 to 1:10 molar ratio of Eu2+:Dy3+

150
In similar work by Mothudi et al. [24], a broad emission spectrum of
SrAl2O4:Eu2+, Dy3+ phosphor powder, is observed to be symmetrical at 528 nm with an
additional peak at 685 nm. Nsimama et al. [25], working on thin films of commercial
SrAl2O4:Eu2+,Dy3+ phosphor, also report the observation of two peaks, but at 517 and 630
nm respectively, while the maximum broad-band of the UV excited luminescence
spectrum of the SrAl2O4:Eu, Dy sample, synthesized using the sol-gel process by Peng et
al. [1] appears at 506 nm. These observations clearly illustrate the variability in the peak
position that can be obtained for similar phases. These differences may be explained in
terms of crystallite sizes. Due to the proximity of the 5d energy level to the conduction
band, changes in particle size may change the size of the band gap such that there is a
corresponding change in the 5d energy level. Since particle size seems to significantly
influence the 4f7–4f65d electric dipole-allowed transitions originating from Eu2+-doped
alkaline-earth aluminate hosts [26], these transitions may form the basis for the variations
in the emission wavelengths observed by the various authors.
The phosphorescence decay characteristics of the SrAlxOy:Eu2+,Dy3+ phosphor
samples for various Dy3+ concentrations are shown in Fig. 7.8. Results for fitted decay
curves of the phosphor are recorded in table 7.1. The decay phenomenon is very useful in
the study of traps. The results show that the initial luminescent intensity and the decay
time of afterglow of the samples are different from each other. By increasing the Dy3+
concentration, the initial luminescent intensity changed such that the sample with the
intermediate Dy3+ concentration (1:2 Eu2+:Dy3+ ratio) has the highest initial intensity and
longest decay time. The high initial intensity is attributed to the presence of a sufficient
number of shallow traps and the ensuing rapid decay is ascribed to the short survival time
of an electron in Eu2+. The deep trap energy centres of Dy3+ [26] could be responsible for
the very long-lasting decay times. Samples with lowest and highest concentrations of
Dy3+ (10:3 and 1:10) have lower initial intensity values and short-lived afterglow due to a
lack of adequate numbers of both shallow and deep traps. Other than for the sample with
the highest Dy3+ concentration (1:10), whose curve may only be fitted by a second order
equation, the other decay times can be calculated by a curve fitting technique based on
the third order exponential decay equation (7.2),

151
33
22
11 expexpexp
tAtAtAI , (7.2)
where I is the phosphorescence intensity at any time t after switching off the excitation
illumination; A1, A2, and A3 are constants; τ1, τ2, and τ3 are decay times for the exponential
components, corresponding to the fast, medium and slow afterglow processes,
respectively. It is observed that the initial fast decay process is missing from the sample
with the highest Dy3+ concentration (1:10 molar ratio) in line with the quenching results
displayed in the PL spectra.
The DSC heating curves for LDPE and its phosphor composites are shown in Fig.
7.9. The curves show endothermic peaks at about 116 C. There is a slight shift in
melting peaks to lower temperatures with an increase in the phosphor content. The peak
Table 7.1: Results for fitted decay curves of the SrAlxOy:Eu2+,Dy3+ phosphor
Sample (Eu2+: Dy3+) 10:3 10:4 10:7 1:2 1:6 1:10
Component Half life times (s)
Fast ( 1 ) 0.037 0.085 0.328 0.434 0.095 0.155
Medium ( 2 ) 0.316 0.432 1.344 2.216 0.429 1.470
Slow ( 3 ) 2.313 2.559 3.573 4.644 2.419 -
temperatures of melting (Tp,m), as well as the experimental (H obsm ) and calculated
(H calm ) melting enthalpies, are summarized in Table 7.2. The comparison between the
observed and expected enthalpies shows higher than expected enthalpy values for all the
composites except for the 0.4% sample. The relative difference between the experimental
and calculated enthalpies increases with increasing phosphor content. This result may be
explained in terms of the relatively amorphous nature of LDPE. Since the phosphor
particles will be situated in the amorphous part of the polymer matrix, and because LDPE
has a relatively low crystallinity, this may be explained through epitaxial crystallization
on the phosphor surfaces giving rise to more crystallites in the presence of the phosphor.
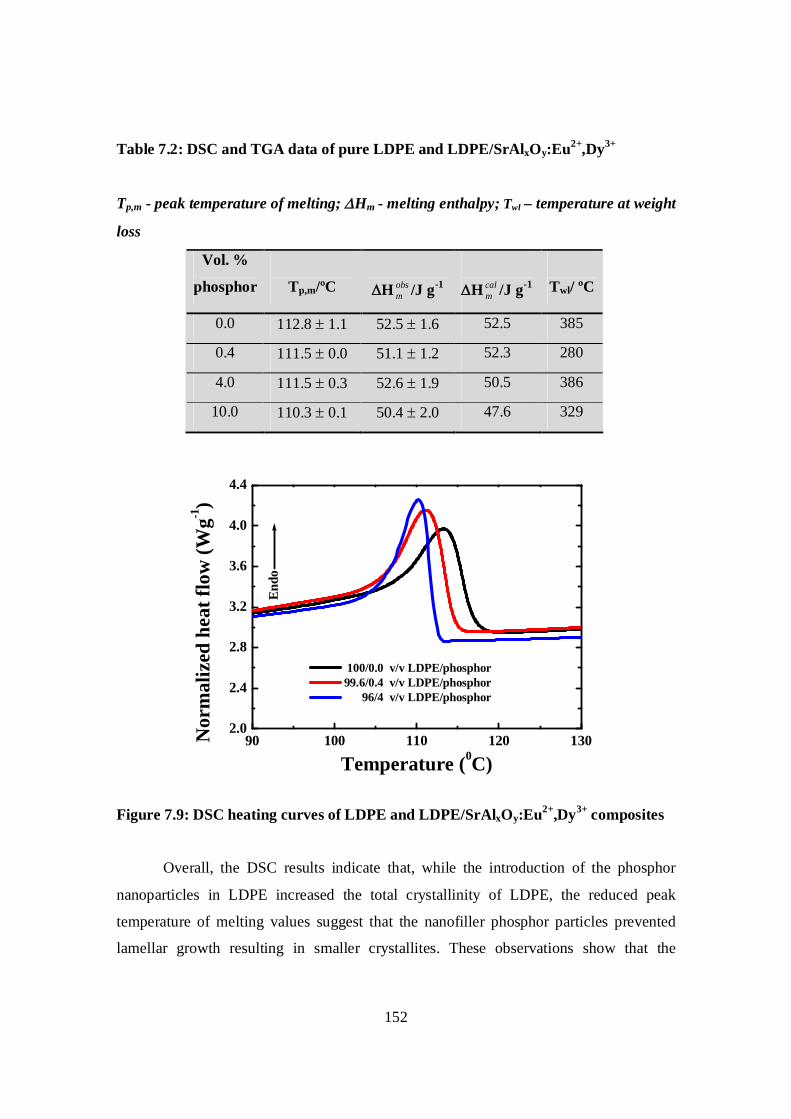
152
Table 7.2: DSC and TGA data of pure LDPE and LDPE/SrAlxOy:Eu2+,Dy3+
Tp,m - peak temperature of melting; Hm - melting enthalpy; Twl – temperature at weight
loss
Vol. %
phosphor
Tp,m/ºC
H obsm /J g-1
H calm /J g-1
Twl/ ºC
0.0 112.8 1.1 52.5 1.6 52.5 385
0.4 111.5 0.0 51.1 1.2 52.3 280
4.0 111.5 0.3 52.6 1.9 50.5 386
10.0 110.3 0.1 50.4 2.0 47.6 329
90 100 110 120 1302.0
2.4
2.8
3.2
3.6
4.0
4.4
Endo
100/0.0 v/v LDPE/phosphor 99.6/0.4 v/v LDPE/phosphor 96/4 v/v LDPE/phosphor
Nor
mal
ized
hea
t flo
w (W
g-1)
Temperature (0C)
Figure 7.9: DSC heating curves of LDPE and LDPE/SrAlxOy:Eu2+,Dy3+ composites
Overall, the DSC results indicate that, while the introduction of the phosphor
nanoparticles in LDPE increased the total crystallinity of LDPE, the reduced peak
temperature of melting values suggest that the nanofiller phosphor particles prevented
lamellar growth resulting in smaller crystallites. These observations show that the

153
phosphor particles acted as nucleating agents in the LDPE/SrAlxOy:Eu2+,Dy3+ phosphor
system.
The TGA curves (Fig. 7.10) of the pure LDPE and LDPE/SrAlxOy:Eu2+,Dy3+
phosphor composites show a one-step weight loss between 400 and 500 oC. The curves
show residual masses that correspond well with the amounts of the initially added
components. Changes in the thermal stability of LDPE, with increase in phosphor content,
can be deduced from the slight shifts in the curves as well as the variation in the values of
the temperature at 10% weight loss. These results show that the phosphor nanoparticles
generally catalyzed the degradation of LDPE, which is contrary to the findings by other
authors on the effect of inorganic fillers on the thermal stability of polymers. Luyt et al.
[27] observed improved thermal stability of copper nanoparticles-filled LDPE
nanocomposites. A similar conclusion was arrived at by Mbhele et al. [28] in their work
on silver-filled polyvinyl alcohol.
200 300 400 500 600
0
20
40
60
80
100
0.0 %3.7 %8.8 %
Wei
ght (
%)
Temperature (0C)
100/0.0 v/v LDPE/phosphor 99.6/0.4 v/v LDPE/phosphor 96/4 v/v LDPE/phosphor 90/10 v/v LDPE/phosphor
Figure 7.10: TGA curves for pure LDPE and LDPE/SrAlxOy:Eu2+,Dy3+

154
7.4 Conclusions
SrAlxOy:Eu2+,Dy3+
phosphor powders have been synthesized by a combustion
synthesis method. The relative amounts of Eu2+ and Dy3+ affected the luminescence
properties of the phosphor. Emission spectra at room temperature have a major broad
band peaking at 515 nm and minor ones at 615 and 683 nm. The broad-band spectra
manifest the occurrence of transitions between the 5d and 4f orbital gaps of Eu2+. The
broad emission spectra are indicative of the good quality of the samples. Investigation on
the variation of emission intensity of different phosphor samples containing different
amounts of Dy3+ revealed that after 2 mol% of Dy3+ concentration, a quenching process
occurred. Dy3+ formed trap levels and the results demonstrated that the initial, relative
intensity as well as decay time were optimized for the 2 mol% concentration of Dy3+.
Improvements in the initial brightness, quenching thresholds and the afterglow times, are
attributed to the presence of both shallow and deep traps. The XRD peaks as well as the
emission wavelength of the major peak (515 nm) are indicative of the dominance of the
monoclinic crystal system in the phosphor powder. The introduction of the phosphor in
LDPE did not structurally alter the polymer, but as the phosphor concentration increased.
On the other hand, the polymer permitted replication of the emission PL peak positions of
the phosphor. Thermal analysis shows that the phosphor nanoparticles acted as nucleating
agents and improved the overall crystallinity in the LDPE matrix.

155
7.5 References
1. Peng, T. Huajun, L. Yang, H. Yan, C. Mater. Chem., Phys., 85: 68, (2004).
2. Fu, Z. Zhou, S. Yu, Y. Zhang, S. Chem. Phys. Lett., 395: 285 (2004).
3. Suematsu, H. Sengiku, M. Kato, K. Mitome, M. Kimoto, K. Matsui, Y. Jiang, W.
Yatsui, K. Thin solid Films., 407: 136, (2002).
4. Aitasulo, T. Dereń, P. Hölsä, J. Jungner, H. Krupa, J.C. Lastusaari, M.
Legendziewicz, J. Niittykoski, J. Strek, W. J. Sol. State Chem., 171: 114, (2003).
5. Sakai, R. Katsumata, T. Komuro, S. Morikawa, T. J. Lumin., 85: 149, (1999).
6. Katsumata, T. Toyomane, S. Sakai, R. Komuro, S. Morikawa, T. J. Amer. Ceram.
Soc., 89: 932 (2006).
7. Ngaruiya, J.M. Nieuwoudt, S. Ntwaeaborwa, O.M. Terblans, J.J. Swart, H.C.
Mater. Lett., 62: 3192, (2008).
8. Lin, Y.H. Zhang, Z.T. Zhang, F. Tang, Z.L. Chen, Q.M. Mater. Chem., Phys., 65:
103, (2000).
9. Ravichandran, D. Johnson, S.T. Erdei, S. Roy, R. White, W.B. Displays., 19: 197,
(1999).
10. Sarkisov, P.D. Popovich, N.V. Zhelnin, A.G. Glass Ceramics, 60 (9-10):, 309,
(2003).
11. Li, X. Qu, Y. Xie, X. Wang, Z. Li, R. Mater. Lett., 60: 3673, (2006).
12. Chander, H. Haranath, D. Shanker, V. Sharma, P. J. Cryst. Growth., 271: 307,
(2004).
13. Han, S.D. Singh, K.C. Cho, T.Y. Lee, H.S. Jakhar, D. Hulme, J.P. Han, C.H. Kim,
J.D. Chun, I.S. Gwak, J. J. Lumin., 128: 301, (2008).

156
14. Glasser, F.P. Glasser, L.S.D. J. Am. Ceram. Soc., 46: 377 (1963).
15. Lin, J. Huang, Y. Zhang, J. Shi, F.J. Wei, S.Y. Gao, J.M. Huang, Z.X. Ding, X.X.
Tang, C.C. Mater. Chem. Phys., 108: 440, (2008).
16. Masumi, I. Hidehiko, K. Takuya, O. Tomoya, S. JP. Patent, 316, 433 (1997).
17. Lu, X.D. Zhong, M.J. Shu, W.G. Yu, Q.M. Xiong, X.Q. Wang, R.Q. Powder
Technol., 177(2): 83, (2007).
18. Guo, C.F. Luan, L. Huang, D.X. Su, Q. Lu, Y.H. Mater. Chem. Phys., 106: 268,
(2007).
19. Wu, S.L. Zhang, S.F. Liu, Y. Yang, J.Z. Mater. Lett., 61: 3185, (2007).
20. Zhu, Y. Zeng, J. Li, W. Xu, L. Guan, O. Liu, Y. Appl. Surf. Sci., 255: 7580, (2009).
21. Park, J.K. Lim, M.A. Kim, C.H. Park, H.D. Appl Phys Lett., 82: 683 (2003).
22. Clabau, F. Rocquefelte, X. Jobic, S. Denieard, P. Whangbo, M.H. Garcia, A.
Mercier, T. Solid State Sci., 9: 608, (2007).
23. Lu, Y. Li, Y. Xiong, Y. Wang, D. Yin, Q. Microelectron, J., 35: 379, (2004).
24. Mothudi, B.M. Ntwaeaborwa, O.M. Botha, J.R. Swart, H.C. Phys. B., 404: 4440,
(2009).
25. Nsimama, P.D. Ntwaeaborwa, O.M. Coetsee, E. Swart, H.C. Phys. B., 404: 4489,
(2009).
26. Chen, X.Y. Ma, C. Li, X.X. Shi, C.W. Li, X.L. Lu, D.R. J. Phys. Chem. C., 113:
2685, (2009).
27. Luyt, A.S. Molefi, J.A. Krump, H. Polym. Degrad. and Stab., 91: 1629, (2006).
28. Mbhele, Z.H. Salemane, M.G. Sittert, C.G.C.E. Nedeljkovic, J.M. Djokovic, V.
Luyt, A.S. Chem. Mater., 15: 5019 (2003).

157
Chapter 8 Temperature Dependence of the Structural and
Luminescent Properties of Long-lasting Afterglow SrAlxOy:Eu2+,Dy3+ Phosphor
8.1 Introduction
Phosphors synthesized from rare-earth metal ions have continued to be deeply
studied and put to wide applications since 1964, when europium doped yttrium vanadate
(YVO4:Eu3+) was successfully proposed as a red phosphor for colour television tubes [1]
and later also for luminescent lamps. This was the start of the nowadays overwhelming
role of rare-earth ion luminescence in commercial phosphors [2]. This extensive interest
has been inspired by both current and very promising potential applications of these
phosphors due to qualities such as high quantum efficiency, anomalous long
phosphorescence, and good stability [3,4].
For example, for scintillator applications, innumerable host lattices containing
rare-earth ions as luminescent activators have been investigated because the 4f5d
transitions of these ions are parity-allowed, yielding fast optical transitions that are highly
desirable in these applications. The fast relaxation is attributed to the ions’ favourable
energy configuration within the host lattice whereby the 4f and lowest 5d levels reside

158
within the normally forbidden crystalline band gap. Transfer of energy from radiation-
induced electron-hole pairs to the luminescent ion is usually quite efficient, although
quenching due to non-radiative electronic transitions may limit the overall luminescence
efficiency of the phosphor [2]. A strong mechanoluminescent property, which can be
utilized in the visualization of stress distribution and other mechano-optical devices, has
also been reported by various authors [5]. In another example, thermographic phosphors
have been extensively explored for remote temperature sensing measurements due to
their accurate sensing capability over a wide range of temperatures, as well as their
ability to withstand a harsh environment. This is exemplified in europium-doped yttrium
oxide (Y2O3: Eu), which has been utilized for high temperature sensing within a rotating
gas turbine [6,7], and managanese-doped magnesium fluorogermanate
(Mg4(F)GeO6:Mn), which has been explored for thermal mapping of hotspots on the
walls of a cryogenic fuel tank [8]. Problems associated with temperature-monitoring
within a magnetic resonance imaging (MRI) scanner, particularly to an infant or a
critical-care patient, has provided an impetus for the development of a phosphor-based
optical sensor for human skin temperature sensing (27–37 C) [9] within such an
environment.
In particular, rare-earth metal ions doped strontium aluminate phosphors, e.g.
SrAl2O4: Eu2+,Dy3+, have attracted great interest for applications in the lamp, the cathode-
ray tube (CRT), and the plasma display panel (PDP) due to their non-radiation and bright
luminescence characteristics. One of the prominent applications of these phosphors is in
the production of flat display panels (FDP), particularly plasma display panels (PDPs).
FDP’s are being successfully developed to replace the cathode-ray tube displays (CRTs)
due to their capacity for faster response, wider viewing angle, larger screen, lower energy
consumption, and higher scalability [10]. However, there still remain issues affecting
operational parameters such as luminescence efficiency, stability against temperature,
high colour purity, and perfect decay time that need to be resolved.
The solid-state reaction process has been used both intensively and extensively
for phosphor synthesis, but this process often results in poor homogeneity and requires

159
high calcinating temperature. In addition, the slow diffusion processes in the solid-state
reactions require the use of fluxing agents, like B(III) ions, to reduce the synthesis
temperature in order to favour the formation of the monoclinic phase and avoid the
stabilization of the hexagonal one. To increase the efficiency of light-emitting materials,
new principles and methods of synthesis are used, in particular, the sol-gel method. Due
to the easier composition control, better homogeneity, and low processing temperature,
the sol–gel technique is a more suited approach for synthesizing fine phosphor powders.
These advantages have led to greater use of this technique [11–13].
The great application potential of the temperature-dependence behaviour of
aluminate luminescent materials gets compromised by the delicate nature of this property.
Hence, it is imperative that a concerted effort is employed to better understand this
important relationship. The aim of the work reported in this chapter was to use the sol-gel
method for the synthesis of nanophase strontium aluminate phosphor powders activated
by europium and dysprosium ions and to study the effect of annealing temperature on the
phase composition and luminescence properties of the phosphor material. This line of
research is interesting for two reasons: (1) It is known that various crystalline
luminescent phases are formed in this system: SrAl2O4 [3,14], SrAl12O19 [15], Sr2Al6O11
[16], and Sr4Al14O25 [17]. (2) In the production of nano-phosphors by the sol-gel method,
variations in annealing temperature are expected to have a profound effect on the degree
of crystallization and transition of Eu3+ ions into Eu2+ state and vice versa.
8.2 Experimental procedure
The initial components for preparing homogeneous solutions were aluminium
nitrate (Al(NO3)2.9H2O), crystalline strontium nitrate (Sr(NO3)2.4H2O), distilled water
and nitric acid. It is important to state that other preparation conditions were fixed, so as
not to contribute in any way. Gel formation and drying were performed at room
temperature. Gels were heat-treated in a temperature interval of ambient – 1000 C for 2
h in air, which is needed for the transition of europium ions into the bivalent state and
strontium aluminates phase formation. Surface morphology and elemental composition of

160
the phosphor powders were investigated using scanning electron microscopy (SEM) and
energy dispersive x-ray spectroscopy (EDS) on a Shimadzu Superscan SSX-550 coupled
with an EDS system. Phase and crystallinity of the synthesized compositions were
investigated by powder XRD using a Bruker D8 (Bruker Co., Germany) x-ray
diffractometer (XRD) with CuK ( = 1.5406 Ǻ). The photoluminescence (PL) excitation
and emission spectra were taken on a Cary Eclipse fluorescence spectrophotometer
equipped with a monochromatic xenon lamp. Each sample was loaded into a circular
holder and excited with 340 nm radiation from a pulsed xenon lamp. The emission
spectra were scanned in the range from 360 to 750 nm.
8.3 Results and discussion
The results of the morphological studies along with chemical composition
determination, which were determined using the SEM coupled with EDS, are shown in
Fig. 8.1 and 8.2, respectively. Fig. 8.1 represents the SEM micrographs of the 1000C
sample at 500 and 5000
Figure 8.1: SEM images of the 1000˚C sample of SrAlxOy:Eu2+,Dy3+ with (a) 500 magnification, (b) 5000 magnification
magnifications, respectively. The micrographs clearly indicate the presence of submicron
crystallites. Fig. 8.1(a) shows irregularly sized and shaped grains with discernible
micropores. The crystallite size distribution is wide. Fig. 8.1(b) shows a generally smooth
(a) (b)
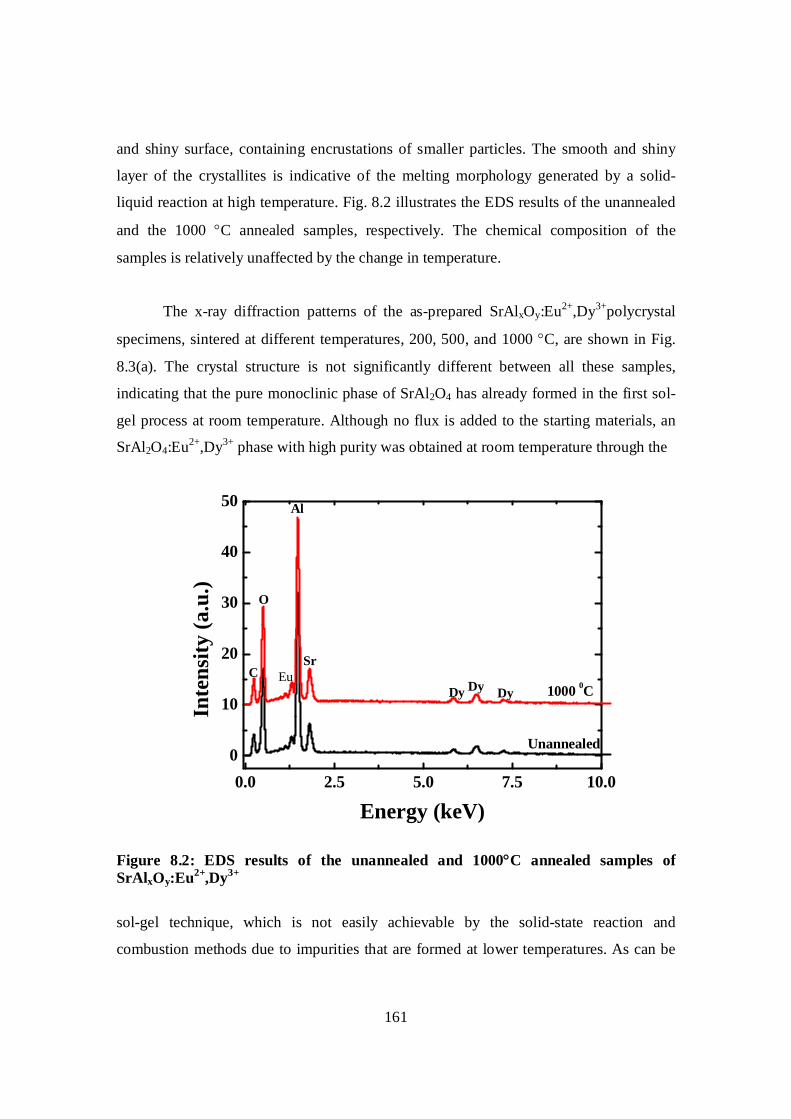
161
and shiny surface, containing encrustations of smaller particles. The smooth and shiny
layer of the crystallites is indicative of the melting morphology generated by a solid-
liquid reaction at high temperature. Fig. 8.2 illustrates the EDS results of the unannealed
and the 1000 C annealed samples, respectively. The chemical composition of the
samples is relatively unaffected by the change in temperature.
The x-ray diffraction patterns of the as-prepared SrAlxOy:Eu2+,Dy3+polycrystal
specimens, sintered at different temperatures, 200, 500, and 1000 C, are shown in Fig.
8.3(a). The crystal structure is not significantly different between all these samples,
indicating that the pure monoclinic phase of SrAl2O4 has already formed in the first sol-
gel process at room temperature. Although no flux is added to the starting materials, an
SrAl2O4:Eu2+,Dy3+ phase with high purity was obtained at room temperature through the
0.0 2.5 5.0 7.5 10.00
10
20
30
40
50
Dy DyDyEu
SrC
O
Al
Unannealed
1000 0C
Inte
nsity
(a.u
.)
Energy (keV)
Figure 8.2: EDS results of the unannealed and 1000C annealed samples of SrAlxOy:Eu2+,Dy3+
sol-gel technique, which is not easily achievable by the solid-state reaction and
combustion methods due to impurities that are formed at lower temperatures. As can be

162
seen from the XRD patterns, pure monoclinic phase diffraction peaks of SrAl2O4 are
seemingly predominant. Other products or starting materials were also observed,
implying that the phase compositions of the precursor powders do not consist of low-
temperature monoclinic phase (-phase) only. This mixed phase could be attributed to
the ratio of Sr to Al used in the precursor. It is known that the presence of the little
amount of doped rare-earth ions has almost no effect on the SrAl2O4 phase composition
[18] but, of more
10 20 30 40 50 60 700
200
400
600
800
1000
1200
1 2 2 2 11 1
1 1: Sr3Al2O62: SrAl2O4
1000OC
500OC
200OC
Unannealed
Inte
nsity
(a.u
.)
2 (deg.) Figure 8.3(a): XRD spectra of the samples at the various temperature values
importance, the annealing temperature had a significant effect on the degree of
crystallization. As the annealing temperature increased from ambient temperature to 200
C, the intensity of the x-ray diffraction peak increased. After 200 C the diffraction
peaks, especially those of the low-temperature monoclinic phase (-phase), were
significantly reduced, therefore affecting the luminescent property of the samples. Also
accompanying the increasing temperature, from ambient to 1000 C, is the enlargement
in the crystallite sizes. The Scherrer equation relates the width of the peaks in an x-ray
powder diffraction pattern to crystal size. The average crystallite sizes of the phosphors,
which were determined from the equation, vary between 42.2 8 nm to 47.2 10 nm.

163
Similar results (40–50 nm) were observed by Lu et al and Arturo et al. [19,20], who used
the microemulsion method for synthesis, with post–annealeing treatment of their samples,
32.4 32.6 32.8 33.0 33.2 33.4 33.6 33.8 34.0
0
200
400
600
800
1000
In
tens
ity (a
.u.)
2 (deg)
UA 2000C 5000C 10000C
Figure 8.3(b): XRD maximum intensity peaks (32.6<2<33.6)
between 800 and 1000 C. They attributed the small particle sizes to a cage effect, in
which the constituent cations are confined by nano-scaled micelles, which restricted the
particle growth. Using the peak for the reflection plane at 33 (Fig. 8.3(b) and Table 8.1),
two features can be illustrated: the peak-narrowing due to crystallite growth and the
shifting in peak position due to the increased crystallinity.
Table 8.1: Full width at half maximum (FWHM) values for the reflection at 33
Temperature (C) UA 200 500 1000
FWHM (degrees) 0.20 0.19 0.18 0.16
Fig. 8.4 shows the excitation spectra of the prepared SrAlxOy:Eu2+,Dy3+ phosphor
samples with the emission wavelength fixed at 515 nm, which is the characteristic
wavelength for the energetic transitions of Eu2+. Broad bands with varying maximum

164
values were observed. The unannealed and 200 C samples, which had the relatively high
intensities, the spectra peaked at around 350 nm. The broad bands correspond to the
4f65d→4f7 energy level transitions of the Eu2+ electron lying in the band gap region of
the host matrix [21]. The emission spectra, monitored with an excitation wavelength of
340 nm, are shown in Fig. 8.5. This wavelength is suitable for excitation of Eu2+ rather
than Eu3+. For temperatures below 600 C, broad emission peaks were
250 300 350 400 450
0
200
400
600
1000OC: slit width = 5 nm (half size)
500OC
200OC
Unannealed
Inte
nsity
(a.u
.)
Wavelength (nm)
Figure 8.4: Excitation spectra of SrAlxOy:Eu2+,Dy3+ at various annealing temperature values
observed at around 515 nm, revealing the characteristic emission of the Eu2+ activators
(4f65d1→4f7 (8S7/2)) parity-allowed transition [22]. As the annealing temperature
increases, not only a very broad emission band due to Eu2+, but also relatively narrow
lines ascribed to Eu3+, are observed. The effect of annealing on photoluminescence
emission intensity of as prepared phosphors is easily observable from the measurements.
Annealing the phosphors at 200 C slightly enhanced the luminescence, while further
increase in temperature significantly quenches the luminescence. When annealed at
around 1000 C, the type of luminescence changes from broad to several sharp peaks.
The relatively sharp emission lines at around 600 nm are attributable to the 4f–4f

165
400 450 500 550 600 650 700 750
0
200
400
600
800
515 nm 10000C
5000C
2000C
Unannealed
PL in
tens
ity (a
.u.)
Wavelength (nm)
Figure 8.5: Emission spectra of SrAlxOy:Eu2+,Dy3+ at the various annealing temperature values
0 1 2 3 4 5
0
200
400
600
800
1000
PL in
tens
ity (a
.u.)
Time (sec)
Unannealed 2000C 5000C 10000C
Figure 8.6: Decay curves of SrAlxOy:Eu2+,Dy3+ phosphor samples annealed at different temperature values after exciting for 5 min

166
transitions of Eu3+. The 5D07F0, 5D07F1, and 5D07F2 transitions of Eu3+ are
observed as emission lines at 585, 621, and 650 nm, respectively.
Significant variations in the light output as well as the quantum efficiency of
some phosphor materials have been observed to occur with changes in temperature.
These changes may result in degradation during processing or operation of certain
devices. In the case of the blue-emitting BaMgAl10O17:Eu2+ phosphor for PDP
application, degradation due to temperature effects is considered to be related to its host
lattice and the Eu2+ activator ion [23]. This degradation has been attributed mainly to the
oxidation of the Eu2+ ion resulting in the production of a trivalent europium oxide ion,
which is inefficient and is in some cases hardly visible in the emission spectrum [24]. The
photoluminescence spectrum of a luminescent material shows characteristic temperature-
dependence; as the temperature is increased the emission peak shifts to lower energy, the
emission band is broadened, and the emission intensity is quenched at some temperatures
[25]. The temperature dependence of the electron–phonon interaction in both the ground
state and the excited state of the luminescence centre is the origin of these phenomena
[26].
Fig. 8.6 shows the decay characteristics of the SrAlxOy:Eu2+,Dy3+ phosphor
annealed at different temperatures. The results show that both the initial luminescence
intensity and decay time of afterglow of phosphors are enhanced when annealed at 200
C. However, further increase in temperature reduces these two properties. The sample
annealed at 1000 C completely quenches the afterglow property of the phosphor. Except
for the sample annealed at 1000 C, all the samples show a rapid initial decay and
subsequent long-lasting phosphorescence, which can be analyzed by a curve fitting
procedure relying on the following triple exponential equation:
33
22
11 expexpexp
tItItII , (1)
where I represents the phosphorescent intensity; I1, I2, and I3 are constants; t is the time;
τ1, τ2, and τ3 are the decay constants deciding the decay rate for the rapid, medium, and

167
slow exponential decay components, respectively. The fitting results of the τ1 and τ2
parameters are listed in Table 8.2.
The decay constants have higher values for the 200 C sample but completely
vanish for the 1000 ˚C sample. It is known that trap depth greatly influences the
recombination between the excited electrons and trapped holes. Consequently, the decay
components are determined by the carriers, which are trapped at different trapping levels.
The long afterglow property of the phosphor samples can be described in terms of these
carriers, whose nature is considered to be holes [14,27]. Upon exposure of phosphors to
the excitation radiation, direct excitation of the 4f–5d transition of Eu2+ happens and
plenty of holes are created; some of the free holes are released thermally to the valence
Table 8.2: Results for fitted decay curves of SrAlxOy:Eu2+,Dy3+ samples at different
temperatures
Temperature (C) UA 200 500 1000
Component Decay constants (s)
Fast ( 1 ) 0.19 0.19 0.02 -
Medium ( 2 ) 0.88 0.88 0.22 -
Slow ( 3 ) 3.31 3.31 2.01 -
band, meantime, one part of the released holes travel through the valence band, and are
trapped by Dy3+ ions [28]. When the excitation source is removed, the excited Eu+1 ion is
relaxed to the metastable state (Eu+1)*. The trapped holes are released thermally to the
valence band and move to recombine with the excessive electrons in the metastable state
(Eu+1)* sites leading to the long afterglow [29].
8.4 Conclusions
In this work, the sol-gel procedure was successfully employed to synthesize
nanophase SrAlxOy:Eu2+,Dy3+ phosphor powders. The average crystallite sizes increased

168
from 42.2 8 nm to 47.2 10 nm as the heating temperature increased from room
temperature to 1000C, indicating an increase in crystallinity. The effect of annealing
temperature on the transformation in phase composition is not conclusive but the
dominance of the SrAl2O4 polymorph is evident from the reflections in the XRD results.
Luminescent results show variations in the peak shapes, positions, and intensities of the
excitation and emission spectra as well as the afterglow behaviour of the samples. This
reflects the profound influence of annealing temperature on these properties, which may
be traced to transitions between trivalent (Eu3+) and divalent (Eu2+) europium states that
originate from changes in the crystal field around the ions.

169
8.5 References
1. Levine, A.K. Palilla, F.C. Appl. Phys. Lett., 5: 118, (1964).
2. Blasse, G. Grabmaier, B.G. Luminescent Materials, Springer, Berlin, (1994).
3. Palilla, F.C. Levine, A.K. Tomkus, M.R. J. Electrochem. Soc., 115: 642, (1968).
4. Blasse, G. Bril, A. Philips Res. Rep., 23: 201, (1968).
5. Xu, C.N. Zheng, X.G. Akiyama, M. Nonaka, K. Watanabe, T. Appl. Phys. Lett., 76:
179, (2000).
6. Ranson, R.M. Thomas, C.B. Craven, M.R. J. Meas. Sci. and Tech., 9: 1947-1950,
(1998).
7. Ranson, R.M. Evangelou, E. Thomas, C.B. Appl. Phys. Lett., 72: 2663, (1998).
8. Beshears, D.L. Capps, G.J. Simmons, C.M. Schwenterly, S.W. Laser-induced
Fluorescence of Phosphors for Remote Cryogenic Thermometry. (1990).
9. Jansky, L. Vavra, V. Jansky, P. Kunc, P. Knizkova, I. Jandova, D. Slovacek, K. J.
Therm. Biol., 28: 429, (2003).
10. Kim, C.H. Bae, H.S. Pyun, C.H. Hong, G.H. J. Korean Chem. Soc., 5/42: 588,
(1998).
11. Atkinson, A. Segal, D.L. J. Sol–Gel Sci. Technol., 13: 133, (1998).
12. Chen, I.C. Chen, T.M. J. Mater. Res., 16: 644, (2001).
13. Chen, I.C. Chen, T.M. J. Mater. Res., 16: 1293, (2001).
14. Abbruscato, V. J. Electrochem. Soc., 118(6): 930, (1971).
15. Singh, V. Rao, T.K.G. Zhu, J.J. J. Solid State Chem., 179: 2589, (2006).
16. Smets, B. Rutten, J. Hoeks, G. Verlijsdonk, J. J. Electrochem. Soc., 136(7): 2119,
(1989).
17. Kemenade, J.T.C. Hoeks, G.P.F. The Electrochemical Society Extended Abstracts,
83-1: Abstract 607, San Francisco, CA, May 8–13, 914, (1983).
18. Lin, Y. Zhang, Z. Zhang, F. Tang, Z. Chen Q. Chem. Phys., 65: 103, (2000).
19. Lu, C.H. Chen, S.Y. Hsu, C.H. Mat. Sci. and Eng. B., 140: 218, (2007).
20. Arturo, M. Quintela, L. J. Colloid Interface Sci., 8: 137, (2003).
21. Kim, J.S. J. Cer. Proc. Res., 10(4): 443, (2009).

170
22. Cordoncillo, E. Julian-Lopez, B. Martínez, M. Sanjuán, M.L. Escribano, P. J. Alloys
Comp., 484: 693, (2009).
23. Lange. H. U.S. Patent, No. 3, 294, 699, (1966).
24. Oshio, S. Kitamura, K. Nishiura, T. Shigeta, T. Horii, S. Matsuoka, T. Nat. Tech.
Rep., 43: 69, (1997).
25. Kamada, M. Muarakami, J. Ohno, N. J. Lumin., 87–89: 1042, (2000).
26. Matsushima, S. Nakamura, H. Arai, M. Xu, C.N. Chem. Lett., 7: 700-701, (2002).
27. Matsuzawa, T. Aoki, Y. Takeuchi, N. Murayama, Y. J. Electrochem. Soc., 143:
2670, (1996).
28. Swart, H.C. Terblans, J.J. Ntwaeaborwa, O.M. Coetsee, E. Mothudi, B.M.
Dhlamini, M.S. Nucl. Inst. Meth., B., 267: 2630, (2009).
29. Chen, R. Wang, Y. Hu, Y. Hu, Z. Cheng, L. J. Lumin., 128: 1180, (2008).

171
Chapter 9 Characterization of Luminescent and Thermal
Properties of Long-afterglow BaAlxOy:Eu2+,Dy3+ Nanoparticles and Polymer Composites
9.1. Introduction
Although extensive research on aluminate phosphors has been undertaken over
the years, the Eu2+,R3+ co-doped barium aluminates such as BaAlxOy:Eu2+,Dy3+ [1,2]
have been studied only infrequently, even though they have potential for persistent
luminescence. The reasons may be attributed to the rather complicated structural
chemistry of the MAl2O4 host as well as the considerable size mismatch between the host
(Ba2+) and the main dopant (Eu2+) cations [3]. On the other hand, the crystal structures of
the compounds studied in this work are all derivatives of the stuffed tridymite structure
(Fig. 9.1). In this type of structure there are large open channels in the framework, which
provide suitable sites for large cations to lodge themselves. These channels are sources of
the structural weakness, which, can ultimately result in degradation.
The aim of the work reported in this chapter, was to prepare BaAl2O4:Eu2+,Dy3+
phosphor materials at different Eu2+ and Dy3+ concentrations by means of a combustion
method. The effects of the Eu2+:Dy3+ molar ratio on the structure, homogeneity, persistent

172
luminescence as well as stability are presented and discussed based on the analyses of the
x-ray powder diffraction, SEM imaging and photoluminescence studies. In addition to the
Figure 9.1: BaAl2O4 structure viewed along [0001]. The solid lines depict the unit cell. The closed circles indicate Ba atoms at the special position (2a) site [4].
synthesized BaAlxOy:Eu2+,Dy3+. In addition to the synthesized BaAlxOy:Eu2+,Dy3+
powder, polymer/phosphor composites of well-defined compositions were also prepared
and studied. This second part of work was motivated by: (i) the possibility of combining
the merits of organic and inorganic materials into systems with novel properties, (ii) the
promising results from previous work by this group [5].
9.2 Experimental Section
9.2.1 Synthesis of the BaAlxOy:Eu2+,Dy3+phosphor samples
Barium aluminate samples were prepared by a combustion synthesis method.
Powders of Ba(NO3)2 (A.R.), Al(NO3)3·9H2O (A.R.), Eu2 (NO3)3 (4N), CH4N2O (A.R.
added as fuel) were used as starting materials. Eu3+ was introduced in the form of
Eu(NO3)3.5H2O. A homogeneous, thick, white solution was obtained after thoroughly
milling the precursor mixture in a mortar using a pestle. Formation of the solution was
facilitated by the water of crystallization present on the metal nitrates. The solution was
then introduced into a muffle furnace maintained at 500 °C. Initially, the paste boiled
and underwent dehydration, followed by decomposition with large amounts of gases

173
escaping. Spontaneous ignition then occurred and the material underwent smouldering
combustion with enormous swelling. The whole process was over in about 5 minutes.
The voluminous and foamy combustion ash was easily milled to obtain the final
BaAlxOy:Eu2+,Dy3+ phosphor powder.
9.2.2 Preparation of BaAlxOy:Eu2+,Dy3+/LDPE nanocomposites
Linear low-density polyethylene (LDPE) was supplied by Sasol Polymers, South
Africa. It has a melt flow index (MFI) of 2.0 g/10 min, which was determined by
preheating a sample of the polymer at 190 C for 5 minutes followed by a shear analysis
on a 2.16 kg mass. It has a melting point of about 110ºC, and a density of 0.922 gcm-3.
The polymer/phosphor composites were produced by melt-mixing the synthesized
barium aluminate phosphor powder into LDPE at volume ratios ranging from 0.4% to
10%. Samples were weighed according to the required ratios and mixed using a volume
of 50 cm3 in a Brabender Plastograph mixing chamber at a screw speed of 30 rpm for
15 minutes. The mixing was carried out at 160 °C. The samples were hot melt-pressed
into slabs of average thickness 0.98 ± 0.05 mm, at 160 °C.
9.2.3 Morphology and structural analysis
Microstructural and elemental composition characterization of the
BaAl2O4:Eu2+,Dy3+particles were performed on a Shimadzu model ZU SSX–550
Superscan scanning electron microscope (SEM), coupled with an energy dispersive x-
ray spectrometer (EDS). For SEM measurements, the probe size was 3.0 nm, the probe
current 0.02 nA, and the accelerating voltage 5.0 keV. The probe size for EDS analysis
was 4 nm, specimen current 1.00 nA, and accelerating voltage 15.0 keV.
Crystalline phases were characterized by an x-ray diffractometer (Bruker D8
diffractometer, Bruker Corporation of Germany, operating at 40 kV and 40 mA, and
using Cu K = 1.5406 Å) with a scan step of 0.02° in 2 and a scan speed of 4°/min. The
divergence slit (DS), scatter slit (SS), and receiving slit (RS) are 1°, 1°, and 0.15 mm,

174
respectively. The average crystallite size of the materials was calculated from the
diffraction data by using the Scherrer equation (Eq. 1) [6].
cos9.0
D (1)
where D is the average crystallite size in metres, the x-ray wavelength in metres, the
full width at half maximum (FWHM) of the selected reflection in radians, and (in
degrees) is half of the Bragg angle (2). The calculation is based on the measurement of
full-width at half-maximum (FWHM) values in the corresponding XRD pattern.
9.2.4 Photoluminescence (PL) measurements
The excitation, emission, and decay spectra were measured at room temperature on a
Varian Cary Eclipse Fluorescence spectrophotometer (Model: LS 55) with a built-in 150
W Xe flash lamp as the excitation source and a grating to select a suitable wavelength for
excitation. Each sample was loaded into a circular holder and excited with 340 nm
radiation.
9.2.5 Thermal analysis
For thermal analysis, differential scanning calorimetry (DSC) and
thermogravimetric analysis (TGA) were performed using the the same measurement
systems as well as procedures as described in the previous chapters.
9.3 Results and discussion
9.3.1 SEM micrographs and EDS spectra
The microstructures of BaAlxOy:Eu2+,Dy3+ powders are shown in the SEM
micrographs in Fig. 9.2. Figs. 9.2(a) and (b) depict the SEM images of the as-synthesized
phosphor powders for low (a) and high (b) Dy3+ concentrations, respectively. The
magnification is 10000 in both images. An inspection of the morphology of the samples

175
Figure 9.2: 10000 magnification SEM micrographs of as-synthesized BaAlxOy: Eu2+,Dy3+ with Eu2+:Dy3+ ratio = (a) 10:1 and (b) 1:10. reveal that the powders are characterized by flakes up to 10 m diameter. The surfaces of
the samples show voids and pores formed by the escaping gases during the combustion
process. When a gas is escaping under high pressure, pores are formed with the formation
of small particles near the pores. The formed gas transports heat away from the forming
product, thus limiting the particle growth. The wide particle-size distribution as well as
irregular shapes of the particles is probably due to the nonuniform distribution of
temperature and mass flow in the combustion wave.
Figure 9.3: EDS spot analysis results for the BaAlxOy:Eu2+,Dy3+ powder sample with 10:1 Eu2+:Dy3+ ratio
(a) (b)

176
Energy dispersive spectroscopy (EDS) is a standard procedure for identifying and
quantifying elemental composition of sample areas as small as few micrometres [7]. Fig.
9.3 shows the EDS spectra of the sample with 10:1, Eu2+:Dy3+ molar ratio. The existence
of Eu in the samples is clear in the corresponding EDS spectra. No other elements were
detected in the EDS emissions apart from Ba, Eu, O, Dy, Al, and C. The elements appear
in ratios concomitant with the proportions mixed in the starting materials, which shows
the advantage of the combustion method in controlling chemical components.
9.3.2 X-ray diffraction (XRD)
Generally, it is well known that the luminescence properties of phosphor particles
are strongly dependent upon the characteristics of the prepared phosphors such as particle
size [8], surface morphology [9], concentration quenching [10], and crystallinity [11].
Crystallinity is one of the most important parameters to obtain phosphor particles with
high luminescence efficiency.
20 30 40 50 60 70
0
100
200
300
400
500 Eu2+:Dy3+ (mole) ratio
1:10
1:6
1:2
10:1
(242
)
**** ***
*
(440
)
(112
)
*Ba(NO3)2
(200
)
(241
)
(224
)
(401
)
(202
)
(102
)
(220
)
Inte
nsity
(a.u
.)
2 [o]
Figure 9.4(a): XRD spectra of BaAlxOy:Eu2+,Dy3+ powder samples for various Eu2+:Dy3+ ratios

177
Figure 9.4 (b): XRD spectra of BaAlxOy:Eu2+,Dy3+ phosphor samples with Eu2+:Dy3+
molar ratio = 2:1, and composite of LDPE with 10% BaAlxOy:Eu2+,Dy3+. [Inset – XRD spectrum of pure LDPE]. The x-ray powder diffraction (XRPD) technique is an effective tool for
determining the phase, crystallinity, and purity of samples prepared under various
conditions. Fig. 9.4 is a display of the XRD results for the BaAlxOy:Eu2+,Dy3+
nanophosphor samples. The broad peaks clearly indicate that nanoparticles were
obtained. The spectra clearly show the presence of the expected hexagonal crystalline
phase for the nanopowders. The main diffraction peaks index well with the card file
(JCPDS:17-0306) in agreement with other reports [12,13]. Crystallite size estimation
based on the Scherrer analysis yielded values ranging between 34 and 41 4 nm.
9.3.3 Photoluminescence spectra
PL measurements were carried out in order to determine the luminescent
properties of the as-prepared aluminate phosphor samples as well as those of the
LDPE/BaAlxOy:Eu2+,Dy3+ nanocomposites. Figs. 9.5 and 9.6 display the excitation and
emission spectra for the phosphors and the nanocomposites, respectively. The

178
photoluminescence spectra exhibit different shapes and broadband peaks. The
wavelength bands in the excitation spectra are broad with wavelengths ranging from 275
to 445 nm while the corresponding blue-green emissions consist mainly of symmetrical
250 300 350 400 450 500 550 600 650 7000
50
100
150
200
250
300
350Eu2+:Dy3+ ratio(b)(a)
705 nm615 nm
505 nm345 nm
Inte
nsity
(a.u
.)
Wavelength (nm)
1:2 1:6 1:10 10:7 10:4 10:1
Figure 9.5: PL (a) excitation (λem= 505) nm and (b) emission (λexc= 340 nm), spectra of BaAlxOy:Eu2+,Dy3+ phosphor for Eu2+:Dy3+ ratio = 10:1 – 1:10. bands with major peaks having maxima at 505 nm that originate from the energy
transitions between the ground state (4f7) and the excited state (4f65d1) of the Eu2+ ions
[14]. The minor peaks at 615 and 705 nm arise from the f-f transitions of the remnant,
unreduced Eu3+ ions.
The photoluminescence in rare earth-doped alkaline earth aluminates originates in
the electronic transitions in the rare-earth ions. The luminescence may be attributed to
one of three possible processes as a result of transitions in either 4f energy levels, 4fn–15d1
states or charge-transfer states. In the case of doping with Eu2+ ions, luminescence is due
to 4f74f65d1 transitions in Eu2+. 4f5d transitions are electric dipole allowed optical
transitions and correspond to strong optical absorption. During excitation, 4f electrons get
transferred to the 5d orbital, which is split into a number of levels due to the crystal field.
The 4f electrons of Eu2+ are not sensitive to the lattice environment due to the shielding

179
function of the outer shell, but the 5d electrons may couple strongly to the lattice.
Consequently, the mixed states of 4f5d will be split by the crystal field and will couple
strongly to the lattice phonons, resulting in broadband absorption and emission. On the
other hand, it is known that different host structures and crystallographic distortions will
influence the crystal field environment of rare-earth ions in the host structure [15]. Since
the crystal field splitting varies considerably depending upon the host material, the
spectral position of the excitation band would also change. In this work the excitation
spectrum at each concentration is broad with a peak at around 340 nm. A concentration-
dependent shoulder also appears at 275 nm.
Figure 9.6: PL (a) excitation (λem = 500 nm), and (b) emission (λexc = 340 nm), spectra of LDPE/BaAlxOy:Eu2+,Dy3+ composites for Eu2+:Dy3+ ratio = 1:2.
The PL curves for the phosphor materials (Fig. 9.5) show that the peak
wavelength of the phosphorescence does not vary significantly with the concentration of
the dopants. This implies that the crystal field, which affects the 5d electron states of the
Eu2+ ions, is not changed dramatically by the concentration variations in the phosphors.
Unlike the excitation bands, the emission bands do not only depend on the crystal field
splitting of the 5d level and the 4f5d de-excitations. In a given host, the emission of
Eu2+ is also significantly influenced by the size of the host cation (Ba2+ in this case),

180
which is replaced by Eu2+. The ionic size of Eu2+ (1.20 Å) is smaller than the radius of
the Ba2+ ion (1.38 Å). Hence, when Eu2+ substitutes for Ba2+ in BaAlxOy, the Eu2+ ion
experiences a reduced attraction owing to shrinkage of the crystal lattice. Anamorphic
crystal lattices result when the surroundings of Eu2+ are changed and so the emission
wavelengths change correspondingly [2,16].
Two Ba2+ sites are believed to exist in the BaAl2O4 crystal structure. However,
the symmetry of the emission bands in the observed results illustrate the presence of one
kind of luminescent centre in the BaAlxOy:Eu2+,Dy3+, where the Eu2+ ions are substituted
with the nine-coordinated Ba2+ sites [17]. Of the two expected Ba2+ sites, the first one
(2a) has a multiplicity of two and a site symmetry of C3 while the second one (6c) has a
multiplicity of six and a site symmetry of C1. Both the Ba2+ sites have nine-coordination
and the sites are similar in average size (d(Ba–O)Ave = 2.86 and 2.87 Å). However, the
lower symmetry site has also shorter Ba–O distances (2.69 Å) corresponding to those
typical of Eu2+–O (2.68 Å [18]). These differences imply that the 6c site will be filled
preferentially leading to a corresponding higher PL intensity as a result of a contribution
from six instead of two Eu2+ ions. The emission wavelength (505 nm) is consistent with
the result derived from the ceramic method by Lin et al. [19] but slightly higher than the
500 nm obtained by Stefani et al., who also observed a minor peak at 435 nm using the
solid state reaction method [20], and the 496 nm by Qiu et. al. (microemulsion) [21].
Though the mechanism of persistent luminescence in lanthanide ions-doped
alkaline earth aluminates is not fully understood, it is agreed that the Eu2+ ion is the
luminescent centre, while the R2+ and R3+ ions have been suggested to trap holes and
electrons, respectively [22]. The mechanism is considered to include the photoionization
of the Eu2+ ions and a subsequent transfer of the electrons to traps formed by the lattice
defects as oxide ion vacancies and possibly also the auxiliary R3+ ion co-dopants. The
thermal bleaching of the electrons from the traps followed by the process reverse to the
storage of the excitation energy leads to the Eu2+ emission [23].

181
The mechanisms explaining the enhanced luminescence emission, as well as the
photoluminescence quantum efficiency when nanoparticle-filled polymer composites act
as the active emitting layer, are not particularly clear. Initially, optical scattering from the
nanoparticle surfaces was believed to be a factor but was excluded since it could not
explain some phenomena such as the observed radiance enhancement in LEDs [24]. An
alternative possible explanation was in terms of an increase of the recombination at the
polymer-nanoparticle interfaces, but this was also discounted. A more plausible
mechanism suggests that the change in morphology, arising from the significant increase
in surface area, may be responsible for the observed enhanced luminance [24,25]. The
high surface reactivity of a nanostructure with a polymer may provide interactions that
can modify polymer properties in a positive way, leading to novel luminescent properties
of the composite. These interactions may yield new radiative recombination mechanisms,
that may be utilized for broadband light emission or wavelength tunable emission. The
mechanisms may be influenced by factors such as the individual properties of the organic
and inorganic components as well as their relative concentration. In some
nanocomposites, the presence of new recombination mechanisms is suggested by the
generation of new PL emission lines [26], which may be attributed to the formation of
interfacial states termed exciplex [27].
9.3.4 Decay curves
Fig. 9.7(a) depicts the typical afterglow decay curves of the phosphor samples
after the powders were activated using a pulsed xenon lamp. The curves show that the
BaAlxOy:Eu2+,Dy3+ phosphor material emits light far longer than the typical microsecond
lifetime of Eu2+ [28]. This indicates the presence of persistent luminescence. The origin
of this long persistence is associated with the second activator ion Dy3+. The Dy3+
incorporation creates deep traps in the energy band gap of the BaAlxOy:Eu2+,Dy3+. These
traps are in the form of hole-trapping levels near the valence band. After excitation by the
light photons, electrons of the Eu2+ ion in the 4f level are transferred to the 5d level, and
holes are produced in the valence band. Some holes created are captured by the Dy3+ hole
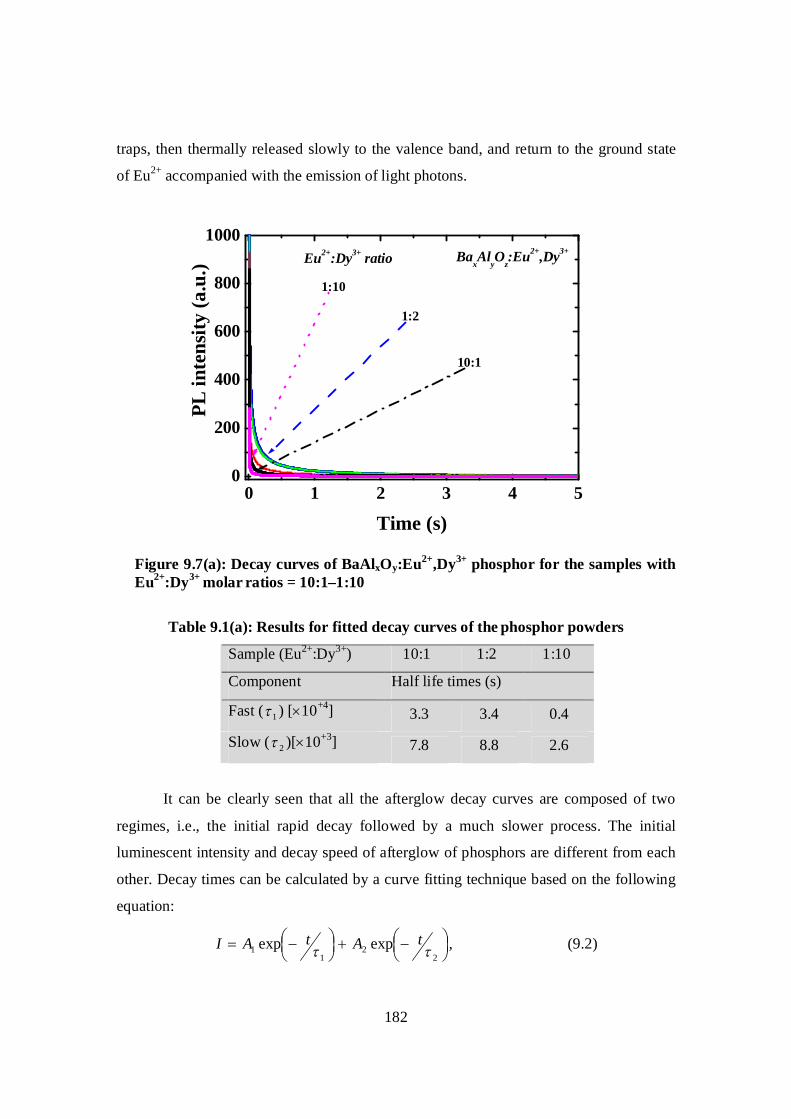
182
traps, then thermally released slowly to the valence band, and return to the ground state
of Eu2+ accompanied with the emission of light photons.
0 1 2 3 4 50
200
400
600
800
1000Eu2+:Dy3+ ratio BaxAlyOz:Eu2+,Dy3+
1:10
1:2
10:1
PL
inte
nsity
(a.u
.)
Time (s)
Figure 9.7(a): Decay curves of BaAlxOy:Eu2+,Dy3+ phosphor for the samples with Eu2+:Dy3+ molar ratios = 10:1–1:10
Table 9.1(a): Results for fitted decay curves of the phosphor powders
Sample (Eu2+:Dy3+) 10:1 1:2 1:10
Component Half life times (s)
Fast ( 1 ) [10+4] 3.3 3.4 0.4
Slow ( 2 )[10+3] 7.8 8.8 2.6
It can be clearly seen that all the afterglow decay curves are composed of two
regimes, i.e., the initial rapid decay followed by a much slower process. The initial
luminescent intensity and decay speed of afterglow of phosphors are different from each
other. Decay times can be calculated by a curve fitting technique based on the following
equation:
22
11 expexp
tAtAI , (9.2)

183
where I is the phosphorescence intensity, A1 and A2 are constants, τ1 and τ2 are decay
times for the exponential components, and t is time [29]. The results recorded in Table
9.1(a) indicate that the BaAlxOy:Eu2+,Dy3+ phosphor samples had different decay times.
0 1 2 3 4 50
200
400
600
800
1000
Inte
nsity
(a.u
.)
Time (s)
0.0/100 v/v LDPE/BaAlxOy:Eu2+,Dy3+
90.0/10.0 v/v LDPE/BaAlxOy:Eu2+,Dy3+
96.0/4.0 v/v LDPE/BaAlxOy:Eu2+,Dy3+
99.6/0.4 v/v LDPE/BaAlxOy:Eu2+,Dy3+
100/0.0 v/v LDPE/BaAlxOy:Eu2+,Dy3+
Figure 9.7(b): Decay curves of pure LDPE, LDPE/BaAlxOy:Eu2+,Dy3+ nano-composites for phosphor vol.% = 0.4–10 and BaAlxOy:Eu2+,Dy3+ phosphor sample with Eu2+:Dy3+ molar ratio = 2:1
The role of Eu2+ ions as well as Dy3+ ions as luminescent centres and trap centres,
respectively, in aluminate phosphors is well established. The lifetime of afterglow is
related to the energy stored, and the number of electrons, which stay, in the trap level.
The intensity of the afterglow is related to the velocity, including the velocity of electrons
escaping from the trap level and the velocity of energy transfer. The rapidly-decaying
process is due to the short survival time of the electrons in Eu2+ while the slow-decaying
process arises from the deep trap energy centre of Dy3+ [30]. The magnitude of the
afterglow intensity and decay time depend on the type of the host structure, which
influences the nature of traps formed.
The curves for the polymer/phosphor nanocomposites, displayed in Fig. 9.7(b),
reveal very interesting observations. At a phosphor content of only 0.4 vol.%, the
polymer matrix seems to alter the decay mechanism from second order to third order as

184
the corresponding decay curves could be fitted with the third order exponential (equation
9.3),
33
22
11 expexpexp
tAtAtAI . (9.3)
Table 9.1(b): Results for fitted decay curve of the 0.4 vol.%
LDPE/BaAlxOy:Eu2+,Dy3+ composite – taken from 1:2, Eu2+:Dy3+ sample
Component Fast ( 1 ) [10+2] Medium ( 2 )[10+2] Slow ( 3 )[10+2]
Half life times (s) 0.7 13.53 155.28
In addition, further increase of the phosphor content above 0.4% appears to
progressively slow the rate of decay. Such elongation in afterglow characteristics would
be very appropriate for applications such as lighting, among others. As mentioned earlier
on (PL section), the origin of the influence of the polymer on phosphorescence behaviour
may be rooted in the morphological changes that arise from the increased surface area
[24,25].
The contribution of hole mobility in this process may be significant and is worth
considering. It has been proposed that when nanoparticles are introduced into a polymer,
probable causes for the improvement in hole mobility may be either a reduction in the
density of traps or reduction in charge trapping due to the superposition of several
transport mechanisms in the nanocomposite, which may include percolation through
polymer nanoparticle interface network [31]. A low rate of hole mobility and electron-
hole recombination will increase the re-trapping probability and further slow down the
decay process [32].
9.3.5 Thermal properties
The DSC heating and cooling curves of the pure LDPE and the LDPE/BaAlxOy:Eu2+,
Dy3+ nanophosphor composites obtained from the second heating and cooling cycles,

185
Figure 9.8(a): DSC heating curves of LDPE and LDPE/BaAlxOy:Eu2+,Dy3+ nanocomposites
Figure 9.8(b): DSC cooling curves of LDPE and LDPE/BaAlxOy:Eu2+,Dy3+ nanocomposites

186
Table 9.2: DSC data of pure LDPE and LDPE/BaAlxOy:Eu2+,Dy3+ composites
Tm: melting peak temperature; Tc: crystallization peak temperature; Hm and Hc:
melting and crystallization enthalpies, respectively; : standard deviation.
Filler content
(Vol.% )
Tm/ºC H obs
m /Jg-1
H calm /Jg-1
Tc/ºC H obs
c /Jg 1
H calc /Jg-1
0.0 109.2 0.0 52.3 7.9 - 95.4 0.1 -64.16 6.5 -
0.4 109.2 0.2 57.1 7.5 52.1 95.6 0.1 -63.9 2.7 -63.9
4.0 109.2 0.7 53.3 1.3 50.3 95.2 0.2 -64.7 2.6 -61.7
10.0 108.3 0.3 48.6 5.5 47.4 95.1 0.2 -57.4 5.5 -58.2
respectively, are shown in Fig. 9.8. The observed as well as expected parameters
corresponding to these DSC curves are recorded in Table 9.2. The curves show that as the
phosphor content is increased, both the melting and crystallization temperatures decrease
slightly. The reduced temperature values are an indication of a reduction in crystallite
sizes in LDPE. This result is similar to our previous observations on the effect of the
commercial SrAl2O4:Eu2+,Dy3+ phosphor in LDPE [5]. However, in contrast to the same
work, values of the expected melting enthalpy values (normalized with respect to the
mass fraction of the LDPE in the composite), are lower than the experimentally
determined ones. Although the difference in the two values progressively decreases as the
phosphor content increases, it is clear that the BaAlxOy:Eu2+,Dy3+ particles acted as
nucleating centres and enhanced the overall crystallinity in the LDPE nanocomposite
while preventing lamellar growth. This is in line with some documented results [33] for
the effect of nanostructured fillers.
Previous studies have shown that the thermal stability of LDPE can be enhanced
to various extends following the introduction of phosphor nanoparticles [5]. In this work,
TGA measurements were made in order to investigate the effect of the combustion-
synthesized BaAlxOy:Eu2+,Dy3+ phosphor nanoparticle fillers on the thermal stability of
LDPE. The curves obtained from the measurements are depicted in Fig. 9.9. The curves

187
show that BaAlxOy:Eu2+,Dy3+ significantly increased the thermal stability of LDPE,
shifting the onset temperature of degradation from about 324 C to 400 C (for the
nanocomposite with 4 vol.% of BaAlxOy:Eu2+,Dy3+). Two probable reasons may account
Figure 9.9: TGA curves for LDPE and LDPE/BaAlxOy:Eu2+,Dy3+ nanocomposites
for the improved stability. Firstly, a strong interaction between the nanofiller particles
and the polymer chains may result in reduced chain mobility, which then suppresses the
chain transfer reaction that is responsible for the degradation in LDPE [34], ultimately
delaying the onset temperature of mass loss. The 10 vol.% sample shows that there is a
filler loading threshold for improved stability. However, the afterglow curves indicate
that this particular concentration does not perform much better than the 4 vol.% one,
indicating that the threshold filler content for optimum persistence luminescence ans
stability of the polymer matrix is less than 10%.
9.4 Conclusions
Nanostructured BaAlxOy:Eu2+,Dy3 powders were prepared by a combustion
method, and ultimately mixed in an LDPE matrix. EDS analysis confirmed the elemental

188
composition in the phosphor. The average crystallite sizes determined from XRD
measurements, using the Scherrer formula, ranged between 34 and 41 nm. The powders
exhibited high brightness luminescence with major peaks having maxima at 505 nm,
which were nicely replicated by the nanocomposite samples. Of particular interest, was
the persistence luminescence behaviour of the phosphor/polymer composites, which were
observed to be profoundly enhanced compared to the as-prepared BaAlxOy:Eu2+,Dy3+
samples. The enhancement probably originated in the change in morphology, arising
from the significant increase in surface area. DSC results show that the
BaAlxOy:Eu2+,Dy3+ particles acted as nucleating centres and enhanced the overall
crystallinity in LDPE while preventing lamellar growth. The LDPE/BaAlxOy:Eu2+,Dy3
nanocomposites had higher thermal stability with respect to that of the pure LDPE. The
improved stability may be attributed to a strong interaction between the nanofiller
particles and the polymer chains, which led to reduced chain mobility, ultimately
delaying the onset of degradation.

189
9.5 References
1. Kuang, J. Liu, Y.L. Chem Lett., 34(4): 598, (2005).
2. Mothudi, B.M. Ntwaeaborwa, O.M. Botha, J.R. Swart, H.C. Phys. B: Phys. Cond.
Matt., 404(22):, 4440, (2009).
3. Katsumata, T. Sakai, R. Komuro, S. Morikawa, T. Kimura, H. J. Cryst. Growth.,
198-199(I): 869, (1999).
4. Fukuda, K. Fukushima, K. J. Solid State Chem., 178: 2709 , (2005).
5. Bem, D.B. Luyt, A.S. Dejene, B.F. Botha, J.R. Swart, H.C. Phys. B: Phys. Cond.
Matt., 404: 4504, (2009).
6. Klug, H.P. Alexander, L. E. X-ray Powder Diffraction Procedures. Wiley: New
York, (1959).
7. Galvan, D.H. Hirata, G.A, Adem, E. Mat. Sci. Eng. B., 126: 28, (2006).
8. Kang, Y.C. Lenngoro, I.W. Park, S.B. Okuyama, K. Mat. Res. Bul., 35(5): 789,
(2000).
9. Chang, H. Lenggoro, I.W. Okuyama, K. Kim, T.O. Jpn. J. Appl. Phys., 43: 3535,
(2004).
10. Jacobsohn, L.G. Bennett, B.L. Radiat. Meas., 42(4-5): 675, (2007).
11. Lee, S.K. Yoon, H.H. Park, S.J. Kim, K.H. Choi, H.W.J. J. Appl. Phys., 46: 7983,
(2007).
12. Ryu, H. Singh, B.K. Bartwal, K.S. Phys. B., 403: 126, (2008).
13. Chen, X.Y. Ma, C. Li, X.X. Shi, C.W. Li, X.L. Lu, X.D.R. J. Phys. Chem., C., 113:
2685, (2009).
14. Lu, C.H. Chen, S.Y. Hsu, C.H. Mater. Sci. Eng. B., 140: 218, (2007).
15. Lin, Y. Zhang, Z. Tang, Z. Mat. Chem. Phys., 70: 156, (2001).

190
16. Chen, Y.J. Qiu, G.M. Sun, Y.B. J. Rare Earths., 20: 50, (2002).
17. Park, Y.J. Kim, Y.J. Mater. Sci. Eng. B., 146: 84, (2008).
18. Shannon, R.D.. Acta Cryst., A32: 751, (1976).
19. Li, Y.L. Zhang, Z. Tang, Z. Zhang, J. Zheng, Z. Lu, X. Mat. Chem. Phys., 70: 156,
(2001).
20. Stefani, R. Rodrigues, L.C.V. Carvalho, C.A.A. Felinto, M.C.F.C. Brito, H.F.
Lastusaari, M. Hölsä, J. Opt. Mat., 31: 1815, (2009).
21. Ryu, H. Singh, B.K. Bartwal, K.S. J. Lumin., 85: 149, (1999).
22. Guanming, Q. Yongjie, C. Xiujuan, G. Linjiu, X. Yiguang, T. Yanbin, S. J. Rare
Earths., 23: 5, (2005).
23. Aitasalo, T. Deren, P. Holsa, J. Jungner, H. Krupa, J.C. Lastusaari, M.
Legendziewicz, J. Niittykoski, J. Strek. W. J. Solid State Chem., 171: 114, (2003).
24. Aitasalo, T. Hölsä, J. Jungner, H. Lastusaari, M. Niittykoski, J. J. Phys. Chem. B.,
110: 4589, (2006).
25. Blom, P.W.M. Schoo, H.F.M. Matters, M. App. Phys. Lett., 73(26): 3914, (1998).
26. Aleshin, A. Alexandrova, E. Shcherbakov, I. J. Phys. D: App. Phys., 42(10): 1361, (2009).
27. Morteani, A. Ho, P.K.H. Friend, R. Silva, C. App Phys Lett., 86: 1077, (2005).
28. Poort, S.H.M. Meijerink, A. Blasse, G. J. Phys. Chem. Solids., 58: 1451, (1997).
29. Matsuzawa, T. Nabae, T. Katsumata, T. Sasajima, T. J. Electrochem. Soc., 144:
L243, (1997).
30. Katsumata, T. Nabae, T. Sasajima. K. J. Cryst. Growth., 183: 361, (1998).
31. Aleshin, A.N. Shcherbakov, I.P. Alexandrova, E.L. Lebedev, E.A. Solid State
Comm., 146(3-4): 161, (2008).

191
32. Jia, W. Yuan, H. Lu, L. Liu, H. Yen, W.M. J. Lumin., 76-77: 424, (1998).
33. Ning, N.Y. Yin, Q.J. Luo, F. Zhang, Q. Du, R. Fu, Q. Polym., 4(25): 7374, (2007).
34. Luyt, A.S. Dramicanin, M.D. Antic, Z. Djokovic, V. Polym. Test., 28(1): 1, (2009).

192
Chapter 10 Summary and Outlook
10.1 Summary
The global objectives of the experimental studies presented in this thesis focused
on factors, which may lead to the enhancement in the qualities of luminescent materials.
The approach adopted involved an analysis of the morphological, structural,
photoluminescent, and thermal characteristics of both commercial and self-synthesized
phosphors as well as phosphor/polymer composites.
Two types of aluminate-based commercial phosphors; the green-emitting
SrAl2O4:Eu2+,Dy3+ and the blue-emitting Sr4Al14O25:Eu2+,Dy3+, were initially
investigated, firstly in their pristine forms and secondly as composites after incorporation
in PMMA and LDPE polymers. The set of PL emissions for the major peaks in SrAl2O4
and Sr4Al14O25-based samples, were broad and occurred at about 505 nm and 418 nm,
respectively. The DSC and TGA results for the corresponding LDPE/SrAl2O4:Eu2+,Dy3+
and LDPE/Sr4Al14O25:Eu2+,Dy3+ composites, showed that the phosphor had no major
influence on either the crystallinity or stability of the former composites. In the latter
composite samples, the phosphor influence on the crystallinity in LDPE was not
significant, but it strongly improved the stability. This first phase of the study provided
193
some insight into the relevant characteristics of phosphors as well as phosphor/polymer
composites, which led to the elimination of PMMA from further investigations and
paved the way for further investigations of these materials.
The second phase of these investigations concerned the synthesis of two types of
phosphors; aluminates of strontium and barium. The preparation of strontium aluminate
was carried out by two methods; combustion and sol-gel. The combustion-synthesized
phosphor powder samples were initially analyzed for the effect of the ratio of Eu2+ to
Dy3+ on the photoluminescence and thermal properties. The emission intensity had a
major peak at 515 nm and was observed to be optimum for a 1:2 mol% ratio of Eu2+:Dy3+
concentration: Higher concentrations of Dy3+ quenched the intensity of the phosphor. The
1:2 mol% ratio was also found to be the optimal value for the initial, relative intensity, as
well as the after-glow decay time. Improvements in these characteristics were attributed
to the presence of both shallow and deep traps. Thermal analysis showed that the
phosphor nanoparticles improved the overall crystallinity in LDPE by acting as
nucleating agents.
One of the attractive features of the aluminate systems is the ability to form
luminescent phases of various forms. In the specific case of the strontium aluminate
systems, some of the prominent crystallographic polymorphs are Sr3Al2O6, SrAl2O4,
SrAl4O7, Sr4Al14O25, and SrAl12O19. This aspect was investigated by studying the effect
of temperature on the structural and photoluminescent properties of sol-gel derived
samples of strontium aluminate, doped and co-doped with Eu2+ and Dy3+, respectively.
The PL results clearly show red-shifted excitation and emission spectra as temperature
increased. At temperatures above 500 C, the broad bands, which originate from f-d
transitions of Eu2+ are reduced to several sharp lines that are characteristic of the f-f
transitions of the Eu3+ ions, which originate from 5D0→7FJ transitions (J = 0,1-6). These
changes are attributed to the variation in the crystallite sizes, whose average values
increased from about 42 to 47 nm as the temperature rose from 0 to 1000 C. The
presence of the SrAl2O4 and Sr2Al3O6 phases was detected from XRD spectra.

194
The final set of experiments consisted of the study of the structural and
photoluminescent properties of a combustion synthesized BaAlxOy:Eu2+,Dy3+ phosphor
as well as BaAlxOy: Eu2+, Dy3+/LDPE composites. In addition, the composite samples
were thermally analyzed. The intention here was two-fold: (1) To produce a good quality
phosphor. (2) To assess the performance of the phosphor in an LDPE matrix.
Photoluminescence emission and excitation spectra, obtained at room temperature, are of
high intensity and consist of broad bands, which are attributed to the transition between
the excited state (4f65d1) and the ground state (4f7). PL results indicate that the
LDPE/phosphor interface, which is considered to have an influence on the composite
behaviour, did not significantly change the spectral positions of the phosphor materials,
whose major emission peaks occurred at about 505 nm; which was a desirable result. The
improved afterglow results for the composites may have been caused by morphological
changes due to increased surface area and defects. Thermal results indicate that the
BaAlxOy:Eu2+,Dy3+ particles acted as nucleating centres and enhanced the overall
crystallinity in the LDPE nanocomposite while preventing lamellar growth, hence
reducing the crystallite sizes in LDPE.
10.2 Outlook
Issues which may inform future research work in the development and application
of luminescent materials revolve around the ability to; (1) produce high brightness
persistent phosphors of high efficiency, (2) develop comprehensive mechanisms to
explain persistence luminescence as well as luminescence in nanocomposite (hybrid)
materials, (3) clarify the size-induced effects in nanophosphors, (4) develop strategies to
control the location, distribution, or segregation of dopant ions in nanoparticles and
nanocomposites.
With regard to producing persistent luminescent compounds, the intense research
in this area has resulted in only a handful of phosphors that are bright enough to consider
their use in practical applications. In addition, these materials almost exclusively fall into
two main categories, the aluminates and the silicates, i.e. the number of hosts used is

195
relatively low. Besides the limited host compounds, so far there has not been any serious
alternative for Eu2+ activators as the emitting centre. Consequently, the price of Eu2+ is
sky-rocketing due to its almost exclusive use as a dopant in most luminescence
applications, including as security markers in Euro bank notes. The most noteworthy
problem in the preparation Eu2+-doped persistent luminescent compounds is the lack of
yellow, orange and red phosphors. The paucity in the search for, particularly bright red
persistent luminescent compounds, has been ascribed to two causes: (1) The difficulty in
obtaining a high enough crystal field in oxides for Eu2+ to emit radiation in the red region
of the visible spectrum. (2) The existence of the so called Purkinje effect, which basically
refers to the natural weakness in the human eye to perceive red (and blue) wavelengths
light.
Quite a number of mechanisms have so far been postulated to explain the
persistent luminescence phenomenon in phosphors. They generally involve charge
carriers getting trapped in long-lived energy levels inside the band gap. However, these
mechanisms are not yet fully understood since many details remain unclear. Clarity is
needed on issues such as: (1) The origin of the charge carriers. (2) The conduction
process of the energy from the traps to the luminescent centres. (3) The influence of
codopants and lattice defects in the neighbourhood of the activators. Future experiments
are necessary to unravel these mysteries.
Nanocrystalline systems constitutes a relatively young field of research. Improved
performance in phosphors is expected when phosphor particles are formed at the
nanometre scale. The anticipated improvement is on account of the reduced sizes of the
particles. Phosphors having a small particle size and high efficiency would be most
useful, since this would ideally enable the preparation of practical phosphors, which can
form a dense, pinhole-free coating on a substrate. However, key issues regarding size-
dependent optical properties still persist. The particle size dependence of the
luminescence efficiency is obscure. Consequently, the potential to prepare high efficiency
and robust phosphors for diverse applications, will require strategies to control the size,

196
location, distribution, or segregation of dopant ions in nanoparticles and multiple phases
in nanocomposites.
Nanocomposite (hybrid) materials represent one of the most fascinating emerging
developments in materials chemistry. The tremendous possibilities of combining different
properties in one material initiated an explosion of ideas about potential materials and
applications. However, the basic science is sometimes still not understood. Therefore
investigations in this field in particular, to understand the structure/property relationships
are crucial.
Against this backdrop, prospects for future research work, derived from the work
presented in this thesis, are many. These include, but are not limited to the following
specific areas:
The opportunity to fine-tune (optimize) the conditions for sample preparation,
following the successful synthesis of the phosphor powders; intensity
comparable to (sometimes surpassing) that of commercial phosphors (see
Appendix).
Detailed investigation of some of the influencing parameters such as
temperature, fluxing and reducing agents, as well as TL studies, in order to
build on the currently inadequate experimental (and theoretical) databases.
Due to time constraints, it was not possible to carry out adequate TEM
analysis. For most of the investigations undertaken, TEM analysis would go a
long way in concretizing many of the conclusions arrived at. This is an
imperative tool to further gather valuable information on the crucial
parameters like, crystallinity, crystallite size and shape.
The polymer/phosphor interface is a virtually unexplored region that is
pregnant with the information, which will provide answers to the interesting
observations (e.g. the improved decay times reported in chapter 9). These
composites deserve to be further investigated.

197
Publications:
1. “Luminescent properties of long-lasting BaAlxOy: Eu2+,Dy3+ nanocomposites” –
To be published in: Journal of Applied Polymer Science. DOI 10.1002/app.
2. “Temperature dependence of the structural and luminescent properties of long-
lasting afterglow SrAlxOy: Eu2+,Dy3+ phosphor”. Submitted to: Journal of Rare
Earths.
3. “Characterization of Luminescent and Thermal Properties of Long Afterglow
SrAlxOy:Eu2+,Dy3+. Phosphor Synthesized by Combustion Method”. To be
published in; Polymer Composites. DOI 10.1002/pc.21036.
4. “Properties of Green SrAl2O4: Eu2+,Dy3+ Phosphor in LDPE and PMMA
Polymers”. Published in: Journal of Applied Polymer Science, Vol. 117, Issue 5,
pp. 2635–2640, (2010).
5. “Structural, Luminescent and Thermal Properties of Blue Sr4Al14O25: Eu2+, Dy3+
Phosphor in LDPE and PMMA Polymers”. Published in the Journal, Physica B,
pp. 4504–4508, (2009).

198
Appendix: PL intensities for the commercial and the as-synthesized
phosphors
400 450 500 550 600 650 700 7500
200
400
600
SrAlxOy:Eu2+,Dy3+
SrAlxOy:Eu2+,Dy3+
SAED(N)
SAED(O)
BAED-(N)
SAED-COM
Inte
nsity
(a.u
.)
Wavelength (nm)
BaAlxOy:Eu2+,Dy3+ Commercial SrAl
2O
4: Eu2+,Dy3+