Investigation on the crystallization mechanism difference ...
Upload
independentCategory
view
3download
0
Journal of Colloid and Interface Science 254, 64–78 (2002)doi:10.1006/jcis.2002.8548
Thermal and Structural Behavior of Milk Fat
3. Influence of Cooling Rate and Droplet Size on Cream Crystallization
Christelle Lopez,∗,† Claudie Bourgaux,‡ Pierre Lesieur,‡ Sophie Bernadou,∗,† Gerard Keller,∗ and Michel Ollivon∗,1
∗Equipe Physico-Chimie des Systemes Polyphases, UMR 8612 du CNRS, 5 rue J.B. Clement, 92296 Chatenay-Malabry, France; †ARILAIT Recherches,42, rue de Chateaudun, 75314 Paris cedex 09, France; and ‡Laboratoire pour l’Utilisation du Rayonnement Electromagnetique,
Bat. 209D Universite Paris-sud, 91898 Orsay, France
Received February 19, 2002; accepted June 14, 2002
Crystallization of triacylglycerols (TG) within milk fat globulesof creams is studied with an instrument coupling time-resolvedsynchrotron X-ray diffraction (XRDT) at both small and wide an-gles and high-sensitivity differential scanning calorimetry (DSC)at cooling rates of −3 and −1◦C/min from 60 to −10◦C and com-pared to that of the anhydrous milk fat (AMF). Simultaneous ther-mal analysis permits correlation of the formation of the differentcrystalline species monitored by XRDT to the DSC events. Underthe above cooling conditions, milk fat TG sequentially crystallize,within the globules, from about 19◦C, in three different lamellarstructures with double-chain length (2L) stackings of 47 and 42 Aand a triple-chain length (3L) stacking of 71 A, all of α type, whichare correlated to two or three overlapped exothermic peaks recordedby DSC. Compared to what is observed for AMF, TG crystallizationin emulsion (i) favors sub-α formation at low temperature and (ii)induces layer stacking defects in 3L crystals. Subsequent heatingat 2◦C/min shows numerous structural rearrangements before finalmelting, confirming that (i) cooling at −1◦C/min leads to the for-mation of unstable crystalline varieties in the dispersed state and(ii) a monotropic transition α → β ′ takes place. Similar behavioris observed for cooling at −3◦C/min and subsequent heating. Anoverall comparison of the thermal and structural properties of thecrystalline species formed as a function of the cooling rate, between>1000 and 0.15◦C/min, and stabilization time at 4◦C is given. De-pending on the cooling rate, at least five crystalline subcell speciesare observed at wide angles, α and sub-α, two β ′ and one β. Atsmall angles, at least six lamellar stackings are identified, three3L and three 2L. However, a single subcell packing (e.g., α) mightcorrespond to several longitudinal chain stackings, demonstratingthe usefulness of the small-angle XRD technique. Reconstitutedemulsions homogenized under different pressures are used to deter-mine the influence of droplet size on crystallization. The decrease ofdroplet size induces (i) a higher supercooling/supersaturation and(ii) a higher disorder and/or a smaller size of TG crystals withinthe emulsion droplets. At the supramolecular scale, polarized lightmicroscopy shows that various cooling rates applied in situ usinga temperature-controlled stage directly influence crystal sizes and
1 To whom correspondence should be addressed. Fax: 33-(1)-46-83-53-12.E-mail: [email protected].
their type of organization within milk fat globules. The faster thecooling rate, the smaller the size of the crystals within the globules.C© 2002 Elsevier Science (USA)
Key Words: cream; triacylglycerols; polymorphism; X-ray diffrac-tion; DSC; phase transitions; microscopy.
640021-9797/02 $35.00C© 2002 Elsevier Science (USA)All rights reserved.
INTRODUCTION
Emulsions are generally classified as oil in water (O/W) orwater in oil (W/O) emulsions if the oil is the dispersed or con-tinuous phase, respectively. In food emulsions, the oil phase issometimes partially crystallized at room temperature as is thecase for milk and dairy products.
In milk, the fat, mainly composed of triacylglycerols (TG),2
is dispersed in globules stabilized by a complex membrane (1).The natural fat globules may differ in composition as well as insize between cows and even between globules from one milk(1–3). Cream is the emulsion resulting from the high concen-tration of milk fat globules. The extreme wide diversity of milkfat fatty acids and TG, each characterized by its own meltingpoint, induces a resulting melting range which spans from about−40 to 40◦C. At intermediate temperature and at equilibrium(e.g., room temperature) milk fat is a mixture of crystals and oil.The thermal behavior of milk fat is usually studied by differ-ential scanning calorimetry (DSC). Authors agree on the exis-tence of three overlapped endotherms corresponding to separategroups of TG which melt separately (4, 5). The complex DSCrecordings result from both the broad distribution of TG com-position and the polymorphism of monotropic types of the TG(6). The various lamellar structures formed by TG are studied byX-ray diffraction (XRD). The longitudinal stacking of the TGmolecules and the lateral packing of their acylglycerol chainsare recorded at small and wide angles, respectively, as detailed
2 Abbreviations used: TG, triacylglycerol(s); XRD, X-ray diffraction; XRDT,X-ray diffraction as a function of temperature; PW, peak width; DSC, differentialscanning calorimetry; T , temperature; 2L, double-chain length; 3L, triple-chainlength.
L
MILK FAT POin (7). Anhydrous milk fat (AMF) crystallization was monitoredby coupled XRD as a function of temperature (XRDT) and DSCtechniques (8–10).
Fat crystallization within globules may increase emulsion in-stability. During processing and/or storage, fat crystals may pro-trude through the interfacial membrane leading to droplet coa-lescence (11). Two of the main factors affecting interdropletpiercing are crystal size and the orientation of the crystals atthe interface (12). By reducing the stability of the emulsion, fatcrystals can either alter the products or be necessary for pro-cessing. In the churning of butter, for example, the formation offat crystals is essential for emulsion destabilization. As cream iscooled, fat crystals grow and pierce the interface between twocolliding globules leading to aggregation and eventual phase in-version. This process is called partial coalescence as it leads tothe formation of aggregated, irregularly-shaped clumps ratherthan energetically favored droplets (1).
The formation of crystals of various types and sizes within fatglobules can have a considerable effect not only on the consis-tency of butter and on the physical properties of whipped cream(e.g., its stability) but also on the rheological properties of alldairy products. Thus, it is of interest to better understand milkfat crystallization within fat globules.
Fat crystallization into globules has been monitored by freeze-fracture electron microscopy (13–15) and polarized light mi-croscopy (16). Four main types of fat globules were classifiedas a function of the crystal habits for each technique (14, 16).These studies gave an insight on the orientation and the size of thecrystals at a microscopic level but only little information existson the organization of TG molecules in the crystals within fatglobules.
It has been shown recently, in our laboratory, that synchrotronXRD allows the study of fat crystallization within fat globules ofcream and even its monitoring as a function of time or temper-ature (7). Coupling simultaneous XRDT and DSC techniquespermitted the study of the crystalline varieties formed in fatglobules of cream during different cooling processes. Unsta-ble varieties were studied by quenching cream (>1000◦C/min)from 50 to −8◦C (7), while crystalline species formed duringslow cooling (0.15◦C/min) were studied in (17). In the presentstudy, the same techniques are used to determine the influence ofboth cooling rates and droplet size on the crystalline structuresformed within fat globules, starting from the characterization ofthe species formed at intermediate rate in order to complementthese previous studies. This characterization at the molecularlevel is complemented at the supramolecular scale by examina-tion, using polarized light microscopy, of both influences ontocrystal morphology within milk fat globules.
MATERIALS AND METHODS
Materials
Fresh concentrated creams (fat content = 40% (wt/wt)), re-sulting from industrial skimming of fresh whole milks, col-
YMORPHISM 65
lected in Brittany in July 2000, were purchased by a dairy plant(Laiterie du Val d’Ancenis, Ancenis, France). Anhydrous milkfat was extracted from this cream, as described in (9, 10), toallow cream/AMF comparison.
Fresh whole milk was obtained from Viltain farm (Saclay,France) immediately after collection and studied within the sameday. Sodium azide was added as a preservative to all emulsionsused. Anhydrous milk fat and β-lactoglobulin powder were pro-vided by Flechard (La Chapelle d’Andaine, France) and Triballatdairy plant (Noyal sur Vilaine, France), respectively.
Emulsion Preparation
Protein solution was prepared by adding 4 wt% β-lactoglobulin powder to the aqueous phase, composed of dis-tilled water, NaCl 80 mM, and 0.04 wt% sodium azide as apreservative, and then stirring overnight at room temperatureto ensure complete dispersion of the protein. The pH of pro-tein solution was adjusted to 6.7 with 1 M NaOH. AMF washeated at 60◦C for 20 min in order to melt all existing crys-tals. AMF and protein solution were mixed at 60◦C to give 45%(v/v) oil in the final emulsion. Emulsion premix was preparedusing the rotor stator system Polytron PT 3000 (Kinematica,Littau, Switzerland) equipped with a 12 mm head working at20,000 rpm for 30 s. Homogenization of the coarse emulsionwas then achieved at different pressures, 10, 30, 40, and 60 bar,with a high-pressure valve homogenizer (Stansted Fluid Power,Stansted, UK).
Droplet-Size Distribution Measurements
One milliliter of each reconstituted milk fat emulsion andcream was diluted in 9 ml of a sodium dodecyl sulfate (SDS)solution (SDS 1%, NaCl 80 mM, pH 6.7). This dilution helpsto defloculate the fat droplets. The droplet-size distribution wasmeasured at room temperature by laser light scattering using aMalvern Mastersizer (Malvern Instruments Ltd, Malvern, UK).The system was equipped with a lens of 45 mm focal lengthand the manufacturer’s presentation code 0505 was selectedto take into account the refractive index of milk fat. The vol-ume/surface average diameter (d32 = �ni d3
i /�ni d2i , where ni
is the number of droplets with diameter di ) of the dropletsand the fat surface area (A = 6/d32, where is the volumefraction of fat) were determined. This technique was mainlyused for relative measurement of droplet sizes of emulsionsrather than absolute characterization in order to allow theircomparison.
XRDT/DSC Measurements
Experiments were conducted by coupled X-ray diffractionas a function of temperature recorded at both small and wideangles and high-sensitivity differential scanning calorimetry.The setup used on a DCI synchrotron of LURE (Laboratoire
pour l’Utilisation du Rayonnement Electromagnetique, Orsay,France) has already been described (9, 18). Briefly, on D22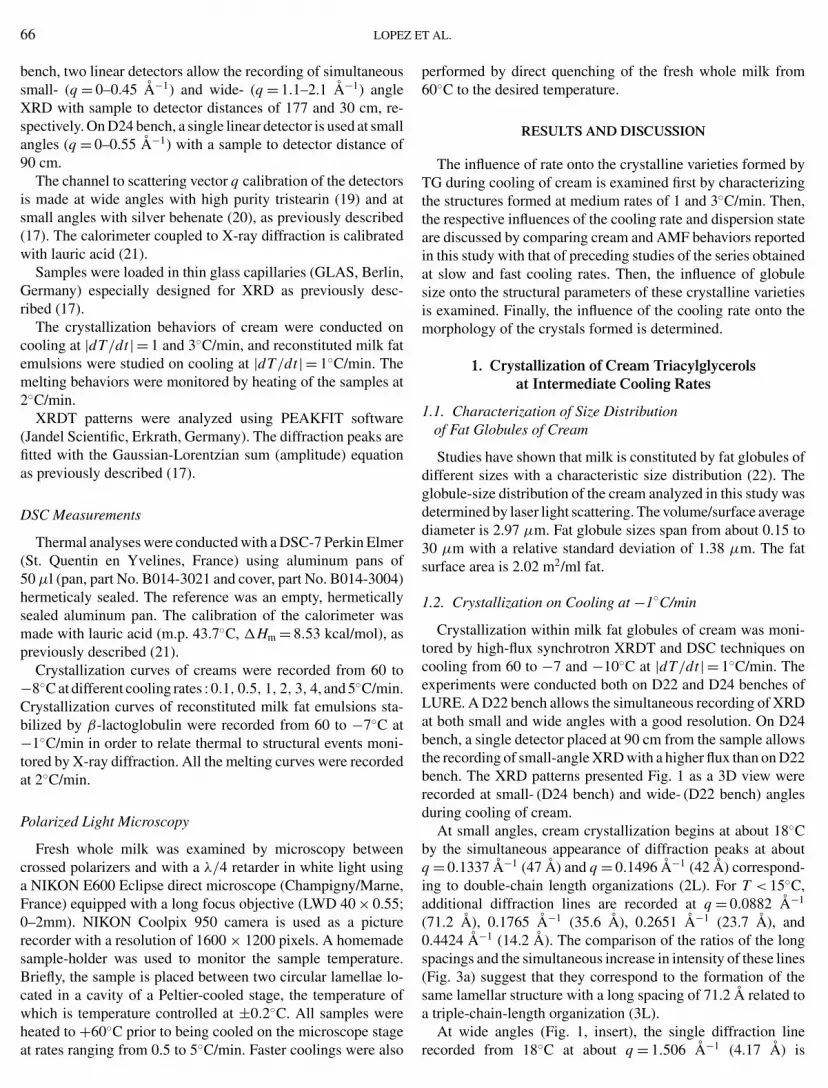
E
66 LOPEZbench, two linear detectors allow the recording of simultaneoussmall- (q = 0–0.45 A−1) and wide- (q = 1.1–2.1 A−1) angleXRD with sample to detector distances of 177 and 30 cm, re-spectively. On D24 bench, a single linear detector is used at smallangles (q = 0–0.55 A−1) with a sample to detector distance of90 cm.
The channel to scattering vector q calibration of the detectorsis made at wide angles with high purity tristearin (19) and atsmall angles with silver behenate (20), as previously described(17). The calorimeter coupled to X-ray diffraction is calibratedwith lauric acid (21).
Samples were loaded in thin glass capillaries (GLAS, Berlin,Germany) especially designed for XRD as previously desc-ribed (17).
The crystallization behaviors of cream were conducted oncooling at |dT/dt | = 1 and 3◦C/min, and reconstituted milk fatemulsions were studied on cooling at |dT/dt | = 1◦C/min. Themelting behaviors were monitored by heating of the samples at2◦C/min.
XRDT patterns were analyzed using PEAKFIT software(Jandel Scientific, Erkrath, Germany). The diffraction peaks arefitted with the Gaussian-Lorentzian sum (amplitude) equationas previously described (17).
DSC Measurements
Thermal analyses were conducted with a DSC-7 Perkin Elmer(St. Quentin en Yvelines, France) using aluminum pans of50 µl (pan, part No. B014-3021 and cover, part No. B014-3004)hermeticaly sealed. The reference was an empty, hermeticallysealed aluminum pan. The calibration of the calorimeter wasmade with lauric acid (m.p. 43.7◦C, �Hm = 8.53 kcal/mol), aspreviously described (21).
Crystallization curves of creams were recorded from 60 to−8◦C at different cooling rates : 0.1, 0.5, 1, 2, 3, 4, and 5◦C/min.Crystallization curves of reconstituted milk fat emulsions sta-bilized by β-lactoglobulin were recorded from 60 to −7◦C at−1◦C/min in order to relate thermal to structural events moni-tored by X-ray diffraction. All the melting curves were recordedat 2◦C/min.
Polarized Light Microscopy
Fresh whole milk was examined by microscopy betweencrossed polarizers and with a λ/4 retarder in white light usinga NIKON E600 Eclipse direct microscope (Champigny/Marne,France) equipped with a long focus objective (LWD 40 × 0.55;0–2mm). NIKON Coolpix 950 camera is used as a picturerecorder with a resolution of 1600 × 1200 pixels. A homemadesample-holder was used to monitor the sample temperature.Briefly, the sample is placed between two circular lamellae lo-cated in a cavity of a Peltier-cooled stage, the temperature ofwhich is temperature controlled at ±0.2◦C. All samples were
◦
heated to +60 C prior to being cooled on the microscope stageat rates ranging from 0.5 to 5◦C/min. Faster coolings were alsoT AL.
performed by direct quenching of the fresh whole milk from60◦C to the desired temperature.
RESULTS AND DISCUSSION
The influence of rate onto the crystalline varieties formed byTG during cooling of cream is examined first by characterizingthe structures formed at medium rates of 1 and 3◦C/min. Then,the respective influences of the cooling rate and dispersion stateare discussed by comparing cream and AMF behaviors reportedin this study with that of preceding studies of the series obtainedat slow and fast cooling rates. Then, the influence of globulesize onto the structural parameters of these crystalline varietiesis examined. Finally, the influence of the cooling rate onto themorphology of the crystals formed is determined.
1. Crystallization of Cream Triacylglycerolsat Intermediate Cooling Rates
1.1. Characterization of Size Distributionof Fat Globules of Cream
Studies have shown that milk is constituted by fat globules ofdifferent sizes with a characteristic size distribution (22). Theglobule-size distribution of the cream analyzed in this study wasdetermined by laser light scattering. The volume/surface averagediameter is 2.97 µm. Fat globule sizes span from about 0.15 to30 µm with a relative standard deviation of 1.38 µm. The fatsurface area is 2.02 m2/ml fat.
1.2. Crystallization on Cooling at −1◦C/min
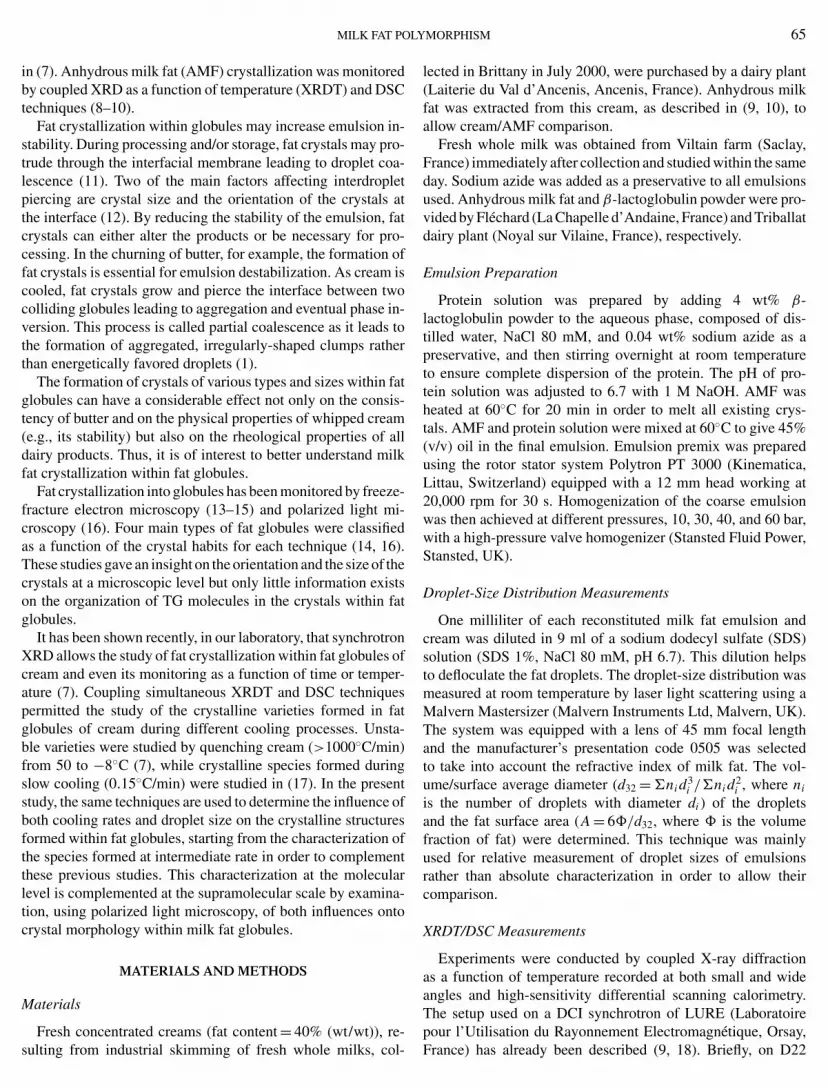
Crystallization within milk fat globules of cream was moni-tored by high-flux synchrotron XRDT and DSC techniques oncooling from 60 to −7 and −10◦C at |dT/dt | = 1◦C/min. Theexperiments were conducted both on D22 and D24 benches ofLURE. A D22 bench allows the simultaneous recording of XRDat both small and wide angles with a good resolution. On D24bench, a single detector placed at 90 cm from the sample allowsthe recording of small-angle XRD with a higher flux than on D22bench. The XRD patterns presented Fig. 1 as a 3D view wererecorded at small- (D24 bench) and wide- (D22 bench) anglesduring cooling of cream.
At small angles, cream crystallization begins at about 18◦Cby the simultaneous appearance of diffraction peaks at aboutq = 0.1337 A−1 (47 A) and q = 0.1496 A−1 (42 A) correspond-ing to double-chain length organizations (2L). For T < 15◦C,additional diffraction lines are recorded at q = 0.0882 A−1
(71.2 A), 0.1765 A−1 (35.6 A), 0.2651 A−1 (23.7 A), and0.4424 A−1 (14.2 A). The comparison of the ratios of the longspacings and the simultaneous increase in intensity of these lines(Fig. 3a) suggest that they correspond to the formation of thesame lamellar structure with a long spacing of 71.2 A related toa triple-chain-length organization (3L).
At wide angles (Fig. 1, insert), the single diffraction linerecorded from 18◦C at about q = 1.506 A−1 (4.17 A) is
Y
MILK FAT POL-7
3
13
23
33
42
52
3L
3L
3L3L
001
002
003005
2L
14.2 Å23.7Å
71.2Å
47Å
42Å2L
35.6Å
1.1 1 .3 1 .5 1 .7 1 .9 2 .1
q (Å -1 )
T (
˚ C
)
-10
0
10
20
30
40
50
sub -α
α
FIG. 1. 3D plot of the evolution of small- and wide- (insert) angle X-raydiffraction patterns recorded during cooling of cream at 1◦C/min.
characteristic of the formation of an hexagonal chain pack-ing, also called α-form, which is the most unstable packingof the acylglycerol chains. From −8◦C, the lines recorded atq = 1.503 A−1 (4.18 A) and 1.630 A−1 (3.85 A) may corre-spond to the formation of a pseudo-orthorhombic perpendicu-lar packing of the acylglycerol chains called sub-α form (seebelow).
The XRD patterns recorded both at small and wide angles asa function of temperature during cooling of cream at −1◦C/min.(Fig. 1) were analyzed using PEAKFIT Software in order to de-termine the position and the maximal intensity of each diffrac-tion peak.
The evolution of the long and short spacings deduced fromthe diffraction peaks observed in Fig. 1, respectively at smalland wide angles, are shown vs temperature in Fig. 2. At smallangles, Fig. 2a clearly shows that the long spacing of the 3L(71.2A) variety and its corresponding superior orders do notshow any significant evolution during cooling of cream. Theevolutions observed for both the 2L (47 A) and 2L (42 A) va-rieties may result from the difficulty in determining the preciseposition of the peak maxima because of their overlapping. In the18 ≥ T ≥ 2◦C domain, the spacing of the single line recorded
at wide angles, corresponding to an α form, shows a progressivedecrease from 4.17 to 4.12 A of the a parameter of the hexagonalMORPHISM 67
subcell, indicating the formation of a denser packing which isnot related to thermal dilation (Fig. 2b). In the 0 ≥ T ≥ −6◦Cdomain, the short spacing slightly increases until about 4.16 A.Then, from −8◦C, we can observe the progressive formation ofa sub-α organization characterized by two diffraction lines at4.18 and 3.85 A, with an α → sub-α polymorphic transition.
The evolutions of maximal intensities of the diffraction peaksrecorded during cooling of cream (Fig. 1) and corresponding tolong and short spacings were plotted on the same graph, Figs. 3aand b, in order to relate the longitudinal organization of the TGmolecules to their lateral packing. Figures 3a and b show thatthe 2L (47 A), 2L (42 A), and 3L (71.2 A) varieties formedduring cooling correspond to an unstable hexagonal packingof α type. The evolution of wide-angle peaks at T < −7◦C(Fig. 1, insert) shows (i) an intensity increase of the main lineat about 4.15–4.20 A correlated with (ii) a shift of this linetoward lower q, (iii) a reduction of its width, and (iv) the oc-currence of a second line at 3.83 A while (v) no evolution ofthe small-angle peaks is observed (Figs. 1 and 2). This has beeninterpreted as the formation of a sub-α organization. The tran-sition α → sub-α has already been observed in AMF at −30◦Cafter cooling at 5◦C/min (23). The α organization correspondsto a random hexagonal packing of the chains in which on av-erage one kink per chain is observed. As the temperature islowered, progressively the chains rotate less rapidly and packtogether more tightly. This transition was regarded as a secondorder one on the basis of its reversibility (see below). The ob-servation by IR on pure TG at low temperature (−50◦C) of adoublet in the rocking mode of sub-α was interpreted as theformation of an orthorhombic perpendicular lateral packing ofthe chains (24). Indeed, differentiation between α, β ′, and sub-αforms is difficult using XRD. The main difference between thetwo varieties resides in the sharpness of the wide-angle peaks,while the line at 4.2 A is sharp for sub-α, it is broad for β ′ and
-10 0 10 20Temperature (˚C)
40
50
60
70
80
Long
spa
cing
s (Å
)
3.80
4.00
4.20
Sho
rt s
paci
ngs
(Å)
2L
2L
3L(001,002,003,005)
αsub-α
a
b
FIG. 2. Evolution of the long (a) and short (b) spacings of cream fat crystalsduring cooling at 1◦C/min. Reciprocal spacings of lamellar structures are multi-
plied by their corresponding diffraction order as reported in the figure (symbolssuperimposed).
E
68 LOPEZ-10 0 10 20 30 40
20
40
60
80
100
% o
f max
imal
inte
nsity
47Å (2L)
42Å (2L)
71.2Å (3L001)
35.6Å (3L002)
23.7Å (3L003)
14.2Å (3L005)
1˚C/min
60
80
100
% o
f max
imal
inte
nsity
Subα α
-10 0 10 20 30 40Temperature (˚C)
-20
-10
0
Hea
t flo
w (
a.u.
) E
ndo
>
2L 47 Å
2L 42 Åα
3L 71.2 Å α
b
a
c
FIG. 3. Evolution of the maximal intensities of the diffraction peaksrecorded in Fig. 1 (100% corresponds to the strongest peak). (a) Evolution of thelong spacings, (b) evolution of the short spacings, and (c) DSC crystallizationcurve.
vice versa for the line at 3.83 A (Fig. 4, insert). The apparentplateau in the α form intensity evolution (Fig. 3b) which seemsincompatible with the concomitant increase in intensity of bothlong spacings around 0◦C (Fig. 3a) could be due to the α → β ′
transition.
The crystallization curve recorded by DSC during cooling ofcream at −1◦C/min shows two or three exothermal events over-
T AL.
lapping each other (Fig. 3c). The initial temperature of crystal-lization is 19.2◦C. The comparison of structural events recordedby XRDT (Fig. 1, Figs. 3a and b) and the thermal analysis mon-itored by DSC allows us to relate the first, and possibly second,exotherm to crystallization of the α 2L (47 A) and α 2L (42 A)varieties, while the following exotherm corresponds to crystal-lization of the α 3L (71.2 A) variety.
The peak width at half height (PW, expressed in A−1) of thediffraction peaks recorded at small angles can be related to struc-tural information on the organization of TG molecules into cry-stals (25). At −7◦C, the PW of the first order peak correspond-ing to the 3L (71.2 A) structure (PW 3L001 = 0.0075 A−1) isrespectively about twice and three times sharper than that of thepeaks related to the 2L varieties (PW 2L (47 A) = 0.0163 A−1;PW 2L (42 A) = 0.0227 A−1). This means either that the meansize of the 3L (71.2 A) crystals is larger than that of the 2Lcrystals or that the TG molecules are more ordered in thesecrystals. The simplification of the Scherrer equation taking intoaccount XRD at very small angles allows an approximation ofthe thickness of the crystals formed (17, 25). The equation is thefollowing, L = 4π/�q, with L (expressed in A) is the thicknessof the crystal, and �q (expressed in A−1) is the middle-heightwidth of the diffraction peak observed. Thus, we estimated thatthe 3L (71.2 A) crystals are about 1680 A (about 24 ordered tri-layers), whereas the 2L (47 A) is about 770 A and the 2L (42 A)
3L1(001)
3L1(002)
3L1(003)3L1(005)
71 .2Å
47Å2L
42Å2L
1.1 1.3 1.5 1.7 1 .9 2.1
q (Å -1 )
T (
˚ C
)
-10
0
10
20
30
40
50
sub-α
β'
3L 2(002)
65Å
2L
α
FIG. 4. 3D plots of the evolution of the small- and wide- (insert) angleX-ray diffraction patterns recorded during heating of the cream at 2◦C/min.

L
MILK FAT POis about 550 A (about 15 ordered bilayers). This difference ofcrystal thicknesses between 3L and 2L varieties is significanteven taking into account an estimated 10–15% inaccuracy onthe PW determined using PEAKFIT Software.
1.3. Melting of Cream Triacylglycerols at 2◦C/min
Following cooling at 1◦C/min, the sample of cream was im-mediately heated at 2◦C/min. The XRD patterns recorded atsmall and wide angles during heating are presented Fig. 4 as 3Dviews.
At small angles, four temperature-delimited domains can bedefined. In the −7 ≥ T ≥ 20◦C domain, the diffraction lines ofthe crystalline varieties formed on cooling (Fig. 1) decrease inintensity as a function of the increasing temperature until theyvanish. In the 16 ≥ T ≥ 24◦C domain, XRD patterns show atransition and the formation of a new diffraction line at aboutq = 0.161 A−1 (39 A) that corresponds to crystallization of a newlamellar structure with a double-chain length organization. From26 to 38◦C, small-angle XRD patterns clearly show a decrease inintensity of the bilayered structure until its final melting. Over40◦C, no diffraction lines are recorded, meaning that all TGdispersed within fat globules of cream are in their liquid state.
Four temperature-delimited domains were also easily iden-tified, during heating of cream, in the XRD patterns recordedat wide angles (Fig. 4, insert), reflecting the evolution of lat-eral packing of the acylglycerol chains until final melting of TGcharacterized by a broad scattering signal (26).
The evolution as a function of temperature of maximal in-tensities of each diffraction peak recorded at both small andwide angles during heating of cream was plotted together withDSC recording in the same figure (Fig. 5) in order to delimit thedomains of existence of the crystals.
The wide-angle XRD patterns recorded from −10◦C on aD22 bench show until about −4◦C the progressive vanishing ofsub-α peaks to the profit of the α one. The temperature rangein which it is observed does confirm that it corresponds to asub-α ↔ α transition, reversible and of the second order. Thefact that an orthorhombic packing transforms into a hexagonalone and consequently that a more ordered packing transformsinto a less stable one on heating is apparently a paradox. Infact, it is not since the sub-α ↔ α transition is not monotropicbut enantiotropic. Contrary to what is observed for other TGtransitions, this solid-solid sub-α ↔ α reversible transition (i)does not imply chain melting (27) and (ii) is not accompaniedby any long spacing change.
On heating at 2◦C/min, the decreases in intensity of the longspacings (Fig. 5a) formed on cooling are correlated with themelting of the α crystals (Fig. 5b). The α 3L (71.2 A) structure,the melting of which ends at about 16◦C, likely transforms into anew 3L packing of long spacing about 65 A, the second order lineof which is clearly recorded at about q = 0.193 A−1 (32.5 A),before vanishing at about 20◦C. The α 2L (47 A) and α 2L
◦ ◦
(42 A) crystals also melt at about 20 C. In the 17 ≤ T ≤ 24 Cdomain, the parallel increase of the long spacing recorded atYMORPHISM 69
0 10 20 30 40
60
70
80
90
100
% o
f max
imal
inte
nsity
sub ααβ '
-10 0 10 20 30 40 50
0
20
40
60
80
100
% o
f max
imal
inte
nsity
71.2Å 3L1(001)
3L1(002)
3L1(003)
47Å 2L42Å 2L32.5Å 3L2(002)
2L
2˚C/min
-10 0 10 20 30 40 50Temperature (˚C)
0.10
0.11
0.12
Hea
t flo
w (
a.u.
) E
ndo
>
2L(41.7Å)
β '
Liquid
3L(71.2Å)
2L(47Å)
3L(65Å) 2L(39.5Å)β'2L(42Å)
α + β'α
a
b
c
FIG. 5. Evolution of the maximal intensities of the diffraction peaksrecorded in Fig. 4. (a) Evolution of the long spacings, (b) evolution of the shortspacings, and (c) DSC melting curve.
q = 0.159 A−1 (39.5 A) and that of the short spacing at about3.8 A characteristic of β ′ crystals means that (i) an α → β ′ poly-morphic transition occurs and (ii) a new 2L organization of β ′
type crystallizes during heating. The long spacing of this lamel-lar structure progressively increases from 39.5 to 40.6 A (24◦C).
This crystalline structure is likely formed by the reorganizationof the TG initially incorporated in the 3L (71.2 A), 3L (65 A),
E
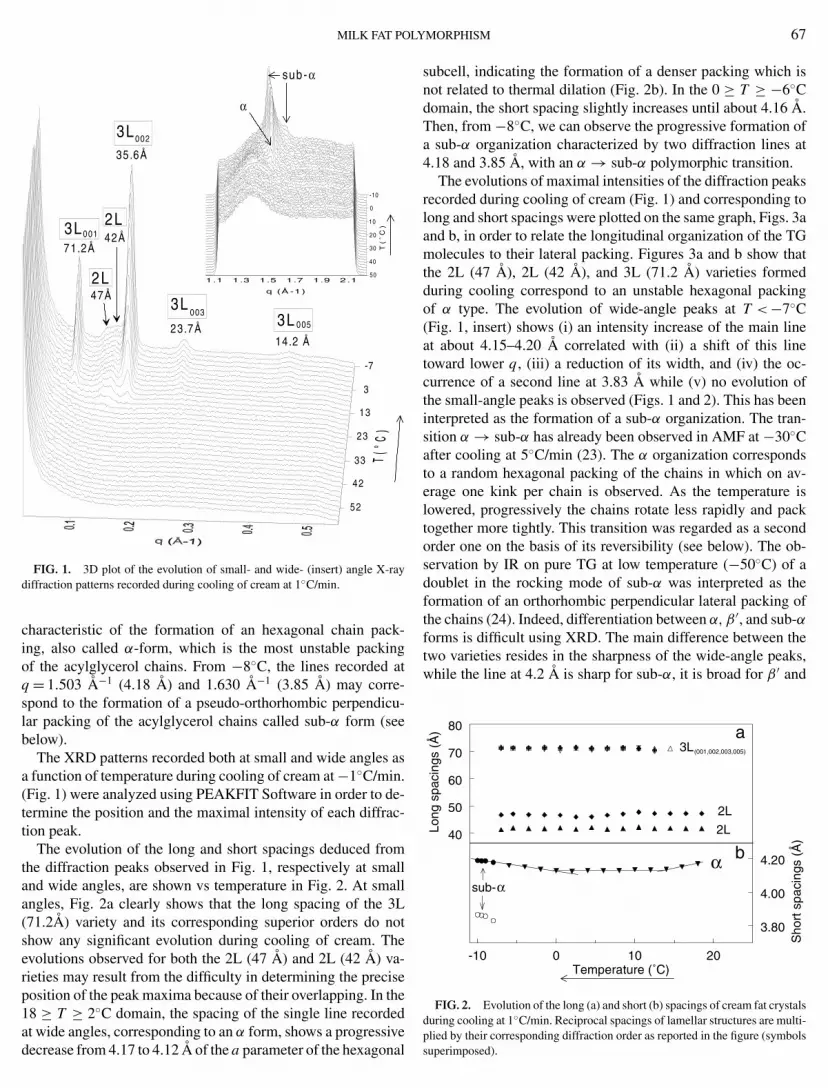
70 LOPEZ2L (47 A), and 2L (42 A) crystals. For 24 < T ≤ 38◦C, the pro-gressive decrease in intensity of the diffraction line associatedwith the β ′ 2L structure is correlated with an increase of thethickness to 41.7 A (38◦C). These results show the progressivemelting of the TG incorporated in this structure until the finalmelting of all TG dispersed in fat globules.
Thank to the above XRD analysis, the complex melting curverecorded by DSC during heating of cream at 2◦C/min is eas-ily interpreted as shown Fig. 5c. In fact, all thermal events ap-pear well separated one from the other since baseline is almostreached between each of the melting peaks making the interpre-tation easier. However likely, the separation of thermal eventsobserved is only apparent. X-ray data show that meltings arefollowed by recrystallizations from which it is possible to de-duce a partial superimposition of exothermic and endothermicevents which amplifies the oscillations in thermal recordings(see below) (27).
1.4. Influence of Dispersion State on Cooling at −1◦C/min
Crystallization behavior of the AMF extracted from creamwas monitored on cooling at −1◦C/min by coupled XRDT andDSC techniques in order to study the influence of TG disper-sion, through the comparison of both cream and AMF behaviorsstudied under the same conditions. Both small- and wide-angleXRD patterns recorded at −7◦C after cooling at −1◦C/min arepresented Fig. 6 for comparison. Figure 6a shows that the α va-riety is formed by TG in AMF while in the dispersed state thesub-α form is observed. However, this difference is not drasticsince the presence of trace amounts of sub-α form is revealedbetween −10 and −5◦C on heating after cooling of AMF at−3◦C/min down to −10◦C (28). The formation of α, sub-α, andβ ′ varieties and their coexistence have recently been observed inAMF as a function of the cooling rate used (23). On cooling at−1◦C/min, they observed the formation of both α and β ′ forms,while sub-α is found together with α crystals at cooling rates≥2.5◦C/min in AMF.
Then, the observation of sub-α in fat globules at cooling rateof −1◦C/min, which it is not observed in AMF, indicates that(i) this state of dispersion influences the α ↔ sub-α transitionand (ii) the emulsified state favors sub-α formation. The for-mation of the sub-α variety in emulsion was, to our knowl-edge, not observed before this study. Its occurrence in creamat slightly higher temperatures and slightly lower cooling ratesthan in AMF is likely related to the dispersed state; however,the influence of Laplace pressure was considered as negligibleat least for the larger droplets.
Figure 6b shows the small-angle XRD patterns recorded at−7◦C after cooling at −1◦C/min of both cream and AMF. Themain lines observed in both are identical and correspond to the3L packing observed above in cream except that (i) the longspacing observed in AMF (72.5 A) is slightly thicker than incream (71.2 A) and (ii) peak widths are larger in cream. In this
respect, Fig. 6b, insert, shows the evolution of width, calcu-lated at the middle height of the 3L peaks as a function of theirT AL.
1.10 1.30 1.50 1.70 1.90 2.10q (Å-1)
I (a.
u.)
sub-α
α
0.05 0.15 0.25 0.35 0.45q (Å-1)
0
20
40
(Tho
usan
ds)
I (co
unts
)
72.5Å
47Å 24.2Å14.5Å
36.3Å
1 2 3 4 5Diffraction order (n)
0.00
0.05
0.10
0.15
0.20
(E-1
)
PW
(q,
Å-1
)
creamanhydrous milk fat
a
b
FIG. 6. Wide- (a) and small- (b) angle X-ray diffraction patterns recordedat -7◦C after cooling at −1◦C/min of cream (thick line) and anhydrous milk fat(thin line). Insert: Evolution, as a function of the diffraction order, of the peakwidths at half-peak height (PW) corresponding to the 3L structures recorded forcream and anhydrous milk fat.
diffraction order (Miller indexes hkl, with h = k = 0, 1 ≤ 1 ≤ 5)(7). The PW dependence on the reflection order n clearly showsthat whereas PW of AMF stays nearly constant as a functionof n (PW = 0.000146 × n + 0.0069; r2 = 0.9967), PW relatedto structures formed by TG in cream increase with a linearrelationship (PW = 0.003874 × n + 0.0040; r2 = 0.9992). Thisvariation shows that defects of longitudinal stacking of the TGmolecules exist in 3L crystals within fat globules. Figure 7 fur-ther illustrates the differences in the thermal and structural be-haviors of cream and AMF on cooling at 1◦C/min (28). Whilethe main exotherms observed for both spread from about 15◦Cdown to the lowest T recorded on cooling in a similar way, initialcrystallizations start at different temperatures and in a differentway, onset of the AMF crystallization slightly preceding that ofcream. A sharp crystallization peak is observed at about 18◦Cin AMF and not in cream. This peak is due to the crystalliza-tion of 2L form(s). The fact that it is sharper in AMF recording
was related to crystal growth rate. While crystal growth, andmaterial supply for growing brought by molecular diffusion, is
LY
MILK FAT PO-5 0 5 10 15 20 25 30 35 40Temperature (˚C)
-0.75
-0.63
-0.51
-0.39
-0.27
-0.15
(E-1
)
Hea
t flo
w (
mV
/mg)
> -1˚C/min
Cream
Anhydrous milk fat
2L
3L
2L3L
FIG. 7. DSC recordings obtained during cooling of cream and anhydrousmilk fat at 1◦C/min.
necessarily limited in fat globules, it is not so in a far greatervolume of bulk fat.
2. Influence of the Cooling Rate on TG Crystallizationin Cream Globules
Using the same techniques, in previous studies of the se-ries, we examined the formation of the most unstable structuresformed within globules after a rapid quenching from 50 to −8◦C(7) and the structures formed on slow cooling at 0.15◦C/min (17).The evolution of cream and AMF during storage at 4◦C was alsorecently investigated (29). In the present work, the formation ofcrystalline varieties is examined at intermediate cooling rates,−1◦C/min (detailed above) and −3◦C/min (briefly exposed be-low), and compared to that observed in the studies moted above,in order to make a broad comparison of the thermal and struc-tural behaviors of milk fat dispersed in emulsion as a function
of the cooling rate (to note, further reference to these works is first endotherm (frequently attributed to the low-melting-point not made below for clarity).TABLE 1Initial Temperatures of Crystallization and Final Melting Pointsa of the Thermal Events Recorded by Differential Scanning Calorimetry
during Cooling of Cream at Different Rates and Their Following Meltings at 2◦C/min
Cooling at different rates Heating at 2◦C/min
dT/dt (◦C/min) 1st exotherm 2nd exotherm 1st endotherm 2nd endotherm 3rd endotherm
0.1 20.64 ± 0.30 20.31 ± 0.26 — — 38.70 ± 0.070.5 20.37 ± 0.30 18.02 ± 0.37 17.12 ± 0.01 22.79 ± 0.15 38.53 ± 0.11
1 19.69 ± 0.42 17.82 ± 0.23 13.22 ± 0.64 20.89 ± 0.40 39.21 ± 0.352 19.26 ± 0.33 17.48 ± 0.45 14.06 ± 0.43 21.24 ± 0.44 38.72 ± 0.273 18.73 ± 0.37 17.11 ± 0.41 14.11 ± 0.29 21.32 ± 0.42 38.62 ± 0.244 18.43 ± 0.34 16.88 ± 0.42 14.08 ± 0.26 21.47 ± 0.44 38.52 ± 0.155 18.12 ± 0.29 16.49 ± 0.38 13.90 ± 0.22 21.52 ± 0.35 38.49 ± 0.07
fraction, noted LMF) recorded during heating corresponds to
a Final melting points were expressed as temperatures of completion of the end
MORPHISM 71
2.1. Thermal Behaviors of Dispersed Fat as a Functionof the Cooling Rate
The thermal behaviors of TG dispersed within milk fat glob-ules of creams were monitored by DSC on cooling at differentrates ranging from 0.1 to 5◦C/min (Fig. 8a) and then immediatelyon heating at the same rate, 2◦C/min, in order to study the influ-ence of the cooling rate on the evolution of crystalline structuresduring their melting (Fig. 8b). Both crystallization and meltingcurves were recorded at least in triplicate using the same ap-paratus (DSC-7, Perkin Elmer) with different cream samples inorder to study the repeatability of the thermal behaviors. How-ever, a single set of crystallization and melting curves is shownfor comparison in Fig. 8.
Two exothermal events corresponding to very different en-thalpies of crystallization are always recorded on cooling, a sharpbut small peak, due to the crystallization of 2L forms, (some-time a double peak is observed) precedes an important but broadone, related to 3L packing. However, both peaks overlap moreor less depending on the cooling rate. Their initial temperaturesof crystallization depend on the DSC scanning rates (Table 1).The faster the rate the lower the crystallization temperature cor-responding to both thermal events. This temperature shift is re-lated to supercooling relaxation and then to the nucleation ratein the dispersed phase.
On heating at 2◦C/min (Fig. 8b), it is observed that the separa-tion between thermal events depends on the cooling rate, Rc, andthen on the metastability of the crystalline varieties formed oncooling (4, 5, 8, 23). Whereas the DSC melting curve recordedafter cooling of cream at 0.1◦C/min only shows overlapped en-dotherms, a succession of endotherms and exotherms is recordedafter cooling at Rc ≥ 0.5◦C/min Surprisingly, the faster Rc, themore marked the peak separation. This confirms the hypothesismade above about the existence of exothermal processes orig-inating from monotropic transitions on heating, except at theslowest rates. This shows that only structural analysis realizedfrom XRDT data allows identification of thermal events. The
otherms (offsets).

E
◦
72 LOPEZ
-10 0 10 20 30 40 50
Temperature (˚C)
-30
-20
-10
0
Hea
t flo
w (
a.u.
) E
ndo
>
0.1˚C/min0.5˚C/min
2˚C/min
5˚C/min
cooling rates
a
b
Hea
t flo
w (
a.u.
) E
ndo
>
2˚C/min
-0.5˚C/min
-0.1˚C/min
-2˚C/min
-5˚C/min
Cooling
rates
LMF MMF HMF
3L 2L 2L
FIG. 8. Influence of cooling rate on cream DSC recordings. (a) Crystal-lization curves recorded at different cooling rates as indicated in the figure. (b)Corresponding melting curves recorded, immediately after cooling, on heatingat 2◦C/min.
melting of 3L structures. The second endotherm (related to themedium-melting-point fraction, noted MMF) corresponds tomelting of the 2L structures formed during cooling. Then, thelast endothermic massif (high-melting-point fraction, notedHMF) corresponds to the progressive melting of the 2L structureformed during heating until final melting of TG dispersedwithin fat globules of creams. Compositions of the TG fractionshave already been studied in AMF and will not be discussedhere (8). The final melting temperatures of these three majorendotherms recorded during heating at 2◦C/min are presentedTable 1. Contrary to the negative influence of cooling rate on theinitial crystallization temperature that is clearly evidenced anddiscussed above, that of heating could not be analyzed in thesame way because of the weakness of the variations observedon the final melting point and of a possible indirect influenceof the polymorphism. Roughly, the final melting point of cream
fat can be considered as independent of the cooling rate and asa consequence of the stability of the varieties formed.T AL.
2.2. Structural Behaviors of Fat Globules as a Functionof the Cooling Rate
Crystallization at 3◦C/min. The crystallization of cream fathas been studied on cooling at 3◦C/min using the same tech-niques (data not shown). Crystallization of TG within fat glob-ules starts by the formation of two 2L structures at about 47.3and 41 A, followed by the crystallization of a 3L (71.2 A) variety.At wide angles, initial crystallization is observed in the α form,then two diffraction lines recorded for T < −6◦C correspondto the formation of sub-α. On heating at 2◦C/min, wide-angleXRD patterns show the sub-α → α → β ′ transition and the melt-ing of all TG dispersed in globules. At small angles, the samestructural changes as those observed after cooling at 1◦C/minare recorded. Briefly, the same crystalline varieties are formedin cream on cooling at −1 and −3◦C/min and upon subsequentheating. However, increasing the cooling rate decreases the ini-tial temperature of crystallization.
Influence of cooling rate. The XRD patterns recorded at bothsmall and wide angles at the end of each cooling process studiedand after conditioning of cream under isothermal conditions at4◦C are shown together Fig. 9 for comparison while the cor-responding data are presented in Table 2. This figure whichdisplays very different patterns demonstrates that (i) crystal-lization within milk fat globules occurs successively into three,four, or five different varieties depending on the cooling rateand (ii) they are only identified at small angles. The comparisonof the small number of crystal type formed to the large num-ber of TG present in milk fat is evidence that mixed crystals areformed within fat globules. Mixed crystals formation was shown
0.05 0.15 0.25 0.35 0.45 0.55q (Å-1)
I (a.
u.)
3L2(002)
3L2
3L 3L(002)
3L(003) 3L(005)
2L
2L
-3˚C/min
-1˚C/min
-0.15˚C/min
quenching
4˚C
40.5Å
65Å
70-72Å
2L
54.2Å3L
3L(002)
46-48Å
40-42Å 1.2 1.3 1.4 1.5 1.6 1.7q (Å-1)
I (a.
u.)
α
β'
α
sub-α
sub-α
β
β'
1β'2α
-3˚C/min
-1˚C/min
4˚C
-0.15˚C/min
quenching
orsub-α
FIG. 9. Small- and wide- (insert) angle X-ray diffraction patterns observedat 4◦C after stabilization and recorded at −8◦C after cooling of creams at thedifferent rates indicated in the figure. Quenching corresponds to a cream sampleanalyzed immediately after quenching to −8◦C (from Ref. 7); 4◦C is recordedafter about 4 days after quenching at 4◦C (from Ref. 29); 0.15, 1, and 3◦C/min
are the cooling rates employed to cool samples to −8 C (from Ref. 17 and thispaper).
MILK FAT POLYMORPHISM 73
TABLE 2Long and Short Spacings Observed by XRD after Cooling of Cream at Different Rates
Long spacings Middle-height Short(A) Type peak width (A−1) spacings (A) Subcell
Quenchinga 70.4 3L(001) 0.0159 4.21 α (or α + sub α)(>1000◦C/min) 47 2L (metastable) 0.0102
35.8 3L(002) 0.008023.7 3L(003) + 2L(002) 0.0120
3◦C/min∗ 47.3 2L 4.17 α then sub α
41 2L71.5 3L(001) 0.007835.8 3L(002) 0.012023.8 3L(003) 0.015114.3 3L(005) 0.0265
1◦C/min∗ 47 2L 4.17–4.12 α then sub α
42-41 2L71.2 3L(001) 0.0077 4.18 + 3.8535.6 3L(002) 0.011423.7 3L(003) 0.014414.2 3L(005) 0.0222
0.15◦C/min∗,b 46.5 2L 4.19 α then α + β ′40 2L71.3 3L1(001) 0.0071 4.2235.6 3L1(002) 0.0115 3.8523.7 3L1(003) 0.015314.2 3L1(005) 0.016365 3L2(001) 0.017932.5 3L2(002) 0.0218
Note. 2L, double-chain length structure; 3L, triple-chain length structure; ∗in the chronological order of occurrence.
a From Ref. (7).b From Ref. (17).in anhydrous milk fat by several authors using thermal analysis(1, 30).
On cooling, whatever the rate in the temperature range stud-ied, the first longitudinal organizations of TG molecules dis-persed within fat globules correspond to 2L structures with longspacings of about 40–42 and 46–48 A (see above, 17). Thesecrystalline varieties may correspond to crystallization of high-melting-point TG. These 2L crystals are generally formed byTG with saturated and similar chain lengths fatty acids (31) like1-myristoyl, 2,3-palmitoyl glycerol (MPP) or tripalmitoyl glyc-erol (PPP) (8). Then, crystallization of 3L structures (about 70 A)characterized by several orders of diffraction occurs. The forma-tion of a 3L (65 A) structure was only observed on slow coolingat −0.15◦C/min. Triple chain length stackings may correspondto crystallization of unsaturated TG molecules, or to that of TGwith fatty acid chains of different lengths (31) like 1-butyroyl,2,3-palmitoyl glycerol (BuPP) or 1-oleyl, 2,3-palmitoyl glyc-erol (OPP) (8). However, as shown Fig. 9, even this very slowcooling (0.15◦C/min) does not provide the ultimate stabiliza-tion of structure. Apparent stabilization is only attained afterfew days storage at 4◦C in our experiments. It is worth noting
the difference between the structure formed after slow coolingand after storage. While the major species formed in the slowlycooled sample is 3L and the 2L variety, the long spacing, whichis 40.5 A, represents only a minor fraction, the main speciesobserved after storage is 2L. Indeed, a slow transition occursduring the storage at 4◦C (29). During this storage, the major 3Lvariety at 70 A, which completely vanishes, is replaced by a 3Lat 54.2 A.
The comparison of half-height peak widths (2L and 3L stack-ing peaks) observed at small angles as a function of coolingrate is also of interest. PW of 3L lines deduced from Fig. 9 areall similar and almost independent of cooling rate except forthat observed after quenching of cream which is sharper (PWvalue measured on 3L002 for accuracy). The PW measured forthe main 2L variety observed after cream storage at 4◦C is sur-prisingly very broad. As a consequence and surprisingly, thelonger the time of stabilization (or the slower the cooling rate)the broader the PW. According to the currently accepted under-standing of polymorphisms for pure compounds, a more stablevariety should display sharper peaks than unstable ones and thisis indeed the case for tristearin. On the contrary, in the case ofa broad mixture of TG, it seems that the more stable speciesdisplays much broader peaks than unstable ones (Fig. 9). Theobservation of such a broadening for the more stable species
can be interpreted as a deformation of the crystalline structure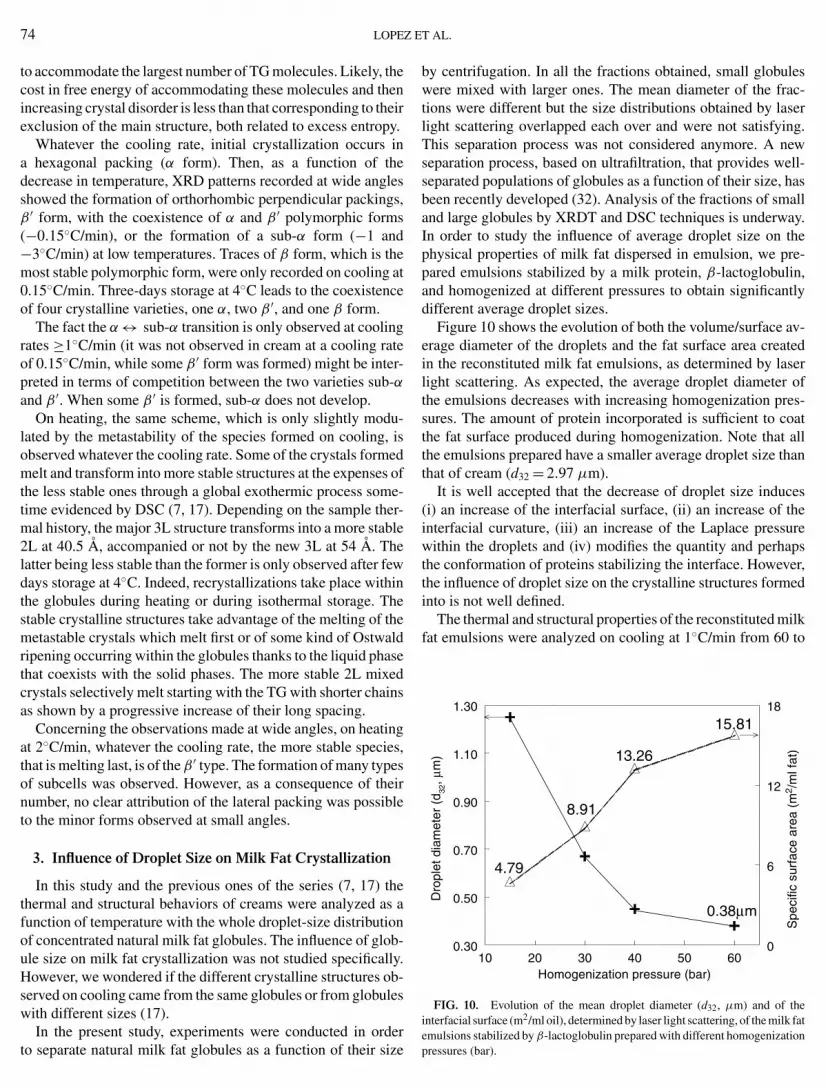
E
74 LOPEZto accommodate the largest number of TG molecules. Likely, thecost in free energy of accommodating these molecules and thenincreasing crystal disorder is less than that corresponding to theirexclusion of the main structure, both related to excess entropy.
Whatever the cooling rate, initial crystallization occurs ina hexagonal packing (α form). Then, as a function of thedecrease in temperature, XRD patterns recorded at wide anglesshowed the formation of orthorhombic perpendicular packings,β ′ form, with the coexistence of α and β ′ polymorphic forms(−0.15◦C/min), or the formation of a sub-α form (−1 and−3◦C/min) at low temperatures. Traces of β form, which is themost stable polymorphic form, were only recorded on cooling at0.15◦C/min. Three-days storage at 4◦C leads to the coexistenceof four crystalline varieties, one α, two β ′, and one β form.
The fact the α ↔ sub-α transition is only observed at coolingrates ≥1◦C/min (it was not observed in cream at a cooling rateof 0.15◦C/min, while some β ′ form was formed) might be inter-preted in terms of competition between the two varieties sub-αand β ′. When some β ′ is formed, sub-α does not develop.
On heating, the same scheme, which is only slightly modu-lated by the metastability of the species formed on cooling, isobserved whatever the cooling rate. Some of the crystals formedmelt and transform into more stable structures at the expenses ofthe less stable ones through a global exothermic process some-time evidenced by DSC (7, 17). Depending on the sample ther-mal history, the major 3L structure transforms into a more stable2L at 40.5 A, accompanied or not by the new 3L at 54 A. Thelatter being less stable than the former is only observed after fewdays storage at 4◦C. Indeed, recrystallizations take place withinthe globules during heating or during isothermal storage. Thestable crystalline structures take advantage of the melting of themetastable crystals which melt first or of some kind of Ostwaldripening occurring within the globules thanks to the liquid phasethat coexists with the solid phases. The more stable 2L mixedcrystals selectively melt starting with the TG with shorter chainsas shown by a progressive increase of their long spacing.
Concerning the observations made at wide angles, on heatingat 2◦C/min, whatever the cooling rate, the more stable species,that is melting last, is of the β ′ type. The formation of many typesof subcells was observed. However, as a consequence of theirnumber, no clear attribution of the lateral packing was possibleto the minor forms observed at small angles.
3. Influence of Droplet Size on Milk Fat Crystallization
In this study and the previous ones of the series (7, 17) thethermal and structural behaviors of creams were analyzed as afunction of temperature with the whole droplet-size distributionof concentrated natural milk fat globules. The influence of glob-ule size on milk fat crystallization was not studied specifically.However, we wondered if the different crystalline structures ob-served on cooling came from the same globules or from globuleswith different sizes (17).
In the present study, experiments were conducted in order
to separate natural milk fat globules as a function of their sizeT AL.
by centrifugation. In all the fractions obtained, small globuleswere mixed with larger ones. The mean diameter of the frac-tions were different but the size distributions obtained by laserlight scattering overlapped each over and were not satisfying.This separation process was not considered anymore. A newseparation process, based on ultrafiltration, that provides well-separated populations of globules as a function of their size, hasbeen recently developed (32). Analysis of the fractions of smalland large globules by XRDT and DSC techniques is underway.In order to study the influence of average droplet size on thephysical properties of milk fat dispersed in emulsion, we pre-pared emulsions stabilized by a milk protein, β-lactoglobulin,and homogenized at different pressures to obtain significantlydifferent average droplet sizes.
Figure 10 shows the evolution of both the volume/surface av-erage diameter of the droplets and the fat surface area createdin the reconstituted milk fat emulsions, as determined by laserlight scattering. As expected, the average droplet diameter ofthe emulsions decreases with increasing homogenization pres-sures. The amount of protein incorporated is sufficient to coatthe fat surface produced during homogenization. Note that allthe emulsions prepared have a smaller average droplet size thanthat of cream (d32 = 2.97 µm).
It is well accepted that the decrease of droplet size induces(i) an increase of the interfacial surface, (ii) an increase of theinterfacial curvature, (iii) an increase of the Laplace pressurewithin the droplets and (iv) modifies the quantity and perhapsthe conformation of proteins stabilizing the interface. However,the influence of droplet size on the crystalline structures formedinto is not well defined.
The thermal and structural properties of the reconstituted milkfat emulsions were analyzed on cooling at 1◦C/min from 60 to
10 20 30 40 50 60Homogenization pressure (bar)
0.30
0.50
0.70
0.90
1.10
1.30
Dro
plet
dia
met
er (
d 32, µ
m)
0
6
12
18
Spe
cific
sur
face
are
a (m
2 /m
l fat
)
0.38µm
4.79
8.91
13.26
15.81
FIG. 10. Evolution of the mean droplet diameter (d32, µm) and of theinterfacial surface (m2/ml oil), determined by laser light scattering, of the milk fat
emulsions stabilized by β-lactoglobulin prepared with different homogenizationpressures (bar).
Y
MILK FAT POL0 10 20 30Temperature (˚C)
-0.30
-0.24
-0.18
-0.11
-0.05
0.01
(E-1
)
Hea
t flo
w (
a.u.
) E
ndo
>
1.25µm
0.67µm
0.45µm
0.38µm10 20 30 40 50 60
Homogenization pressure (bar)
10
11
12
13
14
15
Ons
et (
˚C)
14.1°C
11.6˚C
11.3˚C
10.9˚C
(1.25 m)
(0.67 m)
(0.45 m)
(0.38 m)
FIG. 11. Crystallization curves recorded by DSC during cooling at 1◦C/minof the milk fat emulsions stabilized by β-lactoglobulin and characterized bydifferent mean droplet diameters as indicated in the figure. Insert : Evolution ofthe initial crystallization temperature (onset) as a function of the homogenizationpressure.
−7◦C, respectively by DSC and XRDT techniques in order tostudy the influence of droplet size on milk fat crystallization.
3.1. Thermal Analysis
The crystallization curves recorded during cooling of theemulsions at 1◦C/min are presented in Fig. 11. Reducing thesize of the emulsion droplets induces a higher supercooling.The initial crystallization temperature is displaced toward thelower temperatures (Fig. 11, insert). The differences in super-cooling found for the four emulsions can be explained by thetheory of nucleation for crystallization (33). The impurities thatcatalyze nucleation under a given condition always increaseswith decreasing temperature. When the liquid fat is dispersed inglobule emulsion, at least one nucleus must be formed in everydroplet to achieve full crystallization. The time needed to obtainthe first nucleus is inversely proportional to globule volume. Thisimplies that a lower temperature is needed for a finer dispersionsince more catalytic impurities are needed.
3.2. Structural Analysis
Crystallization behaviors of reconstituted milk fat emulsionscharacterized by different average droplet sizes were monitoredon a D22 bench on cooling at 1◦C/min with XRD patterns of120 s (data not shown). Whatever the size of droplets in whichmilk fat is dispersed, crystallization occurs in the α 3L (72 A)variety. The temperature at which the crystalline structure isformed depends on the size of the emulsion droplets, as shownby DSC recordings. In comparison with crystallization of naturalmilk fat globules under the same conditions, the absence of initial
crystallization leading to 2L structures may be due to the sizeof the droplets. However, the noise recorded at q ∼ 0.16 A−1MORPHISM 75
prevented us to conclude about the existence of a 2L crystallineform.
Study of the diffraction lines recorded at small angles at –7◦Cafter cooling of the emulsion homogenized at 15 bar shows thatthe peak width increases with the orders of reflection associatedwith the same crystalline structure (PW(3L001) = 0.0037 A−1;PW(3L002) = 0.0046 A−1; PW(3L003) = 0.0049 A−1) whichmeans that defects are incorporated in the organization of thelamellar structures (25). Similar results were obtained with allthe emulsions.
The small-angle XRD patterns recorded at −7◦C after cool-ing at 1◦C/min of the four emulsions characterized by differentaverage droplet sizes are presented Fig. 12. The decrease of thedroplet size induces (i) a decrease of the intensity diffracted cor-related with (ii) an increase of the peak width. This broadeningof small-angle XRD peaks has several possible origins. It mightbe the consequence of (i) the increase of the curvature of the in-terface from which crystals are supposed to grow, (ii) the changeof the interfacial molecules through the nucleation, (iii) the rateof crystallization, or any combination of them. The influence ofthe concentration and the conformation of the molecules at inter-face, proteins adsorbed, and/or lipids, which vary as a functionof the droplet size, is not addressed here.
The influence of the curvature could be direct since crystalsare supposed to grow linearly along one, two, or three priv-ileged directions leading respectively to needles, platelets, orparallelepiped-like crystal shapes. Depending on the location ofits nucleating site, the crystal starts to grow from the interface orfrom the bulk phase of the droplet. For the hypothesis of a nu-cleation at the interface the crystal might grow either toward theglobule interior or along the interface. Freeze fracture electron
0.02 0.08 0.14 0.20 0.26 0.32q (Å-1)
Inte
nsity
(co
unts
)
1.25µm
0.67µm
0.45µm
0.38µm
0.3 0.5 0.7 0.9 1.1 1.3Average droplet diameter (µm)
0.004
0.006
0.008
MH
PW
(q,
Å-1
)
20
40
60
80
100
% o
f max
imal
inte
nsity
FIG. 12. Small-angle X-ray diffraction patterns recorded at −7◦C aftercooling at 1◦C/min. of the milk fat emulsions characterized by different meandroplet diameters as indicated in the figure. Insert: Evolution of the middle-
˚ −1
height peak width (expressed in A ) as a function of the mean droplet diameterof the emulsions.
E
76 LOPEZmicroscopy micrographs showing concentric shells of crystalsgrowing “parallel” to the interface suggests that the broaden-ing of small-angle XRD peaks could be related to the interfacecurvature by mean of crystal bending. Indeed, bidimensionalgrowing at the globule interface, leading to platelet-like crystalsin open space, induces constraints in the crystals that shouldbe reflected by small-angle XRD peak widths. On the contrary,crystal growth in the direction of (or from) the globule interiorshould not be submitted to constraints until the crystal reachesthe interface. Four types of organizations of the crystals withinthe milk fat globules have been observed (16). Microscopyshows that this organization depends on the cooling rate (seebelow).
The broadening observed could also be a consequence of thevariation of the initial crystallization temperature observed byDSC (see above). The delay observed for the crystallization ofthe smaller droplets, which is related to their nuclei distribu-tion, increases the supercooling of the fat inside the globules(Fig. 11). The supercooling relaxation which occurs during thecrystallization process influences the crystal growth rate andconsequently the number and the type of defects or the crys-tal size generated during the crystallization process. The largerthe supercooling the faster the crystal growth and the larger thecrystal disorganization inside the globules.
Most of the results obtained here about the influence of dropletsize onto crystalline behavior are correlated with those ob-tained on a newly defined milk fat model based on a cocoabutter/miglyol mixture (34) used to study crystallization in emul-sion (35).
4. Monitoring of Fat Globule Crystallizationin Polarized Light Microscopy
In order to relate the molecular organization of TG withinthe crystal, deduced from XRD analysis, to its morphology, wemonitored crystallization of fat in bulk (28) and within naturalmilk globules in situ using polarized light microscopy at coolingand heating rates similar to those employed above.
Fresh whole milk was examined as a function of cooling ratefrom 60 to −8◦C. The initial temperature was chosen to ensurethat all crystals are destroyed. The sample was directly cooled ina temperature-controlled stage of the microscope as explainedabove.
Rapid quenching (<5 s) from 60 to −8◦C was obtained byfast positioning the hot sample on the precooled stage. The crys-tallization in milk fat globules as resulting from rapid quenchingis shown Fig. 13a. In principle, birefringence of the crystals al-lows determination of their mean orientation and size. In thelarge globules many very small crystals are observed with nopreferred orientation. The mean size of the crystals is about1 µm. The morphology and location of these crystals within theglobule are rather close to those of the needle type (N) observedby (16) while needles are imbricated one into the other within the
globule. Then, in the image shown Fig. 13a, the mean spot sizerepresents more or less the cross section of the needle. In fact,T AL.
the mean size observed might likely be underestimated since,at least in the largest globules, the birefringence observed re-sults from the sum of birefringences of several crystals packedone on the top of the other in the fat globule. In the small-est globules, no layered birefringence is observed. Some of theglobules appeared not birefringent, or very weakly, while at thetemperature of observation it is unlikely that the fat remainedliquid. The very small size of the crystals formed by quenchingmight not allow visualization of them. These last globules wereattributed to type O (16). Then, whatever globule size, “shell-crystallization” is excluded directly after rapid quenching offresh whole milk.
At slow cooling rates (0.5◦C/min) from 60 to −8◦C, thelargest globules display needle-shaped crystals correspondingto type (N) as well as some mixed ( layered + needle) crys-tals attributed to type M (Fig. 13b). The size of the crystalsobserved depends on globule diameter. In the largest globules,the crystal size is larger than 10 µm. In the smallest glob-ules and in some medium-sized globules, the layered birefrin-gence similar to the Brewster cross of radially organized crys-tallizations, e.g., spherulites, was frequently observed as shownFig. 13b. In addition, most of the small globules show bire-fringence. The crystal growth has been monitored during thecooling at 0.5◦C/min by comparing photos taken every minute.It appeared that the largest needles resulted from slow crys-tallization while the layered crystals in the smaller globulesappeared more rapidly (data not shown). This phenomenonmight be related to larger supersaturation in the smallestglobules.
At medium cooling rates (Fig. 13c), the crystallization processis intermediate between that observed after slow cooling and fastquenching with formation of N and layered (L) types. The fasterthe cooling rate the smaller the crystals formed and the less thenumber of birefringent globules. It is worth noting that usingthese criteria, it was possible to distinguish between samplescooled at 1 and 2◦C/min.
The mean size of the crystals observed for fast cooling rates inthe largest globules (in the smallest globules, this size cannot bemeasured) is in the 1–3 µm range (Figs. 13a and c). It is worthremarking that even for quenched sample, this mean size is aboutone order of magnitude larger than that calculated using Scherrerequation. However, the thickness of the crystals, which is thedirection to be considered for the broadening of long spacinglines, might be one order of magnitude smaller than their length.This consideration prevents concluding that the crystal size isresponsible for broadening of XRD peaks.
The above examination of the influence of the cooling rate bypolarized microscopy has shown that the rate of cooling deter-mines the type and size of the crystals formed. The faster therate the smaller the crystals and the less the influence of inter-face on crystal orientation (Brewster cross of radially organizedcrystallization are mainly observed at slow cooling rates). There-
fore, the influence of interface curvature is less likely at the fastcooling rates at which peak broadening has been observed.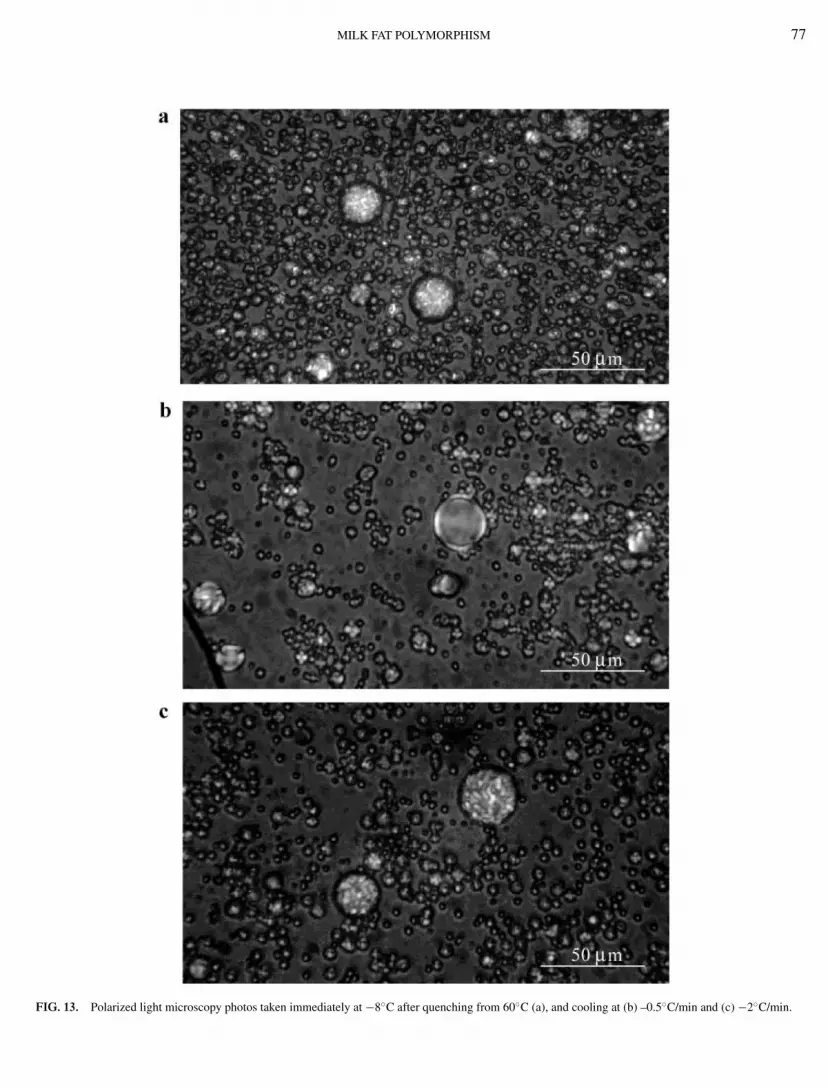
MILK FAT POLYMORPHISM 77
FIG. 13. Polarized light microscopy photos taken immediately at −8◦C after quenching from 60◦C (a), and cooling at (b) –0.5◦C/min and (c) −2◦C/min.
E
78 LOPEZConcerning the globule size, the heating at 60◦C applied to themilk to destroy sample thermal history leads to some coalescenceevidenced by the observation of a larger mean size of heat-treatedglobules. Therefore, the crystallization process observed in thelargest globules is not necessarily representative of that in nativemilk so great care should be taken to control that crystallizationoccurring in middle-size globules is similar to that is observedin the largest ones.
In summary, it was observed that (i) crystal habit within fatglobules strongly depends on the cooling conditions and globulesize, (ii) the faster the cooling the smaller the size of the crystals,(iii) the slower cooling was found to favor the formation of lay-ered crystals in the smaller globules, and (iv) the slow coolinglikely leads to the crystallization of a larger number of smallglobules compared to the fast process. It has also been observedthat needle-like crystals induce deformation of the oil/water in-terface of the fat globule (Fig. 13).
CONCLUSION
The use of high-flux X-ray sources (synchrotron) allowedstudy of the polymorphism and phase transitions displayed bycomplex TG mixtures as a function of temperature. X-ray char-acterization at both small and wide angles permitted identifica-tion at the molecular scale, respectively, of the TG longitudinalstacking and the lateral packing in lamellar structures withinmilk fat globules. At low temperatures, the coexistence of sev-eral crystalline organizations was frequently observed at bothsmall and wide angles within the fat globule. Thanks to the res-olution obtained with the various setups used in these studies,the small-angle analysis performed for the first time on milk fatin the dispersed phase is essential in such an identification of thecrystalline structures and of their thermally induced transitions.The coupling of this technique with a DSC recording permittedus to relate these transitions to the thermal behavior of cream.These tools allowed, for the first time to our knowledge, the iden-tification and the characterization of crystalline structures withinwater-dispersed and highly complex, natural or processed, foodproducts as well as their transitions. The fat concentration inthese studies which varied between 40 and >60% was prettyhigh. Recent studies (Lopez et al., in preparation) show thatsuch investigations are also possible within the fat globule offresh whole milk.
ACKNOWLEDGMENTS
The authors thank ARILAIT Recherches (Paris, France) and ANRT (Paris,France) for supporting this research. They also thank the dairy plant Laiteriedu Val d’Ancenis (Ancenis, France) for providing cream samples and Mr. A.Riaublanc (INRA-LEIMA, Nantes, France) for valuable discussions as well
as all the members of the steering committee on fat research of ARILAITRecherches.T AL.
REFERENCES
1. Mulder, H., and Walstra, P., “The Milk Fat Globule.” Center for Agri-cultural Publishing and Documentation, Wageningen, The Netherlands,1974.
2. Walstra, P., and Borggreve, G. J., Neth. Milk Dairy J. 20, 140 (1966).3. Timmen, H., and Patton, S., Lipids 23, 685 (1988).4. Timms, R. E., Aust. J. Dairy Technol. 35, 47 (1980).5. Marangoni, A. G., and Lencki, R. W., J. Agric. Food Chem. 46, 3879 (1998).6. Hagemann, J. W., in “Crystallization and Polymorphism of Fats and Fatty
Acids” (N. Garti and K. Sato, Eds.), p. 9. Dekker, New York, 1988.7. Lopez, C., Lesieur, P., Keller, G., and Ollivon, M., J. Colloid Interface Sci.
229, 62 (2000).8. Lavigne, F., Polymorphisme et transitions de phases des triglycerides. Ap-
plications aux proprietes thermiques et structurales de la matiere grasselaitiere anhydre et ses fractions. Ph.D., Univ. Paris VII, Paris XI et ENSIA,1995.
9. Lopez, C., Lavigne, F., Lesieur, P., Bourgaux, C., and Ollivon, M., J. DairySci. 84, 756 (2001).
10. Lopez, C., Lavigne, F., Lesieur, P., Keller, G., and Ollivon, M., J. Dairy Sci.84, 2402 (2001).
11. Boode, K., Bispernick, C., and Walstra, P., Colloids Surf. 61, 55 (1991).12. Van Boekel, M. A. J. S., and Walstra, P., Colloids Surf. 3, 109 (1981).13. Buchheim, W., and Precht, D., Milchwissenschaft 34, 657 (1979).14. Precht, D., and Peters, K.-H., Milchwissenschaft 36, 616 (1981).15. Soderberg, I., Hernqvist, L., and Buchheim, W., Milchwissenschaft 44, 403
(1989).16. Walstra, P., Neth. Milk Dairy J. 21, 166 (1967).17. Lopez, C., Lesieur, P., Bourgaux, C., Keller, G., and Ollivon, M., J. Colloid
Interface Sci. 240, 150 (2001).18. Keller, G., Lavigne, F., Forte, L., Andrieux, K., Dahim, M., Loisel, C.,
Ollivon, M., Bourgaux, C., and Lesieur, P., J. Thermal Anal. 51, 783 (1998).19. Ollivon, M., and Perron, R., Chem. Phys. Lipids 25, 395 (1979).20. Blanton, T. N., Barnes, C. L., and Lelental, M., J. Appl. Cryst. 33, 172
(2000).21. Grabielle-Madelmont, C., and Perron, R., J. Colloid Interface Sci. 95(2),
483 (1983).22. Walstra, P., Neth. Milk Dairy J. 23, 99 (1969).23. Ten Grotenhuis, E., van Aken, G. A., van Malssen, K. F., and Schenk, H.,
J. Am. Oil Chem. Soc. 76, 1031 (1999).24. Chapman, D., in “The Structure of Lipids by Spectroscopic and X-Ray
Techniques,” p. 221. Wiley, New York, 1965.25. Guinier, A., “Theorie et pratique de la radiocristallographie,” 3rd ed.,
Dunod, Paris, 1964.26. Larsson, K., Fette Seifen Anstrichm 74, 136 (1972).27. Lavigne, F., Bourgaux, C., and Ollivon, M., J. Phys. IV, J. Phys. I 3, 137
(1993).28. Lopez, C., Lavigne, F., Lesieur, P., Bourgaux, C., Keller, G., and Ollivon,
M., J. Dairy Sci. (2002), in press.29. Lopez, C., Bourgaux, C., Lesieur, P., and Ollivon, M., Lait 82, 317
(2002).30. Van Beresteyn, E. C. H., Neth. Milk Dairy J. 26, 117 (1972).31. Small, D. M., in “Handbook of Lipid Research. The Physical Chemistry of
Lipids. From Alkanes to Phospholipids.” Plenum, New York, 1986.32. Goudedranche, H., Fauquant, J., and Maubois, J.-L., Lait 80, 93 (2000).33. Walstra, P., and Van Beresteyn, E. C. H., Neth. Milk Dairy J. 29, 238
(1975).34. Lopez, C., Riaublanc, A., Lesieur, P., Bourgaux, C., Keller, G., and Ollivon,
M., J. Am. Oil Chem. Soc. 78, 1233 (2002).
35. Lopez, C., Contribution a l’etude de la cristallisation des triacylglycerols:Application aux emulsions laitieres, Ph.D., Univ. Paris VI, 2001.
Copyright © 2022 FDOKUMEN