Nano-sized and micro-sized polystyrene particles affect phagocyte function
Subscriber access provided by MPI FUR POLYMERFORSCHUNG
Macromolecules is published by the American Chemical Society. 1155 SixteenthStreet N.W., Washington, DC 20036
Article
Structural Properties of Atactic Polystyrene of DifferentThermal History Obtained from a Multiscale Simulation
Tim Mulder, V. A. Harmandaris, Alexey V. Lyulin, N. F. A. van der Vegt, K. Kremer, and M. A. J. MichelsMacromolecules, 2009, 42 (1), 384-391• DOI: 10.1021/ma800873z • Publication Date (Web): 12 December 2008
Downloaded from http://pubs.acs.org on February 10, 2009
More About This Article
Additional resources and features associated with this article are available within the HTML version:
• Supporting Information• Access to high resolution figures• Links to articles and content related to this article• Copyright permission to reproduce figures and/or text from this article
Structural Properties of Atactic Polystyrene of Different ThermalHistory Obtained from a Multiscale Simulation
Tim Mulder,‡,† V. A. Harmandaris,§ Alexey V. Lyulin,*,†,‡ N. F. A. van der Vegt,§
K. Kremer,§ and M. A. J. Michels‡,†
Group Polymer Physics, EindhoVen Polymer Laboratories, Technische UniVersiteit EindhoVen,P.O. Box 513, 5600 MB EindhoVen, The Netherlands; Dutch Polymer Institute, P.O. Box 902,5600 AX EindhoVen, The Netherlands; and Max Planck Institute for Polymer Research,Ackermannweg 10, D-55128 Mainz, Germany
ReceiVed April 20, 2008; ReVised Manuscript ReceiVed NoVember 4, 2008
ABSTRACT: A method is presented to obtain well-equilibrated atactic polystyrene (aPS) samples for molecularsimulations. The method starts with equilibrating the polymer in the melt at length scales beyond the Kuhnlength lK, using end-bridging Monte Carlo techniques; at this level a (2:1)-coarse-grained description of aPS isbeing employed. Subsequently atomistic detail is reintroduced, and the sample is equilibrated at the smallestlength scales as well. At length scales beyond lK the simulated polymer chain conformations fulfill the random-coil hypothesis of Flory, and C∞ ) 8.7 ( 0.1 at 463 K. Eventually various glassy samples are created by subjectingthe melt sample to different cooling rates. Pair correlations are in agreement with existing X-ray data, and theamount of dihedral angles in the trans (t) state agrees with NMR data. On the level of dyads, the conformationsof racemic dyads agree well with existing NMR results. At the same time, meso dyads conformations do notagree: 65% of meso dyads is in the gt/tg state (NMR: 80%); 25% is in tt state (NMR: <10%). An attempt hasbeen made to relate the observation in simulations, namely that an increase in cooling time causes an increase inyield stress, to effects of the cooling rate on the polymer structure.
1. Introduction
One striking phenomenon originally introduced by Struik1
in relation to glassy polymers is physical aging. It refers to theslow structural relaxation processes, not involving any chemicalreactions, in polymer materials below their glass transition. Thepresence of aging is not restricted to polymers but occurs inany structural glass.
Physical aging is of importance in relation to mechanicalproperties of materials. The work of Utz et al.2 showed that for abinary mixture of Lennard-Jones particles the height of the yieldpeak and the presence or absence of strain softening can beinfluenced by the heat treatment to which the system is exposed.The presence of physical aging and its influence on mechanicalbehavior of glassy polymers have been demonstrated by forexample Struik et al.1 and Hasan et al.;3 slow cooling rates clearlysupport a high yield stress and the presence of strain softening.
The age of a material increases with time, and the aging isfastest at a temperature just below Tg. The age is determiningfor the height of the yield peak and the degree of strainsoftening.4 The reverse of aging is rejuvenation, which can beaccomplished by heating the polymer above Tg and subsequentlyquenching it into the glassy state again. Alternatively, one cansubject the polymer to a mechanical pretreatment, as has beendemonstrated by Govaert et al.5 By mechanical preconditioning,the brittle atactic polystyrene (aPS) is turned into a ductilepolymer, albeit that this ductility is temporary. aPS appears toage very fast; already after a couple of minutes the height ofthe yield peak increases and strain softening returns, and within2 days the polymer turns brittle. In spite of the observationswith respect to the changes in the mechanical behavior,rejuvenation should not be taken too literally; it has beendemonstrated by Isner et al.,6 who use a rugged-energy-
landscape model, that states produced by mechanical deforma-tion are generally distinct from states traversed during thermalaging.
The observations mentioned make a polymer like aPS a veryinteresting material, which indeed has been studied a lot,including simulations at the atomistic level. Lyulin et al. usemolecular dynamics simulations to study the stress-strainbehavior of aPS, giving, in spite of deformation rates beingorders of magnitude larger than in experiments, reasonablevalues for E moduli, yield stresses, and strain-hardening moduli.7
Aging effects, as seen in stress and energy vs strain plots, havebeen studied by Lyulin et al.8 Deformation and segmentalrelaxation have been explained there in terms of ratios of timescales for cooling. In ref 8 an MD demonstration of the influenceof cooling rate on stress-strain behavior is given by stretchinguniaxially two samples of 8 chains of 80 monomers each. Thesamples have been prepared starting from one chain in vacuum,which was allowed to relax under melt conditions. Subsequently,the single chain system was multiplied in all three Cartesiandirections, and the resulting system was equilibrated again. Theresulting two melt systems of aPS are similar. One of thesamples is cooled down through Tg at a rate of 0.01 K/ps andthe other at a rate of 0.1 K/ps. Both samples have been subjectedto deformation at a rate of 0.025 Å/ps. A more pronounced yieldpeak and a higher degree of strain softening for the samplecooled down slower have been observed.
Although aging refers to structural relaxation, it is veryuncertain what structural properties actually change or evolveduring aging. Molecular simulations could be useful to inves-tigate this. Up to date molecular simulations have primarily beenused to reproduce experimental data on polymer structures inthe melt. Many computational attempts have been made toreproduce the correct conformations of dihedral angles, dyads,triads, etc., in the framework of rotational-isomeric-state (RIS)theories.9-11 Although conformational distributions are notdirectly measured, there are NMR data suggesting that modelcalculations assuming fixed meso dyads with 80% tg/gt con-
* To whom correspondence should be addressed. E-mail: [email protected].
‡ Dutch Polymer Institute.§ Max Planck Institute for Polymer Research.† Technische Universiteit Eindhoven.
384 Macromolecules 2009, 42, 384-391
10.1021/ma800873z CCC: $40.75 2009 American Chemical SocietyPublished on Web 12/12/2008

formations and less than 10% tt, and racemo dyads with morethan 50% tt and less than 8% tgj/gjt, are close to experimentalreality. In addition, pair-correlation functions have been simu-lated, for example, by Harmandaris et al.,12 which reasonablyreproduce the X-ray data on aPS from Londono et al.13
Furthermore, there are attempts to reproduce polymer structureson larger length scales. For example, studies of the intrachaindistances between atoms as a function of the number ofbackbone chemical bonds separating those atoms have beenperformed by Auhl et al.15 for a model polymer and byHarmandaris et al.12,14 and by Spyriouni et al.16 for aPS. Atlevel of the largest length scales, entanglement networks havebeen studied by for example Everaers et al.17 and Tzoumanekaset al.18 Utz et al.2 studied the evolution of the pair correlationsduring the heat treatment of a binary Lennard-Jones system.The number of studies on evolution of structural propertiesduring aging is limited, though.
The main goal of our study is, on the one hand, to reproduceexperimental results on the structural properties of aPS in theglassy state at zero stress. On the other hand, we study how thestructure evolves during cooling and what the effect of coolingrate is on the structure. Finally, we will see how the propertiesof the polymer samples under stress depend on aging history.Relevant questions are what properties evolve during aging andwhat are the relevant length scales. Our approach is thefollowing. First the mapping of the atomistic model onto (2:1)-coarse-grained PS chain is introduced as schematicallydepicted in Figure 1. Then (2:1) coarse-grained aPS polymersamples are created and equilibrated, as described in detail inour previous publication.19,20
Namely, in p:1 coarse-grained models, one monomer isrepresented by p different beads. For p ) 1, the force fieldcontrolling the motions in any degree of freedom in the coarse-grained system is rather simple. One needs bonded potentialscontrolling bond lengths, bond angles, and dihedrals of thepolymer backbone and nonbonded potentials to control interac-tions of beads in different chains or in the same chain butseparated by more than (dependent on details of the model) three
or four bonds (excluded-volume effects have to be taken intoaccount properly). For p ) 2 the monomer consists of twodifferent beads: A beads represent CH2 groups on the polymerbackbone, and B beads represent CH(C6H5) groups. Tacticityis incorporated by labeling the B beads with a + or -. Thevarious bond lengths, bond angles, and dihedral angles in thecoarse-grained model are controlled by force-field terms thatare potentials of mean force of the coarse-grained degrees offreedom. These potentials of mean force have been obtained inatomistic simulations of isolated PS random walks by samplingconformational distribution functions, as also described in ref19. Clearly, with increasing p necessarily more details areincluded in the force field; but in addition, incorporation oftacticity can add to its complexity. In the current 2:1 representa-tion of PS tacticity information is also incorporated. In ourgeneralization of the end-bridging MC (EBMC) algorithm forPS, we take this tacticity information into account. The PSsamples are thoroughly equilibrated on this coarse-grained levelfirst using the EBMC method. The starting point was an EBMCalgorithm designed for and particularly efficient in equilibratingsystems of polyethylene chains of realistic molecular weight(Mw . 1 kDa) in the melt (see ref 21). All moves describedthere (as local moves such as flips, end rotations and concertedrotations inside the chain, and nonlocal moves such as reptationsand end bridging) could be and are used again. Subsequently,atomistic details are reintroduced, after which the structures areequilibrated at the smallest length scales, i.e., down to thechemical bond length, using united-atom molecular dynamicssimulations. Afterward, the equilibrated aPS melt samples arecooled below Tg at the two different cooling rates (0.01 and0.1 K/ps) in MD. Finally, the glassy aPS samples are used forMD production runs, from which structural properties have beencalculated. Dihedral distributions and dyad conformations havebeen calculated as well as distance factors as measured by e.g.Robyr and Suter.22 In addition, the distribution of angles betweenphenyl rings have been determined as a function of the spatialdistance between them. Also, pair-correlation functions havebeen calculated and compared to the data of Londono et al.13
And finally, intrachain distances have been computed to examinethe longer length scales.
In section 2 the details of the reinsertion of atomistic detailare described as well as further details of the sample-buildingprocess and the production runs. In section 3 the aPS structures,in the melt and in the glass, are compared with various resultsfrom the literature, and details regarding the calculation ofvarious distributions and quantities are provided. In section 4the samples resulting after the different cooling rates arecompared in their structural details. Finally, conclusions arepresented in section 5.
2. Reinsertion of Atomistic Detail
An aPS sample consisting of (2:1)-coarse-grained polymerchains has been prepared following the method described inref 19, starting from initial chain configurations, and furtherequilibration using the end-bridging Monte Carlo algorithminitially developed to simulate polyethylene melts, and modifiedhere for aPS. The polymer sample prepared consists of 50 chainswithin a uniform mass distribution between Xj(1 - ∆) andXj(1 + ∆) with an average chain length of Xj ) 100 monomers,and the value of the standard deviation normalized with themean is ∆ ) 0.5. The pressure is 1 bar, and the temperature is463 K, which is well above the glass-transition temperature(experimentally observed values for Tg are around 373 K).Usually the value of Tg is defined by simulating (at atmosphericpressure) the temperature dependence of the specific volume.The dependence of Tg on the cooling rate has been determinedexperimentally23 for some metallic glasses and polymers (poly-
Figure 1. Coarse-grained model of the present study. Two beadsrepresent a monomer. (a) The A bead is located in the center-of-massof a CH2 unit, whereas the B bead in the center-of-mass of a CH(C6H5)group. The symbols in the beads (b) contain information on tacticity.
Macromolecules, Vol. 42, No. 1, 2009 Structural Properties of Atactic Polystyrene 385
(methyl methacrylate), polycarbonate resin). Assuming that therelaxation time of the system follows a Vogel-Fulcher depen-dence on temperature, it was found that the glass-transitiontemperature logarithmically increases with cooling rate. It wasgenerally concluded that the values of Tg determined from MDsimulations are displaced, as expected, to somewhat highertemperatures than the longer time experimental values, but thedisplacements are minor. Lyulin et al.24 show a logarithmicdependence of Tg on cooling rate, and for PS they find for typicalcooling rates in simulations (0.1-0.01 K/ps) values for Tg inthe range 390-400 K.
In order to be able to calculate the structural propertiesmentioned in the Introduction and to check the effect of thecooling rate on these properties, reintroduction of the atomisticdetail into the (2:1)-coarse-grained description is needed. Theresulting structures have been used in united-atom MD produc-tion runs afterward. The back-mapping consists of three stepsinvolving a geometric construction, an energy minimization, anda very short (50 ps) MD run. The calculated pair distributionfunctions (see below) were in an excellent agreement with theexperiment, thus justifying the length of this additional MD run.The whole procedure is described in detail in the next fewparagraphs of this section.
In the first step C atoms are reintroduced. In the (2:1)-coarse-grained description of aPS, the CG atoms of type A representa CH2 unit and the CG atoms of type B represent a CHC6H5
unit. In order to reconstruct the seven C atoms represented byevery B atom, one needs to use the positions of the coarse-grained beads and the previously inserted atoms as well as ofthe average distances between the different types of atoms dij,av
within the same monomer or monomers nearby (i and j representany type of C atom or CG atom). These distances have beenobtained from atomistic simulations.12 C atoms are nowintroduced in trial positions, from which the distances dij to threeatoms nearby are calculated. Subsequently, the length differencesdij - dij,av are minimized using a quasi-Newton algorithm.25
Note here that the above back-mapping scheme, as any otherscheme that introduce more detail, is not unique; i.e., startingslightly different might lead to slightly different states. This isexpected since one CG configuration corresponds to a set ofatomistic states. The back-mapping procedure creates one outof them.
In the second step the united-atom polymer sample isequilibrated for 50 ps in MD, still at 463 K and 1 bar, using asoft-core potential for the repulsive van der Waals interactionsto prevent large local conformational distortions due to spatialoverlap of atoms:
The complete force field with all details has been taken fromMondello et al.26 and also explained in detail elsewhere.27 Thepressure is controlled using the Berendsen barostat28 (�p ) 0.2,where �p is the ratio of the isothermal compressibility and thetime constant of the barostat), and the temperature is controlledvia the collisional-dynamics thermostat29 (λ ) 3 ps, m0 ) 1Da).
After equilibration with the soft-core potential, in the thirdstep of the back-mapping procedure, the full Lennard-Jonespotential is introduced, and a 50 ps MD simulation is performed.From the obtained trajectories structural properties are calculatedand compared to data from literature; the results are given insection 3. Finally, the sample is used for two different coolingsimulations, one at a rate of 0.01 K/ps and the other at 0.1 K/ps,which are typical state-of-art cooling rates employed in atomisticmolecular simulations.24 The two resulting aPS glass samples
are compared with regard to their structural properties, calculatedfrom 50 ps simulation runs at the final temperatures; this isdiscussed in section 4.
3. Structural Properties of aPS Resulting from theMultiscale Preparation Method
The main purpose of the coarse-graining and the connectivity-altering Monte Carlo method described in ref 19 was to improvethe equilibration at longer length scales, beyond the level of theKuhn length. To verify to what extent this was successful, theintrachain distances, i.e., the average distance between mono-mers on the same chain separated by N backbone chemicalbonds, have to be verified. For this purpose the characteristicratio CN has been studied as a function of the number ofbackbone atoms:
where R2(N) is the squared distance between atoms separatedby N backbone chemical bonds and l the length of the chemicalbond in the aPS backbone.
In Figure 2a CN of aPS has been given, as obtained from thesimulations, at three different temperatures: one above Tg ()373K30) and two below Tg. For all temperatures R/Nl2 tends to aconstant value for large N, in agreement with Flory’s random-coil hypothesis.31 In Figure 2b-d the values of C∞ have beendetermined from linear fits to the curves of CN vs 1/N. (Flory31
shows for freely rotating chains that ⟨R2(N)/Nl2 ) C∞(1 - R/N)⟩,with R independent of N. Because the aPS polymer chainsstudied here could be mapped onto freely rotating chains, linearfits of CN vs 1/N data are used here as well.) At T ) 463 K weobtain C∞ ) 8.7 ( 0.1, which compares well to the value 8.5predicted from literature at that temperature (for aPS C∞ ) 9.85at 300 K and d(ln C∞)/d(ln T) ) -0.9 × 10⁻³).30
At lower temperature the value of C∞ ) 9.85 is notapproached. Whereas C∞ should increase during cooling, thisis not observed in our simulations; it even decreases a fewpercent. For T ) 300 K (after cooling from 463 K at a rate of0.1 K/ps) a value of 8.3 ( 0.1 has been found and for T ) 323K (after cooling from 463 K at a rate of 0.01 K/ps), 8.5 ( 0.1.These observations can be understood by realizing that thepolymer chains have no chance to undergo conformationalchanges at length scales beyond the Kuhn length during coolingby either cooling rate employed here; probably the simulatedchanges in intrachain distances at those length scales can belargely attributed to the increase in density during cooling (thesize of the sample reduces by 1.5% for both cooling rates).
To make a comparison at length scales of a few monomersegments or smaller, the pair-correlation function grem has beenstudied. This correlation function, which excludes correlationsbetween atoms separated by fewer than three chemical bondsor atoms belonging to the same phenyl ring, has been extractedby Londono et al.13 from X-ray measurements on variouspolymers, among which aPS. In the left part of Figure 3 grem
has been given for the simulation in the glassy state (T ) 323K), together with the data of Londono et al. The agreement ofthe simulations with the experimental data is excellent.
In addition to pair correlations, distributions of dihedral angleshave been determined from the simulations (see Figure 5);dihedral angles are defined as explained in Figure 4. Accordingto the NMR measurements of Dunbar et al.,32 at roomtemperature, the amount of dihedral angles in the t state is 68( 10%. The results from our simulations are in agreement withthis result of Dunbar et al.; the agreement is best for thesimulated aPS structure that has been created with the slowestcooling rate (0.01 K/ps).
ULJ,soft(r) ) { 24ε(1 - r/σ) + 228ε(1 - r/σ)2 r e σ
4ε((σ/r)12 - (σ/r)6) r > σ(1)
CN ) ⟨ R2(N)
Nl2 ⟩ (2)
386 Mulder et al. Macromolecules, Vol. 42, No. 1, 2009

Apart from having a correct dihedral angles distribution, asimulated polymer structure must also be able to capture thecorrect distribution of dyad conformations, determined by two
consecutive dihedral angles in the polymer chain’s backbone.In Table 1 the percentages of dyads in the various possibleconformations are given for all simulated aPS structures. A goodway of testing whether these dyad-conformational distributionsare close to those in experimental reality is by calculating so-called geometrical rate factors, which can be measured by solid-state NMR. These geometrical rate factors g(ωA,ωB), which arevery sensitive to the distribution of dyads over their variouspossible conformations, determine the rate of magnetizationexchange between two spin packets A and B that have theirchemical shift anisotropy (CSA) tensor differently oriented inthe static magnetic field Bb0 and therefore resonate at differentfrequencies, ωA and ωB.22 In various experimental studies to
Figure 2. Internal distance distributions (a) in the melt at T ) 463 K and in the glass at T ) 300 K and T ) 323 K. All curves tend asymptoticallyto a constant value, in accordance with Flory’s random-coil hypothesis. The values of C∞ have been determined for all three temperatures fromlinear fits to the internal distance distributions; see (b)-(d).
Figure 3. Pair-correlation functions grem in the melt at T ) 463 K andin the glass at T ) 323 K (above) and comparison with the results ofLondono et al.13 (below). In these functions the trivial contributionsfrom atoms separated by fewer than three chemical bonds or betweenatoms in the same phenyl ring have been left out.
Figure 4. All backbone dihedrals (determined by positions of fourconsecutive atoms in the backbone), viewed in the same direction, thatis, always starting from a CH2 unit: CH2-CH(C6H5)-CH2-CH(C6H5).The direction of positive orientation is such that sterically equivalentconformations are assigned the same dihedral angle.
Macromolecules, Vol. 42, No. 1, 2009 Structural Properties of Atactic Polystyrene 387

determine geometrical rate factors for aPS,22,33,34 aPS with 13Clabels at position 1 in the phenyl group has been used (see Figure6). The orientation of the phenyl ring with respect to the externalmagnetic field Bb0 determines its resonance frequency ω.g(ωA,ωB) determines the rate at which spin exchange takes placebetween an ensemble of phenyl groups with a particularorientation with respect to the external magnetic field thatcorresponds to a Larmor frequency ωA and an ensemble ofphenyl groups with an orientation with respect to Bb0 thatcorresponds to a Larmor frequency ωB. For an ensemble of Ninteracting spins the geometrical rate factor gAB is given by
where nA and nB are the numbers of spins with frequencies insmall intervals around ωA and ωB, respectively. The vacuummagnetic permeability is µ0, the gyromagnetic ratio is γ, rij isthe distance between spins i and j, and θij is the angle betweenthe internuclear vector and the static magnetic field Bb0. Thegeometrical rate factor provides information on local orienta-
tional order between the phenyl rings. In absence of such ordera 2D plot of g(ωA,ωB) will be totally flat; deviations fromflatness indicate preferred angles between spatially proximatephenyl groups. A quantity that is similar to the geometrical ratefactor but that is measured under magic-angle spinning (MAS)conditions35 (where the angular dependence drops out) is thedistance factor. The distance factor fd is defined as
where F is the density of the labeled spins and 4πg12(r)r2/V isthe probability density to find a spin with resonance frequencybetween ω1 and ω1 + dω1 and a spin with resonance frequencybetween ω2 and ω2 + dω2 at a distance between r and r + dr;V is the volume of the sample. The sensitivity of the distancefactor to local packing comes from the dependence of theresonance frequencies on the orientation of the molecularfragments with respect to the static magnetic field. The distancefactor spectra from disordered amorphous samples would beflat, fd(ω1, ω2) ) constant; polycrystalline solids, which arelocally perfectly ordered, give rise to sharp peaks.
The rate constants R(ωA,ωB) (∼g(ωA,ωB)) for polarizationtransfer between phenyl rings, as obtained from the simulationsat the various temperatures, are shown in Figures 7a-c; thosereported by Robyr et al.22 are shown in Figure 7d. Clearly thereexists local order between the phenyl rings, and the order isexaggerated in the simulations, as can be seen from the strongerdeviations from a flat profile for the simulations than for theexperiments. To extract more information from these ratefactors, one should look into separate contributions fromdifferent types of dyads and contributions from orientationalcorrelations between phenyl groups in different chains. Someexperimental results on the separate contributions of meso andracemic dyads already exist.33
Robyr, Gan, and Suter33 showed that distance factors,calculated using RIS models with for meso dyads more than80% tg/gt and less than 10% tt and for racemic dyads morethan 50% tt and less than 8% tgj/gjt, approach experimentaldistance factors very reasonably. From our simulations we obtainconformations of racemic dyads that agree with these results.For the meso dyads the percentage of dyads in tg/gt found inthe simulations, 63%, is too low; the amount of meso dyads intt, 28%, is much too high.
The reason for the discrepancies between the simulationresults for meso-dyad conformations and the results of Robyret al. is not obvious. However, some insight into the causes ofthe discrepancies may be obtained from comparing the aPSstructures prepared by the methods described in this paper to asimilar approach that was followed by Spyriouni et al.16 In ourwork aPS sample preparation is initiated with equilibration atthe (2:1) level of coarse graining, followed by reinsertion of
Figure 5. Distribution P(φ) of dihedral angles in the melt at 463 K and in the glassy state at 323 and 300 K. The percentages of t, g, and gj, resultingfrom integrating P(φ) over (-π, -π/3], (-π/3, π/3], and (π/3, π], respectively, are given in the table.
Table 1. Conformations of Dyads at 463 K in the Melt and inthe Glassy State at 300 and 323 K
T ) 463 K, %T ) 300 K
(0.1 K/ps), %T ) 323 K
(0.01 K/ps), %
meso tt 19.8 24.8 27.7gjgj 0.0 0.0 0.0gg 5.5 4.3 4.1gjt/tgj 7.5 5.8 4.2gt/tg 64.9 63.5 63.2gjg/ggj 2.3 1.6 0.8
racemic tt 43.8 48.9 55.2gjgj 0.0 0.0 0.0gg 24.6 22.3 18.3gjt/tgj 6.1 3.0 1.9gt/tg 19.4 21.4 21.6gjg/ggj 6.1 4.4 3.0
Figure 6. A C13-labeled phenyl ring in an external magnetic field Bb0.The carbon atoms at positions 1 in the phenyl ring are 13C and are thussensitive to NMR. The orientation of Bb0 with respect to the phenylring determines the resonance frequency of the 13C atom.
g(ωA, ωB) ) NnAnB
( µ0
4πpγ2
2 )∑i
nA
∑j
nB (1 - 3 cos2 θij
rij3 )2
(3)
fd(ω1, ω2) ) 4πF∫0
∞g12(r)r-4 dr (4)
388 Mulder et al. Macromolecules, Vol. 42, No. 1, 2009

atomistic detail and equilibrating locally afterward. Spyriouniet al. start by equilibrating using a 1:1-coarse-grained model ofaPS. Subsequently, a backmapping scheme, i.e., a scheme forreinsertion of atomistic detail, has been used that is necessarilymuch more complicated than ours, as their coarse-grained modelis further away from the atomistic one than ours. Spyriouni etal. report on the conformational properties of their PS samplesat a temperature of 500 K an overall amount of dihedrals in thet state of around 60%, which is comparable to our 56% at 463K. And considering the temperature difference, the conforma-tional data found by Spyriouni et al. at 500 K are probably alsoin agreement with the experimental result of Dunbar et al.32 atroom temperature (68 ( 10% of the dihedrals in the t state).For the conformations of dyads Spyriouni et al. observe thefollowing. The amount of meso dyads in the gt/tg conformationis 60% and of all racemic dyads 45% is in the tt conformation.These results are again comparable to our results (see Table 1).The agreement between the present results on conformationalproperties of PS and those of Spyriouni et al. is remarkable.The fact that in both Spyriouni and our simulations the sameforce field for the atomistic simulations has been used does nottrivially explain the agreement between both data.
4. Structural Properties Obtained from the DifferentCooling Rates
After checking the simulated properties vs experimentalknowledge, we would like to compare the different propertiesof the sample created by slow cooling from the melt (at 0.01K/ps to a final temperature of 323 K) and the sample createdby fast cooling (0.1 K/ps to a final temperature of 300 K). Asalready observed in the Introduction, the cooling rate is reflectedin the mechanical behavior. The stress-strain curves obtainedusing two different cooling rates are different, primarily in theheight of the yield peak, the sample resulting from the lowercooling rate giving the highest yield stress as shown in ref 8.From the previous discussion of the intrachain distances
distribution, it became already clear that chain conformationschange little at the long length scales, and intrachain distancesessentially scale with size of the sample.
At the level of pair-correlation functions, one observes a bitsharper peaks at lower temperatures (see Figure 3, lower panel).Especially peaks at the length scales below 4-5 Å becomesharper, which is a signature of increased local order uponcooling. The influence of cooling rates, however, on the pair-correlation functions is hardly noticeable (see Figure 3, leftpanel). This information is very general and does not give muchinsight. It would be more interesting to look at specific, carefullychosen correlations, such as correlations between atoms inspatially close phenyl rings, either in the same chain or indifferent chains.
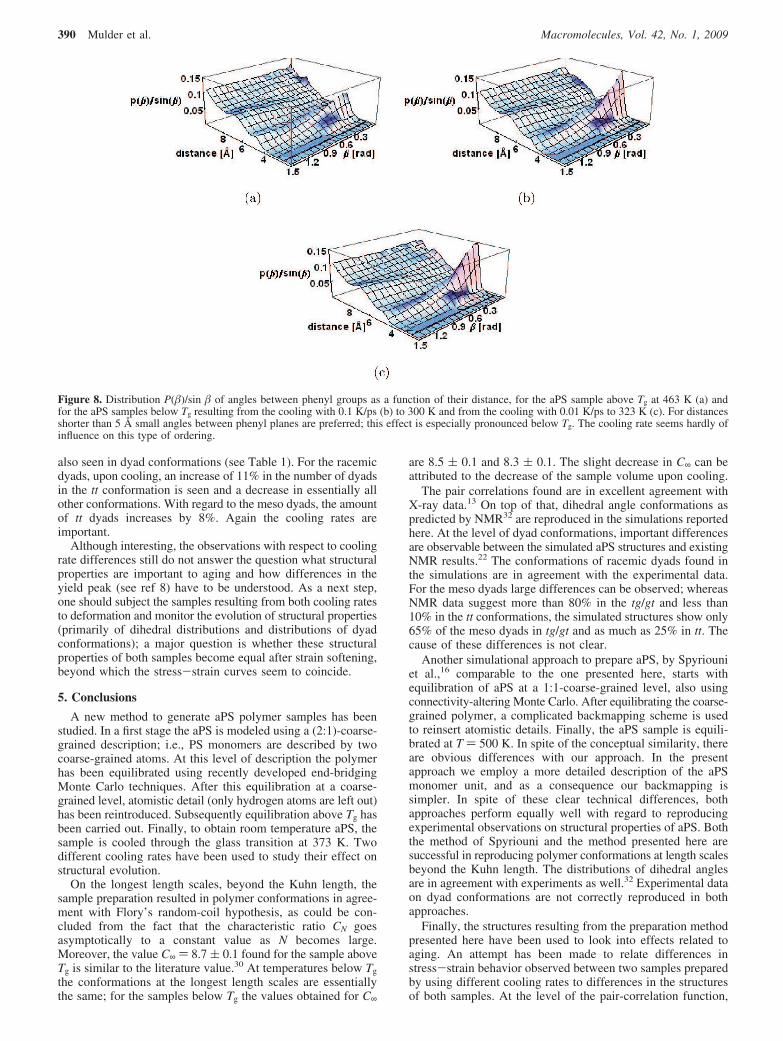
As an example we studied the distribution of angles � betweenphenyl planes as a function of their distance. The distributionP(�)/sin � is given in Figure 8. Small angles are preferred, bothat high temperature (463 K) and in the glassy state. Fortemperatures below the glass transition this ordering effect ismore pronounced. Again, the influence of cooling rate is verysmall; compare parts b and c of Figure 8. Probably for lengthscales smaller than 5 Å, the only effect is that the thermalfluctuations of angles � around their average values becomeless as the temperature is decreased. For length scales above 5Å no changes are observed; both above and below the glasstransition, no preferred angles are present. This could mean thatin real aPS at distances beyond 5 Å no orientational correlationbetween phenyl rings exists. However, alternatively it couldmean that although there exist such correlations in real aPS,this is not seen in the simulations because of the huge coolingrates.
The dihedral angle distributions (see Figure 5) show anincrease, upon cooling, in the number of dihedral angles in thet state, at the cost of both dihedral angles in the g state and inthe gj state. These effects are almost twice stronger for the slowercooled sample than for the faster cooled one. These effects are
Figure 7. Rate constants for polarization transfer obtained from the simulations (a-c) at 463 K (a), 323 K (b), and 300 K (c) and from experimentsat 295 K by Robyr22 (d). The distance factors at 300 K (c) compare reasonably to the distance factors measured by Robyr et al. (d). Furtherimprovement of the dyad statistics (see discussion on dyad conformations) is needed to obtain better agreement between distance factors as obtainedfrom experiment and simulation. In (a) through (c) the parts-per-million scale (∆f/f ×106) has been used; in (d) the kHz (∆f) scale, where ∆f is theshift of the NMR resonance frequency with respect to the resonance frequency f of the standard reference TMS (tetramethylsilane). For details onboth scales see for example ref 22 or 36).
Macromolecules, Vol. 42, No. 1, 2009 Structural Properties of Atactic Polystyrene 389
also seen in dyad conformations (see Table 1). For the racemicdyads, upon cooling, an increase of 11% in the number of dyadsin the tt conformation is seen and a decrease in essentially allother conformations. With regard to the meso dyads, the amountof tt dyads increases by 8%. Again the cooling rates areimportant.
Although interesting, the observations with respect to coolingrate differences still do not answer the question what structuralproperties are important to aging and how differences in theyield peak (see ref 8) have to be understood. As a next step,one should subject the samples resulting from both cooling ratesto deformation and monitor the evolution of structural properties(primarily of dihedral distributions and distributions of dyadconformations); a major question is whether these structuralproperties of both samples become equal after strain softening,beyond which the stress-strain curves seem to coincide.
5. Conclusions
A new method to generate aPS polymer samples has beenstudied. In a first stage the aPS is modeled using a (2:1)-coarse-grained description; i.e., PS monomers are described by twocoarse-grained atoms. At this level of description the polymerhas been equilibrated using recently developed end-bridgingMonte Carlo techniques. After this equilibration at a coarse-grained level, atomistic detail (only hydrogen atoms are left out)has been reintroduced. Subsequently equilibration above Tg hasbeen carried out. Finally, to obtain room temperature aPS, thesample is cooled through the glass transition at 373 K. Twodifferent cooling rates have been used to study their effect onstructural evolution.
On the longest length scales, beyond the Kuhn length, thesample preparation resulted in polymer conformations in agree-ment with Flory’s random-coil hypothesis, as could be con-cluded from the fact that the characteristic ratio CN goesasymptotically to a constant value as N becomes large.Moreover, the value C∞ ) 8.7 ( 0.1 found for the sample aboveTg is similar to the literature value.30 At temperatures below Tg
the conformations at the longest length scales are essentiallythe same; for the samples below Tg the values obtained for C∞
are 8.5 ( 0.1 and 8.3 ( 0.1. The slight decrease in C∞ can beattributed to the decrease of the sample volume upon cooling.
The pair correlations found are in excellent agreement withX-ray data.13 On top of that, dihedral angle conformations aspredicted by NMR32 are reproduced in the simulations reportedhere. At the level of dyad conformations, important differencesare observable between the simulated aPS structures and existingNMR results.22 The conformations of racemic dyads found inthe simulations are in agreement with the experimental data.For the meso dyads large differences can be observed; whereasNMR data suggest more than 80% in the tg/gt and less than10% in the tt conformations, the simulated structures show only65% of the meso dyads in tg/gt and as much as 25% in tt. Thecause of these differences is not clear.
Another simulational approach to prepare aPS, by Spyriouniet al.,16 comparable to the one presented here, starts withequilibration of aPS at a 1:1-coarse-grained level, also usingconnectivity-altering Monte Carlo. After equilibrating the coarse-grained polymer, a complicated backmapping scheme is usedto reinsert atomistic details. Finally, the aPS sample is equili-brated at T ) 500 K. In spite of the conceptual similarity, thereare obvious differences with our approach. In the presentapproach we employ a more detailed description of the aPSmonomer unit, and as a consequence our backmapping issimpler. In spite of these clear technical differences, bothapproaches perform equally well with regard to reproducingexperimental observations on structural properties of aPS. Boththe method of Spyriouni and the method presented here aresuccessful in reproducing polymer conformations at length scalesbeyond the Kuhn length. The distributions of dihedral anglesare in agreement with experiments as well.32 Experimental dataon dyad conformations are not correctly reproduced in bothapproaches.
Finally, the structures resulting from the preparation methodpresented here have been used to look into effects related toaging. An attempt has been made to relate differences instress-strain behavior observed between two samples preparedby using different cooling rates to differences in the structuresof both samples. At the level of the pair-correlation function,
Figure 8. Distribution P(�)/sin � of angles between phenyl groups as a function of their distance, for the aPS sample above Tg at 463 K (a) andfor the aPS samples below Tg resulting from the cooling with 0.1 K/ps (b) to 300 K and from the cooling with 0.01 K/ps to 323 K (c). For distancesshorter than 5 Å small angles between phenyl planes are preferred; this effect is especially pronounced below Tg. The cooling rate seems hardly ofinfluence on this type of ordering.
390 Mulder et al. Macromolecules, Vol. 42, No. 1, 2009
sharper peaks indicating stronger local ordering have beenobserved for temperatures below Tg than for temperatures aboveTg. However, no influence of the cooling rate was seen. Also,the distribution of angles between phenyl rings as a function ofthe distance between the rings did not reveal any influence of thecooling rate. The only clear differences were observed inthe distributions of dihedrals angles and consequently in thedistributions of the meso and racemic dyads over their variouspossible conformations.
The main goal of this paper is to present the whole multiscalemethodology and to check how structural properties change withcooling rate. Not all differences in the structural propertiesbetween the two samples, obtained using two different coolingrates, are very pronounced; however they are significant. Wedo observe the differences between the samples obtained usingtwo different cooling rates, namely, (i) the stress-strain curvesobtained using two different cooling rates are different, primarilyin the height of the yield peak; (ii) the characteristic ratio for apolymer prepared with lower cooling rate is slightly larger; (iii)the distribution of dihedral angles as well as of the dyadsconformations changes with cooling rate: the number ofdihedrals in the trans state is increasing upon cooling. This effectis almost twice stronger for the slower cooled sample than forthe faster cooled one.
We also have shown that with decreasing the temperaturethe characteristic ratio is also decreasing in contrast withexperimental data. The reason is the very high cooling ratescompared to the experimental ones. Because of that, the chainsdo not have time to equilibrate at the level of the end-to-enddistance. This can be seen by the values reported for the differentcooling rates: samples after cooling with a rate 0.1 K/ps shownC∞ ) 8.3 whereas samples after cooling with a rate 0.01 K/ps(thus giving more time for the chains to equilibrate) shown C∞) 8.5.
Our results do show small structural differences for thesamples obtained using two different cooling rates. In a possiblefollow-up study of aging one should focus on the evolution(during deformation) of structural properties, especially dihedralangle distributions and distributions of dyad conformations, insamples obtained from different cooling rates; a key questionis whether beyond strain softening, where stress-strain curvescoincide, differences in structural properties have been erased.
Acknowledgment. This work forms part of the researchprogramme of the Dutch Polymer Institute (DPI), project 487.
References and Notes
(1) Struik, L. C. E. Physical Aging in Amorphous Polymers and OtherMaterials; Elsevier: Amsterdam, 1978.
(2) Utz, M.; Debenedetti, P. G.; Stillinger, F. H. Phys. ReV. Lett. 2000,84, 1471.
(3) Hasan, O. A.; Boyce, M. C. Polymer 1993, 34, 5085.(4) van Melick, H. G. H.; Govaert, L. E.; Raas, B.; Nauta, W. J.; Meijer,
H. E. H. Polymer 2003, 44, 1171.(5) Govaert, L. E.; van Melick, H. G. H.; Meijer, H. E. H. Polymer 2001,
42, 1271.(6) Isner, B. A.; Lacks, D. J. Phys. ReV. Lett. 2006, 96, 025506.(7) Lyulin, A. V.; Vorselaars, B.; Mazo, M. A.; Balabaev, N. K.; Michels,
M. A. J. Europhys. Lett. 2005, 71, 618.(8) Lyulin, A. V.; Michels, M. A. J. Phys. ReV. Lett. 2007, 99, 085504.(9) Yoon, D. Y.; Sundararajan, P. R.; Flory, P. J. Macromolecules 1975,
8, 776.(10) Rapold, R. F.; Suter, U. W. Macromol. Theory Simul. 1994, 3, 1.(11) Rehahn, M.; Mattice, W. L.; Suter, U. W. AdV. Polym. Sci. 1997, 131–
132.(12) Harmandaris, V. A.; Adhikari, N. P.; Van der Vegt, N. F. A.; Kremer,
K. Macromolecules 2006, 39, 6708.(13) Londono, J. D.; Habenschuss, A.; Curro, J. G.; Rajasekaran, J. J. J.
Polym. Sci., Part B 1996, 34, 3055.(14) Harmandaris, V. A.; Reith, D.; VanderVegt, N. F. A.; Kremer, K.
Macromol. Chem. Phys. 2007, 208, 2109.(15) Auhl, R.; Everaers, R.; Grest, G. S.; Kremer, K.; Plimpton, S. J.
J. Chem. Phys. 2003, 119, 12718.(16) Spyriouni, T.; Tzoumanekas, C.; Theodorou, D. N.; Muller-Plathe,
F.; Milano, G. Macromolecules 2007, 40, 3876.(17) Everaers, R.; Sukumaran, S. K.; Grest, G. S.; Svaneborg, C.;
Sivasubramanian, A.; Kremer, K. Science 2004, 303, 823.(18) Tzoumanekas, C.; Theodorou, D. N. Macromolecules 2006, 39, 4592.(19) Mulder, T.; Harmandaris, V. A.; Lyulin, A. V.; Van der Vegt, N. F. A.;
Vorselaars, B.; Michels, M. A. J. Macromol. Theory Simul. 2008, 17,290.
(20) Mulder, T.; Harmandaris, V. A.; Lyulin, A. V.; Van der Vegt, N. F. A.;Michels, M. A. J. Macromol. Theory Simul. 2008, 17, 393.
(21) Mavrantzas, V. G.; Boone, T. D.; Zervopoulou, E.; Theodorou, D. N.Macromolecules 1999, 32, 5072.
(22) Robyr, P.; Tomaselli, M.; Grob-Pisano, C.; Meier, B. H.; Ernst, R. R.;Suter, U. W. Macromolecules 1995, 28, 5320.
(23) Bruning, R.; Samwer, K. Phys. ReV. B 1992, 46, 11318.(24) Lyulin, A. V.; Balabaev, N. K.; Michels, M. A. J. Macromolecules
2003, 36, 8574.(25) Press, W. H.; Flannery, B. P.; Teukolsky, S. A.; Vetterling, W. T.
Numerical Recipes; Cambridge University Press: Cambridge, 1985.(26) Mondello, M.; Yang, H. J.; Furuya, H.; Roe, R. J. Macromolecules
1994, 27, 3566.(27) Vorselaars, B.; Lyulin, A. V.; Michels, M. A. J. Macromolecules 2007,
40, 6001.(28) Allen, M. P.; Tildesley, D. J. Computer Simulation of Liquids;
Clarendon Press: Oxford, 1987.(29) Lemak, A. S.; Balabaev, N. K. J. Comput. Chem. 1996, 17, 1685.(30) Mark, J.; Ngai, K.; Graessley, W.; Mandelkern, L.; Samulski, E.;
Konig, J.; Wignall, G. Physical Properties of Polymers; CambridgeUniversity Press: Cambridge, UK, 2003.
(31) Flory, P. J. Statistical Mechanics of Chain Molecules; HanserPublishers: New York, 1989.
(32) Dunbar, M. G.; Novak, B. M.; Schmidt-Rohr, K. Solid State Nucl.Magn. Reson. 1998, 12, 119.
(33) Robyr, P.; Gan, Z.; Suter, U. W. Macromolecules 1998, 31, 8918.(34) Robyr, P.; Muller, M.; Suter, U. W. Macromolecules 1999, 32, 8681.(35) Gan, Z.; Ernst, R. R. Chem. Phys. Lett. 1996, 13, 253.(36) Neuhaus, D.; Williamson, M. P. The Nuclear OVerhauser Effect in
Structural and Conformational Analysis; VCH Publishers: New York,1989.
MA800873Z
Macromolecules, Vol. 42, No. 1, 2009 Structural Properties of Atactic Polystyrene 391
Copyright © 2022 FDOKUMEN