Evaluation of biodegradability of polystyrene materials ... - NOVA
192
Evaluation of biodegradability of polystyrene materials in the managed landfill and soil THANH BA HO B.Sc. in Biological Science, University of Natural Sciences, Vietnam M.Sc. in Applied Science, RMIT University, Victoria, Australia Submitted in fulfilment of the requirements for the degree of Doctor of Philosophy (PhD) School of Environmental and Life Sciences Faculty of Science University of Newcastle (UON) New South Wales, Australia October 2018
-
Upload
khangminh22 -
Category
Documents
-
view
2 -
download
0
Transcript of Evaluation of biodegradability of polystyrene materials ... - NOVA

Evaluation of biodegradability of polystyrene materials in the managed landfill and soil
THANH BA HO B.Sc. in Biological Science, University of Natural Sciences, Vietnam
M.Sc. in Applied Science, RMIT University, Victoria, Australia
Submitted in fulfilment of the requirements for the degree of
Doctor of Philosophy (PhD)
School of Environmental and Life Sciences Faculty of Science
University of Newcastle (UON) New South Wales, Australia
October 2018

i
TABLE OF CONTENTS
Chapter 1 INTRODUCTION ........................................................................................... 1
1.1 Background.......................................................................................... 1 1.2 Aim and objectives ............................................................................... 6 1.3 Structure of thesis ................................................................................ 7
Chapter 2 REVIEW OF LITERATURE ........................................................................... 9
2.1 Polystyrene .......................................................................................... 9 2.2 History of polystyrene ........................................................................ 12 2.3 Synthesis of polystyrene .................................................................... 12 2.4 Other polystyrene blends and copolymers ......................................... 13 2.5 Uses of polystyrene ........................................................................... 14 2.6 Treatment of polystyrene wastes and its effects on the environment and human health .................................................................................... 15 2.7 Biodegradation of polystyrene and polystyrene blends ...................... 17 2.8 Analytical techniques used in biodegradation studies ........................ 35
2.8.1 Visual observation ...................................................................... 35 2.8.2 Changes in mechanical properties and molar mass ................... 35 2.8.3 Weight loss measurements: ...................................................... 36 2.8.4 Determination of biogas (CO2/CH4) evolution ............................. 36 2.8.5 Oxygen consumption .................................................................. 37 2.8.6 Clear-zone formation .................................................................. 37 2.8.7 Radiolabelling ............................................................................. 37
2.9 Standard tests for plastic biodegradation ........................................... 41 2.10 Issues with current standards/specifications .................................... 43
Chapter 3 GENERAL MATERIALS AND METHODS .................................................. 46
3.1 Materials ............................................................................................ 46 3.1.1 Test samples .............................................................................. 46 3.1.2 General equipment ..................................................................... 47 3.1.3 Chemicals ................................................................................... 49
3.2 Methods ............................................................................................. 49 3.2.1 Overview of experiment .............................................................. 49 3.2.2 Design of experiments ................................................................ 50 3.2.3 Biodegradation studies ............................................................... 50

ii
3.2.3.1 Visual observations ............................................................. 50 3.2.3.2 Determination of weight loss ............................................... 50 3.2.3.3 Measurement of gas evolution ............................................ 51 3.2.3.4 Field emission Scanning Electron Microscopy .................... 51 3.2.3.5 Fourier Transform Infrared Spectroscopy ............................ 54 3.2.3.6 Gel Permeation Chromatography ........................................ 55 3.2.3.7 Nuclear Magnetic Resonance spectroscopy ....................... 57 3.2.3.8 Gas Chromatography-Mass Spectrometry .......................... 58
3.2.4 Next generation sequencing analysis ......................................... 60 Chapter 4 EVALUATION OF BIODEGRADABILITY OF POLYSTYRENE MATERIALS IN A MANAGED LANDFILL ........................................................................ 62
4.1 Introduction ........................................................................................ 62 4.2 Experimental procedure and materials .............................................. 64
4.2.1 Test samples .............................................................................. 64 4.2.2 Experimental procedure ............................................................. 64
4.3 Results and discussion ...................................................................... 67 4.3.1 Monitoring of temperature and water level ................................. 68 4.3.2 Visual observation ...................................................................... 69 4.3.3 Surface imaging of test samples ................................................. 73 4.3.4 Fourier Transform Infrared Spectroscopy ................................... 78 4.3.5 Gel Permeation Chromatography .............................................. 82 4.3.6 Nuclear Magnetic Resonance spectroscopy .............................. 83 4.3.7 Determination of weight loss ....................................................... 85
4.4 Conclusions ....................................................................................... 87 Chapter 5 EVALUATION OF BIODEGRADABILITY OF POLYSTYRENE MATERIALS IN LABORATORY CONDITIONS ................................................................ 88
5.1 Introduction ........................................................................................ 88 5.2 Materials and methods ...................................................................... 89
5.2.1 Test design ................................................................................. 89 5.2.2 Calculation of the percent of biodegradation .............................. 91
5.3 Results and discussion ...................................................................... 91 5.3.1 Gas measurement ...................................................................... 91 5.3.2 Visual observation ...................................................................... 92 5.3.3 Field emission Scanning Electron Microscopy ............................ 94 5.3.4 Fourier Transform Infrared Spectroscopy ................................... 96 5.3.5 Nuclear Magnetic Resonance spectroscopy ............................ 101 5.3.6 Determination of weight loss ..................................................... 104

iii
5.4 Conclusions ..................................................................................... 104 Chapter 6 INVESTIGATION OF BIODEGRADABILITY OF POLYSTYRENE MATERIALS IN GARDEN SOIL ................................................................ 106
6.1 Introduction ...................................................................................... 106 6.2 Materials and methods .................................................................... 107 6.3 Results and discussion .................................................................... 108
6.3.1 Visual observation .................................................................... 108 6.3.2 Field emission Scanning Electron Microscopy .......................... 110 6.3.3 Fourier Transform Infrared Spectroscopy ................................. 113 6.3.4 Nuclear Magnetic Resonance spectroscopy ............................ 117
6.4 Conclusions ..................................................................................... 120 Chapter 7 BACTERIAL ISOLATION AND INVESTIGATION OF BIODEGRADABILITY OF MODIFIED POLYSTYRENE BY ISOLATED BACTERIA ................... 121
7.1 Introduction ...................................................................................... 121 7.2 Materials and methods .................................................................... 122
7.2.1 Materials ................................................................................... 122 7.2.2 Methods .................................................................................... 123
7.3 Results and discussion .................................................................... 125 7.3.1 Determination of weight loss ..................................................... 125 7.3.2 Field emission Scanning Electron Microscopy .......................... 127 7.3.3 Fourier Transform Infrared Spectroscopy ................................. 129 7.3.4 Gel Permeation Chromatography ............................................. 131 7.3.5 Nuclear Magnetic Resonance spectroscopy ............................ 131 7.3.6 Gas Chromatography-Mass Spectrometry ............................... 133
7.4 Conclusions ..................................................................................... 135 Chapter 8 BACTERIAL IDENTIFICATION IN THE LANDFILL ................................. 136
8.1 Introduction ...................................................................................... 136 8.2 Materials and methods .................................................................... 137 8.3 Results and discussion .................................................................... 139 8.4 Conclusions ..................................................................................... 147
Chapter 9 SUMMARY AND CONCLUSIONS ............................................................ 148
9.1 Research concept ............................................................................ 148 9.2 Research components and processes involved ............................... 150
9.2.1 Biodegradability of polystyrene in a managed landfill ............... 150

iv
9.2.2 Biodegradability of polystyrene in landfill leachate under laboratory conditions ......................................................................... 151 9.2.3 Biodegradability of polystyrene in garden soil .......................... 152 9.2.4 Bacterial isolation and polystyrene biodegradation by isolated bacteria .............................................................................................. 153 9.2.5 Identification of microbial communities in a managed landfill and in leachate ............................................................................................. 153
9.3 General conclusion and application of this research ........................ 154 9.4 Future research ............................................................................... 156 REFERENCES ...................................................................................... 159

v
LIST OF FIGURES CHAPTER 1
Figure 1.1 Types of popular plastics used in the market ....................... 2 Figure 1.2 The percentage of plastics used in Australia ........................ 3 Figure 1.3 Estimated time range for plastic degradation in the marine environment ........................................................................................... 4 Figure 1.4 Summarized diagram of the research .................................. 6
CHAPTER 2 Figure 2.1 Polymerization of styrene to produce polystyrene ................ 9 Figure 2.2 Structural types of polystyrene ........................................... 10 Figure 2.3 Production of EPS and HIPS pellets .................................. 13
CHAPTER 3 Figure 3.1 Polystyrene samples used in this project ........................... 47 Figure 3.2 FESEM analytical processes .............................................. 53 Figure 3.3 FTIR spectrometer systems used to analyse the polystyrene test samples ........................................................................................ 55 Figure 3.4 Gel Permeation Chromatography system used to analyse the polystyrene test samples ..................................................................... 56 Figure 3.5 Nuclear Magnetic Resonance spectroscopy system used to analyse the polystyrene samples......................................................... 58 Figure 3.6 GC-MS system used to analyse the polystyrene test samples ............................................................................................................ 59
CHAPTER 4 Figure 4.1 Map of location of test site marked with a red point ............ 64 Figure 4.2 Diagram of location of samples in the landfill test seen from above ................................................................................................... 65 Figure 4.3 Housing cases used for the test in the landfill .................... 66 Figure 4.4 Longitudinal section of a sample in the landfill test (left) and diagram of all test samples after being installed into the landfill (right) 66 Figure 4.5 Temperature (oC) data from inside the Summerhill landfill at 11m depth from Nov 2015 to Oct 2016 ................................................ 69 Figure 4.6 Level of leachate data from inside the Summerhill landfill at 11 m depth from Nov 2015 to Oct 2016 ............................................... 69 Figure 4.7 HIPS lids after incubation inside the landfill in for 356 days (left) and 76 days (right) ...................................................................... 71

vi
Figure 4.8 MPS cups after incubation inside the landfill: Photo a) & c): inside and outside of the cup after 356 days; photo b) & d): inside and outside of the cup after 76 days .......................................................... 72 Figure 4.9 MPS cups stained with iodine solution: test sample after 76 days inside the Summerhill landfill (left), and control sample (right) .... 73 Figure 4.10 FESEM micrographs of modified polystyrene foam cups (10,000X). Control sample (top), and the test sample after being buried in the landfill for 356 days (bottom) ...................................................... 75 Figure 4.11 FESEM micrographs of modified polystyrene foam cups (100X): test sample after being buried in the landfill for 356 days (bottom) compared to control sample (top) .......................................... 76 Figure 4.12 FESEM micrographs of HIPS lids (10,000X): control sample (top) and the test sample after being buried in the landfill for 356 days (bottom) ............................................................................................... 77 Figure 4.13 FTIR spectra of MPS of control sample (top), and samples after 356 days in the landfill (bottom) ................................................... 79 Figure 4.14 FTIR spectra of PS of control sample (top), and samples after 356 days in the landfill (bottom) ................................................... 80 Figure 4.15 FTIR spectra of HIPS of control sample (top), and samples after 356 days in the landfill (bottom) ................................................... 81 Figure 4.16 1H NMR analysis of polystyrene foamed cups (MPS) ....... 84 Figure 4.17 Weight changes of the test samples in the landfill after different test times ............................................................................... 86 Figure 4.18 Surface of MPS foam cup inside the landfill for 356 days after washing ....................................................................................... 86
CHAPTER 5 Figure 5.1 Diagram of laboratory test (top) and a photo of lab test (bottom) ............................................................................................... 90 Figure 5.2 MPS samples treated with iodine solution after 90 days in the leachate (right) compared with control sample (left). ........................... 94 Figure 5.3 FESEM micrographs at 10,000x magnification of polystyrene foam cups (PS) in the lab test after 90 days: negative control sample (left), treated sample (right) ................................................................. 95 Figure 5.4 FESEM micrographs at 10,000x magnification of modified polystyrene foam cups (MPS) in the lab test after 90 days: negative control samples (left), treated sample (right) ....................................... 95 Figure 5.5 FESEM micrographs at 10,000x magnification of HIPS lid in the lab test after 90 days: control sample (left), treated sample (right) .... ............................................................................................................ 96

vii
Figure 5.6 FTIR spectra of HIPS. New peaks seen in the treated sample have been circled in red and green ..................................................... 98 Figure 5.7 FTIR spectra of MPS. New peaks seen in the treated sample have been circled in red. ..................................................................... 99 Figure 5.8 FTIR spectra of PS. The top graph is control sample and the bottom graph is the treated sample ................................................... 100 Figure 5.9 1H NMR spectrum of modified polystyrene foam cups (MPS): control sample (top) and the treated sample (bottom) ....................... 102 Figure 5.10 1H NMR spectrum of Dart® foam cups (PS): control sample (top) and the treated sample (bottom) ............................................... 103
CHAPTER 6 Figure 6.1 Images of garden soil biodegradation experiment. ........... 108 Figure 6.2 Images of inside and outside surfaces of a foam cup after six months in soil (right) compared to the control (left)............................ 109 Figure 6.3 FESEM micrographs of modified polystyrene foam cups (MPS) of blank sample (top) and test sample in the soil (bottom) at 10,000x magnification. ....................................................................... 111 Figure 6.4 FESEM micrographs of polystyrene foam cups (PS) of blank sample (top) and test sample in soil for six months (bottom) at 10,000x magnification. .................................................................................... 112 Figure 6.5 FTIR spectra of blank sample of MPS (A) and treated sample of MPS in soil for six months (B)........................................................ 115 Figure 6.6 FTIR spectra of blank sample of PS (A) and treated sample of PS in soil for six months (B) .......................................................... 116 Figure 6.7 1H NMR spectra of PS of a blank sample (a), and a test sample in soil for 6 months (b) .......................................................... 118 Figure 6.8 1H NMR spectra of MPS of a blank sample (a), and a test sample in soil for 6 months (b) .......................................................... 119
CHAPTER 7 Figure 7.1 Thin Film Modified polystyrene discs (TFMP) made by surface casting .................................................................................. 123 Figure 7.2 Diagram of bacteria isolation from leachate with polystyrene film thickness 0.025 mm as substrate ................................................ 124 Figure 7.3 Change in weight of the TFMPS test samples after 90 days incubation with isolated bacterial strains (error bars represent standard deviation) ........................................................................................... 126 Figure 7.4 FESEM micrographs of a control sample of TFMPS at magnification of 5,000x (top) and 10,000x (bottom) .......................... 128

viii
Figure 7.5 FESEM micrographs of treated samples at 10,000x magnification. TFMPS was treated with strains of (a) F1; (b) F2; (c) F5; (d) F7 ................................................................................................. 129 Figure 7.6 FTIR spectra of TFMPS film treated with isolated strain F8 ... .......................................................................................................... 130 Figure 7.7 1H NMR spectrum of a control sample of TFMPS film ...... 132 Figure 7.8 1H NMR spectrum of TFMPS treated with F2 strain ......... 132 Figure 7.9 1H NMR spectrum of TFMPS treated with F8 strain ......... 133 Figure 7.10 GC-MS graph of biodegradation products of TFMPS polystyrene by strain F8 .................................................................... 134
CHAPTER 8 Figure 8.1 Relative abundance of microorganisms at phylum level (level 2) of taxonomy in solid and leachate phase of landfill ....................... 141 Figure 8.2 Relative abundance of microorganisms at class level (level 3) of taxonomy in solid and leachate phase of landfill ....................... 142 Figure 8.3 Relative abundance of microbial communities in leachate at phylum level (level 2) ......................................................................... 143 Figure 8.4 Relative abundance of microbial communities in leachate at Class level (level 3) ........................................................................... 144

ix
LIST OF TABLES
Chapter 2
Table 2.1 Summary of industrial applications of polystyrene. (American Chemistry Council 2015) .............................................................................. 11
Table 2.2 Plastic waste generation and recovery in the United States, 2012 .. ..................................................................................................................... 15
Table 2.3 Typical commercial additives used with polystyrene. ................... 19
Table 2.4 Summary of studies on biodegradability of polystyrene and modified polystyrene .................................................................................... 21
Table 2.5 Existing techniques for assessment of polystyrene biodegradation . ..................................................................................................................... 39
Table 2.6 Standard tests for biodegradation of plastic materials.................. 41
Chapter 3
Table 3.1 List of general equipment used in the project ............................... 48
Chapter 4
Table 4.1 Types and quantity of testing samples in the Summerhill landfill . 67
Table 4.2 Estimation of colour change of the test samples .......................... 70
Table 4.3 Estimation of surface change of the test samples ........................ 74
Table 4.4 Summary of changes in FTIR spectroscopy of the test samples . 79
Table 4.5 GPC analysis of foam cups (MPS and PS) treated in the Summerhill landfill for different periods of time ............................................ 83
Chapter 5
Table 5.1 Quantities of test samples in the laboratory conditions ................ 91
Table 5.2 Summary of weight of test samples before and after laboratory testing ........................................................................................................ 104
x
Chapter 7
Table 7.1 Quantities of test samples for evaluation of modified polystyrene biodegradability of isolated bacteria ........................................................... 125
Table 7.2 GPC analysis of modified polystyrene foam cups (TFMPS) treated by isolated bacteria under laboratory conditions at 460C ........................... 131
Chapter 8
Table 8.1 Identification of isolated bacteria capable of decomposing polystyrene (see chapter 7) ....................................................................... 145
Table 8.2 Microorganisms identified in the published literature able to degrade polystyrene .................................................................................. 146

xi
LIST OF ABBREVIATIONS ABS Acrylonitrile Butadiene Styrene
ASTM American Society for Testing and Materials
CFU Colony Forming Unit
DNA Deoxyribonucleic acid
DSC Differential Scanning Calorimetry
EPS Expanded Polystyrene
FESEM Field Emission Scanning Electron Microscopy
FTIR Fourier Transform Infrared
GC-MS Gas Chromatography-Mass Spectrometry
GPC Gel Permeation Chromatography
HDPE High-Density Polyethylene
HIPS High-Impact Polystyrene
HPLC High Performance Liquid Chromatography
ISO International Organization for Standardization
LDPE Low-Density Polyethylene
MPS Modified Polystyrene
NMR Nuclear Magnetic Resonance
PCR Polymerase chain reaction
PP Polypropylene
PS Polystyrene
PVC Polyvinyl Chloride
TFMPS Thin Film Modified Polystyrene
TPS Thermoplastic Starch

xii
ABSTRACT
Polystyrene is a widely used plastic in many aspects of human life and industrial products due to its useful characteristics. The demand for polystyrene is continuously growing, and the amount of polystyrene waste also continuously increasing. However, polystyrene is very stable and extremely hard to degrade in the environment after disposal. The scarcity of landfill space, hazards of waste incineration and increasing costs of disposing of solid wastes have led to investigations into additives that are believed to help promote the decomposition of polystyrene. Some researchers have reported that additives do help promote the decomposition of plastics, but these tests have been carried out in laboratory conditions. In summary, evaluations of polystyrene biodegradation have been carried out in vitro, and no comprehensive research has been carried out in the real situation of commercial landfills. In this project, the biodegradability of a patented (Patent US 20120301648A1) novel polystyrene cup, where the surface of pre-expanded polystyrene beads had been electrostatically coated with starch, was investigated. This product was believed to be biodegradable in laboratory tests but no data was available on the breakdown of the product when placed in a commercial waste disposal landfill facility. Therefore, the research was conducted in the landfill, where most polystyrene wastes end up. The in situ investigation was followed by further tests in laboratory conditions with leachate organisms from the landfill. A comparison was also made between landfill and soil biodegradation. Microorganisms in the landfill capable of decomposing polystyrene were isolated and identified. The present research is the first report on biodegradability of polystyrene in a managed landfill.
The landfill test was conducted at the Summerhill Waste Management Centre (SWMC), Newcastle, NSW, Australia, a solid waste landfill managed by City of Newcastle. The site is licensed by the NSW Environment Protection Authority (EPA) to receive a wide variety of 'General Solid Waste (Putrescible and Non-putrescible) and Special Waste'. The test samples were installed inside the landfill at 11 meters depth for test time up to 1 year. The samples were analysed after incubations of 76 days, 165 days, 257 days and 356 days. The lab tests using leachate from the landfill were performed in the

xiii
laboratory for 90 days at 46 & 28 degrees Celsius. The test with garden soil was done for six months. The biodegradability of polystyrene was analysed by FTIR, FESEM, GPC, NMR, GC-MS, gas measurement, visual observation and weight loss. Bacteria from the landfill and leachate were isolated and investigated for their ability to biodegrade polystyrene.
The results showed that microorganisms could degrade polystyrene in the landfill and soil. However, in general, the biodegradability of polystyrene was very slow. FESEM showed changes in surface of the test samples such as scabrous or rough surface and forming cracks or holes compared to smooth surface of control. Also, FTIR and NMR showed slight changes in peak intensities in their spectra indicated that the chemical structure of polystyrene had been affected considerably in both regions of aliphatic chains and aromatic rings. These changes were interpreted as signs of depolymerisation. However, in other tests no evolved gas was found, and only a slight decrease in molecular weight was measured indicating that the decomposition process is very slow. Intermediate products of biodegradation also were found as styrene oxide, phenylacetaldehyde and 2-phenyl ethanol in culture solution with isolated bacteria and modified polystyrene as a sole source of carbon. There were eight bacteria strains isolated from the landfill by culturing over 90 days in mineral salt medium with polystyrene as the sole source of carbon. It was shown that these organisms were able to degrade polystyrene in laboratory tests but to varying extents. Next-generation sequencing and bioinformatics analyses showed that they belonged to the Bacillus genus and the Brevibacillus genus. Due to time constraints these pure cultures were not further characterised. Bioinformatics analysis of landfill and leachate also revealed the vast diversity of microbial communities present in the landfill and leachate.
The work described in this thesis supports the hypothesis that modified polystyrene as per US Patent 20120301648A1 is able to be degraded by organisms present in landfill but to a limited extent. Further work is needed to characterise the organisms isolated and indeed to look further into the existence of other candidate organisms in the landfill before commercially viable organisms can be employed in the fight to reprocess polystyrene in landfill.
xiv
DECLARATION
I hereby certify that the work embodied in the thesis is my own work,
conducted under normal supervision. The thesis contains no other material
which has been accepted, or is being examined, for the award of any other
degree or diploma in any university or other tertiary institution and, to the best
of my knowledge and belief, contains no material previously published or
written by another person, except where due reference has been made in the
text. I give consent to the final version of my thesis being made available
worldwide when deposited in the University’s Digital Repository, subject to
the provisions of the Copyright Act 1968 and any approved embargo. Thanh Ba Ho
Signed Date 02/10/2018

xv
ACKNOWLEDGEMENTS
I would like to take this opportunity to thank all those who have supported me during this study.
Firstly, with all my immense gratefulness, I express my gratitude and respect to my principal supervisor, Professor Tim Roberts. During the four years of my candidate, he has conveyed to me the passion and belief to work. I learnt a phrase "blue sky" from him that helped me believe in my research even though the research works not easy. He has been inspiring and encouraging me to achieve research work. Tim must “work hard for me” to accomplish my research work and thesis write up. I cannot imagine my life and my work during four years in Australia without his invaluable support and guidance. I have imagined that Tim is my second father. Any words would not be enough to express my thanks to him. I am eternally grateful to Professor Tim Roberts in my life. He will be a continuous source of inspiration for me in my life.
Great thanks to my co-supervisor Professor Minh Nguyen. He helped me connect to my research team at the University of Newcastle and other supports since the first day I came to Australia.
My sincere thanks to Dr Steven Lucas, my co-supervisor, for his help on lab setting, some works in the field test in the Summerhill landfill and paper publication.
To Professor Michel Lefebvre, my co-supervisor for his supply of test materials and initial research plan.
I wish to thank Dr Monica Rossignoli who kindly supported analyses of FTIR and NMR.
Thanks to Dr Clovia Holdsworth for support on GPC analysis. Thank you to Mrs Vicki Thompson for some chemicals and small equipment.
Special thanks to staff in The Summerhill Landfill Management Centre who helped me set up the in situ test.
Thanks to the kind help of Robert Mueller for bioinformatics analysis.
I am thankful to staff in Biology laboratory for support of my work of isolation and DNA extraction and Staff of ABRF for GC-MS and FESEM.

xvi
I also do not forget to say great thanks to the TFI team who encouraged me to complete my work and also shared my feeling in my life during my time working in TFI.
Thank you to all my friends and colleagues for all their friendship and support over the years in Australia without my closest relatives.
I would like to thank my family for all their love, unwavering support of spirit and encouragement throughout my study. I wish to dedicate this thesis to my wife and two lovely daughters who have always encouraged me in everything I have done throughout my life and whom I know would be very proud of me for the work I have done throughout this study.
Finally, I would like to thank Vietnamese Government and The University of Newcastle, Australia for their scholarship and opportunity for me to finish this course.

1
Chapter 1
INTRODUCTION
1.1 Background
With developments in science and technology and the increase in the global population, the demand for plastics is ever increasing. Plastic materials have been widely used in every aspect of human life and industries such as packaging, building, furniture, housewares, electrical, electronic, transport, and agriculture. The global plastics production is about 322 million tonnes per year. Plastics are estimated to make up approximately 20%–30% volume of municipal solid waste in landfill sites in the United States, Germany, and Australia (Adamcova & Vaverkova, 2014; Leja & Lewandowicz, 2010). Plastic is a name given to synthetic organic polymers with high molecular weight such as low-density polyethylene (LDPE), high-density polyethylene (HDPE), polyvinyl chloride (PVC), polypropylene (PP), polystyrene (PS), polyurethane, and polyethylene terephthalate. Based on the primary processes in the manufacture of synthetic polymers, plastics are divided into two groups: thermoplastics such as polyethene, polypropylene and thermosetting plastics such as polyurethane. Thermoplastics are the products made by breaking the double bond in the original olefin by additional polymerisation to form new carbon-carbon bonds, the carbon-chain polymers (Zheng, Yanful, & Bassi, 2005). Structure of thermoplastics is often linear. Some thermoplastics, polyethylene principally, can be cross-linked. Thermoplastics can be repeatedly softened and hardened by heating and cooling because the polymer chains associate through intermolecular forces, which weaken rapidly with increased temperature. Therefore, thermoplastics can be recycled through several cycles. Thermosetting plastics are formed by the elimination of water between a carboxylic acid and an alcohol or amine to form polyester or polyamide. Thermoset plastics have a highly cross-linked structure. They are solidified and have a 3D structure obtained by chemical cross-linking produced after or

2
during the processing, and they cannot be melted and modified again. Some polymers are used industrially in their two forms, thermoplastic and thermoset; for example, the polyethylene or the vinyl acetate -ethylene (VAE) copolymers. Thermoplastic consumption is roughly 80% or more of the total plastic consumption while thermoset consumption is roughly 12 - 20%. Plastics have many excellent characteristics such as low cost, lightweight, ease of manufacture, versatility, thermal efficiency, durability, and moisture resistance; therefore, plastics are used in an enormous and expanding range of products (Figure 1.1). They have already displaced many traditional materials, such as metal, glass, wood, stone, horn and bone, leather, paper, and ceramic, in most of their former uses.
Figure 1.1 Types of popular plastics used in the market (Yang et al., 2018) According to the U.S. Environmental Protection Agency, about 32 million tonnes of plastic waste were generated in 2012, representing 12.7 per cent of total municipal solid waste. It includes almost 14 million tonnes of plastics as containers and packaging, about 11 million tonnes of durable goods such as appliances, and almost 7 million tonnes of nondurable goods, such as plates and cups. Only 9 per cent of the total plastic waste generated in 2012 was recovered for recycling (EPA, 2014). Ghosh et al., 2013, reported that Asia is

3
the largest consumer market for plastics, accounting for about 35% of the global consumption. It is followed by North America and Western Europe with 26% and 23% respectively. China and India are the two biggest markets for plastic consumption in Asia with the growth rate of polymer consumption around 10% and 16% respectively. In Australia, total plastic consumption in 2009-2010 was 1,501,258 tonnes. The total packaging plastic consumption was 565, 285, equivalent to 37% of total plastic consumption (Figure 1.2). Every year, Australians throw billions of disposable cups, lids and plates in the bin and the most of them end up in landfills without recycling (Drake, 2012).
Figure 1.2 The percentage of plastics used in Australia (A’Vard & O’Farrell, 2013) Like other plastics, polystyrene (PS) is widely used because of its excellent mechanical properties and relatively low cost. PS is widely used in construction materials (insulation), packaging foam, food containers, disposable cups, plates, cutleries, cassette boxes, and compact disks. There was about 21 million tonnes of PS produced in the world in 2013 (Yang et al., 2015b). As a result of such extensive use, plastics including PS have accumulated in the environment, causing environmental pollution, human health problems,

4
and ecosystem changes due to their toxicity and recalcitrant compounds. PS materials can be recycled; however, most PS foam ends in landfills. Since PS foam is lightweight and bulky, transportation costs are a significant component of its recycling. The recycling rate for PS foam in the United States rose to 28% in 2010 from around 20% in 2008 (Rubio, 2018).
Figure 1.3 Estimated time range for plastic degradation in the marine environment (West, 2016) The demand for plastic is still increasing, and the result is an ever increasing amount of plastic waste. The scarcity of landfill space, hazards of waste incineration and increasing costs of disposing of solid wastes have caused scientists to search for new approaches for waste management, particularly of plastic waste. Notably, in the anaerobic condition of a landfill environment, biodegradation of polystyrene would be useful by saving landfill space as well as for energy recovery from evolved biogas. Another critical area of future research is the identification of additives to enhance the rate of polystyrene biodegradation. Theoretically, polystyrene

5
can be used as a carbon source for microorganisms similar to many other hydrocarbons. However, the high molecular weight of polystyrene limits its use as a substrate for enzymatic reactions to take place. The convenience and increasing demand for these polymers together with the increasingly stringent changes in environmental protection have led to legislative requirements to convert them into biodegradable materials in a significantly shorter time. A possible solution is to use an additive capable of accelerating the reaction of the plastic with atmospheric oxygen and incorporating oxygen atoms into the carbon chains in the first stage of degradation. The additives such as metal salts (iron, cobalt and manganese) and copolymer that accelerate this process and promote biodegradation are widely used (Ammala et al., 2011; Ojeda et al., 2009). However, the relation and interaction between additives and rate of biodegradation have still not been clarified. To reduce environmental pollution caused by PS, some solutions have been applied such as reducing the use of PS products and using modified PS materials that can be biodegraded in the environment. PS foam has been banned from sale and use in some places such as San Francisco, Washington DC, Paris, Toronto, and New York because of the enormous problem it causes in waterways (Daneman, 2013; McIlroy, 2015). Researchers have been trying to modify polystyrene by blending with other materials to increase biodegradability of polystyrene in the environment. There have been some studies to find microbes that can digest PS in the environment such as soil, landfill, and activated sludge. Two strategies of polystyrene degradation, using pure microbial strains and/or complex microbial communities have proved that polystyrene can be biodegradable although the biodegradation rate is slow (see Table 2.4, chapter 2). However, research performed so far has mainly been of a descriptive nature. It is likely that future investigations will focus on isolation of microbes and enzymes able to oxidise and break polystyrene chains and use as a substrate to elucidate the mechanisms of degradation of polystyrene and the fate of polystyrene inside microorganisms. So far, most of the studies have been carried out in lab conditions or lab scale with synthesized polystyrene (graft of blend with other easy degradable compositions such as starch). There have been few studies investigating the degradation of commercial products of polystyrene that have high molecular weight and contain additives to increase their durability. In other words, commercial products of polystyrene are often hard to degrade in the environment. Also, studies of polystyrene

6
biodegradation in anaerobic conditions such as in landfill are rare and to my knowledge there is little information on such in situ studies.
1.2 Aim and objectives
The main aim of the present study was to evaluate the biodegradability of modified polystyrene. The following specific objectives were chosen to elucidate this aim: • To evaluate the biodegradability of polystyrene and to determine the rate of biodegradation of polystyrene (beverage foam cups and HIPS lids) in the real conditions of managed landfill and soil. • To determine the bacterial community in a managed landfill participating in the biodegradable process of polystyrene. • To isolate bacteria that can degrade polystyrene and investigate the end-products of the biodegradation process. All of the research works are summarised in figure 1.4. Figure 1.4 Summarized diagram of the research
Polystyrene foam cups and High impact polystyrene lids
Sampling preparation
Landfill tests Laboratory tests
Analysis of biodegradability
Biodegradation studies by isolated strain of microorganisms
Isolation of microorganisms
Garden soil test

7
1.3 Structure of thesis
The thesis reports on an investigation of biodegradability of polystyrene material in the real environments of landfill and garden soil, and also the bacteria involved. The thesis is composed of nine chapters including five experimental chapters.
Chapter 1 Introduction
This chapter introduces plastic issues in general and polystyrene in particular, and the necessity to do research on these issues. It also mentions the aims and objective of the research, and thesis structure.
Chapter 2 Review of literature
This chapter presents overview of polystyrene, critical review of the existing research on polystyrene degradation, and methods used to evaluate the degradation. By showing gaps in previous research, the review of the literature highlights the need to do this research.
Chapter 3 General materials and methods
True to its name this chapter lists general materials used and various methods applied to carry out the experiments for the research. It also describes the validated methods for evaluation of polystyrene biodegradation.
Chapter 4 Evaluation of biodegradability of polystyrene materials in a managed landfill
This chapter describes the experiment in real condition at the Summerhill landfill, New South Wales, Australia. The purpose of this chapter is to investigate biodegradability of polystyrene in a managed landfill where most polystyrene waste is ending up. In this experiment, cups of polystyrene and modified polystyrene, and lids of high impact polystyrene were examined. It contains the hypothesis, experimental process, obtained results, and critical discussion.
Chapter 5 Evaluation of biodegradability of polystyrene materials in laboratory conditions
Due to the technique of waste treatment in the Summerhill landfill, leachate coming from capped landfill site is not recycled into the landfill solid phase. The humidity inside the landfill was not controlled and may enormously affect the growth of microorganisms inside the landfill. A simulation of landfill condition in the laboratory was carried out to evaluate the polystyrene

8
materials by using leachate collected from the landfill to overcome the disadvantage of humidity and weight loss in the landfill test (chapter 4). This helped to determine the rate of biodegradation.
Chapter 6 Investigation of biodegradability of polystyrene materials in garden soil
In practice not all waste polystyrene is recycled or placed in landfill, a small part of polystyrene foam wastes is not collected to the landfill for many reasons such as spreading by wind due to their light weight or no activity of collection and treatment throughout the world. As the results of that, polystyrene wastes also end up in ambient soil and water environments. Can these polystyrene wastes be degraded by various microorganisms existing in the soil? To find the answer, an experiment was carried out using garden soil which contains a variety of microorganism. It supplies more knowledge about biodegradability of polystyrene in different real conditions.
Chapter 7 Bacterial isolation and investigation of biodegradability of modified polystyrene by isolated bacteria
The obtained results from the previous experiment showed signs of biodegradation of polystyrene. However, which bacteria were involved and what intermediate products of biodegradation of polystyrene were released was still unknown. The work of this chapter was to isolate and evaluate bacteria that can degrade modified polystyrene as the sole source of carbon after 90 days of incubation. The analytical tools used also helped to clarify the intermediates molecules of the degradation of polystyrene.
Chapter 8 Bacterial identification in the landfill
Based on the results of experiments in chapter 7, isolated bacteria able to break down polystyrene foam as the sole source of carbon after 90 days of incubation were identified. Also to have a more general understanding of the community of bacteria in the managed landfill and its leachate; the bacterial consortium present in landfill and landfill leachate was also examined.
Chapter 9 Summary and conclusions
This chapter summarises significant findings and discussions based on the research, provides conclusions. It also points out limitations of the research and suggestions about future research directions.
9
Chapter 2
REVIEW OF LITERATURE∗
2.1 Polystyrene
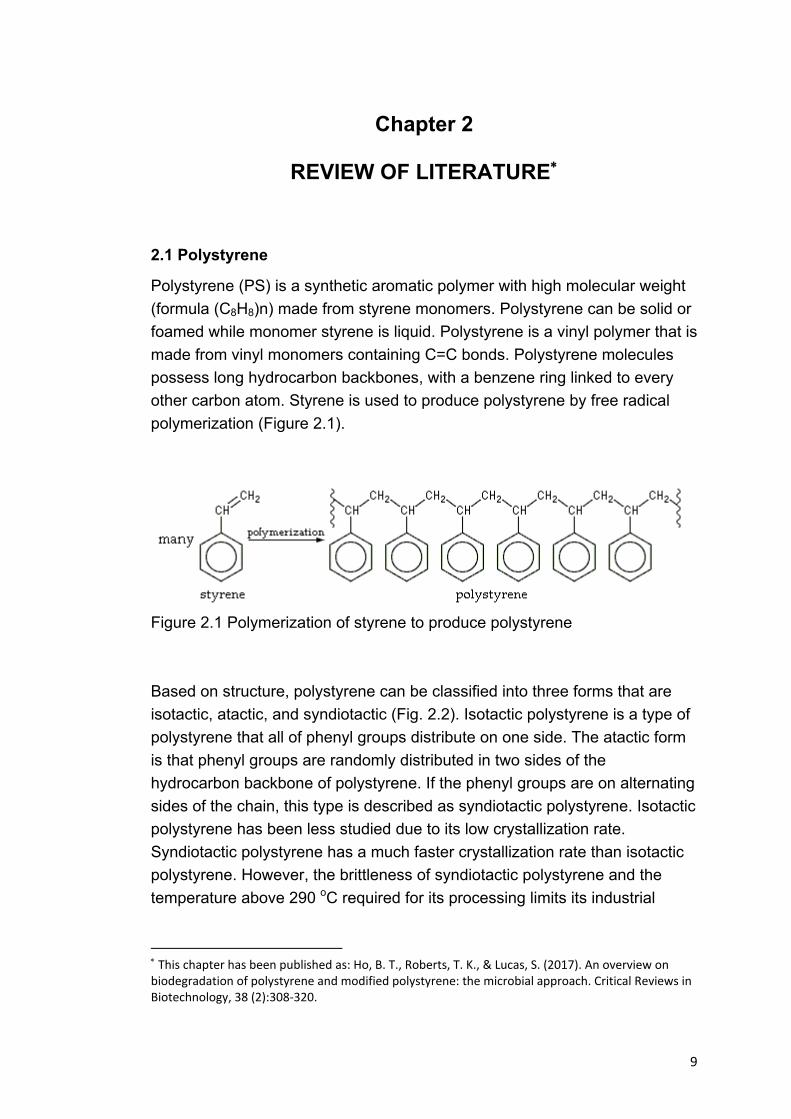
Polystyrene (PS) is a synthetic aromatic polymer with high molecular weight (formula (C8H8)n) made from styrene monomers. Polystyrene can be solid or foamed while monomer styrene is liquid. Polystyrene is a vinyl polymer that is made from vinyl monomers containing C=C bonds. Polystyrene molecules possess long hydrocarbon backbones, with a benzene ring linked to every other carbon atom. Styrene is used to produce polystyrene by free radical polymerization (Figure 2.1).
Figure 2.1 Polymerization of styrene to produce polystyrene Based on structure, polystyrene can be classified into three forms that are isotactic, atactic, and syndiotactic (Fig. 2.2). Isotactic polystyrene is a type of polystyrene that all of phenyl groups distribute on one side. The atactic form is that phenyl groups are randomly distributed in two sides of the hydrocarbon backbone of polystyrene. If the phenyl groups are on alternating sides of the chain, this type is described as syndiotactic polystyrene. Isotactic polystyrene has been less studied due to its low crystallization rate. Syndiotactic polystyrene has a much faster crystallization rate than isotactic polystyrene. However, the brittleness of syndiotactic polystyrene and the temperature above 290 oC required for its processing limits its industrial
∗ This chapter has been published as: Ho, B. T., Roberts, T. K., & Lucas, S. (2017). An overview on biodegradation of polystyrene and modified polystyrene: the microbial approach. Critical Reviews in Biotechnology, 38 (2):308-320.

10
applications. The most commercially important form of polystyrene is atactic (Laur, Kirillov, & Carpentier, 2017).
Figure 2.2 Structure types of polystyrene Polystyrene has been mainly used in four types of product: General Purpose Polystyrene (GPPS), High Impact Polystyrene (HIPS), Polystyrene foam and expanded polystyrene (EPS) foam. General purpose polystyrene is clear, hard, and somewhat brittle and was used in packaging of food industry, laboratory ware, and electronics. Expanded polystyrene is made by expanding beads of polystyrene plastic which are then fused together. Useful properties of EPS are lightweight, strength, durability, thermal insulation, shock absorption, versatility, ease of use, moisture resistance. Therefore, EPS is widely used in many everyday applications such as building and construction (insulated panel systems), packaging, disposable cups, cutleries, lids and plates. Polystyrene has a relatively low melting point, low permeability to oxygen and water vapour, and is an inexpensive resin. The excellent physical and processing properties make polystyrene suitable for a wider range of applications than any other plastics. Applications of polystyrene are summarised in Table 2.1.

11
Table 2.1 Summary of industrial applications of polystyrene (American Chemistry Council 2015) Types of polystyrene Application General Purpose Polystyrene (GPPS)/ Oriented Polystyrene (OPS)
produce baskets pie containers cookie trays deli hinged take-out containers bakery cake domes cutlery (disposable serviceware) plates, bowls, platters (disposable serviceware) cups (disposable serviceware)
High Impact Polystyrene (HIPS) yogurt containers creamers cold drink cups lids single-service condiment containers plates (single-service and reusable) stirrers
Polystyrene Foam meat/poultry trays – (pre-packaged and store packaged) cold drink cups hot drink cups single-service plates/bowls hinged take-out containers school lunch and other food service trays other foam sheet (i.e., egg cartons and fruit and vegetable trays)
Expanded Polystyrene (EPS) Foam
cups and containers coolers (grape and fish boxes) insulated panel systems

12
2.2 History of polystyrene
Polystyrene was accidentally discovered in 1839 in Germany by Edward Simon, an apothecary. Simon found that an oily substance from the resin of sweetgum tree, Liquidambar orientalis, was thickened into jelly in the air and named it as styrol oxide. In 1845 John Blyth and August Wilhelm von Hofmann found that styrol had the same changes in the absence of oxygen and named it as metastyrol. In1866, Marcelin Berthelot identified that it is a polymerization process that changes styrol to metastyrol. Later, Hermann Staudinger (1881-1965) described that a chain reaction occurs when heating styrol and resulting in the formation of macromolecules called polystyrene. In Germany, the I. G. Farben company started producing polystyrene in Ludwigshafen in 1931. Later, expanded polystyrene was produced in 1959 by the Koppers Company in Pittsburgh, Pennsylvania. Polystyrene with syndiotactic conformation was synthesized for the first time in the early 1980s.
2.3 Synthesis of polystyrene
The process of polystyrene synthesis was summarised in figure 2.3. Briefly, it begins by a hydrocarbon cracking (breaking of carbon-carbon bonds in the precursors) natural gas or crude oil to create ethylene. The cracking temperature decides the yield of ethylene. The next step is alkylation of benzene with ethylene to form ethyl-benzene. Then, dehydrogenation of ethylbenzene forms styrene. Polystyrene is produced by polymerization of monomer – styrene. Depending on their applications, polystyrene products are made by injection blow moulding, extrusion, injection stretch blow moulding and thermoforming. Extrusion and injection moulding are used for production of general purpose polystyrene. Thermoforming is often used to make expanded polystyrene foam products. Expanded polystyrene (EPS) is manufactured from polystyrene beads by using a blowing agent (pentane- low boiling point) to expand the polymeric chains in order to achieve a low density foamed polystyrene. A steam process causes the thermoplastic polystyrene to become softer and the internal pressure of the blowing agent causes expansion of the polystyrene bead up to 40 times its original volume. The expanded polystyrene beads are moulded into special shapes by heating with steam again that causes the

13
external surface to become soft and beads stick to each other. When moulded, nearly all the volume of the EPS (95-98%) is air.
Figure 2.3 Production of EPS and HIPS pellets (Polystyrene packing Council, n.d.)
2.4 Other polystyrene blends and copolymers
General purpose polystyrene has a relatively low melting point, reduced resistance to chemicals, scratching and impact, rather poor barrier properties to oxygen and water vapour; poor scratch resistance, low flexibility which considerably limits its use in high-performance and engineering products. To

14
achieve specific properties for a particular application, styrene is mixed with other monomers such as butadiene, acrylonitrile, etc. to make blends, copolymers, graft copolymers. The mix improves properties of impact resistance, toughness, and heat resistance such as high-impact polystyrene (HIPS) or acrylonitrile butadiene styrene (ABS) which are used in electrical and electronic equipment (Brennan, Isaac, & Arnold, 2002). HIPS is a thermoplastic elastomer made from poly (styrene-butadiene-styrene). Polybutadiene has double bonds in it that cause polymerization with styrene as a graft copolymer. The presence of rubber provides flexibility and lowers the softening point, allowing easy thermoforming of HIPS. It also has improved impact resistance and barrier properties, but reduced transparency. ABS is a blend polymer derived from the mix of acrylonitrile, butadiene, and styrene. Acrylonitrile is a synthetic monomer produced from propylene and ammonia. Butadiene, produced by steam cracking process of a petroleum hydrocarbon, is used to produce ethylene and other alkenes. ABS has flexibility of composition, structure and properties by a ratio of monomer for diverse applications. ABS is used in the electronic and automobile industry. ABS is also blended with other polymers for different applications such as ABS/polycarbonate and ABS/polyvinyl chloride (Subramanian, 2017). Styrene-acrylonitrile copolymer (SAN), a rigid, transparent plastic produced by the copolymerization of styrene and acrylonitrile in a ratio of approximately 70 to 30, respectively. SAN has been used in automotive parts, battery cases, kitchenware, appliances, furniture, and medical supplies since the 1950s. SAN combines the clarity and rigidity of polystyrene with the hardness, strength, and heat and solvent resistance of polyacrylonitrile; therefore, it has better mechanical properties as compared to the polyacrylonitrile and polystyrene. Polystyrene–polyacrylonitrile is generally utilised in the automobile making, home wiring and other applications (Wang et al., 2008).
2.5 Uses of polystyrene
Polystyrene is one of the most frequently used thermoplastic materials after polyolefin and polyvinyl chloride (Chemistry Research and Applications, 2014). Polystyrene has an extensive range of uses in human life. It is used in packaging, construction, electronics, house and medical ware and disposable

15
food services (Meenakshi et al., 2002). Expanded polystyrene (EPS) is used for protective packaging in electrical, pharmaceutical and retail industries etc., because of lightweight, shock resistance, cushioning properties, and flexibility in design possibilities. Expanded polystyrene is also widely used in cold rooms, refrigeration and building insulation because of its thermal insulation properties (Aminudin et al., 2011; Kannan et al., 2009). It is sold under various trade names, including Styrofoam™, Styropor®, Styron™, Styro-Flex®, Carinex®, Cellofoam®, Depron XPS®, Fostarene®, Styraclear®, Lustrex®, SABIC® PS, and INEOS® Styrenics. There were about 21 million tonnes of polystyrene produced in the world in 2013 (Yang et al., 2015a, b). Most of the polystyrene wastes ended up in landfills, and a tiny proportion was recycled. In the United States, there was less than 1% of polystyrene waste recycled in 2012 (Table 2.2). Table 2.2 Plastic waste generation and recovery in the United States, 2012 Type of Product
Generation (Short Tons)*
% of Total Generation
Recovery (Short Tons)
% of Total Recovery
Recovery Rate (%)
HDPE 5,530,000 17.4% 570,000 20.4% 10.3% LDPE/LLDPE 7,350,000 23.1% 390,000 13.9% 5.3% PET 4,520,000 14.2% 880,000 31.4% 19.5% PP 7,190,000 22.6% 40,000 1.4% 0.6% PS 2,240,000 7.1% 20,000 0.7% 0.9% PVC 870,000 2.7% 0 0% 0% All Plastics 31,750,000 2,800,000 8.8% Source: EPA (2014) * Short tons = 2000 pound = 0.9 tonnes.
2.6 Treatment of polystyrene wastes and its effects on the environment and human health
Unlike other types of plastic, treatment of polystyrene waste is neither efficient nor effective. Thermal treatment is a favourite decomposition method

16
but can produce large amounts of dioxin precursors such as halogenated phenols and cause dangerous pollution to the environment (Tang, Kuo, & Liu, 2017). Recycling polystyrene is considered as a good solution for protecting the environment; however, it has an enormous disadvantage due to the lightweight and bulk of foamed polystyrene leading to increasing transportation costs. The cost associated with recycling of plastic packaging is often higher than that of producing virgin plastics. Consequently, most polystyrene waste is sent to landfill. It has caused a scarcity of landfill space, and increasing costs of disposing of solid wastes. Because of the less than effective treatments available for polystyrene wastes, they have accumulated in the environment, causing environmental pollution, human health problems and ecosystem changes by their toxicity and recalcitrant compounds. Floating marine debris include a large proportion of plastics especially Styrofoam that pose a severe problem to marine life and natural ecosystems (Hinojosa & Thiel, 2009). Under the influence of biological, physical and chemical factors in the environment for a long time, polystyrene can be broken down into fragments or tiny debris called microplastics. Microplastic particles have the size range from 5 mm to less than 1 micrometre (Andrady, 2011; Dehaut et al., 2016). They are ingested by zooplanktons, mussels, oysters, shrimps, crustaceans, fishes, etc. and can make their way into human food chains. Recently, scientists reported that microplastics from polystyrene were found in water and ocean (Crawford, Blair, & Quinn, 2016; Wu, Yang, & Criddle, 2017). Weinstein, Crocker, and Gray (2016) stated that polystyrene degraded relatively quickly into microplastic particles in salt marshes after eight weeks (Weinstein et al., 2016). Lambert and Wagner (2016) also reported that weathering of polystyrene generated small particles, especially in the nanometre range. Polystyrene is manufactured from the monomer styrene. Styrene is a volatile, colourless, strong-smelling, oily liquid. Styrene is not harmful in tiny amounts in air or food. However, styrene can cause an irritation in human eye and mucous membrane or gastrointestinal problems when contacted. Also, styrene and its metabolites are known to cause serious adverse effects on human health such as neurological impairment and toxic effects on liver (Mooney, Ward, & O’Connor, 2006). Some microbes metabolise styrene in natural environments. Styrene biotransformation to styrene epoxide and formation of peroxide radical are more toxic to human health. Migration of styrene from expanded polystyrene cups into the hot beverages, which is

17
dependent on the fat content, exposure temperature and time (Khaksar and Ghazi-Khansari, 2009). Further, additives used in polystyrene manufacturing may also cause adverse effects. The many commercial additives used for polystyrene material production are shown in Table 2.3. Rani and colleagues (2017) detected hazardous hexabromocyclododecanes; the most widely used brominated flame retardants, in expanded polystyrene buoys used for aquaculture farming. This additive was found in nearby marine sediments and mussels growing on expanded polystyrene buoys (Rani et al., 2017). Decabromodiphenyl ether (decaBDE) and Antimony Trioxide (Sb2O3) are synergistic flame retardant combinations frequently added to HIPS that have been classified as possible human carcinogens (Sekhar et al., 2016).
2.7 Biodegradation of polystyrene and polystyrene blends
Polystyrene is a durable thermoplastic that is generally believed to be non-biodegradable. Actually, biodegradation of polystyrene does occur but at a very slow rate in natural environments, and therefore polystyrene persists for long periods of time as solid waste. Kaplan and colleagues in 1979 stated that in cultivated soils containing a wide range of fungi, microbes and invertebrates, degradation of polystyrene is less than 1% after 90 days with no significant increase in degradation rate after this time (Kaplan, Hartenstein, Sutter, 1979). Conversely, Otake and colleagues reported that a sheet of polystyrene buried in soil for 32 years had no sign of degradation (Otake et al., 1995). The hydrophobic nature of thermoplastics reduces their resistance to hydrolysis. The molecular composition of plastics affects the hydrophobicity of the polymer surface, which in turn affects how easily microorganisms can attach themselves (Albertsson & Karlsson, 1993). Thermoplastics have high molecular weights, and their general lack of water solubility prevents microorganisms from transporting them into their cells for metabolism (Artham & Doble, 2008; Krueger et al., 2017; Motta et al., 2009). Biological processes can start outside the microbial cell by the secretion of extracellular enzymes. However, these enzymes are too large to penetrate deep into the polymer, so they act on the surface by cleaving the polymer chain via hydrolytic mechanisms (Palmisano & Pettigrew, 1992). Generally,

18
microbes cannot degrade synthetic polymers which are made up of only carbon and hydrogen atoms. It is probably due to a total lack in the polymer’s backbone of sites (functional chemical groups) involving carbon-to-oxygen bonds (C=O, C–OR, C–OH), which are the real target of microbial enzymes (Krueger et al., 2017; Motta et al. 2009). Biological processes are further enhanced by the formation of functional groups in the polymer chain (Albertsson, Andersson, & Karlsson, 1987; Nagai, Matsunobe, & Imai, 2005). The use of anti-oxidants, flame-retardants, processing lubricants, and stabilizers in the manufacturing process further protects thermoplastics from oxidation and biodegradation, contributing to the quality, life and usefulness of the resin. Bisphenol A, for example, is widely used as an antioxidant and stabilizing material for polymer products (Yamamoto et al., 2001). Other additives include antimicrobial agents (used in food packaging to preserve shelf-life), and dyes and pigments (often used to improve aesthetic properties of the material) (Saron & Felisberti, 2006). Some typical commercial additives are summarized in Table 2.3. Recently, silver nano-particles have been utilized as an antimicrobial agent in plastic food packaging materials (Arsanit, 2017). Nanosilver damages bacterial cells by weakening cell membranes and destroying enzymes that transport cell nutrients, therefore prolonging the shelf life of foodstuffs (Silvestre, Duraccio, & Cimmino, 2011). Stabilizer technology has the aim to extend the service life of plastics used in outdoor environments, especially in regions of the world that have high temperatures and long summer seasons (Al-Salem, 2009). UV stabilizers, or light absorbers, for example, act to protect the plastic against UV or sunlight damage such as discoloration, cracking, brittleness, or other loss of desirable physical properties. Some typical UV stabilizers are benzophenones, hindered amines, and benzotriazoles.

19
Table 2.3 Typical commercial additives used with polystyrene Additives Dose Functions References 2-(2’-hydroxy-5’-methylphenyl) benzotriazole (Tinuvin P)
0.2-0.3%
UV Stabilizer Smith & Taylor, 2002
Acrawax 200ppm Processing lubricant
Smith & Taylor, 2002
Alicylic bromine 4% Anti-oxidant Grossman & Lutz, 2001
bis (2, 2, 6, 6-tetramethyl-4-piperidyl)sebacate (Tinuvin 770)
0.2-0.5%
UV Stabilizer Smith & Taylor, 2002
Decabromodiphenyl ethane (S-8010)
1-12% Flame retardant
Grossman & Lutz, 2001
Decabromodiphenyl oxide 1-12% Flame retardant
Grossman & Lutz, 2001; Alaee et al., 2003
Dibromoethyldibromocyclohexane (Saytex BCL-462)
<1% Flame retardant
Grossman & Lutz, 2001
Ethylene bistetrabromonorbornane dicarboximide (Saytex BT-93)
13% UV resistant Grossman & Lutz, 2001; Smith & Taylor, 2002
Hexabromocyclododecane <1% Flame retardant
Grossman & Lutz, 2001; Alaee et al., 2003
Mineral Oil <3% Processing lubricant
Smith & Taylor, 2002.
Octadecyl 3,5-di-tert-butyl-4-hydroxycinnamate (Irganox 1076)
0.1 -0.2%
Anti-oxidant Smith & Taylor, 2002
Pentabromochlorocyclohexane <1% Flame retardant
Grossman & Lutz, 2001
Stearic acid 1000-2500 ppm
Processing lubricant
Smith & Taylor, 2002
Tetrabromobisphenol A 10-20% Flame retardant
Alaee et al., 2003

20
Tris Nonyl Phenyl Phosphite (Wytox)
0.2% Anti-oxidant Smith & Taylor, 2002
Zinc stearate 1000-1800 ppm
Processing lubricant
Smith & Taylor, 2002
Since the discovery of synthetic plastics, research has mainly focussed on developing durable materials or very slowly degrading materials in the natural environment. The scarcity of landfill space, hazards of waste incineration and increasing costs of disposing of solid wastes have more recently caused scientists to research new approaches for waste management. Biodegradation of synthetic polymers could be a valuable solution to this environmental problem. The first research on biodegradation of polystyrene was carried out by Sielicki and colleagues (Sielicki et al., 1978). They investigated biodegradation of 1,3-diphenylbutane (styrene dimer) and [beta-14C] polystyrene in liquid enrichment cultures and soil. After that, there have been many studies on biodegradation of different types of polystyrene with a variety of analysing methods for biodegradation. All of the research literature has been summarised in Table 2.4

21
Table 2.4 Summary of studies on biodegradability of polystyrene and modified polystyrene Materials Methods Results References
Blank polystyrene Blend of polystyrene and starch irradiated Polystyrene/10 wt% Starch
Samples were buried for 6 months in soil including agricultural and desert soils. Fourier transform infrared (FTIR), swelling behaviour, mechanical properties, thermogravimetric analysis (TGA), and scanning electron microscopy (SEM) were used to measure biodegradability.
The Polystyrene was generally found to be more resistant to the biodegradation in the two types of soil. The degradation of irradiated Polystyrene/10 wt% Starch bio-blend at a dose of 5 kGy in agricultural soil was slightly higher than that in desert soil. Irradiated PSty/10 wt% Starch bio-blend at a dose of 5 kGy could be used as a potential candidate for packaging material due to the improvement in its mechanical and thermal properties.
Ali and Ghaffar, 2017
Polystyrene films subjected to pure Fenton's reagent (a solution of hydrogen peroxide with
The films were incubated with brown-rot fungus Gloeophyllum trabeum up to 20 days. Biodegradation was analysed by gravimetry, water contact angle (CA) measurement and X-ray photoelectron spectroscopy
There was signal of superficial oxidation; however, the overall effects on the polymer were only slight.
Krueger et al., 2017

22
ferrous iron as a catalyst ) Polystyrene and poly(lactic acid) (PS:PLA) PS:PLA filled with organically modified montmorillonite (OMMT) (PS:PLA:OMMT)
The samples were incubated with fungus Phanerochaete chrysosporium up to 28 days. Scanning electron microscope was used to observe the growth of microorganism and fractures inside the polymer matrix. Change in extracellular protein content, biomass production, and % degradation with respect to time of incubated samples have been also studied.
The PS:PLA:OMMT (at 5 phr OMMT content) and PS:PLA (at 30% PLA) composites show an increment in degradation. The presence of OMMT leads to faster degradation of PS:PLA:OMMT nanocomposites, which decreases in mechanical property by 30% of PLA and 5 wt% of OMMT content.
Shimpi et al., 2017
Polystyrene Two bacterial strains TM1 and ZM1 (isolated from guts of two worms Tenebrio molitor and Zophobas morio) were incubated with PS emulsion. Biodegradation was evaluated by turbidity assay
TM1 and ZM1 could utilize polystyrene as their carbon sources. Yeast extract was a very important co-factor for the TM1 and ZM1 with more efficient PS degrading ability
Tang et al., 2017
Two synthesized 14C-labelled polystyrene polymers: uniformly labelled
The samples were incubated with fungus Penicillium variabile CCF3219 for 16 weeks. The samples were also pre-treated by ozonation to find its effect on the mineralisation by the fungus.
The fungi mineralised both the labelled polymers, and that the [U-ring-14C]-PS with a lower molecular weight led to a higher mineralisation rate. The surface of the ozonated [β-14C]-PS
Tian et al., 2017

23
on the ring ([U-ring-14C]-PS) and labelled at the β-carbon position of the alkyl chain ([β-14C]-PS)
14CO2 was captured to calculate the mineralisation of 14C-PS. Biodegradation were investigated by scanning electron microscopy, Fourier transform infrared spectrometry and gel-permeation chromatography.
became uneven and rough after the incubation, indicating an attack on the polymer by the fungus. Ozonation generated carbonyl groups on the [β-14C]-PS and the amount of the carbonyl groups decreased after incubation of the [β-14C]-PS with the fungus. The molecular weights of the ozonated [β-14C]-PS decreased after incubation. Ozonation pre-treatment could be useful for degradation of PS waste and remediation of PS-contaminated sites
High impact polystyrene with decabromodiphenyl oxide and antimony trioxide
Enrichment medium containing the test samples was used to isolate microbial cultures. 16S rRNA sequencing was used to identify isolated bacteria. Fourier transform infrared, thermogravimetric analysis, Nuclear magnetic resonance and scanning electron microscopy were used to measure biodegradability.
Four bacterial strains were isolated and identified as Enterobacter sp., Citrobacter sedlakii, Alcaligenes sp. and Brevundimonas diminuta. 12.4% (w/w) of the test sample lost within 30 days using an isolate, Enterobacter sp. Polystyrene intermediates were detected in the degradation medium.
Sekhar et al., 2016
High impact Bacillus spp. and Pseudomonas spp. were Degradation with Bacillus spp. showed a Mohan et al.,

24
polystyrene isolated from soil with HIPS as a sole carbon and identified by 16S rRNA sequencing. These techniques of HPLC, NMR, FTIR, TGA and weight loss analysis were used to confirm biodegradation.
weight loss of 23% (w/w) of HIPS film in 30 days. Reduction in turbidity in four days incubation of HIPS emulsion with Bacillus spp. and Pseudomonas spp. was 94% and 97%, respectively.
2016
Polystyrene (disposable plate)
PS degrading micro-organisms were isolated from five different soil samples collected at five different locations. The degradation rate of five strains of microorganism including Pseudomonas aeruginosa, Bacillus subtilis, Staphylococcus aureus, Streptococcus pyogenes, and Aspergillus niger on plastic samples was observed separately by calculating percentage weight loss
The maximum percentage of biodegradation of PS was by Gram negative cocci (in single) isolated from garbage soil after four months of incubation period. The percentage loss in weight of PS was highest by Bacillus subtilis
Asmita, Shubhamsingh,& Tejashree, 2015
Styrofoam containing PS > 98% with (Mn) of 40,430 and (Mw) of 124,200
Mealworms (the larvae of Tenebrio molitor Linnaeus) were fed with Styrofoam as a sole diet. Gel permeation chromatography, solid-state 13C cross-polarization/magic angle spinning nuclear magnetic resonance (CP/MAS NMR)
Within a 16 day test period: - 47.7% of the ingested Styrofoam carbon was converted into CO2. - 49.2% was egested as fecula with a limited fraction incorporated into biomass. The 13C-labeled PS was mineralized to 13CO2
Yang et al., 2015a
25
spectroscopy, and thermogravimetric Fourier transform infra-red (TG−FTIR) spectroscopy were used to analyse fecula egested from Styrofoam-feeding larvae
and incorporated into lipids.
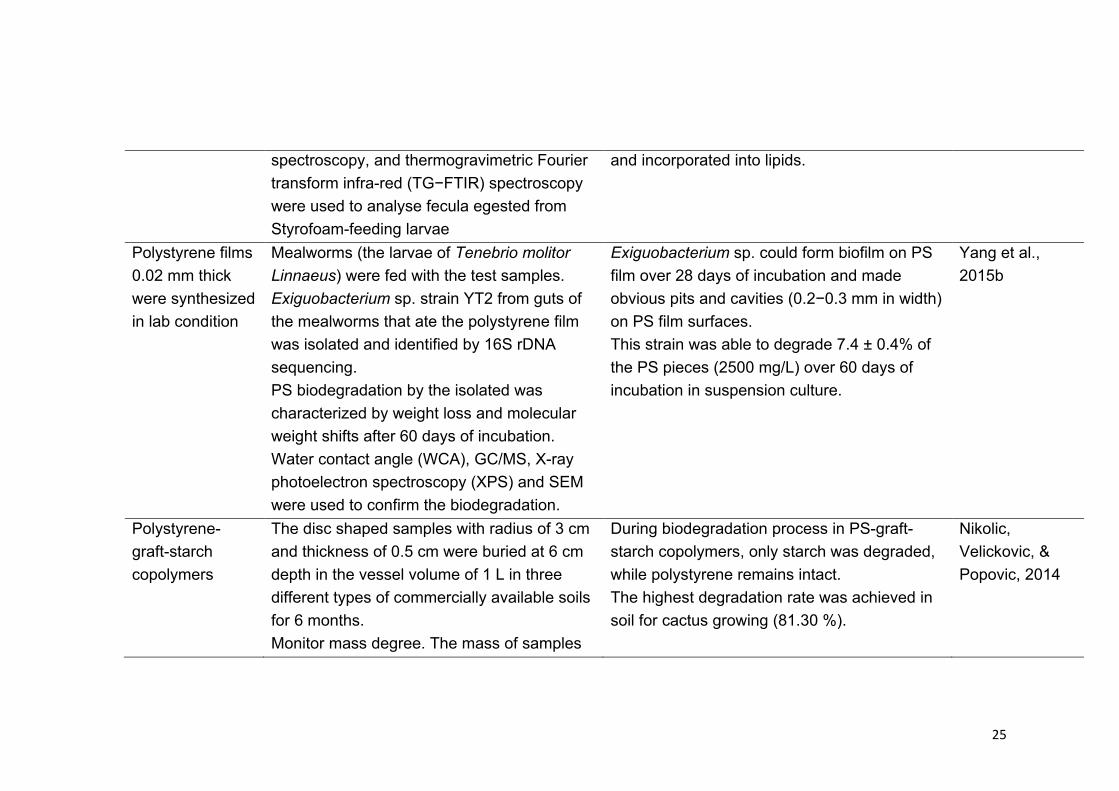
Polystyrene films 0.02 mm thick were synthesized in lab condition
Mealworms (the larvae of Tenebrio molitor Linnaeus) were fed with the test samples. Exiguobacterium sp. strain YT2 from guts of the mealworms that ate the polystyrene film was isolated and identified by 16S rDNA sequencing. PS biodegradation by the isolated was characterized by weight loss and molecular weight shifts after 60 days of incubation. Water contact angle (WCA), GC/MS, X-ray photoelectron spectroscopy (XPS) and SEM were used to confirm the biodegradation.
Exiguobacterium sp. could form biofilm on PS film over 28 days of incubation and made obvious pits and cavities (0.2−0.3 mm in width) on PS film surfaces. This strain was able to degrade 7.4 ± 0.4% of the PS pieces (2500 mg/L) over 60 days of incubation in suspension culture.
Yang et al., 2015b
Polystyrene-graft-starch copolymers
The disc shaped samples with radius of 3 cm and thickness of 0.5 cm were buried at 6 cm depth in the vessel volume of 1 L in three different types of commercially available soils for 6 months. Monitor mass degree. The mass of samples
During biodegradation process in PS-graft-starch copolymers, only starch was degraded, while polystyrene remains intact. The highest degradation rate was achieved in soil for cactus growing (81.30 %).
Nikolic, Velickovic, & Popovic, 2014

26
was measured every 15 days. Fourier transform infrared spectroscopy and scanning electron microscopy were used as methods for characterization of grafted copolymers of polystyrene and starch.
PS/CaSO4 nanocomposites
50 mg of PS/CaSO4 nanocomposites films in 50 ml of mineral salts basal were inoculated with 2 ml of a Gram-positive bacterium, Rhodococcus pyridinivorans NT2 (1.5 × 10⁶ CFU/ml). The biodegradation was assessed by the quantitative estimation of bacterial biomass of biofilm, weight loss study, FTIR and Raman spectroscopy, gel permeation chromatography, contact angle measurements, GC–MS analysis and CO2 release.
There is a steep increase in protein content over three weeks of incubation. A linear positive correlation was observed between the biomass attached on the polymer surfaces and weight loss over the whole incubation period studied.
Kundu et al., 2014
Grafted copolymers of corn starch and polystyrene (PS) and corn starch
The synthesized copolymers and products of degradation were characterized by Fourier transform infrared spectroscopy and scanning electron microscopy. Biodegradation was monitored by mass decrease and the number
The starch–graft-poly(methacrylic acid) copolymers had completely degraded after 21 days, the starch–graft–polystyrene had partially degraded (45.8–93.1 % mass loss) after 27 days.
Nikolic et al., 2013

27
and poly(methacrylic acid)
of microorganisms by the Koch method.
PS: PLA and PS:PLA:organically modified montmorillonite (OMMT) composites.
Confirmation of surface modification using FTIR. Put these polymers in broth medium containing pure Pseudomonas aeruginosa in shaking incubator in 28 days at room temperature. Determination of biomass, protein and degradation. SEM was used to view film surfaces.
All composition supported to the degradation nature properly. The bacterial growth and extracellular protein concentration varies with various composition. 10% PS: PLA and 2 phr (parts per hundred parts of resin) PS: PLA: OMMT nanocomposite showed maximum degradation efficiency
Shimpi et al., 2012
loose-fill foams contain corn starch and polystyrene at ratios of 70:30 and 80:20
The structures and biodegradability of loose-fill foams were evaluated using a laboratory composting system, five 6 L chambers. Biodegradability was expressed as the percentage of CO2 in the exhaust gas eluted from the individual chambers. The concentrations of CO2 in the exhaust gas from the chambers were recorded using a gas chromatograph and the net CO2 production was calculated by subtracting the
The CO2 generation peaked after about 15 days of composting, and then decreased. The rate and amount of CO2 eluted depended on the starch content in the foams. At the end of the composting tests, the remaining foam material had fibrous and crumbly textures, presumably consisting primarily of polystyrene. FTIR and NMR spectra of the foams, taken after 39 days of composting, did not reveal the
Pushpadass et al., 2010

28
CO2 production in the control (chamber) SEM was used to view the microstructures of foams.
spectral features of starch, thereby confirming the decomposition of the starch
Polystyrene (PS) and Expanded polystyrene (EPS) solution (2%) in chloroform was casted on petri plates to get thin films (0.3 - 0.5 mm)
The films remained buried in garden soil for eight months. Bacteria were isolated and identified molecular characterise. FTIR spectroscopy was employed to study surface changes of polystyrene films. Biodegradation products were analysed by High pressure liquid chromatography.
The bacterial isolated strains were identified as Microbacterium sp. NA23, Paenibacillusurinalis NA26, Bacillus sp. NB6, Pseudomonas aeruginosa NB26. They were able to extract some carbon from the complex molecules of polystyrene but the process was very slow and causes no significant chemical changes on the surface.
Atiq et al., 2010
Polystyrene/corn-starch blends (films were 2mm in thickness)
The samples were evaluated by soil burial test under laboratory conditions for a period of 60 days. Weight loss of the specimens with time was used to evaluate degradation. The morphology of the samples was observed with a scanning electron microscope.
The microbial activity inside the specimens was accelerated in the first 15 days of evaluation. There were significant differences in film images after 30 days of incubation in soil. Fractured surfaces covered with a heterogeneous microorganism community
Oliveira, Cunha, & Andrade, 2010
PS and TPS PS/TPS blends were buried in a perforated After 6 months, PS/TPS blends with buriti oil Schlemmer et

29
were mixed in different ratios 0.9:0.1, 0.7:0.3, 0.5:0.5 and 0.3:0.7 TPS was obtained by mixing starch powder, water and glycerol or buriti oil in 50:15:35 (mass/vol/vol) ratios
box to allow the samples to be attacked by the microorganisms and moisture. The box was buried at a depth of 7 - 9 inches beneath the soil surface. Thermogravimetry was used to determine the mass loss and decomposition temperature (Td) of the blends.
presented only one thermal degradation stage with a significant increase in mass loss.
al., 2009
Atactic polystyrene homopolymer samples (Mw) of 270,000 g mol-1 (without pro-oxidant additive) and 286,000 g
The samples were subjected to degradation by ultraviolet radiation and heat over three different time periods. The oxidised surface residues detached from the samples were incubated in a stabilised compost of urban waste (58 oC) or in an aqueous mineral medium (25 oC), the latter being inoculated with urban waste compost and also with a
These samples underwent biodegradation and gave mineralisation values of 2–5% over 2–3 months of incubation in compost and perlite or in mineral aqueous medium. Biodegradation of the residues from the samples not containing pro-oxidant additives was also observed, but at levels which were lower than those obtained for oxo-biodegradable samples.
Ojeda et al., 2009

30
mol-1 (with pro-oxidant additive with a cobalt-based salt additive; and with a manganese-based salt additive.)
microbial consortium. Microbial growth was assessed through optical density at 600 nm. Respirometry tests in compost were measure by CO2 value.
Chemically oxidized polystyrene
Pure culture of fungi Curvularia, Aspergillus niger, Aspergillus flavus, Mucor sp., Monilia sp., and Penicillium sp. Microscopic examination for degradation
Curvularia colonized the oxidized polystyrene in Sabouraud plates within 9 weeks. Hyphae adhering to and penetrating the polymer’s surface.
Motta et al., 2009
Three forms of polystyrene: - pure standard polystyrene flakes; - polystyrene powder; - ELISA 96-well microtiter plates manufactured
Cultivate strain of Rhodococcus ruber on the experimental samples. Estimating bacterial biomass of the biofilm. Estimation of the protein content of biofilms by a spectrophotometer at 280 nm. Biofilm respiration measurements. SEM for biofilm analysis.
This study shows the colonization, biofilm formation and, presumably, partial biodegradation of polystyrene by R. ruber (C208). Prolonged incubation (of up to 8 weeks) of C208 with polystyrene resulted in a dense biofilm on the polystyrene surface which may have led to a partial degradation (about 0.8% weight loss) of the polymer the formation of biofilms on hydrophobic polymers, such as
Mor and Sivan, 2008

31
from pure polystyrene.
polystyrene, may be promoted by carbon starvation
Pine wood treated with polystyrene
Pure culture with fungus Postia placenta for 8 weeks. Determine the mass loss
The wood samples treated with polystyrene were not significantly decayed
Raberg & Hafren, 2008
Polystyrene Pyrolysis of polystyrene to styrene oil, followed by the bacterial conversion of the styrene oil to PHA by Pseudomonas putida CA-3 (NCIMB 41162) as the sole source of carbon and energy.
Styrene oil (1 g) was converted to 62.5 mg of PHA and 250 mg of bacterial biomass in shake flasks.
Ward et al., 2006
high impact polystyrene blended with starch (16-32%) weight)
The samples were incubated with concentrated activated sludge for 12 weeks. Mechanical degradation was determined by stress-strain tests. GPC measurements established changes towards lower polymer molecular weights. SEM examination showed the presence of microorganisms in the polymer samples, as well as changes in polymer morphology in areas near holes produced in samples.
HIPS with starch was degraded for 12 weeks by concentrated activated sludge. Concentrated activated sludge was effective in polymer degradation and starch accelerated the structural changes in that work
Jasso et al., 2004
polystyrene
Isolating and identifying 16S rDNA Weight loss measurement
Xanthomonas sp. and Sphingobacteriem sp. could degrade polystyrene
Oikawa et al., 2003

32
Bacillus sp. STR-Y-O strain decomposed polystyrene 56% of initial concentrations in 8 days.
Maleic anhydride (14% by weight) to functionalize polystyrene and anchored small quantity of different monomeric sugar like glucose, lactose or sucrose
Pure culture of soil bacteria (Serratia marcessens, Pseudomonas sp. and Bacillus sp.) on the test sample. Degradation was determined by infrared spectroscopy analysis, weight loss, and gel permeation chromatography.
The changes in the IR spectrum, Weight loss of the polymers, reduction in the molecular weight supported for the biodegradation. Anchoring of minute quantities of saccharide moieties onto polyolefins would greatly improve their rates of biodegradation
Galgali et al., 2002
Graft copolymer of Cassava starch and polystyrene
Soil burial testing The resistance of the plastic to bacteria (Bacillus coagulans 352) All degradation processes were followed by monitoring tensile properties, molecular weight, and thermal properties of the plastic.
All the plastics took a longer time to degrade by the soil burial test. The composite PS sheets revealed the destroyed areas of starch, indicating that the bacteria help promote the biodegradation of polystyrene plastics before other disintegrations take place.
Kiatkamjornwong et al., 1999

33
Lignopolystyrene Graft Copolymers
The polymer samples were incubated with the white rot fungi Pleurotus ostreatus, Phanerochaete chrysosporium, and Trametes versicolor and the brown rot fungus Gloeophyllum trabeum. Degradation was verified by weight loss, quantitative UV spectrophotometric analysis of both lignin and styrene residues, scanning electron microscopy of the plastic surface, and the presence of enzymes active in degradation during incubation.
White rot fungi degraded the plastic samples at a rate which increased with increasing lignin content in the copolymer sample. Both polystyrene and lignin components of the copolymer were readily degraded. White rot fungi produced and secreted oxidative enzymes associated with lignin degradation in liquid media during incubation with lignin-polystyrene copolymer. Polystyrene pellets were not degradable. Brown rot fungus did not affect any of the plastics.
Milstein et al., 1992
Three synthetic 14C-labeled polymers: poly (methyl methacrylate), phenol formaldehyde, and polystyrene.
Radioactivity was measured in a Beckman LS 100C-liquid scintillation counter for base line rates of 14CO2 release.
All three polymers are highly recalcitrant to biological decay. The addition of cellulose and minerals failed to increase decomposition rates significantly. Fungi in axenic cultures degraded 0 to 0.24% polystyrene during 35 days
Kaplan et al., 1979
[14C]polystyrene Liquid enrichment and four different soils Degradation rate was 1.5 to 3% after 4 months Sielicki et al.,

34
and 1,3-diphenylbutane
Measuring 14CO2 evolution Soil microorganisms of Nocardia, Micrococus, Pseudomonas, Bacillus metabolized 1,3 diphenylbutane
1978
35
2.8 Analytical techniques used in biodegradation studies
2.8.1 Visual observation
Visual observation to evaluate the apparent changes on the surface morphology of the biodegraded polymer can be used for an initial estimation of biodegradation. These changes include roughening, loss of smoothness of the surface, creation of holes and cracks, changes in colour, and formation of microbial colonies over the surface. Visual changes can be used as the first indication of any microbial attack. Microbial colonies can be seen by the naked eye, and their quantity of microorganisms on Petri dishes can be estimated by several normalized tests (Lucas et al., 2008; Nikolic et al., 2014; Tang et al., 2017). However, to obtain information about the degradation mechanism, more sophisticated observations can be employed such as scanning electron microscopy, photonic microscopy, polarization microscopy, electronic microscopy, atomic force microscopy, and scanning force microscopy. Method of visual observation is simple, quick, and cheap. The obtained results, however, are qualitative because the microbial colonies may be utilizing additives within the polymer and not the polymer itself. Furthermore, some structural differences may be due to physical/chemical degradation rather than biodegradation (Moore & Saunders, 1997).
2.8.2 Changes in mechanical properties and molar mass
Stress-strain tests (tensile strength, elongation at break, modulus, and yield stress) are used to measure mechanical changes during degradation. A disadvantage of using mechanical properties, or any other property that relies on the macromolecular nature of the substrate for the estimation of biodegradability, is that these properties can only address the early stages of the biodegradation process. Mechanical properties are usually used to support the results of other tests. A decrease in the average molecular weight and the broadening of the molecular weight distribution provide initial evidence of the degradation of a polymer. A change in molecular weight is a measure of bulk deterioration, whereas biodegradation occurs initially on the polymer’s surface. Therefore, no degradation may be observed from molecular weight measurement even when there has been a significant amount of

36
weight loss. However, the method can be used to indicate where cleavage occurs in the polymer chain during biodegradation. Change in molecular weight is an easy measurement of biodegradation, and when used with other methods, it can be a useful indicator of the degree of biodegradability (Moore & Saunders, 1997). The molecular weight of a biodegradable polymer can be measured by gel permeation chromatography (Kundu et al., 2014; Yang et al., 2015b).
2.8.3 Weight loss measurements
Measurement of weight loss for the estimation of biodegradation is a frequently used method when the polymer is exposed to a mixture of selected microbes in culture media with the polymer as the sole source of carbon. This method is standardized for in-field and simulation biodegradability tests (ASTM D7473-12, 2012). Problems can arise with the correct cleaning of the sample or if the material disintegrates excessively (Muller, 2005). Measurement of the weight loss of samples is not really representative of material biodegradability since this loss of weight can be due to the vanishing of volatile and soluble impurities (Lucas et al., 2008). Furthermore, the method only addresses the early stages of the biodegradation process but gives no information on the extent of mineralization (Zee, 2005).
2.8.4 Determination of biogas (CO2/CH4) evolution
Evolved CO2 or CH4 from biodegradation are used as analytical parameters to determine the ultimate biodegradability of polymers. Under aerobic conditions, microbes use oxygen to oxidize carbon compounds and form CO2 as one of the major metabolic products. The amount of CO2 evolved is a measure of the extent of biodegradation achieved. It is expressed as a percentage of the theoretically expected value for total carbon conversion to CO2. A value of 60% carbon conversion to CO2 achieved within 28 days for the resins made from single polymer is generally taken to indicate ready degradability. A respirometer is used to measure CO2 production. CO2 evolution is the method most often used to measure biodegradation (Kundu et al., 2014; Pushpadass et al., 2014). Some public tests have been standardized for aerobic biodegradation, such as the modified Sturm test and the laboratory-controlled composting test which was discussed in the Standard manuals (ISO 14852, 1999; ISO 14855-2, 2007; ISO 17556, 2012; EN 14047, 2002).

37
Anaerobic tests generally follow biodegradation by measuring the increase in pressure and/or volume due to methane evolution, usually in combination with gas chromatographic analysis of the gas phase. A number of public tests have been standardized for anaerobic biodegradation of polymers, such as the anaerobic sludge test and the anaerobic digestion test as in ISO 13975:2012, ASTM 5526–12, and ASTM D5511–12 (ISO 13975,2012; ASTM D5511-12, 2012; ASTM D5526-12, 2012).
2.8.5 Oxygen consumption
The amount of oxygen consumed during biodegradation is also an indicator of biodegradation. It can be measured by comparing the biological oxygen demand to the chemical oxygen demand. A respirometer is used to measure the oxygen consumption (Moore & Saunders, 1997). The method for the determination of oxygen consumption is based on the so-called MITI (Ministry of International Trade and Industry, Japan) test and is standardized as ISO 14851:1999, ISO 17556:2012, and EN 14048:2002 (ISO 17556, 2012; ISO 14851, 1999; EN 14048, 2002).
2.8.6 Clear-zone formation
This method is an agar plate test in which the polymer is dispersed as very fine particles within the synthetic medium agar resulting in an opaque appearance of the agar. After inoculation with microorganisms, the formation of a bright halo around the colony is found. The formation of a bright halo indicates that the microorganisms are at least able to depolymerize the polymer, which is the first step of biodegradation. The method is usually applied to screen microorganisms that can degrade a particular polymer, but it can also be used to obtain semi-quantitative results by analysing the growth of the clear zone (Lucas et al., 2008).
2.8.7 Radiolabelling
Radiolabelling is a non-destructive technique for measuring biodegradation. Using this technique for polymeric materials to investigate biodegradability in different microbial environments shows a high degree of precision and consistency. In this technique, the carbon in the polymer is radiolabelled with carbon isotope 14C and exposed to a microbial environment.

38
It is possible to determine the duration of exposure by comparing the amount of radioactive 14CO2 or 14CH4 to the original radioactive of the label product. The amount of 14CO2 evolved is measured using a scintillation counter. This method is not subject to intervention by additives or biodegradable impurities in the polymer. The disadvantages of this method are the difficulty and cost in preparing radiolabelled polymers (e.g. particular laboratory, and specific equipment). Licensing (trained technicians) and waste disposal of the radioactive samples may also be drawbacks (Zee, 2005, Shah et al., 2008). Techniques available for evaluating PS degradation are summarized in Table 2.5.
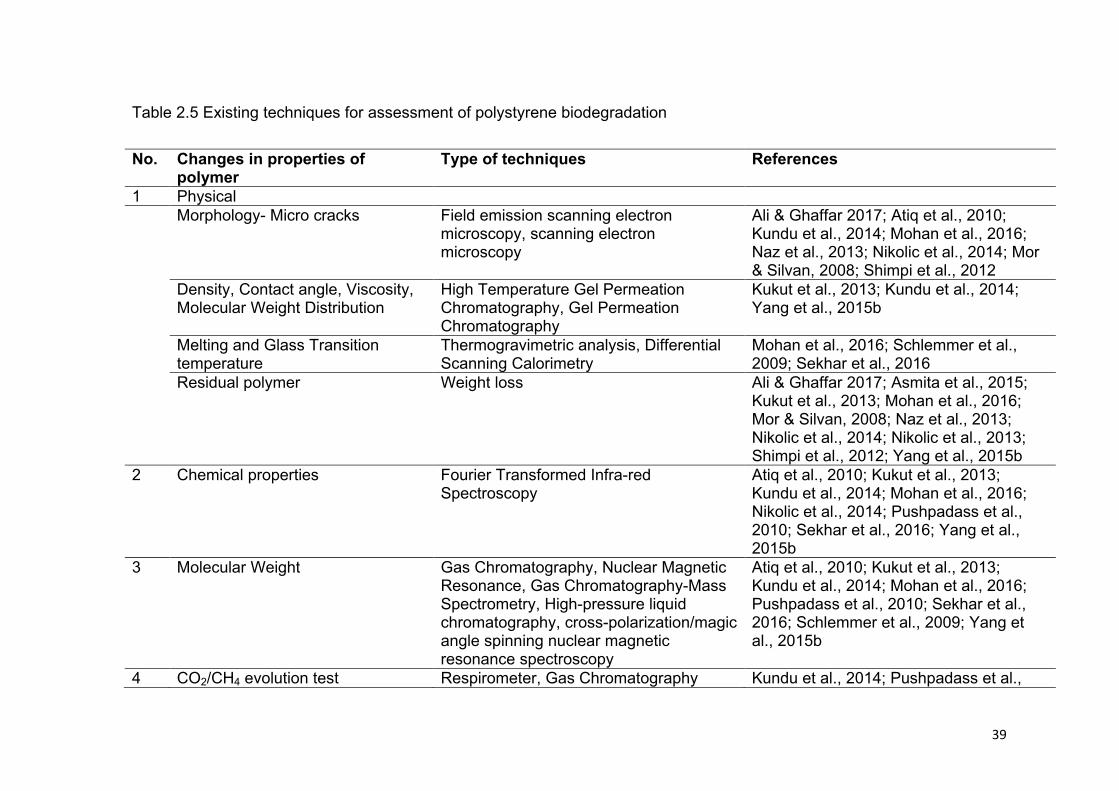
39
Table 2.5 Existing techniques for assessment of polystyrene biodegradation No. Changes in properties of
polymer Type of techniques References
1 Physical Morphology- Micro cracks Field emission scanning electron
microscopy, scanning electron microscopy
Ali & Ghaffar 2017; Atiq et al., 2010; Kundu et al., 2014; Mohan et al., 2016; Naz et al., 2013; Nikolic et al., 2014; Mor & Silvan, 2008; Shimpi et al., 2012
Density, Contact angle, Viscosity, Molecular Weight Distribution
High Temperature Gel Permeation Chromatography, Gel Permeation Chromatography
Kukut et al., 2013; Kundu et al., 2014; Yang et al., 2015b
Melting and Glass Transition temperature
Thermogravimetric analysis, Differential Scanning Calorimetry
Mohan et al., 2016; Schlemmer et al., 2009; Sekhar et al., 2016
Residual polymer Weight loss Ali & Ghaffar 2017; Asmita et al., 2015; Kukut et al., 2013; Mohan et al., 2016; Mor & Silvan, 2008; Naz et al., 2013; Nikolic et al., 2014; Nikolic et al., 2013; Shimpi et al., 2012; Yang et al., 2015b
2 Chemical properties Fourier Transformed Infra-red Spectroscopy
Atiq et al., 2010; Kukut et al., 2013; Kundu et al., 2014; Mohan et al., 2016; Nikolic et al., 2014; Pushpadass et al., 2010; Sekhar et al., 2016; Yang et al., 2015b
3 Molecular Weight Gas Chromatography, Nuclear Magnetic Resonance, Gas Chromatography-Mass Spectrometry, High-pressure liquid chromatography, cross-polarization/magic angle spinning nuclear magnetic resonance spectroscopy
Atiq et al., 2010; Kukut et al., 2013; Kundu et al., 2014; Mohan et al., 2016; Pushpadass et al., 2010; Sekhar et al., 2016; Schlemmer et al., 2009; Yang et al., 2015b
4 CO2/CH4 evolution test Respirometer, Gas Chromatography Kundu et al., 2014; Pushpadass et al.,

40
2010; 5 Others Protein analysis, Turbidity Assay, plate
count Kundu et al., 2014; Mor & Silvan, 2008; Naz et al., 2013; Nikolic et al., 2013; Shimpi et al., 2012; Tang et al., 2017

41
2.9 Standard tests for plastic biodegradation
Many countries have attempted to standardise test methods of plastic biodegradation and currently ASTM standards, ISO standards, and European standards are most widely used. ASTM International is one of the largest voluntary standards development organizations which many technical standards have been built up and applied around the world. Known for their high technical quality and market relevancy, ASTM International standards have an essential role in the information infrastructure that guides design, manufacturing and trade in the global economy. European standards were first used for the internal region of 33 countries of Europe. However, these standards were also used by other countries to refer for building their standards or for application. These standards used for evaluating plastic biodegradability were designed to assess plastic materials under environmental conditions or in municipal and industrial biological waste treatment facilities as aerobic composting and anaerobic digestion like conditions managed landfill sites. Most of the popular standards are shown in Table 2.6 as follows: Table 2.6 Standard tests for biodegradation of plastic materials Test codes Testing name ASTM D6400-04 Standard specification for compostable plastics. ASTM D5338-11 Standard Test Method for Determining Aerobic
Biodegradation of Plastic Materials under Controlled Composting Conditions, Incorporating Thermophilic Temperatures.
ASTM D6691-09 Standard test method for determining aerobic biodegradation of plastic materials in the marine environment by defined microbial consortium or natural sea water inoculum.
ASTM D7081-05 Standard specification for non-floating biodegradable plastics in the marine environment
ASTM D5988-18 Standard Test Method for Determining Aerobic Biodegradation of Plastic Materials in Soil.
ASTM D5210-92 Standard Test Method for Determining the Anaerobic

42
(2007) Biodegradation of Plastic Materials in the Presence of Municipal Sewage Sludge.
ASTM D7475 – 11
Standard Test Method for Determining the Aerobic Degradation and Anaerobic Biodegradation of Plastic Materials under Accelerated Bioreactor Landfill Conditions.
ASTM D5511-12 Standard Test Method for Determining Anaerobic Biodegradation of Plastic Materials under High-Solids Anaerobic-Digestion Conditions.
ASTM D5526-12 Standard Test Method for Determining Anaerobic Biodegradation of Plastic Materials under Accelerated Landfill Conditions.
ASTM D6776-02 Standard test method for determining anaerobic biodegradability of radiolabelled plastic materials in a laboratory-scale simulated landfill environment.
ISO 10210:2012 Plastics – Methods for the preparation of samples for biodegradation testing of plastic materials.
ISO 13975:2012 Plastics – Determination of the ultimate anaerobic biodegradation of plastic materials in controlled slurry digestion systems – Method by measurement of biogas production.
ISO 14851:1999 Determination of the ultimate aerobic biodegradability of plastic materials in an aqueous medium – Method by measuring the oxygen demand in a closed respirometer.
ISO 14852:2018 Determination of the ultimate aerobic biodegradability of plastic materials in an aqueous medium – Method by analysis of evolved carbon dioxide.
ISO 14853:2005 Plastics - Determination of the ultimate anaerobic biodegradation of plastic materials in an aqueous system – Method by measurement of biogas production.
ISO 14855-1:2012
Determination of the ultimate aerobic biodegradability of plastic materials under controlled composting conditions — Method by analysis of evolved carbon dioxide – Part 1: General method.
ISO 14855-2:2018
Determination of the ultimate aerobic biodegradability of plastic materials under controlled composting

43
conditions – Method by analysis of evolved carbon dioxide – Part 2: Gravimetric measurement of carbon dioxide evolved in a laboratory-scale test
ISO 15985- 2004 Plastics - Determination of the ultimate anaerobic biodegradation and disintegration under high-solids anaerobic-digestion conditions - method by analysis of releases biogas. (52°C ± 2°C- thermophilic conditions).
ISO/DIS 17556 Plastics - Determination of the ultimate aerobic biodegradability of plastic materials in soil by measuring the oxygen demand in a respirometer or the amount of carbon dioxide evolved.
ISO 17088 Specifications for compostable plastics. EN 13432- 2000 Requirements for packaging recoverable through
composting and biodegradation – Test scheme and evaluation criteria for the final acceptant of packaging.
EN 14995 – 2006
Plastics. Evaluation of compost ability. Test scheme and specifications.
2.10 Issues with current standards/specifications
Currently, there are many standard tests for biodegradable capacity of plastics for different purposes from developed countries or organizations and are used for their third-party test results such as ASTM (American Society for Testing and Materials), ISO (International Organization for Standardization), and European Standardization (EN). These standard tests have been used to evaluate biodegradation of plastics as aerobic composting as well as anaerobic biogasification. However, these standard tests need to be modified to suit the real conditions that most plastic wastes that end up in landfill sites are exposed to (Adamcova & Vaverkova, 2014). In Australia, two standards as AS 4736-2006 and ASTM D5511 are used to assess plastic biodegradation. AS 4736- 2006 standard is used for an aerobic condition such as composting while ASTM D5511 standard is used to evaluate plastic degradation as might be seen in managed landfill conditions.

44
AS4736-2006 standard, prepared by the Standards Australia to assist authorities to regulate polymeric materials entering into the Australian market, provides assessment criteria for plastic materials that are to be biodegraded in municipal and industrial aerobic composting facilities (Australian Standard). This standard is similar to the widely known European EN 13432 standard but has an additional requirement of an earthworm test for eco-toxicity (Australian Bioplastics Association). A biodegradable plastic must meet five criteria (CSIRO):
• Minimum of 90% biodegradation of plastic materials within 12 weeks in compost
• Minimum 90% of plastic materials should disintegrate into less than 2mm pieces in compost within 12 weeks
• No toxic effect of the resulting compost on plant or earthworms • No presence of heavy metals and harmful substances • Plastic materials should contain more than 50% organic materials.
It is clear that AS4736-2004 is a strict standard for plastic biodegradation in aerobic composting. However, in Australia, there was about 34.8% of packing plastics recycling and more than 65% of packing plastics ended up in landfill sites (Drake, 2012). The standard AS4736-2006, therefore, does not adequately deal with the biodegradation requirements of managed landfill sites because environmental conditions in compost and landfill sites are entirely different. An alternative solution for this discrepancy is application of standard ASTM D5511. The test method of ASTM D5511 standard is equivalent to ISO 15985 (ASTM international). This standard is suitable for evaluation of plastic biodegradation in an anaerobic condition which resembles that in landfill sites. ASTM D5511 is a test method that determines the rates and degree of biodegradability of plastic products when placed in a high solids anaerobic apparatus (Biorene and ASTM) which measures the volume of CO2 and CH4 evolved from the test sample. The measurement of the gases evolved over time is a measure of the percentage of biodegradation. Biorene Company is one of the pioneer companies in Australia applying ASTM standard D5511 for testing of the plastic biodegradation in lab scale (http://www.biorene.com.au). The testing method of ASTM D5511 standard resembles other anaerobic conditions

45
where the gas generated is recovered, and other factors are controlled such as moisture, oxygen, and temperature (ASTM international). However, there are still some differences between lab scale and the real condition in a landfill site. It is clear that biodegradation of plastics depends on both the chemical nature of the polymer and the environment in which they are placed (Adamcova & Vaverkova, 2014; Bhardwaj, Gupta, & Tiwari, 2013). There are many environmental factors affecting biodegradation such as temperature, illumination, humidity, pH, oxygen, and other compounds because they mainly affect the activities of microorganisms. Moreover, microbial diversity in the landfill sites is more extensive than in the lab scale test (Adamcova & Vaverkova, 2014). Yi and colleagues (2014) stated that efficiency of anaerobic digestion was also affected by the total solids content of feedstock (Yi et al., 2014). Solids content in naturally wetter landfills range from 55% to 65%, while the driest landfills may reach 93% (Plastic in landfill- http://www.goecopure.com/plastic-landfills). Moreover, the growth of microbes in landfill site may also be affected the carbon dioxide and methane which are formed in the anaerobic condition by the microbes. In the real condition as landfill, the activity of microbes is also affected by topography and seasonal temperature and humidity factors. So, is it the best test if only more than 20 - 30% of total solids are to be used in the testing method of D5511? In addition, the short time frame of the standard test method for plastic biodegradation is unlikely to yield relevant results because the overall rate of degradation of organic materials in landfill sites is slow and the operation time of a managed landfill is at least of 20 years while the time in the laboratory standards test is around three months. Adamcova & Vaverkova (2014) showed in their experiment that some plastic materials which were advertised as 100% degradable or certified as compostable in a municipal waste landfill could not decompose in twelve months. Even though cellulose filter paper, an easy biodegradable material, was fully biodegraded after eight months (Adamcova & Vaverkova, 2014). Until now, the degradation process for commercial biodegradable materials following burial in modern sanitary landfills is virtually unknown.

46
Chapter 3
GENERAL MATERIALS AND METHODS
3.1 Materials
3.1.1 Test samples
There were three different plastic samples used in the research project: 1) Modified polystyrene (MPS) foam cups, 2) High-impact polystyrene (HIPS) lids, 3) Polystyrene (PS) cups, Dart® (Dart Container Corporation, Michigan, US).
The disposable beverage cups (MPS) and lids (HIPS) were supplied by Steripak Pty Ltd, Australia for biodegradability assay. According to the manufacturer, the foam cups are made of modified polystyrene containing polystyrene and starch with the ratio 99.5:0.5 respectively. This biodegradable additive was electrostatically coated on the surface of pre-expanded polystyrene beads (Lefebvre, Patent US 20120301648A1). These products were believed to biodegrade in the environment. The biodegradability of these two products in compost was investigated in lab scale at Victoria University, Australia. According to an internal report for Rema Industries & Services Pty Ltd prepared by Marlene Cran (2011), there was significant biodegradation of these cups and lids under laboratory conditions when incubated with compost. Dart foam cups (Stock Number: 8J8) were bought in the market in Australia. These regular cups were produced by Dart Container Corporation, the world's largest manufacturer of foam cups and containers. A photo of all test samples is shown in figure 3.1.

47
Figure 3.1 Polystyrene samples used in this project
3.1.2 General equipment
The basic laboratory apparatus used for the research is listed in table 3.1. Other equipment available in the laboratory was also used and is referred to in the relevant chapters.

48
Table 3.1 List of general equipment used in the project
Equipment Suppliers Analytical balance (0.001g) Sartorius Gottingen, Germany Level Troll 700 Data logger In-Situ, USA Variable temperature-Water baths Labec, Australia Eppendorf centrifuge/ Microcentrifuge
Eppendorf Geratebau, Germany
Dry block heater Memmert Co., Germany Vortex mixer Thermo Fisher Scientific, USA Shaker UK Labs Direct, UK Fridge 4oC Sanyo Co., Japan CO2 Incubator Thermo Fisher Scientific, USA Microflow advanced Bio safety cabinet
Microflow , UK
Micropipettes Thermo Fisher Scientific, USA Thermometer Thermo Fisher Scientific, USA pH meter Hanna Instrument, Australia Gas sampling bags Restek Corporation, U.S. NMR tubes Sigma-Aldrich, USA Three-way valves (PVDF) Burkle, Deutschland GC-MS system Agilent Technologies FESEM system Zeiss FTIR system PerkinElmer UATR Two model-
USA NMR system AscendTM 400, Bruker GPC system Shimadzu, Japan Glassware (beakers, conical flasks, Petri dishes, test tubes, glass bottles, pipets, 2 ml vials, 10 mL vials, etc.,)

49
3.1.3 Chemicals
MOBioPowersoil kit (Mo Bio) Nutrient Agar (Oxoid) Nutrient Broth (Oxoid) Mineral salts for microbial culture (Oxoid) Diethyl ether (Sigma-Aldrich) Phenylacetaldehyde (2-Phenylacetaldehyde; Sigma-Aldrich) Styrene oxide (Styrene-7,8-oxide; Sigma-Aldrich) Phenylethanol (2-Phenylethanol; Sigma-Aldrich) 1-Phenyl-1,2-ethanediol (Sigma-Aldrich) Deuterated chloroform (Sigma-Aldrich) Tetrahydrofuran (Sigma-Aldrich)
3.2 Methods
3.2.1 Overview of experiment
In laboratory studies (Cran, 2011) an effect was reported after 12 and 24 days as follows:
• Normal 100% polystyrene cups (PS) did not biodegrade to any significant extent.
• HIPS (High impact polystyrene) lids were found to biodegrade by 3.2% in 12 days.
• The MPS foam cups biodegraded by 4.24% in 24 days. However, there are many differences between lab condition and landfill condition. Is the biodegradation rate in a landfill similar to the rate in a lab test? Comparison of the rate of degradation of disposable cups and lids made from modified polystyrene with rate of degradation with normal 100% polystyrene cups when placed in municipal waste cells capped for methane production, the questions to be addressed were:
1) What is the rate of degradation of polystyrene in a managed landfill?

50
2) Is the rate of degradation affected by the degree of moisture in the waste cell that the sample is placed in?
3) What are the organisms that are associated with the degradation of the sample?
4) Is the rate of biodegradability similar between landfill conditions and lab conditions which follow the standard test ASTM D5511?
5) Does the biodegradation rate increase following time? Alternatively, how long until modified polystyrene is degraded completely?
3.2.2 Design of experiments
To evaluate biodegradability of polystyrene, the samples were tested in different test conditions including in landfill (see chapter 4); in lab scale (see chapter 5); and with garden soil (see chapter 6). The research project also isolated bacteria that can potentially biodegrade polystyrene and examined biodegradability of polystyrene with these isolated bacteria in laboratory conditions (see chapter 7). To give more understanding of the microbial community inside the managed landfill and to identify the isolated bacteria, next-generation sequencing technique and bioinformatics analysis were applied (see chapter 8).
3.2.3 Biodegradation studies
3.2.3.1 Visual observations
Visual observations to evaluate the macroscopic changes on the surface structure of the biodegraded polymer can be used for an initial estimation of biodegradation. In this project, after being taken out of the test sites (landfill and laboratory test), these samples were visually examined to evaluate macroscopic changes in the surface structure of the test samples. These changes included roughening of the surface, creation of holes and cracks, changes in colour, and a presence of microbial cells on the surface of the samples. Then, the presence of the carbohydrate (starch) in the samples was investigated by treating the sample with an iodine solution.
3.2.3.2 Determination of weight loss
Determination of residual polymer for the estimation of biodegradation of plastics is a frequently used method, and it has been used in many previous studies for biodegradation of polystyrene materials (Ali & Ghaffar 2017;

51
Asmita et al., 2015; Kukut et al., 2013; Mohan et al., 2016; Mor & Silvan, 2008; Naz et al., 2013; Nikolic et al., 2014; Nikolic et al., 2013; Shimpi et al., 2012; Yang et al., 2015b). The samples after removal from landfill or laboratory test were rinsed with distilled water to remove attached soil or sludge and biomass, and then dried to constant weight at low temperature (e.g. room temperature). Then, the unchanged final weight was recorded. The percentage of biodegradation was to be calculated based on the following formula:
Biodegradation=100 (m0 - mx)/m0
Where: mo is the sample mass before test;
mx is the sample mass after test.
3.2.3.3 Measurement of gas evolution
Measurement of volume of evolved gas during the test time of polymer biodegradation has also been purported to be a useful method. The evolved gas of CO2/CH4 is measured in the anaerobic condition, whereas CO2 is recorded in the aerobic condition. Carbon dioxide evolution is the method most often used to measure biodegradation (Kundu et al., 2014, Pushpadass et al., 2014). Evolved gas in lab test condition was collected in dedicated gas bags and measured by 50 mL syringes via three-way valves. The measurement of gas was described in chapter 5.
3.2.3.4 Field emission Scanning Electron Microscopy
To obtain information about the degradation mechanism, Field emission scanning electron microscopy was applied. It is a more sophisticated observation than visual examination and has been used by many researchers for examination of degradation of polystyrene (Adamcova et al., 2018; Ali & Ghaffa, 2017; Atiq et al., 2010; Kundu et al., 2014; Mohan et al., 2016; Naz et al., 2013; Nikolic et al., 2014; Oliveira et al., 2010; Pushpadass et al., 2010; Shimpi et al., 2012; Yang et al., 2015b). The morphology of the samples was observed with a Scanning electron microscope, (ZEISS SIGMA VP Field Emission Scanning Electron Microscopes with Bruker light element SSD EDS detector- USA) to find

52
changes on the surface of the samples, and bacterial growth regarding degradation. After being taken out from the landfill and laboratory tests, the foam cups and lids were repeatedly rinsed with distilled water, and then were dried at 35oC and evaluated for evidence of biodegradation. Samples were fractured, and the fractured surfaces were vacuum-coated with gold (SPI Module™ Sputter Coater) for two minutes under Argon atmosphere and then examined by FESEM (Fig. 3.2). The scan was carried out at an acceleration voltage of 5kV to 10kV. The obtained results were compared with the control samples without treatment in the landfill. The analysing process was done at Electron Microscope and X-Ray Unit (EMX), the University of Newcastle.

53
Figure 3.2 FESEM analytical processes
Source: Author

54
3.2.3.5 Fourier Transform Infrared Spectroscopy
FTIR is an extremely useful technique to examine changes in chemical properties. FTIR covers a wide range of chemical applications, especially for polymers and organic compounds. It measures absorbed light at each wavelength of the sample. When IR radiation is passed through a sample, some radiation is absorbed by the sample and some radiation is transmitted. A detector records the transmitted signal as a spectrum representing a molecular ‘fingerprint’ of the sample. The possible changes in chemical properties of test samples are used to compare to control samples. This technique was commonly used in previous studies on polystyrene degradation (Ali & Ghaffa, 2017; Atiq et al., 2010; Kukut et al., 2013; Kundu et al., 2014; Mohan et al., 2016; Nikolic et al., 2014; Pushpadass et al., 2010; Sekhar et al., 2016; Yang et al., 2015a). FTIR spectrometer (PerkinElmer UATR Two model- USA) with the diamond/ZnSe crystal was used to study functional groups attached at the time of surface modification (Fig. 3.3). After being taken out from the landfill and laboratory tests, the foam cups and lids were repeatedly rinsed with distilled water, and then were dried at 35oC and evaluated for evidence of biodegradation. FTIR spectra were recorded across the frequency range 4000-450 cm-1. The results obtained for the degraded test samples were compared with the control non-degraded sample. It was expected to find changes in intensities and the formation of new peaks in different regions of spectra. These analyses were carried out in the Chemistry Laboratory, the University of Newcastle.

55
Figure 3.3 FTIR spectrometer systems used to analyse the polystyrene test samples. Source: Author
3.2.3.6 Gel Permeation Chromatography
Gel permeation chromatography is often used to measure average molecular weight, and the broadening of the molecular weight distribution of polymers. The possible changes of molecular weight of test samples compared to control samples provide initial evidence of the degradation of a polymer. It is expected that biodegradation will be revealed as a decrease of molecular weight after treatment. This technique was used in some previous research on polystyrene biodegradation (Kundu et al., 2014; Kukut et al., 2013; Sadrieva et al., 2013; Yang et al., 2015b). Briefly, ten milligrams of the polystyrene sample was dissolved in 5 mL of Tetrahydrofuran (THF) and shaken for several hours until it was dissolved completely. The liquid was filtered through a syringe filter, Ø= 0.45 µm for weight analysis. Molecular weights were determined by gel permeation chromatography (GPC) instrument, a Shimadzu LC-20AD HPLC instrument equipped with an LC-20 AD pump and a SIL-20A/20AC injector operated with a SIL-20A auto-sampler using a Shim-pack GPC-80M 8 mm x 30 cm column (Shimadzu) and SPD-20A RID detector, with Tetrahydrofuran as the eluent. Molecular weights were measured against a series of polystyrene standards ranging from 10,000 to 1,000,000 kDa.

56
Figure 3.4 Gel Permeation Chromatography system used to analyse the polystyrene test samples. Source: Author

57
3.2.3.7 Nuclear Magnetic Resonance spectroscopy
Nuclear magnetic resonance (NMR) is a phenomenon that nuclei in a magnetic field can behave like a magnet; absorb and re-emit electromagnetic radiation because of their charge and spin. NMR spectroscopy operates by applying a magnetic field to nuclei and then measuring the amount of energy necessary to put various nuclei in resonance. This energy depends on the strength of the magnetic field and the magnetic properties of the isotope of the atoms. Nuclei in different electronic environments (shielded or unshielded) require a different amount of energy to bring them into resonance. An NMR spectrum provides a signal or peak representing the energy necessary to bring each nucleus into resonance. The difference of peak height between test and control samples provides evidence of the degradation of test samples. We expect that biodegradation will also reveal changes in chemical structure of polystyrene by formation of new peaks. Some researchers used this technique for investigation of polystyrene degradation (Kukut et al., 2013; Mohan et al., 2016; Pushpadass et al., 2010; Schlemmer et al., 2009; Sekhar et al., 2016). In this research, it was supposed that the biodegradation could alter samples by forming new chemical compounds or functional groups and these changes can be detected by nuclear magnetic resonance spectroscopy (NMR). 1H NMR spectroscopy was carried out at 400 MHz (A Bruker BioSpin AVANCE III 400MHz with sample changer - SampleXpress, 60 positions) (Fig. 3.5). The test samples were dissolved in deuterated chloroform to obtain a concentration of 0.01 g/mL and filtrated through Syringe filters Puradisc™ PVDF (Pore Size: 0.45µm, Diameter: 13mm). The solution was filled up to 5 cm in NMR tubes (Wilmad® NMR tubes 5 mm diam., Sigma-Aldrich). Both control and degradation samples were studied using 1H NMR spectroscopy with 16 spins. The software of Topspin, version 3.5 analysed test results. These tests were done at the Analytical and Biomolecular Research Facility (ABRF), the University of Newcastle.

58
Figure 3.5 Nuclear Magnetic Resonance spectroscopy system used to analyse the polystyrene samples. Source: Author
3.2.3.8 Gas Chromatography-Mass Spectrometry
The Gas Chromatography/Mass Spectrometry is one of the most accurate tools for analysing environmental samples. The instrument will separate chemical mixtures (the GC component) into individual substances when heated. Then, the heated gases are carried through a column with an inert gas (such as helium) to the MS component to identify the components at a molecular level. Mass spectrometry identifies compounds by the mass of the analytic molecule base on a library of known mass spectra covering several thousand compounds. This analytical method was used in some previous research on polystyrene degradation (Kundu et al., 2014; Yang et at., 2015b). In this project, the analysis was conducted at the Analytical and Biomolecular Research Facility (ABRF), the University of Newcastle. It is a modern GC-MS system with Triple Quadrupole MS, an injection using an Autosampler, and a headspace sampler (Fig. 3.6).

59
It was reported that microorganisms could degrade polystyrene waste into intermediate compounds or volatile organic compounds. These by-products can release to the ambient environment. In this project, the liquid phases from experiment in chapter 7 (using isolated bacteria to degrade TFMPS) were analysed by GC-MS technique to find mediated compounds of the degradation. Briefly, ten millilitres of culture broth (see experiment 4) was transferred to a 15mL vial. Then, one millilitre of diethyl ether was added to the vial. The vial was shaken well in 3 minutes and left for deposit in 2 minutes. The liquid in the top phase of the vial was then collected to 2 mL autosampler vial for GC-MS analysis.
Figure 3.6 GC-MS system used to analyse the polystyrene test samples. Source: Author
The GC-MS analytical parameters were summarized as follow:
Chromatographic parameters
• Column: HP-5 MS (30 m x 250µm x 0.25 μm)
• Injection Mode: Split
• Split Ratio: 12.5:1

60
• Carrier Gas: Helium
• Flow Control Mode: Linear Velocity
• Average Velocity: 36.796 cm/sec
• Pressure: 8.8085 PSi
• Column Flow: 1.00 mL/min
• Total Flow: 15.5 mL/min
• Total Program Time: 15.00 min
• Column Oven Temp. : Rate (ºC /min) Temperature (ºC) Hold time (min)
70.0 0.00
10.00 160.0 1.00
25.00 280.0 1.20
Mass Spectrometry parameters
• Ion Source Temp.: 200 ºC
• Interface Temp.: 230 ºC
• Ionization Mode: EI
• Event Time: 0.20 sec
• Mode: SIM
• m/z: 104,103 and 78
• Start Time: 1.00 min
• End Time: 5.00 min
3.2.4 Next generation sequencing analysis
To have a comprehensive understanding of the microbial community in environmental samples (landfill samples, leachate) and their correlation, Next -Generation sequencing was applied based on 16S rDNA sequence diversity.

61
The genomic DNAs of the bacteria strains were extracted by the PowerSoil® DNA Isolation Kit (MO BIO). The V3-V4 region of 16S rDNA was amplified using primers 341F-(5′-CCTACGGGNGGCWGCAG-3′) and 805R (5′-GACTACHVGGGTATCTAATCC-3′) and an Illumina MiSeq next-generation sequencer. The sequencing was carried out by the Hawkesbury Institute for the Environment (Western Sydney University, Australia). The details of this analysis are presented in chapter 8.

62
Chapter 4
EVALUATION OF BIODEGRADABILITY OF POLYSTYRENE MATERIALS IN A MANAGED LANDFILL
4.1 Introduction
It is widely accepted that polystyrene is remarkably stable and will likely exist for hundreds of years in the environment. Otake and colleagues reported that a sheet of polystyrene buried in soil for 32 years had no sign of degradation (Otake et al., 1995). Kaplan and colleagues reported that degradation of polystyrene in cultivated soils containing a wide range of fungi, microbes and invertebrates was less than 1% after 90 days with no significant increase in degradation after this time (Kaplan et al., 1979). Recently, as reviewed in this thesis, polystyrene can be degraded by bacteria in the environment, notwithstanding that the rate of degradation observed was low (see chapter 2, Table 2.4). In general, the biodegradation rate of PS was higher when PS was mixed or blended with additives such as starch of corn or potato, metal salts of carboxylic acids or dithiocarbamates based on cobalt (Co), iron (Fe), manganese (Mn) or nickel (Ni). Some trading companies have been producing and selling their biodegradation promoting additives with a claim that they help plastics be biodegraded in the environment with different terms such as “degradable,” “Oxo-degradable,” “Oxo-biodegradable,” “Oxo-green” and “landfill degradable”. Some additive producers are Add-X Biotech (Sweden), EKMDevelopments (Germany), EPI (Canada), Wells Plastics Ltd (British), Willow Ridge Plastics Inc. (US), d2w by Symphony International (England), ENSO Plastics (US). However, when applying the results of the previously published research to commercial digestion of polystyrene caution is needed: i) Most of those tests were carried out in laboratory conditions with good control of test parameters. In fact, there are primary and significantly different factors affecting the growth of target PS-degrading microorganisms such as pH, temperature, humidity, toxic, oxygen, or interaction between organisms in a real environment such as landfill or soil compared to a lab-based test.

63
These factors cannot be well controlled in such actual conditions thus affecting the rate of any potential polystyrene biodegradation. ii) The tests were made in lab conditions using pure polystyrene. Polystyrenes used commercially in industries like food, building, etc., contain many additives that can affect biodegradability of plastic. The use of antioxidants, flame -retardants, processing lubricants, and stabilizers in the manufacturing process also keeps thermoplastics from oxidation and biodegradation, contributing to the quality, life and usefulness of the resin. Recently, silver nanoparticles have been utilized as an antimicrobial agent in plastic food packaging materials (Arsanit, 2017). Nano silver damages bacterial cells by weakening cell membranes and destroying enzymes that transport cell nutrients, therefore prolonging the shelf life of food stuffs (Silvestre, Duraccio, & Cimmino, 2011). Consequently, degradation rate of commercial products may be lower than the rate in lab test. iii) Most polystyrene wastes end up in landfills; however, there has been no comprehensive study of biodegradation of polystyrene in a landfill so far. Previous studies were conducted in test conditions close to landfill conditions. However, inside a dump, a microbial community grows in an anaerobic condition that is very different from the compost or soil used in the literature. iv) The duration of the experiments was short; typically it lasted from one month to six months. Such short test times are not comparable to the running time of a landfill that continues for several decades. Therefore, the research questions that were investigated in the work reported here were:
Could polystyrene be degraded by microbes in a landfill? And
Do the commercial biodegradation-promoting additives increase the rate of biodegradation of polystyrene?

64
4.2 Experimental procedure and materials
4.2.1 Test samples
In this experiment, three kinds of samples were used for evaluation of biodegradability in a landfill that including modified polystyrene foam cups (MPS), polystyrene foam cups (PS), and high impact polystyrene lids (HIPS). The detailed information of these test samples was presented in chapter 3.
4.2.2 Experimental procedure
Landfill site
The experiment was carried out at Summerhill Waste Management Centre, Wallsend city, New South Wales 2287, Australia (32°53'32.9"S 151°38'33.7"E; Fig.4.1). The Summerhill Waste Management Centre is a solid waste landfill managed by The City of Newcastle. The site is fully licensed by the NSW Environment Protection Authority to receive a wide range of putrescible and non-putrescible domestic solid waste. It is situated in the void of a massive old open cut mining area. This site has been designed as a managed landfill site from which evolving gas has been used for electricity production under the supervision of LMS Energy Pty Ltd. Work health and safety approvals were obtained for these experiments. Leachate is collected into a holding dam at the lowest edge of the landfill.
Figure 4.1 Map of location of test site marked with a red point. Source: Google

65
Preparation of test samples
At the test site shown in the Fig. 4.1, a hole (500 mm diameter) was drilled deep into the landfill to a depth of 11 meters by a third party (Goodman Drilling & Piling Pty Ltd). After being drilled, six 12-meter PVC pipes (110 mm diameter) were inserted into the holes (Fig. 4.2). Each of these pipes had been perforated with 10mm holes for a distance of approximately 5 meters from the bottom to allow for movement of the leachate into the pipes. Then, five housing cases containing the test samples were lowered on wire ropes into these piles to a depth of near 11 metres intending to be thus submerged in the leachate. The housing cases are PVC pipes (90 mm diameter, 750 mm in length). The body of the housing cases had many holes so the leachate could freely move in or out and contact the test samples (Fig. 4.3). After placing the housing cases into the pipes, these pipes were closed by screw caps. The big hole was sealed from the atmosphere by gravel layer (in the bottom) and 2 meters of clay layer on the top to prevent gas releasing from inside of landfill to the ambient environment (Fig. 4.4).
Figure 4.2 Diagram of location of samples in the landfill test seen from above
Note: Number 1-5 represents test pipe containing housing cases; Level TROLL 700 data logger was installed in pipe number 6.
Each of the 5 pipes was filled with the same set of samples so that one pipe could be sampled for a particular time period as shown in Table 4.1.
Hole Ø=500mm
PVC pipes Ø=110mm
Clay 1 2
3
4
5 6

66
Figure 4.3 Housing cases used for the test in the landfill
Figure 4.4 Longitudinal section of a sample in the landfill test (left) and diagram of all test samples after being installed into the landfill (right)
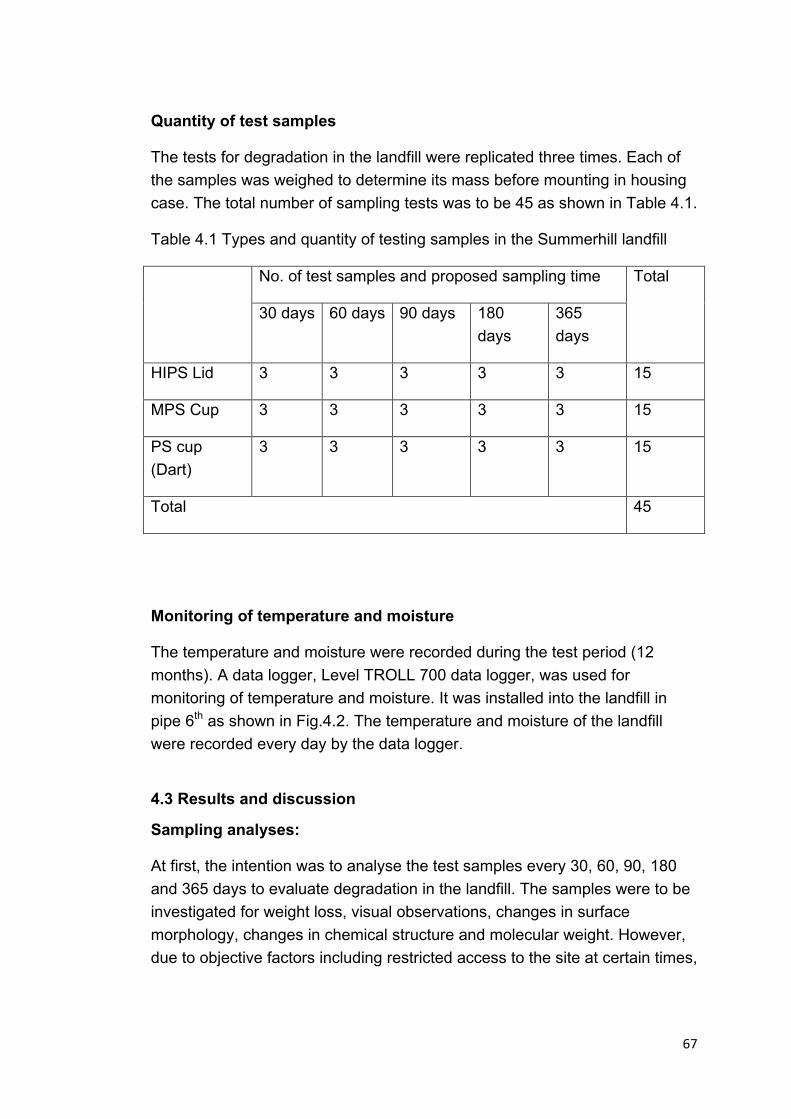
67
Quantity of test samples
The tests for degradation in the landfill were replicated three times. Each of the samples was weighed to determine its mass before mounting in housing case. The total number of sampling tests was to be 45 as shown in Table 4.1.
Table 4.1 Types and quantity of testing samples in the Summerhill landfill
No. of test samples and proposed sampling time Total
30 days 60 days 90 days 180 days
365 days
HIPS Lid 3 3 3 3 3 15
MPS Cup 3 3 3 3 3 15
PS cup (Dart)
3 3 3 3 3 15
Total 45
Monitoring of temperature and moisture
The temperature and moisture were recorded during the test period (12 months). A data logger, Level TROLL 700 data logger, was used for monitoring of temperature and moisture. It was installed into the landfill in pipe 6th as shown in Fig.4.2. The temperature and moisture of the landfill were recorded every day by the data logger.
4.3 Results and discussion
Sampling analyses:
At first, the intention was to analyse the test samples every 30, 60, 90, 180 and 365 days to evaluate degradation in the landfill. The samples were to be investigated for weight loss, visual observations, changes in surface morphology, changes in chemical structure and molecular weight. However, due to objective factors including restricted access to the site at certain times,

68
the test samples were analysed at 76, 165, 257 and 356 days. The detail of analysing methods used is described in chapter 3.
4.3.1 Monitoring of temperature and water level.
During the period of 12- month test, the temperature inside the landfill at the test position was relatively constant. The value of the temperature was auto recorded every hour and shown in figure 4.5. It revealed a fluctuation from 46 to 52 oC even though outside temperature had an appreciable change between seasons from 3 to 47 oC (http://www.weatherzone.com.au//nsw/hunter/wallsend). The stability of the temperature was expected as the test samples were installed inside the landfill at the second stage of anaerobic decomposition. In this stage, thermophilic microorganisms were very active and produced much heat. Potent activity of microorganisms during this period may have been beneficial for decomposition of the polystyrene. However, the level of leachate inside the landfill underwent a considerable change during the test period. Unexpectedly the test samples were only submerged in the leachate in some initial months of the test (Fig. 4.6). In the Summerhill landfill, leachate drains to a storage pool for discharge following further treatment. For operational reasons the proposal initially discussed of pumping the leachate to the top of the landfill in the area of the experiment, but was not able to be realised. As the result of poor recycling of leachate, the samples were not in contact with the leachate for the later part of the field test. Some leachate was initially trapped inside the cups following the first immersion because these cups were always kept upright when being installed.

69
Figure 4.5 Temperature (oC) data from inside the Summerhill landfill at 11m depth from Nov 2015 to Oct 2016
Figure 4.6 Level of leachate data from inside the Summerhill landfill at 11 m depth from Nov 2015 to Oct 2016
4.3.2 Visual observation
There was no significant change in the colour of the lid samples during the test period (Fig. 4.7), however compared to the control sample, the MPS and PS test samples had some dark spots caused by dry sludge. These dark

70
spots were washed out easily by distilled water. All the test samples still held their original shape, no cracks or holes on their body. In both types of cup samples (MPS and PS), colour outside of test cups had changed from white to yellowish through contact with the leachate in the landfill. However, the change of colour was not different between cups in different period of test times due to the drainage of the landfill. Inside the cups, a thin dark layer was attached by combining of sludge and or solid particles containing in the leachate trapped in these cups (Fig. 4.8). The dark colour was increased following the test time. All the test cups kept their original shape and had no holes or cracks on their body. There was no significant difference in shape and surface of the test cups of PS compared to MPS as observed by naked eye.
These changes on colour of the test samples were estimated on table 4.2.
Table 4.2 Estimation of colour change of the test samples
Samples
Test time (days) 76 165 257 356
MPS * * * * * * * * * PS * * * * * * * * * HIPS - - - -
Note: The more stars, the darker the colour; “-”: No change

71
Figure 4.7 HIPS lids after incubation inside the landfill for 356 days (left) and 76 days (right)

72
Figure 4.8 MPS cups after incubation inside the landfill. Photo a) & c): inside outside of the cup after 356 days; photo b) & d): inside and outside of the cup after 76 days
a) b)
c) d)

73
To investigate the existence of additive (starch) in the test cups of modified polystyrene, these cups were dyed with iodine solution. The results showed that the starch in the test cups was lost entirely after 76days buried in the landfill while it was clearly visible in the control sample (by turning a dark-blue/black in iodine solution) (Fig.4.9). The additive also wholly disappeared in samples from the other tests of 165 days, 257 days, and 356 days. The loss of the additive may derive from decomposition by microorganisms in the landfill. Starch is a carbohydrate source that can be readily degraded by microorganisms.
Figure 4.9 MPS cups stained with iodine solution: test sample after 76 days inside the Summerhill landfill (left) control sample (right)
4.3.3 Surface imaging of test samples
Changes on the surface of the samples and adherence of microbes on the surface of the test samples were observed by FESEM. In general, the FESEM micrographs showed that the foam cups (MPS & PS) without treatment had smooth and homogeneous surfaces, whereas the samples being buried in the landfill showed the presence of microorganisms on the scabrous surface and formation of pits and holes indicating slight degradation

74
(Fig. 4.10). The bead boundaries of PS foam of the test samples seemed to be looser than those of the control sample (Fig. 4.11). For samples of HIPS lids, compared to control sample (blank sample without installing into the landfill), test samples had a slight erosion on their surfaces (Fig. 4.12). Perhaps the high molecular weight and hydrophobic property of HIPS made it less affected by microorganisms. These changes on surface of the test samples are summarised in Table 4.3.
Table 4.3 Estimation of surface change of the test samples
Samples
Test times (days) 76 165 257 356
MPS scabrous scabrous scabrous scabrous PS scabrous scabrous scabrous scabrous HIPS slight
scabrous slight
scabrous slight
scabrous slight
scabrous
From table 4.3, there were two conclusions could be drawn from FESEM analysis. The first, there was no significant difference of test samples (MPS, PS, HIPS) in different test times of 76 days, 165 days, 257 days, and 356 days. In other words, the degradation of these samples was not dependent on the length of time the samples were in the landfill, supporting the concept that the samples were only immersed in fluid in the landfill for 8 weeks before the area dried out. In addition, in early stage of degradation, a thin film of suspended solid and microorganism was formed and covered the surfaces of foam cups. Gradually, this film developed thicker and may prevented microorganisms contacting with polystyrene. In the unexpectedly dry conditions of the landfill, the film was not mechanically impacted (such as leachate flow) so it was not peel off. Secondly, the changes observed on MPS and PS samples were not remarkably different even though MPS contained additive (starch). It may be that amount of additive was extreme low (0.5%w) and not large enough to made an attraction of microorganisms. Moreover, this additive was electrostatically coated on the surface of pre-expanded polystyrene beads. Therefore, there was only very small volume of additive presented on surface of MPS cups.

75
Figure 4.10 FESEM micrographs of modified polystyrene foam cups (10,000X). Control samples (top), and the test sample after being buried in the landfill for 356 days (bottom)

76
Figure 4.11 FESEM micrographs of modified polystyrene foam cups (100X): sample after being buried in the landfill for 356 days (bottom) compared to control sample (top)
Note: The expanded junctions between individual polystyrene beads as marked by red lines.

77
Figure 4.12 FESEM micrographs of HIPS lids (10,000X): control sample (top) and the test sample after being buried in the landfill for 356 days (bottom)

78
In general, field emission scanning electron micrographs showed that all test samples had signs of degradation in the landfill by changes in their morphology at a microscopic level. It also demonstrated the adherence of bacterial cells on the surface of the samples. The changes in morphology indicated that the starch was degraded by microorganisms in the landfill. The loss of starch was confirmed by observation when testing with iodine solution in section 4.3.2. The obtained results were quite similar to results of various published research (Adamcova et al., 2018; Ali & Ghaffa, 2017; Atiq et al., 2010; Kundu et al., 2014; Mohan et al., 2016; Naz et al., 2013; Nikolic et al., 2014; Oliveira et al., 2010; Pushpadass et al., 2010; Shimpi et al., 2012;Yang et al., 2015b). By using SEM, Ali & Ghaffar (2017) stated that film of polystyrene-starch blend had a rough surface and many holes throughout the film after soil burial test, indicating the occurrence of degradation, which enables the removal of starch portions by microorganisms. In another report on biodegradation of HIPS by Bacillus spp. and Pseudomonas spp., Mohan and colleague (2016) also found that film of HIPS without any microbial treatment had a plain and smooth surface, the samples that were treated showed that organisms were found colonised near and around the incisions and formation of pits and holes indicating degradation. Using SEM to investigate biodegradation of polystyrene by strain YT2 isolated from gut of mealworm, Yang et al., 2015b recorded that biofilm of strain YT2 generated visible surface deterioration, with the formation of pits and cavities on the surface of the PS film while the surface of the control sample was smooth and did not have any defects.
4.3.4 Fourier Transform Infrared Spectroscopy
The treated samples of foam cups and HIPS lids in the landfill were analysed to find possible changes in the chemical structure of polystyrene by using FTIR spectroscopy. The results showed changes in peak intensities in different regions of spectra and the formation of new peaks suggesting some digestive changes in the structure of polystyrene (Fig. 4.13, 4.14, & 4.15). In general, the FTIR spectra of all three types of test samples showed that there were changes in the chemical structure of polystyrene. However, these changes were only found in samples after 356 days in the landfill and hard to find in the other samples of 76 days, 165 days, and 257 days (Table 4.4).
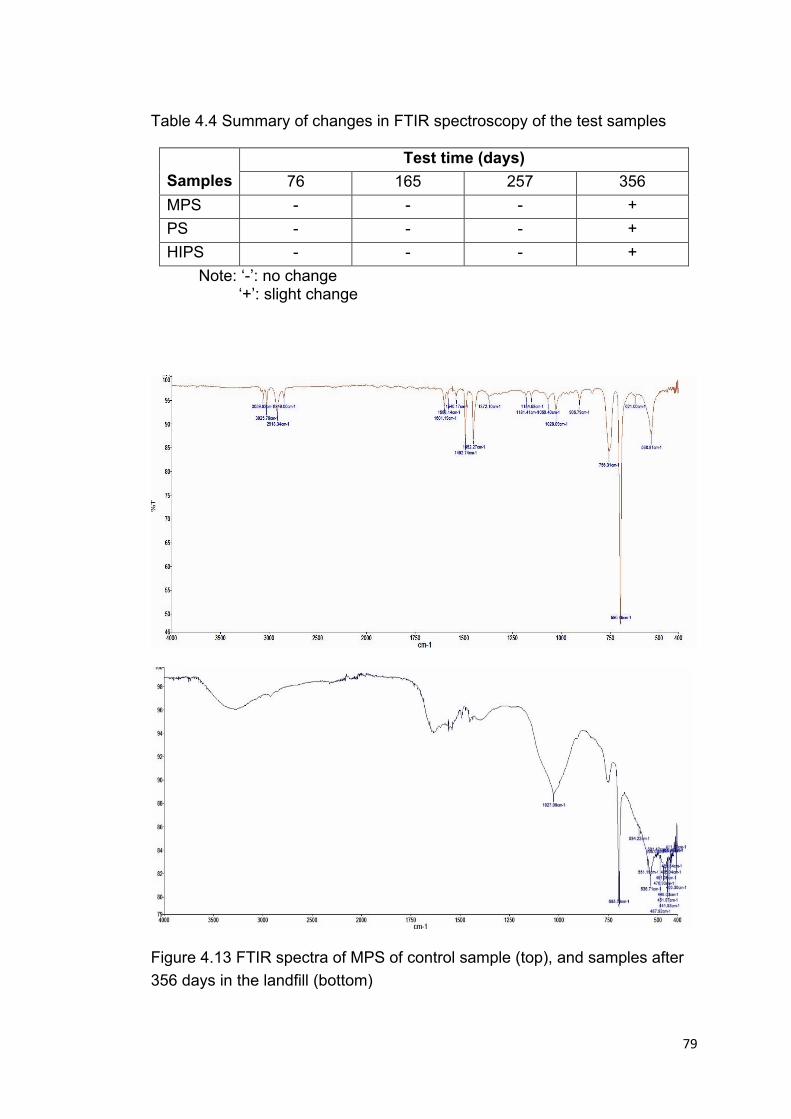
79
Table 4.4 Summary of changes in FTIR spectroscopy of the test samples
Samples
Test time (days) 76 165 257 356
MPS - - - + PS - - - + HIPS - - - +
Note: ‘-’: no change ‘+’: slight change
Figure 4.13 FTIR spectra of MPS of control sample (top), and samples after 356 days in the landfill (bottom)

80
Figure 4.14 FTIR spectra of PS of control sample (top), and samples after 356 days in the landfill (bottom)

81
Figure 4.15 FTIR spectra of HIPS of control sample (top), and samples after 356 days in the landfill (bottom)
In control samples of MPS, PS, HIPS, the position of major peaks in FTIR spectra was similar. The peaks at 2918 cm-1 and 2849 cm-1 correspond to CH2 asymmetric and symmetric stretching. The peaks around at 3059 cm-1 and 3025 cm-1 correspond to aromatic C–H stretching and the peak at 755 cm-1 corresponds to out-of-plane C–H bending mode of the aromatic ring. Also, the peak around at 695 cm-1 corresponds to ring-bending vibration. The other peaks found at 1601 cm-1, 1492 cm-1, 1452 cm-1, 1028 cm-1 correspond

82
to C=C stretching/vibration of aromatic rings (Ali and Ghaffar, 2017; Sekhar et al., 2016).
After 356 days exposure of samples in the landfill, FTIR spectra of PS and HIPS had slight changes in peak intensity at the major peaks (Fig. 4.14 & 4.15). In the MPS sample, a similar change was found but of higher intensity compared to PS and HIPS. The changes in FTIR spectra demonstrated that the chemical structure of polystyrene of test samples had changed. Some previous research investigating biodegradation of different types of polystyrene material also reported that there were changes in FTIR spectra indicating the degradation (Ali & Ghaffa, 2017; Atiq et al., 2010; Sekhar et al., 2016; Kukut et al., 2013; Kundu et al., 2014; Mohan et al., 2016; Nikolic et al., 2014; Pushpadass et al., 2010; Yang et al., 2015b).
4.3.5 Gel Permeation Chromatography
Possible biodegradation of the treated foam cups (MPS and PS) in the landfill could lead to changes in their molecular weight that could be detected by the GPC technique. The results of GPC analyses are presented in table 4.5. There was a variation of weight-average molecular weight (Mw) and number-average molecular weight (Mn) of both types of the test sample in different times of the test and a decrease in a polydispersity (Mw/Mn) after treatment. The increase in molecular weight might be attributed to chain cleavage and further crosslinking (Pticek et al., 2007; Tsuji and Ikada, 1998) and leading to the decrease in a polydispersity. The smaller the polydispersity index is, the narrower the molecular weight is. In other words, if a polymer has a narrow range of polymer chain lengths, the polydispersity is low. However, compared to the control samples (0 days), in both MPS and PS, a reduction in weight-average molecular weight (Mw) and number-average molecular weight (Mn) was observed after 356 days inside the landfill indicated that polymer chains of these samples were varied considerably.

83
Table 4.5 GPC analysis of foam cups (MPS and PS) treated in the Summerhill landfill for different periods of time
Sample Test time (days)
Number average molecular weight Mn (Daltons)
Weight average molecular weight Mw (Daltons)
Polydispersity (Mw/Mn)
MPS
0 136704 393835 2.88093 76 163809 430656 2.62901 165 142391 370604 2.60272 257 147376 361629 2.45379 356 129535 340014 2.62488
PS
0 158888 496546 3.12512 76 124661 393336 3.15525 165 151833 396319 2.61023 257 141888 399674 2.81684 356 138225 369152 2.67066
The decrease of Mn and Mw of test samples after 356 days indicated that the polystyrene could be degraded. The process of depolymerisation by microorganisms caused reduction of average molecular weight of the polymer. Kundu et al., 2014 also reported that Mn and Mw of polystyrene material continuously decreased during 28 days of in vitro biodegradation test with Rhodococcus pyridinivorans NT2. A similar result of a decrease of average molecular weight of polystyrene when treating with strain YT2 isolated from mealworm also were recorded by Yang and colleague (Yang et al., 2015b).
4.3.6 Nuclear Magnetic Resonance spectroscopy
In the 1H NMR spectrum control using deuterated chloroform as the internal reference, the aliphatic and aromatic protons appeared in 1–2 ppm and 6–7 ppm signal region, respectively (Fig. 4.16). However, a significant increase in the number of peaks presented in the area between 3 and 6 ppm of the tested sample of 356 days (MPS and PS). Also, new peaks were found in signal region representing for aliphatic and aromatic of polystyrene chain. The increase in new peaks is an indication that the chemical structure of polystyrene might be changed, and formed new chemical bonds or functional

84
groups. Also, there was increase height of peak in signal region of 0.5 -2 ppm and 6-7 ppm.
Figure 4.16 1H NMR analysis of polystyrene foamed cups (MPS)
Note: The aliphatic and aromatic protons appear in the 1-2 ppm and 6-7 ppm signal region, respectively in the 1H NMR spectrum of control sample (a) and the test sample (b). The test sample showed significant increase in the number of peaks in signal regions between the aliphatic and aromatic signal regions, focusing signal region from 3 ppm to 6 ppm(c). In some previous studies on biodegradation of polystyrene materials using 1H NMR, the result showed changes in different regions of the spectra. Sekhar and colleague reported that Enterobacter sp. could degrade high-

85
impact polystyrene and create an increased number of peaks in the aliphatic and aromatic signal regions of 1H NMR spectra after 30 days of incubation (Sekhar et al., 2016). Mohan et al., described that the formation of a major peak between 3-4 ppm in 1H NMR spectrum when brominated High Impact Polystyrene (HIPS) was incubated with strains of Pseudomonas spp. and Bacillus spp. (Mohan et al., 2016).
4.3.7 Determination of weight loss
The final weight of all test samples had a slight increase comparing to their original weight. The increase in weight of these test cups (MPS and PS) is higher than test lids (HIPS). The change in weight of test samples in different test times shown in figure 4.17 was not statistically significant. The increase of weight of foam cup can be explained by attachment of small particles or biofilm of bacteria in the sludge of the landfill on the surface of the samples. Foam cups were made by expanded polystyrene containing many polystyrene beads. There are small openings between expanded polystyrene beads that dust particles or bacteria can easily attach (Fig 4.18). HIPS lids have a smooth surface, and hydrophobic characterise found by aromatic benzene rings and its high density that cause a difficulty to stick of dust particles or cell of bacteria. This led to a small mass increase of HIPS lids compared to the foam cups in the test.

86
Figure 4.17 Weight changed of the test samples in the landfill after different test times
Note: MPS_ Modified polystyrene cup; PS_ Polystyrene cup; HIPS_ High Impact polystyrene
Figure 4.18 Surface of MPS foam cup inside the landfill for 356 days after washing
0
0.5
1
1.5
2
2.5
3
3.5
4
76 days 165 days 257 days 356 days
Wei
ght (
g)
Change on weight of the test samples in the landfill
Before test(MPS)
After test (MPS)
Before Test (PS)
After test (PS)
Before test(HIPS)
After test (HIPS)

87
Determination of biodegradation rate of polystyrene based on weight loss is a popular method and was used in some previous research (Ali & Ghaffar 2017; Asmita et al., 2015; Kukut et al., 2013; Mohan et al., 2016; Naz et al., 2013; Nikolic et al., 2014; Nikolic et al., 2013; Shimpi et al., 2012; Yang et al., 2015b). However, in this particular case of the landfill test, determination of weight loss was not an appropriate method to find the rate of degradation of polystyrene material due to the increase in weight after the test. Maybe inside the landfill, high temperature, high content of suspended solids, and physical structure of expanded polystyrene foam were reasons that caused increase weight of the test samples. Also, the rinsing process after the test may also affect the weight change. If exceedingly high pressure water washing is used to remove solid particles attached on the surface, there is a possibility that the morphology of the sample surface might change and affect to further analyses (FESEM, FTIR, and NMR) whereas light rinse could not remove attached particle on the surface.
4.4 Conclusions
The results obtained in the landfill test showed signs of degradability of expanded polystyrene and high-impact polystyrene although the degradation was very slow. They showed some changes in the test sample including morphology, physical and chemical character. However, it was still uncertain that these changes were caused by microorganisms in a complicated environment such as a landfill that had many factors may also lead to these changes (e.g. chemicals, metal ions, high temperature, etc.). Also, the inability to collect any soluble intermediate compounds of the biodegradation process was also a drawback of this in situ landfill test. Therefore, to understand further the biodegradability of polystyrene in the landfill, a simulation test of landfill condition was carried out in the laboratory.

88
Chapter 5
EVALUATION OF BIODEGRADABILITY OF POLYSTYRENE MATERIALS IN LABORATORY CONDITIONS
5.1 Introduction
Polystyrene has been widely accepted as being very persistent in the environment. However, some published papers recently reported on the biodegradation by microorganisms, of polystyrene, especially modified polystyrene (see Table 2.4). It appears that polystyrene can be degraded in different environments and that modified polystyrene could be a promising alternative solution for the need of polystyrene material in future. In an internal research report (not yet published) carried out by Victoria University, Melbourne, Australia, it was shown that modified polystyrene could be degraded impressively in the presence of compost. Specifically, the HIPS lids were found to biodegrade by 3.2% in 12 days, the foam cups biodegraded by 4.24% in 24 days, while the Dart® foam cups did not biodegrade to any significant extent (Cran, 2011). The research was done following the method of the standard ASTM D5511 and biodegradation rate was calculated by measurement of evolved gas. Chapter 4 reports on the polystyrene degradation found in the earlier experiment of evaluation of polystyrene biodegradability in the landfill by the thesis writer. However, the research in the landfill could not determine the rate of degradation. Moreover, the results could not absolutely state that the degradation was microbial biodegradation because there were the many other environmental factors or chemical compounds in the landfill that could affect degradation. In essence, biodegradation of polymers occurs when microbes convert the polymers into small molecules such as carbon dioxide, water, and methane by their enzymes. The pathways and rate of biodegradation depend on polymer materials, the ambient conditions, and microbial community that are present and active.

89
Based on the above arguments, an experiment was carried out in the laboratory to evaluate the biodegradability of the same polystyrene materials that had been previously tested in the landfill leachate. It was proposed that these polystyrene materials could be degraded by microorganisms existing in leachate collected from the landfill and that the biodegradation could be determined by evolved gas; by measurement of mass loss; changes in chemical structure of polystyrene; and physical changes that could be observed by naked eye and FESEM.
5.2 Materials and methods
Typically, in an anaerobic condition, carbon sources are metabolised by anaerobic microbes and produce biogas (including the main component of methane and carbon dioxide and a minor trace gas as hydrosulphide, nitrogen) and increase the biomass of microbes. The rate of metabolism can be defined via measurement of the volume of producing gas. The components of biogas can be identified by gas chromatography. In this experiment, the Dart® foam cups (PS), modified polystyrene foam cups (MPS), and high-impact polystyrene lids (HIPS) were used for the investigation of biodegradation. Cardboard was used as positive control. Leachate was collected from the Summerhill landfill and stored in two- litre bottles. The evolved gas of biodegradation was collected and contained in dedicated bags. The tests were carried out at 46±0.5 oC which simulating conditions in the landfill and at room temperature (around 28 oC).
5.2.1 Test design
The test samples of foam cups and lids were cut into small pieces (around 20 x 70 mm). Five grams of each sample was added in a 250 ml conical flask containing 200ml the leachate being taken from the landfill. Amount of air in the top space of the conical flask was replaced by pure nitrogen gas, and the vial was sealed by a rubber bung to create anaerobic conditions (simulating landfill condition). The flask was placed in a water bath and kept at 46±0.5 oC during the time of the test. For negative control (blank samples), the sample preparation was similar to the process of treated samples, but the leachate was autoclaved at 121 oC for 15 minutes before use in the tests. In the positive control, polystyrene was replaced by 5g of cardboard. Also, the similar test (test samples and sample preparation) was done at room

90
temperature. Each of the tests was replicated three times. Quantities of test samples in laboratory condition are summarised in Table 5.1. The biogas generated by the degradation during the test was to be collected in gas sampling bags (multi-layer foil gas sampling bags _ Restek Corporation, U.S.) and measured by syringes that could be connected at three-way valves in the system (Fig. 5.1). The volume of gas was to be recorded at three-day intervals during the test time of 90 days or until no further gas evolved. The gas composition was to be analysed by a gas analyser (CP4900 Mini Gas Chromatograph) to define the percentage of methane and carbon dioxide. The biodegradability of polystyrene materials was investigated by comparing the control samples and treated samples.
Figure 5.1 Diagram of laboratory test (top) and a photo of lab test (bottom)

91
5.2.2 Calculation of the percent of biodegradation
The rate of biodegradation was intended to be calculated following the
standard method ASTM D5511 (www.astm.org).
% biodegradation = mean Cg (test)−meanCg (blank)Ci
x 100
Where:
Cg = amount of gaseous carbon produced, g, and
Ci = amount of carbon in test compound added, g.
One mmole of gas produced occupied 22.4 mL at standard temperature and
pressure (STP) that is equivalent to one mmole (12mg) of organic carbon
from the test sample.
Table 5.1 Quantities of test samples in the laboratory conditions
Temp. 46 oC Temp. 28 oC Total
HIPS Lid
Negative control
3
3
3
3
12
MPS Cup
Negative control
3
3
3
3
12
PS cup (Dart)
Negative control
3
3
3
3
12
Positive control 3 3 6
Total 42
The other methods used to evaluate the biodegradation in this experiment (weight loss, FESEM, FTIR, NMR) have been described in chapter 3.
5.3 Results and discussion
5.3.1 Gas measurement
After 90 days of this laboratory test, in both cases of 46 oC and 28 oC, there was no gas found in any of the gas sampling bags of treated samples of polystyrene (MPS, PS, HIPS). There was also no gas in all negative control samples. In positive controls, a little gas was trapped in gas sampling bags (around 2-3 mL on average).

92
In these experiments however, there was no gas found with the polystyrene made cups and lids, indicating that there were either no organisms in the leachate capable of digesting the plastic or that the concentration of active bacteria was too low. In negative controls, there was no decomposition because the sterilisation killed all microorganisms. In positive controls, evolved gas may come from degradation of cellulose in cardboard. Due to lacking oxygen, the decomposition happened at a slow rate and not much gas evolved. There were some earlier reports that microorganisms can degrade pure polystyrene and polystyrene blends in natural environments such as compost, activated sludge, and soil by measuring gas evolution. Sielicki et al., (1978), measured 14CO2 evolution to determine polystyrene biodegradation in soil. Similar research was conducted to evaluate the rate of polystyrene biodegradation in soil and activated sludge by measurement of 14CO2 (Kaplan et al., 1979). In 2010, Pushpadass and colleagues investigated biodegradation of starch–polystyrene loose-fill foams in a composting medium by measuring CO2 generation (Pushpadass et al 2010). Kundu et al. (2014) studied on biodegradation rate of the nanocomposites of polystyrene and CaSO4 nanorods graft by measuring the CO2 evolution using a microbial inoculum (Rhodococcus pyridinivorans NT2). In essence, the rate of polystyrene biodegradation was prolonged and depended on material and test conditions. However, there has been no report of polystyrene biodegradation in leachate environment or anaerobic condition so far. In my knowledge, there has been yet no research on polystyrene degradation in an anaerobic condition as landfill by measuring methane or carbon dioxide.
5.3.2 Visual observation
After 90 days soaked in the leachate, the test samples of PS and MPS changed their colour from the original white to light yellowish. The change of colour happened in both treated samples and negative control samples. However, HIPS samples still retained their original colour in both treated samples and control samples, most likely because they had the smooth surface and hydrophobic feature. There was no significant difference in shape and morphology surface of the treated samples compared to the control samples as detected by eye. Almost all of the cardboard in the positive controls was dissolved in the presence of landfill leachate.

93
In samples of MPS, when tested with iodine solution, the additive (starch) was lost in treated samples while it was still visible in the negative control sample (Fig. 5.2). The loss of the additive in this test was similar to the result in the landfill test (see chapter 4). In the landfill test, it was concluded that microorganisms consumed the starch, but other factors may have been involved. However, in the laboratory test with the leachate, the loss of starch in MPS was evidence that the microorganisms had consumed it. In the negative control samples, microorganisms were killed by sterilisation and there was no loss of blue iodine staining evident allowing the conclusion that microbial viability was necessary to degrade the starch. Similar degradation of starch by microorganisms with concomitant loss of starch blending or grafting with polystyrene has been reported in some recent studies (Ali and Ghaffar, 2017; Nikolic et al., 2013 & 2014; Pushpadass et al., 2010).

94
Figure 5.2 MPS samples treated with iodine solution after 90 days in the leachate (right) compared with control sample (left)
5.3.3 Field emission Scanning Electron Microscopy
For the samples of foam cups, there were changes on the surface of MPS and PS of treated samples. The FESEM micrographs showed that the negative control samples had an entirely smooth and homogeneous surface even though they had changes in their colour. However, in treated samples,

95
they showed the adherence of microorganisms on the scabrous surface and formation of pits and holes indicating degradation (Fig. 5.3 & Fig 5.4). Figure 5.3 FESEM micrographs at 10,000x magnification of polystyrene foam cups (PS) in the lab test after 90 days: negative control sample (left), treated sample (right) Figure 5.4 FESEM micrographs at 10,000x magnification of modified polystyrene foam cups (MPS) in the lab test after 90 days: negative control samples (left), treated sample (right)

96
Similar to foam cups, the lid samples had a significant change at the microscopic level. The FESEM micrographs showed a difference between the test and the negative control of HIPS sample after 90 days soaked in the leachate (Fig. 5.5). Figure 5.5 FESEM micrographs at 10,000x magnification of HIPS lid in the lab test after 90 days: control sample (left), treated sample (right) The results of FESEM of this experiment were quite similar to the results of the earlier test in the landfill that microorganisms degraded all test materials (PS, MPS, and HIPS). It was found that there was no change in negative control samples indicating that changes on the surface of these polystyrene samples were caused by degradation by microorganisms in the leachate and landfill and not from unknown factors of physics or chemistry. Once again, FESEM showed that it was a useful tool to analyse biodegradation of polystyrene at a microscopic level. This technique was also used by other laboratories (section 4.3.3, chapter 4).
5.3.4 Fourier Transform Infrared Spectroscopy
FTIR spectroscopy was used to find possible changes in the chemical structure of polystyrene by comparing treated samples and control samples. The FTIR is a useful and suitable tool to detect changes in the chemical structure of polymers. FTIR spectroscopy has been used in some previous
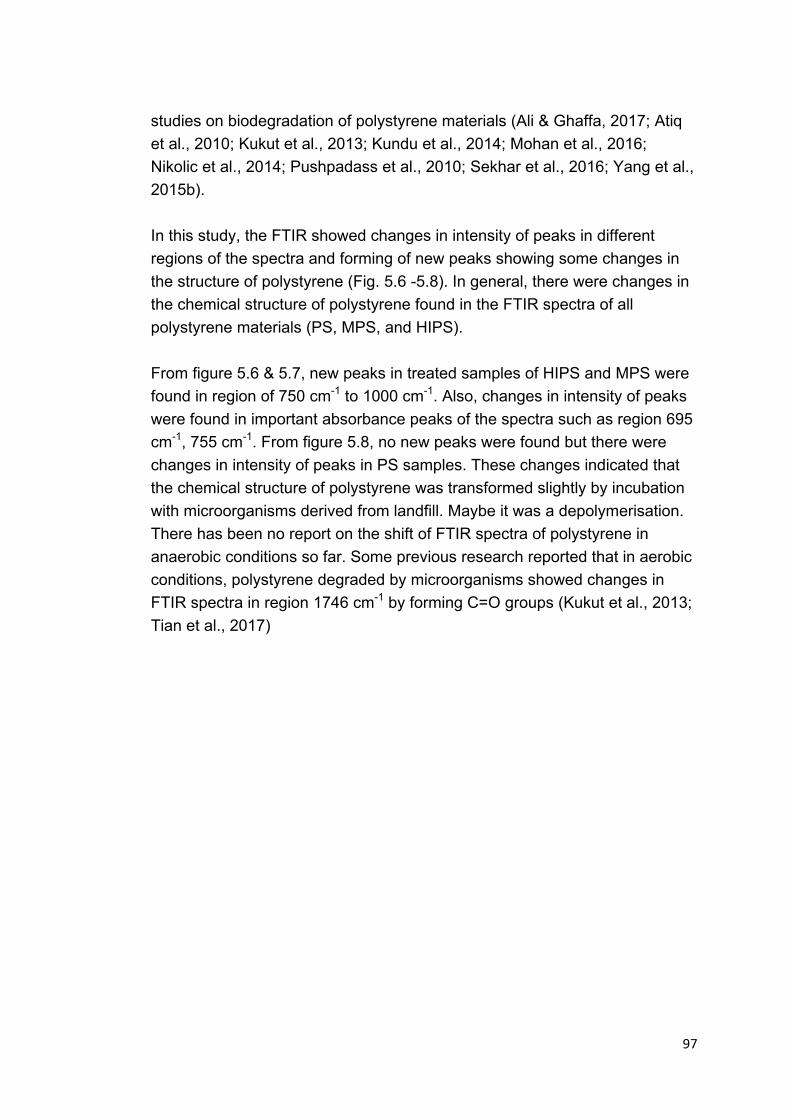
97
studies on biodegradation of polystyrene materials (Ali & Ghaffa, 2017; Atiq et al., 2010; Kukut et al., 2013; Kundu et al., 2014; Mohan et al., 2016; Nikolic et al., 2014; Pushpadass et al., 2010; Sekhar et al., 2016; Yang et al., 2015b). In this study, the FTIR showed changes in intensity of peaks in different regions of the spectra and forming of new peaks showing some changes in the structure of polystyrene (Fig. 5.6 -5.8). In general, there were changes in the chemical structure of polystyrene found in the FTIR spectra of all polystyrene materials (PS, MPS, and HIPS). From figure 5.6 & 5.7, new peaks in treated samples of HIPS and MPS were found in region of 750 cm-1 to 1000 cm-1. Also, changes in intensity of peaks were found in important absorbance peaks of the spectra such as region 695 cm-1, 755 cm-1. From figure 5.8, no new peaks were found but there were changes in intensity of peaks in PS samples. These changes indicated that the chemical structure of polystyrene was transformed slightly by incubation with microorganisms derived from landfill. Maybe it was a depolymerisation. There has been no report on the shift of FTIR spectra of polystyrene in anaerobic conditions so far. Some previous research reported that in aerobic conditions, polystyrene degraded by microorganisms showed changes in FTIR spectra in region 1746 cm-1 by forming C=O groups (Kukut et al., 2013; Tian et al., 2017)

98
Figure 5.6 FTIR spectra of HIPS. New peaks seen in treated sample have been circled in red and green

99
Figure 5.7 FTIR spectra of MPS. New peaks seen in the treated sample have been circled in red

100
Figure 5.8 FTIR spectra of PS. The top graph is control sample and the bottom graph is the treated sample
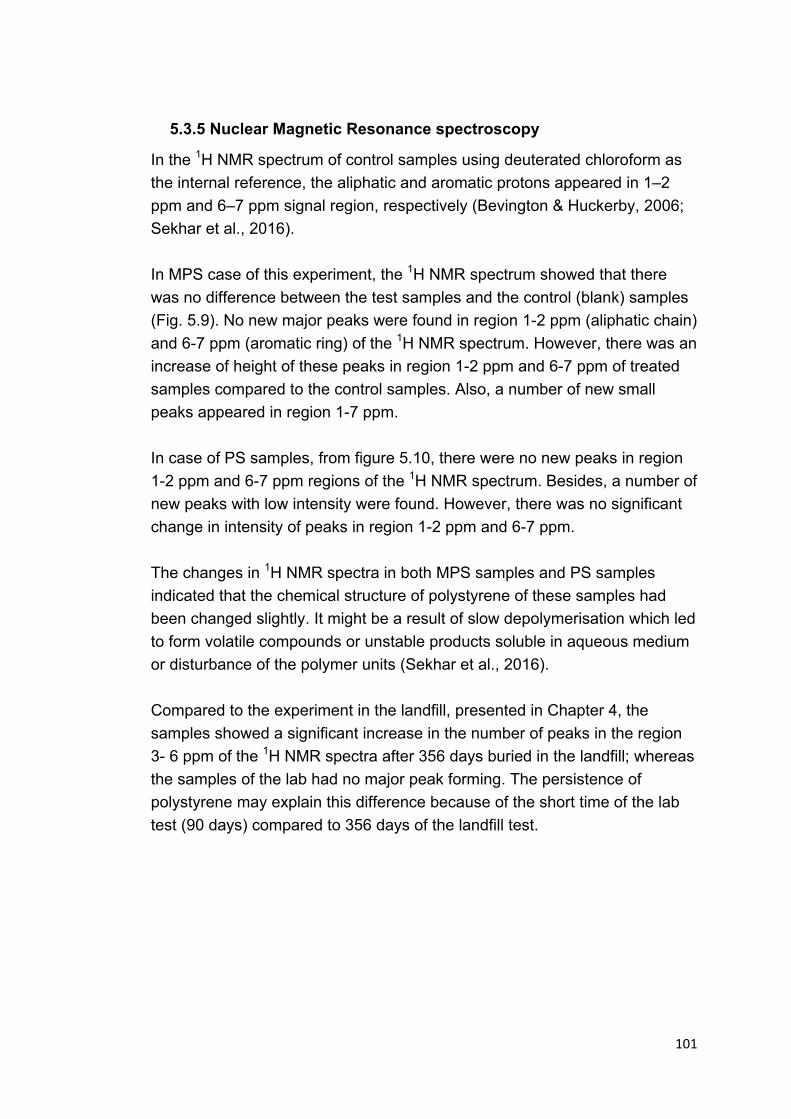
101
5.3.5 Nuclear Magnetic Resonance spectroscopy
In the 1H NMR spectrum of control samples using deuterated chloroform as the internal reference, the aliphatic and aromatic protons appeared in 1–2 ppm and 6–7 ppm signal region, respectively (Bevington & Huckerby, 2006; Sekhar et al., 2016). In MPS case of this experiment, the 1H NMR spectrum showed that there was no difference between the test samples and the control (blank) samples (Fig. 5.9). No new major peaks were found in region 1-2 ppm (aliphatic chain) and 6-7 ppm (aromatic ring) of the 1H NMR spectrum. However, there was an increase of height of these peaks in region 1-2 ppm and 6-7 ppm of treated samples compared to the control samples. Also, a number of new small peaks appeared in region 1-7 ppm. In case of PS samples, from figure 5.10, there were no new peaks in region 1-2 ppm and 6-7 ppm regions of the 1H NMR spectrum. Besides, a number of new peaks with low intensity were found. However, there was no significant change in intensity of peaks in region 1-2 ppm and 6-7 ppm. The changes in 1H NMR spectra in both MPS samples and PS samples indicated that the chemical structure of polystyrene of these samples had been changed slightly. It might be a result of slow depolymerisation which led to form volatile compounds or unstable products soluble in aqueous medium or disturbance of the polymer units (Sekhar et al., 2016). Compared to the experiment in the landfill, presented in Chapter 4, the samples showed a significant increase in the number of peaks in the region 3- 6 ppm of the 1H NMR spectra after 356 days buried in the landfill; whereas the samples of the lab had no major peak forming. The persistence of polystyrene may explain this difference because of the short time of the lab test (90 days) compared to 356 days of the landfill test.

102
Figure 5.9 1H NMR spectrum of modified polystyrene foam cups (MPS): control sample (top) and the treated sample (bottom)

103
Figure 5.10 1H NMR spectrum of Dart® foam cups (PS): control sample (top) and the treated sample (bottom)

104
5.3.6 Determination of weight loss
The dry weights of all test samples were carefully determined before and after the test. Typically, tests for biodegradation in activated sludge, soil, wastewater, sample weight can show increased weight due to the attachment of microbial cells or solid particles in the test environment or show decreased weight due to degradation or fragmentation. However, the results of this research showed that there was no significant change in the mass of samples during 90 days lab test. In other words, the samples of control and test almost retained their original weight suggesting not much degradation and fragmentation of the test samples. Also, there was much adherence of bacterial cell onto the samples. The weight of the test samples is shown in Table 5.2. Table 5.2 Summary of weight of test samples before and after the laboratory testing
Replication of samples 1st 2nd 3rd
Initial weight (g)
Final weight (g)
Initial weight (g)
Final weight (g)
Initial weight (g)
Final weight (g)
MPS Test 5.003 5.002 5.005 5.005 5.000 5.001 Blank 5.005 5.005 5.009 5.008 5.007 5.007
PS Test 5.001 5.000 5.002 5.003 5.002 5.001 Blank 5.000 5.001 5.004 5.004 5.007 5.007
HIPS Test 5.000 5.000 5.002 5.002 5.004 5.003 Blank 5.003 5.003 5.008 5.008 5.006 5.006
Cardboard 5.004 5.005 5.007 5.006 5.003 5.000
5.4 Conclusions
The results of the present tests in the laboratory showed some signs of biodegradation of polystyrene. The previous test in the landfill also showed signs of biodigestion of the polystyrene but as stated earlier, other factors may have been in play in the landfill. The results of this laboratory test conclusively showed that it was the microorganisms that had degraded the polystyrene. The chemical structure of polystyrene had slight changes that

105
were supported by the results of FTIR spectra and 1H NMR spectra. Also, the morphology of treated samples was transformed as observed by field emission scanning electron micrographs. However, the biodegradation was still very low in all type of the test samples. The result is quite similar to recent studies on biodegradation of polystyrene material. It was further concluded that the mass test was rather insensitive. To further define the organisms responsible and the conditions needed for their function experiments described in subsequent chapters were set up in which polystyrene was the sole source of carbon.
106
Chapter 6 INVESTIGATION OF BIODEGRADABILITY
OF POLYSTYRENE MATERIALS IN GARDEN SOIL
6.1 Introduction
In general, it has been widely accepted that polystyrene is resistant to biodegradation and hence extremely persistent in the environment. In 1995, Otake and colleagues found that a sheet of polystyrene had no sign of degradation after 32 years buried in soil (Otake et al., 1995). Similarly, a study on biodegradation of polystyrene/thermoplastic starch blends with plasticizer buriti oil (Mauritia Flexuosa (Buriti) Fruit Oil) in soil for 6 months revealed that the blend polymer could be degraded by soil microorganisms, but it was the starch component that was degraded and there was no significant effect on the polystyrene (Schlemmer et al., 2009). Ali and Ghaffar (2017) reported that polystyrene was generally resistant to the biodegradation after six months buried into two types of soil (agriculture soil and desert soil). However, on the other hand, some studies found that microorganisms could degrade polystyrene in soils. Sielicki and colleague (1978) reported that polystyrene could be degraded in different soils (a landfill cover soil and three different agricultural topsoils) with degradation rates varied from 1.5 to 3.0% for a 4-month period. Similarly, Kaplan and colleagues stated that in cultivated soils containing a wide range of fungi, microbes and invertebrates, degradation of polystyrene was less than 1% after 90 days with no significant increase in degradation rate after this time (Kaplan et al., 1979). A study in 2010 found six isolated bacterial strains in garden soil that could use expanded polystyrene films as a sole source of carbon (Atiq et al., 2010). Oliveira et al., 2010 also found a signal of biodegradation of polystyrene/starch blend in soil (black subsoil mixed 30wt% bovine manure) by weight loss and changes on samples’ surface. Nikolic and colleagues (2014) discovered biodegradation of polystyrene-graft-starch copolymers in three different types of soil (soil rich in humus, soil for cactus growing, and soil for orchid growing). Although the biodegradation rate of polystyrene in all the above studies was limited, it can be taken as a promising sign for treatment of polystyrene wastes in future.

107
In two earlier experiments on biodegradation of foam cups in the two different test conditions of landfill and leachate in this project, the results showed that polystyrene could be partially degraded by microorganisms available in that anaerobic environment. So what does happen to the polystyrene foam cups if they were disposed in other natural environments such as soil? Can microorganisms available in soil decompose them? The primary aim of this project was to evaluate biodegradation of modified polystyrene foam cups in the modern landfill where most polystyrene wastes end up. However, it was also of interest to evaluate biodegradation of these samples in the soil environment because landfills were not the only place that polystyrene wastes end up. The hypothesis was that the foam cups in garden soil might be degraded faster than in the managed landfill or in the laboratory in leachate. The biodegradation was to be evaluated by changes in the chemical structure of polystyrene using NMR, FTIR, and physical changes on its surface by visual observation and FESEM.
6.2 Materials and methods
Materials In this experiment, the Dart foam cups (PS) and modified polystyrene foam cups (MPS) were used for the investigation of biodegradation. Garden soil was mixed with compost (Cow manure compost) at ratio 1:1 v/v. The compost was in the form of fertiliser (Bunning warehouse, Australia) Methods The experiment was conducted as illustrated in Figure 6.1. Briefly, a 3 cm layer of the mixed soil was placed in the bottom of a foam box (A). Then, the testing samples (6 cups of MPS and 6 cups of PS) was put into the box and covered by the mixed soil (B). The cover layer on top was about 3 cm. In other words, all sides of these cups contacted the soil. Finally, coriander seeds were grown in the foam box (C). Water was added every two days for growing of coriander. After six months, the test samples were taken out and observed visually. FESEM investigated microscopic changes on their surface. Biodegradability of these samples by changes in their chemical

108
structure was analysed by NMR and FTIR. The test results were compared to blank samples not in contact with soil.
Figure 6.1 Images of garden soil biodegradation experiment Note: A- A 3 cm layer of the mixed soil was placed in the bottom B- The cups was cover by soil C- Growing of coriander in soil containing test cups
6.3 Results and discussion
6.3.1 Visual observation
These foam cups still kept their original shape after six months buried in the mixed soil. There were no holes or cracks on their surface as observed by naked eye. Many pieces of dried root skins of coriander and small soil particles hard stuck on cups’ surface both inside and outside (Figure 6.2) and were hard to remove by rinsing with distilled water. However, there was little particulate matter which inserted or stuck to around the boundaries of polystyrene beads as compared to the samples in the landfill and leachate test. In contrast the in situ landfill experiment showed much more substance around polystyrene beads when the samples submerged in the leachate for a long time. In this test, water was added every two days that was just enough for the growth of coriander. A test with iodine solution revealed that there were no dark-blue spots on the surface of MPS cups. It was possible that the additive (starch) was degraded by microorganisms in the soil. This result was quite similar to the test results in landfill and leachate that starch was no longer visible after the test. The

109
result was in agreement with the statement of Schlemmer and colleagues that only starch was lost and there was no significant effect on polystyrene in their research (Schlemmer et al., 2009).
Figure 6.2 Images of inside and outside surfaces of a foam cup after six months in soil (right) compared to the control (left)

110
6.3.2 Field emission Scanning Electron Microscopy
FESEM was used to study the surface morphology of test samples and original samples. From figure 6.3 and 6.4, microscopic changes were found in both MPS and PS samples after the test. The surface of MPS and PS cups buried six months in the soil had scabrous, pits and holes while the blank sample, without treatment, had a smooth surface. These changes showed that microorganisms in the soil could attack the polystyrene itself. The obtained results were quite similar to the earlier findings of the test in the landfill and the leachate (Shown in chapter 4 & 5). Some previous research investigating biodegradation of polystyrene blend in the soil also reported that the microorganisms had changed the surface morphology of test samples. It was not clear if these observed changes were due to mere removal from the surface of starch or indeed due also to enzymatic attack on the polystyrene itself. Ali and Ghaffar found that the surface of the film blended PS/ Starch 10 wt% and irradiated with a dose of 20 kGy had a rough surface and many holes throughout the film surface after soil burial for six months, indicating the occurrence of degradation, which enables the removal of starch portions by microorganisms (Ali and Ghaffar, 2009). Investigating the effects of microorganisms on the surface film of PS/starch blends, Oliveira and colleagues revealed much-degraded surfaces with many holes and cracks causing by starch consumption of organisms in soil within 60 days (Oliveira et al., 2010). These holes and cracks produced by biodegradation in the present research study had random shapes, and were not uniform over the whole surface. These changes found at the microscopic level indicated that polystyrene was quite enduring to soil microorganisms but not totally resistant to them.

111
Figure 6.3 FESEM micrographs of modified polystyrene foam cups (MPS) of blank sample (top) and test sample in the soil (bottom) at 10,000x magnification

112
Figure 6.4 FESEM micrographs of polystyrene foam cups (PS) of blank sample (top) and test sample in soil for six months (bottom) at 10,000x magnification
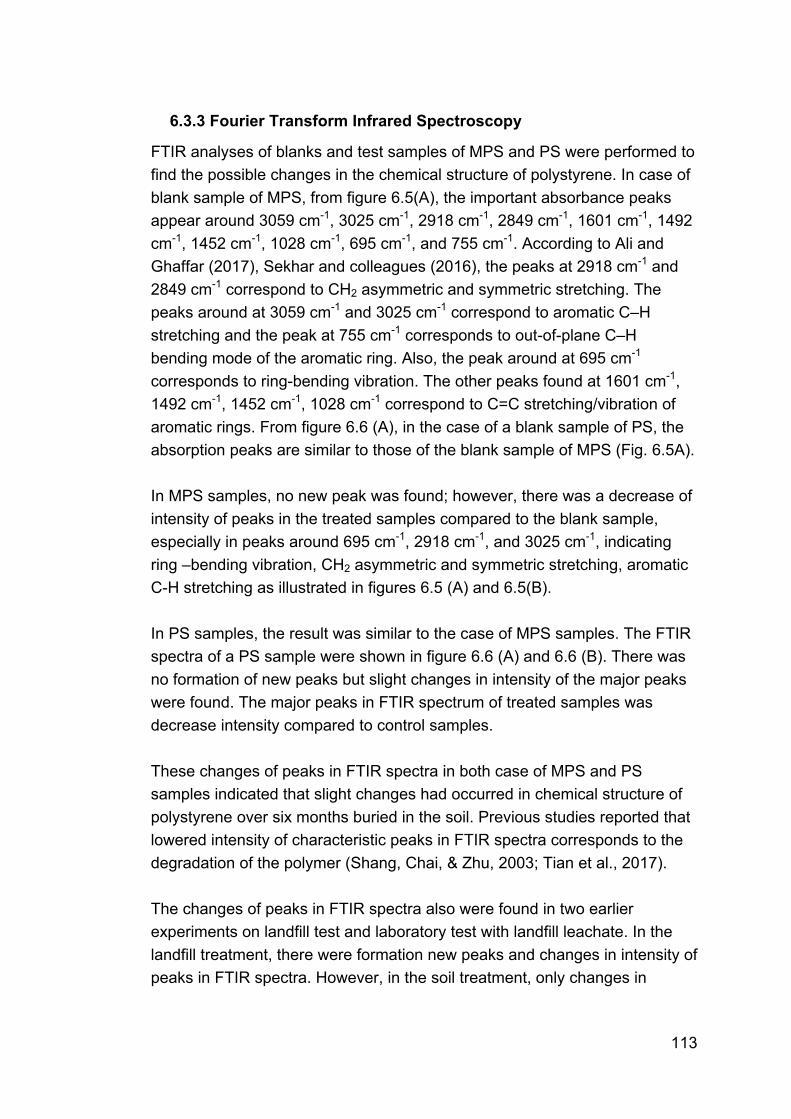
113
6.3.3 Fourier Transform Infrared Spectroscopy
FTIR analyses of blanks and test samples of MPS and PS were performed to find the possible changes in the chemical structure of polystyrene. In case of blank sample of MPS, from figure 6.5(A), the important absorbance peaks appear around 3059 cm-1, 3025 cm-1, 2918 cm-1, 2849 cm-1, 1601 cm-1, 1492 cm-1, 1452 cm-1, 1028 cm-1, 695 cm-1, and 755 cm-1. According to Ali and Ghaffar (2017), Sekhar and colleagues (2016), the peaks at 2918 cm-1 and 2849 cm-1 correspond to CH2 asymmetric and symmetric stretching. The peaks around at 3059 cm-1 and 3025 cm-1 correspond to aromatic C–H stretching and the peak at 755 cm-1 corresponds to out-of-plane C–H bending mode of the aromatic ring. Also, the peak around at 695 cm-1 corresponds to ring-bending vibration. The other peaks found at 1601 cm-1, 1492 cm-1, 1452 cm-1, 1028 cm-1 correspond to C=C stretching/vibration of aromatic rings. From figure 6.6 (A), in the case of a blank sample of PS, the absorption peaks are similar to those of the blank sample of MPS (Fig. 6.5A). In MPS samples, no new peak was found; however, there was a decrease of intensity of peaks in the treated samples compared to the blank sample, especially in peaks around 695 cm-1, 2918 cm-1, and 3025 cm-1, indicating ring –bending vibration, CH2 asymmetric and symmetric stretching, aromatic C-H stretching as illustrated in figures 6.5 (A) and 6.5(B). In PS samples, the result was similar to the case of MPS samples. The FTIR spectra of a PS sample were shown in figure 6.6 (A) and 6.6 (B). There was no formation of new peaks but slight changes in intensity of the major peaks were found. The major peaks in FTIR spectrum of treated samples was decrease intensity compared to control samples. These changes of peaks in FTIR spectra in both case of MPS and PS samples indicated that slight changes had occurred in chemical structure of polystyrene over six months buried in the soil. Previous studies reported that lowered intensity of characteristic peaks in FTIR spectra corresponds to the degradation of the polymer (Shang, Chai, & Zhu, 2003; Tian et al., 2017). The changes of peaks in FTIR spectra also were found in two earlier experiments on landfill test and laboratory test with landfill leachate. In the landfill treatment, there were formation new peaks and changes in intensity of peaks in FTIR spectra. However, in the soil treatment, only changes in

114
intensity of peaks were found. It might be explained by the test time was probably not long enough for the degradation of microorganisms. Furthermore, any low molecular weight and volatile compounds liberated by such biodegradation would move into the ambient environment and would not be detected by FTIR analysis of the solid plastic test samples remaining. Recently, FTIR spectroscopy has been used as a useful analytical tool in many biodegradation studies of polymer (Ali & Ghaffar, 2017; Atiq et al., 2010; Kukut et al., 2013; Kundu et al., 2014; Mohan et al., 2016; Nikolic et al., 2014; Pushpadass et al., 2010; Sekhar et al., 2016, Tian et al., 2017).

115
Figure 6.5 FTIR spectra of blank sample of MPS (A) and treated sample of MPS in soil for six months (B)
(A)
(B)

116
Figure 6.6 FTIR spectra of blank sample of PS (A) and treated sample of PS in soil for six months (B)
(A)
(B)

117
6.3.4 Nuclear Magnetic Resonance spectroscopy 1H NMR spectroscopy was used to find the changes in chemical structure of polystyrene in test samples of MPS and PS buried in the soil for six months compared to blank samples not bury. This technique is useful and has been used in recent research for degradation of polymers (Kukut et al., 2013; Mohan et al., 2016; Sekhar et al., 2016). In the PS case, from figure 6.7a, 1H NMR spectrum of polystyrene of the blank sample appeared in 1–2 ppm and 6–7 ppm signal region, respective an aliphatic chain and an aromatic group in the chemical structure of polystyrene in order (Bevington & Huckerby, 2006; Sekhar et al., 2016). From figure 6.7b, 1H NMR spectrum of the treated sample, a slight increase in the number of peaks in both the aliphatic and aromatic signal region was observed in the test sample. Also, there was an increase in the height of peaks in 1–2 ppm and 6–7 ppm signal region. In case of MPS, the similar situation had been found. From figure 6.8b, there was an increase in the intensity of peaks and a modest increase in the number of peaks in both the aliphatic and aromatic signal region of the 1HNMR spectrum as compared to spectrum in figure 6.8a. Combining with the results of FTIR analyses above, these changes might be attributed to slow depolymerisation process making the change in chemical structure of polystyrene, the formation of volatile compounds or dislocation of the polymer units into the surrounding medium. This result of 1H NMR was close to observations of two earlier experiments in the landfill and leachate that MPS and PS samples had changed their structure after the treatment. This 1H NMR result was similar to result of Sekhar and colleagues investigating biodegradation of high impact polystyrene in pure culture of as Enterobacter sp., Citrobacter sedlakii, Alcaligenes sp. and Brevundimonas diminuta for 30 days. It was also found that there was an increase in the number of peaks in the region of aromatic and aliphatic (Sekhar et al., 2016).

118
Figure 6.7 1H NMR spectra of PS of a blank sample (a), and a test sample in soil for 6 months (b)
a)
b)

119
Figure 6.8 1H NMR spectra of MPS of a blank sample (a), and a test sample in soil for 6 months (b)
a)
b)

120
6.4 Conclusions
It was concluded that after immersion in garden soil for six months, foam cups of both MPS and PS could be degraded in the test environment. The degradation could be observed via changes in the chemical structure shown in spectra of FTIR and 1H NMR analyses, and changes in physical characteristic shown in the image of visual observation and FESEM. Combining this result with earlier experiments in the landfill and lab condition (with leachate), it could be concluded that soil and landfill microorganisms are able to decompose foam cups in the environment. However, the rate of biodegradation was still very low possibly because there were many other carbon sources more readily consumable by the microorganisms and perhaps also the many independent factors of the physical and chemical environment that were not optimal for the function of these microorganisms. Although the FESEM showed a presence of bacteria cells on the surface of the test samples, it could not be definitely concluded that these changes came only from decomposition by these microorganisms. It is generally acknowledged that there are many factors in the surrounding environment such as UV, heat, and chemicals that may contribute to a part of these changes. Subsequent research studies using polystyrene as a sole source of carbon would help to find what microorganisms are functionally active and also to better be able to detect intermediates.

121
Chapter 7
BACTERIAL ISOLATION AND INVESTIGATION OF BIODEGRADABILITY OF MODIFIED POLYSTYRENE
BY ISOLATED BACTERIA
7.1 Introduction
In two earlier experiments to investigate the breakdown of polystyrene in the landfill and in the laboratory, evidence was found of slight polystyrene degradation by microorganisms available in the landfill. The results showed that the degradation rate was very slow but nevertheless positive. One of the most likely things that could affect the biodegradation rate was the short period of the test compared to the running time of typical landfill (dozens of years). Typically, when waste is initially placed in landfill, there are many available sources of carbon for the digestive bacteria to feed on. Easily utilizable carbon sources will be used first by microorganisms. Therefore, breakdown of polystyrene chains would only happen when other carbon sources are almost exhausted. In other words, it is reasonable to hypothesise that biodegradability of polystyrene needs more time than the other carbon sources and is likely to be very slow requiring a running time of dozens of years in the landfill. Also it should be stressed that not all bacteria have the necessary enzymes to break bonds in polystyrene and of those that do, their numbers may be very low due to competition. Recently, some studies reported that polystyrene could be degraded by certain bacteria isolated from the environment. It was found that high impact polystyrene film could be degraded up to 12.4% weight loss within 30 days by Enterobacter sp. (Shekhar et al., 2016). Yang et al., (2015) found that Exiguobacterium sp. strain YT2 from mealworms could remove 7.4 ± 0.4% of weight reduction (2500 mg PS/L in 108 cells/mL) after 60 days (Yang et al., 2015b). Another study reported that Bacillus sp. NB6 and Pseudomonas aeruginosa NB26 could degrade polystyrene after 8 weeks (Atiq et al., 2010). No weight reduction was reported and no significant surface changes were observed using FTIR analysis but intermediate compounds (1-phenyl-1, 2 ethandiol and 2-phenylethanol) were detected by HPLC. Similarly, Mor & Sivan found using actinomycete Rhodococcus ruber C208 and with

122
polystyrene flakes as sole carbon source, that there was 0.5% or 0.8% weight reduction within 4 or 8 weeks and subsequent biofilm formation (Mor & Sivan, 2008). Therefore, an investigation was undertaken to find if isolated microorganisms from landfill were capable of rapidly degrading polystyrene when tested with polystyrene as a sole source of carbon.
7.2 Materials and methods
7.2.1 Materials
In the work for this thesis, modified polystyrene cups (MPS) were the object of investigation of polystyrene biodegradation by isolated microbes. In the earlier test in landfill and leachate, biodegradation of MPS was slow. It was stated that biodegradation of plastics occurred on the surface (Chinaglia, Tosin, & Degli-Innocenti, 2018); therefore, these foam cups were transformed into thin films, thickness approximately 0.2 mm, by surface casting as described below and were labelled Thin Film Modified Polystyrene (TFMPS). These thin films might enhance microbial attack and facilitate later analyses such as visual observation and FTIR. To convert MPS cups to thin films, eight gram of MPS cups were transferred to a beaker containing 240 mL tetrahydrofuran 99.9% (Sigma-Aldrich) and thoroughly mixed for 10 min to dissolve, and then the liquid was transferred to glass Petri dishes (around 10mL per dish) and allowed to evaporate in a fume hood several days to form thin films (Fig. 7.1). Experiments described below used both pure polystyrene film obtained commercially from Aldrich Chemicals and the TFMPS described above.

123
Figure 7.1 Thin Film Modified polystyrene discs (TFMPS) made by surface casting
7.2.2 Methods
Experiment 1: Screening microorganisms capable of decomposing polystyrene from landfill leachate This experiment was conducted to find microorganisms in the Summerhill landfill leachate that can degrade the polystyrene film; thickness 0.025 mm (Sigma-Aldrich) in laboratory condition at 46 oC. The polystyrene film was used with an expectation that it could help to increase interaction of microbial community and substrate and to raise degradation rate, since Kale’s group had shown that the physical form of polystyrene may also influence biodegradability (Kale et al., 2015). It seems that polystyrene can be degraded more rapidly if it is in the form of powder, film, flake, pellet and/or fibre. The test was summarised in figure 7.2

124
Figure 7.2 Diagram of bacteria isolation from leachate with polystyrene film thickness 0.025 mm as substrate In this test, five grams of the polystyrene film, thickness 0.025 mm (Sigma-Aldrich) was added to a 250 mL conical flask containing full flask of the leachate obtained from the liquid escaping from the downhill side of the Summerhill waste facility (approximately 250 mL to remove the air in the flask). The flask was incubated in a warm water bath at 46±0.5 oC for five months until almost the film was no longer clearly visible. An aliquot of 1 mL solution was spread on agar plates containing a nutrient medium. These plates were incubated at 30 oC in CO2 incubator for three days. Single colonies were separated and purified by repetitive streaking several times (3-4 times until uniform) on nutrient agar plates to use for tests of polystyrene degradation. There were eight pure isolated strains, as determined by colony shape and colour, and were coded from F1 to F8. The same process was carried out with sterilized leachate and samples as a control test. No organisms could be cultured from this material. In the control test, the film was not degraded. Experiment 2: Evaluating biodegradability of modified polystyrene (TFMPS) by the isolated bacteria Bacteria strains isolated from experiment 1 were used to evaluate biodegradability of polystyrene foam cups which had been transformed to thin film (TFMPS). The eight bacterial strains were grown separately in test tubes containing nutrient broth until obtaining a density around of 108 CFU mL-1. An aliquot of 5 mL stock culture of each isolated strain was transferred into a 250 mL conical flask containing 100 mL autoclaved mineral salt medium with pre-weighed TFMPS as a sole carbon source. There was no nutritive material for microbes other than the polymer. The air in top space of these flasks were replaced by nitrogen gas and sealed by rubber bungs.

125
These flasks were kept in warm water baths at 46±0.5 oC. After ninety days of incubation, these films were taken out and examined for evidence of biodegradation. The control test was done without bacterium (TFMPS + mineral salt medium). All degradation experiments were carried out in triplicates. Quantities of test samples were summarized in Table 7.1 Table 7.1 Quantities of test samples for evaluation of modified polystyrene biodegradability of isolated bacteria Code F1 F2 F3 F4 F5 F6 F7 F8 Control Quantity 3 3 3 3 3 3 3 3 3 Total 27 The methods used to evaluate the biodegradation in this experiment (weight loss, FESEM, FTIR, NMR, GPC, GC-MS) have been described in detail in chapter 3.
7.3 Results and discussion
7.3.1 Determination of weight loss
All test samples were carefully weighed before doing the test. After being taken out of the test flasks, the TFMPS samples were lightly rinsed with distilled water and dried in an oven to constant weight. The final weight of all test samples had a decrease comparing to their original weight. The weight loss also happened in control samples with the average loss of 0.68% indicated that the TFMPS might be fragmented in the test solution or it happened in cleaning process of sample after treated. The method to determine percentage of degradation was described in chapter 3, section 3.2. The change in weight of the test samples by eight different strains is shown in figure 7.3. From figure 7.3, the graph showed that there were four strains out of eight isolated bacterial strains having considerable ability to degrade polystyrene, with degradation rate around 10-12.5%. The maximum biodegradation rate was about 12.5% by strain F7. Strain F2 had the lowest rate at below 7%. The weight loss could be due to several reasons. One of the most likely reasons was that microorganisms degraded polystyrene with considerable rate due to the absence of any other carbon source. Changes in morphology

126
of the residual polystyrene samples (thin films) as revealed by FESEM, FTIR, GPC, NMR, and GC-MS confirmed this assumption. It is possible that some of the weight loss was due to the metabolism by bacteria of the starch additive found in TFMPS but since this material only constitutes 0.5% by weight of the MPS (Lefebvre, Patent US 20120301648A1) this is unlikely to be the sole reason for weight loss observed. Secondly, the weight loss might also happen by fragmentation or mechanical breakage because the thin films had many holes and balloons. This debris (in micrometre) may lie in the liquid phase of the treatment process and not be recovered to measure. However, more analysis was necessary to clarify it.
Figure 7.3 Change in weight of the TFMPS test samples after 90 days incubation with isolated bacterial strains (error bars represent standard deviation) Some previous research also reported weight loss of polystyrene materials incubated with pure microbial strains. Mohan and colleagues showed loss of HIPS film up to 23% (w) incubated with Bacillus sp. and less than 10% incubated with Pseudomonas sp. for 30 days (Mohan et al., 2016). Mor and Sivan reported that polystyrene was lost 0.8% incubated with Rhodococcus ruber (Mor and Sivan, 2008). Oikawa described that polystyrene reduced 56% incubated with Bacillus sp. STR-Y-O strain for 8 days (OiKawa et al., 2003).
0
2
4
6
8
10
12
14
F1 F2 F3 F4 F5 F6 F7 F8
Perc
ent (
%)
Percentage of weight loss of polystyrene

127
7.3.2 Field emission Scanning Electron Microscopy
Polystyrene foam contains about 97% of air in its volume. When the foam cups were dissolved in a solvent (tetrahydrofuran) and aliquots dried to form TFMPS holes and balloons in different sizes could be observed under FESEM (Figure 7.4) but not by the naked eye. The surface of the original foam cups was plain and smooth (See in chapter 4 & 5, FESEM section). After 90 days incubated with the isolated bacteria, treated TFMPS samples were analysed by FESEM to find possible changes on their surface and compared to the control samples. The FESEM micrographs showed that the surface of treated films had signs of biodegradation that could not be seen in the control samples. Some microbial cells and small debris adhered on polystyrene film compared to control samples. These changes were found in all treated samples. However, the change was not uniform in each sample and between different samples presumably due to the random attack of microbes. In other words, it was not possible to quantitatively compare the rate of biodegradability between different samples by FESEM. Surface change might be not proportional to the weight loss of the samples (section 7.3.1). Some illustrated FESEM micrographs are shown in figure 7.5.

128
Figure 7.4 FESEM micrographs of a control sample of TFMPS at magnification of 5,000x (top) and 10,000x (bottom)

129
Figure 7.5 FESEM micrographs of treated samples at 10,000x magnification. TFMPS was treated with strains of (a) F1; (b) F2; (c) F5; (d) F7
7.3.3 Fourier Transform Infrared Spectroscopy
The FTIR showed changes in intensities of major peaks of the spectra of TFMPS polystyrene. Also, a new peak was formed in region around 2987 cm-
1. The change in peak intensity and the formation of a new peak were observed in all treated samples. Spectrum of treated sample by strain F8 (Fig. 7.6) is presented as an example. From figure 7.6, in control samples, the important peaks appeared around 3059 cm-1, 3025 cm-1, 2918 cm-1, 2849 cm-1, 1601 cm-1, 1492 cm-1, 1452 cm-
1, 1028 cm-1, 695 cm-1, and 755 cm-1. The peaks at 2918 cm-1 and 2849 cm-1

130
correspond to CH2 asymmetric and symmetric stretching. The peaks around at 3059 cm-1 and 3025 cm-1 correspond to aromatic C–H stretching and the peak at 755 cm-1 corresponds to out-of-plane C–H bending mode of the aromatic ring. Also, the peak around at 695 cm-1 corresponds to ring-bending vibration. The other peaks found at 1601 cm-1, 1492 cm-1, 1452 cm-1, 1028 cm-1 correspond to C=C stretching/vibration of aromatic rings (Ali and Ghaffar, 2017; Sekhar et al., 2016). In spectra of TFMPS treated sample by strain F8, there was a sharp decrease of intensity of all main peaks in region of 695 cm-1, 755cm-1, 1452 cm-1, 1492 cm-1, 3059 cm-1, 3025 cm-1, 2918 cm-
1, 2849 cm-1, 538 cm-1, 1601 cm-1 indicated that the chemical structure of polystyrene was strongly influenced by biodegradation. Especially, the formation of a new peak was found in region 2987 cm-1 suggesting change in aliphatic region. This is the first report of a new peak in this region of FTIR spectrum of digested polystyrene. Compared to the landfill tests (chapter 4) and the lab tests (chapter 5), the changes seen in this experiment were stronger in peak intensity and could be easily seen in the treated samples. It was notable that these changes happened in all eight treated samples. These changes indicated that in the medium with polystyrene as a sole source of carbon, polystyrene can be decomposed more aggressively than in environments where there are many alternative sources of organic carbon such as landfill or leachate.
Figure 7.6 FTIR spectra of TFMPS film treated with isolated strain F8

131
7.3.4 Gel Permeation Chromatography
The molecular weight distribution of TFMPS films in this research are presented in table 7.2. Compared with the control sample, weight average molecular weight Mw had a slight increase and number average molecular weight Mn had a slight decrease in all treated samples. The changes in weight average molecular weight and number average molecular weight led to increase of polydispersity (Mw/Mn) after treatment process. The smaller the polydispersity index is, the narrower the molecular weight is. In other words, if a polymer has a narrow range of polymer chain lengths, the polydispersity is low. The increase in value of polydispersity was observed indicated that the chain lengths of polystyrene were varied considerably in treated samples. Table 7.2 GPC analysis of modified polystyrene foam cups (TFMPS) treated by isolated bacteria under laboratory conditions at 46 oC No. Code Number average
molecular weight Mn (Daltons)
Weight average molecular weight Mw (Daltons)
Polydispersity (Mw/Mn)
1 Control 146621 320755 2.18765 2 F1 130355 342419 2.62682 3 F2 134962 339700 2.51700 4 F3 134962 339700 2.51700 5 F4 140731 347388 2.46846 6 F5 141574 346844 2.44992 7 F6 141574 346844 2.44992 8 F7 143248 396070 2.58450 9 F8 138988 347204 2.49808
7.3.5 Nuclear Magnetic Resonance spectroscopy
The NMR spectra showed that there were differences between the treated samples and the control samples. In the 1H NMR spectrum of control samples using deuterated chloroform as the internal reference, the aliphatic and aromatic protons appeared in 1–2 ppm and 6–7 ppm signal region, respectively (Bevington & Huckerby, 2006; Sekhar et al., 2016). Compared to control samples, in all treated samples, there were no new major peaks

132
found, but there was the change of height of peaks found in region 1-2 ppm and 6-7 ppm. Two 1H NMR spectra of strain F2 (Fig. 7.8) and strain F8 (Fig. 7.9) were used to illustrate for the changes. From figure 7.8, peaks in the region 6- 7.5 ppm showed a considerable decline compared to the control in figure 7.7 while the other peak also had a decrease of intensity. The changes in height of peaks in all treated samples in the signal region of 1-2 ppm and 6-7 ppm of 1H NMR indicated that the chemical structure of polystyrene was affected considerably.
Figure 7.7 1H NMR spectrum of a control sample of TFMPS film Note: The aliphatic and aromatic protons appeared in 1-2 ppm and 6-7 ppm signal region, respectively
Figure 7.8 1H NMR spectrum of TFMPS treated with F2 strain

133
Figure 7.9 1H NMR spectrum of TFMPS treated with F8 strain
7.3.6 Gas Chromatography-Mass Spectrometry
In earlier experiments in landfill, leachate, and in garden soil, it was found that microbes in the environment could degrade polystyrene materials. However, the degradation rate was not high. Because of the experimental conditions any end-products or intermediate compounds released into the ambient environment by the biodegradation process could not be detected. In this experiment, GC-MS was used to investigate products of biodegradation by isolated bacteria. We assumed that isolated microbes could decompose modified polystyrene in mineral salt media without containing any other carbon source. The product of the decomposition may be in the liquid phase of the culture. Therefore, after 90 days of incubation with TFMPS, the liquid culture of eight strains was examined using GC-MS. The results were compared with the control sample not containing bacteria (TFMPS polystyrene film + mineral salt medium). Details of the analysis were presented in section 3.2.3.8, chapter 3. The results of GC-MS showed that phenylacetaldehyde, 2-phenyl ethanol, and styrene oxide were found in all treated samples, but none of these were found in the control samples. Due to some limitations, a quantitative analysis could not be done, but in general, the amount of styrene oxide was much

134
higher than phenylacetaldehyde and 2-phenyl ethanol. Figure 7.10 illustrates GC-MS result of biodegradation products of polystyrene by strain F8. Styrene is monomer forming polystyrene, so it is surmised that polymer chains were broken down to monomers or some intermediate compound as styrene oxide, phenylacetaldehyde and 2-phenyl ethanol that have chemical structure and formula close to monomeric styrene. Atiq and colleagues also reported that 2-phenyl ethanol was found in culture media of isolated strains from soil incubated with polystyrene by HPLC (Atiq et al., 2010). A similar report by Mohan and colleagues that phenyl ethanol appeared in culture medium with Bacillus spp. and Pseudomonas spp. after incubation with high impact polystyrene by HPLC (Mohan et al., 2016). In another study, using isolated bacteria incubated with high impact polystyrene and analysing culture media by HPLC, Sekhar and colleagues discovered that styrene oxide and 2-phenyl ethanol were present in culture media of Enterobacter Sp. while 2-phenyl ethanol was found in culture media of Citrobacter sedlakii and Brevundimonas diminuta (Sekhar et al., 2016). The data obtained by GC-MS also backs up the assumption that the products of biodegradation were mobile and remained in the liquid phase of the media and therefore would not explicitly appear in the NMR analysis (sharp peaks) of the treated polystyrene in earlier test in the landfill, leachate, and soil.
Figure 7.10 GC-MS graph of biodegradation products of TFMPS polystyrene by strain F8
135
7.4 Conclusions
Eight isolated bacterial strains from the landfill leachate were found to be able to use polystyrene as a source of carbon. They may be facultative anaerobic bacteria and later identification showed that they belong to genus of Bacillus and Brevibacillus (Chapter 8). Strain F7 had the highest rate of biodegradation around 12.5% based on weight loss within 90 days. The other three bacterial strains (F1, F4, and F5) had a degradation rate of 10-11%. GC-MS evidence of polystyrene breakdown products was seen in all eight of the bacteria culture experiments. These were promising results indicating bacterial polystyrene degradation. These experiments also proved that the biodegradation rate of polystyrene could be increased by long term incubation with bacteria from the landfill and polystyrene as the sole source of carbon. Converting to physical thin films could increase degradation rate. Because these films had many small holes and rough surface, they could be useful for bacterial adhesion. FESEM showed in figure 7.5 that many cells attached to these holes. Also, biodegradation of polymers happens on their surface. Intermediate compounds of biodegradation process including Phenylacetaldehyde, styrene oxide, and 2-phenyl ethanol were found in eight of the test. In conclusion, the experiment showed that isolated strains could degrade polystyrene by using it as a source of carbon. The biodegradation had been shown by changes of physical and chemical of the samples. Further studies on the polystyrene breakdown of these microorganisms as well as their application in industrial scale of polystyrene waste treatment should be undertaken.

136
Chapter 8
BACTERIAL IDENTIFICATION IN THE LANDFILL
8.1 Introduction
Microorganisms in landfills play a significant role in disposing of waste. The community of microorganisms in landfill sites may vary over time and rely on the environmental factors inside the landfill. In the initial stage of decomposition in managed landfills, nutrients and oxygen are abundant and suitable for aerobic microorganisms. Later, facultative aerobic and obligate anaerobic microorganisms such as methanogens will replace aerobic groups because of depletion of oxygen and organic carbon sources, increase of temperature and decrease of pH. In the earlier experiment to evaluate the biodegradability of polystyrene in the landfill (Chapter 4), polystyrene was found to be slightly degraded. The degradation was presumably caused by the microbial community in the landfill. However, evaluation of polymer biodegradation in the managed landfill had limitations. In the simulation test of the landfill condition to find biodegradability of polystyrene (chapter 5), landfill leachate was used to replace the in situ landfill approach. This laboratory simulation test also indicated biodegradation of polystyrene. We hypothesised that the microbial community in the landfill leachate and the landfill site was similar because the microbial cells were swept by landfill leachate. So, the leachate could be used in laboratory test replacing the field test and also eliminating the complicated uncontrolled factors of the landfill situation and also eliminating the difficulties encountered in drilling holes into an actively working commercial landfill site. So the questions were: - Was the microbial community in landfill leachate and landfill solid similar in this project? - Can leachate be used in the laboratory instead of the landfill for tests of biodegradation? Is the degradation rate similar? - How did microbes change after one year test in the landfill? - What were isolated bacteria (chapter 7) that could degrade polystyrene?

137
- What was the difference of microbial communities contained in fresh leachate and lab leachate incubated with polystyrene thin film? These questions would be partially clarified in this chapter by sequencing and bioinformatics analysis. Due to the University of Newcastle restrictions on length of candidature for PhD students the detailed genetic analysis was unable to be completed and will be the subject of future publications.
8.2 Materials and methods
Sample preparation
In the field test at the Summerhill Landfill, three solid samples were collected at depths of 11 meters in the landfill. The first sample (coded S1) was collected when drilling the hole for the field test (details in chapter 4). The second sample (coded S2) was at 76 days when the first polystyrene samples were taken out of the well. Similarly, the third sample (coded S3) was collect at 356 days when the last polystyrene samples were taken out. In the lab test, there were two liquid samples. The first sample (coded L1) was landfill leachate (used in lab test in chapter 5) that was collected at a leachate reservoir in the Summerhill landfill. All drained leachate from the landfill were stored in this pool for further treatment. The second sample (coded L2) was collected five months after the leachate had been incubated with polystyrene film, for bacteria isolation (Experiment 2, chapter 7). Also, there were eight liquid samples from the broth cultures of the isolated strains described in chapter 7. DNA extraction and sequencing
The genomic DNAs from all the above samples were extracted using the PowerSoil® DNA Isolation Kit (MO BIO). The process of sample preparation and DNA extraction was carried out following manufacturer’s protocol. The extracted DNAs were purified by PCR before doing a sequencing analysis. The V3-V4 region of 16S rDNA was amplified using primers 341F-(5′-CCTACGGGNGGCWGCAG-3′) and 805R (5′-GACTACHVGGGTATCTAATCC-3′) and an Illumina MiSeq next-generation sequencer. The process had four steps including library preparation, cluster generation, sequencing, and data analysis. The sequencing was carried out

138
by the Hawkesbury Institute for the Environment (Western Sydney University, Australia). Bioinformatics and microbial identification
The microbial identification was carried out using open-source tools from third-party developers. Qiime2 analysed sequencing of samples (code S1, S2, S3, L1). The other sequencing (8 samples of pure isolated strains) were run by MG-RAST. QIIME2 is a robust, extensible open-source bioinformatics pipeline for performing microbiome analysis from raw DNA sequencing data. Its data input can be from raw sequencing data generated on the Illumina or other platforms. However, it requires a high-performance computing system for annotating the data. MG-RAST, Metagenomic Rapid Annotations using Subsystems Technology, (https://www.mg-rast.org) is an open-source tool from a third-party developer. It is a free, public resource for the analysis of metagenome sequence data which does not require high-performance computing for annotating the data (Meyer et al., 2008). The server was created and maintained by Argonne National Laboratory from the University of Chicago. Demultiplexed raw reads were processed using Qiime2 (version 2018.4). First, the qualities of the forward and reverse reads were checked before trimming and joining the paired-end reads (Caporaso et al. 2010). Following this step, the primers were trimmed off the forward and reverse read and truncated at 270bp and 230bp before merging them using the DADA2 plugin with a maxEE score of 2 (Callahan et al. 2016) . For the taxonomic assignment, the trained naive bayes classifier from the Qiime2 data resources page was used. This classifier was trained on the full length 16S rRNA gene with a 99% coverage rate (SILVA-119-99%). Furthermore, sampling depth was checked using the alpha-rarefaction curves generated by the Qiime diversity alpha-rarefaction plugin. The taxonomic classification was displayed using a taxa-bar-plot with the levels one to seven, corresponding to Level 1 Domain, Level 2 Phylum, Level 3 Class, Level 4 Order, Level 5 Family, Level 6 Genus, and Level 7 Species.

139
8.3 Results and discussion
The huge diversity of microorganisms in the landfill (S1, S2, S3) and leachate (L1) at different levels were shown in figure 8.1 & 8.2. From figure 8.1, microbiota in samples of S1 and S2 at the phylum level were similar with a dominance of Proteobacteria followed by Chloroflexi, Firmicutes, Chlorobi and Bacteroidetes. The similarity indicated that there was no difference of microorganisms in the landfill solid waste over the interval of 76 days. In other words, the community of microorganism had not much changed from the first day to day of 76. Proteobacteria is the largest phylum in bacteria domain and has six classes containing gram-negative bacteria, and some of them cause popular human diseases such as Escherichia, Shigella, Salmonella, Yersinia, Brucella, Rickettsia, Bordetella, Neisseriay, and Helicobacter (Rizzatti et al., 2017). The phylum of Chloroflexi contains filamentous bacteria stained mostly Gram negative, and have a wide diversity of metabolisms but are a well-known character as photoheterotrophs (Ward et al., 2018). Firmicutes belong to bacteria domain which most of them stain gram-positive and produce endospores. Some of the popular genera are Lactobacillus, Streptococcus, Mycoplasma, and Clostridium. Chlorobi is a phylum containing anoxygenic, phototrophic bacteria such as green sulfur bacteria that reduced sulfur compounds instead of oxygen. Bacteroidetes phylum contains anaerobic or aerobic, non-spore- forming and rod-shaped bacteria, stained Gram-negative. They are widely distributed in soil, sediments, water, guts and on the skin of human and animals. However, after 356 days, the microbial community had a change in the solid phase when comparing sample S3 to samples S1 and S2. Microbiota in sample S3 at phylum level was dominated by Firmicutes and Proteobacteria followed by Tenericutes, whereas Chloroflexi, Chlorobi and Bacteroidetes became minor phyla suggesting that the microbial composition in the solid phase of the landfill had changed after around a year. When comparing sample L1 and sample S1 at the phylum level (Fig. 8.1), there was a difference in the microbial community. In leachate sample (L1), there was an increasing abundance of phyla of Thermotogae and Synergistetes which were only minor phyla in solid phase samples (S1, S2, S3). This change indicated that the microbial community in the leachate and

140
landfill solid was not similar. This result was similar to report of Staley and colleagues that microbial communities in the solid and leachate phases in landfills were different (Staley, de los Reyes, & Barlaz., 2011). In the managed landfill, solid wastes have been buried in multiple layers and in different times. Therefore, the landfill microbial community would vary by time and location of the landfill depending on nutrient sources and physical and chemical factors in the landfill such as oxygen, pH, temperature, moisture. However, the leachate moving from the top to the bottom would collect most microbial cells and bring them to the leachate holding containment pool. Also, some types of bacteria were affected by contacting oxygen and UV in the containing pool. That is the most likely reason for the difference of community of microorganisms in leachate and solid waste.

141
Figure 8.1 Relative abundance of microorganisms at phylum level (level 2) of taxonomy in solid and leachate phase of landfill
0% 10% 20% 30% 40% 50% 60% 70% 80% 90% 100%
S1
S2
S3
L1
Relative Frequency
Euryarchaeota Thaumarchaeota Acidobacteria
Actinobacteria Armatimonadetes Bacteroidetes
Caldiserica Candidate division BRC1 Candidate division JS1
Candidate division OD1 Candidate division OP11 Candidate division OP8
Candidate division OP9 Candidate division TM7 Candidate division WS6
Chlamydiae Chlorobi Chloroflexi
Deferribacteres Deinococcus-Thermus Elusimicrobia
Fibrobacteres Firmicutes Gemmatimonadetes
Lentisphaerae NPL-UPA2 Nitrospirae
Planctomycetes Proteobacteria SHA-109
Spirochaetae Synergistetes Tenericutes
Thermotogae Verrucomicrobia Unassigned

142
Figure 8.2 Relative abundance of microorganisms at class level (level 3) of taxonomy in solid and leachate phase of landfill
0% 20% 40% 60% 80% 100%
S1
S2
S3
L1
Relative Frequency
Methanobacteria MethanomicrobiaThermoplasmata Miscellaneous Crenarchaeotic GroupAcidobacteria AcidimicrobiiaActinobacteria CoriobacteriiaOPB41 ThermoleophiliaChthonomonadetes BacteroidiaCytophagia FlavobacteriiaSphingobacteriia Bacteroidetes;__Caldisericia Candidate division BRC1;__Candidate division JS1; uncultured bacterium uncultured candidate division JS1 bacteriumCandidate division JS1; uncultured organism Candidate division JS1;__uncultured planctomycete Candidate division OP8; uncultured bacteriumCandidate division OP9; uncultured bacterium Candidate division TM7;__Candidate division WS6;__ ChlamydiaeChlorobia IgnavibacteriaAnaerolineae CaldilineaeChloroflexia DehalococcoidiaChloroflexi;TK10 ThermomicrobiaChloroflexi; uncultured Chloroflexi;__Deferribacteres DeinococciElusimicrobia FibrobacteriaBacilli ClostridiaFirmicutes; OPB54 Firmicutes;__Gemmatimonadetes OligosphaeriaNPL-UPA2; uncultured organism NitrospiraPlanctomycetes; BD7-11 Planctomycetes; MD2896-B258Phycisphaerae PlanctomycetaciaAlphaproteobacteria BetaproteobacteriaDeltaproteobacteria GammaproteobacteriaProteobacteria;__ SHA-109; uncultured bacteriumSpirochaetes SynergistiaMollicutes ThermotogaeVerrucomicrobia; OPB35 soil group OpitutaeSpartobacteria Bacteria;__;__Unassigned;__;__

143
To investigate changes in leachate microbial composition following incubation for five months of leachate with polystyrene thin film and original leachate (coded L1), the analysis of L2 was compared to L1 and are shown in different levels of taxonomy in figure 8.3 and 8.4. From figure 8.3, it could be seen that the microbial community in sample L2 had less diversity compared to sample L1. In sample L2, Phylum of Firmicutes showed absolute abundance with more than 90%; whereas phylum of Actinobacteria and Chloroflexi became minor. However, Microbiota in sample L1 at the phylum level was dominated by Firmicutes, followed by Proteobacteria, Bacteroidetes, Thermotogae, and Synergistetes. The result showed that the microbial community in the leachate had been changed after five months incubated with polystyrene thin film. It was surmised that in the five-month test at 46±0.5 oC, oxygen and nutrient sources gradually, depleted microorganisms that required oxygen and other carbon sources, not polystyrene could not survive. At that time, there was an existence of microorganisms adapting to these changes such as facultative anaerobic and obligate anaerobic microorganisms together with bacterial spores that mainly belonged to the phylum of Firmicutes. The isolation later showed that they belonged to the genus Bacillus and Brevibacillus (Table 8.1).
Figure 8.3 Relative abundance of microbial communities in leachate at phylum level (level 2)
0% 20% 40% 60% 80% 100%
L2
L1
Relative Frequency
Euryarchaeota Thaumarchaeota AcidobacteriaActinobacteria Armatimonadetes BacteroidetesCaldiserica Candidate division BRC1 Candidate division JS1Candidate division OD1 Candidate division OP11 Candidate division OP8Candidate division OP9 Candidate division WS6 ChlamydiaeChloroflexi Elusimicrobia FibrobacteresFirmicutes Lentisphaerae PlanctomycetesProteobacteria Bacteria; SHA-109 SpirochaetaeSynergistetes Tenericutes ThermotogaeVerrucomicrobia Bacteria;__ Unassigned;__

144
Figure 8.4 Relative abundance of microbial communities in leachate at Class level (level 3)
0% 10% 20% 30% 40% 50% 60% 70% 80% 90% 100%
L2
L1
Relative Frequency
Methanobacteria Methanomicrobia
Thermoplasmata Crenarchaeotic Group
Acidobacteria Acidimicrobiia
Actinobacteria Coriobacteriia
Actinobacteria; OPB41 Thermoleophilia
Chthonomonadetes Bacteroidia
Cytophagia Bacteroidetes; SB-1
Sphingobacteriia Bacteroidetes;__
Caldisericia BRC1;__
JS1; uncultured bacterium JS1; uncultured bacterium
JS1; uncultured organism JS1;__
OD1; uncultured Microgenomates bacterium OD1; uncultured epsilon proteobacterium 1025
OP11; uncultured planctomycete OP8; uncultured bacterium
OP9; uncultured bacterium WS6;__
Chlamydiae Anaerolineae
Caldilineae Dehalococcoidia
Chloroflexi; TK10 Chloroflexi; uncultured
Elusimicrobia Fibrobacteria
Bacilli Clostridia
Erysipelotrichia Negativicutes
Firmicutes; OPB54 Firmicutes;__
Lentisphaeria Oligosphaeria
Phycisphaerae Planctomycetacia
Alphaproteobacteria Betaproteobacteria
Deltaproteobacteria Gammaproteobacteria
Proteobacteria;__ SHA-109; uncultured bacterium
Spirochaetes Synergistia
Mollicutes Thermotogae
Verrucomicrobia; OPB35 soil group Opitutae
Spartobacteria Bacteria;__;__
Unassigned;__;__

145
Table 8.1 Identification of isolated bacteria capable of decomposing polystyrene (see chapter 7)
No. Code Genus % Match 1 F1 Bacillus 76.09 2 F2 Bacillus 98.16 3 F3 Brevibacillus 99.75 4 F4 Brevibacillus 99.39 5 F5 Brevibacillus 98.31 6 F6 Brevibacillus 89.68 7 F7 Bacillus 99.60 8 F8 Brevibacillus 99.68

146
Other researchers in several countries have shown that it is possible to isolate specific microorganisms that can degrade polystyrene (Table 8.2). Some of these belong to the Bacillus genus and may in fact be similar to the organisms isolated in the current work. Table 8.2 Microorganisms identified in the published literature able to degrade polystyrene No. Microorganisms Test materials References
1 Enterobacter sp., Citrobacter sedlakii, Alcaligenes sp., Brevundimonas diminuta
high impact polystyrene (HIPS), with decabromodiphenyl oxide and antimony trioxide
Sekhar et al., 2016
2 Bacillus spp. Pseudomonas spp.
brominated high impact polystyrene
Mohan et al.,2016
3 Paenibacillus urinalis, Bacillus sp., Pseudomonas aeruginosa
Expanded polystyrene films
Atiq et al., 2010
4 Rhodococcus ruber Polystyrene flakes Mor and Sivan, 2008
5 Curvularia sp. Chemically oxidized polystyrene
Motta et al., 2009
6 Bacillus sp., Xanthomonas sp., Sphingobacterium sp.
Expanded polystyrene Oikawa et al., 2003
7 Serratia marcescens, Pseudomonas sp. Bacillus sp.
polystyrene-co-maleic anhydride copolymer
Galgali et al., 2002
8 Bacillus coagulans Starch-g-polystyrene copolymers
Kiatkamjornwong et al., 1999

147
8.4 Conclusions
The test of microbial identification in this project helped us have an overview understanding of the microbial community in a managed landfill and its leachate. Due to some limitations in this project, the archaeal community was not identified even though a small portion of archaea could be detected. Archaea have a vital role of converting hydrogen, carbon dioxide and acetic acid to methane. Mori and colleagues reported that archaea accounted for 2-3% of microorganisms in landfill leachate and mainly belonged to genus Methanosaeta converting acetate to methane (Mori et al., 2003). In conclusion, the results showed a massive diversity of microorganisms in the landfill and leachate. The microbial community in the landfill was varied depending on environmental factors inside landfill such as oxygen, carbon source, and pH. Microbial communities in leachate and burial sites are also different. The experiments described in Chapter 7 showed that pure cultures of bacteria from leachate could biodegrade polystyrene to some extent and it is acknowledged that further work is required to describe these eight organisms fully at species and sub species level. Nevertheless, the sequencing studies shown in this chapter that reveal major differences in the microbial populations found in leachate compared to landfill make it reasonable to assume that future work will lead to the isolation of other bacteria from landfill that are also able to digest polystyrene.

148
Chapter 9
SUMMARY AND CONCLUSIONS
9.1 Research concept
Polystyrene is a widely used plastic in many aspects of human life and industries due to its useful characteristics of low cost, lightweight, ease of manufacture, versatility, thermal efficiency, durability, and moisture resistance. Consequently, a huge amount of polystyrene waste has been discarded to the environment every year. Treatment of polystyrene wastes is neither efficient nor effective. Thermal treatment can cause pollution by by-products of the thermal process. Recycling methods have high costs and limited applications and low productivity. Consequently, most polystyrene wastes have been sent to landfill which increases the volume of waste markedly. It has caused a scarcity of landfill space, and increasing costs of disposing of solid wastes. Polystyrene is very stable and extremely hard to degrade in the environment after disposal. Because of its high molecular weight, hydrophobic character, and structural complexity (containing aromatic rings and lacking functional chemical groups in the backbone chain), polystyrene is very resistant to microbial consumption. Moreover, the search for durable materials or very slowly degrading materials has led to the development of many polystyrene additives, such as anti-oxidants, flame retardants, processing lubricants, and stabilisers, which in turn further protects polystyrene from oxidation and biodegradation. To meet the demand for polystyrene and solve the problem of polystyrene wastes, novel modified polystyrenes have been developed by scientists and manufacturers to improve its biodegradability in the environment. Polystyrene can be grafted, blended, or coated with other polymers or substances. Recently, many additives have been developed and applied in polymers with different trade names. It is claimed that the additives help plastics to be biodegraded in the environment with different terms such as “degradable,” “Oxo-degradable,” “Oxo-biodegradable,” “Oxo-green” and “landfill degradable”. Some of the well-known companies are Add-X Biotech

149
(Sweden), EKMDevelopments (Germany), EPI (Canada), Wells Plastics Ltd (British), Willow Ridge Plastics Inc. (US), d2w by Symphony International (England), ENSO Plastics (US). However, degradability of polymers combined with these additives has not been comprehensively tested in a real environment such as landfill or soil. Most polystyrene wastes end up in landfills. Therefore, evaluation of its biodegradability should be carried out in a similar condition. There are some well-known standard tests that can be applied for evaluation of polystyrene wastes in a landfill such as the anaerobic sludge test and the anaerobic digestion test as in ISO 13975:2012, ASTM 5526–12, and ASTM D5511–12 (ISO 13975, 2012; ASTM D5511-12, 2012; ASTM D5526-12, 2012). Most of those tests; however, are carried out in laboratory conditions with good control of test parameters. There are many independent factors in real environments as landfill or soil which can affect biodegradability of plastics. Besides, the test time of these standards is short; typically it lasts from one month to six months. Most of the studies on evaluation of polystyrene biodegradation were conducted in lab conditions and utilised test substances synthesised from low molecular weight pure polystyrene and additives. There are no comprehensive test reports on commercial products of polystyrene so far. Polystyrene can be used as a carbon source for microorganisms similar to many other hydrocarbons. The ability of microorganisms to use polystyrene as a carbon source has been recently established. However, the high molecular weight and structural complexity of polystyrene limits its use as a substrate for enzymatic reactions to take place. Some additives such as starch can attract and support for the initial growth of microorganisms which subsequently attack the polystyrene. In this project, evaluation of biodegradation of commercial products of expanded polystyrene (MPS cups, PS cups) and HIPS lids was conducted in different environments and conditions to find their biodegradability. The MPS cups Code R221 is novel polystyrene, are made from expanded polystyrene beads electrostatically coated with a media capable of supporting the growth of bacteria (Patent US 20120301648A1). The main aim of this research project was to determine the biodegradability of these samples in the landfill where most polystyrene wastes ended up. Besides that, expanded

150
investigations were conducted in landfill leachate and soil to have more information of biodegradability of the polystyrene in different environments. Also, the bacterial community and isolated bacteria involved in polystyrene degradation were also determined.
9.2 Research components and processes involved
9.2.1 Biodegradability of polystyrene in a managed landfill
Polystyrene is widely accepted as non-biodegradable material in the environment. However, recent studies showed that polystyrene could be degraded at a small level (summarised in Table 2.4, chapter 2). This thesis describes experiments in which polystyrene samples were installed at a depth of 11 m inside of the landfill, and the samples were analysed at different times (see chapter 4). Some suitable analytical techniques were employed to investigate the degradation. FESEM observed the morphology of these samples. FTIR and 1H NMR evaluated the chemical structure of polystyrene. GPC analysed possible changes in the molecular weight of polystyrene. Degradation rate was also determined by weight loss after the test. Finally, iodine solution was used to follow the presence of the additive in MPS samples. FESEM micrographs showed microscopic scabrous changes on the surface by formation of pits and holes in both MPS cups and PS cups indicating degradation of polystyrene. HIPS lids had slight erosion on their surfaces. Chemical structure of polystyrene was also slightly transformed as seen with 1H NMR and FTIR by changes in intensities of peaks in different regions of spectra and the formation of new peaks. These changes are suggestive of depolymerisation. The molecular weight of polystyrene of MPS and PS was slightly decreased as determined by GPC. The additive in MPS cups was shown to have disappeared used iodine testing. The results obtained in the landfill test showed definite signs of degradation. However, the degradation could be only observed at a micro level. These results were found in the test samples of 356 days and could not find elsewhere in the test sample of 76 days, 165 days, and 257 days indicating that decomposition was quite slow. Also, the degradation rate could not be determined because of increase of final weight of test samples due to attachment of solid particles in the test environment. Another concern was that the degradation might be affected by unknown chemical and physical

151
factors in the landfill because of a diversity of garbage component in the landfill. It was unfortunate that the leachate levels in this experiment fluctuated wildly, resulting in the samples being exposed to leachate for much shorter time period than anticipated.
9.2.2 Biodegradability of polystyrene in landfill leachate under laboratory conditions
Biodegradation of plastics is described as the process whereby the microorganisms use the plastics as sources of carbon & energy (Selke et al., 2015). In anaerobic conditions, biodegradation of plastics can evolve biogas mainly containing methane and carbon dioxide. Measuring the amount of biogas can help to determine the biodegradation rate of the plastic. In the earlier test in the landfill, the test samples had signs of degradation; however, any evolving gas could not be measured. So, this experiment was set up in the laboratory to simulate landfill conditions using dedicated gas sampling bags to measure any evolved gases and hence determine the biodegradation rate. In this simulation test, the landfill leachate was used as a source of microorganisms to investigate biodegradation of polystyrene samples (MPS, PS, HIPS) at 46±0.5 oC within 90 days. Control samples in which the leachate was autoclaved to inactivate the microorganisms and act as a negative control, and in which cardboard was used as a positive control to replace polystyrene samples. Also, a similar test was conducted at room temperature to expand understanding of polystyrene degradation in different conditions (details in chapter 5). After 90 days of the test, there was no gas found in the treated samples of polystyrene (MPS, PS, HIPS) and negative control samples. However, a small amount of gas was found in samples of the positive control by degradation of cardboard (cellulose). FESEM micrographs of the test samples showed microscopic changes on the surface of polystyrene samples that was similar to results in the landfill test. There was no change found in samples of the negative control. The results of FESEM in the lab test were interpreted as indicating that the degradation was most likely caused by microorganisms in the landfill. Also, FTIR and 1H NMR showed slight changes in peak intensities in different regions of the spectra and these were interpreted as signs of depolymerisation. Compared to the landfill tests, the changes observed in this experiment were very slight. The short time of the

152
test (90 days) may also be a contributing reason for the lesser change in the polymer structure In conclusion, the results of the lab tests indicated that microorganisms in the landfill could decompose polystyrene. The fact that the polystyrene biodegradation was manifested at a low level may be due to the time limitation of the experiment.
9.2.3 Biodegradability of polystyrene in garden soil
Two previous tests in the landfill and laboratory with leachate showed signs of biodegradation of polystyrene even though the biodegradation was at a low level. Some studies recently reported that polystyrene and modified polystyrene (blended or grafted with starch) could be degraded in soil by microorganisms (Atiq et al., 2010; Nikolic et al., 2014; Oliveira et al., 2010). Also, Mehboob and colleagues stated that aromatic hydrocarbons were rather more persistent in anoxic condition than in aerobic conditions because aerobic microorganisms used molecular oxygen for the initial activation of degradation (Mehboob et al., 2010). Therefore, an experiment was carried out to expand understanding of biodegradability of polystyrene in garden soil where there was some level of oxygenation of the soil. The cups of MPS and MP were buried in garden soil (mixed topsoil and manure compost at the ratio of 1:1 v/v) and then growing coriander on the top. The water supplied for growing the coriander would support moisture for microorganisms in the soil. After six months of testing, the polystyrene samples were evaluated for their biodegradability by FESEM, 1H NMR, and FTIR (see chapter 6). The results showed that foam cups of MPS and PS could be degraded in garden soil. However, the biodegradation was minimal. The degradation could be observed via slight changes in the chemical structure shown in spectra of FTIR and 1H NMR analyses, and changes in physical characteristic shown in the image of visual observation and FESEM. This result was similar to the report of Atiq and colleagues that soil bacteria could decompose polystyrene but at an extremely slow rate (Atiq et al., 2010).

153
9.2.4 Bacterial isolation and polystyrene biodegradation by isolated bacteria
Previous tests in the present project showed that polystyrene could be degraded by microorganisms in the landfill, leachate, and soil. The biodegradation rate, however, was still low. It was surmised that the abundance of other organic carbon sources was possibly one of causes of extremely low biodegradation rate of polystyrene. Recently, some studies reported that pure bacteria isolated from the environment could increase biodegradation rate of polystyrene (Mor & Sivan, 2008; Shekhar et al., 2016; Yang et al., 2015b). Therefore, experiments were undertaken to isolate microorganisms from the landfill leachate that could degrade polystyrene and use it as a carbon source. The isolated strains were used to evaluate their biodegradability of polystyrene film as a sole source of carbon. The polystyrene film (TFMPS) was made from MPS cups by a surface casting technique (see chapter 7). There were eight bacterial strains isolated from the landfill leachate that used polystyrene as a carbon source. These strains could degrade the thin film of modified polystyrene (converted from the MPS cups) in mineral salt medium containing polystyrene as a sole carbon source. The highest degradation rate was up to 12.5% by weight loss after 90 days of incubation.
9.2.5 Identification of the microbial communities in a managed landfill and in leachate
Setting up a biodegradation test in a managed landfill was strategically and physically complicated and the decision was made to use bacteria from the landfill leachate in laboratory tests to complement the field tests. However, it was then necessary to determine if the microbial communities in landfills and leachate were similar and could replace each other. Also, an understanding of microbial communities in landfill and leachate was also necessary. These analyses would show microbial composition, their correlation and the variety of microorganisms in landfill and leachate (see chapter 8). Genomic DNAs of the samples were extracted and purified by PCR before sequencing by an Illumina MiSeq next-generation sequencer. The raw data of DNA sequencing were used for bioinformatics analysis with Qiime 2 and MG-RAST (details in chapter 8).

154
The results of bioinformatics analysis showed a massive diversity of microorganisms in the landfill and leachate, with many of them possibly uniquely new species. The microbial community in the landfill showed variation over time presumably dependent on environmental factors. There was a considerable difference in microbial communities between leachate and landfill. Therefore, it may not be optimal to use microbial communities in leachate for evaluation of biodegradability instead of doing the experiment in situ in a landfill. My studies also found that the eight bacterial strains isolated from the leachate in chapter 7 all showed abilities to degrade polystyrene and all belonged to the genus Bacillus or Brevibacillus. These organisms appear to not normally exist in high concentrations in landfill sites. But the fact that such organisms have been reported offers opportunities for commercialisation of cultures for application to the managed landfill.
9.3 General conclusion and application of this research
Biodegradation of plastic is a complex process caused by the activity of many microbial enzymes. Due to their structural complexity (e.g. containing the aromatic ring and few functional groups), high molecular weight (polymerisation) and hydrophobicity, most of the synthetic plastics are persistent in the natural environment or degrade at a prolonged slow rate. Similar to other synthetic plastics, it was accepted that polystyrene could not degrade in the natural environment. Recently, some studies carried out in lab conditions have reported that microorganisms could degrade both polystyrene and modified polystyrene (grafted or blended with other natural degradable compositions) in the environment or after pure isolation. Thus it is reinforcing the belief that soon scientists will be able produce polystyrene that can be decomposed in the natural environment. So far, there have been no reports on polystyrene biodegradation in the landfill where most polystyrene wastes end up. This project is the first to report on biodegradation of polystyrene in a managed landfill. Complementary experiments revealed that polystyrene could be degraded in soil and in the laboratory by landfill leachate but in every case at a very slow rate. This result correlates well with some previous studies that also showed that biodegradation of polystyrene was possible even though the test conditions of the present research and the previous ones were very different. One of the drawbacks in this project is the lack of direct and reliable method for quantifying the degradation rate. The analytical methods (FESEM, GPC,

155
FTIR, 1H NMR, and GC-MS) used in the present study are extremely precise and are very useful but are technically difficult to use in field studies. Some earlier research showed that only starch in modified polystyrene was degraded and not the polystyrene itself. However, this project showed that besides starch, polystyrene could be degraded by microorganisms forming intermediate compounds such as 2-phenyl ethanol, phenylacetaldehyde, and styrene oxide. When one compares these MPS findings with the results with PS it is possible to conclude that the starch additive is able to be removed from the polystyrene, but further changes seen with PS indicate that the polystyrene itself is attacked on incubation in soil, leachate, and landfill. An indication showed that some organisms have the enzymatic ability to degrade this recalcitrant polymer, even though ever so slowly. The graft or blend of starch into polystyrene leads to an inevitable increase in polydispersity that theoretically can help increase biodegradation rate. Starch can increase the polymer's ability to retain water and stimulate the polymer's breakdown of microorganisms. However, this research could not find a correlation between the additive (starch) in MPS cups and biodegradation rate of polystyrene. We surmised that low levels of additives might not be enough to promote the growth of microorganisms involved in the decomposition of polystyrene. The degradation rate of polystyrene in landfills may depend on the characteristics of the solid waste (e.g., composition and age of the refuse) and ambient factors (e.g., the presence of oxygen in the landfill, moisture content, and temperature). This study provides a holistic view for plastics scientists and producers to develop modified polystyrene that can be decomposed in the landfill and also to find a suitable test method for the biodegradation. The eight isolated microbes that decomposed polystyrene were found to be common in the landfill. It offers opportunities for commercialisation of cultures for application to the managed landfill. Researchers in several countries have shown that it is possible to isolate specific microorganisms that can degrade polystyrene, but these organisms appear not usually to exist in high concentrations in landfill sites.

156
9.4 Future research
Due to the sophisticated features of landfill ecosystems, safety management in landfill experiments, and the limitation on technology and knowledge, the research gaps still exist and will continue to exist. The research work based on this project suggests some areas that require further investigations in the future, which include: 1. Investigation of polystyrene biodegradation in a different ratio of starch to find the best ratio for biodegradability of polystyrene. In the present research, the amount of starch in the MPS cup was 0.5%wt. The higher the starch content, the higher the permeability and the microbial growth (Gray, 2011). Hydrophobicity is one of the causes of reduced biodegradability of polystyrene and the starch additive leads to a decrease in hydrophobicity when in an aqueous environment. Eco-smart is marketed as a biodegradable plastic with Eco-Smart® additive loaded at 0.7–4% by weight to polypropylene materials to increase their biodegradation rate. (http://www.castawayfoodpackaging.com.au/). Sadrieva and colleagues found that an increase in the additive (starch) from 5 to 10 wt. % had no significant influence on the temperature characteristics of the polystyrene but accelerated the degradation process on exposure to soil microorganisms (Sadrieva et al., 2013).Oliveira and colleagues similarly reported that an increase in the content of starch contributed to increasing biodegradability (Oliveira et al., 2010). The rate of bacterial growth depended on the relative ease with which microorganisms could access the starch phase. Schlemmer et al., also reported that the presence of starch at contents of 50% or greater improved the degradation of the blends (Schlemmer et al., 2009). 2. Investigation of modified polystyrene biodegradability in different methods of mixing of polystyrene and starch: grafting, blending, and coating to find a suitable method that can improve biodegradation rate. Typically, plastic polymers are too large to pass through the cell membrane of microorganisms. So, the biodegradation must start by fragmentation of polymers by secreted microbial enzymes to break the polymer to smaller fragments. These fragments can be further degraded and mineralised within microbial cells (Shah et al., 2008). Grafting method may seem to be useful for biodegradation because polymer chains can be broken down from the
157
middle of the chain promoting fragmentation and then further mineralisation. Each mixing method probably has its advantage and disadvantage owing to its effect on mechanical properties of polystyrene. Therefore, in order to ensure harmony regarding product endurance and biodegradability, further research is still needed. 3. Mechanism of biodegradation of polystyrene and degradation by-products should be studied. Some intermediate compounds of polystyrene degradation have been found so far, but no reports on a mechanism of the biodegradation have been reported (Atiq et al., 2010; Kundu et al., 2014; Mohan et al., 2016; Sekhar et al., 2016; Yang et al., 2015b). Also, it is crucial to define between biodegradation and fragmentation of polymer as some polymers may be involved in fragmentation that creates micro plastics causing secondary pollution (see chapter 2). 4. Enzymes involved in the biodegradation process should be isolated and identified. Enzymes could lead to production in an industrial scale of plastic-depolymerising enzymes for future application. Although there has been some research on polystyrene degradation so far (summarised in Table 2.4, chapter 2), there were few studies elucidating what enzymes were involved in the biodegradation. 5. Genes involved in biodegradation could be studied in detail. The isolated gene could be cloned and transferred to none- harmful bacteria for further research and application. 6. Appropriate methods for assessing the biodegradability of plastics should be investigated. The current method is based on compost as a substrate whereas most plastic wastes end up in landfills that have different environmental parameters from compost. Secondly the duration of the test is very important. In the early stage of biodegradation, some additives for biodegradation (e.g. starch) will be degraded first followed by the biodegradation of the polymer chains of the plastics. Sufficient time must be allowed to allow any such degradation to be measured. Moreover, the growth of microorganisms in field conditions is very dependent on the ambient environment such as pH, oxygen, temperature, carbon

158
source, and the biological community. In a landfill, for example, these factors change during the degradation. In the first stage, the amount of oxygen and organic carbon sources is still abundant; the aerobic microorganisms will thrive. The steady growth of the group of aerobic microorganisms will deplete the oxygen, pH, organic carbon source and increase temperature inside the landfill. At this time, the facultative microorganisms will increase and then there will be a selective change to f anaerobic bacteria. Easily consumable carbon sources will begin to be depleted, and then the microorganisms will use carbon sources that are much more difficult to decompose. Polymer chains then become the targeted carbon source and may be able to be broken down at this stage. Therefore, biodegradation of plastics can take a long time. 7. Further field-scale trials should be done for bioremediation of plastic waste in contaminated landfill sites. Such tests would give an overview of the mechanism of biodegradability of plastics and the organisms involved. In view of the safety and procedural difficulties of working in a commercial landfill site, a simulation of landfill condition should be carried out on a small scale. Particular emphasis could then be placed on ensuring the test area was continually moist by recycling the landfill leachate to study area. In my experiment the landfill leachate was not recycled due to procedural difficulties with the commercial partner and hence the test materials spent a large amount of the time of the experiment in dry conditions. It may be a reason why there have been no published reports on plastic degradation in landfills so far.

159
REFERENCES
A’Vard, D., & O’Farrell, K. (2013). 2011–12 National Plastics Recycling Survey - Final Report. Plastics and Chemicals Industries Association: Sustainable Resource Use Pty Ltd (ABN 52 151 861 602).
Adamcova, D., & Vaverkova, M. (2014). Degradation of Biodegradable-Degradable Plastics in Municipal Solid-Waste Landfill. Polish Journal of Environmental Studies, 23(4), 1071-1078.
Adamcova, D., Radziemska, M., Zloch, J., Dvorackova, H., Elbl, J., Kynicky, J., Brtnicky, M., & Vaverkova, M. D. (2018). Sem analysis and degradation behavior of conventional and bio-based plastics during composting. Acta universitatis agriculturae et silviculturae mendelianae brunensis, 66(2), 349-356.
Alaee, M., Arias, P., Sjodin, A., & Bergman, A. (2003). An overview of commercially used brominated flame retardants, their applications, their use patterns in different countries/regions and possible modes of release. Environment International 29, 683–689.
Albertsson, A. C., & Karlsson, S. (1993). Aspects of Biodeterioration of Inert and Degradable Polymers. In ternational Biodeterioration & Biodegradation, 31, 161-170.
Albertsson, A. C., Andersson, S. O., & Karlsson, S. (1987). The Mechanism of Biodegradation of Polyethylene. Polymer Degradation and Stability, 18, 73-87.
Ali, H. E., & Ghaffar, A. A. M. (2017). Preparation and Effect of Gamma Radiation on The Properties and Biodegradability of Poly(Styrene/Starch) Blends. Radiation Physics and Chemistry, 130, 411-420.
Al-Salem, S. M. (2009). Influence of natural and accelerated weathering on various formulations of linear low density polyethylene (LLDPE) films. Materials and Design, 30, 1729-1736.
American Chemistry Council. (2015, February 9). The Safety of Styrene-Based Polymers for Food-Contact Use 2013. Retrieved 2016 from:

160
https://www.plasticfoodservicefacts.com/wp-content/uploads/2017/10/Polystyrene-Report.pdf.
Aminudin, E., Din, M. F. M., Mohamad, Z., Noor, Z. Z., & Iwao, K. (2011). A Review on Recycled Expanded Polystyrene Waste as Potential Thermal Reduction in Building Materials. Paper presented at the International Conference on Environment and Industrial Innovation IPCBEE.
Ammala, A., Bateman, S., Dean, K., Petinakis, E., Sangwan, P., Wong, S., Yuan, Q., Yu, L., Patrick, C., & Leong, K. H. (2011). An overview of degradable and biodegradable polyolefins. Progress in Polymer Science, 36(8), 1015-1049.
Andrady, A. L. (2011). Microplastics in the marine environment. Marine Pollution Bulletin, 62(8), 1596-1605.
Arsanit (2017). Polystyrene foams with nanosilver. Retrieved 2016 March from: http://arsanit.pl/polystyrene-foams-with-nanosilver/
Artham, T., & Doble, M. (2008). Biodegradation of aliphatic and aromatic polycarbonates. Macromolecular Bioscience, 8(1), 14-24.
Asmita, K., Shubhamsingh, T., & Tejashree, S. (2015). Isolation of Plastic Degrading Micro-organisms from Soil Samples Collected at various locations in Munbai, India. International Research Journal of Environment Sciences, 4(3), 77-85.
ASTM D5210-92(2007). Standard Test Method for Determining the Anaerobic Biodegradation of Plastic Materials in the Presence of Municipal Sewage Sludge. ASTM International, West Conshohocken, PA, 2007. Retrieved 2015 from: www.astm.org
ASTM D5338-11. Standard Test Method for Determining Aerobic Biodegradation of Plastic Materials Under Controlled Composting Conditions, Incorporating Thermophilic Temperatures. ASTM International, West Conshohocken, PA, 2011. Retrieved 2017 from: www.astm.org
ASTM D5511-12. Standard test method for determining anaerobic biodegradation of plastic materials under high-solids anaerobic-digestion conditions. ASTM International, West Conshohocken, PA, 2012. Retrieved 2016 from: www.astm.org

161
ASTM D5526-12. Standard test method for determining anaerobic biodegradation of plastic materials under accelerated landfill conditions. ASTM International, West Conshohocken, PA, 2012. Retrieved 2016 from: www.astm.org.
ASTM D5988-18. Standard Test Method for Determining Aerobic Biodegradation of Plastic Materials in Soil. ASTM International, West Conshohocken, PA, 2018. Retrieved 2018 from: www.astm.org
ASTM D6400-04. Standard Specification for Compostable Plastics. ASTM International, West Conshohocken, PA, 2004. Retrieved 2017 from: www.astm.org
ASTM D6691-09. Standard Test Method for Determining Aerobic Biodegradation of Plastic Materials in the Marine Environment by a Defined Microbial Consortium or Natural Sea Water Inoculum. ASTM International, West Conshohocken, PA, 2009. Retrieved 2017 from: www.astm.org
ASTM D7081-05. Standard Specification for Non-Floating Biodegradable Plastics in the Marine Environment. ASTM International, West Conshohocken, PA, 2005. Retrieved 2014 from: www.astm.org
ASTM D7473-12. Standard test method for weight attrition of plastic materials in the marine environment by open system aquarium incubations. ASTM International, West Conshohocken, PA, 2012. Retrieved 2016 from: www.astm.org
ASTM D7475-11. Standard Test Method for Determining the Aerobic Degradation and Anaerobic Biodegradation of Plastic Materials under Accelerated Bioreactor Landfill Conditions. ASTM International, West Conshohocken, PA, 2011. Retrieved 2015 from: www.astm.org
Atiq, N., Ahmed, S., Ali, M. I., Andleeb, S., Ahmad, B., & Robson, G. (2010). Isolation and identification of polystyrene biodegrading bacteria from soil. African Journal of Microbiology Research, 4(14), 1537-1541.
Bevington, J. C., & Huckerby, T. N. (2006). Studies of end-groups in polystyrene using 1H NMR. European Polymer Journal, 42, 1433-1436.

162
Bhardwaj, H., Gupta, R., & Tiwari, A. (2013). Communities of Microbial Enzymes Associated with Biodegradation of Plastics. Journal of Polymers and the Environment, 21(2), 575-579.
Brennan, L. B., Isaac, D. H., & Arnold, J. C. (2002). Recycling of acrylonitrile–butadiene–styrene and high impact polystyrene from waste computer equipment. Journal of Applied Polymer Science, 86, 572-578.
Callahan, B. J., McMurdie, P. J., Rosen, M. J., Han, A. W., Johnson, A. J. A., & Holmes, S. P. (2016). DADA2: High-Resolution Sample Inference from Illumina Amplicon Data. Nature Methods, 13(7), 581-583.
Caporaso, J. G., Kuczynski, J., Stombaugh, J., Bittinger, K., Bushman, F. D., Costello, E. K., Fierer, N., Peña, A. G., Goodrich, J. K., Gordon, J. I., Huttley, G. A., Kelley, S. T., Knights, D., Koenig, J. E., Ley, R. E., Lozupone, C. A., Mcdonald, D., Muegge, B. D., Pirrung, M., Reeder, J., Sevinsky, J. R., Turnbaugh, P. J., Walters, W. A., Widmann, J., Yatsunenko, T., Zaneveld, J., & Knight, R. (2010). QIIME Allows Analysis of High-Throughput Community Sequencing Data. Nature Methods, 7(5), 335-336.
Chemistry Research and Applications. (2014). Polystyrene: Synthesis, characteristics and applications (C. LYNWOOD Ed.). New York: Nova Science Publishers, Inc.
Chinaglia, S., Tosin, M., & Degli-Innocenti, F. (2018). Biodegradation rate of biodegradable plastics at molecular level. Polymer Degradation and Stability, 147, 237-244.
Cran, M. J. (2011). Testing the anaerobic biodegradability of modified polystyrene beverage lids and foam cups. Final report for Remma industries & Services Pty Ltd (pp. 1-6): Victoria University, Melbourne Australia (Internal document).
Crawford, Blair, C., & Quinn, B. (2016). The biological impacts and effects of contaminated microplastics.Microplastic Pollutants (pp. 159-178). ProQuest Ebook central: Elsevier Science & Technology. Retrieved from: http://ebookcentral.proquest.com/lib/newcastle/detail.action?docID=4747929.
CSIRO. (n.d.). Biodegradation Test Facilities at CSIRO. Biodegradable Plastics - Testing according to Australian Standard AS 4736. Retrieved 2017 March 27 from: www.csiro.au.

163
Daneman, M. (2013). More cities ban polystyrene foam, citing environment. Retrieved 2018 from: https://www.usatoday.com/story/news/nation/2013/12/21/polystyrene-foam-ban/4141835/
Dehaut, A., Cassone, A. L., Frere, L., Hermabessiere, L., Himber, C., Rinnert, E., Rivière, G., Lambert, C., Soudant, P., Huvet, A., Duflos, G., & Paul-Pont, I. (2016). Microplastics in seafood: Benchmark protocol for their extraction and characterization. Environmental Pollution, 215, 223-233.
Drake, A. (2012). Disposable plastic in Australia - facts and statistics. Biorene. Retrieved 2015 March from: http://www.biorene.com.au/the-facts/disposable-plastic-in-australia-facts-and-statistics/.
Elashmawi, I. S., N.A. Hakeem, and E.M. Abdelrazek. Spectroscopic and thermal studies of PS/PVAc blends. Physica. B. 2008; 403:3547– 3552.
EN 14047:2002. Packaging. Determination of the ultimate aerobic biodegradability of packaging materials in an aqueous medium. Method by analysis of evolved carbon dioxide. 2002.
EN 14048:2002. Packaging. Determination of the ultimate aerobic biodegradability of packaging materials in an aqueous medium. Method by measuring the oxygen demand in a closed respirometer. 2002.
EPA (2014). Wastes - Resource Conservation - Common Wastes & Materials: Plastic. U.S. Environmental Protection Agency. Retrieved 2015 from: http://www.epa.gov/epawaste/conserve/materials/plastics.htm
Galgali, P., Varma, A. J., Puntambekar, U. S., & Gokhale, D. V. (2002). Towards biodegradable polyolefins: Strategy of anchoring minute quantities of monosaccharides and disaccharides onto functionalized polystyrene, and their effect on facilitating polymer biodegradation. Chemical Communications, 0(23), 2884-2885.
Ghosh, S. K., Pal, S., & Ray, S. (2013). Study of microbes having potentiality for biodegradation of plastics. Environmental Science and Pollution Research, 20(7), 4339-4355.
Gray, J. E. (2011). Polystyrene: properties, performance, and applications J. E. Gray (Ed.)

164
Grossman, R.F., & Lutz J.T.J.( 2001). Polymer modifiers and additives. Edited by Marcel Dekker, INC., New York. ISBN: 0-8247-9949-6.
Hinojosa, I. A., & Thiel, M. (2009). Floating marine debris in fjords, gulfs and channels of southern Chile. Marine Pollution Bulletin, 58, 341-350.
http://www.castawayfoodpackaging.com.au/
ISO 10210:2012. Plastics -- Methods for the preparation of samples for biodegradation testing of plastic materials. Retrieved 2017 from: www.iso.org
ISO 13975:2012. Plastics: determination of the ultimate anaerobic biodegradation of plastic materials in controlled slurry digestion systems: method by measurement of biogas production. Retrieved 2016 from: www.iso.org
ISO 14851:1999. Determination of the ultimate aerobic biodegradability of plastic materials in an aqueous medium: method by measuring the oxygen demand in a closed respirometer. Retrieved 2016 from: www.iso.org
ISO 14852: 2018. Determination of the ultimate aerobic biodegradability of plastic materials in an aqueous medium: method by analysis of evolved carbon dioxide. Retrieved 2018 from: www.iso.org
ISO 14855-2:2018. Determination of the ultimate aerobic biodegradability of plastic materials under controlled composting conditions: method by analysis of evolved carbon dioxide. Part 2: gravimetric measurement of carbon dioxide evolved in a laboratory-scale test. Retrieved 2018 from: www.iso.org
ISO 17088:2012. Specifications for compostable plastics. Retrieved 2018 from: www.iso.org
ISO/DIS 17556. Plastics: determination of the ultimate aerobic biodegradability of plastic materials in soil by measuring the oxygen demand in a respirometer or the amount of carbon dioxide evolved. Retrieved 2018 from: www.iso.org
Jasso, C. F. G., González‐Ortiz, L. J. R., Contreras, J. R., Mendizabal, M. E., & Mora, G. J. (2004). The degradation of high impact polystyrene with and without starch in concentrated activated sludge. Polymer Engineering and Science, 38(5), 863-869.

165
Kale, S. K., Deshmukh, A. G., Dudhare, M. S., & Patil, V. B. (2015). Microbial degradation of plastic: a review. Journal of Biochemical Technology, 6(1), 952-961.
Kannan, P., Biernacki, J. J., Visco, D. P., & Lambert, W. (2009). Kinetics of thermal decomposition of expandable polystyrene in different gaseous environments. Journal of Analytical and Applied Pyrolysis, 84, 139-144.
Kaplan, D. L., Hartenstein, R., & Sutter, J. (1979). Biodegradation of Polystyrene, poly methyl methacrylate and phenol formaldehyde. Applied and Environmental Microbiology, 38(3), 551-553.
Khaksar, M. R., & Ghazi-Khansari, M. (2009). Determination of migration monomer styrene from GPPS (general purpose polystyrene) and HIPS (high impact polystyrene) cups to hot drinks. Toxicology Mechanisms and Methods, 19(3), 257-261.
Kiatkamjornwong, S., Sonsuk, M., Wittayapichet, S., Prasassarakich, P., & Vejjanukroh, P. C. (1999). Degradation of styrene-g-cassava starch filled polystyrene plastics. Polymer Degradation and Stability, 66, 323-335.
Krueger, M. C., Seiwert, B., Prager, A., Zhang, S., Abel, B., Harms, H., & Schlosser, D. (2017). Degradation of polystyrene and selected analogues by biological Fenton chemistry approaches: Opportunities and limitations. Chemosphere, 173, 520-528.
Kukut, M., Karal-Yilmaz, O., & Yagci, Y. (2013). Synthesis, characterization, and hydrolytic degradation of graft copolymers of polystyrene and aliphatic polyesters. Designed Monomers and Polymers, 16(3), 233-240.
Kundu, D., Hazra, C., Chatterjee, A., Chaudhari, A., & Mishra, S. (2014). Biopolymer and biosurfactant-graft-calcium sulfate/polystyrene nanocomposites: Thermophysical, mechanical and biodegradation studies. Polymer Degradation and Stability, 107, 37-52.
Lambert, S., & Wagner, M. (2016). Formation of microscopic particles during the degradation of different polymers. Chemosphere, 161, 510-517.
Laur, E., Kirillov, E., & Carpentier, J. F. (2017). Engineering of Syndiotactic and Isotactic Polystyrene-Based Copolymers via Stereoselective Catalytic Polymerization. Molecules, 22, 1-31.

166
Lefebvre, M. S. M. (2012). US Patent No. 20120301648A1: U. S. P. A. Publication.
Leja, K., & Lewandowicz, G. (2010). Polymer Biodegradation and Biodegradable Polymers - a Review. Polish Journal of Environmental Studies, 19(2), 255-266.
Lucas, N., Bienaime, C., Belloy, C., Queneudec, M., Silvestre, F., & Nava-Saucedo, J. E. (2008). Polymer biodegradation: Mechanisms and estimation techniques - A review. Chemosphere, 73, 429-442.
McIlroy, T. (2015). Shane Rattenbury considers ACT polystyrene ban. Retieved from https://www.canberratimes.com.au/national/act/shane-rattenbury-considers-act-polystyrene-ban-20150202-133kvb.html
Meenakshi, P., Noorjahan, S. E., Rajini, R., Venkateswarlu, U., Rose, C., & Sastry, T. P. (2002). Mechanical and microstructure studies on the modification of CA film by blending with PS. Bulletin of Materials Science, 25(1), 25-29.
Mehboob, F., Weelink, S., Saia, F. T., Junca, H., Stams, A. J. M., & Schraa, G. (2010). Microbial Degradation of Aliphatic and Aromatic Hydrocarbons with (Per) Chlorate as Electron Acceptor. In T. KN (Ed.), Handbook of Hydrocarbon and Lipid Microbiology: Springer-Verlag Berlin Heidelberg.
Meyer, F., Paarmann, D., D'Souza, M., Olson, R., Glass, E. M., Kubal, M., Paczian, T., Rodriguez, A., Stevens, R., Wilke, A., Wilkening, J., & Edwards, R. A. (2008). The metagenomics RAST server – a public resource for the automatic phylogenetic and functional analysis of metagenomes. BMC Bioinformatics, 9(386), 1-8.
Milstein, O., Gersonde, R., Huttermann, A., Chen, M. J., & Meister, J. J. (1992). Fungal biodegradation of lignopolystyrene graft copolymers. Applied and Environmental Microbiology, 58(10), 3225-3232.
Milstein, O., R. Gersonde, A. Huttermann, R. Frund, H. J. Feine, H. D. Ludermann, M. J. Chen, and J. J. Meister. Infrared and nuclear magnetic resonance evidence of degradation in thermoplastics based on forest products. J. Environ. Polym. Degrad. 1994; 2(2): 137-152.

167
Mohamed, A., Gordon, S. H., & Biresaw, G. (2007). Polycaprolactone/polystyrene bioblends characterized by thermogravimetry, modulated differential scanning calorimetry and infrared photoacoustic spectroscopy. Polymer Degradation and Stability, 92, 1177-1185.
Mohan, A. J., Sekhar, V. C., Bhaskar, T., & Nampoothiri, K. M. (2016). Microbial assisted High Impact Polystyrene (HIPS) degradation. Bioresour Technol, 213, 204-207.
Mooney, A., Ward, P. G., & O’Connor, K. E. (2006). Microbial degradation of styrene: biochemistry, molecular genetics, and perspective for biotechnical applications. Appl Microbiol Biotechnol, 72, 1-10.
Moore, G.F, & Saunders, S.M. (1997) Advances in biodegradable polymers. Vol. 9. Shawbury (UK): Rapra Technology Limited.
Mor, R., & Sivan, A. (2008). Biofilm formation and partial biodegradation of polystyrene by the actinomycete Rhodococcus ruber: biodegradation of polystyrene. Biodegradation, 19(6), 851-858.
Mori, K., Sparling, R., Hatsu, M., & Takamizawa, K. (2003). Quantification and diversity of the archaeal community in a landfill site. Canadian Journal of Microbiology, 49, 28-36.
Motta, O., Proto, A., Carlo, F. D., Caro, F. D., Santoro, E., Brunetti, L., & Capunzo, M. (2009). Utilization of chemically oxidized polystyrene as co-substrate by filamentous fungi. Int. J.Hyg.Environ.Health, 212, 61-66.
Muller, R. J. (2005). Biodegradability of Polymers: Regulations and Methods for Testing Biopolymers. Online (Vol. 12, pp. 365-388): Wiley-VCH Verlag GmbH & Co. KGaA.
Nagai, N., Matsunobe, T., & Imai, T. (2005). Infrared analysis of depth profiles in UV-photochemical degradation of polymers. Polymer Degradation and Stability, 88, 224-233.
Naz, I., Batool, S. A., Ali, N., Khatoon, N., Atiq, N., Hameed, A., & Safia, A. (2013). Monitoring of growth and physiological activities of biofilm during succession on polystyrene from activated sludge under aerobic and anaerobic conditions. Environ Monit Assess, 185(8), 6881-6892.

168
Nikolic, V., Velickovic, S., & Popovic, A. (2014). Biodegradation of polystyrene-graft-starch copolymers in three different types of soil. Environ Sci Pollut Res Int, 21(16), 9877-9886.
Nikolic, V., Velickovic, S., Antonovic, D., & Popovic, A. (2013). Biodegradation of starch–graft–polystyrene and starch–graft–poly(methacrylic acid) copolymers in model river water. Journal of the Serbian Chemical Society, 78(9), 1425-1441.
Oikawa, E., Linn, K. T., Endo, T., Oikawa, T., & Ishibashi, Y. (2003). Isolation and Characterization of Polystyrene Degrading Microorganisms for Zero Emission Treatment of Expanded Polystyrene. Environmental Engineering Research, 40, 373-379.
Ojeda, T., Freitas, A., Dalmolin, E., Pizzol, M. D., Vignol, L., Melnik, J., Jacques, R., Bentof, F., & Camargo, F. (2009). Abiotic and biotic degradation of oxo-biodegradable foamed polystyrene. Polymer Degradation and Stability, 94(12), 2128-2133.
Oliveira, C. I. R., Cunha, F. R., & Andrade, C. T. (2010). Evaluation of biodegradability of different blends of polystyrene and starch buried in soil. Macromolecular Symposia, 290, 115-120.
Otake, Y., Kobayashi, T., Asabe, H., Murakami, N., & Ono, K. (1995). Biodegradation of low‐density polyethylene, polystyrene, polyvinyl chloride, and urea formaldehyde resin buried under soil for over 32 years. Journal of Applied Polymer Science, 56(13), 1789 - 1796.
Palmisano, A. C., & Pettigrew, C. A. (1992). Biodegradability of Plastics. Bioscience, 42(9), 680-685.
Polystyrene packing Council. (n.d). Polystyrene Facts – Educational Facts About Polystyrene. Retrieved 2018 from: http://www.polystyrenepackaging.co.za/educationalinformation.htm.
Pticek, A., Hrnjak-Murgic, Z., & Jelencic, J. (2007). Effect of the structure of ethylene-propylene-diene-graft-polystyrene graft copolymers on morphology and mechanical properties of SAN/EPDM blends. eXPRESS Polymer Letters, 1(3), 173–179.

169
Pushpadass, H. A., Weber, R. W., Dumais, J. J., & Hanna, M. A. (2010). Biodegradation characteristics of starch-polystyrene loose-fill foams in a composting medium. Bioresour Technol, 101(19), 7258-7264.
Raberg, U., & Hafren, J. (2008). Biodegradation and appearance of plastic treated solid wood. International Biodeterioration and Biodegradation, 62(2), 210-213.
Rani, M., Shim, W. J., Jang, M., Han, G. M., & Hong, S. H. (2017). Releasing of hexabromocyclododecanes from expanded polystyrenes in seawater -field and laboratory experiments. Chemosphere, 185, 798-805.
Rizzatti, G., Lopetuso, L. R., Gibiino, G., Binda, C., & Gasbarrini, A. (2017). Proteobacteria: A Common Factor in Human Diseases. BioMed Research International, 2017, 1-7.
Rubio, M. R. (2018). Recycling of EPS Foam Packaging. Environmental Impacts of EPS Foam. Retrieved 2018 from: https://www.bioenergyconsult.com/tag/environmental-impacts-of-eps-foam/
Sadrieva, A. G., Boreiko, N. P., Trifonova, O. M., & Garifutdinov, M. K. (2013). Investigating the possibility of modifying polystyrene with polysaccharides with the aim of producing biodegradable grades. International Polymer Science and Technology, 4, 56-58.
Saron, C., & Felisberti, M. I. (2006). Action of dyes in the degradation and stabilization of polymers. Chem. Nova vol.29 no.1, 29(1), 124-128.
Schlemmer, D., Sales, M. J. A., & Resck, I. S. (2009). Degradation of different polystyrene/thermoplastic starch blends buried in soil. Carbohydrate Polymers, 75(1), 58-62.
Sekhar, V. C., Nampoothiri, K. M., Mohan, A. J., Nair, N. R., Bhaskar, T., & Pandey, A. (2016). Microbial degradation of high impact polystyrene (HIPS), an e-plasticwith decabromodiphenyl oxide and antimony trioxide. Journal of Hazardous Materials, 318, 347–354.
Selke, S., Auras, R., Nguyen, T. A., Aguirre, E. C., Cheruvathur, R., & Liu, Y. (2015). Evaluation of Biodegradation-Promoting Additives for Plastics. Environmental Science & Technology, 49(6), 3769-3777.

170
Shah, A. A., Hasan, F., Hameed, A., & Ahmed, S. (2008). Biological degradation of plastics: A comprehensive review. Biotechnology Advances, 26, 246-265.
Shang, J., Chai, M., & Zhu, Y. (2003). Solid-phase photocatalytic degradation of polystyrene plastic with TiO2 as photocatalyst. Journal of Solid State Chemistry, 174, 104-110.
Shimpi, N., Borane, M., Kadam, M., & Mishra, S. (2017). Effect of organically modified montmorillonite (OMMT) on biodegradation of PS:PLA and PS:PLA:OMMT using Phanerochaete chrysosporium. Polymer Composites, 38(7), 1292-1301.
Shimpi, N., Borane, M., Mishra, S., & Kadam, M. (2012). Biodegradation of polystyrene (PS)-poly(lactic acid) (PLA) nanocomposites using Pseudomonas aeruginosa. Macromolecular Research, 20(2), 181-187.
Sielicki, M., Focht, D. D., & Marti, J. P. (1978). Microbial degradation of [14C]polystyrene and 1,3-diphenylbutane. Can. J. Microbiol., 24, 798-803.
Silvestre, C., Duraccio, D., & Cimmino, S. (2011). Food packaging based on polymer nanomaterials. Progress in Polymer Science, 36, 1766–1782.
Smith, S. H., & Taylor, L. T. (2002). Extraction of various additives from polystyrene and their subsequent analysis. Chromatographia, 56(3-4), 165-169.
Staley, B. F., de los Reyes, F. L., & Barlaz, M. A. (2012). Comparison of Bacteria and Archaea communities in municipal solid waste, individual refuse components, and leachate. FEMS Microbiology Ecology, 79(2), 465-473.
Subramanian, M. N. (2017). Polymer blends and composites. Beverly, MA: Scrivener Publishing.
Tang, Z. L., Kuo, T. A., & Liu, H. H. (2017). The Study of the Microbes Degraded Polystyrene. Advances in Technology Innovation, 2(1), 13 - 17.
Tian, L., Kolvenbach, B., Corvini, N., Wang, S., Tavanaie, N., Wang, L., Ma, Y., Scheu, S., Corvini, P. F. X., & Ji, R. (2017). Mineralisation of 14C-labelled polystyrene plastics by Penicillium variabile after ozonation pre-treatment. New Biotechnology, 38, 101-105.

171
Tsuji, H., & Ikada, Y. (1998). Properties and Morphology of Poly(L-lactide). II.Hydrolysis in Alkaline Solution. Journal of Polymer Science: Part A: Polymer Chemistry, 36, 59-66.
Wang, C., Xue, T., Dong, B., Wang, Z., & Li, H. L. (2008). Polystyrene–acrylonitrile–CNTs nanocomposites preparations and tribological behavior research. Wear, 265, 1923-1926.
Ward, L. M., Hemp, J., Shih, P. M., McGlynn, S. E., & Fischer, W. W. (2018). Evolution of Phototrophy in the Chloroflexi Phylum Driven by Horizontal Gene Transfer. Front Microbiol, 9(260), 1-16.
Ward, P. G., Goff, M., Donner, M., Kaminsky, W., & O'Connor, K. E. (2006). A two-step chemo-biotechnological conversion of polystyrene to a biodegradable thermoplastic. Environmental Science and Technology, 40(7), 2433-2437.
Weinstein, J. E., Crocker, B. K., & Gray, A. D. (2016). From macroplastic to microplastic: Degradation of high-density polyethylene, polypropylene, and polystyrene in a salt marsh habitat. Environmental Toxicology and Chemistry, 35(7), 1632-1640.
West, D. (2016). Turn back the toxic tide- Threat Abatement Plan Marine Plastic Pollution. The Boomerang Alliance, pp. 1-44. Retrieved from: https://www.boomerangalliance.org.au/
Wu, W. M., Yang, J., & Criddle, C. S. (2017). Microplastics pollution and reduction strategies. Frontiers of Environmental Science and Engineering, 11(1).
Yamamoto, T., Yasuhara, A., Shiraishi, H., & Nakasugi, O. (2001). Bisphenol A in hazardous waste landfill leachates. Chemosphere, 42, 415-418.
Yang, S. S., Brandon, A. M., Xing, D. F., Yang, J., Pang, J. W., Criddle, C. S., Ren, N. Q., & Wu, W. M. (2018). Progresses in Polystyrene Biodegradation and Prospects for Solutions to Plastic Waste Pollution IOP Conf. Series: Earth and Environmental Science (Vol. 150, pp. 1-9): IOP Publishing.
Yang, Y., Yang, J., Wu, W. M., Zhao, J., Song, Y., Gao, L., Yang, R., & Jiang, L. (2015a). Biodegradation and Mineralization of Polystyrene by

172
Plastic-Eating Mealworms: Part 1. Chemical and Physical Characterization and Isotopic Tests. Environ. Sci. Technol., 49, 12080-12086.
Yang, Y., Yang, J., Wu, W. M., Zhao, J., Song, Y., Gao, L., Yang, R., & Jiang, L. (2015b). Biodegradation and Mineralization of Polystyrene by Plastic-Eating Mealworms: Part 2. Role of Gut Microorganisms. Environmental Science & Technology, 49, 12087−12093.
Yi, J., Dong, B., Jin, J., & Dai, X. (2014). Effect of Increasing Total Solids Contents on Anaerobic Digestion of Food Waste under Mesophilic Conditions: Performance and Microbial Characteristics Analysis. PLoS One, 9(7), 1-10.
Zee M. (2005). Biodegradability of polymers: mechanisms and evaluation methods. Chapter 1. In: Handbook of biodegradable polymers. Sawbury (UK): Rapra Technology Limited.
Zheng, Y., Yanful, E. K., & Bassi, A. S. (2005). A review of plastic waste biodegradation. Crit Rev Biotechnol, 25(4), 243-250.

APPENDIX
Some pictures of preparation for in situ research at the Summerhill Landfill Waste Management Center