3Stantec - Government of Nova Scotia
92
Source Emissions Testing — Recovery Boiler and Power Boiler, Winter 2015 3 Stantec Prepared for: Northern Pulp Nova Scotia Corporation P.O. Box 549, Station Main New Glasgow, NS B2H 5E8 Prepared by: Stantec Consulting Ltd. 102-40 Hightield Park Drive Dartmouth, NS B3A 0A3 Project No. 121413456 April 10, 2015
-
Upload
khangminh22 -
Category
Documents
-
view
4 -
download
0
Transcript of 3Stantec - Government of Nova Scotia

Source Emissions Testing —
Recovery Boiler and PowerBoiler, Winter 2015
3 StantecPrepared for:Northern Pulp Nova ScotiaCorporationP.O. Box 549, Station MainNew Glasgow, NS B2H 5E8
Prepared by:Stantec Consulting Ltd.102-40 Hightield Park DriveDartmouth, NS B3A 0A3
Project No. 121413456
April 10, 2015
SOURCE EMISSIONS TESTING — RECOVERY BOILER AND POWER BOILER, WINTER 2015
TABLE OF CONTENTS
EXECUTIVE SUMMARY II
1.0 INTRODUCTION 1
2.0 OVERALL APPROACH 1
2.1 SUBMISSION OF PRE-TEST PLAN2.2 ON-SITE SOURCE EMISSIONS TESTING 2
2.3 INFORMATION REVIEW AND REPORTING 2
3.0 TEST METHODS, EQUIPMENT, AND CALIBRATIONS 3
3.1 SAMPLING PROCEDURES AND EQUIPMENT 33.1.1 Total Particulate Matter 33.1.2 Combustion Gases 5
3.2 QUALITY ASSURANCE AND QUALITY CONTROL 5
4.0 RESULTS AND DISCUSSION 6
4.1 EXHAUST STACK SAMPLE LOCATION DETAILS 6
4.2 RECOVERY BOILER 7
4.3 POWER BOILER 9
4.4 SUMMARY OF RESULTS 10
5.0 CLOSURE 10
LIST OF TABLES
TableE.1 Summary of Scope HTable 2.1 Source Emissions Testing Matrix 2Table 4.1 Sample Location Details 6Table 4.2 Source Testing Results - Recovery Boiler - Particulate Matter 7
Table 4.3 Source Testing Results - Recovery Boiler - Combustion Gases 8Table 4.4 Source Testing Results - Power Boiler - Particulate Matter 9
Table 4.5 Source Testing Results - Power Boiler - Combustion Gases 10
LIST OF FIGURES
Figure 3.1 Source Emissions Testing Methad 5 Sampling Train 4
List of Appendices
Appendix A Pre-test PlanAppendix B Calibration DataAppendix C Field Data SheetsAppendix D Calculations
Stantec
File: 121413456

SOURCE EMISSIONS TESTING — RECOVERY BOILER AND POWER BOILER, WINTER
EXECUTIVE SUMMARY
Northern Pulp Nova Scotia Corporation, referred to herein as Northern Pulp, retained StantecConsulting Ltd. to conduct source emissions testing at the Kratt pulp mill in New Glasgow. NovaScotia. Source emis5ions testing were conducted on the Recovery Boiler and the Power Boiler tofulfill the conditions specified in the current Certificate of Approval to Operate (C0A) 20 11-076657-R03. The source emissions testing campaign was performed according to the pre-testplan submitted to the Nova Scotia Department of Environment. The testing was conductedduring the week of March 9th, 2015.
In this report, source emissions testing data are presented for measurements which includecombustion gases and total particulate matter (PM) as well as exhaust gas temperature,exhaust flaw rate, moisture content, velocity, and volumetric flow rate. The scope of work forthe testing campaign is summarized in Table E.1.
Table E.1 Summary of Scope
Number ofSource Samples per Parameter Sampling Method
Source
. 3 Total Particulate Matter (PM) EPS 1 /RM/8Recovery Boiler3 Combustion Gases EPS L’RM/lS
. 3 Tatal Particulate Matter (PM) EPS 1 /RM/8Power Boiler3 Combustion Gases EPS 1 /RM/ I 5
The average measured concentration of PM from the Power Boiler was 155 mgIRm3 (correctedto 11% 02), which is above the respective regulatory stack limit of 150 mg/Rm3 presented inTable 1 of the facility’s Approval. The measured concentration of PM from the Recovery Boilerwas 833 mg/Rm3 (corrected to 11% 02), which is above the regulatory limit of 375 mg/Rm3presented in Table 1 of the facility’s Approval.
(3StantecFile: 121413456

SOURCE EMISSIONS TESTING — RECOVERY BOILER AND POWER BOILER, WINTER 2015
1.0 INTRODUCTION
Northern Pulp Nova Scotia Corporation, referred to herein as Northern Pulp, retained Stantec
Consulting Ltd. (Stantec) to conduct source emissions testing at the Kraft pulp mill in New
Glasgow, Nova Scotia. Source emissions testing were conducted on the Recovery Boiler and the
Power Boiler. The source emissions testing campaign was performed according the pre-test plan
submitted on February 23d, 2015 to the Nova Scotia Department of Environment, following
methods published by the United States Environmental Protection Agency and Environment
Canoda. The testing was conducted during the week of March 91h, 2015.
In this report, source emissions testing data are presented for combustion gases (oxygen, carbon
dioxide, nitrogen oxides, sulphur dioxide, and carbon monoxide), total particulate matter (PM),
exhaust gas temperature, exhaust flow rate, moisture content, velocity, and volumetric flow
rate.
This report is in five sections. Section 1 contains the introduction and the scope of work for the
project. The study approach and a brief description of the various parts of the project are in
Section 2. Section 3 contains a brief description of the testing methodologies, equipment, and
calibration techniques used during the source emissions testing program. In Section 4, the results
of the source emissions testing are presented and discussed, and concluding remarks are
presented in Section 5. Appendices A through D contain supporting information for the report.
2.0 OVERAll APPROACH
The project consisted of five parts:
1. Submission of the Pre-test Plan:
2. Site Preparation and Preliminary Survey;
3. On-site Source Emissions Testing;
4. Laboratory Analysis; and
5. Information Review and Reporting.
Each of these parts is described below.
2.1 SUBMISSION OF PRE-TEST PLAN
The on-site testing was conducted in accordance with the Pre-Test Plan submitted on February
23’d, 2015 to Nova Scotia Environment (NSE). The Pre-Test Plan outlined the contaminants to be
tested, as well as the methodologies proposed for conducting the source testing on the exhaust
stacks. Appendix A provides a copy of the plan.
(3Stantec
File: 121413456
SOURCE EMISSIONS TESTING — RECOVERY BOILER AND POWER BOILER, WINTER 2015
2.2 ON-SITE SOURCE EMISSIONS TESTING
Stantec set up the source emissions testing equipment and conducted a preliminary survey tomeasure the exhaust gas temperature, velocity, and flue gas composition for those sourcesrequiring particulate testing. The data from this survey was used to determine the appropriatenozzle size to conduct isokinetic sampling (where the velocity of the gas entering the nozzle isequal to the gas velocity in the stack) for particulate matter sampling.
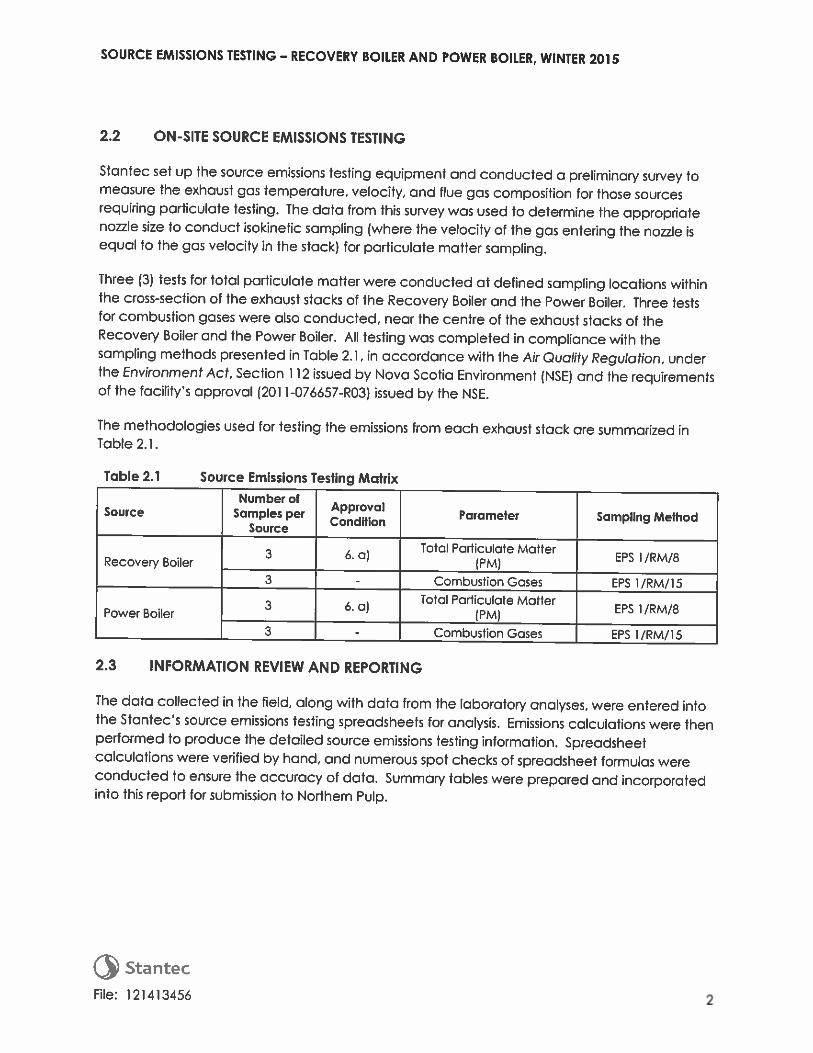
Three (3) tests for total particulate matter were conducted at defined sampling locations withinthe cross-section of the exhaust stacks of the Recovery Boiler and the Power Boiler. Three testsfor combustion gases were also conducted, near the centre of the exhaust stacks of theRecovery Boiler and the Power Boiler. All testing was completed in compliance with thesampling methods presented in Table 21, in accordance with the Air Quaflty Regulation, underthe Environment Act, Section 112 issued by Nova Scotia Environment (NSF) and the requirementsof the facility’s approval (201 1-076657-R03) issued by the NSF.
The methodologies used for testing the emissions from each exhaust stack are summarized inTable 2.].
Table 2.1 Source Emissions Testing MatrixNumber of ApprovalSource Samples per CondItIon Parameter Sampling Method
Source
. 3 6. a) Total Particulate MatterEPS 1 JRM/BRecovery Boiler (PM)
3 - Combustion Gases EPS ]/RM/]5Total Particulate Matter
. 3 6. al EPS 1 /RM/8Power Boiler 1PM)3 - Combustion Gases EPS ]/RM/]5
2.3 INFORMATION REVIEW AND REPORTING
The data collected in the field, along with data from the laboratory analyses, were entered intothe Stantec’s source emissions testing spreadsheets for analysis. Emissions calculations were thenperformed to produce the detailed source emissions testing information. Spreadsheetcalculations were verified by hand, and numerous spot checks of spreadsheet formulas wereconducted to ensure the accuracy of data. Summary tables were prepared and incorporatedinto this report for submission to Northern Pulp.
Stantec
File: 121413456 2
SOURCE EMISSIONS TESTING — RECOVERY BOILER AND POWER BOILER, WINTER 2015
3.0 TEST METHODS, EQUIPMENT, AND CALIBRATIONS
This section contains a description of the methods and equipment used to conduct the source
emissions testing campaign. The calibration procedures used to ensure the quality of the source
emissions testing data are also summarized in this section.
3.1 SAMPLING PROCEDURES AND EQUIPMENT
The following sub-sections contain brief descriptions of the sampling equipment and
methodologies used during the source emissions testing campaign.
3.1.1 Total Particulate Mailer
Particulate matter emissions from the exhaust stacks were measured in accordance with the
Environment Canada Reference Method EPS 1/RM/8, entitled Reference Methods for Source
Testing: Measurement of Releases of Particulate from Stationary Sources.
The sampling train, used specifically for isokinetic sampling of particulate matter, is described in
detail in EPS 1/RM/B, and is generally referred to as the ‘Method 5’ sampling train for particulate
matter, named after the United States Environmental Protection Agency (US EPA) protocol. The
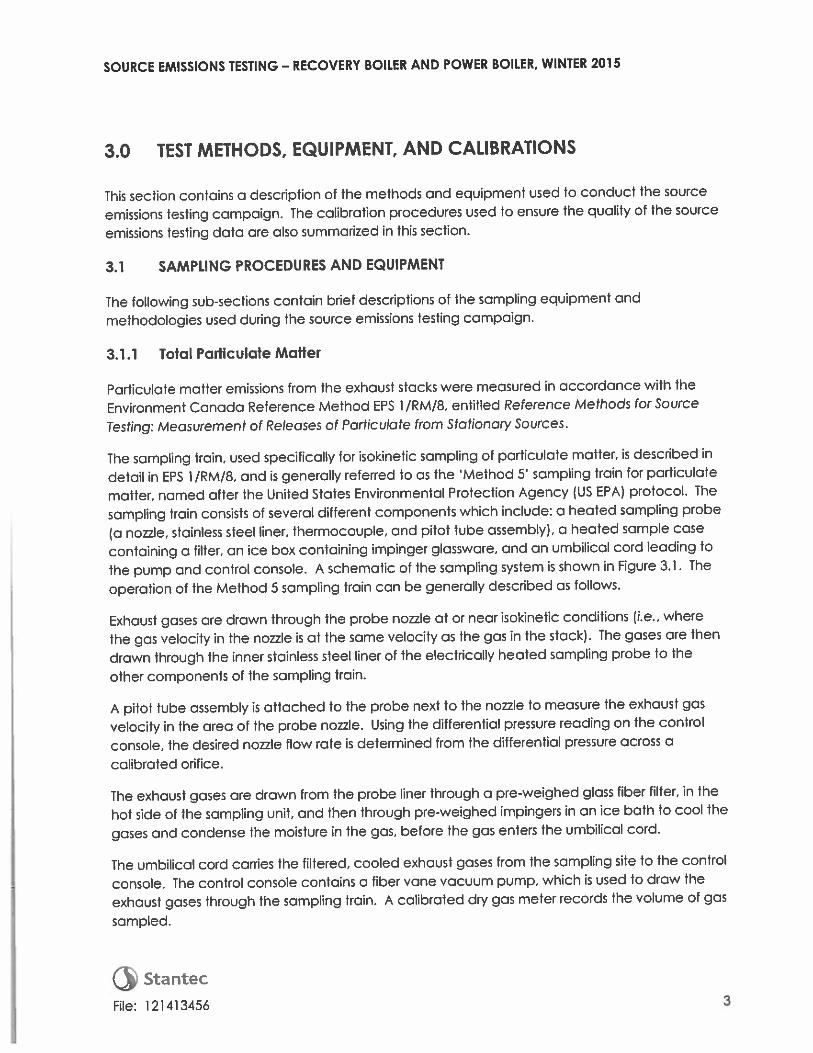
sampling train consists of several different components which include: a heated sampling probe
(a nozzle, stainless steel liner, thermocouple, and pitot tube assembly), a heated sample case
containing a filter, an ice box containing impinger glassware, and an umbilical card leading to
the pump and control console. A schematic of the sampling system is shown in Figure 3.1. The
operation of the Method 5 sampling train can be generally described as follows.
Exhaust gases are drawn through the probe nozzle at or near isokinetic conditions (i.e., where
the gas velocity in the nozzle is at the same velocity as the gas in the stack). The gases are then
drawn through the inner stainless steel liner of the electrically heated sampling probe to the
other components of the sampling train.
A pitot tube assembly is attached to the probe next to the nozzle to measure the exhaust gas
velocity in the area of the probe nozzle. Using the differential pressure reading on the control
console, the desired nozzle flow rate is determined from the differential pressure across a
calibrated orifice.
The exhaust gases are drawn from the probe liner through a pre-weighed glass fiber filter, in the
hot side of the sampling unit, and then through pre-weighed impingers in an ice bath to cool the
gases and condense the moisture in the gas, before the gas enters the umbilical cord.
The umbilical cord carries the filtered, cooled exhaust gases from the sampling site to the control
console. The control console contains a fiber vane vacuum pump, which is used to draw the
exhaust gases through the sampling train. A calibrated dry gas meter records the volume of gas
sampled.
(3File: 121413456 3

F1tE
STA
ND
ARD
I
HO
TBO
X
aP
PIlO
TaH
ORI
FICE
MA
NO
AET
ERM
PID
ME1
ER
STA
CKTH
ERM
OC
OU
PLE
DRY
GA
SM
ETER --1
POW
ERnov
CO
NTR
OL
CO
NSO
LE
SOU
RC
EE
MIS
SIO
NS
TE
STIN
GM
ETH
OD
5SA
MPL
ING
TRA
IN

SOURCE EMISSIONS TESTING — RECOVERY BOILER AND POWER BOIlER, WINTER 2015
After completion of testing, the impingers are re-weighed, with the difference in moss
corresponding to the mass of water collected. This measurement is used to calculate the
moisture content of the exhaust gas.
Prior to the particulate matter testing, filters were conditioned and pre-weighed. Following the
testing, particulate mailer was recovered from the nozzle, the sampling probe and the in-line
filter. Following testing, the filter containing the particulate sample, was conditioned and
weighed, and the net weight of the collected particulate matter was determined. After each
test, the probe and nozzle were rinsed with acetone and this acetone was collected, placed
into a pre-weighed container and evaporated until dry. The amount of particulate for each
part of the sample was determined gravimetrically, and the mass of particulate matter
collected for each test was calculated as the sum of the particulate matter collected in the
filter, probe, and nozzle rinse. The contents of the water filled impingers were also recovered
gravimetrically for particulate matter and reported separately as requested by the NSF. These
recoveries were performed at Stantec’s laboratory in Fredericton, New Brunswick. Appendix B
contains the equipment calibration data.
3.1.2 Combustion Gases
The combustion gases (02, C02, CO. NOx, and 502) from the boilers were sampled according to
the Environment Canada reference method EPS 1/RM/15, entitled Reference Method for the
Monitoring of Gaseous Emissions from Fossii Fue-flred Burners. In this method, samples of flue gas
are drawn through a probe, non-isokinetically, from a single point near the centre of the stack.
An FNFRAG Model 500 Micro-Fmission Analyzer, manufactured by ENFRAC Inc., was used to
conduct the sampling. The Model 500 is equipped with a flue gas probe that has an integrated
filter trap and condensate trap, and a housing unit that contains the pump and the
electrochemical cells which are used to measure concentrations of sulphur dioxide, nitrogen
oxides, carbon monoxide, carbon dioxide, and oxygen. The ENERAC Model 500 Micro-Emission
Analyzer is manufactured and calibrated to confirm accuracy. Calibration data is included in
Appendix B.
3.2 QUALITY ASSURANCE AND QUALITY CONTROL
Throughout the source emissions testing program, quality assurance and quality control
procedures were applied to ensure the collection of reliable and accurate emissions data.
Quality control checks were performed at several stages during the testing program to ensure
the collection of representative samples and the generation of valid results.
The Quality Control (QC) checks included the following:
• use of standardized checklists and field notebooks to ensure completeness, traceability, and
comparability of the process information and samples;
• field checking of standardized forms by a second person to ensure accuracy and
completeness;
(3File: 121413456 5
SOURCE EMISSIONS TESTING — RECOVERY BOILER AND POWER BOILER, WINTER 2015
• strict adherence to sample chain-of-custody procedures:
• testing for cyclonic or reverse flow, as well as stratified flow conditions: and
• leak checks of sampling train.
Equipment was calibrated according to the protocols and schedule as prescribed by NSF,Fnvironment Canada. and the US FPA. These calibrations include the following:
Pilots: Calibrated in a wind tunnel with probe and nozzles attached.
Gas meters: Calibrated using a critical orifice calibration set.
Nozzle: Four diameter measurements made using a micrometer across the sharpened edges.
Thermocouples: Calibrated using a potentiometric technique.
Gas Analyzers: Calibrated against reference gases using standard calibration gases within theexpected range of concentrations from the source.
Calibration data are in Appendix B of this report.
4.0 RESULTS AND DISCUSSION
The results of the source emissions testing campaign are provided and discussed in this section.
Appendices B through D contain supporting information including calibration information, fielddata sheets, and calculations.
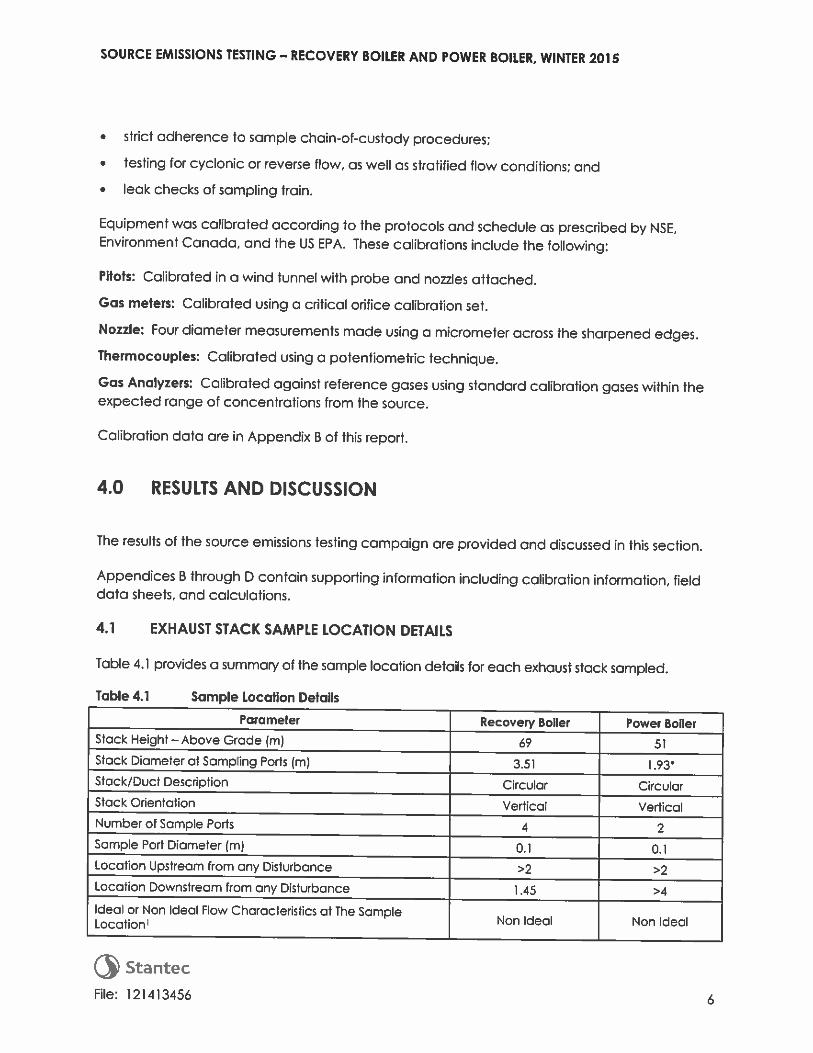
4.1 EXHAUST STACK SAMPLE LOCATION DETAILS
Table 4.1 provides a summary of the sample location details for each exhaust stack sampled.
Table 4.1 Sample Location Details
Parameter Recovery Boiler Power BoilerStack Height—Above Grade (ni) 69 51Stack Diameter at Sampling Ports (m) 3.51 1.93Stack/Duct Description Circular CircularStack Orientation Verticol VerticalNumber of Sample Ports 4 2Sample Port Diameter (m) 0.1 0.1Location Upstream from any Disturbance >2 >2Location Downstream from any Disturbance 1.45 >4Ideal or Non Ideal Flow Characteristics at The Sample
Non Ideal Non IdealLocation’
StantecFile: 121413456 6

SOURCE EMISSIONS TESTING — RECOVERY BOILER AND POWER BOILER, WINTER 2015
Table 4.1 Sample Location Details
Parameter Recovery Boiler Power Boiler
Total Number of Sample Points for PM 24 24
Number of Sample Points per Traverse for PM 12 12
Sample lime per Point for PM (mm) 5 5
Sample time per Test for PM (mm) 120 120
Sample time per Test for TRS (mm) NA NA
Sample time per Test for gases (mm) 30 30
Diameter confirmed while testing during the week of March 91h
4.2 RECOVERY BOILER
The results of the source emissions testing for total particulate matter and combustion gases from
the Recovery Boiler exhaust stack are in Tables 4.2 and 4.3, respectively.
Table 4.2 Source Testing Results - Recovery Boiler - Particulate MatterStack
Emission LimitParameter Test #1 Test #2 Test #3 Average (Table 1 of
Approval)
Test Date Mar. 10, 2015 Mar, 10, 2015 Mar. 11, 2015 - -
Test Start 9:00 AM 12:15 PM 9:20 AM - -
Test Duration (mm) 120 120 120 120 -
Volume of Gas Sampled(Rm3) 1.8? 1.87 1.75 1.8? -
Average Isokineticity (%) 105 102 104 103 -
Total Volume of MoistureCollected in Impingers -
(mL) 540 542 541 541
Particulate Matter FromFilter and Probe Wash 1mg) 2,474 2,779 2,220 2,491 -
Particulate Matter FromImpingers (mg) 1.94 4.54 3.27 3.25 -
Exhaust Gas Parameters
Exhaust Gas Temperature(°C) 67.6 67.8 63.9 66.4 -
Exhaust Gas MoistureContent (%) 28.9 28.3 29.5 28.9 -
Exhaust Gas Velocity (mIs) 13.7 14.5 13.7 14.0 -
Exhaust Gas VolumetricFlow Rate (Rm3/s) 83.3 88.6 81.7 84.6 -
Oxygen - 02 (%) 4.80 4.50 4.39 4.56 -
Carbon Dioxide - C02 (%) 1 5.6 15.9 1 6.1 15.9 -
Stantec
File: 121413456 7

SOURCE EMISSIONS TESTING — RECOVERY BOILER AND POWER BOILER, WINTER 2015
Table 4.2 Source Testing Results - Recovery Boiler - Particulate Mailer
StockEmIssion UmitParameter Test #1 Test #2 Test #3 Average
(Table 1 ofApproval)
Total Particulate Matter -
PMConcentration at 11% 02(mg/Rm3) 842 898 759 833 375*
Emission Rate (kg/hr) 411 474 373 419 -
Legend:Degrees Celsius.
mis Metres per second.Rm3/s Dry cubic metres per second at reference conditions (25°C and 101.3 kPa).mg/Rm3 Milligrams per dry cubic metre at reference conditions (25°C and 101.3 kPa).kgihr Kilograms per hour.For the period between the issuance of Approval No.201 l-076657-R03 and the commissioning of the recovery boiler
precipitator system, the particulate emission limit for the Recovery Boiler is 375 mg/Rm3.
The average measured concentration of particulate matter was 833 mg/Rm3 (corrected to 11%02). which is above the stack emission limit of 375 mgIRm3 presented in Table 1 of the facility’sApproval.
Table 4.3 Source Testing Results - Recovery Boiler - Combustion GasesParameter Test #1 Test #2 Test #3 Average
Test Date Mar. 10, 2015 Mar. 10, 2015 Mar. 11, 2015 -
Test Duration (mm) 30 30 30 30Exhaust Gas VolumetricFlow Rate (Rm3/s) 83.3 88.6 81.7 84.6Sulphur Dioxide - 502Concentrotion (ppm) 8.14 6.14 27.9 14.0Concentration (mgiRm2) 13.1 9.72 43.8 22.2Emissions Rate (kg/hr) 6.40 5.14 21.5 11.0Nitrogen Oxides - NOConcentration (ppm) 23.7 46.1 52.1 40.7Concentration (mg/Rm3) 27.4 52.4 58.8 46.2Emissions Rate (kg/hr) 1 3.4 27.7 28.9 23.3Carbon Monoxide - COConcentration (ppm) 1,772 2,817 3,083 2558Concentration (mg/Rm3) 1,248 1,947 2.116 1770Emissions Rate (kg/hr) 609 1 .029 1 .039 892Legend:Rr&/s Dry cubic metres per second at reference conditions (25°c and 101.3 kra).mg/Rm3 Milligrams per dry cubic metre at reference conditions (25°C and 101.3 kro).kg/hr Kilograms per hour.NA Not Applicable
The emission rates for SO2. NO and CO for the Recovery Boiler were 11.0kg/hr. 23.3 kg/hr and892 kg/hr. respectively.
(3File: 121413456 8

SOURCE EMISSIONS TESTING — RECOVERY BOILER AND POWER BOILER, WINTER 2015
4.3 POWER BOILER
The results of the source emissions testing for total particulate matter and combustion gases from
the Power Boiler exhaust stack are in Tables 4.4 and 4.5. respectively.
Table 4.4 Source Testing Results - Power Boiler- Particulate Mailer
StackEmission Limit
Parameter Test #1 Test #2 Test #3 Average(Table 1 ofApproval)
T tD tMar. 10, Mar.11, Mar.11,
es ae 2015 2015 2015 - -
Test Start 8:47 AM 1 2:00 PM 2:52 PM - -
Test Duration (mm) 1 20 1 20 I 20 1 20 -
Volume of Gas Sampled (Pm3) 1 .50 1 .34 1 .48 1 .44 -
Average Isokineticily (%) 107 108 105 106 -
Total Volume of Moisture -
Collected in Impingers (mL) 291 260 285 278
Particulate Matter From Filter andProbe Wash (mg) 220 239 229 229 -
Particulate Matter From Impingers -
1mg) 4.8 3.0 4.2 4.0
nExhaust Gas Temperature 1°C) 64.7 65.1 63.9 64.6 -
Exhaust Gas Moisture Content (%) 20.8 20.8 20.7 20.8 -
Exhaust Gas Velocity (mIs) 18.9 17.1 19.1 18.4 -
Exhaust Gas Volumetric Flow Rate(Rm3/s) 38.2 34.4 38.5 37.0 -
Dxygen-02 (%) 10.8 11.4 97 10.6 -
Carbon Dioxide - CO2 (%) 9,79 9.26 I 1.0 10.0 -
Total Particulate Matter - PM
Concentration at 11% 02
(mg/Pm3) 143 185 137 155 150
Emission Rate (kglhr) 20.1 22.1 21.5 21.2 -
Legend:°C Degrees celsius.rn/s Metres per second.Rm3/s Dry cubic metres per second at reference conditions (25°c and 101.3 kPa).mg/Pm3 Milligrams per dry cubic metre at reference conditions (25°c and 101.3 kPo).kg/hr Kilograms per hour.ND Non-delectable
The overage measured concentration of particulate matter (corrected to 11% 02) was 155
mg/Pm3, which is slightly above the stack emission limit of 150 mg/Pm3 presented in Table 1 of
the facility’s Approval (No. 201 l-076657-R02J. Only one out of the three tests was above the
limit.
Stantec
File: 121413456 9
SOURCE EMISSIONS TESTING — RECOVERY BOILER AND POWER BOILER, WINTER 2015
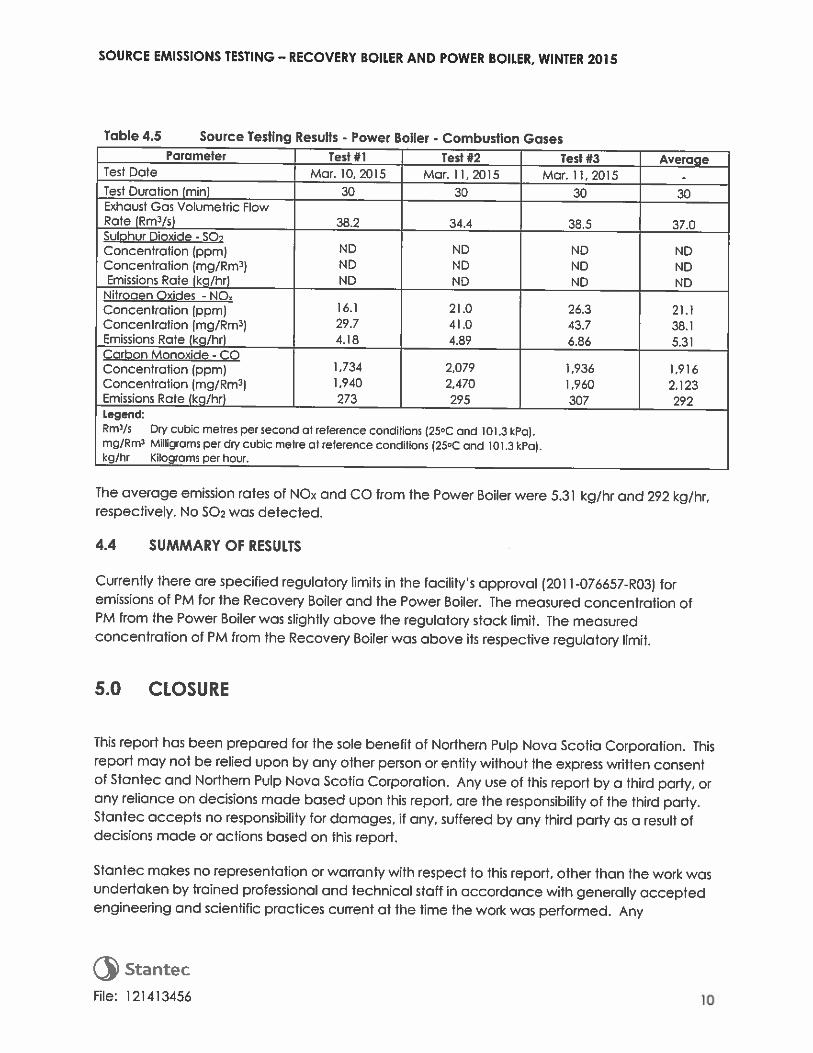
Table 4.5 Source Testing Results - Power Boiler - Combustion GasesParameter test #1 1 Test #2 Test #3 Average
TestDate Mor.10,2015 Mar.11,2015 Mar.l1,2015 -
Test Duration (mm) 30 30 30 30Exhaust Gas Volumetric FlowRate (Rm3/s) 38.2 34.4 38.5 37.0Sulphur Dioxide - SO2Concentration (ppm) ND ND ND NDConcentration (mg/Rm3) ND ND ND NDEmissions Rate (kg/br) ND ND ND ND
Nitrogen Oxides - NOConcentration (ppm) 16.1 21.0 26.3 21.1Concentration (mg/Rm33 29.7 41.0 43.7 38.1Emissions Rate (kg/hr) 4.18 4.89 6.86 5.31Carbon Monoxide - COConcentration (ppm) 1,734 2,079 1,936 1,916Concentration (mg/Rm3) 1,940 2,470 1,960 2,123Emissions Rate (kg/hr) 273 295 307 292Legend:Rm/s Dry cubic metres per second at reference conditions (25CC and 101.3 kPa).mg/Rm3 Milligrams per dry cubic metre al reference conditions (25CC and 101.3 kPoj.kg/hr Kilograms per hour. -I
The overage emission rates of NOx and CO from the Power Boiler were 5.31 kg/hr and 292 kg/hr.respectively. No 502 was detected.
4.4 SUMMARY OF RESULTS
Currently there ore specified regulatory limits in the facility’s approval (201 1-076657-R03) foremissions of PM for the Recovery Boiler and the Power Boiler. The measured concentration ofPM from the Power Boiler was slightly above the regulatory stack limit. The measuredconcentration of PM from the Recovery Boiler was above its respective regulatory limit.
5.0 CLOSURE
This report has been prepared for the sole benefit of Northern Pulp Nova Scotia Corporotion. Thisreport may not be relied upon by any other person or entity without the express written consentof Stantec and Northern Pulp Nova Scotia Corporation. Any use of this report by a third party, orany reliance on decisions made based upon this report, ore the responsibility of the third party.Stantec accepts no responsibility for damages, if any, suffered by any third party as a result ofdecisions made or actions based an this report.
Stontec makes no representation or warranty with respect to this report, other than the work wasundertaken by trained professional and technical staff in accordance with generally acceptedengineering and scientific practices current at the time the work was performed. Any
(3 StantecFile: 121413456 10

SOURCE EMISSIONS TESTING — RECOVERY BOILER AND POWER BOILER, WINTER 2015
information or facts provided by others and referred to or utilized in the preparation of this report
was assumed by Stantec to be accurate.
This study was undertaken exclusively for the purpose outlined herein ond was limited to those
contaminants and sources specifically referenced in this report. It should be noted that the
measurements were taken over a relatively short time period on-site, and the emissions results
may be considered representative only for the conditions present at the time of testing. This
report cannot be used or applied under any circumstances to another location or situation or for
any other purpose without further evaluation of the data and related limitations.
This report was developed by Gillion Hatcher, M.A.Sc. and reviewed by Vicki Corning, P.Eng. and
Mark Scaplen, P.Fng.
If you have any questions regarding the contents of ihis report, or require any additional
information, please do not hesitate to contact the undersigned.
hwmYalckc)
Gillian Hatcher, M.A.Sc. Vicki Corning, P.Eng.
Project Manager Associate, Environmental Services
Tel: (902) 468-7777 Tel: (506) 452-7000
Stantec
File: 121413456

SOURCE EMISSIONS TESTING — RECOVERY BOILER AND POWER BOILER, WINTER 2015
Appendix APie-test Plan
Stantec

Stanlec Consulting Ltd.102 - 40 Highfield Park DriveDartmouth NS B3A 0A3Tel: (902) 468-7777Stantec Fax: (902) 468-9009
February 20, 2015FUe: 121413456
Attention: Mr. Marc TheriauliNova Scotia Environment20 Pumphouse RoadPictou, NS B2H 5C6
Dear Mr. Theriault,
Reference: Pre-Test Plan for Source Emissions Testing Northern Pulp,Pictou Mill —2015 Calendar Year
Please accept this Pre-test Plan for the completion of source emissions required at the Pictou Mill in
New Glasgow, Nova Scotia for the 2015 calendar year.
Introduction
Northern Pulp is required to perform source emissions testing on the Recovery Boiler, Ume Kiln,
Smelt Dissolving Tank, Power Boiler and the High Level Roof Vent to fulfil the conditions specified in
the current Certificate of Approval (C0A) to Operate 201 1-076657-R03. The required annual
testing for 2015 consists of:
• Recovery Boiler and Power Boiler particulate matter testing 4 times per year;
• Lime Kiln and Smelt Dissolving Tank particulate matter testing 2 times per year;
• Ume Kiln, High Level Roof Vent and Smelt Dissolving Tank total reduced sulphur (TRS) testing 2
times per year;
• One PM2S testing event per year on the four stacks noted above for particulate matter; and
• One Chlorine (Cl) and Chlorine Dioxide (CIO2) event per year on the bleach plant exhaust
(High Level Roof Vent being the source of these emissions).
Test Program Organization
The source emissions testing will be performed for:
Company Name: Northern PulpCompany Address: P.O. Box 549, Station Main, New Glasgow, NS, B2H 5E8Contact Name:Position: Environmental/Technical LeaderTelephone Number: (902) 752-8461[mail: &northernpulp.com
Design with commLnity n mind
c3February 20, 2015Mr. Marc TheriaultPage2of 12
Reference: Pre-Test Plan for Source EmIssIons Testing Northern Pulp,Pictou Mill —2015 Calendar Year
Sampling Company: Stantec Consulting Ltd.Project Manager: Gillian HatcherTelephone Number: (902) 468-7777Fax Number: (902) 468-9009Email: Stantec.comKey Sampling Team:
. (withsupport from other staff as needed)
Source Emissions Testing Program
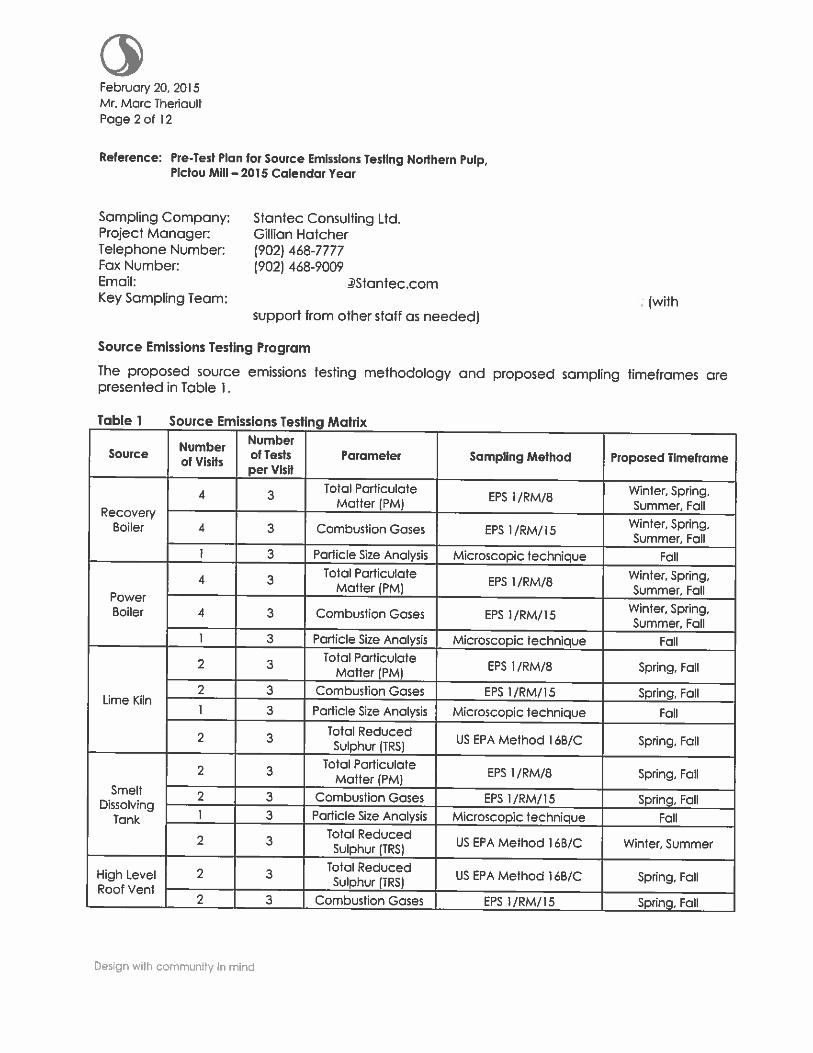
The proposed source emissions testing methodology and proposed sampling timeframes arepresented in Table 1.
Table 1 Source Emissions Testing Matrix
NumberNumberSource of Tests Parameter SamplIng Method Proposed Tlmeframeof Visitsper_Visit
Total Particulate Winter, Spring,4 3 EPS 1 /RM/8Matter (PM) Summer, FallRecoveryWinter, Spring,Boiler 4 3 Combustion Gases EPS 1/RM/15Summer, Fall
1 3 Particle Size Analysis Microscopic technique FallTotal Particulate Winter, Spring,4 3 EPS 1/RM/8Molter (PM) Summer, FallPower
Winter, Spring,Boiler 4 3 Combustion Gases EPS 1/RM/15Summer, Fall
1 3 Particle Size Analysis Microscopic technique FallTotal Particulate2 3 EPS 1 /RM/8 Spring, FallMatter_(PM)
2 3 Combustion Gases EPS 1/PM/is Spring, FallLime Kiln1 3 Particle Size Analysis Microscopic technique Fall
Total Reduced2 3 US EPA Method 1 6B/C Spring, FallSulphur_(TRS)Total Particulate2 3 EPS 1 /RM/8 Spring, FallMatter_(PM)
Smelt 2 3 Combustion Gases EPS 1/RM/15 Spring, FallDissolving1 3 Particle Size Analysis Microscopic technique FallTank
Total Reduced2 3 US EPA Method 1 6B/C Winter, SummerSulphur_(TRS)
Total ReducedHigh Level 2 3Sulphur (TRSI
US EPA Method 16B/C Spring, FallRoof Vent
2 3 Combustion Gases EPS 1/RM/15 Spring, Fall
Design wilh community in mind

3February 20, 2015
Mr. Marc Theriault
Page3of 12
Reference: Pre-Test Plan for Source Emissions Testing Northern Pulp.Plctou MllI—2015 Calendar Year
Table 1 Source Emissions Testing Matrix
NumberNumber
Source of Tests Parameter Sampling Method Proposed Tlmeframeof Visits per Visit
Chlorine and NCASI Special Report 91-1 3
chlorine dioxide 07Spring
Note:Timeframes are as follows based on the approval deadfines-Winter: January-March 31, 2015, Spring: April — June 30, 2015,
Summer: July-September 30, 2015, FoIl: October-December 31 2015
Details of each of the methods identified in Table I, in addition to the preliminary testing
methodology, are provided in the sections that follow.
Preliminary Testing: Upon arrival at each sampling location, Stantec will setup the source emissions
testing equipment and conduct a preliminary survey to measure the average velocity, flue gas
composition, and moisture content in the stack gases using EPS 1 /RM/8 Methods B, C, and D,
respectively. The data from this survey will be used to determine the appropriate nozzle size to
conduct isokinetic sampling (where the velocity of the gas entering the nozzle is equal to the gas
velocity in the stack) for particulate matter during the official testing part of the work. Verification for
cyclonic or reverse flow will also be conducted during the preliminary survey, according to
procedures outlined in the Environment Canada reference method [PS 1 /RM/8.
Should fluctuations in the velocity pressure at a selected traverse point exceed 20% of the
average pressure for that point; the diameter of the testing cross section will be reduced to
include only those areas along the traverse which meet this requirement (less than 20% of the
average). Although the diameter maybe reduced, the number of sampling points along each
traverse will remain the same as determined from [PS 1 /RM/8, Method A, using the equivalent
diameter.
Volumetric flow and exhaust gas emissions will be calculated using the full cross sectional area.
Particulate Matter: The source emissions testing of the Recovery Boiler, Lime Kiln, Smelt Dissolving
Tank, and the Power Boiler for total particulate matter will be conducted in accordance with the
Environment Canada reference method EPS 1 /RM/8, entitled “Measurement of Releases of
Particulate from Stationary Sources”. In addition the alignment approach, as specified in the US
EPA Guidance Document — GD-00B, will be applied when source testing the Lime Kiln due to the
cyclonic flow this source exhibits.
The particulate sampling train, used specifically for isokinetic sampling, is described in detail in EPS
1/RM/8, and is generally referred to as the “Method 5’ sampling train for particulate matter (after
the US EPA protocol). The sampling train has several different components which include: aheated sampling probe (a nozzle, stainless steel liner, thermocouple, and pitot tube assembly), a
heated sample case containing a filter, an ice box containing impinger glassware, and on
Design wilh community In mind

February 20, 2015Mr Marc TheriaultPage 4 of 12
Reference: Pre-Test Plan for Source Emissions Testing Northern Pulp.Plctou MIII —2015 Calendar Year
umbilical cord leading to the pump, and control console. A schematic of the sampling system isshown in Figure 1.
For all source tests, leak checks of the sampling train will be performed as per accepted US EPAand Environment Canada methods. For each official test, two (2) traverses with up to twelve (12)sampling points per traverse will be used. Sampling will be conducted for five (5) minutes persampling paint, up to a maximum sampling time of 120 minutes per test.
The amount of material caught in the impingers will be determined grovimetrically and reportedseparately from the calculated total particulate matter emissions. All particulate matter sampleswill be recovered and analyzed at the Stantec laboratory in Fredericton, NB.
Microscopic Analysis (Fine Particulate, PM2.s): As per the facility’s Industrial Approval to Operate.the Environment Canada EPS 1 /RM/55 or an alternative method acceptable to the Department isrequired for PM2.5 testing. As the method quoted in the approval is not valid for stacks withpotential for entrained water droplets in the exhaust (which applies to boilers and dissolving tankat Northern) or cyclonic flow (which applies to the Lime Kiln), we propose microscopic analysis offilters as the viable option. This method involves analysis of total particulate matter filters (collectedas described above) for fine particulate percentage.
The particle size analyses will be performed by MVA Scientific Consultants, based in Duluth, GA.using a JEOL JSM-6500F field emission scanning electron microscope operating in automatedmode under the control at a Thermo Scientific Noran System SIX x-ray analysis system, using theirautomated particle size analysis method.
Total Reduced Sulphur: The source emissions testing of the Ume Kiln, the Smelt Dissolving Tank andthe High Level Root Vent for total reduced sulphur will be conducted in accordance with US EPAMethod 1 6B. In this method, the sample is extracted from the exhaust gas of the stack through aheated Teflon line. The sample is chilled and then posses through an 502 analyzer to measure SO2from the source. The sample exits the analyzer and is then passed through a furnace where allsulphur compounds in the gas stream are thermally oxidized to SO2, this SO2 is measured in asecond inline analyzer. The difference in the initial 502 and the final 502 measurement is the totalreduced sulphur concentration (reported as H25). The analyzers are both Western Research SO2non-dispersive ultra-violet (NDUV) continuous analyzer. Monitoring will be conducted continuouslyover a 24 hour period as required by the approval condition.
Chlorine, Chlorine Dioxide (C12, dO2): Samphng will be conducted in accordance with NCASI’ssampling method which consists of the extraction of a sample bubbling through midget impingersand subsequent analysis by titration. The sampling train for the Cl2 and C102 consists of series ofthree mini impingers, connected by Teflon tubing. The first two impingers each contain 20 ml ofpotassium iodide (KI) solution buffered with potassium di-hydrogen phosphate (KH2PO4). The thirdimpinger contains silica gel to remove any remaining moisture from the gas stream. The impingersore cooled by an ice bath, and the dried gas is then drawn through the sampling train with acalibrated pump. Total sampling time for each test is sixty (60) minutes.
Design with cammunify in mind
3February 20, 2015Mr. Marc TheñaulfPage 5of 12
Reference: Pre-Test Plan br Source Emissions Testing Northern Pulp,Plctou MIII —2015 Calendar Year
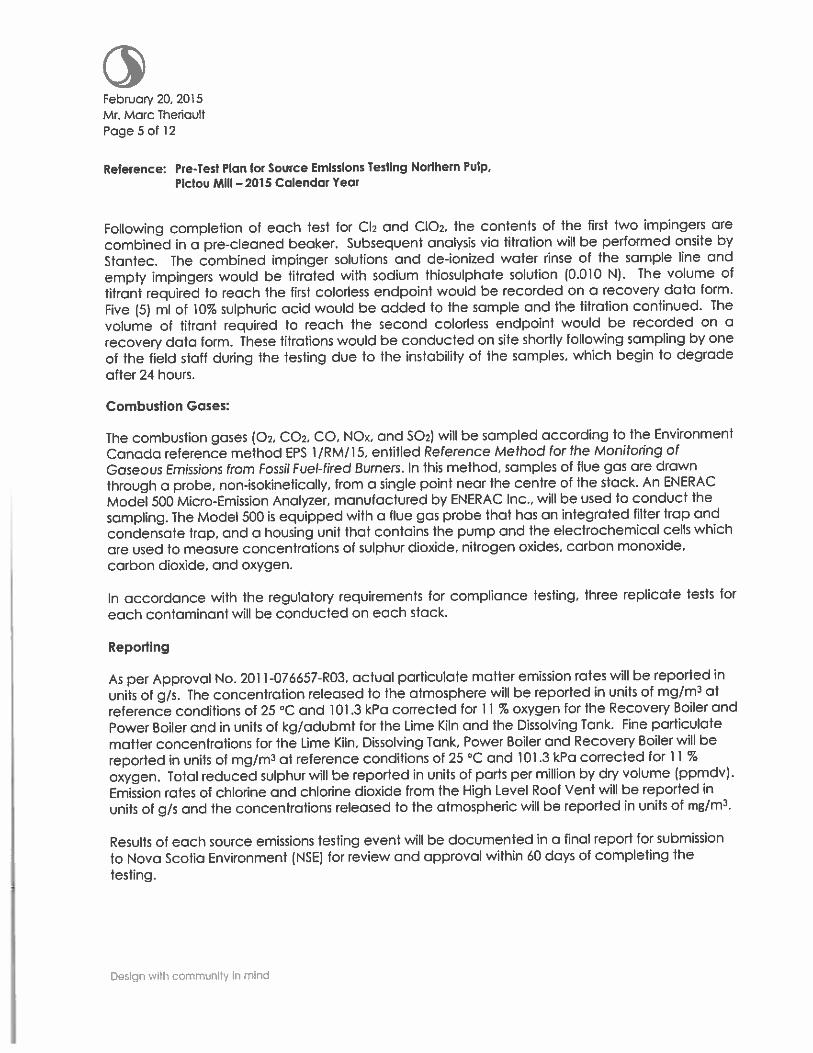
Following completion of each test for C12 and Cl02, the contents of the first two impingers are
combined in a pre-cleaned beaker. Subsequent analysis via titration will be performed onsite by
Stantec. The combined impinger solutions and de-ionized water rinse of the sample line and
empty impingers would be titrated with sodium thiosulphate solution (0.010 N). The volume of
titrant required to reach the first colorless endpoint would be recorded on a recovery data form.
Five (5) ml of 10% sulphuric acid would be added to the sample and the titrotion continued. The
volume of titrant required to reach the second colorless endpoint would be recorded on a
recovery data form. These titrations would be conducted on site shortly following sampling by one
of the field staff during the testing due to the instability of the samples, which begin to degrade
after 24 hours.
Combustion Gases:
The combustion gases (02, C02, CO. NOx, and 502) will be sampled according to the Environment
Canada reference method F’S 1/RM/15, entitled Reference Method for the Monitoring of
Gaseous Emissions from Fossil Fuel-fired Burners. In this method, samples of flue gas are drawn
through a probe, nan-isokinetically, from a single point near the centre of the stack. An ENERAC
Model 500 Micro-Emission Analyzer, manufactured by ENERAC Inc., will be used to conduct the
sampling. The Model 500 is equipped with a flue gas probe that has an integrated filter trap and
condensate trap, and a housing unit that contains the pump and the electrochemicol cells which
are used to measure concentrations of sulphur dioxide, nitrogen oxides, carbon monoxide,
carbon dioxide, and oxygen.
In accordance with the regulatory requirements for compliance testing. three replicate tests for
each contaminant will be conducted on each stack.
Reporting
As per Approval No. 2011 -076657-R03, actual particulate matter emission rates will be reported in
units of g/s. The concentration released to the atmosphere will be reported in units of mg/rn3 atreference conditions of 25 °C and 101.3 kPa corrected for 11 % oxygen for the Recovery Boiler ond
Power Boiler and in units of kg/adubmt for the Lime Kiln and the Dissolving Tank. Fine particulate
matter concentrations far the Lime Kiln, Dissolving Tank, Power Boiler and Recovery Boiler will bereported in units of mg/rn3 at reference conditions of 25 °C and 101.3 kPa corrected for 11 %
oxygen. Total reduced sulphur will be reported in units of parts per million by dry volume (ppmdv).
Emission rates of chlorine and chlorine dioxide from the High Level Roof Vent will be reported in
units of g/s and the concentrations released to the atmospheric will be reported in units of mg/m3.
Results of each source emissions testing event will be documented in a final report for submission
to Nova Scotia Environment (NSE) for review and approval within 60 days of completing the
testing.
Design wilh cornmuniiy In mind

(3February 20, 2015Mr. Marc ThehaultPage 6 of 12
Reference: Pre-Test Plan for Source Emissions Testing Northern Pulp.Pictou MIII — 2015 Calendar Year
Sampling Locations
The number and location of sample points along each traverse were previously determinedaccording to EPS 1 /RM/8. Method A, using the exhaust stack diameter. A diagram of a typicalsample location is provided in Figure 2.
Figure 1 Source Emission Testing, Method 5 Sampling Train
Design wiih community In mind

February 20, 2015Mr. Marc ThehaultPage 7 of 12
Reference: Pre-Test Plan for Source Emissions Testing Northern Pulp,Picicu MIII —2015 Calendar Year
Figure 2 Source Emissions Testing, Sample Location Details
nL r.oa,
Design wilh community in mind
February 20,2015Mr. Marc TheriaultPage8af 12
Reference: Pre-Test Plan for Source Emissions resting Northern Pulp,PIctou MIII —2015 Calendar Year
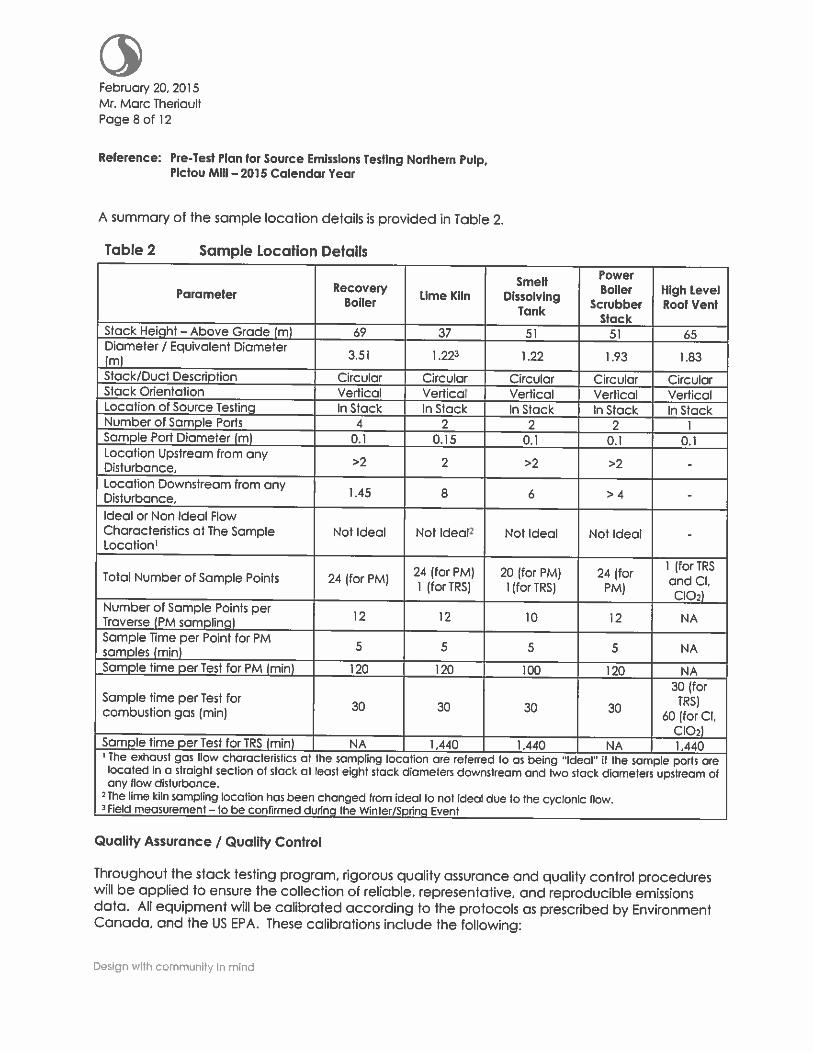
A summary of the sample location details is provided in Table 2.
Table 2 Sample Location Details
PowerRecovery me
Boiler High LevelParameter Lime Kiln DissolvingBoiler Scrubber Roof VentTankStack
Stock Height — Above Grade (m) 69 37 51 51 65Diameter / Equivalent Diameter
3.51 1 .22 I .22 1 .93 1 .83
StacklDuct Description Circular Circular Circular Circular CircularStack Orientation Vertical Vertical Vertical Vertical VerticalLocation of Source Testing In Stack In Stack In Stack In Stack In StackNumber of Sample Ports 4 2 2 2 1Sample Port Diameter (m) 0.1 0.15 0.1 0.1 0.1Location Upstream from any
>2 2 >2 >2 -Disturbance,Location Downstream from any
1 45 8 6 >4 -Disturbance,Ideal or Non Ideal FlowCharacteristics at The Sample Not Ideal Not Ideal2 Nat Ideal Not Ideal -
Locatiant
1 (forTRSTotal Number of Sample Points 24 (for PM) 24 (for PM) 20 (for PM) 24 (for
and Cl,1 (for TRS) I (far TRS) PM)00’)
Number of Sample Points per12 12 10 12 NATraverse (PM sampling)
Sample lime per Point for PM5 5 5 5 NAsamples mm)
Sample time per Test for PM (mm) 120 120 100 120 NA30 (for
Sample time per Test for30 30 30 30
TRS)combustion gas (mm) 60 (for Cl,
002)Sample time per Test for TRS (mm) NA 1,440 1,440 NA 1.440‘ The exhaust gas tlaw characteristics at the sampling location are referred to as being “Ideal” ii the sample ports arelocated in a straight section of stack at east eight stack diameters downstream and two stack diameters upstream ofany flow disturbance.
2The lime kiln sampling locatian has been changed from ideal to not ideal due to the cyclanic flaw.measurement — to be confirmed during the Winter/Spring Event
Quality Assurance / Quality Control
Throughout the stack testing program, rigorous quality assurance and quality control procedureswill be applied to ensure the collection of reliable, representative, and reproducible emissionsdata. All equipment will be calibrated according to the protocols as prescribed by EnvironmentCanada, and the US EPA. These calibrations include the following:
Design with cammunity In mind

‘3February 20, 2015Mr. Marc TheriaultPage 9 of 12
Reference: Pre-Test Plan for Source Emissions Testing Northern Pulp,Pictou MIII —2015 Calendar Year
Pitots: calibrated in a wind tunnel with probe and nozzles attached;Gas meters: calibrated against a critical orifice set;Thermocouples: calibrated using a potentiometric technique:Nozzle: four diameter measurements made using a micrometer across the
sharpened edges: andCombustion Gas Analyser: 2 point calibrations using span gases of known concentrations.
Calibration data will be provided in the final report.
Quality control checks will be performed at several stages during the testing program to ensure
the collection of representative samples and the generation of valid results. These checks oreperformed by test personnel throughout the program under the guidance of the source testingcrew chief. The Quality Control (QC) checks include the following:
• Use of standardized checklists and field notebooks to ensure completeness, traceability, ond
comparability of the process information and samples collected;
• Field checking of standardized forms by a second person to ensure accuracy andcompleteness;
• Strict adherence to sample chain-of-custody procedures;
• Use of appropriate field blanks (e.g., filter and solution samples); and
• Leak checks of sample trains.
All internal quality assurance and quality control procedures will be strictly adhered to during alltest programs to ensure the production ot useful and high quality data throughout the course ofthe program.
Qualifications of Source Testing Team
The successful completion of this project requires the skills of competent and experienced
professionals who have a strong commitment to complete the project quickly and efficiently andto produce high quality results. The source testing team we have assembled to meet the
challenges of this assignment consists of highly trained professionals who bring a broad range of
expertise and experience to the project. The following paragraphs provide brief descriptions ofthe qualifications of the source emissions testing team:
Senior Reviewer:
Design with community in mind

February 20, 2015Mr. Marc TherjaultPage lOaf 12
Reference: Pre-rest Plan for Source Emissions Testing Northern Pulp,Pictou MHI—2015 Calendar Year
Project Manager and Report Writer:
Destgn with community in mind
February 20, 2015Mr. Marc ThehaultPage 11 of 12
Reference: Pre-test Plan for Source Emissions Testing Northern Pulp,Plctou Mill —2015 Calendar Year
Source Testing Team:
Schedule
Table 3 provides an overview at the proposed schedule to complete the testing, as described inthe above sections, for the 2015 calendar year. Stantec will confirm actual test dates, in writing,with NSE within thirty days prior to the testing commencing.
Currently we are proposing to conduct the winter testing event within the week of March 9th,
Design with community in mind

<3February 20, 2015Mr. Marc TheriaultPage l2of 12
Reference: Pre-Test Plan for Source Emissions TestIng Northern Pulp.P(ctou MIII —2015 Calendar Year
Table 3 Proposed Schedule
Event Proposed Date ScopeWinter
February-March 31 (March 9th week)Recovery and Power Boiler PM, gases,dissolving tank TRS
SpringApril-June 3Q Recovery, Power Boiler, kiln, dissolving tank
PM, gases, kiln, HLRV TRS, HLRV chlorineS urn me r
July-Sept. 30 Recovery and Power Boiler PM, gases,dissolving tank TRS
FallOctober-Dec. 31 Recovery, Power Boiler, kiln, dissolving tank
PM, PM?.5, gases, kiln, HLRV TRS
Closing
Your timely wdffen approval of this pre-test plan is greatly appreciated. If you have any questions.please do not hesitate to contact me directly at (902) 468-7777.
Regards,
STANTEC CONSULTING LTD.
hw9ojkJ UGillian Hatcher Vicky CorningFroject Manager — Environmental Services Team LeadPhone: (902) 468-7777 Phone: (506) 457-3200Fax: (902) 468-9009 Fax: (506) 452-7652
stantec.corn stantec.corn
v:\t2I4\ccthe\12t4’3\I2t4I3456_.2OI5sccK.’esi9gnp\’eoo’t;ng\e-est par\e’tes p:sn nahe,r cutcDt5vtocx
Design with community in mind

SOURCE EMISSIONS TESTING — RECOVERY BOILER AND POWER BOILER, WINTER 2015
Appendix BCalibration Data
Stantec
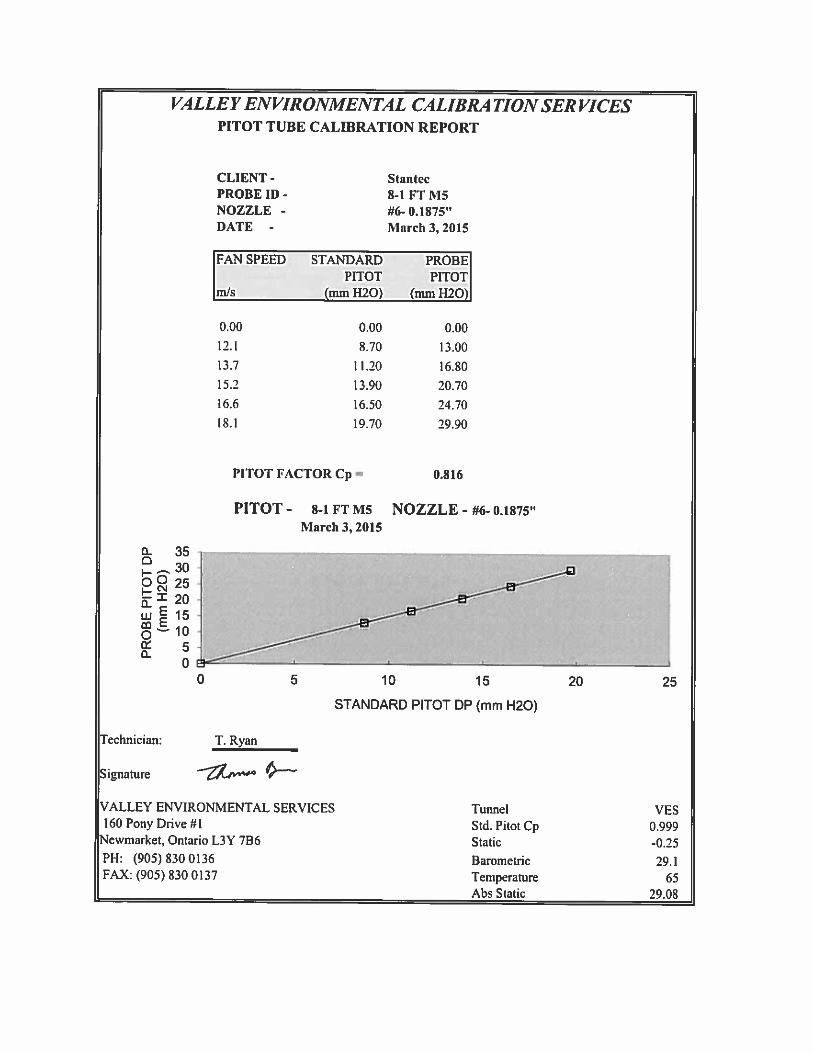
VALLEY ENVIR ONMENTAL CALIBRA TION SER VICESPITOT TUBE CALIBRATION REPORT
aC
—x
wE
C
0
CLIENT -
PROBE ID -
NOZZLE -
DATE -
0.00
12.1
13.7
15.2
16.6
18.1
0.00
8.70
11.20
13.90
16.50
19.70
S (an Ice81 FT MS#6- 0.1875”March 3,2015
0.00
13.00
16.80
20.70
24.70
29.90
rechnician: T. Ryan
Signature
VALLEY ENVIRONMENTAL SERVICES160 Pony Drive #1
Newmarket, Ontario L3Y 7B6
PH: (905)8300136FAX: (905) 830 0137
FAN SPEED STANDARD PROBEPITOT PITOT
mIs (mm H2O) (mm H20)
PITOT FACTOR Cp = 0.816
PITOT - 8-1 FT MS NOZZLE - #6- 03875”March 3, 2015
353025201510
50
0 5 10 15 20 25
STANDARD PITOT DP (mm H20)
TunnelStd. Pilot Cp
VES0.999
Static -0.25BarometricTemperatureAbs Static
29.165
29.08
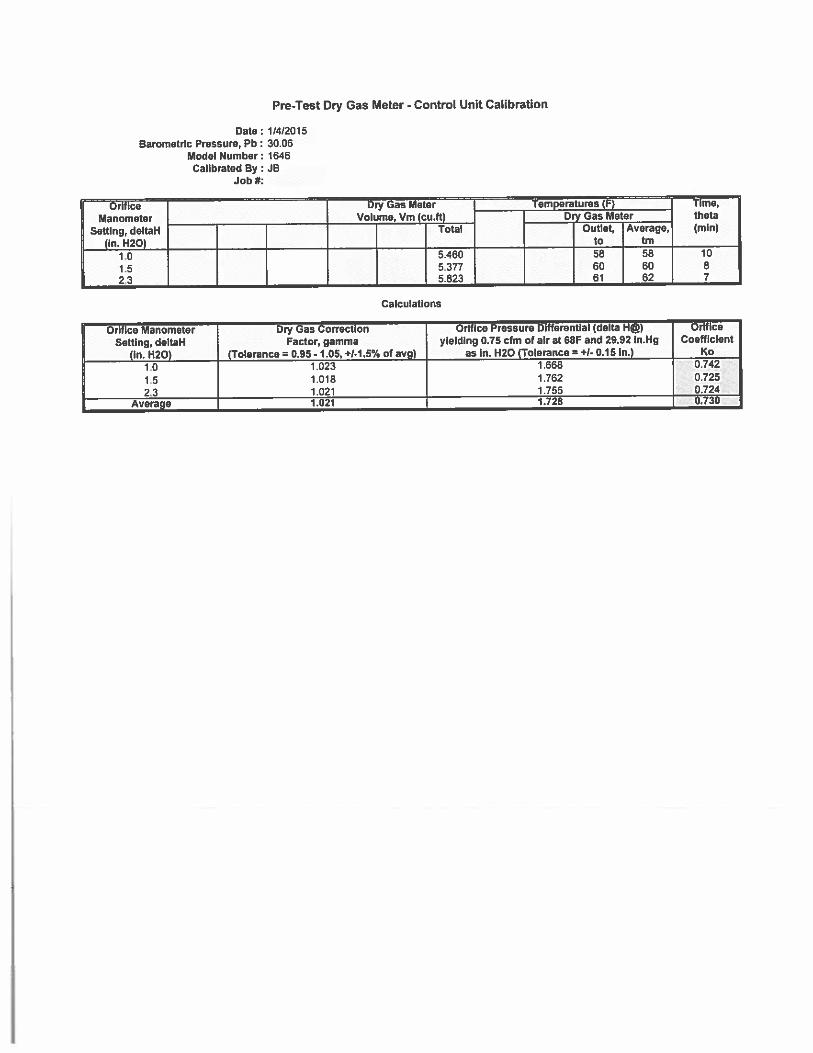
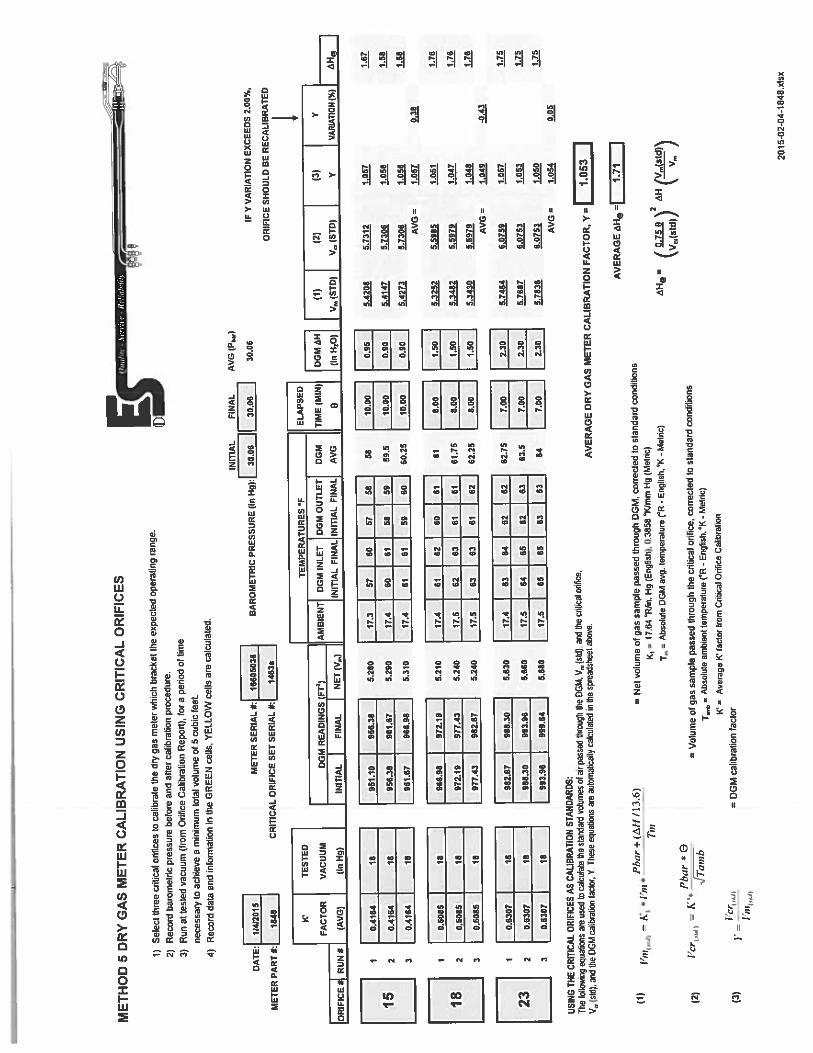
Data 114/2015Barometric Pressure, Pb 30.06
Model Number: 1646Calibrated By : JB
Orifice Manometer Dry Gas Correction Orifice Pressure Differential (delta H@) Orifice
Setting, deitaH Factor, gamma yielding 0.75 cfm of air at 6SF and 29.92 in.Hg Coefficient
(in. H20) (Tolerance = 0.95-1.05, +1-1.5% of avg) as in. H2O (Tolerance = +/-0.15 In.) Ko
1.0 1.023 1.668 0.742
1.5 1.018 1.762 0.725
2.3 1.021 1.755 0.724Average 1021 1.728 0.730
Pre-Test Dry Gas Meter - Control Unit Calibration
Job #:
Calculations

Pre-Test Dry Gas Meter - Control Unit Calibration
Date : 114(2015Barometric Pressure, Pb : 30.06
Model Number: 1848Calibrated By JB
Job #:
Orifice Diy Gas Meter Temperatures (F) Time,Manometer Volume, Vm (cu.ft) Diy Gas Meter theta
Setting, deitaK Total Outlet, Average, (mm)(In. Ff20) to tm
0.9 5.293 59 59 101.5 5230 61 62 82.3 5657 53 63 7
Calculations
Orifice Manometer Dry Gas Correction Orifice Pressure Differential (delta H@) Orif IceSetting, deltaFf Factor, gamma yielding 0.75 cfm of air at 6SF and 29.92 in.Hg Coefficient
(In. H2O) (Tolerance = 0.95- 1.05, +1-1.5% of avg) as in. Ff20 (Tolerance = +1- 0.15 In.) Ko0.9 1.057 1.608 01541.5 1.049 1.759 0.7272.3 1.054 1.751 0.725Average 1.053 1.706 0.735
ME
TH
OD
&D
RY
GA
SM
ET
ER
CA
LIB
RA
TIO
NU
SIN
GC
RIT
ICA
LO
RIF
ICE
S
I)S
elec
tth
ree
criti
cal
mif
lces
toca
libr
ate
the
dry
gas
met
erw
hich
brac
ket
the
expe
cled
oper
atin
gra
nge.
2)R
ecor
dba
rom
etri
cp
ress
ure
befo
rean
daf
ter
cali
brat
ion
proc
edur
e.
3)R
unat
test
edva
cuum
(fro
mO
rifi
ceC
alib
ratio
nR
epor
t),
for
ape
riod
oftim
e
nece
ssar
yto
achi
eve
am
inim
umto
tal
volu
me
of5
cubi
cre
et.
4)R
ecor
dda
taan
din
fonn
atio
nin
the
GR
EE
Nce
lls.
YE
LL
OW
cell
sar
eca
lcul
ated
.
USI
NG
THE
CR
ItIC
AL
ORI
FICE
SAS
CALI
BRA
TIO
NST
AN
DA
RDS:
The
follo
wing
equa
tions
amus
edto
calc
ulat
eth
est
anda
rdvo
lum
esot
airp
sed
thro
ugh
the
0GM
,V,
(std
),an
dth
ecr
itica
l oitc
e.
Va
(std
),an
dth
e0G
Mca
libra
tion
fto
r,Y.
Thes
eeq
uatio
nsam
auto
mat
caty
calc
ulat
edin
the
spre
adsh
eet
ahov
e.A
VE
RA
GE
DR
YG
AS
ME
TE
RC
AL
IBR
AT
ION
FAC
TO
R,
Y=
I1.
053
(1)
rn.
=K
,*
*P
/jar
+(A
u,t1
6)
IT,
n
Pb
ar*
O(2
)Ic
r1,,
=‘i
ram
b
=N
etvo
lum
eof
gas
sam
ple
pass
edth
roug
h0G
M,
corr
ecte
dto
stan
dard
cond
itio
ns
K,=
17.6
4‘R
Ein.
Hg
(Eng
ish)
,0.
3558
‘iQ
nmH
g(M
etric
)
7,
=Abs
olut
e0G
Mav
g.le
mpe
ratu
re(‘
R-
Eng
lish,
‘K-
Met
ric)
Vol
ume
ofga
ssa
mpl
epa
ssed
thro
ugh
the
criti
cal
orif
ice,
corr
ecte
dto
stan
dard
cond
itio
ns
=Abs
olut
eam
bien
tte
nper
alur
e(‘
R-
Eng
lish.
‘K.
Mel
ric)
AV
ER
AG
E=(
1.11
AH
r(P
2is
;2H
’V,,(s
td)
\V.,(s
td))
\V
,
(3)
=D
GM
calib
ratio
nfa
ctorK’
=A
vera
geK’
fact
orfr
omC
nlic
alO
nfic
eC
altr
atio
n
DA
TE:
1141
2015
ME
TE
RPA
RT
4:184
MET
ERSE
RIA
LL
1660
5036
CR
ITIC
AL
OR
IFIC
ESE
TSE
RIA
L#:
1463
s
IORIF
ICE
RUN
C
K’
FAC
TO
R
(AV
G)
TEST
ED
VA
CU
UM
tinH
g)
INm
AL
FIN
AL
AV
G(P
h.,)
BA
RO
MET
RIC
PRE
SSU
RE
(inH
g):1
30.0
6II
30.0
6I
30.0
6
0GM
RE
AD
ING
S(A
4)
INIT
iAL
IFI
NA
LIN
Er(
V,,)
0.41
6418
0.41
6418
0.41
641!
TE
MPE
RA
TU
RE
S‘F
0GM
INLE
T
INI’
flAL
FIN
AL
951.
1095
6.38
956.
3896
1.67
961.
6796
6.98
0GM
OU
TLET
INIT
IAL
FIN
AL
0.50
85
0GM
AV
G
2 3 2 3 2 3
EL
APS
ED
TIM
E(M
IN)
0
13
0.50
4518
IFY
VA
RIA
TIO
NE
XC
EE
DS
2.00
%,
OR
IFIC
ESH
OU
LD
BE
RE
CA
LIB
RA
TE
D
I0G
M&
H
(inH
5O)
0.50
85
966.
98
17.3
5760
17.4
6061
5859
17.4
6161
5960
18
972.
19
972.
19
(1)
(2)
V,
(570
)V
.,(S
TD)
23
977.
43
977.
43
17.4
5.28
0
5.29
0
5.31
0
5.21
0
5.24
0
5.24
0
5.63
0
5.66
0
5.65
0
61
982.
67
(3)
Y
VV
ARI
AflO
N(%
)
17.5
0.63
0718
0.63
0718
0.63
0718
62
62
6081
63
17.5
61
63
61
63
982.
6796
8.30
984.
3099
3.96
993.
9699
9.64
6162
17.4
,,,jI...,L
!L..62
62
17.5
6465
6263
17.5
6565
6363
5810
.00
0.95
5.42
085.
7312
1.05
71.
67
59.5
10.0
00.
905.
4147
5.73
061.
058
1.58
60.2
510
.00
0.90
5.42
735.
7306
1.05
61.
58
AV
G=
1.05
70.
38
618.
001.
502Z
25.
5965
IZ
61.7
56,
001.
505.
3482
5.59
791.
047
1.76
52.2
55.
001.
505.
3430
5.59
791,
045
1.76
AV
G=
1.04
9-0
.43
62,7
57.
002.
305.
7464
6.07
591.
057
1.75
63.5
7.00
2.30
5165
76.
0753
1.05
31.
75
647.
002.
305,
7836
6.07
531.
050
1.75
AV
G=
1.05
40.
05
201
5-02
-04-
164
8.xI
sx
ME
TH
OD
5D
RY
GA
SM
ET
ER
CA
LIB
RA
TIO
NU
SIN
GC
RIT
ICA
LO
RIF
ICE
S
1)S
elec
tth
ree
criti
cal
orif
ices
toca
libr
ate
the
dry
gas
met
erw
hich
brac
ket
the
expe
cted
oper
atin
gra
nge.
2)R
ecor
dba
rom
etri
cpr
essu
rebe
fore
and
afte
rca
libr
atio
npr
oced
ure.
3)R
unat
test
edva
cuum
(fro
mO
rifi
ceC
alib
ratio
nR
epor
t),
for
ape
riod
oftim
ene
cess
ary
toac
hiev
ea
min
imum
tota
lvo
lum
eof
5cu
bic
feel
.4)
Rec
ord
data
and
info
rmat
ion
inth
eG
RE
EN
cells
,Y
EL
LO
Wce
llsar
eca
lcul
ated
.
Qaa
lin’—
Srn’
kr’
Itt’
1iah
ilir
4 V
INIT
IAL
FIN
AL
AV
G(P
,,)
BA
RO
MET
RIC
PRE
SSU
RE
(InH
g):1
30.0
6II
30.0
6I
30.0
6IF
YV
ARI
ATI
ON
EXC
EED
S2.
00%
,
1758
5858
56
16.5
5858
5857
16.5
5859
5758
17.5
6163
6061
17.6
6364
6161
17.6
6465
6162
OR
IFIC
ESH
OU
LDB
ER
ECA
LIB
RA
TED
I(1
)(2
)(3
)Y
V,
(STD
)V
,,(S
TD)
YVA
RIAT
ION
1%)
5810
.00
0.95
5.58
505.
7330
1.02
61.
67
57.7
510
.00
0.95
5.61
655.
7360
1.02
11.
67
5810
.00
0.95
5.61
585.
7350
1.02
11.
67
AV
G=
1.02
30.
23
59.7
58.
001.
505.
4917
5.60
261.
020
1.76
60.5
8.00
1.50
5.50
435.
6002
1.01
71.
76
60.7
56.
001.
505.
5118
5.59
911.
016
1.76
AV
G=
1.01
84.2
7
61.2
57.
002.
305.
9677
6.07
531.
016
1.76
62.2
57.
002.
305.
9358
6.07
461.
023
1.76
637.
002.
30j4
Z6.
0746
1.02
11.
75
AV
G=
1.02
10.
04
AV
ER
AG
ED
RY
GA
SM
ET
ER
CA
LIB
RA
TIO
NF
AC
TO
R,
YI
1.02
1
16.7
17.1
17.3
60 61 62
61 62 61
59 59 60
59 60 60
(I)
=*
Pbar
±(A
1!1
13.6
)
mu
Pbur
*0
(2)
lcr,
,1A.
*
vTa
rn?,
(3)
—
______
—‘‘
“lI
MO
=N
etvo
lum
eof
gas
sam
ple
pas
sed
thro
ugh
DG
M,
corr
ecte
dto
stan
dar
dco
ndit
ions
K,=
17.6
4‘R
fln.
Hg
(Eng
lish)
.0.
3858
‘K/m
mH
g(M
etric
)
T,,
=A
bsol
ute
DG
Mav
g.te
mpe
ratu
re(‘
R-
Eng
lish,
‘K-
Met
ric)
=V
olum
eof
gas
sam
ple
pas
sed
thro
ugh
the
crit
ical
orif
ice,
corr
ecte
dto
stan
dar
dco
ndit
ions
T,,,,
..=
Abs
otut
eam
bien
tte
mpe
ratu
re(‘
R.
Eng
lish,
‘K-
Met
ric)
K’A
vera
geK
fact
orfr
omC
ritic
alO
ntic
eca
libra
tion
=0G
Mca
libr
atio
nfa
ctor
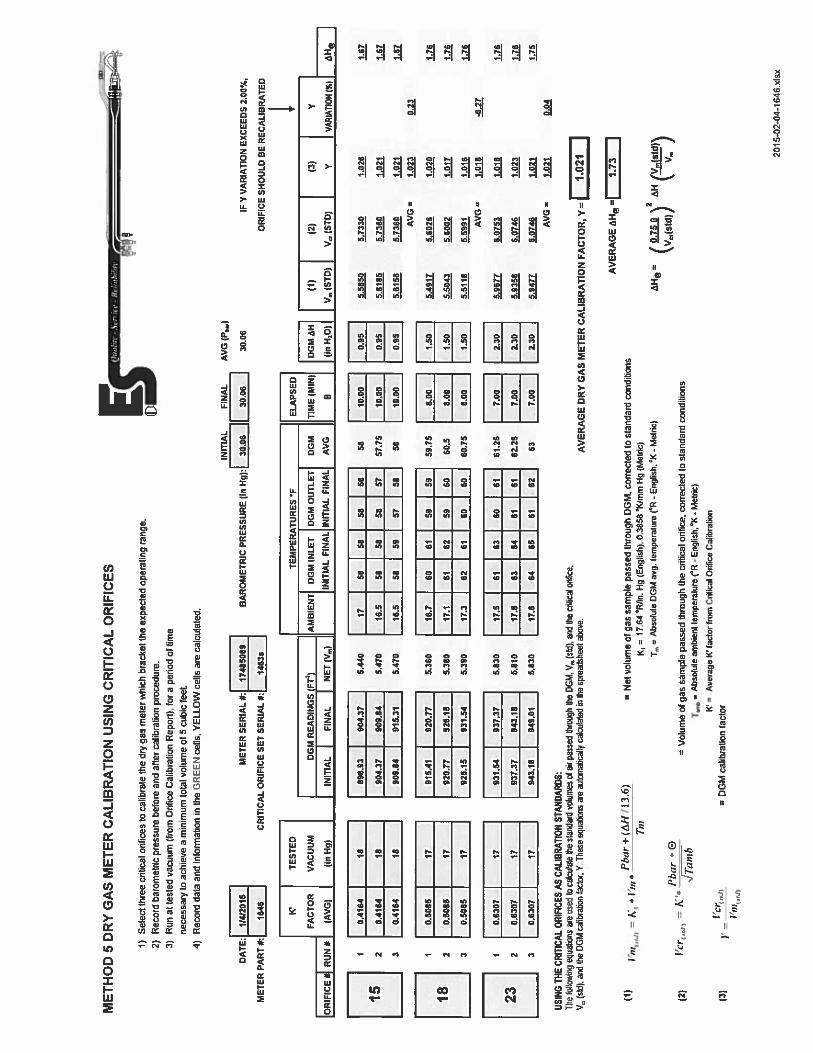
AV
ER
AG
EA
He
=11.
73
AH
(PJi
fl,,2
5H(V
m(s
td)
\V,,(s
td))
\v,
,
DA
TE:
1/4/
2015
ME
TE
RP
AR
T#:
1646
ME
TE
RSE
RIA
L#:
1748
5069
CR
ITIC
AL
OR
IFIC
ESE
TSE
RIA
L#:
1463
s
IOR
IFIC
Eii
RU
N#
K’
FAC
TO
R
(AV
G)
TE
STE
D
VA
CU
UM
(inH
g)
0GM
RE
AD
ING
S(F
T’)
INIT
IAL
IFI
NA
LN
ET(V
,,)
0.41
6416
0.41
6418
0.41
6418
AM
BIE
NT
TE
MPE
RA
TU
RE
S‘F
DG
MIN
LET
INIT
IAL
FIN
AL
898.
9390
4.37
904.
3790
9.84
909.
8491
5.31
DG
MO
UT
LE
T
INIT
IAL
FIN
AL
152 3
182 3
232 3
0.50
85
0CM
AV
G
EL
APS
ED
TIM
E(M
IN)
0
0.50
85
17 17
0GM
AH
(inH
1O)
0.50
85
915.
4192
0.71
17
920.f
l92
6.15
926.
15
5.44
0
5.47
0
5.47
0
5.36
0
5.38
0
5.39
0
5.83
0
5.8
10
5.83
0
931.
54
0.63
0717
0.63
0717
0.63
0717
931.
5493
7.37
937.
3794
3.18
943.
1894
9.01
USI
NG
THE
CRIT
ICA
LO
RIFI
CES
AS
CALI
BRA
TIO
NST
AN
DA
RDS:
The
follo
win
geq
uatio
nsam
used
toca
lcul
ate
the
stan
datfi
volu
mes
ofai
rpa
ssed
thro
ugh
the
0GM
,V
,,(s
td),
and
the
criti
cal
orifi
ce,
V(s
td),
and
the
0GM
calib
ratio
n(t
or,
Y.T
hese
equa
tions
are
auto
mat
icat
yca
lcul
ated
inth
esp
read
shee
tab
ove.
2015
’02’
04-1
646.
xlsX

Calibration DataEnerac 500 Combustion Analyzer
Stantec Consulting Ltd.Location: Fredericton, NBDate: March 11,2015
Pre-Test Calibration Post Test Check
G Date 11-Mar-is Date 11-Mar-15Parameter Unit
pan asPersonnel NGM Personnel NGM
Concentration Ambient Air Span Gas Ambient Air Span GasReading Reading Reading Reading
Co ppm 200 0 193 0 2001000 1012 1001
SO2 ppm 200 0 178 0 200
NOX ppm 200 0 198 0 200

VALLEVENVIRONMENTAL CALIBRATIONSER VICES
35
25
E’ 20Lu 15mao 10
500
PITOT TUBE CALIBRATION REPORT
CLIENT -
PROBE ID -
NOZZLE -
DATE -
0.00 0.00
8.90 14.10
11.10 17.80
13.70 21.80
16.70 26.40
19.70 31.10
Technician: T. Ryan
Signature jZ,w.ec __
VALLEY ENVIRONMENTAL SERVICES160 Pony Drive #1
Newmarket, Ontario L3Y 786
PH: (905)8300136FkX: (905) 830 0137
TunnelStd. Pitot CpStatic
BarometricTemperature
VES0.999-0.25
29.1565
Stantec2FT MS#8- 0.250”Fcbruary 23, 2015
FAN SPEED STANDARD PROBEH PITOT PITOT
rn/s H: .(rnrnH2O) (mmH2O)
0.00
12.2
13.6
15.1
16.7
18.1
PITOT FACTOR Cp = 0.794
PITOT - 2Ff MS NOZZLE - #8- 0.250”February 23, 2015
0 5 10 15 20 25
STANDARD PITOT OP (mm H20)
Abs Static 29.13

Stantec Consulting Ltd.Steel Nozzle Calibration Data Sheet
NozzlelD Nozzle_Diameter_(inches)
Set - 1 <1> <2> <3> <4> Hi-Lo Avg.
1-4 0.125 0.124 0.125 0.125 0.001 0.125
1-6 0.175 0.173 0.165 0.175 0.010 0.172
1-8 0.236 0.232 0.234 0.232 0.004 0.234
1-10 0.307 0.305 0.308 0.305 0.003 0.306
1-12 0.367 0.372 0.367 0.371 0.005 0.369
1-14 0.434 0.434 0.433 0.434 0.001 0.434
1-16 0.500 0.497 0.503 0.501 0.006 0.500
QNQC Check
Each Diameter Measured To Within = 0.001 InchesHigh - Low <1= 0.004
Prepared By: JJB Date: Feb 05, 2015
SOURCE EMISSIONS TESTING — RECOVERY BOILER AND POWER BOILER, WINTER 2015
Appendix CField Data Sheets
Stantec

MOISTURE FIELD DATA SHEET
Moisture Data
Impingor No. Impinger Final Weight Tare Weight Weight ofContents (g) (g) Moisture (g)
I IOOmLH2O
2 100mLH2O L/3, I3 Blank 1o5t jOg
4 200gSiNcaGeI 99 U i 3
Total Weight Gain (g)
Moisture Volume (niL) IS
—‘ Volume H20 Collected:
xo.045 =
ml
51 ft3H1O(Vwc)
DGM Final SO 8i ft3
DGM Initial a q
Final - Initial = - 9 ft3 (Vmc)
Moisture =
(Vwc + Vmc)
0’ 130g
Project No.:
Client:
Plant:
Location:
thfb.’9 9t’jlit F] MIPnakr €o.l.r
Test: (‘Ax — I
Stantec
Date: fr0.r ID ip,5
Analyst: ‘16 i-?
Moisture = Vwc
Moisture =

Job
No
.:M
Cli
ent
______
_____________
Pla
nt:
?.d
nL
ocat
ion:
a04r
Lit
Tes
t:L
M-‘
Dat
e:
__
__
____
Ope
rato
rs:
NM
-f4jN
.G
amm
a:(D
53
Def
taH
@:
______
__
_
Plt
otC
oeff
.:
__
__
__
__
_
Sta
fl:
LS
Fin
ish:
SO
UR
CE
TE
ST
ING
FIE
LD
DA
TA
SH
EE
T
Sta
tic
Pre
ssu
re(l
n.H
20):
0;20
Pof
lL
engt
h(i
n):
(,‘
Sta
ckD
ia.
(in.
):l-
(c”
Pro
beL
engt
h(if
):g
I
Nonle
ID(i
n.):_
4aJf
lJ3
-?J
Con
soie
SIN
:
__
__
__
_
Pre
-Tes
tL
eak
Ch
ect
Vac
uum
Pre
ssur
e:P
ost-
Tes
tL
eak
Che
ck:
Vac
utan
Pre
ssur
e:
-J
K’:
(63
Tra
vers
eT
ime
Sta
ckG
asV
eloc
ityO
rifi
ceG
asM
eter
Pro
beO
ven
Impi
nger
Gas
Met
erT
emp.
(F)
Pum
pP
oint
(mm
)T
emp.
,T
aH
ead,
dPdH
Vol
ume
Tem
p.T
emp.
Out
let
Vac
uum
(9(l
n.H
20)
(In.
H20
)(c
u.ft
)(F
)(F
)T
emp.
(9In
Out
(in.
Hg)
hI
.1S
LO
S.
z\
3,-
Li—
St
—I
s‘c
iaI
oO
p,ç
cç3
.n%
22L
a4’
L5
L52
——
It
O<
t59
L4.t
hi
4Z
—1
i°.o
cli
Sp4
.9C
M2;
’1‘j
3S
t—
)3
it..
fIL
Otà
.(oI
(0.b
+2T
h(2l
(o‘1
552
rio
%,It
tis
sa
‘I\.
\QO
Aaj
jt-
7ci
22
—,
to3
.jp
q14
Sc
s’s
-,
<iz
<\°
0,10
1-2’
-kS
235E
52
-i
tc
L.7
O\\J,
2S
o4C
\SC
0St
-i—
IL
i.IS
O,’4
DID
Zt
2t,
S2
L4
3,
Lii
54-
II
aC
35
sS
i5’
-1—
ict
‘.t5
O,}p
%4
,t).
2-o
St
SW
-i
;ç
‘50
b.R
92S
Li
Si
cm—
lI
fl
1.4
5fl
.9IT
hO
22
5(
5S
:l_
-1-
O.°’
..3le
.10
25
L5*
S9
1‘n
.rO
O5
19.1
5CC
54
4r
Lc
5D
’M).
SS
iS
9I
-iç
pO
1.8
5\O
2,
fl2ia
2%’-
cc-(
VLO
\Rfl
.O
i..,
m.ç
-21
e.9
So
sc—
iU
LOhC
Yo
19.
3c
2t.
L.
53S
ccc
tc
\y_
S1
n(in
j’),
ç.i-
çu
zrj
-n.t
3o0
(p
—1
(,o
flp
9-t
3D
’)2
9-I
‘cm
-cE
,—
(
SO
UR
CE
TE
STIN
GFI
EL
DD
ATA
SHE
ET
Job
No.
:C
lient
:P
lant
:L
ocat
ion:
td..trg4L
Tes
t:w
’—
—
Dat
e:bar
-ia
Ope
rato
rs:
b-F
AA
,..
Gam
ma:
j.os3
Deft
aH
@:_
_______
Pho
tC
oeff
.:p
9j
Sta
rtF
inis
h:
k7
’4[7
t’c
a
A±
:r
Sta
tic
Pre
ssu
re(i
n.H
20):
t)P
ort
Len
gth
(In)
:4
”S
tack
Din
.(i
n.):
.j
c.P
robe
Len
gth
(It):
__
__
__
__
__
__
Noz
zle
ID(i
n.):
—‘
(0.
Q-j
jC
onso
leSI
N:
I
Pre
-Tas
tL
eak
Che
ck:
Vac
uum
Pre
ssur
e:P
ost-
Tes
tL
eak
Che
ck:
Vac
uum
Pre
ssur
e: K’:
Tra
vers
eT
ime
Sta
ckG
asV
eloc
ityO
rifi
ceG
asM
eter
Pro
be
Ove
nim
ping
erG
.eM
eter
Tem
p.(9
Pum
pP
oint
(mm
)T
emp.
,T
aH
ead,
dPdH
Vol
ume
Tem
p.T
emp.
Out
let
Vac
uum
(F)
(in.
H20
)(i
n.H
20)
(cu.
ft)
(9(9
Tem
p.(F
)in
Out
(in.
Hg)
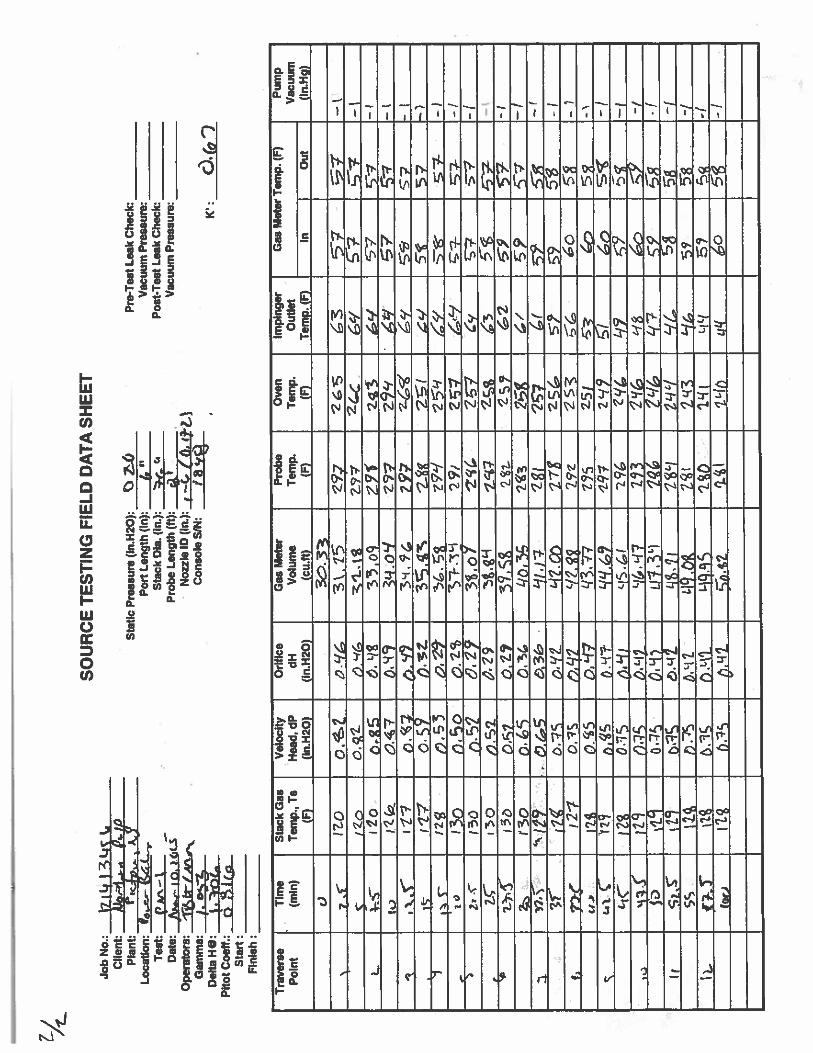
V30.3
3,
7S
aD
DV
.3L
15
£97
145
57
--
5O
i-4
177
-‘L
I2O
O.’J
S3
3,0
9p
vc
24
.W¶7
cv
-cIt
)1W
047
0.9
9i.
o’i
£7
729
’16
7-L
-till
p.%
Jô
M39,9
4297
‘-
‘Y-
I
!i1
7O
.S?
ô.f
l3,4
%2S
7C
’)5
7-)
‘1I2
?O
.S3
5t.
2S
I--)
ri3
pO
.Z’I
fl.1
’-1
29
iz,
.ci3
0r.
52
0,2
?3
toI
1;-
?-f
,z.
c30
1S
7‘Z
çj-
‘c3
bg,
c,’
o,f
l39.S
2t-
‘asy
i-
ci
-‘iS
ooJ5
O.3
.Q
p,35
2€s
26
flS
’“It
?css
o,3&
-zgj
-‘
3r
i1D
.7S
o.Y
L‘1
2.D
17K
ZS
5$
-,
t.y
-çi2
10.7
5O
’j2
29
z253
60
-,.
p,’
flq
3.7
7a5
,g
--‘
90,
qsp.
4w-1
tiC
I2’
015
o•’-’
S4
J2
%-y
—l
jZ9
Q,5
pM
?%
,qy
IL
ls
SI
-,JD
O.7
50
97
L17.
392q,
‘C-I
,L
9cq
sb.
’41
L1$
,TI
Lit
53
555%
11*
p7
5D
.9Z
L.I9
,og,
‘1-,
j,.
%O
,L-jf
l_n
O57
—1
.12
€p35
p.4
1i.q
nu4
6°
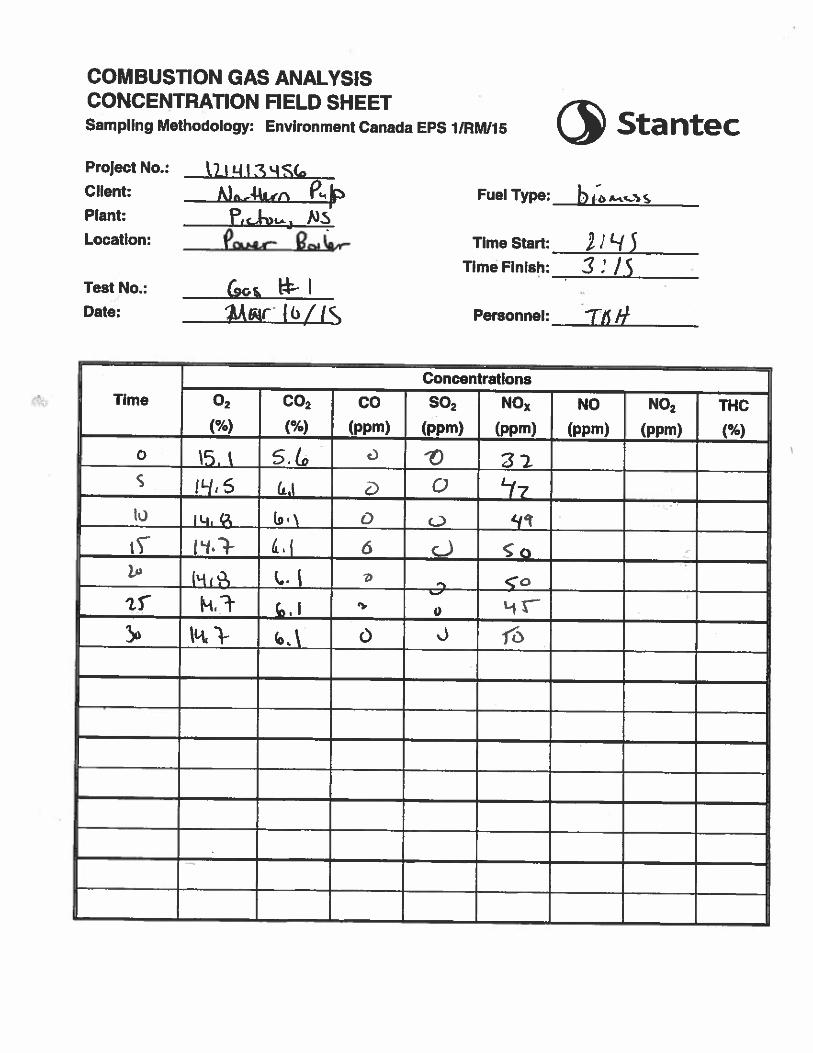
COMBUSTION GAS ANALYSISCONCENTRATION FIELD SHEETSampling Methodology: Environment Canada EPS 1/RW15 (3 Stantec
ConcentrationsTime 02 CO2 CO SO2 NOx NO NO2 THC
(%) (%) (ppm) (ppm) (ppm) (ppm) (ppm)
0 c) 13 32S (i_I a 0
. (NW:.10 0 0 ‘flc 6 U coja
D..2
if tI
S o 0
-10Project No.:
Client:
Plant:
Location:
Test No.:
Date:
Fs1
o& WI1kw (6/IS
Fuel Type:
Time Start:
Time Finish:
Personnel:
21’-i5• 3:13
WI

Project No.:
Client:
• Plant:
Location:
Test
Analyst: g/77Xg
MOISTURE FIELD DATA SHEET
Moisture Data
Impinger No. Impinger Final Weight Tare Weight Weight ofContents (g) (g) Moisture (g)
1 100mLH2O 3 7311L)
2 IOOmLH2Q a32—
3 Blank 659.54 ZOOgSiiicaG&
Total Weight Gain (g) 2nD
IMoisture Volume (mL) 1 t .
Volume H2O Collected:
XO.048 =
ml
12 .,‘Vi ft!HOwwc)
Final - initial =
Moisture =
ft3
ft3
ft3(Vmc)
Vwc(Vwc+Vmc)
Moisture = Q
M0tM.t t/gd, &hij; trpy,
Pn-”ZDate: ‘4cr It 2o;5
(3 Stantec
DGM Final
DGM InWal ),7 C
Moisture = 0

SO
UR
CE
TE
ST
ING
FIE
LD
DA
TA
SH
EE
TJo
bN
o.:
jI3’1
%C
lient:P
dpP
lant
Po..t’
j3.,;(er
Static
Pre
ssure
(ln.H20):
o.Z
0P
reTest
Leak
Check:
__
__
__
___
__
Location:
RJo.,
iKP
anL
ength(in);
6”
Vacuum
Pressure:
__
___
___
___
Test:
Pfl :2
Stack
Die.
(In.):t•’
Post-T
estL
eakC
hect
__
__
__
___
_
Date:
P4P
robeL
ength(ft):
__
__
__
__
__
Vacuum
Pressure:
__
___
___
__
Operators:
tl.ia/I
inN
onleiD
(ln.):
I-(€.(c
.sl:)
Gam
ma:
iC
onsoleSIN
:/
‘/8D
ehaHO
:;.b
K’:
Ô.g
VP
itotc
oeff.:_
__
__
__
__
Stan:£‘.‘tl
Finish:
__
__
__
__
__
__
_
Traverse
Tim
eS
tackG
asV
elocityO
rificeG
asM
eterP
robeO
venim
pingerG
asM
eterT
emp.(9
Pum
pP
oint(m
En)T
emp.,
Ta
Head,
dPdH
Volum
eT
emp.
Tem
p.O
utletV
acuum(F
)(in.H
20)(in.H
20)(cu.ff)
(F)(F)
Tem
p.(F)
InO
ut(in.H
g)0
t2..22I
1.&049
3.S
I19/
Lf1e‘-(O
-
6jqq
IS
oW
I31
‘10
-/
‘2-/L
15
it/.O
1cj9
Zfl
26g
3’
39--,
ipj.g
1.06
7.L
t-z
83Z
‘to
‘to-‘
34.6
“ISj.7
O.?9
Sg.5’(fl.5
‘to‘1
0-
i’hG
9.ig
2W
2bZ
36
Ljp
‘((N-j
Ljii,
/.54oiR
Zvy
‘to-
toL’S
SZ
.(?‘,
‘U“6
-(U
S/t,c
,,.n
63.Z
‘2w
1464/7
-(iS
1461.0
0.6’S57
S’z
‘in-I
4‘itS
“-j9o46
2%
‘Zfl
‘-ia‘q
nSo
p..
p.3
5hS
.g,
19
3aci
39
-7
151O
snfl
4L.Q
5’34
1ô
-i35
16?O
Sc,1
.7L
1.35zqt
3.
‘ftw
o-(
f(0)46
p.26L
o7
19
23c.
-(trn
o.’ico.7
5U
t36
‘11-l
‘1‘Ij.6
9.’4SS9,3’5
29?IL
?3€,
‘if‘if
-I‘16
0%
O.Th
l.oI
t7L
3L
fq..7
-(tO
HiS
‘St
6%
D,2
9n.6
72_W
i3%
‘1’-1
%o
1610.96
°15
9l.1
&1
9‘13
‘U-1
II51.6
ISnD
’Zt1
.bi
ig9
34
‘-i-1
656.2j
-jf.732?L
2S
92-I
116i.6
(91p.c
p.n
3S
S1
‘-13‘ft
-lp.s
.ts31I9
i’iL
19
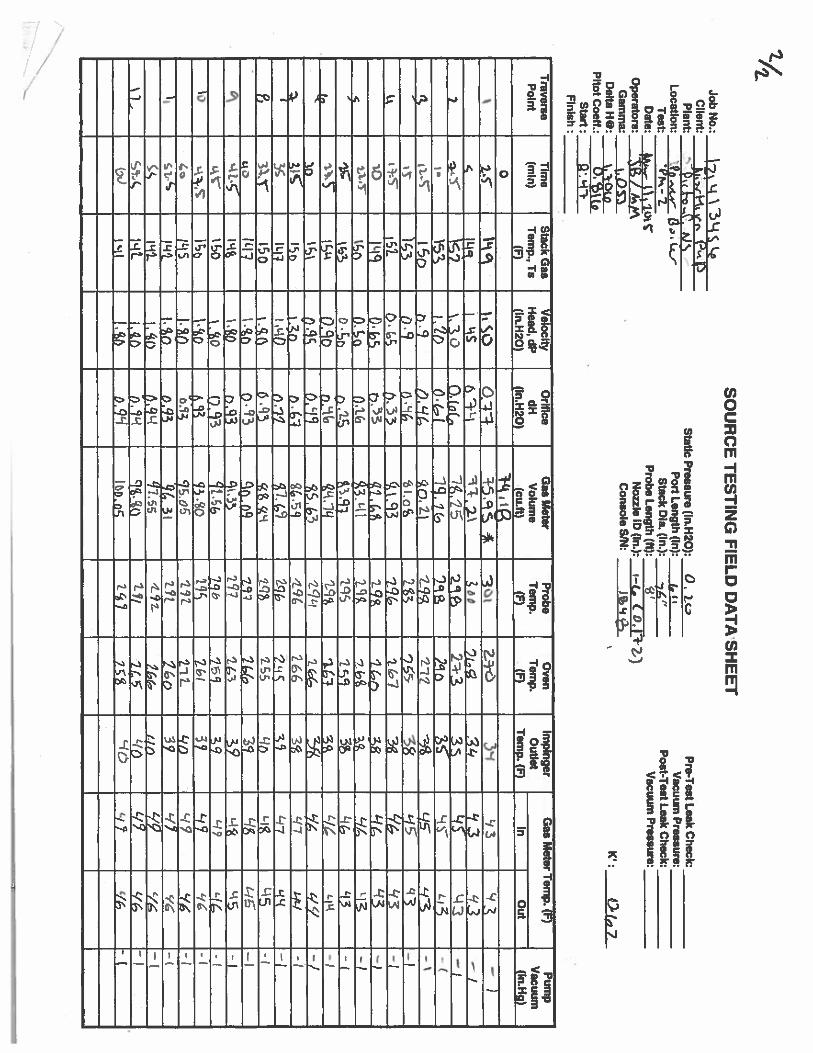
-LI“L
SO
UR
CE
TE
ST
ING
FIE
LD
DA
TA
SH
EE
TJobN
o.:_
__
__
__
__
__
__
Client:
________
__
__
__
__
__
__
__
__
__
_
Plant:
________
__
__
__
__
__
__
__
__
__
_
Location:
.Qo
.T
est:P
%-2
Date:
tA’w-I\1
lotc
Operators:
W/
Gam
ma;
______
__
__
__
DehaH
@:
Oto
Pftot
Coeft:
______
__
__
_
Start:
QM
Th
Finish:
Static
Pressu
re(ln.H
20):0
,P
ortL
ength(In):
I.‘
Stack
Dia
(in.):7%
”P
robeL
ength(ft):
WN
onleiD
(in.)
,—(..
CO
.fl-7.)
Console
SIN:
IQ
Pre-T
estL
eakC
heck_________
Vacuw
nP
ressure:
_____________
Post-T
estL
eakC
heck:
__
__
__
__
__
__
Vacuum
Pressure:
‘‘
(Jtfl
K’:
O(n
7
Traverse
Tim
eS
tackG
asV
elocityO
rificeG
asM
eterP
robeO
venIm
pingerG
asM
eter Tem
p.(F)
Pum
pP
oint(m
m)
Tem
p.,T
aH
ead,dP
dHV
olume
Tem
p.T
emp.
Outlet
Vacuum
(9(ln.H
20)(in.H
20)(cu.ft)
(F)(9
Tem
p.(F)
inO
ut(in.H
g)
°
‘abc
0.f
lR
-5as
#1
+0
39
Lj3
—
4‘iS
69.L1
‘i1-.2.\—
/1
q.L
\.OO
.(o(.L
i]-l
,2p
p.&1
99.m‘m
a-(
nn,g
c,w
.i-a-n
-‘Ii-‘
‘1E,3
0.
ti.oto
2iS37
95
38q3
—l
iS?.-i9
2W?
96it
r53
2C
qc,n
‘1%‘-‘!3
,O
.So
0.1.6,3.’11
£94IC
D.%
b0
.1.S
3)
93-(
•flh
çftg
pcs
-,
,p
.’)c0.9’?
IlL,
‘/9-/
I5bl.3
n1)41
%S
9494
26
6L
jt/-i
&L
q3‘‘19
t.fl
V.9
1gb—
,f
ISOp,q.3
‘Lq
‘165‘15
-I
Ill?i.%
ôp
.93
gp
.g1W
02’?
‘18o,
1%
1),g391.35
16
3‘-ig
45
-!‘.&
rIbO
p13
‘IZ.Sb‘-(p
-
z&
i37
‘17-l
41L
15lit)
a7&
oS191
2-iLL
jp
‘/9‘cc
-,
I.%0
0,939j,
3(Z?L
16p3?
‘/75’C
—(
csi’-lt
97%liz
.1/9
—
Lt’-it.
n.’HC
J%jp
19/7
,L
(()1/?
—i
&0,9’?
IbD.nt
?cs9
7‘/6
-

a)CCuU,
0aLUftt
1.-rnC
,W
co
rE‘a
‘aW
)Z
Dw
n.E
00
000
aa>.
——
a;L
L
EU
.
I-
-ta;
-CC00Ia;a
-a--If’
-SC
‘NcL-e‘a-J
cF’,
0za;c
ls
I-
—
C00z—I-.
a;4-
fta
ZD
,C
’
Lc-r
//

MOISTURE FIELD DATA SHEET
• Project No.:Client:
Plant:
Location:
Test:
P4clU&t p
PAi.-3
Stantec
Date: frJr. LIJLIAcAnalyst: 11Th
Moisture Data
Impinger No. Impinger Final Weight Tare Weight Weight ofContents (g) (g) Moisture (g)
1 IOOmLH2O________ 7i5 5 23o1 (2 IOOmLH2O
3 Blank (SDdO (oSQi- 2.3
4 200gSIlicaGel j6QL11( lb. iTotal Weight Gain (g)
Moisture Volume (mL)
Volume H20 Collected:
XO.046 =
ml
-t•’18 ft3H2OWwc)
0GM Final
0GM Initial
Final - Initial
Moisture =
ft3
iDO ‘S I ft3
Lt!,.(.\ ft3(Vmc)
Vwc(Vwc+Vmc)
Moisture = “tiLts
tiJtS4
MoIsture = EL’Z ,t’L

JobN
o:
13-iS
CC
Ileflt:N
tefl.e
vn
Plan
t4S
Location:
m_
,_r
&.L
t.aø
Test:
?t.
—>
Date:
lCtS
Operators:
TB
HG
amm
a:\o
’%D
eftaHO
:i.o
(.
Pftotcoeff.:
o.3
uS
tart:tO
oF
inish
:
SO
UR
CE
TE
ST
ING
FIE
LD
DA
TA
SH
EE
T
Static
Pressu
re(in.H
2O):
oZ
oP
ortL
ength(in):
C.”
-S
tackD
ia(in.):
flj.‘
Probe
Length
(ft):R
’N
on
laiD(in
.):—
(.(o
.r3z)
ConsoleS
/N:
18
4a
Pta-T
estL
eakC
heck:_V
acuumP
ressure:P
ost-Test
Leak
Check:
Vacuum
Pressure:
K’:
t2&
2
Traverse
Tim
eS
tackG
asV
elocityO
rificeG
asM
eterP
robeO
venim
pingerG
a:M.b
rTew
p.(F
)P
ump
Point
(miii)
Tem
p.,T
sH
ead,dP
dHV
olume
Tem
p.T
emp.
Outlet
-‘-
Vacuum
(9(in.H
2O)
(in.H20)
(cu.ft)(9
(9T
emp. (9
inO
ut(iaH
g)C
()O.5
i‘
iSp.ck3
oi.-
y3oo
Ztc
cIAc-is
—I
5S
L2L
3L43
c49—
j-
35
Lfl
O,S
ou
3.3
5Z
2(,
50
—I
inIS
OO
.&O
30
at
£43q9
)fl-S
15o
o.c
)0
.15
62
—/
icnS
tm
23
\OS
.59
30o
asS
—t
n-..cb
.tG
Io(0
.25
20\
52-5?
—i
0M4
lo(iI
‘rR-3
269-
s-c
o.q
9O
.23
iOT
h)
ZI
‘7Js1—
,zc
0,
tWO
.24-
2S’1-2(.S
2.
-j
‘fl—
fn’4-ç’
Cfl
zg’-t2t5
4L152
52
—Ia
o,t
CV
Vi-
ôqfl-
yç-j..,
Lfl
7S
Z_
c)
,2S9
zsi.
‘-itS
t.-—
‘-
I-ti)Iw
tn2’53
4t
Si
—)
nS
_ic
in’9-3
;it.cZ
co‘12—
ci
57
—I
14oIL
fS1M
b‘1516
297‘-//
43
-(O
g1j6
iLl295
‘-ILS
t—
‘cC199
/40
1I%
C9
115
‘ZZ
‘-IL5
3si..
-‘b
Nt
Th
9o
19&1-to
‘4?‘3
—1
,o-
O.9o
ii€S
29
5Z
13
‘—10
-cx
—?
i’flj.-T
h1).’A
9Z
93-I
ci’-n
j1DP
ML
V3I
t90
9tO
53
‘5%-‘
LH
i.ç
,gIU
.%9
o39
-L0
014’I
O.%
’jtf
liI3’?
6’?-
‘1
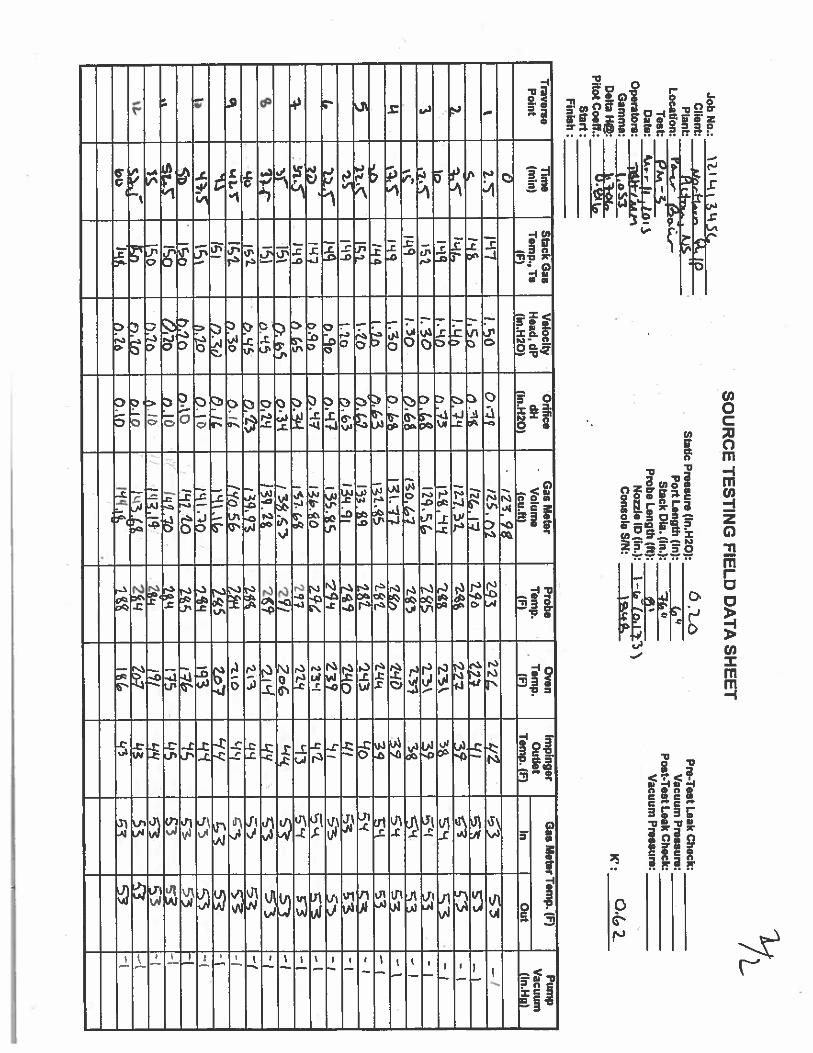
SO
UR
CE
TE
ST
ING
FIE
LD
DA
TA
SH
EE
TJobN
o.:illt4
i4
5C
Client:
Plan
tL
ocation:ra
.-C
rT
estP
M-S
Date:
kk
rrtIJfliSO
perators:yW
.WIsA
tiG
amm
a:l.o
S’3
Delta
H@
:__
__
__
__
_P
itotC
oeff.:_
___
__
__
_S
tart:
____
__
__
__
Fin
ish:
______
_______
Static
Pressu
re(in.H
20):O
.Th.oP
ortL
ength(In):
6,’
Stack
Dia.
(In.):C’
Probe
Length
(ft):
__
__
__
__
__
__
Nozzle
ID(in.):
ID(O
,I7’j
‘
Console
SIN:
__
__
__
__
__
Pre’T
estL
eakC
heck:
____________
Vacuum
Pressu
re:
___________
Post-T
estL
eakC
heck:
____________
Vacuum
Pressure:
____________
bJD
.M-sw
fl
%L
(pR
dm
.,&S
K’:
Traverse
Tim
eS
tackG
asV
elocityO
rificeG
asM
eterP
robeO
venIm
pingerG
asM
eter Tem
p.(F)
Pum
p
Point
(mm
)T
emp.,
Ts
Head,
dPdH
Volum
eT
emp.
Tem
p.O
utletV
acuum
(F)(ln.H
2O)
(in.H20)
(cu.ft)(F)
(F)T
amp.
(9In
Out
(In.Hg)
‘iT
1971.50
0fl9
/ZS
,nl
zg
32
24
42
S3
—/
ç1
gn
.(z
.r719o
—i
IJ.L
4?2-7
,3t
‘an
3?
93
-
loiq
gn,1
5It’,9
’13?,
SN
S3
-
31.3
02
.M39
-
c1.3
0IO
,G7
‘Z3
‘LV
?3€
-
M1.30
O.S
ITh.17
3?
,1M
gL.Th
t.b3
%31.S
tat
‘aq
—(
51St
1.10IM
-2
93
‘10-
is
149to
o.,3
139.9(‘aM
p‘It
-ilL—
——
-‘
1,0.90
I3S
.S2
9’,
23?
In9
395
-1
jo
,gn.9
7:3
.€0
g’L-
I
.-.lS
•149
OS
O.3’{
r’n.w
797Q
Z’f
113‘SN
-I
rIsi
p.3
’f/3
5ç,3
29
/Z
aG—
I%
fl
.‘-t5O
,t’14
39
.flU
t‘z
i4-,
.qo
o%
3,399%
Zn
L19
s.
-(‘.4L
V3
oTh1
-4
9c
-11st
(LIt
IL1L
(OZ€S
L/C
/-ç
nw
o.o
r-u.-p
55
-
5t
190bfin
I’I7.’2O‘15
c-
53
-1(S
on.I0
tIgT.7O
(75L
5£
3IS
I)tq
jq2p.g
9i
53
1-
fl,Wb
.lOV
It3.6c.Zol
4353,
—I.
bD
Ig,
n.Zo
04
0I%
‘(35
3—
t
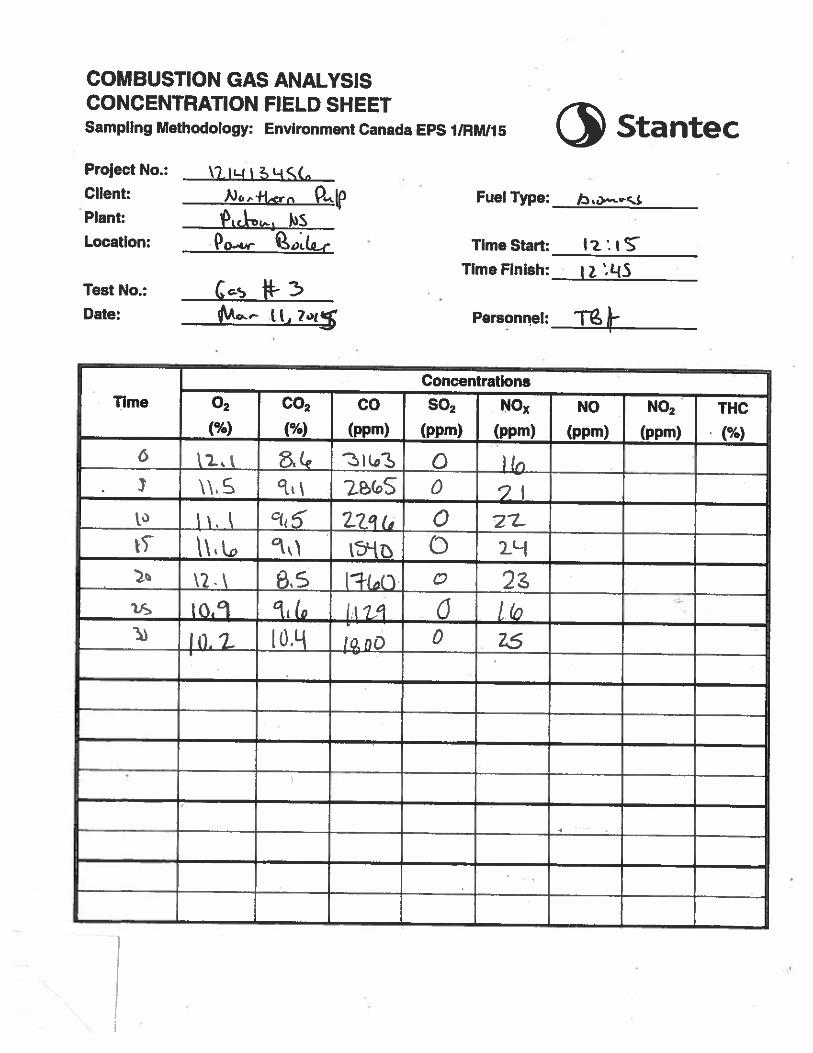
COMBUSTION GAS ANALYSISCONCENTRATION FIELD SHEETSampling Methodology: Environment Canada EPS 1IRM!15 StantecProjectNo.:
______________
Client: A)or+tcrn tp Fuel Type: h>-’-’-ssPlant: SLocation: Qovr Time Stan: 12:1 c
Time Finish: zTest No.: W 3Date: .Aar I. 7°t Personnel:
ConcentrationsTime 02 CO2 CO SO2 NOx NO NO2 THC
(%) (%) (ppm) (ppm) (ppm) (ppm) (ppm) (%)6 0 HpI 2b&S 0 91t’ 0 27-ii \u0 i-o 0
65 o 2Sus to9 10
([lit (0.9 15
,
. 4
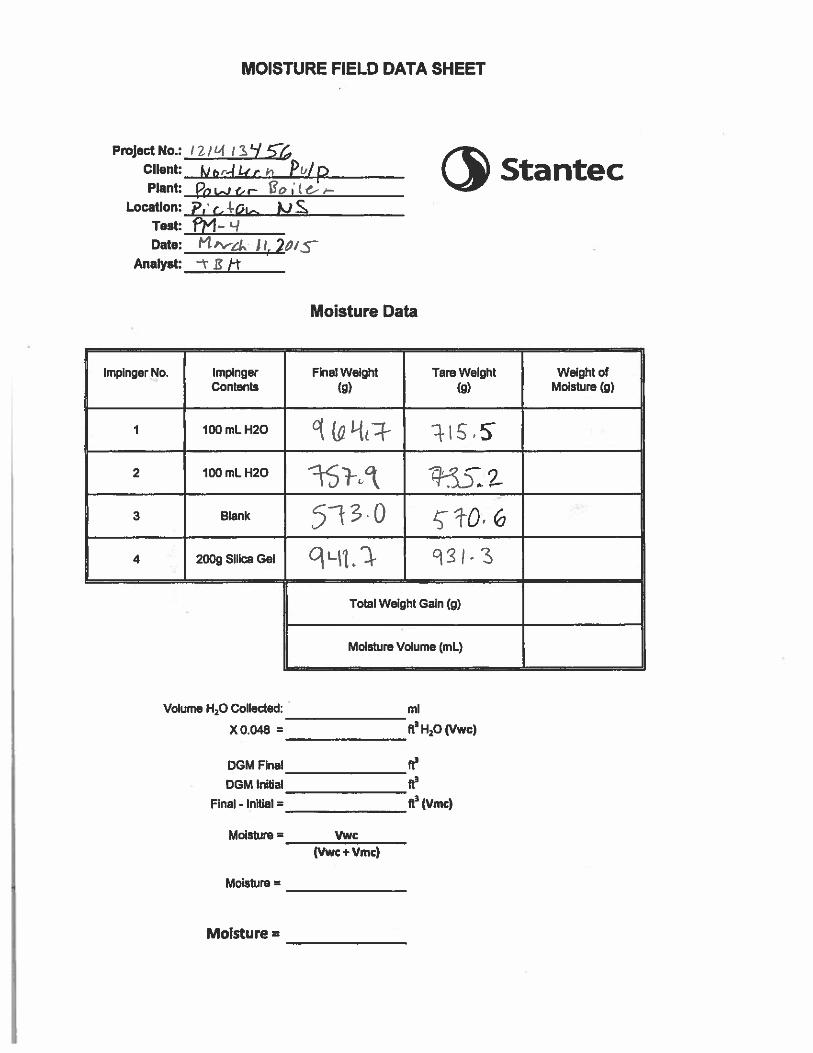
MOISTURE FIELD DATA SHEET
Project No.:
Client:
Plant:
Location:
Test:
Date:
‘zig :1W c7.KIbr-1L4rh Pu/pnicn l?o1tC-t-
Per1-Oi. .jS
frltv-ei I
Stantec
Analyst: -t £ /-t
Moisture Data
Impinger No. lmplnger Final Weight Tare Weight Weight atContents (g) (g) Moisture (g)
I IOOmLH2O
2 IOOmLH2O 9 Th352
3 Blank 51304 200gSiIicaG&
Total Weight Gain (g)
Mdsture Volume (mL)
Volume HaO Collected;
XO.048 =
ml
if’ i-ip (Vwc)
DGM Final
DGM lnibal
Final - initial =
Moisture =
Moisture =
Vwc(Vwc + Vmc)
ft3ft3
ft3 (Vmc)
MoIsture =

SO
UR
CE
TE
ST
ING
FIE
LD
DA
TA
SH
EE
TJo
bN
o.:
__
___
Cli
ent:
Pla
nt:
Loc
atio
n:?‘
-tn.
,&
cT
est:
Pr%
-9D
ate:
__
__
__
______
Ope
rato
rs:
3i6/
-rsK
/JW
Gam
ma:
i.pel
Dei
taH
@:
l7p’
P%to
tCoe
ff.:
D4(O
Sta
nF
inis
h:
Sta
ucP
ress
ure
(in.
H20
):o
.2o
Po
dL
engt
h(i
n):
C,”
Sta
ckD
ie.
(in.
):6”
Pro
beL
engt
h(H
):<4
’N
on
IeiD
(in
j:l—
(,t7
3’1
Con
sole
S/N
:jg
g
tilL
)IS
’f5
Mof
1Lni
P.a
Ij?,n
;lp
rP
ro-T
est
Lea
kC
heck
:V
acuu
mP
ress
ure:
Pos
t-T
est
Lea
kC
hec
tV
acuu
mP
ress
ure: K’:
ng
t
Tra
vers
eT
ime
Sta
ckG
asV
eloc
ityO
rifi
ceG
asM
eter
Pro
beO
ven
impi
nger
Gas
Met
erT
emp.
(F)
Pum
pP
oint
(mm
)T
emp.
,T
sH
ead,
dPdH
Vol
ume
Tem
p.T
emp.
Out
let
Vac
uum
(9(i
n.H
20)
(ln.
H20
)(c
ult
)(F
)(9
Tem
p.(9
inO
ut(i
n.H
g)0
1t.
O,s
’-(
149.
Zp
295
(90
5’7
-c5
15i
100
oS
!lv
o.j
g19
759
59
-
‘17
AIs
sflj
298
2.o
tL
13
57
-‘It
’1
S3
(.00
o.S
t,y
z.i
y297
log
‘43
59
-l3
zZ.5
Jsg
O.G,
oØ
3i17
379
2%
2(&
‘43
ho
-/5
151
n.W
0.3
1rfli
1(t
‘12
-ILI
,7.5
ISO
0.45
p.1.
9I1
L1I
29t
(1
‘(3
‘Oo.
’-S
O.1
.’{(1
.c.2
S19
9V
-a‘4
3,
59
—I5
0.9
0a.
ti‘7
15‘Z
F9‘1
360
51
‘tl’j
0.35
0.1
9/7
,4€
1_.7
2‘/3
59
-,L
77.5
‘MS
a95
psi
n7.3
2%
‘N-l
3o
HZ
IMo
p.6
317
8.17
793
Lj3
69
732
.5iq
/Ao
oS
OL
79
.329
€5
95
ISO
o.W
(Vj.
SI
195
1W
92
hO
59
-iS
31.5
IgS
ô,9
tlI
iO27
14
0-‘
‘10
i’42.
I.o
n.f
liS
L%
.fl.
-17
,39
.j.
90
.07
1s9
‘42
-t/1
5IL
(O110
ct
I2
519
7L
it-
IQ%
‘I’S
(.90
I.pl
I8.9
3297
‘it
-S
qi3
’?1
.9ô
?.0
I%L
2321
5U
t91
£9U
67.5
131
.W29
Ifl
93S7
SR-I
csJ9
Ois
op.
9729
7-t
I?‘7
’5Ii
p19
z.lt
76°
-é.
tsI.
0p
.97
193’f
t27’i
‘19
o
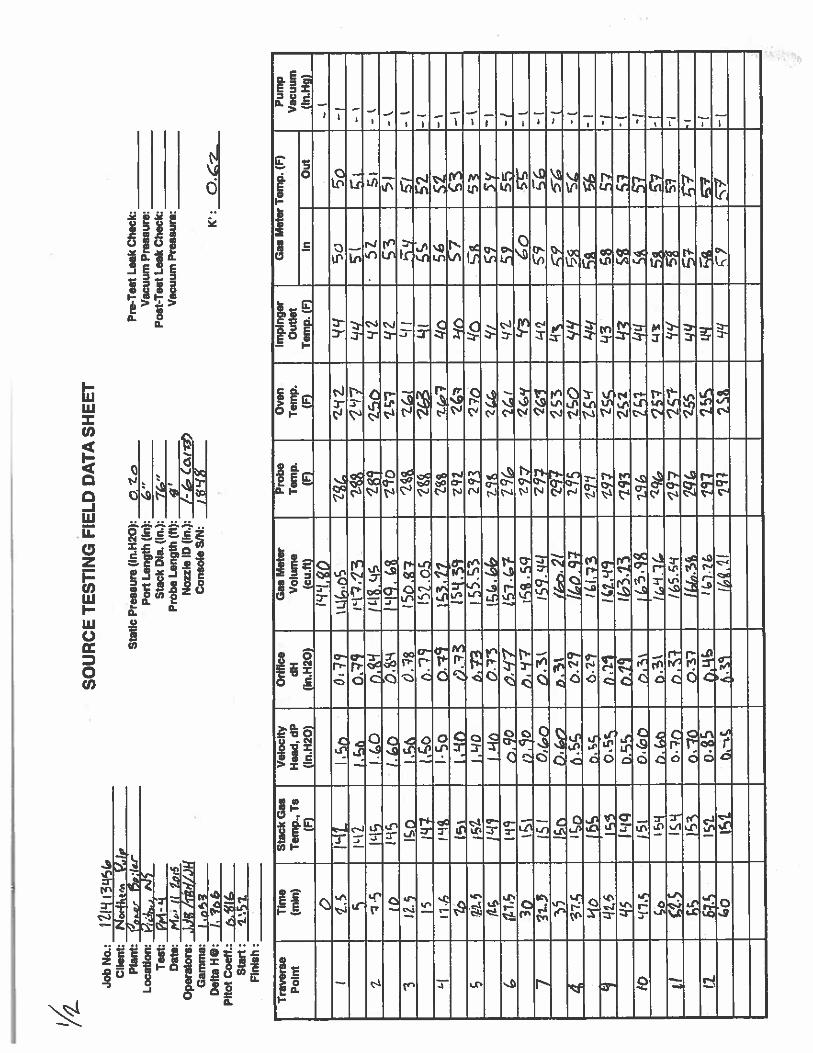
Job
No.
:—C
lient
:—P
lant
:L
ocat
ion:
—ih
4,
M5
Tes
t:p
j.4
Dat
e:H
.’(I
jots
Ope
rato
rs:
jjff
/i*I
/JW
Gam
ma:
lio
;D
efta
H@
:J,
p&
Pil
otC
oeff
.:n
S(
Sta
rt:
t5
tF
inis
h:
__
__
__
__
__
__
SO
UR
CE
TE
ST
ING
FIE
LD
DA
TA
SH
EE
T
Sta
tic
Pre
ssure
((n.
H20
):p
to
Pod
Len
gth
(In)
:“
Sta
ckD
ie.
(in.
):7k,”
Pro
beL
engt
h(H
):4’
Noz
zle
ID(I
n.):
1-b
Ca,i
tC
onso
leSI
N:
5’j
S
IZIN
1314’&
(‘r
o;kr
Pre
-Tes
tL
eak
Chec
kV
acuu
mP
ress
ure:
Pos
t-T
est
Lea
kC
hec
kV
acuu
mP
ress
ure: K’:
O.’
z...
Tra
vers
eT
ime
Sta
ckG
asV
eloc
ityO
rifi
ceG
asM
eter
Pro
beO
ven
Impi
nger
Gas
Met
etT
emp.
(9P
ump
Poi
nt(m
m)
Tem
p.,
Ta
Hea
d,dP
dHV
olum
eT
emp.
Tem
p.O
utle
tV
acuu
m(F
)(l
n.H
20)
(In.
H20
)(c
u.ft
)(9
(9T
emp.
(9In
Out
(ln.
Hg)
0-
iH
Lf,
O7
71L
3(,.ô
S‘z
’-cz
50
¶,‘-
ii0.?
?i’
€1
’75E
(c
-1.
1.5
1%I.
Op,L
.1(L
IZ(iS
.57
.-
195
(.p
0,
19Q.
s‘z
o‘z
.c51
312
.5iD
0.78
ISpn
t2c,
957
-5
l.co
o.R
?I5
2.p.
5‘3
1,5
2-i
‘II9
I.5
o.t
Iec
3.17
Isd
igO
56
52
-‘
loIs
’,p
,73
•Z:7
HO
57
-‘
S;s
1.i,’
-ioo.
13iS
5,S
329
163
-4€
.I
L1O
O.f
lt.
k&
U.
‘HST
—I
é.1/f
l’S(‘1
9p.g
71
5i.
72%
‘2(.
f5
9-/
3Qo,H
71ç
3.5q
fly
ZG.’j
‘13
Co
7fl
Ojp
p.3k
iSg.g
g2
97
‘2&
-i
S9
-(b5
b.W
7o.3
/bo.
2129
72
53
43
7•
Ip
o.%
(,.2
7/1
90.9
729
5-t
Lit
O..t,
O.2
71
t11
3Z
54
1g
-i
9i
o.S
10.
2’)
147
lsc
58L
v-f
g5O.
’3S
n.19
((13
.13
‘295
25±
4?
57-C
it‘L
7.S15
Lo.(
ot
1i.
qg
57-1
D1b
4h.C
,hp
.31
,5$
tio
w/S
.%q
197
25
1-‘
W3
163
ofl
oO
S?
11kM
255
57
•1
Li67
.S1S
to
45
p,gb
lbS
-((c
oi.—
1s1M
M29
?2S
%5
7—
t

MOISTURE FIELD DATA SHEET
ProjeotNo.: /%Ig;395Client: t)dc ?JPlant:
Location:
Test: PM-M.-IO
Volume H10 Collected:
XO.048 =
DGM Final
DOM Initial
Final - initial =
Moisture Data
___________________ft3_________ft3
113(Vmc)
Moisture
Moisture =
Vwc(Vwc + Vmc)
0,306
,flflty-,ñav
Date:
Analyst:
Stantec
fl/-rBn /Mq
Impinger ND. Impinger Finai Weight Tare Weight Weight ofContents (g) (9) Moisture (g)
1 1oomLH2Q ‘79-3.S
2 100mLH2Q q7y.O 7Z9.3 Blank
- f3Ro.94 200gSilicaGel joi3 ,I 2 2.5
Total Weight Gain (g) 5L/o I
Moisture Volume (mL) S
sc/a.25.92
ml
ft3 HO (Vwc)
Moisture =

SO
UR
CE
TE
ST
ING
FIE
LD
DA
TA
SH
EE
Ti4
‘i
çJo
bN
o.:_
_____________________
Cli
ent:
___________________________
Plar
W:_
______________________
Loc
atio
n:?.
(3b4
fi.,’
Tes
t:
_________
Dat
e:fl
i,..,jo
/it
Ope
rato
rs:
Thfr
/5G
amm
a;j.
fluD
ehaH
@:_
________
Pit
otC
oeff
.:p
Sta
n:
Co
oF
inis
h:
Sta
tic
Pre
ssu
re(i
n.H
20):
(.(t
?
Por
tL
engt
h(I
n):
&‘
Sta
ckD
ie.
(in.
):P
rob
eL
engt
h(I
t):
2’N
onle
lo(I
n.):
j—(o
1fl’
v)C
onso
leSI
N:
__
__
__
__
__
Tra
vers
eT
ime
Sta
ckG
asV
eloc
ityO
rifi
ceG
asM
eter
Pro
be
Ove
nim
ping
erG
asM
eter
Tem
p.(9
Pum
p
Poi
nt(m
m)
Tem
p.,
Ts
Hea
d,dP
dHV
olum
eT
emp.
Tem
p.O
utle
tV
acuu
m
(9(i
n.H
2O)
(in.
H20
)(c
u.It
)(9
(F)
Tem
p.(9
inO
ut(l
n.H
g)
0Z
1t3
’I\
z.c
-et
gag
vcS
32J
2..
3°c
-“—
15
tSL
0.69
013
‘270
‘3cp
‘77
97
-.
ct
O,57
o.f
lc3
.g9
27c
zc’/
c:7
—
IpM
o.3
Zis
.o%
‘y/
97
-I‘
s2.C
ICJf
O.g
lt1
6.t
7‘t
ic3d
‘-II
-2.
%c
1S1
O.9
/34
(7,4
7270
31
ZtI
Ot/?
97
‘Inc
O.t
.2l.
&5
‘2.7
°L
Ie‘q
7-I
10çg
(,,€
piI
9AsH
%0
33
‘to
‘/2
73
tiS
‘5’:
WO
Kt7
O315
‘Ia
99
‘/7
-3
LC
-flt
.a3
ii‘7
9‘9
7-3
&19
1m
Ut1
3.3
72
70
307
Lfn
So
‘yv
-3o
O.t
Cli
50
‘I’?
-V‘
‘n.r
p.’
iio.
82It
S15
‘Lb
-5O
W‘1
’5o
‘/7
cm
a‘n
b.T
‘1-7
0‘/
‘‘/
7‘
nc
0.%
?1S
.i’L
2-I
D3i
SO
‘-(3
-5ID
U.S
0.23
t9.s
L‘2
.76
311
5’
t-S
.
3oB
io
.513
o.S
Iti
-I
3iO
Si‘1
8-5
nZ
_‘S
HoS
L13
1.7L
‘-7°
‘-i”y
52-
gg-ç
I-f‘2
31.9
71-
7o‘-
Ic£2
.Y
R—
6
40
ISL
‘L3tj
pt’
70
5o
9‘/
5t
‘18
.-C
ctr
t36,t
91
-70
3n
53L
f7
—E
ist-
’91
.11
‘3t1
Ct
ti9—
4c
cç
1G3
o&9
‘b31
fl3
L,s9
-(,
oL5
3ôS
’-(
131,9
32
3b
3t0
c1o
—
AJo
rtte
w.
kIr
PS
._&
JSP
reT
est
Lea
kC
hec
k/8
Vac
uum
Pre
ssur
e:
___
___
__
___
_
Pos
t-T
est
Lea
kC
heck
:___
___
__
___
_
Vac
uum
Pre
ssur
e:
__
__
__
___
___
K’:
(JQ

Job
No
.:12
.141
3’IS
G,
SO
UR
CE
TE
ST
ING
FIE
LD
DA
TA
SH
EE
T
Clie
nt:
Akr
tlLM
fl(9’
.IP1
mm
:fL
kn..
PL
ocat
ion:
(k’a
.t.—
yIS
atL
tT
est:
__
__
__
__
_
Dat
e:M
arJ>
/WO
pera
tors
:—
r?
jr,
Gam
ma:
io-
Det
taH
O:
,.7fS
Pil
otC
oeft
:p‘
Sta
rt:_
__
___
__
Fin
ish
:
__
__
__
______
Sta
tic
Pre
ssure
(ln.
H20
):.
IOP
ort
Len
gth
(In)
:&
Sta
ckD
ie.
(In.
):lj
jP
robe
Len
gth
(H):
z.’N
onie
lD(l
n.)
:i—
Sld
.2j)
Con
sole
S/N
:lttC
ft
Pre
-Tes
tL
eak
Chec
kV
acuu
mP
ress
ure:
Pos
t-T
est
Lea
kC
hec
kV
acuu
mP
ress
ure:
—I -d
—ii
K’:
Tra
vers
eT
ime
Sta
ckG
asV
eloc
ity
OrI
fIce
Gas
Met
erP
robe
Ove
nIm
plnq
erG
asM
eter
Tem
p.(9
Pum
pP
oInt
(mm
)T
emp.
.T
aH
ead,
dPdH
Vol
ume
Tem
p.T
emp.
Out
let
Vac
uum
(F)
(In.
H2O
)(l
n.H
20)
(cu.
ft)
(F)
(9T
emp.
(9In
Out
(in.
Hg)
a‘
‘i-S
rs2
2’i
o,5
-z-3
c4tg
ç(5
L(0
2’11,3
2M9
‘zaP
,53
.5J
—I
1-f
O.H
S2.4
Z.c
fl310
—
l1S
’O
..o
I-t
ltei.
35
33p
31j
I4L
j5L
So
-s
‘i.,.c
15%
p.p’
cno
Si
-9L
C15
’-t
n.t
3V
1L
flP
-i‘-j
Si
-7Li
p.ç
c790
tjt
.3,
—
7oQ
.St
fl.B
1)4
’L2L
2io
scS
i-
cnr
aM
3o
ccSe
’-9
1s-
i’-&
a7S
\.’-
G2D
309
°n.r
1S
3o
2%
3k
Si
-tO
O4
Li
29-i
ati
sc‘S
I-i
n.,7
-2sc
43io
‘15
CS
1fl
49(a
2%
.14
:yx
n-
an-c
o.b
<#
2W
611
S3
-4)
go
p(o’t
O.P
fl-
sc,1
x,
1-p
.1)
cs
ca
—/d
‘n/I
Os°
0p’j
t’i8
nS
’t
ri-n
.5o
SD
sO
,5’1
’O
t)‘-
(o”
W31
150
S_5Z
_‘O
ç.c
.oasc
pok
n-o
SCm
sq‘
cço
o.,p
cL
wU
2S
—E
--__n___
-‘C
)c
d°
t’l-
o5/
ara
sc
pico’
o.
Th-T
hS
jg(.
19-1
O6O
n.a
c’pfl.q
‘-
5t,
-Jo
&o
153
“ice
291)
ma
.%S9
-/z
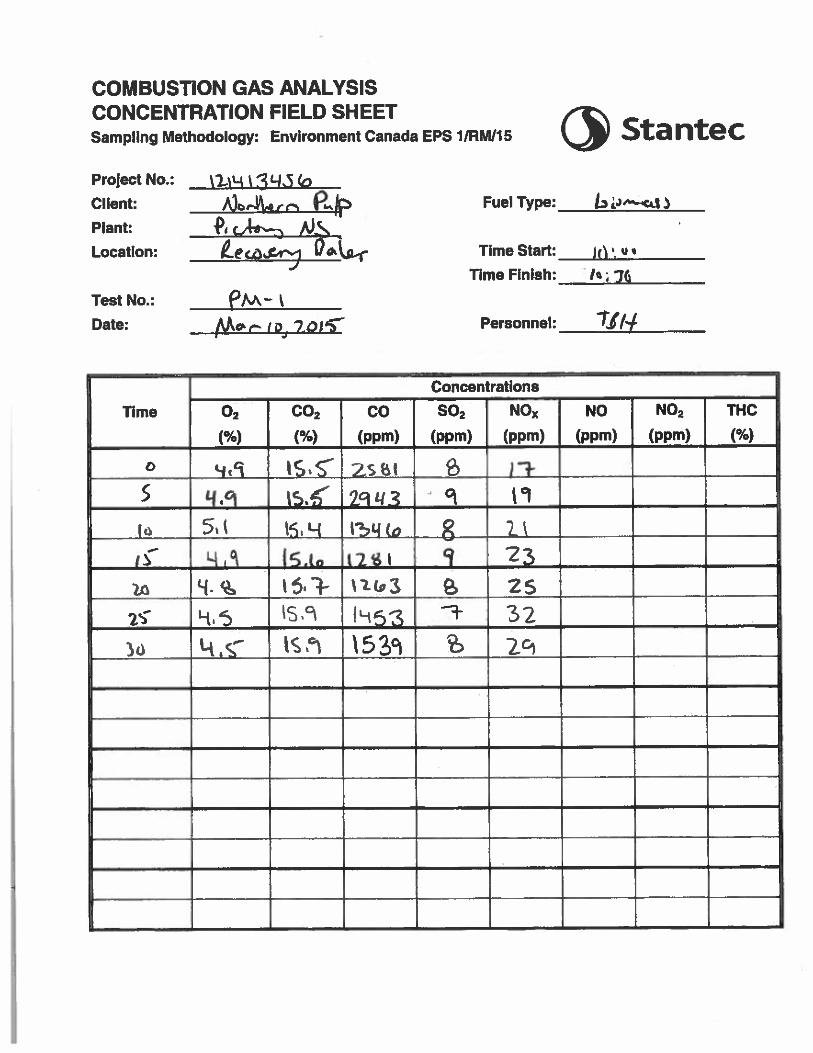
COMBUSTION GAS ANALYSISCONCENTRATION FIELD SHEETSampling Methodology: Environment Canada EPS 1IRMI15 (3StantecProject No.:
Client:
Plant:
Location:
Test No.:
Date:
li-i
A)bAk4rn ftbf2i—, ALStecasni OaLcç
-I
PM-i
Fuel Type:
Time Stan:
Time Finish:
Personnel:
La L3”—cd 3
u
TJ/4
Concentrations
Time 02 CO2 CO 502 NO NO NO2 ThC
(%) (%) (ppm) (ppm) (ppm) (ppm) (ppm) (%)
b iSIS zssl SS Lf9 19fo 51 jç 8,c LIA ISAn L2I 9 23
2G 9.% 15I1 ilo3 25
2 ‘-1.5 32
3ö (Sn 539 S 2°
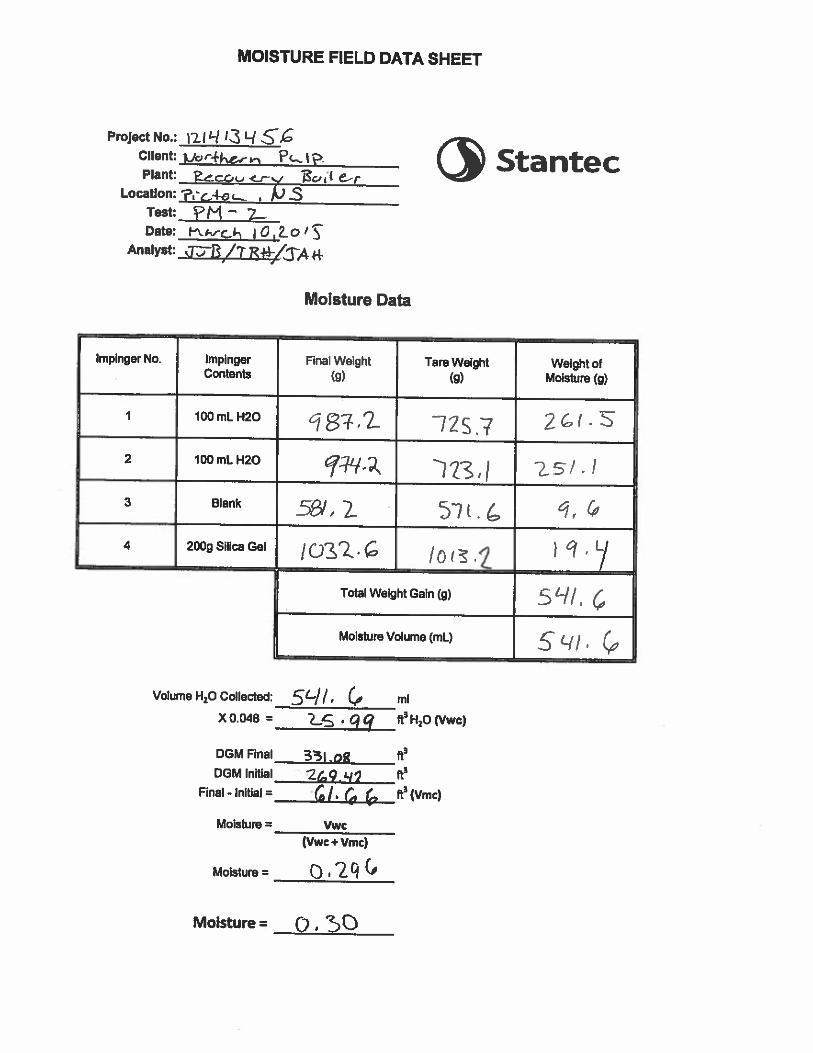
MOISTURE FIELD DATA SHEET
Project No.: 121 I 3 q S.CClient: )Jor+kern PcJp StantecPlant: eco c- ‘j &( tr
Location: ?c%c_. MSTest: PM 1-Date: fr&rcI- ;o1ao’ç
Analyst: .TTB,/7 JW/SAi+
Moisture Data
Impinger No. Impinger Final Weight Tare Weight Weight ofContents (g) (g) Moisture (g)
I 100mLH2Q @872 125.7
2 IOOmLH2O q.q3 2SIf
3 Blank 521,2
4 200gSilicaGel loi.1 9,
Total Weight Gain (g)
Moisture Volume (mL) 5 (4,
Volume H20 Collected: 5C//, (a ml
XO.048 = 2_S gg ft3H2OWwc)
DGM Final 35pg ft3DGM Initial 2(9’fl ft1
Final-lnibal= c, ft3(Vmc)
Moisture = Vwc(Vwc+Vmc)
Moisture =
Molsture= 0. 30

SO
UR
CE
TE
STIN
GFI
EL
DD
ATA
SH
EE
T
‘-a
Job
No.
:_______________________
Clie
nt:
jdaf
tArn
Y4a
Pla
nt:
f-it
fri—
...A
lsL
ocat
ion:
Q.t
ta.
Tes
t:-t
Dat
e:t*
IO
pera
tors
:ji
-’J53
Gam
ma:
1.D
eft
aH
O:_
__
__
__
Pit
otC
oeft
.:
__________
Sta
n:
I1.’
.i5F
inish:
_____________
Pre
-Tes
tL
eak
Che
ck:
—
Vac
uum
Pre
ssur
e:
__
__
__
___
__
_
Pos
t-T
est
Lea
kC
heck
:__
___
__
___
_
Vac
uum
Pre
ssur
e:
__
___
___
___
_
Sta
tic
Pre
ssiz
e(l
n.H
20):
f.(3
Pod
Len
gth
(In)
:f.
Sta
ckD
ia.
(In.
):3
.1
Pro
be
Len
gth
(ft):
ti
Non
Tei
D(l
n.):
j—(O
,23L
f)C
onso
les/
N:
ficj
K’:
Tra
ver
seT
kne
Sta
ckG
asV
eloc
ity
Ori
fice
Gas
Mat
erP
robe
Ove
nim
ping
erG
asM
eter
Tem
p.(9
Pu
mp
Poi
nt(m
m)
Tem
p.,
Ts
Hea
d,dP
dHV
olum
eT
emp.
Tem
p.O
utle
tV
acuu
m
(9(m
n.H
20)
(In.
H20
)(c
ult
)(9
(9T
emp.
(9In
Out
(mn.
Hg)
p-2
6292
)zr
071
1.7
D.S
Zfl
‘-ta
’53
53
-,
s1S
2O
.bL
(m
9I
1.7
I9
a-h,
?Z
93
WY
55
S3
-(z
n3.Z
’4L
ISS
S53
IDp
.o.
9127
’-{.
SI
110
“oO
53
-1
‘Sar
,gg
<s.’
O-i
llL
ii57
iriS
sô.é
5‘s
o12—
‘10
53
-(14
L5c
6,9
3‘U
R.3
’.f
tlo
59--
2.
7t
O,&
5c.9
32?9,b
33
’”39
5>’
55
Sair
:55
0.9
3fl
o.f
l3u
.57
552
CI5
O1h
’S093
zg
i,js
Z1O
31é
38’
55-3
.,m
,r‘5
7O
..6
o.9Y
2*5,9
W2-
7p3
eS
56
-31
0(5
7J.9
9Z
€’I
7O
1-I
t5”
It
M—
3
nC
‘55
O.L
o9
5Z
9R
-Z7
3657
—
sc
310
-
155
t.b
O.9
5V
6,5
3ll
tj3o
839
‘jQ
15(o
o.9S
29,Q
31T
37
61
-1
‘tiC
‘56
0.6
729
142
3o
-5ti
CI5
o.4
,95
169
375
tjo.
%2-
7,S
q-5
5eO
.7O
W19
6-o,
71
%3
9L
ISR
-
1..
rt’
,w‘2
.94.
27rIo
‘CO
<cO
.kS
023
71
.(,p
‘fli
go
58
-6
t15
7M
St9
8.R
7V3
L.2
-Lfp
g\
095
3baIh
2.
6’
5g
-7

SO
UR
CE
TE
ST
ING
FIE
LD
DA
TA
SH
EE
T
Va
Sta
tic
Pre
ssure
(in.
H20
):(0
Po
dL
engt
h(I
n):
/si
Sta
ckD
ie.
(in.
):P
robe
Len
gth
(ft):
1’N
onle
iD(i
n.)
:1—
Rfn
,Liq
)C
onso
leS/
N:
If,
Ct
Pre
-Tes
tL
eak
Chec
k:_
_________
Vac
uum
Pre
ssur
e:
__
__
__
__
__
__
Pos
t-T
est
Lea
kC
heck
:
__
__
__
__
__
__
Vac
uum
Pre
ssur
e:
JobN
o.:
Cli
ent:
fvoe
rl_tin
able
Pla
nt:
kb..
usL
ocat
ion:
lZec
...r
j”IS
.1e-
Tes
t:r’,—
z.
Dat
e:ac
ivw
SO
pera
tors
:iS
14/6
Gam
ma:_
______
Def
laH
O:
IL1-L
’?.
Pit
otC
oeff
.:p
‘4j
Sta
rt:
Fin
ish
:
K’:
Tra
vers
eT
ime
Sta
ckG
asV
eloc
ity
Ori
fice
On
Met
erP
robe
,O
ven
Impi
nger
Gas
Met
erT
emp.
(9P
ump
Poi
nt(m
m)
Tem
p.,1.
Hea
d,dP
dHV
olum
eT
emp.
Tam
p.O
utle
tV
acuu
m(9
(ln.
H20
)(i
aH2O
)(c
u.ft
)(9
(9T
emp.
(F)
inO
ut(l
n.H
g)p
iS
0.9
5‘S
0I.’
-17
27/
5L1-
LII
cO
.(0(
c.9
51oL
.13o?
CI
5?
-
‘53
p.4
5o.
9V3o’o
’/D
’rO
-
iSS
O.6
0.9
53oS
.fl
-270
.6o
SR
-p
..L
..r
‘5
0.6
’3O
6,6
217
!5?
5!,
-
sIS
S0.9
5307.g
73d
45
57
-8j
li-S
o.c
,,095
309.I
gz1
6-t
cs
-s
ic15
”io.&
,a95
31p.9
8210
.‘-
15157
9IS
Io
e..
C95
31117(0
‘270
5$
57
“.9
yr
‘Si
p.
,9s
3,0
’/
270•
.ç7
(.t4
.c1
53
O.9
53(V
.3270
311
‘17
SC
-0
5179
310
f-7
I15
2.c.
&c
c.9
53i
C’.
9Z‘a
ll%
‘75S
56
-II
Klc
ZID
&t.
95
5v.Z
t3c
YR
‘19
‘Sc
t3c9.f
l270
3c
‘18
55
-fl
151
O.6
p.9t
1310.7
72
o3d-
L/y
5y
39;tc
oe
•3fl
.OS
’21
05’
o‘i
-vi.
ttr
,gass
O’9
33253’(
‘Z.V
i’3t
cc)
-li
ii41
-rO
.G1L
LI
10
&(
5’5
so
iS3
MY
32S
J0
3”
€1-
ç’-
t-‘
3)
sz.ç
C.9
9Z
7.1
Jtl
O3d
-‘3
cc3tS
.tl
31
S-4
o.9’
t3fl
&o
flo
31
0£‘
-i-v
-fc,
.dl)
tip
-sec

COMBUSTION GAS ANALYSISCONCENTRATION FIELD SHEETSampling Methodology: Environment Canada EPS 1/RM115 StantecProject No.:
Client:
Plant:
Location:
Test No.:
Date:
Ijdkr PMIPPch41 MS’
RQton 4o(ttr
Mer io/ic
Fuel Type:
Time Start:
Time Finish:
Personnel:
$4
‘dt
Ia
-Ca
Concentrations
Time 02 CO2 CO SO2 NOx NO NO2 THC
(%) (%) (ppm) (ppm) (ppm) (ppm) (ppm) (%)
‘\Sf 2qr S .91S ttc ‘ztO
ID io 2&O
IC ILmO os9, (a
2’ I(.O 2Z°13, (0 Ljp
ZS 91P tS° 2tiTh3 S 5,
‘3 SS 3oC ‘1

MOISTURE FIELD DATA SHEET
ProJectNo.:7I9I3gSClient: I’nr-1l—r!N P1.ApPlant:
Location:
Test: 0r4-2Date:
Analyst: t-re Iigtt /3+t
Stantec
Moisture Data
impinger No. Impinger Final Weight Tare Weight Weight ofContents (g) (g) Moisture (g)
1 100mLH2O 995. VSO-S 2’5
2 IOOmLH2O- z39 ‘
3 Blank 4-o. -
4 200gSHicaGei 1L14 (Total Weight Gain (g)
Moisture Volume (mL) SL10
XO.048=________
DGM Final a-. 2flDGM InlUal 33’-) .3:1-
Moisture =
Tccovt’-/ 0erp;c4ot.. ‘PJS
Volume H20 Collected: ml
ft3 H20 (Vwc)
ft3
ft3Final - initial = fj’ ft3 (Vmc)
Moisture = Vwc(Vwc +Vmc)
n, 36
‘p,ZiMoisture =
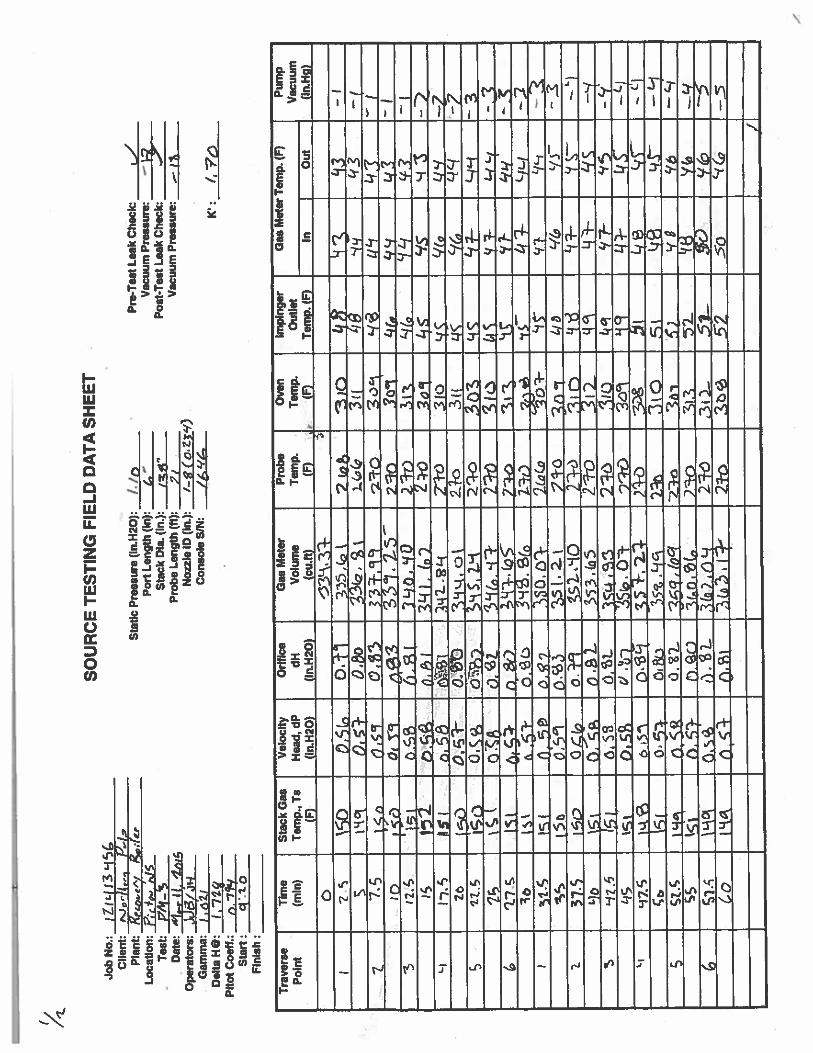
SO
UR
CE
TE
ST
ING
FIE
LD
DA
TA
SH
EE
TJo
bN
o.:
ItI
z.i
I3
95
Clie
nt:
flJ
0r/4
,..1
P(F
Plan
t:K
c0.r
-yL
ocat
ion;
RT
est:
i’m
-%D
ate:
‘ij
.4n,c
Oper
ators
:.5
3/31
4G
amm
a:j,
pti
Del
taH
O:
1.79
4P
itot
Coe
ff.:
,,,
il’5
’S
tart
;g
’.to
Fin
ish:
Sta
tic
Pre
ssure
(In.
H2O
):I.là
Po
dL
engt
h(I
n):
1.—
Sta
ckO
le.
(in.
):,z
*rP
rob
eL
engt
h(f
t):2
/N
ozzl
eID
(In.
):I—
g(a
qy)
Co
nso
leSI
N:
__
__
__
__
__
Pre
-Tes
tte
ak
Ch
eC
t___
__
___
_V
acuu
mP
ress
ure
:—
Pos
t-T
est
Lea
kC
heck
:__
___
___
___
_
Vac
uum
Pre
ssure
:—
K’:
67o
Tra
vers
eT
ime
Sta
ckG
asV
eloc
ity
Ori
fice
Gas
Met
erP
rob
eO
wn
Impi
nger
Ga
Met
erT
emp.
(9P
um
p
Pai
nt(m
m)
Tem
p.,
Ta
Hea
d,dP
dli
Vol
ume
Tem
p.T
emp.
Out
let
Vac
uum
(9(h
tH2O
)(l
n.H
20)
(cu.
ft)
(F)
(9T
emp.
(9In
Out
(In.
Hg)
0.33L
\fl
2’
036
O.f
l3
35
.(Q
2cn
b10
1‘1
3-I
S?-
mba
1ja(
o31
(tj
9Q
3—
(z
7.6
Q5
33T
h.99
ao
(/L
j
ippc
33
°I.2
-5zio
3ci
(43
-t3
]4o
.tIO
‘jt.
j93
ist2
:p•
95
-2L
I-iA
fiSH
ô.S
8gt.
R’i
79-0
3j0
U’!
—z
2o
D,’
-O
2t
23
03ii
‘-7
St-
sS
Q303
CS
sq...
.-3
0cM
Pit
i-fl
Sic
Lii
z-’c
-
(P
7S
o1$-
n&
)?9
-(aS
z-’°
‘(7-
ois
’a.
51-
gA
b39S
.(0
tfl
‘3t6
1(
52’
O.9
3D
.O’}
2LoL
o303-
‘it
97’
9’-s
i5a
0S33
75I.
1t
24
I/a
2.3j5
o.
5l”
lO2T
hà?3
mn
‘tS
rLb
ork
coS
L35
3.6)
5Z
IV312.
gç
‘‘-
n.6
1j
8,5
6O
.fl
3cc4S
2.
21o
3io
‘15
LIs
isi
p,55
O.1
35(Q
.O7
3t9
‘jq
in
tl9
fl
5O
\351-I2
29-0
cb
15i
35t.’
-jA
10
51—
c-I
scz.c
o.n
..3
,j0
g‘6
1‘1
SS‘c
i0:5
7-
cIa
)‘e’1
oSi
-c0
,s’
O.’
6L,b
).n
t27
-C3
IL
Si—
50
6o
I’
p’c
-p.
SM2L
t3r-
2T-o
52
so
-—s
/
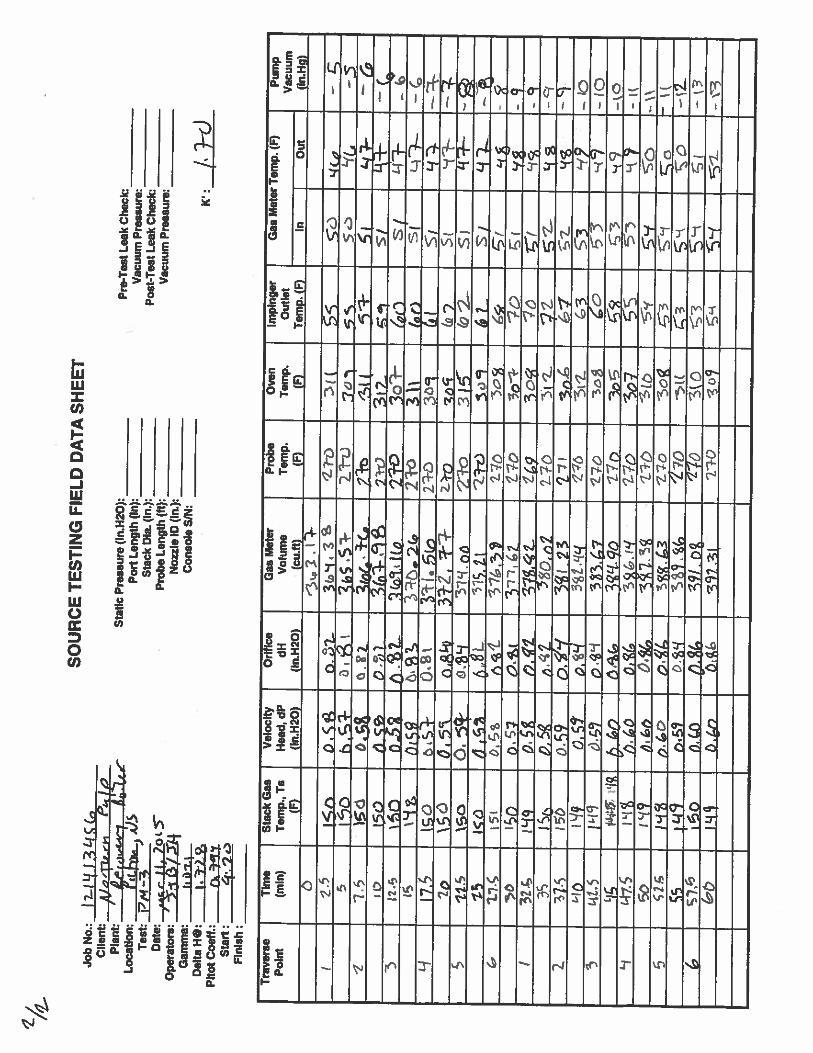
.7’
°V930mm0mm2c!
.‘gP
F:z
i.J
:.4s
S
Co0C
w
m
Co
z
.9m
IrI0
Cozm
-4m-4nwnmc_c—açaç
-cm —r—
nIp ‘S

ron
tCD
—U)
o0
— z 0
! o3
-no
—
0
U)
0 300
5C
)w
am
c
o
-c ii:;m
-j0
‘CD
—
c%z o
nD DI 0
.DI m U
)
(0C’, C (J
C 2 t
0 ‘1 0 0 0 z z 0
N CI,I
SOURCE EMISSIONS TESTING — RECOVERY BOILER AND POWER BOILER, WINTER 2015
Appendix DCalculations
Stantec

Cli
ent:
Non
hem
Pul
pJo
bN
um
ber
1214
1345
6
Pla
nt:
Pow
erB
ode,
Loc
atio
n:P6
600.
NS
Tes
t:P6
0-2
Dal
e,10
—M
ar—13
Per
sonnel
:T
BII
2JJB
JJM
I
Tes
tSt
an:
8:47
AM
Tes
tF
inis
h:
1047A
M
Para
mete
r.B
arom
etri
cP
ress
ure
.P
bar
(in.
Hg)
Sta
ckS
tati
cP
ress
ure
.P
stat
lc(I
n.H
20)
koble
nt
Tem
p.
(F)
H20
Volu
me
Co
lecte
d.
Wi
(ml)
Tot
alS
Sam
plin
gP
oint
s,S
amp
lin
gT
ime
per
Po
int
(mm
)R
eadin
gs
Tak
enE
very
—fl
int
Reg
ulat
ory
Age
ncy
Tra
ver
seP
oin
t
Pan
icula
teC
oll
ecte
dtr
amE
ther
(fig
):P
atti
cula
teC
oll
ecte
dfr
om
Pro
be
Was
h(m
a):
Pan
icula
teC
ole
cted
from
imp
ing
erW
ath
mg)
:
Tota
lP
arti
cula
teC
oll
ecte
dm
g):
1955
0.20 28
2995 24 25
NSE
WV
2,5
141
514
47,
514
590
045
925
040
IStI
e97
,514
720
4222
.5‘4
625
14*
27.5
149
30It
t325
Iii
35II
I37.5
159
4014
942.5
131
45Ii
!47
.505
250
III
525
5055
III
57.5
149
0014
9
¶62
.514
965
149
267
.5tS
270
153
3726
150
7513
3
4V
.515
290
049
5825
950
8516
3e
el-s
5490
151
7925
119
9514
75
97,5
150
500
147
102.
514
1lo
sIS
O10
107.
515
011
011
5II
112.
514
2It
S14
212
117.
514
212
014
1
02.
1%)
C02
.(2
’)N
i.(¼
)C
D(p
pm)
NO
r)p
pmi
502
(ppm
)
5221
191.
600.
8953
520
1.50
0.93
54730
ito
tm
l55980
I_go
I.00
57.2
60
1-70
094
5*540
160
0*0
39780
1.50
0e3
60.9
10
1.50
013
62170
1301
0.55
6529
)9.
000-
5560210
1.181
0.55
63.1
40
0.60
033
65910
0.50
0.27
66650
0.30
0.27
67330
0.43
025
61.0
20
0.45
025
68600
0.45
0.25
69.3
50
0.43
025
70.0
10
0.35
025
70670
043
0-25
7132
0
0.59
028
flO
OD
0.30
0.3*
72730
0.50
02*
73.3
50
0.50
028
74le
O
7415
15
ISo
0.77
75950
1.35
0.74
V.2
10
139
066
78250
120
060
26
0
0.60
046
*0219
0.90
0.46
8108
0
065
033
81930
0.65
033
82640
0_So
026
*3310
0.50
023
*3540
0.90
046
*3749
0.95
0.49
03.6
30
311
0.67
96.5
901.
40072
87.6
50
580
093
85840
1.111
093
900%
0.80
093
91330
1.10
0.93
9256
0
1.80
0.93
93880
ItO
0.93
95.0
50
1.10
0.93
96310
1.00
094
97350
1.80
094
9800
0
1.80
094
190.
050
40 40 39 40 49 40 4’ 41 4’
42 42 12 32 41 42 42 42 42 42 43 13 43 43 41
Sta
ckD
iam
eter
.(i
n.)
Sta
ckA
sse,
sq.
n.j
Pro
bele
ngth
.In
.)N
ozzl
eD
iam
eter
.In
.)P
ilot
Coen
icle
nt.
(Cp)
Gam
ma.
met
erconst
an
tPo
olle
ng
thIn
.)
40 10 3D 40 40 40 40 30 ID ID 40 49 40 40 40 31 II 40 4’ 4’ 41 42 12 32
Raw
Dat
afo
r
Test
#1
inp
ing
erN
o.Im
ping
erFI
nal
Wei
ght
Tar
eW
eigh
tW
eigh
tof
Conte
nts
(9)
(9)
Moi
stur
eig
)I
100
itt
H20
994.
373
1.4
262.
5
210
0no
LH
206552
028.
023
.2
3B
lank
659
.5659.5
0.0
420
09sa
cs
Gel
996.
499
4.0
4.4
198.
020.9
4-f
299.
5
10.8
9.8
79.4
1733
.9‘6
-I0.
0
Tol
l)W
eigh
tG
ain
(91
Moi
stur
eV
olu
me
(mL
)
Tim
eS
tack
Gas
0-t
yp
eP
ilot
Ori
fice
Gas
Met
er
Tem
p,T
ede
lta
Pde
lta
HV
olum
a
(min
i(F
)(I
n.H
20)
(in.
H20
)cu
.It
)
290.
52
90.6
7631
.50
0.17
20.
8)6
1.05
3
Gas
Mel
erT
emp
Inle
tO
utle
t(S
F)(•
9
Tra
ver
seI
Tra
ver
seI
10 II I,
33 45 45 45 45 36 41 46 46 46 46 47 4,
38 49 49 49 45 49 49 19 49 19
43 43 44 43 43 43 43 43 40 44 44 44 45 45 45 46 46 46 46 46 46 36

Calc
ula
tio
ns
for
Test
#1
Cli
ent
No,
them
Ptd
pJo
bN
umbe
r12
1413
458
Pla
nt:
Pow
erB
oile
rL
ocat
ion:
Pid
ofi,
Na
Tes
t:P1
4-2
Gat
e:lO
4Aao
-l5
Per
sonnel
:T
hUIJ
JWJA
H
0
Calc
ula
ted
Para
mete
rs
Sla
ckG
asP
ress
ure
-P
.lo
Ng)
Sla
ckG
askio
leco
lar
Wei
ght.
Dry
Bas
is.
Md
tlbll
bnole
lV
olio
nve
otW
ater
Vap
ou
rC
oll
ecte
d.
Vw
c)cu
it)
Sla
ckG
asII
ois
ture
Co
nte
ntr
asd
ecim
al)
slack
Gas
Mol
ecul
arW
eigh
t,W
etO
asis
,M
s(l
blt
blt
ole
)
Iso
kin
etic
ity
Checks
Tra
y.,..
Poi
ntro
toe
slac
kG
asS
-typ
ePi
tot,
Ori
fice
Sla
ckC
atT
en
p,T
sd
etla
Pde
tlaH
V,l
ocit
y,U
sR
Iti
n.H
an)
tim
8120
)iB
is)
2.5
7.5
ID 12.5 Is 17.5
20 22.5
25 27.5
30 32.5
35 37.5
40 42.5
45 47.5
50 52.5
55 57.5
80 62.5
65 07.5
70 72.5
75 77.5
to 815
.5 07.5
90 92.5
as 91.5
Ito
102.
500
510
7.5
lID
112.
511
511
7.5
020
601
1,60
0.89
75.7
229
.82
604
1.50
083
73.5
029
.61
605
0,60
0.00
80.5
82
96
260
51.
800,
0080
.58
29
62
608
1.70
0,94
70.5
129
.62
808
1.60
0.08
76,0
629
.81
907
1.50
0.63
73.6
82861
602
1.50
0.84
73.3
82861
600
5.00
0,55
60.1
128
.58
608
1,00
0.55
6021
25.5
560
91,
000.
556
02
625
,59
619
0.60
0.33
48.7
82
95
761
10,
500
27
41
68
29.5
761
10,
500
27
42.6
529
.57
610
0.45
0.25
40.4
829
.51
606
0.45
025
40.4
229
.57
all
0.45
025
40.4
928
,57
612
0.45
025
40.5
225
,57
812
0.45
025
40.5
225
.57
611
0.45
025
40.4
920
.57
610
0,50
02
842
.65
29.5
761
10.
500
28
42.6
829
.57
609
0.50
026
4161
29.5
760
90.
50026
42.6
129
.57
609
1.50
0.77
73.6
128
.61
609
1.45
0,74
72,5
028
.00
012
1,30
0.65
68.6
825
.60
613
120
0.61
00
23
29.5
961
00.
900.
495
72
229
.50
613
0,90
0.48
57.3
829
.58
612
0.65
0.33
46.7
029
.57
609
0.65
0.33
46.5
629
.57
610
050
026
41
55
26
57
613
0.50
025
42.7
529
.57
824
0.90
0.46
57.4
029
.58
611
0.95
0.49
58.6
329
.58
810
1,30
0.67
68.7
729
.60
607
lAO
02
271
.19
29
60
810
1,00
0.93
80.9
22
96
280
71.
600.
9300
.72
29.6
280
61,
600,
9380
.76
29.6
261
01.
800.
8300
.92
29
82
610
1.80
0.83
60.9
229
.82
805
1.80
0.83
00.5
629
.82
802
1.80
0.83
60.3
525
.62
602
8.80
0.04
80.3
829
.62
602
6.80
0.94
60.3
828
.62
601
1.80
0.94
60.3
229
.02
Aver
age
Ave
rage
Ave
rage
08
062
.07
20.5
9
12
40
1.38
810
8.33
12
10
1.35
410
9.43
12
50
1.40
11
03
43
9.30
01.
450
107.
461260
1.41
110
7.43
12
40
1.38
800
6.50
02
00
1.34
210
6.69
1.89
01.
331
987.
341.
090
12
18
920.
730
95
01.
000
10
52
90.
930
0.03
810
3.16
0.77
00.
559
110.
390
74
00.
025
11
62
00.
680
0.75
9I5
0.77
0.60
00.
770
114.
110.
550
0.73
500
6.95
0.67
00.
747
110.
750,
000
0.73
510
021
0.65
00.
735
1092
10.
650
0.72
410
7.36
0.69
00.
768
106.
040.
720
0.80
11
11
22
0.72
00.
001
11154
0.73
00.
011
113.
89
0.58
915
9.76
1.40
211
5.60
1.15
41
00
65
1.12
110
101
1.05
411
0.40
0.98
510
1.43
0.94
211
6.30
083!
102.
420.
898
98.1
50.
896
86.3
90.
886
93.0
60.
965
100.
841.
062
92.6
71
21
71
01
08
1211
9421
1.38
11
01
16
1.37
010
1.42
8.35
710
0.57
1.38
010
8.38
0.37
910
1.79
0.39
010
2.35
.388
10
02
21.
379
101.
541.
378
101.
45
29.5
530
.00
I3
.90205
27.5
0
Chec
knoge
Ch.c
kan
rag
eO
ols
ide
ofC
rite
ria
Vll
thin
Cre
eei.
Met
erP
ress
,A
vg.
Tem
p.P
m(i
n.H
o)T
m(H
)
Tra
vers
eI
Tra
ver
se2
Gas
Met
erts
ok
in.u
cs
Vol
ume,
Vote
Ref
.,V
m(c
oo.
IL)
Vm
c(cu
.IL
)
It 11 02 4 I 7 S 9 It II 12
509
500
500
500
500
500
501
501
50!
500
509
501
50I
SD’
508
502
502
502
502
502
502
003
503
503
503
503
503
504
504
504
505
505
505
505
505
505
500
500
507
507
507
508
506
505
508
505
508
508
0.77
01
26
01
04
01-
010
0.95
00
07
00.
850
0.75
00.
830
0.6
300-t
oo
0.09
00.
980
1.10
0‘.
150
9250
1.24
01230
0.24
05360
8360
02
40
12
50
12
50
Tot
al47
.770
ToW
53.0
81A
ven
ge
006.
82
Tot
al02
0A
ven
ge
Aven
ge
509
1.13
Aver
age
503
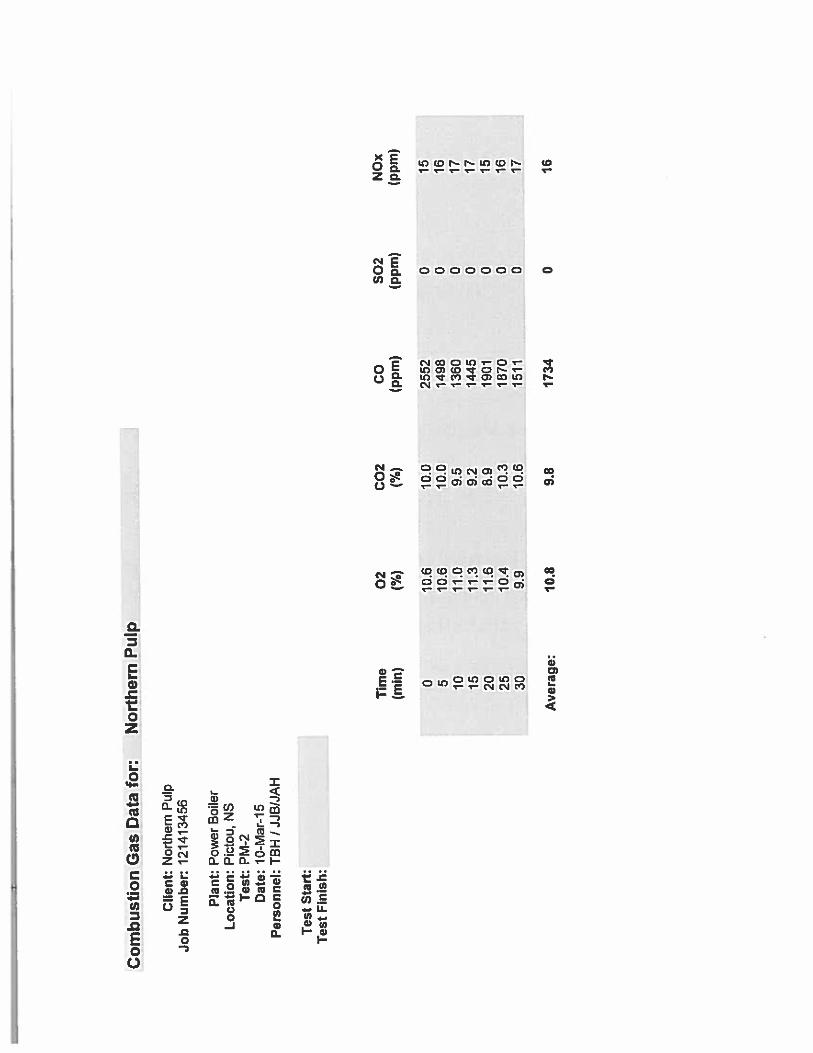
Co
mb
ust
ion
Gas
Dat
afo
r:N
orth
ern
Pul
p
Cli
ent:
Nor
ther
nPu
lpJo
bN
umbe
r:12
1413
456
Pla
nt:
Pow
erB
oile
rL
ocat
ion:
Pict
ou,
NS
Tes
t:PM
-2D
ate:
10-M
ar-1
5P
erso
nnel
:TB
HIJ
JBIJ
AH
Tes
tS
tart
:T
est
Fin
ish:
Tim
e0
2C
02C
OS
02N
Ox
(mm
)(%
)(%
)(p
pm)
(ppm
)(p
pm)
010
.610
.025
520
155
10.6
10.0
1498
016
1011
.09.
513
600
1715
11.3
9.2
1445
017
2011
.68.
919
010
1525
10.4
10.3
1870
016
309.
910
.615
110
17
Ave
rage
:10
.89.
817
340
16
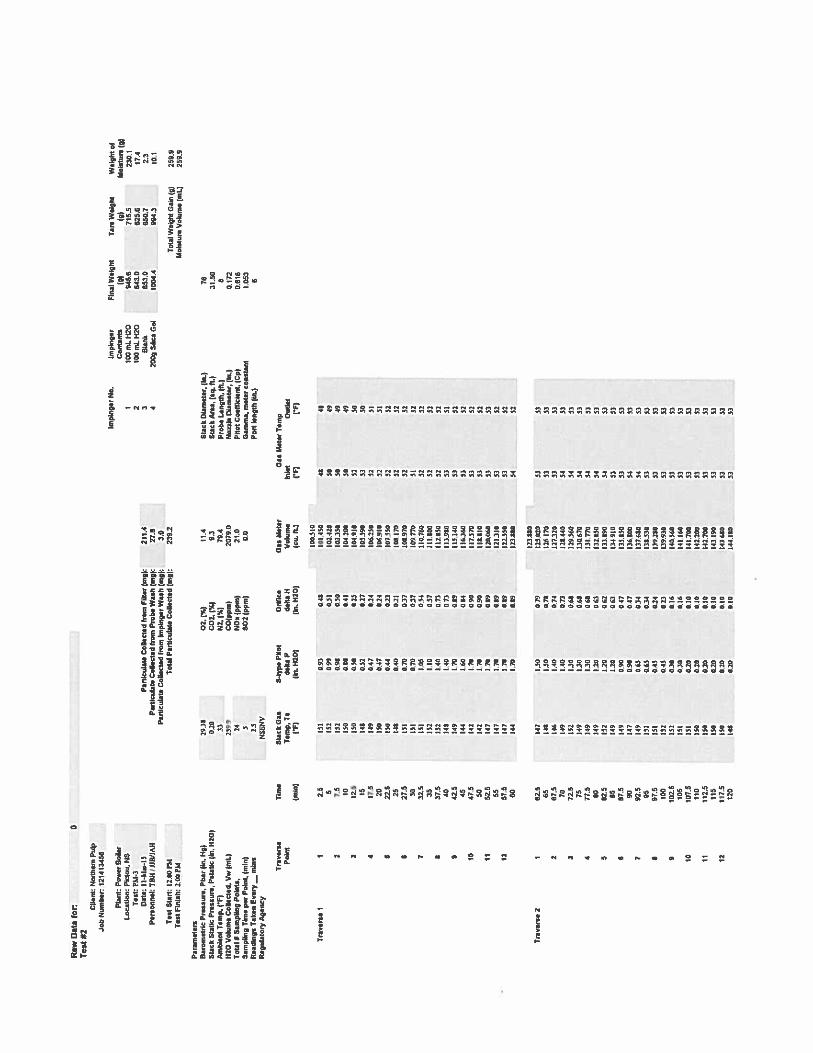
Raw
Dat
a(o
rT
est#
2C
lien
t;N
mui
emP
ulp
Job
Num
ber.
1214
1345
6
Pla
nt:
Pow
erB
oile
rL
ocat
ion:
Pid
mt.
NS
Tes
t:PM
-SD
ate;
II-M
an-I
SP
erso
nn
el:
Til
tI
JJW
JAH
Tes
tS
tan
:t2
.00
PMT
est
Fin
ish:
2.06
]FM
Par
emel
ers
Bar
omet
ric
Pre
ssu
re.
Pbs
,’(t
o.H
g)S
tack
Sta
lkP
ress
ure
,P
seat
ic(i
n.H
20)
knbie
nt
Tem
p.(‘
F)H
20V
otum
eC
ote
cted
.V
et(n
ilT
otal
IS
ampl
ing
Poi
nts,
Sam
ptin
gT
ine
per
Poin
t(m
ini
Rea
din
gs
Tak
enE
very
—m
itts
Reg
ulat
ory
Age
ncy
Tra
ver
seP
on
t
29.3
80.
20 3321
9.9
24 25N
SEN
V
Tim
eS
tack
Gas
Spype
Pou
tO
rifi
ceT
emp.
Ta
delt
aP
deli
aH
(min
I(‘
9(i
n.H
20)
(In.
H20
)
2t1
.427
.e3.
02392
Sta
ckD
iam
eter
,(I
n.)
Sta
ckP
ies.
(sq.
FL)
Pro
beie
ng
th,
(04
Nonle
Dia
met
er,
(In.
)P
ilot
Coe
ffic
ient
,(C
p)G
amm
a.m
eter
const
ant
Pen
leng
th(i
n.)
7639
.50
0.17
20.
096
1.05
36
Tot
alW
etgh
tG
ain
(9)
259.
9M
oist
ure
Vol
ume
(nil
259.
9
Par
ticu
late
Col
lect
ed(m
mF
ilte
r(m
gi;
Par
licu
late
Col
lect
edIr
on
Pro
beW
ash
mg)
:P
arti
cula
teC
olle
cted
(mm
lmpi
nger
Was
hm
g):
Tot
alP
erli
cubte
Col
lect
edm
g);
02,
(%)
CO
Z1%
)N
2.(%
lC
O(p
pm)
Not
(ppm
)502
(ppm
(
Impi
nger
No.
Impi
nger
Fina
lW
eigh
tT
are
Wei
ght
Wei
ght
ofC
onte
nts
(g)
(9)
Moi
stur
e(a
lI
900
slit.
H20
945.
671
5.5
230.
12
tOO
mL
H20
643.0
625.6
17.4
3B
lank
653.
0650,7
2.3
4bO
gSi
lica
Gel
1004
.489
4.3
10,1
11.4
9.3
79-4
2079.0
21.0
0.0
Gas
Met
erV
olum
e(c
it.
hI
Gas
Met
erT
emp
Inle
tO
utle
t(‘
F)
100.
510
Tra
vers
al
125
151
093
049
9014
5046
485
992
0.90
0.58
1014
203D
492
7.5
152
099
0-50
1031
3050
4910
130
080
OA
t10
1200
5045
3125
150
0-30
023
1019
1032
5015
148
0-32
027
105.
590
5350
417
.514
9047
024
1002
5132
3120
ISO
0.47
024
1069
1052
515
flS
ISO
044
0.11
167.
550
5252
2514
104
(102
810
6.17
052
326
27.5
151
0.70
037
109.
970
5252
3015
10.
700.
3700
077
05!
527
32
6li
t1.
03004
110.
700
5232
3519
21.
10057
111.
900
5232
537
.515
28.
400.
7711
2.93
152
5240
148
1.30
073
113.
950
5351
9425
949
9.70
0.89
115
141
5352
4514
31.
600.
8496300
5333
1047
.514
31.
70090
117.
570
5352
50‘4
2tI
n0.
9011
8.81
053
52II
52
514
71.
70089
120.
060
5333
5013
7i’
D0.
9912
131
053
5212
57.6
147
(70
099
(31
91
053
3260
144
1.70
0.19
025.
880
5452
123.
981
Tra
ver
se2
I625
147
9.35
0.79
125.
020
5353
6512
993
00.
7812
6170
5353
267
.016
1.40
0.74
1271
3053
5370
149
1.40
0.77
128.
440
5453
37
25
152
130
0.68
129.
560
5433
7514
911
0003
130.
670
5453
477
.514
913
006
413
1770
5453
8014
9‘2
0063
932.
850
3453
5825
932
9,20
062
933.
890
5453
as
949
9.30
0.63
3191
053
535
87,5
149
0.90
0.37
135.
eso
3353
9014
70.
900.
1713
6.0(
054
537
92,5
‘39
0.63
034
137.
680
5433
95II
I0.
65034
138.
530
5353
897
.515
10.
4302
413
928
053
3390
015
20.
430.
2303
9.93
053
339
902.
015
2010
0,16
40.3
6053
5310
515
10.
300.
1614
1.16
033
5310
907,
515
10.
30010
141.
700
5353
990
090
0.20
0.10
142.
200
5333
1111
2.5
150
0.20
010
142.
700
3353
Its
500.
200
ID14
3.1%
5353
1211
7.5
990
020
0.10
943
680
3353
120
(46
0.20
0.90
144.
180
3333

Cal
cula
Mons
for
0
Test
#2
Cli
ent
Noi
*mon
P*
Job
Num
ber:
1214
1345
6
Pla
nt:
P64.
69B
aler
Loca
tion:
flo
at.
NO
Test
P84-
3D
ate:
11-M
ar-1
5P
erso
nnel
:T
hH
IJJ
BJJ
PJI
Calc
ula
ted
Pora
onote
rsls
ok
ino
lici
tyC
hecks
Sta
ckG
.P
ress
ure.
PSin
-Hg)
Sta
ckG
asM
olec
ular
Wei
ght.
Dry
Bas
is,
Md
(tbf
lb-o
nole
)
Vol
ume
ofW
ater
Vap
our
Coll
ecte
d.V
et
(cul
t)S
ack
On
Mois
ture
Co
nle
ni
9%as
dec
imal
tS
ack
Gas
Mol
acst
arW
ebW
etB
ani
s.M
sll
b-I
b-m
ole
l
Chec
kg
ang
.O
uls
ide
olC
nle
ña
Chec
k58
mm
Cei
leña
2.5
7-5 10 12,5 II 17.5
20 22-5 25 27.5
30 32.5
35 37-5
40 42.5
45 47.5
50 52.5
55 57-5
60 62-S
65 67.5
70 72.5
75 77.5
80 82.5
85 87,5 90 9
15
95 97.5
Ito
102.
5It
s10
7.5
lID
112,
5‘I
S11
7.5
120
Tot
al12
0
Sta
ckG
asS
4ypa
Pil
ot.
Onfi
ceS
lack
Gas
Tem
p.
Ta
delt
aP
delI
aH
Vel
ocit
y.U
s
(RI
(ut
Han
)(i
n.H
ZDg
(Its
)
61I
0.63
0.48
58,4
326
.42
612
0.56
0.51
60
34
29.4
2
612
0.88
0.50
60.0
329
.42
610
0.80
0.41
54.1
526
.4’
610
0.50
025
42.8
126
.40
608
0,52
0.27
43.5
929
.40
600
0.47
024
41.4
729
.40
610
0,47
024
41,5
129
,40
610
0.44
0,23
40,1
629
,40
608
0.40
021
38
23
20.4
0
611
0,70
0,37
50.7
029
,41
611
0,70
0,37
50,7
029
A1
611
1,05
0,54
62.0
929
,42
612
1.10
0,57
63,6
029
.42
612
lAO
0.73
71.7
529
.43
608
lAO
0,73
71,5
229
,43
609
1,70
0,69
78,8
726
.45
604
1,60
0.84
78
20
26.4
4
602
170
0,90
76.4
226
,45
602
1.70
0.90
76,4
229
,45
607
1.70
0.89
76,7
429
,45
607
1,70
0,89
76.7
429
.45
607
‘.70
0,89
79.7
429
,45
604
1.70
0.89
76,5
529
.45
607
1,50
0,79
73,9
7
606
1.50
0.78
74.0
3
609
1.40
0,74
71A
060
95.
400.
7371
.56
612
1.30
0.68
69.1
4
609
130
0,68
68,9
7
609
1.30
0,68
68,9
7
609
120
0,63
6827
612
120
0,62
56,4
360
9120
0,63
86
27
609
0,90
0,47
57.3
9
607
0.90
0.47
57
29
609
0,65
0.34
41,7
761
10,
650,
3448
,65
611
0,45
0,24
40.6
561
20,
45023
40,6
0
612
0.30
0.16
33,2
2
611
0.30
0.16
33,1
961
10
30
0.10
27.1
061
00.
200.
1027
,08
610
020
0_ID
27,0
8
610
020
0,10
27,0
8S
It0,
200,
1027
.08
506
0.20
0.10
27.0
3
Aver
age
Aveg
ate
Aver
age
609
0,95
GA
O
11
40
123
616
0,39
1.15
0124
710
1.35
1.15
0124
710
4,72
1.12
0121
310
2,14
1.12
0121
31
60
25
1,11
012
02
105.
041,
160
1.19
110
4.09
1.08
01.
170
109.
361,
040
1-12
610
2,67
1,02
01,
106
100.
550,
940
1.01
910
6.95
0,65
01.
028
107.
610,
680
0,95
211
7-67
0.65
00,
921
113,
950.
750
0.81
212
0,81
0,65
00.
704
104,
780.
630
0,68
212
4,37
0,60
60,
650
116
25
0,54
00,
585
930.
430,
500
0,54
192
0.67
0.5
0.54
112
0.67
0,49
00,
530
118
26
0,49
00.
530
1182
60.
500
0.54
112
0,47
29,3
929
.94
I2.4
750
22
827
-45
tune
Met
erP
ress
_A
vg.
Tem
p,P
mti
mH
otT
m(R
I
Gas
Met
er
Tea
ven
eI
Tra
ver
se2
Tra
ven
aP
oin
t
4 10 II II 2 4 $ e 7 8 9 IC II II
too
kin
etic
sV
olum
e.V
oL@
Rd.
Vm
(Cu.
It)
Vm
c(C
o.It
)(‘
A)
0.94
01.
029
109,
430,
970
1.05
819
023
0.93
01.
015
102,
360,
850
09
27
103,
350.
790
0.77
210
9.94
0.88
00.
739
101.
050,
660
0,71
710
4.16
0,66
00,
717
10
425
0.64
00.
694
904,
370,
620
0,67
310
5,67
0.80
00.
868
103,
580,
600
0.86
990
3.08
0,99
01,
075
194,
691.
040
1.12
910
7,54
1,05
01.
141
962
81,
130
12
28
10
32
71.
160
12
60
962
31
220
1.32
510
3,88
1,21
01,
314
99.8
01
240
1.34
61
022
71
250
1,35
610
3,42
12
50
1-35
710
3-52
12
40
1,34
690
2.70
1.33
01.
443
109.
77
508
510
510
510
511
512
512
512
512
512
512
512
512
552
512
512
513
613
513
513
513
513
513
513
5(3
513
513
514
614
5,4
5,4 5,4
514
513
513
514
514
513
513
5,3
5,3
513
513
513
5,3
5,3 513
513
29,4
429
,44
29.4
329
.43
28,4
329
.43
29,4
329
,43
29,4
329
,43
29.4
129
,41
29,4
129
,41
29,4
029
.40
29,3
929
,39
29.3
929
,39
29
39
29,3
929
,39
29.3
5
Aver
age
Am
eag
eA
vera
ge56
.19
20,4
251
2bla
tT
otal
Ave
rage
47.3
8910
7,61
43.6
70
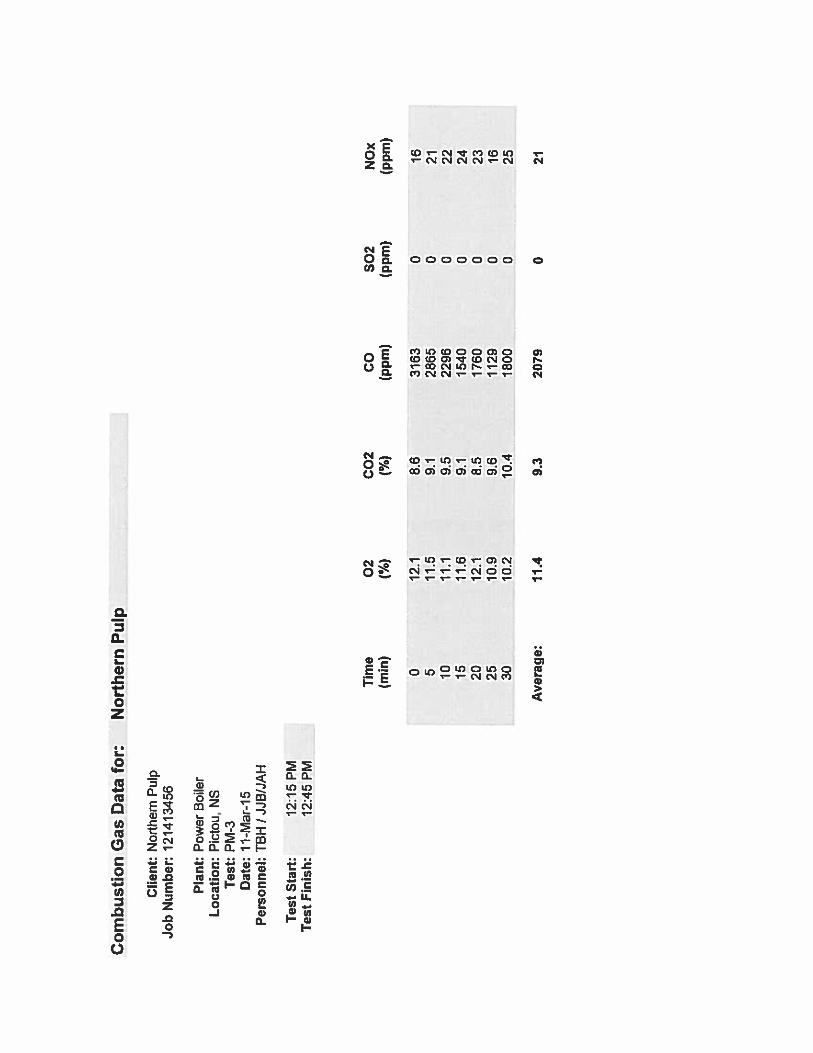
Com
bust
ion
Gas
Dat
afo
r:N
orth
ern
Pul
p
Cli
ent:
Nor
ther
nPu
lpJo
bN
umbe
r:12
1413
456
Pla
nt:
Pow
erB
oile
rL
ocat
ion:
Pict
ou,
NS
Tes
t:PM
-3D
ate:
11-M
ar-1
5P
erso
nnel
:TB
HI
JJB
IJA
H
Tes
tS
tan:
12:1
5PM
Tes
tF
inis
h:12
:45
PM
Tim
e02
C02
CO
502
NO
x(m
m)
(%)
(%)
(ppm
)(p
pm)
(ppm
)
012
.18.
631
630
165
11.5
9.1
2865
021
1011
.19.
522
960
2215
11.6
9.1
1540
024
2012
.18.
517
600
2325
10.9
9.6
1129
016
3010
.210
.418
000
25
Ave
rage
:11
.49.
320
790
21

9£00_c9
19
11110
os-Ic01
ScScScScSccc65ccSccccc6cccccccccScScScScScIcScIcISIcIcISItIcIcIc9’
99095ccccI_cccccccccIcIcScIccc
Iii!)utS
usi
U0d
jUfl’U
Ols9
flw’tw
wt0
Id3)Iu
.prJJ0
03
lOld
CuU
nl.w
tla91270N
lii)q
iflusi
oqoidCu
tsI
n-c
c,n
sIii!)
Jia
wsia
09
I5
09%
Vc61
09051161
090
*2
06
’65
OSc611
6c011551
cc056955
cco19ck
I09
oIt1
I09
0%
tSI
09091
SI09
01601109
01561109
0IflI0
09061111
09091915
09000911
09C
OC
cI!09
OIL—
IT09
0%
£1109
051W
cc011111
650*1
ILl
cc011010
Sc09109!
001591
cc001191
Sc011195
Ic001991
Sc0cc
c910
9L
flISc
0g6c95Sc
octc
gI
Sc0
1r1
91
Sc011191
Sc
016091cc
OT
tO,’
66olrS
cI
09009101
cco19lc
lcc
ocL
ocI
Scocccsl
Ic0
61
ccI
95O
ttEcI
cco
corcI
noL
SOcI
cc059611
cco
ctsi-I
IcS
tIlt!oc
oco
9i-l
055i-lI
160
0*
!160
051160
00I
160
001tO
T065
to_I06_I
tel
06
’co-I
061960
001960
0*1000
Ccl
000lo
T510
I0I
110ceo
600
cc0ItO
010
cr0
cr0
cEo
cccItO
090
rca
coT160
001IcC
001160i-co
001
610
do
tOT
cto
coo
UI
LEO010
IdItO
010
i-cl
lEo
090
i-cl
110090
cl
cr0
cc-u011
oro
dde
ccl
610
ccoccl
610
550
ocT
ItO190
ocTlE
O090
101ItO
060
ISO110
060
6i-I
£10
Ott
610
610
OFT
Ed£10
ott
ci010
Ccl
Si-I
610
CC
ILi-I
610
010
ocI
i-SO091
ci-’n
I091
di-’
610
ocI
ti-I
610
or’
ti-I
cclO
ttSc!
c_Icco
ilccc
Illclo
ttE
lO
IL[i-I
SL
Ot
011SO
’ccl
i_codti-I
lot
dcl516
LII
06ccl
ole
ti-I06
ctIS
IBti-I
09091
519
III09
idcu
10101
KS
Ott
ccl01
dcl
019
ISO09
095O
lD
09sIc
ccc-to09cit
ci-c_ti
ltc_
ItS
tc_cc01
S-ItS
tc_
tiat
c-Iccc
c_cc0I
c_I
s-c
IlIad
.0_T
oni’
A,uofiy
MO
IqID
SN
51110M
D0
]05
91
11
000119N(V
IE)
Shod
i.do
w!j
Sui1dw
,gshulod
SuId
wss
1151°!
Iw)
MP
PS
IO2
SWfllO
A0111
.)d
wej
IUSIO
WV
(0tH
10!)‘Iln
IdaJn
ss.iJ‘o
fl5‘I’1
1lOw
ui)iq
a‘1
15
15
1i
dO
PIO
WlO
to
0_Toil
hititd
tnt
11w)S
WIIO
A111111016
lift
IS)1050N
I!0M15101
tea
(Ow
)P91391I00
°IT°’9
Pd
520!
p:(O
w(
IISSMi,D
u!dhllW
ail001091103
IIS01010S
d
oct
:lOw
IU
UM
SqO
id11015
P0105103
°i’1O
’flJd£
09
1:l6w
(•S
IWW
OJI
011251103oO
qnZ!U
td
591Ic
1:4SIU
!d000!
Nd
tIEIS
ISin
!
oovc,o
rLqool
I0U
UoU
dcv
I’iI
I:5250
tod
dIi.j
SNlIP
id:1
00
5,0
110508
JIMO
d:01911
9509095cc
-Joqw
oN
qor
°d
WI!W
ON
:010113
LI*IS
O!
0U
OJ
8250M
EN
ILcc
0IIVcii.
IL
ZsciS
otI!
L01116501
IS)ti)
(11ii,)
(0tH
ii!)latH
105(Iii
huiw)201090
10111SW
OIO
AH
fl°P
d11op
.‘dso
.j
diii.!
012509s0
j°i°
vi
550
5001510O
OId
.dbs
559
lt1S
00
hull)tO
O
c_St
wilT
‘ON
lice,
lwd
d)0
3
£01
1%)tN
0-ti
(%)‘tO
S1.6
1%)tO
i_actIc
S1116
10
niP
sSO
Ot
p_cg-a
tc0-U
S91518
Itt
tctI
6101
OtH
1bc
16
11
co
lt1
09
6O
tHiw
Ccc
ID)
511151016(6)
(6)521
6iU
03
40l’l0
!M1q6!9M
on!
I’IO.5M
SlId
jacuId
wI
/10
13
0N
ItI-’
Cen
t
95ItodIcE
ON
.nlo
1d
w1
-5k---
-
____

Cal
cula
tio
ns
ton
Tes
t#3
Cli
ent
Nor
ther
nP
oip
Job
Nu
mb
er.
1214
1345
6
Pla
nt:
Pow
erB
oile
rL
oca
tio
n:
Picl
og,N
OT
est
PL
Dal
e:11
-Mar
-15
Per
sonnel
:T
hW
JJS
IJM
I
Cal
cula
ted
Par
amet
ers
Sla
ckG
asP
ress
itre
,P
alin
.Hg)
slack
Gas
Mol
ecul
arW
eigh
t.D
ryB
asis
.M
d(l
Mb.n
slel
Vol
ume
enW
ater
Vap
our
Co
llec
ted
.V
wc
truS
t)S
tack
Gas
Moi
slor
.C
onte
nt1%
asde
cthi
all
Sta
ckG
asM
ole
cula
rW
eith
tW
etB
asis
.M
s)t
hlb
-en
sle)
bokln
ellc
lty
Chec
ks
Che
ckra
nge
Wtt
hin
Cei
lena
Chec
kav
eng
oW
ithi
nC
rite
ria
Tra
vers
eP
urnt
2.5
7-5
It 115
95 ‘7-S 20 32.5
25 27.5
30 315
35 37,5
40 42.5
45 47-5 50 5
15
55 57.5
60 615
65 67.5
70 715
75 n-s 80 82.5
65 87.5
60 82,5
95 87.5
100
l02
.5It
s10
7.5
lb 112.
5‘‘
511
7.5
120
Sta
ckG
asS
-typ
eP
itol.
0,11
1cc
Sta
ckG
asT
em
pT
sd&
laP
deh
aHV
eloc
ity.
(R)
in.
H20
Ilil
tH
OG
)00
5)
602
1.50
0.79
73.4
660
21,
500.
7)73
.46
605
1.60
0.84
76.0
560
51.
600.
6476
.05
610
1,50
0.78
73.9
460
7IS
O0.
7973
.76
608
1.50
0.79
7382
611
1.40
0.73
71.4
961
21.
400.
737
t,5
56
0)
9.40
0,73
71,3
660
00.
600,
475723
611
0.00
0.67
57,3
261
10.
600,
3146
.80
610
060
0,31
46,7
761
00.
550
29
44.7
761
50.
55029
44.5
66
I30.
550
29
44
.8)
609
0,55
62
944
.14
811
0.60
0.31
46.6
061
40.
600.
3146
.92
614
0.70
0.37
50,6
461
30.
700.
3750
.64
602
0.65
0.45
55.7
561
20.
750.
3952
.37
594
1.00
0.54
59.5
629
.35
611
1.00
0.52
60.4
229
.39
615
1.00
0.52
60.6
229
.39
613
1.00
0,52
60.5
229
,3)
614
1.00
0.52
60.5
720
.38
611
0.60
0.31
48.0
029
.30
610
0.55
02
944
,77
29,3
760
70.
45024
40.4
029
.37
604
0.40
021
38.0
029
.37
604
0.35
0.1
)35
,54
29.3
760
50.
050.
5’58
.60
20.3
660
21.
000.
5359
,08
29.3
960
51,
500.
6073
.64
29.3
960
71,
500.
8073
.76
29.4
160
51.
800.
5680
.67
29.4
160
21,
806.
5660
.47
29.4
259
91,
901,
0212
.47
29.4
260
01.
001.
0202
,53
29.4
360
38.
001.
0262
.74
20.4
359
71.
001.
0282
.33
29.4
35
)71.
600.
9780
.13
29,4
360
01.
800.
0780
.33
29.4
259
61.
800.
978
02
029
.62
595
1.80
0.97
60.0
029
.62
Aver
age
Aver
ate
Aven
ge
607
1.15
0.61
1,00
01.
072
105,
700,
860
1,05
010
4.99
1.00
01.
072
107,
580,
690
8.00
01
00
23
1.01
01,
081
108.
360,
760
0,83
580
7,77
0,75
00.
802
108,
090,
670
0,71
610
0.36
0.62
00,
562
104,
140,
560
0.56
510
0.55
0.63
00.6
)756
,53
0.68
00.
641
03.4
01.
040
1.11
290
.35
12
10
12
95
105.
361.
160
1262
93.6
41,
260
1.34
689
.79
1,31
01.
402
100.
739.
350
1.44
710
4.00
1.31
01,
404
101.
171,
340
‘.43
110
3,07
9.3)
0lA
OS
103.
538.
300
8.39
3‘0
2.65
1.30
01.
393
102.
711.
310
1.40
390324
29,3
830
,15
13.6
880
20
727
,63
—e
9.ni
nl
Tra
ver
seI
Tra
ver
se
Met
erP
ress
Avg
.T
emp.
Pm
lilt
Hal
Tm
lR)
29,4
129
.41
29.4
129
.41
29.6
129
,41
29,4
129
,40
29,4
021
,40
29,3
629
,36
29.3
729
,37
29.3
729
.37
29,3
729
,37
29,3
728
,37
29.3
629
,36
29.3
829
.38
It II 82 2 3 4 IC 11 I!
Ge,
Met
erIs
ekin
euc.
Vol
ume.
Vo
lQ
Re?
,V
m(C
u.01
)V
mcl
cu.
IL)
12
00
1.33
011
7.76
1.16
01
26
310
4,03
12
00
1.32
610
4.31
12
30
‘.33
510
5.00
1,19
01
25
01
05
29
1,16
01
27
710
3,95
1,17
01
26
510
3,05
1.17
01,
262
100.
7!1.
140
1209
103.
561.
160
1260
108.
040.
950
1.02
010
7.60
0.97
01.
041
109,
740.
780
0,63
710
8.03
0.79
00.
647
109.
320,
760
0.61
610
9.95
0,75
00,
805
806.
950,
750
0,80
410
9,67
0,76
00.
815
109,
750.
750
0,80
510
3,87
0,76
00,
637
10
82
90,
780
0,83
710026
0,84
00,
802
108.
010,
940
1,00
910
9.51
0.08
00,
643
109,
02
Sit
511
582
512
513
514
514
5,5
516
5,7
5,7
598
59)
SI)
517
517
518
516
Sb 518
598
SI,
518
SI)
Sb 5,9 518
5,9
519
519
519
520
520
520
520
520
520
520
520
520
520
5,9
5,9
5,9
Ste
509
5)9
519
Tot
al12
0A
ven
ge
62,3
2A
vera
ge29
,39
Tot
al46
,650
Tot
al5
22
74
Aver
age
517
Ave
rage
104,
52

Co
mb
ust
ion
Gas
Dat
afo
r:N
orth
ern
Pul
p
Cli
ent:
Nor
ther
nPu
lpJo
bN
umbe
r:12
1413
456
Pla
nt:
Pow
erB
oile
rL
ocat
ion:
Pict
ou,
NS
Tes
t:P
M4
Dat
e:11
-Mar
-15
Per
sonn
el:
TB
H/J
JB/J
AH
Tes
tS
tart
:4:
00PM
Tes
tF
inis
h:4:
30PM
Tim
e0
2C
02C
OSO
2N
Ox
(mm
)(%
)(%
)(p
pm)
(ppm
)(p
pm)
010
.310
.112
490
175
10.0
10.7
2928
016
1010
.411
.413
700
24
159.
011
.729
840
27
209.
011
.617
490
33
259.
411
.016
270
34
309.
810
.516
460
33
Ave
rage
:9.
711
.019
360
26
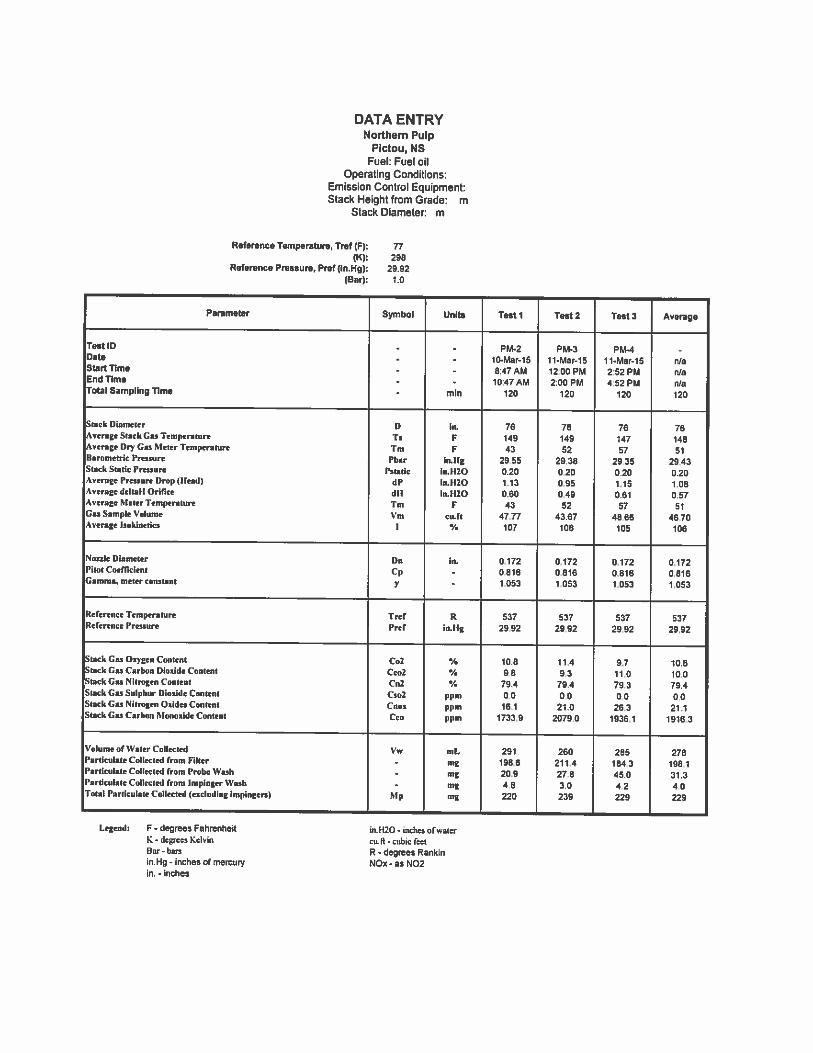
DATA ENTRYNorthern Pulp
Plctou, NSFuel: Fuel oil
Operating Conditions:Emission Control Equipment:Stack Height from Grade: m
Stack Diameter: m
Reference Temperature, Tref (F): 77(K): 298
Reference Pressure, PrefQn.Hg): 2992(Bar): 1.0
Parameter Symbol Units Test 1 Test 2 Test 3 Average
Test ID- - PM-2 PM-a PM-4 -
Date- - 10-Mar-iS I 1-Mar-15 1 1-Mar-i S n/a
Start Time- 8:47 AM 12:00 PM 2:52 PM a/a
End Time- - 10:47 AM 2:00 PM 452 PM Va
Total Sampling Time- mm 120 120 120 120
Stack Diameter D in. 76 76 76 76Average Stack Gas Temperature Ts F 149 149 147 148Mtragt thy Gas Meter Temperature Tm F 43 52 57 SIBarometric Pressure rhar injig 29.55 29.38 29.35 29.43Stack Static rressure Pstatic in.l120 0.20 0.20 0,20 0.20Average Pressure Drop (head) dP in.hI20 1.13 0.95 1.15 1.08Average deltall Orifice dli in.1I20 0.60 0.49 0.61 0,57Average Meter Temperature Tm F 43 52 57 51Gas Sample Volume Vm cuSs 47.77 4367 46.66 46.70Ayes-see laokmne,ics I Ta 107 108 105 106
Nneale Diameter Di. in. 0 172 0.172 0,172 0.172Pitottoefficiens Up - 0.816 0 816 0,816 0816Gamma, meter constant y — 1.053 1.053 1.053 1.053
Reference Temperature Tref R 537 537 537 537Reference Pressure Pref intl8 29.92 29.92 29.92 29.92
Stack Ga. Ongen Contene CoZ 10.8 11.4 9.7 10.6Stack Gas Carbon Dioxide Content CcoZ V. 9.8 9.3 11.0 10.0Stack Gas Nitrogen Content CnZ ¼ 79.4 79.4 793 79,4Stack Gas Sulphur Dioaide Content CsoZ ppm 0.0 0.0 0.0 0.0StackGeeNitrogenOaidesContent Coos ppm 16.1 21.0 26.3 21.1Stack Gas Carbon Monoxide Content Cci. ppm 1733.9 2079.0 1936.1 1916.3
Volume of Water Collected Vw ml 291 260 285 278Particulate Collected from Filter
- ong 198.6 211.4 1843 198.1Particulate Collected ri-nm Probe Vash - mg 20 9 27.8 45 0 31 3Particulate Collected rrnm Impinger Wash
— mg 4.8 3 0 4.2 4 0Total Particulate Collected (excluding impingen) Sip mg 220 239 229 229
Legend: F - degrees Fahrenheit n,[120 - inches atwaterK - degrees Kelvin cu,ft - cubic FeetBar - ban R - degrees Rankmnin.Hg - inches of mercury NOx - as N02in. - inches

CALCULATIONSNorthern Pulp
Plototu, NSFuel: Fuel oil
0per91219 Conditions.Emission Control Equipment:
Stack Height from Grade: mStack Diameter: in
Vadeble Symbol UnIts Calculation Test I Test 2 Test 3 Average
Sink Are. A, 1q11 4e — Pit I(ohlOi’2 4 31.50 31.50 31.50 31.S0
I.e A,),q.ml.Ai).,fl)sbOIZt 293 293 293 293
B.rnciricPewure PS., kP. Pbur)kfll•Pb.rdntbj.IJN 1001 995 994 998
t.ck Stitic Pn..ne Ps,r.k k11. N.m kPEe Ptnrk 1.1120)1 C!) 0 Os 0.05 005 005
Ant. Stack Tcmpcretsn Ti K Ti Ri eTc fl • 14* 809 809 807 808
At1. Meter Temperittire In K Tn lliTe IFI°44* 503 512 517 511 0
NonkDismeirr 0s D.iel-Dsibislld 4 4 4 44
C., Meicr r echOiC Pm tIlt Pm — Pbn+l 411 i 13.’) 29 59 29.42 29 39 2947
Simple Volnac et RefCond Yst ‘tO Vme’Tnr!Pnru{Vm s Pm .yiIte 53.09 47.30 5225 509
‘I.e Vec(amIt020J3nvee)e,n) 1.50 1.34 148 1.44
Volume trwster Vepoor voc twit t’wt fiNd uvo, 13.94 1248 13.87 13.38
Woter Fraction Boo Bet—Vet! I V*t + Vet) 0.200 0.208 0 207 0 2
Meleccil.r Wricht. Dry Rd bIb-er) Md— &41 irish •ti: (Coo), bIt Cell 3000 2994 30.15 300
3tokctl.r Weibo. Wet Mi 1616-md ‘(nIld II’ loot clii t 0..) 27.50 2745 27.83 27.5
Stick Pn.eun P. iRa P. — PIer • P.1.115! 03.11) 2954 29.39 2938 2944
(tick Ca V.kdtp Ci 16. Ce • 19.33 I Cp I (NP I Tilt’s t orts 62 07 54.19 02 72 60 3
en Ce ie!•1 53- 11U11161 I 1092 17.13 19.12 104
Anal Stub U.. Fine Rile Q .ri Q—lCs LisA. 117,330 100 218 113 558 114035
Dry Stick C.. Ftto, Rite 9. R,rm Q. —0 lI’S—ti u )TnUTeI r (ri/Pitt) 81.820 72,822 81,607 78.408
Rn-s Q.ite...1b811047250.(Rifroe 3825 3437 3052 370
Sulphur Ditside. SO!502 Me,,ii red Concentration C.ul ppm Mr.,.nen,t From lim Cee An.).r 000 0 00 0 00 0.00
U,correc it’d 1) Ref Cond C.u3 chess C,.0)e0/Rrm( — Ccii ppm) I 342 0.00 000 000 000
SO! Eminion Rile cR113 1/’ ERiti • Ceo3!I0ce • QI 000 000 000 000
hfl, eRetllkflfl.ibt CR1006/el 000 0.00 0.90 000
502 Ccdetttr.licnCorrected 1.11% 02 C.u3 stir. Cm3t11%roI.C,.3 ).WR.metiltbI)i/l0tt-C31 000 0.00 000 0.00
orrrctrd 0.3% 02 L.a eWRsm Cu3 )r403) • C..3 (nt/Ram) • atea,00.1t31 DM0 000 000 000
Corrected 1112% C02 Cml mWRse CeO 113% COllm CaiO isp/Rem), ill/tea) 000 000 DX 000
NiIrnenr anN., . NOt
NOr Matured Cnncrnlratioe Cm. ppm Mreooree.ot Ins lii. Ce. AIim., 1014 2100 26.29 21 14
Uncorrrcoed 61 RrFCosd Cm. ma/Rn- tort lmpjmtsnl— Cm, ppm) r 1.103 30.38 39.52 49.47 3979
Not Emission Rely 1Km’ Wi cRoon — Cts./lom s Qu 1 16 1 38 191 1.40
1/br Ktstikflr(.ien Emmila/if 4.15 489 8.06 5.31
NO. Centre caRomCorrected toIl ¼ 02 Cm’ mpltm Cm, 111% 03). Cmi (ma/ten) I i0fl.I 1)1 ifll.colt 2970 41.00 4373 38.14
:rretted oJ% 02 Cm, siRen Cen (3+1.021. Cen ieflt.l • )lfl,O(/c21.)Ca31 5389 74 13 7900 6496
Correctid 1012% C02 Cm. st/Is. Cm, 113% COOl — Cm, ieeia.i 5 )iLtctI) 3728 5123 5397 4740
CsrbortMsnmtide-COCOMr.uurrdCrectolr.iioo Cc. ppm Ma.an.nhlmn.ICSA.Jpn 173300 2379.00 1938.14 191833
U.esrncte,161R.fCad ci. se/On- cm)etRn-i-reev,sJ.Ilal 198527 235048 221688 219429
CO Emieeion Ret. ERrs LIce — Cn(bIi0 sQ. 7593 01.82 0539 01 05
•fl, Ipso ha/hi —30s eflco (e) 27334 294.56 307.41 291 V
CO Cenren trail.,Correcled 1.11% 02 Coo mg/Ire Csulll%09).Cro)ms/ReeII)351.lI)!00.9-C031 194046 2469.54 195957 2123.19
Corrected to 3% 02 Coo mg/Rim 00(3% 03)— Ceo ma/Rem), 3554) I 1359-CoO) 350552 4485.13 3543.05 3038.90
Corrected 1012% C02 Cc. mt/Rem Cc.(13% CD!). Ceo )m1Imim) I il/troll 243449 3005.78 2419,42 264823
PsnktIsleCooc,olndot C, si/mis Ci— MpIVmo 14801 17019 15492 15974
Piniedsie Emisoiou Rite LIp a/c LRp—Ct.lsQ, 554 813 597 509
wait !Rpêtirisjeo ER1)g/.e 20.10 2200 2148 2122
Penletlote CoecmtnliooCormted i.II’. 02 Ci edge C. pifl’. 031C.. tlbI-tI)lt3OICo3t 14272 18498 13594 15487
Corrected IoJ% 02 Ci m14em Ci (31’. 031°C.. (30.54)! (2t.t-C13l 25004 33442 24759 10002
Corrected it 2% C02 Ce mt/hem Ci 12% COO). Ccl (13/Ceo3I 17905 231.11 16900 19305
I.ute.dl sql -squire feel nb-0 - motto or mercury m0IRcm-ml9n.ms per dry relerence cube mel.
oqm-oqu.r. meorn II ‘cubic rot 9!..000m, per secyol
P,.1142 Cu 0’ rube main Nor- is (02
deretl Rink. Rot Coot -melerence lemp. ‘lure in FIssure 25 C sod 101 3 mel ecrm.nlcul rube feel per trundle
pym-paitipomitism Rome- dlyr.remncecunicm.frio pereoroed
Rtlm -dry melmoence cube feet per miour.

OFFICIAL STACK TESTING RESULTSNorthern Pulp
Pictou, NSFuel: Fuel oil
Operating Conditions:Emission Control Equipment:Stack Height from Grade: m
Stack Diameter m
N SE N VParameter Test I Test 2 Test 3 Average Limits
Test ID PM-2 PM-a PM-4 - -
Test Dale 10-Mar-i 5 1 1-Mar-15 1 1-Mar-15 - -
Stack Gas Temperature (C) 64.7 65.1 63.9 64.6 -
Moisture Content (%) 20.8 20.8 20.7 20.8 -
Velocity (ntIs) 18.9 17.1 19.1 18.4 -
Volumetric Flow (Rems) 38.2 34.4 38.5 37.0 -
Ongen - 02 (%) 10.8 11.4 9.7 1 0-6 -
Carbon Dioxide - C02 (%) 9.79 9.26 11.0 10.0 -
Sulphur Dioxide- 502502 Measured Concentration (ppm) 0.0 0.0 0.0 0.0 -
S02 Concentration at 11% 02 (mg/Rcm) 0.0 0.0 0.0 0.0 -
Emission Rate (lqz/hr) 0.00 0.00 0.00 0.00 -
Nitrogen Oxides - NOxNOx Measured Concentration (ppm) 16.1 21.0 26.3 21.1 -
NOx Concentration at 11% 02 (mg/Rcm) 29.7 41.0 43.7 38.1 -
Emission Rate (ku/hr) 4.18 489 6.86 5.31 -
Carbon Monoxide - COCO Measured Concentration (ppm) 1734 2079 1936 1916 -
CO Concentration at 11% 02 (mglRcm) 1940 2470 1960 2123 -
Emission Rate (kglhr) 273.3 294.6 307,4 291.8 -
Particulate Matter - PMParticulate Concentration at 11% 02 (mg/Rem) 143 185 137 155 -
Particulate Emission Rate (kg./hr) 20.1 22.1 21.5 21.2 -
Legend: C - degrees Celsius Ref Cond - reference temperature and pressure (25 C and 101.3 kPa)rn/s - metres per second mglRcm - miligrams per dry reference cubic metreRcms - dry reference cubic metres per second NOx - as N02ppm - parts per million ND - non-detectable

PnO
ooIa
I.lt
eco
vo
4..;
Ieçin
ger
Cat
ch.
P,o
beW
nh
.F
itte
rC
atch
Cli
ent:
109T
h4m
Pul
p
F6116r
Po
wer
ho
ur
Iow
an:
P02
nu.
045
Job
Nu
mb
er1
21
41
24
50
IMP
IN060
CA
TC
H
__
__
__
__
_
fleaer
Per
8A
igh
tele
tR
ow
oveda
fle
a.t
Pat
Wig
bb
let
Un
ow
elec
ted
Coere
ded
Cow
Sai
rree
Ode
Sait
wl.
IDJar,
Jar
Saaçle
Rio
’.T
ota
lR
Io..
Dat
eP
att
uols
ee
Ptn
ilde
toS
am
ple
,T
ees
Co
tiec
ted
War
Wil
esA
adt.
.d0
,W
eight
lot
Wei
ght
tot
mall
194.
12T
rial
SA
ver
age
Rtn
oe4
.)to
tlo
tto
tto
)m
all
Tib
IaT
d.t
3A
nt.
ge
161079100
1070770
5079279
51.1
-26
89
04559
2905
lIt
15
16
1079334
10
79
32
0107
933
205
05
30
00
40
P5
1124390
1124397
1124316
PM
-I8
34
34
55
72519
69
13
76
1124432
1124412
11
244
32
05
03
105020
07
1077205
3077203
101
72
04
PM
38
31
24560
26
47
63
566
1077251
1077240
307
725
000
04
600042
Co
etc
(Wri
t
HI
30
92
00
51092006
(1092006
(5
60
60
66
)4553
(1
91
5]
15
25
10
92
01
0I
1092011
I(
1092011
O5
[0
503
PR
OO
FW
AS
H
0.e
eer
Pr.
Reow
vedn
See
hee
pat
Vie
igN
*le
tU
Now
erec
led
Co
ered
ed
Coobir
ee
Sie
npee
lDJar.
Jar
Rec
Over
edR
iots
Tota
lbate
Part
cta
tde
Patt
cota
IDalah
xcd
oo
eT
ree
Ace
torr
eA
aow
.A
ceco’.
Md
thr
l*41
h6
lot
Wei
gh
t(9
9
Tri
atl
194.
12T
rIM
SA
ver
age
tot
(ot
Ott
to)
Tri
alI
TrI
al?
TrI
MS
Ara
ee.
1(6
1121040
1121640
1121040
PM
-?4
29
02
24
51154
72
12
26
1122903
112200
411220
94
00
334
0070
9
001106362
1106370
1106360
51.0
34
22
12
74
0hO
t90
30
77
1105611
110(6
71
1105671
05
231
00778
NI
1127040
1137011
6627050
PM
33
95
03
24
5714
225
630
1127511
112750
011
2-70
110
0461
00450
Co
ot-
tern
X4
16
22
t94
)11
32
86
4I
1122694
AS
3032
22
40
062
I09
30522094
11
22
0I
I112
2502
Io
oI
Deo
st
FIL
20
RC
AT
CH
otA
aW
56
:01034
h/tn
Pt.
VW
e(a
’P
ool
Wri
gh
Ot(i
iP
arb
ett
ale
FIk
alo
het
D4tI
.l0
Dat
e:W
eig
ht
Mav4dW
MaI6
sedbv
from
flher(
gt
TrI
MI
TR
eJO
TrI
MS
Ave
rage
Tri
alI
TrI
al?
TrIa
lSA
venge
0226
-23
03509
02
50
602007
PM
-?0
54
95
09
49
60
54
53
03056
0226
-20
0347
203
474
0347
6PM
-S0
5569
0550
906
905
0211
4
0336-I
S0
24
22
02421
03
43
3P
06
40
5260
09
26
205264
03643

Raw
Data
for
Test
#1C
lien
t:N
orth
ern
Pu
Job
Nu
mb
er
12
14
13
45
6
Pla
nt:
Rec
ov
ery
Bal
erL
oca
tio
n:
P65
00.
NO
Tes
t:P
M-I
Dat
e:0-M
a-IS
Per
son
nel
:T
hH/J
JWS
AN
Tes
tS
tan
:9;
IXIA
.MT
est
Fin
ish
:11
.101
AM
Par
ticu
late
Cole
cle
d1m
mF
iler
(mg)
Paf
licu
lale
CoA
ecle
d(r
emP
rob
eW
ash
1mg)
:P
anic
ule
teC
og
ecte
dfr
om
Impin
ger
Was
h(m
g)T
ota
lP
afl
icula
l.C
oll
ecte
dm
g):
‘.9
24
74
2
Para
mete
rsB
arom
etri
cP
ress
ure
.P
bs’
(in.
Hg)
Sta
ckS
tati
cP
ress
ure
.P
atat
ic(I
n.(3
20)
Am
bien
tT
emp.
(‘F
)(3
20V
olum
eC
ole
cied
.V
ov(m
l.)T
ota
lI
Sam
pti
ng
poin
ts.
Sam
plin
gT
ime
per
Poi
nt,
(mm
)R
eadin
gs
Tak
en0very
_nin
eR
egula
tory
Ag
ency
Tra
ver
seP
oin
t
30.0
3It
o 10S
ill
24 21
Tin
eS
tack
Gas
Sype
Pil
ot
Ori
fice
Tem
p.
To
del
laP
del
laN
(mtn
f(‘
FI
in.
(320
)(I
n.(3
20)
Sla
ckD
iam
eter
,(I
n.)
Sta
ckA
xes.
(sq
.It
)P
robe
Len
gth
,(f
t.)N
ozzl
eD
iam
eter
,(i
n.)
P180
1C
oer
nci
ent.
(Cp)
Gam
ma,
met
erconst
an
tP
ort
len
gth
(It.
)
ISO
503.
87
0234
02
94
1021
2.5
532
515
27.
505
2II
154
12.5
154
1515
417
.515
420
154
225
5325
542
7.5
5430
154
32
.515
235
054
37
,515
440
5442
.505
445
154
47.5
154
50II
I52
.515
]55
553
57
.5(5
360
153
els
‘53
5515
407
.515
570
553
72.5
554
7515
4fl
’S05
450
153
52.5
155
5515
457
.555
9015
48
2.5
(54
9553
97
.554
100
052
502.
515
450
555
550
7.5
055
110
155
112.
515
411
5‘5
311
7.5
054
120
153
1102
400.
580.
6211
1-53
00.
590.
03211700
0.59
083
213.
890
0.59
0.t3
215.
070
0.50
011
216.
270
0.57
000
207.
370
090
0_el
218
650
0.50
001
209.
030
0.58
0.e
l11
1.01
00.
580.
8222
2210
6.58
081
1133
56038
0.82
114.
500
0.58
0.82
115.
750
0.58
082
226.
930
o38
0.82
116.
120
0.55
00
]22
3)22
00.
590.
8323
0.51
00.
980.
1223
5.73
00.
58G
el23
2.89
0059
084
234100
0.59
014
2252
900.
5900
323
6.51
10.
590(4
2377
300.
59003
229.
020
259.
020
0.55
082
240.
450
061
0.86
1417
956.
6001
524
3.07
0059
0.14
244.
530
0.60
0.85
141.
510
0.59
0.83
146.
790
059
0.83
248.
010
0.50
012
249260
0.61
006
2505(0
0.59
003
251
790
0.59
014
233.
000
0.59
0II
254.
140
058
0.82
255.
470
0.61
086
256.
740
0.60
0.85
256
000
0.61
0.87
2552
60039
0.84
260
550
0.51
0.81
260.
750
0.60
005
163.
000
0.60
085
264.
230
0.59
054
265.
500
0.55
014
266.
750
0.60
085
267.
950
0.60
005
2692
50
50 4,
47 40 it 49 49 49 49 49 50 50 50 50 50 St
55 52 52 52 5)
53 54 34 SI 55 55 54 54 54 55 55 55 55 53 55 59 55 35 55 15 55 55 55 55 54 54 54
50 47 47 47 47 47 47 47 47 47 47 47 47 47 47 47 40 48 48 46 49 49 49 50 50 50 30 50 SI SI ‘I SI SI 5I 5’ ‘I It 51 52 52 51 32 52 52 32 52 51 32
‘74
3.4
110.0
tmpin
ger
No.
Imp
ing
e’F
inal
Wei
ght
Tar
eW
eig
ht
Wei
ght
orC
onte
nts
Ig)
gfM
ois
ture
(9)
I00
0m
l.H
20
973.
572
6.0
247.
52
100
ml.
H20
974.
0729.0
244.
43
Bla
nk59
6.6
570.
925
.74
20
0g
SO
caG
d00
03.5
990.
522.5
02.
(5’)
CD
2.(5
’)N
Z1%
)C
Olp
pm)
NO
app
m)
502
(pp
ml
4.8
15.5
79.6
1fl
2.3
23.7 a.’
Gas
Met
erV
olu
me
)cu
.ft)
Tot
alW
eigh
sG
ain
(go
Moi
stur
eV
olum
e)m
L)
540.
154
0.5
Gas
Met
erT
emp
Inle
t0
—I
(•9
(‘F)
Tra
ver
seI
Tra
ver
se2
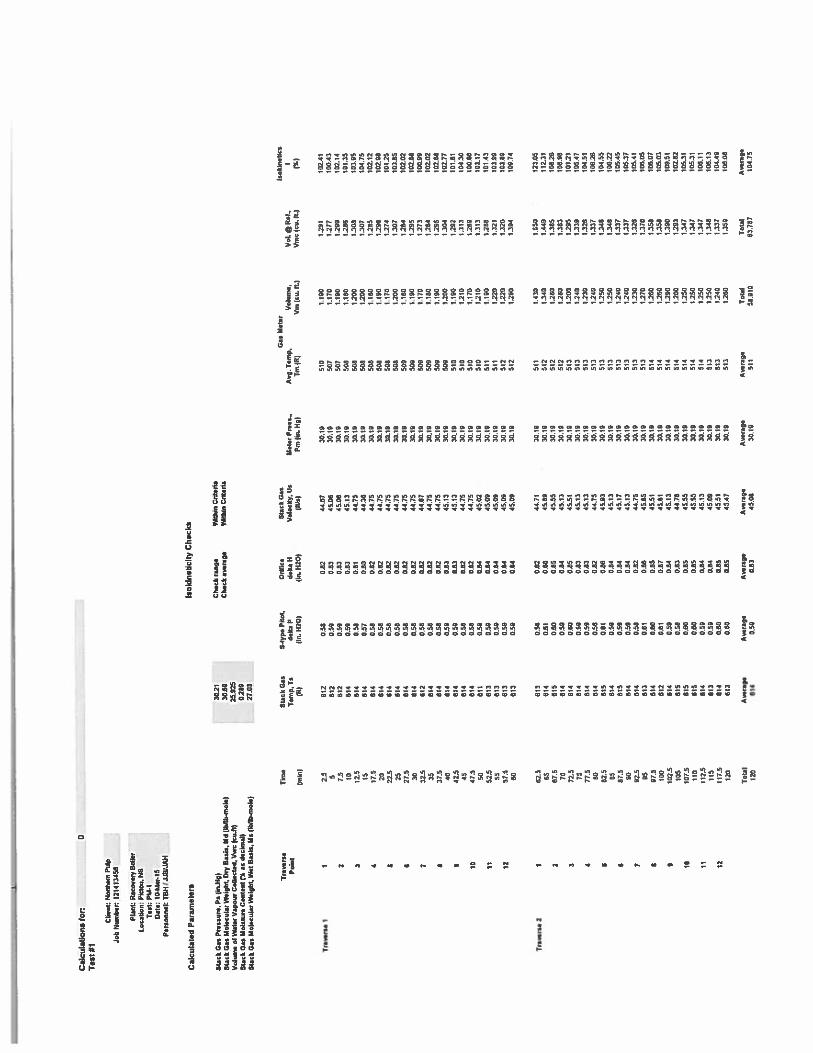
0C
alc
ula
tions
for
Test
81
Cha
nt:
Nor
ther
nP
14
JebN
um
her
1214
1345
6
Pla
nt:
Rec
over
yB
aler
Loca
tion:
frost
.N
ST
est:
P84.
1D
ate:
I04.l
ar-I
Per
son
nel
:T
hHIJ
JBIJ
AH
Calc
ula
ted
Para
mete
rsIs
okin
olic
ityC
hecks
Sla
ckG
asP
ress
ure
,P
sti
n.H
gtS
lack
0.5
Mol
ecul
arW
eish
tD
ryB
asis
,M
d(I
lalk
-one
t.)
Vol
ume
olW
ater
Vap
our
Coll
ecte
d.
Vw
c(cw
fl)
Suck
Gas
Moi
srur
eC
onte
nt
1%as
dec
imal
)S
uck
Gas
Mol
ecul
arW
eig
ht
Wet
Bas
is,
Ms
tIkl
Ib.e
sele
)
Chec
knote
V6O
hin
crit
eria
Ch
eck
av
en
ge
Wo
thin
celt
eda
2,5
7.5
It 115
IS 07.5
20 fl-s 25 27.5
30 32.5
35 37,
40 42.5
45 47.5
50 52.5
55 57-5
60 62.5
65 87.5
70 72.5
75 77.5
80 82.5
85 87-s
90 92.5
05 81.5
006
182.
560
510
7.5
Ito
112.
5l’
s11
7.5
120
Sta
ckG
as5
tep
Pil
ot,
Ori
ric.
Sla
ckG
asT
em
pT
sdel
taP
dek
aNV
elo
cty
Os
CR)
(Ut
NO
D)
(in.
H20
)tw
o)
12
0)
102.
411
277
100.
431
291
102.
141
286
101.
35U
SD8
103.
051.
307
104.
7502
851
011
2129
610
19
812
1410
02
51,
301
103.
65120
410
10
2129
510
2.88
127
310
0.99
126
410
10
2125
510
2.88
1.30
410
2.77
129
210
1.61
1.31
300
4.30
12
69
100.
861.
313
003.
0712
88lO
lA)
1.32
110
3.90
1.32
000
3.80
1.39
400
0.74
30
26
30.6
925
.925
02
60
27.0
3
rena
(mm
)
Vol
unw
.V
oLQ
ReO
.,V
ol(C
u.It
)V
ms
(to.
It)
Iso
lines
cs
0%)
Poin
t
3 4 ID II 12 IS II 12
Tra
oer
sa2
002
0.58
0.82
44.6
7
602
0.50
0.83
45.0
600
20.
590.
8345
.06
014
0.59
0.83
45.1
3
614
0.58
0.81
44.7
5
614
0.57
0.60
44.3
0
614
0.58
0.82
44.7
561
40.
560.
0244
.75
014
0.58
0.82
44.7
5
6l4
0.58
0.82
44.7
5
604
0.58
0.82
44.7
560
40.
580.
8244
.75
612
0.58
0.82
44-8
7
614
0.56
0.82
44.7
5
614
0.56
0.82
44.7
560
40.
550.
8345
.13
614
0.55
0.83
45.1
3
614
0.58
08
244
.75
614
05
80.
8244
.75
811
0.5
)5.
8445
.02
613
0.55
0.84
45.0
9
613
0.55
0.64
45.0
9
613
5.59
0.84
45.0
9
613
0.59
0.64
45.0
9
013
0.56
0.62
44.7
1
614
0.61
0.66
45.0
0
615
0.60
0.65
45.5
56
)40
.5)
0.84
45.0
300
40.
600.
8545
.51
004
0.5
)0.
8345
.13
604
0.56
0.83
45.1
3
614
0.56
08
244
.75
665
0-66
0.86
45.9
300
40
.5)
0.84
45.1
360
50.
590.
8445
.17
614
0.55
08
445
.13
604
0.58
0.82
44.1
56)3
0.61
01
845
.05
614
0.60
0.85
45-5
181
20.
60017
45.6
1
614
0.5
)0.
8445
.13
615
0.58
0.03
44.7
861
50.
600.
8545
.55
615
0.60
0.85
45.5
561
40.
590.
6445
.13
613
0.5
)0.
844
50
960
40.
600.
8545
.56
603
0.60
0-85
45.4
7
Ave
rage
45.0
8
Gas
M.t
.rM
eter
Pre
ss,
Avg
.T
emp.
Pm
(in.
Hg)
Tm
OR)
30
.1)
560
1.1)
030
.16
507
1.17
03
0.1
)50
71.
160
30.1
050
81.
180
30.1
050)
12
00
30.1
050
81
200
30.1
950
81.
180
30.1
050
81.
1)0
30.0
050
81.
170
30.0
050
81.
200
35.1
950
01.
180
30
.1)
500
1.19
03
0.1
)50
91.
170
30.1
950
01.
180
30.1
050
90.
1)0
30
.1)
509
120
03
0.1
)51
01.
1)0
30.1
951
0121
030
.10
510
1.17
03010
510
121
030
.16
511
1.10
030
.10
511
122
030
.10
512
122
030
.10
512
12)0
30.0
051
11.
430
35.1
856
20.
340
30
.1)
502
12
60
30.1
050
21.
280
30
.1)
563
12
00
30.1
956
30
24
03
0.1
)56
30
23
030
.10
503
024
030
.10
503
125
03
0.1
)51
31
25
030
.19
513
124
030
.10
513
1.24
030
.10
513
1.23
030
.10
513
127
030
.10
514
136
030
.10
514
126
0301)
514
129
030
.00
514
130
030
.10
514
125
030
.66
504
1.25
03
0.1
)50
41
25
03
0.1
)56
30
250
30.1
951
30
240
30.1
050
36
260
Ave
rage
Aver
age
Tot
al30
.1)
Tot
alA
ver
age
Aver
age
Ave
rage
120
614
0.59
0.83
1.55
012
3.05
1.44
911
2.31
1.36
51
0)2
61.
363
106.
981
2)5
1012
1‘.
339
105.
471.
326
104.
511.
337
106
26
1.34
610
4.55
1.34
81
06
22
1.33
710
5.45
1.33
710
5.37
0.32
610
5.41
1.37
015
6.05
1.35
600
6.07
6.35
810
5.03
0.39
060
9.50
12
93
002.
821.
347
105.
311.
347
105.
311.
347
106.
111.
348
106.
131.
337
104.4
)1.
35)
106.
08
Tot
alA
ver
age
511
58.0
1063
.767
104.
75

Com
bust
ion
Gas
Dat
afo
r:N
orth
ern
Pul
p
Cli
ent:
Nor
ther
nPu
lpJo
bN
umbe
r:12
1413
456
Pla
nt:
Rec
over
yB
oile
rL
ocat
ion:
Pict
ou,
NS
Tes
t:PM
-iD
ate:
10-M
ar-1
5P
erso
nnel
:TB
HI
JJB
/JA
R
Tes
tS
tart
:10
:00A
MT
est
Fin
ish:
10:3
0A
M
Tim
e0
2C
02C
O802
NO
x(m
m)
(%)
(%)
(ppm
)(p
pm)
(ppm
)
04.
915
.525
818
175
4.9
15.5
2943
919
105.
115
.413
468
2115
4.9
15.6
1281
923
204.
815
.712
638
2525
4.5
15.9
1453
732
304.
515
.915
398
29
Ave
rage
:4.
815
.617
728
24
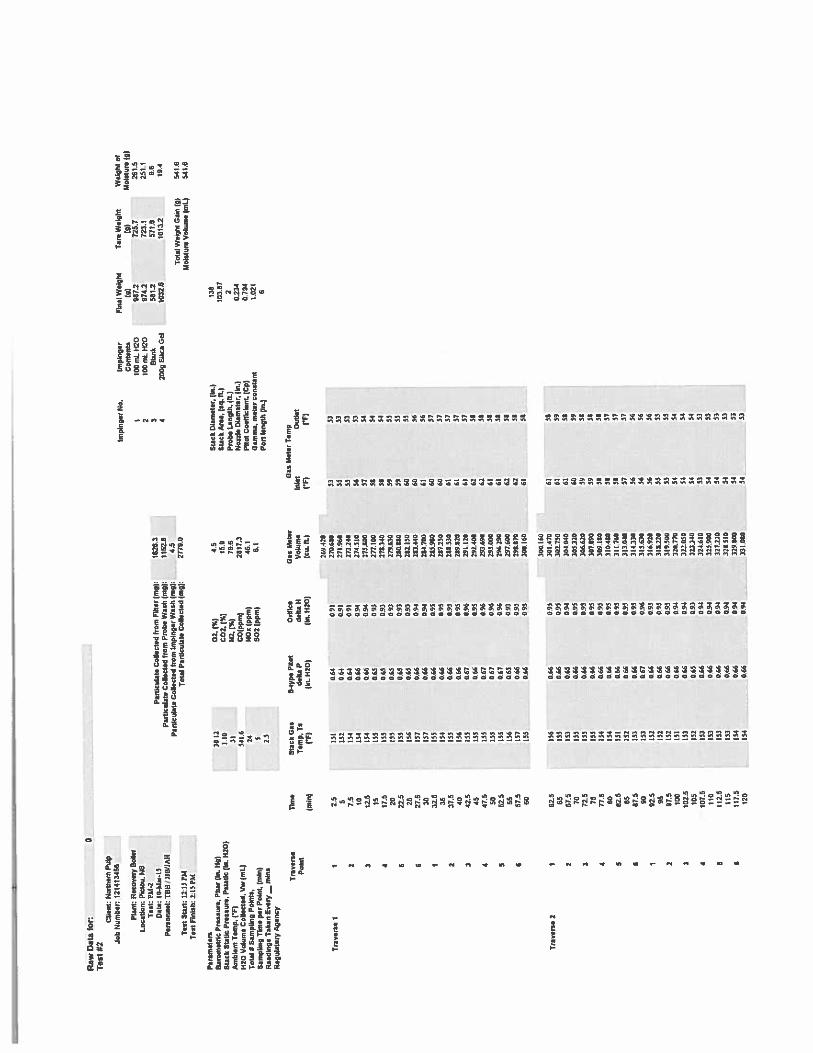
Raw
Dat
afo
r0
Test
#2
Cli
ent:
Nor
ther
nP0
4oJo
bN
umbe
r.12
1413
456
Impi
nger
No.
Impi
nger
Fina
lW
eigh
tT
are
Wei
gh?
Wei
gh?
or
Pla
nt.
Rec
over
yB
oile
rC
on
tents
tiIs)
Moi
stur
e(9
)
Loc
atio
n:P
idou
.U
SI
100
mL
H2O
987.
27
25
126
1.5
Tes
t:P
M-I
210
0re
t11
2097
4.2
723.
125
1.1
Dat
e:I0
-Mon
.15
Par
ticu
late
Co
llec
ted
from
Fil
ter
mg)
:16
20.3
3B
lank
58
12
571.
69.
6
Per
sonnel
:T
BH
JJJB
JJA
NP
arti
cula
teC
oU
ecl,
dfr
om
Pro
beW
ash
1mg)
:11
52.1
420
09S
,hca
Gel
1032
.610
13.2
19.4
Par
ticu
late
Col
lect
edfr
omIm
ping
erW
ash
(mgI
:4.
5
Tes
tS
ian:
02(5
PMT
otal
Par
ticu
late
Col
lect
ed(n
gl:
2779
.0T
old
Wei
ght
Gai
n(9
)64
9.6
Tes
tF
inis
h:215P
MM
oist
ure
Vol
ume
(mL
)54
1.6
Pann
eelI
tB
arom
etri
cP
ress
ure
.P
bar
(in.
Hal
3012
02.1
%)
4.5
Sla
ckD
iam
eter
.(i
n.)
938
Sta
ckS
tall
’P
ress
ure
,P
sual
ic(i
n.H
iD)
1.10
C02
.5%
)is
.gS
lack
Ana,
(sq.
Iti
loll
?
Mnb
ient
Tem
p.5W
)35
‘42.
j%(
70.6
Pro
beI.
engl
h.((1
52
1120
Vol
ume
Coe
ecle
d.V
w(m
L)
541.
6C
0(pp
m)
2617.3
Noah
Dia
met
er,
(In.
)0.
234
Tot
alI
San
ph
og
Poi
nts,
24N
ba
(ppi
n(48
.1P
ilot
Coe
ffic
ient
.(C
r10.
794
Sam
plin
gT
ime
per
Poin
t(m
m)
1502
(ppm
)6.
)G
amm
a.n
ele
rco
nst
ant
1.02
?
Rea
din
gs
Tak
enE
very
—m
ine
25
Por
tle
ng
thin
.)6
Reg
ula
tory
Ag
ency
Tre
vere
eT
ime
Sla
ckG
asS
4ype
P60?
OrI
fIce
Gas
litt
er
Gas
Met
erT
emp
Poi
ntT
enp.
Ta
delt
aP
delt
aH
Vol
ume
Inle
tQ
uIe
t
min
I(W
)(h
i.H
20(
(in.H
iO)
(cIL
tt)
(‘9
(FI
2693
10
Tre
ven
eI
I2.
5II
I0,
6309
127
0.61
053
53
501
200
40.
9127
1.96
035
53
27.
505
4O
.09
123
3240
1533
1003
4066
093
274.
500
5633
III
054
066
094
275.
156
5754
1505
10.
650-
932”
000
5554
417
.515
3065
0.93
278
330
5654
2055
0.63
093
279.
630
3955
22.5
(53
0.65
093
200180
5955
2505
696
50.
9326
2.15
060
55
27.5
057
0.68
094
283.
100
6056
3005
70.
660.
9426
4.70
061
56
315
115
0.66
0.95
265.
980
6937
3553
30.
6609
510
7,29
060
57
237.5
155
0.66
0.95
210.
530
6)17
4019
60.
66095
209.
120
6037
342.5
511
0.67
0%
291
120
6157
4515
50.
6609
529
3.30
062
56
447
.505
50.
670%
293.
690
6236
5015
5067
0%
295.
000
6?55
552
.509
50.
670%
2962
9060
55
5505
60.
650.
9329
7600
6250
657
.519
70.
66095
1981
7062
16
6013
50.
66091
300.
060
6536
356
160
Tra
ver
se2
I62
.511
60.
660.
9530
1.47
061
16
6501
506
%0,
95302730
6?59
267
.5(5
30,
650,
9430
4.04
060
55
7005
30,
6%0.
9530
532
060
39
372.5
(15
0,66
0,95
306.
620
1958
7505
50.
6609
130
7.59
059
58
V.5
554
0.66
095
309.
180
5856
0054
0,66
095
300,
450
3557
515
151
0,66
095
30)
760
3857
6515
20,
6609
530
3,04
057
57
67,5
193
0.66
095
304330
5656
9005
30,
670,
9630
5,63
056
96
92.5
052
0,66
0,95
306,
920
5656
9505
20,
6%09
531
8220
5555
97.5
052
0.66
0.91
319,
500
5555
100
050
0.60
004
320.
770
5454
102.
503
30.
66094
321
090
5233
105
552
0.65
093
2333
4034
54
107.
505
30.
66093
324.
600
5353
110
III
066
0.94
325.
900
5453
112.
505
30.
660.
9332
7220
5433
115
053
0.6%
0,94
320,
100
5453
117.
515
40,
660,
9432
9.eO
O54
55
120
154
0,66
091
331,
000
1413

Calc
ula
tio
ns
for.
0T
est
#2
Cli
ent
Nor
ther
nP
4i
Job
Nu
mb
er:
1214
1345
6
Pla
nt:
Rec
over
yB
oile
rL
oca
tio
n:
Pid
nu
,14
8T
est:
P04.
2D
ate:
10-M
ar-I
SP
erso
nnel
:iO
NI
JJW
JAH
Calc
ula
ted
Par
amet
ers
Sta
ckG
asP
rass
urs
,PS
(is.
Hg)
Sta
ckG
asM
ole
cula
rW
eigh
t.D
ryB
asis
,M
d)l
blI
boek)
Vol
ume
orW
ater
Vap
ou
rC
oll
ecte
d,V
ar
Ictu
il)
Sta
ckG
asM
ois
ture
Co
nte
nt
1%as
dec
imal
)S
tack
Gas
Mol
ecut
arW
eigh
t,W
etO
asis
,M
stl
Wlb
.eno
l.t
Checknnge
Wth
loce
iten
aC
hec
kav
erag
eW
ithi
nC
rite
ria
Sta
ckG
asS
itype
Pit
ot,
Ori
fice
Sta
ckG
asT
em
pT
sdelt
ar
del
taH
Vel
ocit
y,U
sIN
)(i
tcH
lOl
[.0
00
1(W
s)
Aven
9e
Aver
age
Aver
age
614
0.66
0.84
Ave
rage
47.5
8
Iso
Wn
oti
city
Checks
3020
30.7
325
.907
02
63
27.1
3
Tra
ver
seI
Tra
ver
se2
Gas
Met
erts
ok
ioet
ics
Met
erP
ress
.,A
vg.
Tem
p.
Vol
ume,
VoL
Ret
,P
m{i
o.H
g)T
m(R
IV
mcu
.11
.1V
Ine
(en.
It)
(%)
Tra
vers
eli
nt.
Poi
nt
l°1
)
I2.
501
1064
0.91
46.8
130
.19
563
12
60
1,35
610
1.83
561
2064
0.01
46.6
430
.18
5(4
0260
1,37
810
3.33
27.
581
40.
640.
0146
.92
30.1
95(4
12
80
1.37
810
3.50
0001
40.
660.
9447
,65
30.1
956
51
27
01.
369
ltl.
03
3115
814
0.66
0.94
47.6
530
.19
516
12
00
1.38
400
2.42
1561
50-
650.
9347
.32
30.0
951
61.
300
1.30
4(0
3.90
417
,561
50.
650.
9347
,32
30,1
051
612
401.
329
00.1
620
615
0.65
0.93
47.3
230
.10
517
12
90
1.38
010
2.60
527
.561
50.
650.
9347
,32
30.1
051
71
25
01.
338
60.7
625
616
0.65
0.93
47.3
630
,10
518
12
70
1.35
810
1.38
627
.56
(70.
680.
9447
.76
30,1
951
81
21
01,
378
102.
1830
617
0.66
0.94
47.7
630
.16
519
(260
1.34
499
.70
7315
615
0.66
0.95
47.6
930
.19
519
(280
1.36
610
1.12
3561
40.
660.
0547
.85
30.1
951
61,
270
1.35
51
90
25
837
,566
00.
680.
9547
.69
30.1
050
61.
280
(.30
410
1,03
4061
6066
0.95
47,1
330
.19
5(0
1260
(.37
510
1.00
942
.563
50.
670,
064
80
530
.19
519
1.39
0(.
3(6
106.
8445
6(5
0.66
0.95
47.8
930
.19
520
(2(0
1.36
219
0.83
1047
.56
(50.
670.
0648
.05
30.1
851
0(2
90
1.37
219
0.85
506)
50.
670.
9048
.05
30.1
952
01,
3)0
1.36
510
2,52
II52
.561
50.
670.
9648
.15
30.1
952
01
20
01.
374
090.
6655
6)6
0.65
0.03
47.3
630
.16
520
(.31
01.
304
10407
1287
,561
70.
660.
9547
,76
30.1
052
01
27
01,
351
1902
160
615
0.68
0.95
41.6
030
,10
520
12
90
1.37
410132
I62
.560
60.
680.
9547
.73
30,1
952
01.
310
1.36
510
3.38
6561
5066
0.95
47.6
930
.10
520
1280
1,30
210
0.83
267
.561
30.
550.
944
72
530
,19
520
1290
1.37
410
2.33
7061
00.
650.
9547
.69
30.1
652
01.
2(0
1.36
310
0.93
3115
615
0.68
0.95
47.6
930
.19
519
1.30
01.
387
102.
7075
6(5
0.68
0.95
47.6
930
.19
536
1270
1,35
519
0.33
477
.503
4066
0.05
47.6
530
.19
538
12
90
(.37
810
1,93
8068
4066
0-95
47.6
530
.19
5(8
(.30
01,
380
102,
825
815
611
0.66
0.95
47.5
330
.19
5(8
12
60
1.36
811
0.99
8561
20.
660.
9541
.57
30.1
951
71
28
01.
370
101,
17t
67.5
613
066
0.95
47.6
130
.19
516
12
90
1,38
310224
6061
30.
870%
47.9
730
.19
586
1.30
01,
304
10226
79
15
612
0.66
0.95
47.5
730
.10
536
1290
1.38
310
2.16
9561
20.
680.
6547
.57
30,1
051
51.
300
1,39
610
3.15
I07
.561
20.
680.
9547
.57
30.1
95)5
12
80
1.37
510
1.56
100
(II
0.55
0.94
47.5
330
,10
514
12
70
1,36
110
0.88
610
2.5
613
0.65
0.94
47.6
130
,16
514
12
80
1.31
8(0
1.84
105
612
0.65
0.93
4721
30,6
651
41
29
01.
388
(03.
3410
107.
561
3O
M0.
9447
,61
30(0
513
12
70
1,37
01
01
24
110
6(3
0.68
0.94
47.6
130
,19
514
12
90
1.39
0(0
2,74
II11
2,5
6(3
0,65
0.94
47.6
130
,19
514
1.32
01-
422
105,
1311
561
30.
550.
9447
.61
30.1
051
41
29
01,
390
(02.
7412
117,
56(
40.
650.
9447
.65
30.1
951
41
29
01.
390
(02.
6212
063
40.
680.
9447
.65
30,1
951
41280
1.37
910
2.02
Tot
alT
otal
Tot
alA
ver
age
110
61.8
0065
.997
101.
88A
ven
ge
30.1
9A
ven
ge
517

Co
mb
ust
ion
Gas
Dat
afo
r:N
ort
her
nP
ulp
Cli
ent:
Nor
ther
nP
ulp
Job
Num
ber
:12
1413
456
Pla
nt:
Rec
over
yB
oile
rL
oca
tio
n:
Pic
tou,
NS
Tes
t:PM
-2D
ate:
10-M
ar-1
5P
erso
nn
el:
TB
HIJ
JB/J
AH
Tes
tS
tart
:12
:00
PMT
est
Fin
ish
:12
:30
PM
Tim
e0
2C
02
CO
S02
NO
x
(mm
)(%
)(%
)(p
pm)
(pp
m)
(ppm
)
04.
515
.924
658
42
54.
515
.826
477
34
104.
416
.026
607
3615
4.4
16.0
3058
649
204.
516
.028
936
4225
4.6
15.9
2973
559
3046
15
J30
254
61
Aver
age:
4.6
15.9
2817
646

Raw
DaL
afo
rT
est
#3
Cli
ent:
Nor
ther
nP
uJo
bN
umbe
r.12
1413
456
Pla
nt:
Rec
over
yS
oeer
Loc
atio
n:P
idou
.64
5T
est:
P61-
3D
ate:
li—M
at—
IlP
enonnel
:T
BW
IIW
JMI
Tes
tS
Ian:
9:20
&M
Tes
tF
inis
h:11
:20A
M
Bar
omet
ric
Pre
ssu
re,
Pb
arin
.H
g)S
tack
Sta
tic
Pre
ssu
re.
Pst
atic
ha.
H20
)k
nb
i.n
tT
emp.
rF)
H20
Vol
ume
Co
llec
ttd
.V
wm
L)
Tot
alI
Sam
plin
gP
oint
s,S
ampl
ing
Tim
epe
rP
oint
,m
m)
Rea
ding
sT
aken
Ev
ery
_m
ine
Reg
ulat
ory
Age
ncy
Tro
vero
eP
oint
29.5
5‘-
to 2654
060
24 23 0
Tim
eS
tack
Gas
5-ly
peP
bot
Ori
fice
Tem
p.T
ade
lla
Pde
lta
H(m
iii)
Fl
in.
H2O
)(i
n.64
20)
1605
.271
4.6
3-3
2219
.9
Sla
ckD
iam
eter
,(i
n.)
Sta
ckN
ea.
(sq.
It)
Pro
beL
engt
h,(I
t)N
oze
Dia
met
er,
(in.
)P
act
Coe
ffIc
ient
.(G
pOG
amm
a,m
eter
Con
stan
tP
ort
leng
th(i
n.)
138
103.
87
0.23
40.
784
1.02
16
0
Par
ticu
late
Col
lect
edfr
omF
ilte
r(t
ug):
Par
ticu
late
Co0
ecie
dfr
omP
robe
Wat
h(1
119)
:P
arti
cula
teC
olle
cted
from
impin
ger
Wat
h(m
g):
Tot
alP
erti
cula
teC
olle
cted
(mg(
:
02,
(%(
C02
,(%
)N
2.(%
)C
0(p
pn
)N
Ot
(ppm
)5
02
(ppm
)
impi
nger
No.
Impi
nger
Fina
lW
eigh
tT
are
Wei
ght
Wei
ght
orC
onte
nts
(9)
(9)
Moi
stur
e(g
)I
100
mL
6420
995.
873
0.8
2663
2‘0
0m
LH
20
957.9
718.
323
8.6
3B
lank
562.
657
0.7
11.8
420
09Si
lica
Oni
973.
894
9.7
24,1
4.4
16.1
79.5
3083
.052
.127
.9
Gas
Met
erV
olum
e(c
u.t
t)
Tot
siW
eigh
tG
ain
(91
Moi
stur
eV
olum
e(n
iL)
540-
654
0.6
Gsa
Met
erT
emp
Inle
toutl
et(‘
F)(‘
F)
3343
70T
rav
erse
I1
2,5
890
0.56
0.79
3396
8043
455
849
0_SI
080
3368
8044
432
7,5
190
0.59
0.83
357
990
4443
1089
00-
5908
335
9250
4443
312
,513
103
8O
il34
0400
4043
1510
203
808
134
1620
4343
417
.5II
I09
808
834
2810
4644
2085
005
708
033
4000
4644
522
.585
005
80.
8234
9240
4734
2515
165
808
231
6-47
047
448
27.5
838
037
080
347
650
4744
3085
’657
010
3488
6047
441
32.5
896_
Se0.
8133
807
047
4435
850
039
0_to
351110
4645
237
.615
00-
56079
332.
300
3745
4009
80.
900.
8239
365
047
433
42
.515
9058
082
3949
3047
1545
191
038
081
336-
076
4745
44
7.6
148
059
084
3172
7048
4550
131
037
080
3584
9048
415
52
.581
9018
0-81
359690
4846
55II
I037
080
3608
6040
466
57.5
049
0-59
082
361
040
5046
6011
9037
0.91
363
170
5046
363
t70
Tro
vene
2I
62
.5‘1
00-
580-
8236
4380
3046
6595
0057
080
363.
970
3046
26
7.5
050
018
0-82
3667
6058
4770
130
6_St
0-82
367.
980
3847
372
,585
00
It081
369160
St47
7603
80-
380-
83370360
Si47
47
7.5
50057
Oat
370560
5847
6015
0039
064
372770
Si
475
92
.5IS
O099
064
374000
3147
8515
0051
082
3752
10II
478
07
.5‘S
t0.
380.
82376390
5148
8030
097
0-88
377.
820
SIIt
19
2.5
tO036
082
378
t20
5138
8513
00-
380-
8238
0020
32It
297
.505
0059
084
380230
3248
100
049
039
0.84
382440
5349
330
2.5
819
0-19
084
383670
3349
305
140
0.60
086
364900
5349
410
7.6
140
0.60
0.86
356
140
5349
110
149
060
006
367280
3430
511
2.5
848
066
0.16
305
630
5450
115
119
099
083
369860
3450
611
7.5
150
060
086
391080
54Ii
120
849
060
0-86
392-
300
3452
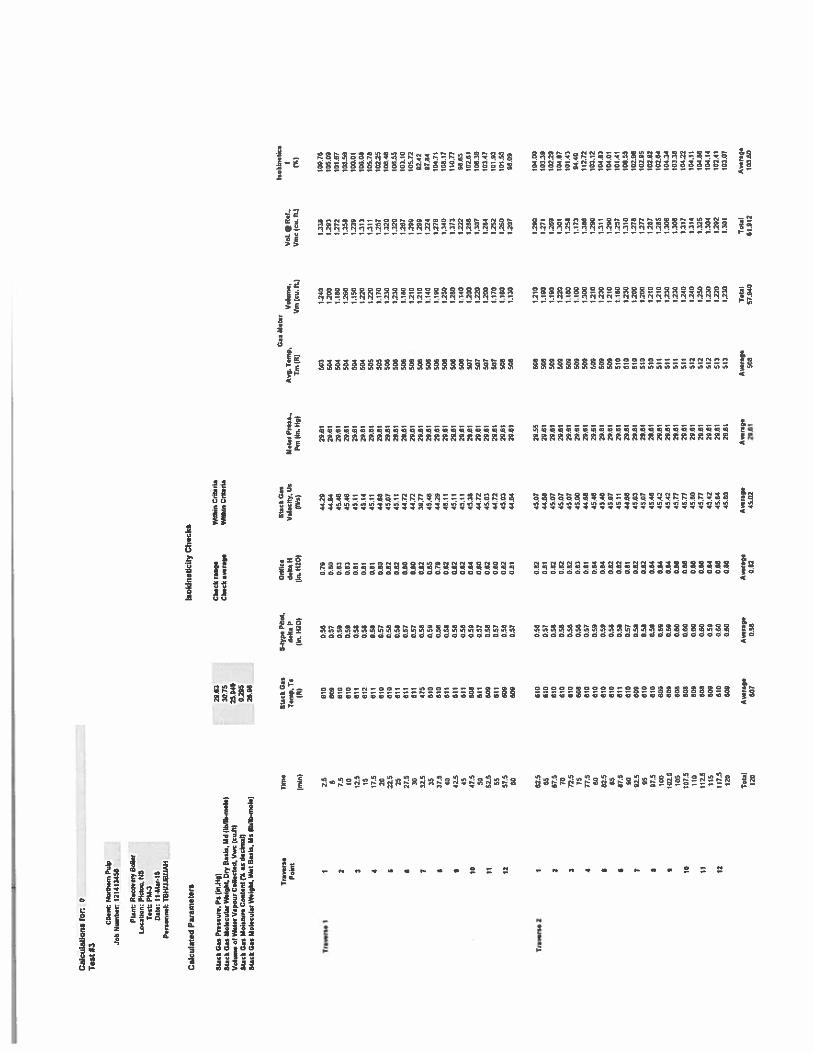
Cal
cula
tion
sfo
r.T
ool
#3
Cli
ent
Nor
ther
nP
ulp
Job
Num
ber
.12
1413
456
Pla
nt:
Rec
over
yB
oSe,
Loc
alio
n:P
iGou
.N
OT
est
PM
-ID
ate:
Il-M
ar-I
SP
erso
nn
el:
ThW
JJB
IJA
JI
Cal
cula
ted
Par
amet
ers
Isok
ineU
city
Che
cks
Sta
ckG
asP
ress
ure
.P
sin
.N9)
Sta
ckG
asM
ole
cula
rwei
gh
t,D
ryB
asis
.M
dIl
bn
b.l
lole
IV
olum
eer
Wal
erV
apour
Coll
ecte
d,
Vet
’co
ol)
Sta
ckG
asM
eisl
ure
Conte
nt
9%as
dec
imal
)
Sla
ckG
asM
olec
ular
Wei
9hL
Wet
Bas
is.
Ms
lIM
b-n
ote
)
Chec
kra
nge
‘Mlh
inC
rite
ria
Chec
kav
erag
eW
Ithi
nC
iNar
ia
2.5 S 7.5 It las
IS 17.5
20 33.5
25 27.5
30 32.5
35 37.5
40 425
45 47,5
50 52.5
55 57.5
80 62.5 65 67.5
70 “.5 75 77.5
60 025
65 07.5
90 915
95 97.5
100
102.
5lo
s10
7,5
ISO
112.
5I’
S11
7.5
120
Sla
ckG
asS
4y
p.
Pil
ot.
OnI
lce
Sla
ckG
as
Tem
pT
sde
lta
Pdel
taH
Vel
ocit
y.U
s
(RI
tin.
HID
)(l
it.H
20)
(025
)
610
058
0.79
44
29
29.6
1
609
0.17
0.80
44
84
29.6
1
650
0.59
0.93
45.4
629
.61
610
0.59
0.93
45.4
629
.65
611
0.58
0,85
45.1
129
,85
612
0.58
0.91
45.1
429
.61
811
0.59
0.0)
45.1
129
.6)
650
0.57
0.90
44.6
829
.6)
650
0.58
0.82
45.0
729
.8)
611
0.58
08
245
.11
2961
611
0.57
08
04432
29.6
1
611
057
0_at
44.7
229
.61
475
0.58
08
239
.77
29.6
1
8)0
0.59
0.85
45.4
629
.61
610
0.55
0.79
44
29
2961
61)
0.58
0.62
45.1
129
.61
611
0.58
0.82
45.1
129
.61
611
0.58
0.82
45.1
12961
609
0.59
0.94
45.3
829
.61
SII
0.57
0.80
44.7
229
.6)
609
0.58
0.82
45.0
339
.6)
611
0.57
0.80
44
32
28.8
)
609
0.58
0.82
45.0
329
.8)
609
0.57
0.6)
44.6
429
.6)
6)0
0.58
08
26
)00.
57081
8)0
058
0.82
6)0
0.58
0.82
600
0.58
0.62
608
0.58
0.93
810
0.57
081
810
0.5
)0.
8461
00.
590.
8481
00.
580.
8261
10.
580.
6281
00.
570.
9560
90.
580.
9261
00.
590.
8265
00.
590.
8460
90.
59084
609
0.59
0.84
608
0.80
0.86
808
0.60
0.86
609
0.60
0.88
800
0.60
0.86
600
0.59
0.84
610
0.60
0.66
609
0.60
0.88
45.0
729
.55
44.0
829
.61
45.0
729
.61
45.0
729
.61
45
07
29.6
14
50
029
.61
44.6
829
.61
45.4
829
.65
45.4
629
.65
45.0
729
.61
4511
29.6
)44
.58
29.6
)45
.03
29.6
)45
.07
29.8
)45
-46
29.8
)45
.42
29.6
)45
.42
29.6
14
53
229
.61
45.7
729
.61
45.8
029
.61
45.7
729
.6’
45.4
229
.61
45.8
429
.61
45.6
029
.6)
Met
erP
ress
.A
vg.T
emp
,V
olum
e,V
OL
@R
eL,
Pm
(lit
Hg)
Tri
m)
Vm
)cu
.tt)
Vn
c(cu
.Ot)
509
506
509
509
509
509
509
509
509
509
550
590
5)0
5)0
5)0
511
511
SI)
SI)
512
512
512
503
5)3
1.33
910
9.76
1293
105.
091
272
101.
671.
358
108.
561
23
910
0.01
1.31
31000
81.
311
105.
781
25
710
22
55.
320
100.
461.
320
588.
551.
257
103.
105.
299
505.
725
29
092
42
1224
87.9
41
27
610
4.71
1.34
010
8.17
5.37
31)0
.77
13
22
99.6
512
86
102.
8)1.
307
100.
3912
84
103.
4712
52
101.
9312
00
101.
5552
07
98.0
9
29.8
330
.75
25.9
490
29
525
.98
rose
Ti.
vene
I
Tease
r..
2
Gas
Met
erIs
oh
inel
ics
rhoT
ease
r..
Poi
nt 4 IC II 12 I 3 4 5 5 7 8 I 10 II 12
503
504
504
504
504
504
505
505
500
500
500
500
500
500
500
500
500
508
507
507
507
507
506
509
1.24
01
200
1.18
05
260
1.15
05.
330
1220
1.17
01
230
1230
1.15
01.
2)0
121
01.
140
1.19
0125
0526
0514
0120
01220
126
0117
01.
180
1.13
0
1210
1290
504.
001.
190
1271
103,
391.
100
12
59
10
229
13
20
1.30
110
4.87
1.18
01
259
101A
31.
100
1.17
394
.40
‘.30
01.
386
112.
1112
10
129
010
3.12
52
30
1.31
110
4.83
12
10
12
90
104.
0)1.
180
12
57
101.
4)12
30
1.31
010
0.55
1.21
05
278
102.
8812
00
52
77
102.
951
210
12
87
502.
921
210
12
95
502.
541
230
1.30
690
4.34
12
30
1.30
510
3.38
12
40
1.3)
71
042
25
240
1.3)
410
4.11
12
50
1.32
510
4.88
12
30
130
410
4.14
13
20
129
210
2.41
1230
1.30
110
30
7
Tot
alT
olal
Aven
ge
61.9
1210
3.00
Tot
alA
ven
ge
Aven
ge
Aven
ge
Aver
age
120
607
0.58
0.82
45
02
Ase
rag
e29
.6)
Ave
rage
508
57.9
40
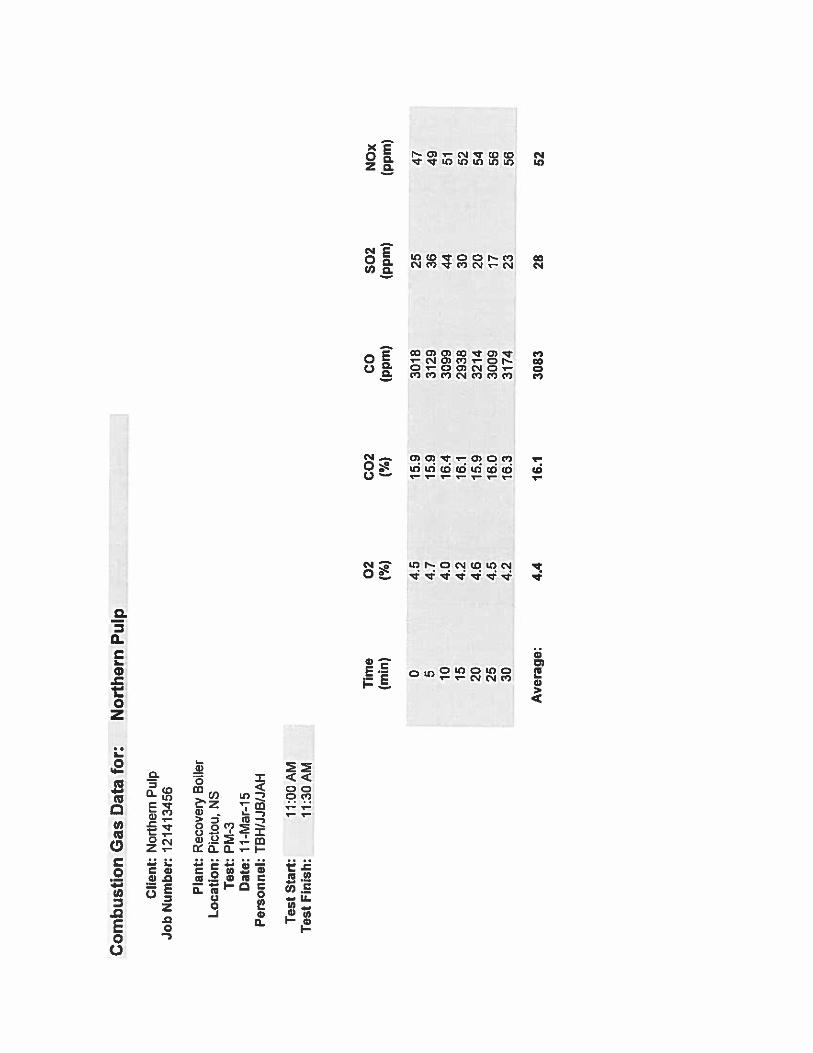
Com
bust
ion
Gas
Dat
afo
r:N
orth
ern
Pul
p
Cli
ent:
Nor
ther
nP
ulp
Job
Nu
mb
er:
1214
1345
6
Pla
nt:
Rec
over
yB
oile
rL
oca
tion:
Pic
tou,
NS
Tes
t:PM
-3D
ate:
11-M
ar-1
5P
erso
nn
el:
TB
H!J
JB/J
AH
Test
Sta
rt:
11:0
0AM
Tes
tF
inis
h:
11:3
0AM
Tim
e0
2C
02
CO
S02
NO
x(m
m)
(%)
(%)
(ppm
)(p
pm)
(pp
m)
04.
515
.930
1825
475
4.7
15.9
3129
3649
104.
016
.430
9944
5115
4.2
16.1
2938
3052
204.
615
.932
1420
5425
4.5
16.0
3009
1756
304.
216
.331
7423
56
Av
erag
e:4.
416
.130
8328
52
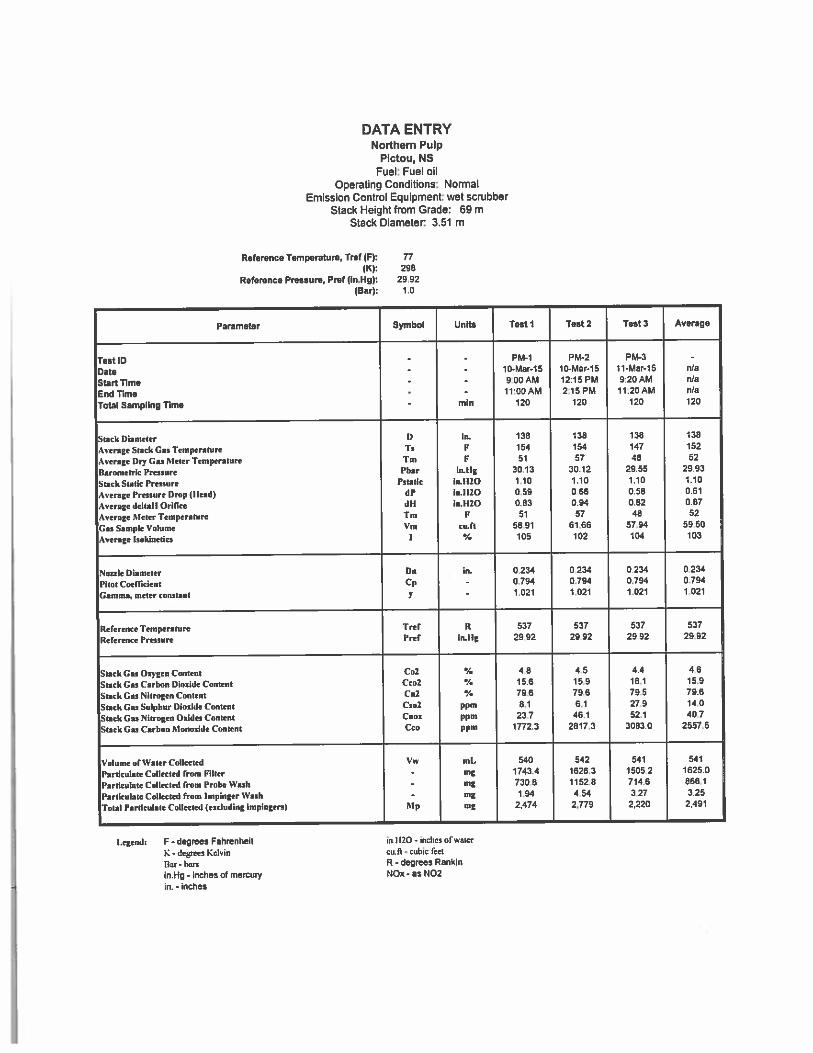
DATA ENTRYNorthern Pulp
Plctou, NSFuel: Fuel oil
Cperating Conditions: NormalEmission Control Equipment: wet scrubber
Stack Height from Grade: 69 mStack Diameter: 3.51 m
Reference Temperature, Trot (F): 77(K): 298
Reference Pressure, Prof (in.Hg): 2992(Oar): 1.0
Parameter Symbol Units Test I Test 2 Test 3 Average
Test ID - - PM-i PM-2 PM-3 -
Date - - 10-Mar-15 10-Mar-15 il-Mar-IS nla
Staftilme - - 900AM 12:15 PM 9;20AM n/a
End Time - - 11:00 AM 2:15 PM 11:20 AM n/a
Total Sampling Time - mm 120 120 t20 120
Stack Diameter D in. 138 138 138 138
Average Sack Gas Temperature Ta F 154 154 147 152
Average Pt3’ C,as Meter Temperature Tm F 51 57 48 52
narometric Preature Pbar mug 30.13 30.12 29.55 29.93
Slack Static Preasure Potatic inliZO 1.10 1.10 1.10 1.10
Average Pressure Drop (Head) dP in.1120 0.59 0.66 0.58 0.61
Average deltall Orifice dli mIll0 0.83 0.94 0.62 0,87
Average Meter Temperature Tm F 51 57 48 52
Ge, Sample Volume Vm cu.ft SB 91 61.66 57.94 59.50
Average lsa&inetice I 105 102 104 103
Noale Diameter Da in- 0 234 0 234 0.234 0.234
Pilot Coeflident Cp - 0.794 0.794 0,794 0.794
Gamma meter constant y - 1.021 1.021 1.021 1.021
Rererence Temperature Tref Ii 537 537 537 537
Reference Pressure Pref mUg 29,92 29.92 29.92 29.92
Stack Gas Oxygen Content Cal 48 4 5 44 4,6
StackGas Carbon DioxideContent Cco2 V. 15.6 15.9 16,1 15.9
SeackGasNitrngenContent Cal 79.6 79.6 79.5 79.6
Stack Gas Sulphur Dioxide Content fbi ppm 8.1 6.1 27.9 14.0
Stack Ga, Nitrogen Oxide, Content Coos ppm 23.7 46.1 52.1 40.7
Slack Gas Carbon Monoxide Content Cco ppm 1772.3 2817.3 3083.0 2557.5
Volume ofWaler Collected Vw mL 540 542 541 541
Particulate Collected from Filter - mg 1743.4 1626.3 1505.2 1625,0
Particulate Collected from Prttbe Watts - mg 730.8 1152.8 714.6 866.1
Particulate Collected rrom Impinger Wash - mg 1.94 4,54 3.27 3,25
Total Particulate Collected (excluding impiogen) %lp mg 2.474 2,779 2,220 2,491
legend: F - degrees Fahrenheit in.1120 - indict nfwatcr
K - dcgrces Kclvin caft - cubic rcccBar- ban R - degrees Rankinin.Hg - inches of mercury NOx - as N02
in. - inches

CALCULATIONSNortism Put1,
Pktou, NSFuel: Fuel oil
Operating Conditions: NonnalEmission Control Equipment: wet scrubber
Stack Height from Grade: 69 mStack Diameter: 3.51 m
Vadablo Symbol Units Calculation Test I Tail 2 Teat 3 Averag.
tick Area Ac q.fl A,— hi ilOrI2rlVl 19387 10387 10367 10357M5 AI{Içst—A, io4flbt.ii 965 965 9.65 965
Birometric Penis,. floe 6Cc PbnlLP.tspb.rlmlI.luJ./Rt 1023 1920 103.1 1014Stack Static Pr.n.rc P,t.ilt LP. Pei.o6 bElt— htMl. blew.. I 31’ 027 027 027 027Ag. Stoek Temperature Ti Ti/mi—Tow). 064 814 614 607 612A.g. Meter Trmperoture Ti, II Ti, let_ Ta Fl, 060 511 517 508 511Nonle Diameter on as flu li,st Ian lb.) I 30.4 6 6 8 59
Con Meter Preuture Pm leit ho — Plot + dill ni 30.19 30.19 29.61 39.00Sample Volume ut RelCond Vine .160 Vine Trer/Pnea lOst Pm cyilT.. 63.79 6603 6192 639
rum Vnuicwmt16tltJ3eV.mleoSli 1.61 187 175 181Volume .1 Wiler Vapour Vine itO Vine — beset a Vu 25 92 26 90 25.95 25 96‘Vatir Fraction Boo . Sea—Vine/i VsctVse I 0 289 0 263 0.295 0.3
MakcoltrWdflt,Dr, Md fl-id Md-eolic,o21.33iru21+lzIicezi 3009 30.73 3075 307Iukoulor Weiibt. Wet 11’ t-.d ‘0. 11411. 0oi,° lit mu 2703 27 13 2898 270
Stick Censure N 16115 Pu— fl.rlPuauelI1ti 3021 3330 2963 30.01lack Cat VcIudt, Li WI Li — ILl’ . Cp I /4 P07,06?, M.lr41 45 90 47 58 45.02 45 9
ale U.ls,/,l—t)Oliut, WI) 1374 14S0 13.72 140Aciu,l Stock Cu, Fbi, Rile 13 IOta QbOiVnA’ 280,972 296,542 280.554 286.023Dry Slick G.e Flow Rite 131 tern Qi —13 011.00tH Tnt/Tel z Pt/Cnn 176,516 107,783 173.197 179.185
Ron, Qe lien,t_600473 tQu)Roflu) 63.32 8083 81.75 048
Sulphur Dioeide.502502 Meattored Coucrntrtt.’oa Coot ppm Moomuemeet trim Rho., Au.Iyner 8.14 614 27.88 1405Uncorrected ia Ref Cued Ciot se/Rein Clot lme/Rent Ccii tjipniu 242 21 33 1609 7299 2600502 Emliston Rite FReul Wi FR,ii ceozions I Qu 178 1.43 5.97 306
LIIr Fieollbflri—JCteR.uliWnl 840 5.34 2140 1100
502 CunceminfltoCorrected 10ll% 02 Cmi na/Ru. ClIlt¼OIi—Ctalimflu.ttlmn-Ilt/blte.Ct31 1312 9.72 4375 2220Cureected o3% 02 Ciol nw/Rem C.o2lJ%o3o—Cn2lne/nemt.liuntlo5.bcu3) 2372 1757 79.11 4013Curtated is 12% C02 Cmi nt/Ru. ClllO2VuColItCm2inflC.ltlIiuCutll 1637 12.14 5450 2767
Nitroern Otides - NO,NO. SI toured Cuncenir,te’eo riot ppm Me.onn.e.i Ira ha. 9m Anuipee 23,71 46.14 52.14 4087Uacurncled /8 Ref Cund Cm, me/Rim Cm0 me/Rest’ C.eu (pps}. tOni 44.63 8664 98.13 7653NO. minion Rile Limo i/i FRmu 5 riot/tIle uQe 3,72 7 70 6.02 6 48
kflr tRamu Ibsltri “16’ Cite, lgl 13.39 2771 20.88 2333
NO, Cuneimi rulionCorrected to ‘0% 02 Conu se/Or, Clout 00% 030 Cou. ne/Runt: (2,9-Ill lQt9.Col) 27.44 5242 5083 48.23Corrected 1,3% 02 Cue, ne/Rei, Cite, (2T’uO3i Ciii me/Runt u l28.9-Jl /11,9-Cdt 49.62 9478 106.37 8359Corrected to 12% C02 (mu st/nts Cm, 112% COil — Cmt line/Real, 112/null 34.24 6540 73.27 8768
C.tho. %Innonote- COCO Me.inrrd Conceourstins Cm pta Mm,s.seuI Fins hi, C.u Aautfler 1772.29 281729 3983 CO 2557.52L/neurreeird /8 RefCond Cm me/Ron Ceo 061/Rush Ceo pp.o e 1.141 2029.27 322579 353004 292836CO Liuinioo Rote em.. V. Fmn—Ceal000.Q. 10907 285.91 28856 24705
hi/Re iai.l4iriuJt I LRe.lri 60885 102929 193828 89227
CO CotteemiritiunCorrected 1001% 02 Ceo se/Rein CmlII% 03l Coo si/Rent, 1260-1 Ii) neC-Cult 1247.81 1947.28 2118.19 177043Corrected 03% 02 Ceo si/Rein Ce,{3% Oil • rellme/RomI u 369.3l/l3e9-Cu21 2256.14 352083 3028.24 320107Corrected 1002% C02 Ceo se/Rein Ceutli%COltCCulmu/nemltit3JCeeii 1556.70 243237 2635.76 2208.28
Pafliculote Concen Irallo, Ci se/Rem Ce— lop lOst 1369.58 148091 1265.99 1374 15Panheulote Emi,,ion Rite ERP e/e FOps Ci/1 u Q. 114.11 13179 193.49 11648
be/hr Fop lloirI 3.4 u (Op li/it 410.78 47444 372.58 439.27
Ponicolots Contrml riliunConnled lnbI% 02 Ci miles Ci mlI%000C, C i269-IliiiflO-C.2l 64215 89758 75894 83289Corettlent 1n3%02 C, mt/Rem ClU%OflsC.ent9-3,/12t0-Coi 152228 6z29O 137222 ‘50593Corrected is 02% COl C. si/Re. Ci i13%C03HCI tiI3/ndl 105082 1121 19 94527 Q39 03
Uied, ,cn-tqu.eCnt ot/R.rc’nonfrnmlfl IS.’ ‘9uaenp,erryrn04.rtucnnt.tIm .OIhI nm/rue 3- cube lint 1/i- WI—nm ..r ondP.0152 com.cuOnmmm NOo.nN03
Ret Cuni . ,.l’mnee em purl/ire ma presouu. /25 c •04 101 3 IP.l ‘tin. .ct,.i rube reel pit moultppm- pod. m mi//cnn Remu . /ry chit/ti cube metre, p.icotyot
Rclm . dry elihi000 cube bolt p.1mm/rote
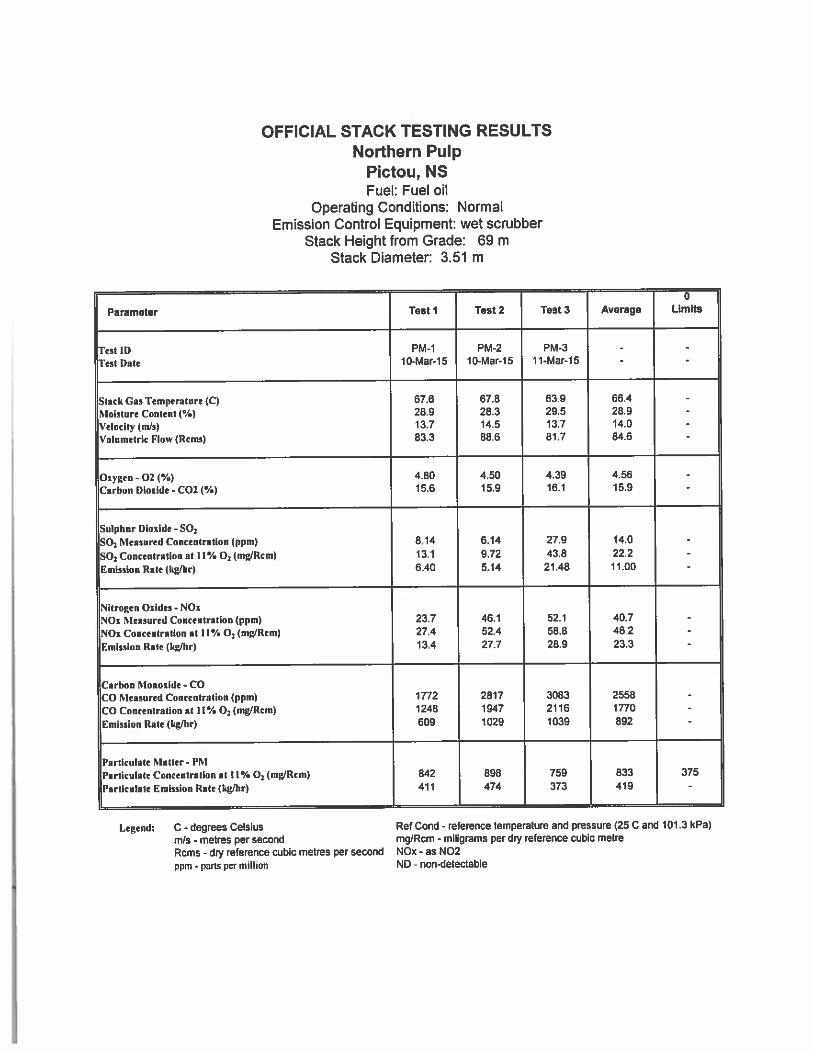
OFFICIAL STACK TESTING RESULTSNorthern Pulp
Pictou, NSFuel: Fuel oil
Operating Conditions: NormalEmission Control Equipment: wet scrubber
Stack Height from Grade: 69 mStack Diameter: 3.51 m
0
Parameter Test I Test 2 Test 3 Average Limits
Test ID PM-i PM-2 PM-3 - -
festDate 10-Mar-15 10-Mar-15 11-Mar-15 - -
Slack Gas Temperature (C) 67.6 67.8 63.9 66.4 -
Moisture Content (%) 28.9 28.3 29,5 28.9 -
Velocity (ni/a) 13.7 14.5 13.7 14.0 -
Volumetric Flow (Rcms) 83.3 88.6 81.7 84.6 -
Oxygen -02 (%) 4.80 4.50 4.39 4.56 -
Carbon Dioxide- C02 (%) 15.6 15.9 16.1 15.9 -
Sulphur Dioxide - SO3SO2 Measured Concentration (ppm) 8.14 6.14 27.9 14.0 -
SO2 Concentration at 11% 02 (mg/Rcm) 13.1 9.72 43.8 22.2 -
Emission Rate (kg/hr) 6.40 5.14 21.48 11.00 -
Nitrogen Oxides - NOxNOx Measured Concentration (ppm) 23.7 46.1 52.1 40.7 -
NOx Concentration at 11% 0, (mgiRcm) 27.4 52.4 58.8 46.2 -
Emission kale (kgihr) 13.4 27.7 28.9 23.3 -
Carbon Mnnoxide - COCO Measured Concentration (ppm) 1772 2817 3083 2558 -
COComcentratioo.t1l%0,(mWkcm) 1248 1947 2116 1770 -
Emission Rate (kg/hr) 609 1029 1039 892 -
Particulate Matter — PMParticulate Concentration at 11% 02 (mwRcm) 842 898 759 833 375
Particulate Emission Rate (kg/br) 411 474 373 419 -
Legend: c - degrees celsiusmis - metres per secondRcms - dry reference cubic metres per secondppm - parts per million
Ref Cord - reference temperature and pressure (25 c and 101.3 kPa)mgiRcm - miligrams per dry reference cubic metreNOx - as N02ND - non-detectable

i961 S
____
=
HIt
1i
I
9S
inin -.
IIIHE
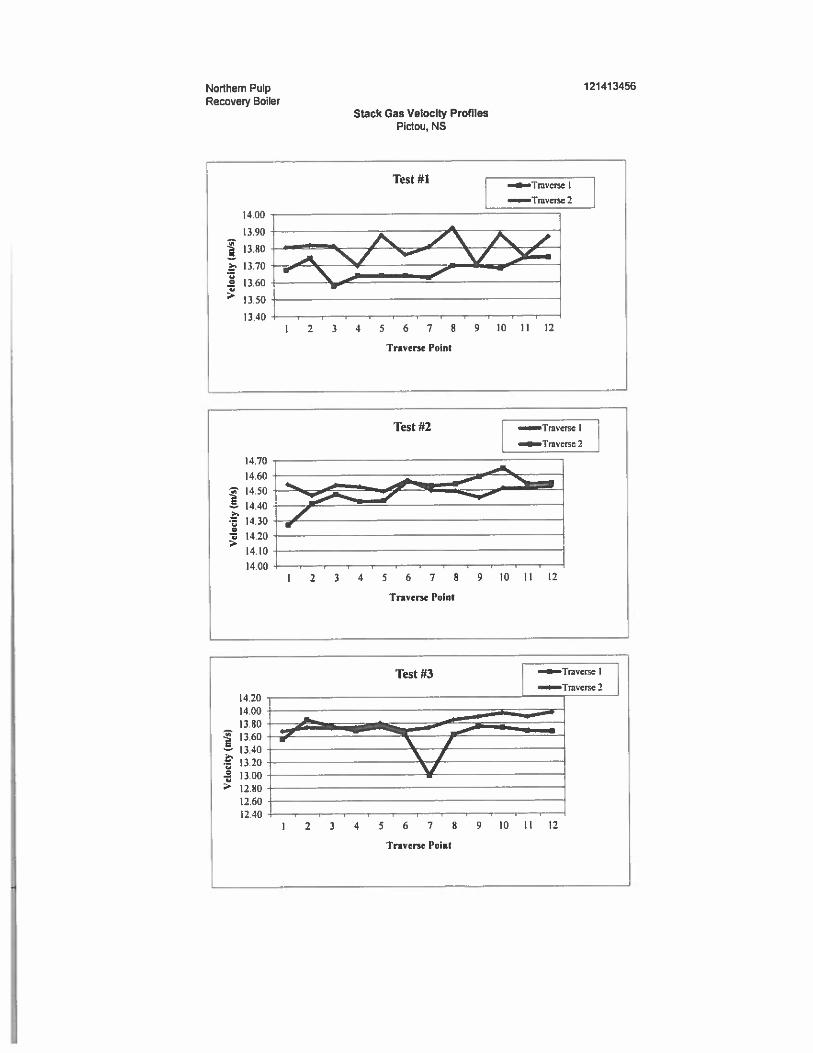
toa2aoz
mc
>t
CDS0mCo
ii
I UUIC
l
—C
lU
U
UU
>>I
0
Co
U,
C”
a)
=0
to
ow
zE
t
0
00%
N
CCa4?IC-
‘CU,
0
N
-t
CCa-C?1-
C-
C’
‘0
CI
NCaI?I
‘0
C”
o0
00
00
0
C”
C”
flC
”C
”C
”
(cpu)£,p
oIa1
j
CI
-t
oo
00
00
00
N‘0
U•3
—C
IC
(c/rn)(j!3oIa1
0000000000
-ttn
C”C
”C
”fl
Cl
CI
Cl
(c/lu
)A
,iaoIa