Fluorescence resonance energy transfer using lanthanide-ion doped oxide nanoparticles as donors
28
Fluorescence Resonance Energy Transfer using Color Variants of GFP Dale W. Hailey, Trisha N. Davis and Eric G. D. Muller* Department of Biochemistry, University of Washington Seattle, Washington 98195 *Corresponding author: Department of Biochemistry University of Washington Box 357350 Seattle, Washington 98195 FAX: 206-685-1792 Email: [email protected] Running title: FRET in Yeast
-
Upload
polytechnique -
Category
Documents
-
view
0 -
download
0
Transcript of Fluorescence resonance energy transfer using lanthanide-ion doped oxide nanoparticles as donors
Fluorescence Resonance Energy Transfer using Color Variants of GFP
Dale W. Hailey, Trisha N. Davis and Eric G. D. Muller*
Department of Biochemistry, University of Washington
Seattle, Washington 98195
*Corresponding author:
Department of Biochemistry
University of Washington
Box 357350
Seattle, Washington 98195
FAX: 206-685-1792
Email: [email protected]
Running title: FRET in Yeast

2
Introduction
The recent discovery that the human genome encodes only 5 times the number of genes
found in the yeast genome suggests that the fundamental cellular biology of a human cell is not
that much more complex than the cell biology of a yeast cell. As a step towards a greater
understanding of yeast cell biology, the Yeast Resource Center (YRC) at the University of
Washington (http://depts.washington.edu/~yeastrc/) integrates four technologies to study the
components, the function, the structure and the dynamic modifications of protein complexes in
yeast. Those technologies are mass spectrometry, two-hybrid analyses, optical sectioning
microscopy, and protein structure prediction. The goal is to identify not only the constituents of
protein complexes, but also to determine how protein complexes interact to form networks of
interconnected pathways.
Protein localization in live cells
The function of a protein is intimately associated with its location in the cell.
Fluorescence microscopy of live cells expressing proteins fused to the green fluorescent protein
(GFP) allows the visualization of proteins and protein complexes in their natural context (1). In
yeast the replacement of a protein with a GFP-protein fusion is easy to accomplish (2, 3). If the
target protein is essential for viability, the function of the GFP-protein fusion can be tested for its
ability to support growth. We have tagged 17 essential genes and found that only one fusion
protein could not support growth and two conferred slow growth. In addition, driving gene
expression from the native promoter insures that the GFP-protein fusion does not flood the cell
with more protein than the cell can properly assimilate. Given these simple precautions the

3
localization of the GFP fusion will likely reflect the natural distribution of the protein in the cell
and yield important information on protein function.
In principle several proteins could be tagged and resolved simultaneously using the
different color variants of GFP and dsRed (1, 4). However we have found that proteins tagged
with either dsRed or the blue fluorescent protein yield weak or undetectable fluorescent signals
in yeast (unpublished results, see also (5) ). Thus in practice only the two color variants cyan
fluorescent protein (CFP) and yellow fluorescent protein (YFP) (1) are available for
simultaneous expression and co-localization studies in yeast. A full description of the plasmids
and methods for generating CFP and YFP fusions is described below. The reader is referred to
several recent papers which provide excellent overviews on fluorescent microscopy in yeast
using GFP (6, 7, 8).
Fluorescence microscopy with modern hardware and software achieves spatial resolution
close to the theoretical limits of optical resolution, 200 – 300 nm. Thus proteins within this
distance of each other will co-localize. For example the yeast spindle pole body, a structure that
is embedded in the nuclear envelope and nucleates microtubules, is about 200 nm across (9). The
fluorescence intensity from any two proteins of the spindle pole body tagged with CFP and YFP
coincide; the distance between them cannot be measured directly.
Localization to defined subcellular structures at a resolution of 200-300 nm is often
sufficient to assign a broad function to many proteins. For example mapping proteins to the
spindle pole body implies a shared role in microtubule organization, whereas a bud tip
localization implies a role in polarized growth. However some localizations, such as the
cytoplasm, are not very informative. In addition, to probe deeper into the mechanism of action of
4
a protein complex requires a deeper understanding of molecular structure that only comes at
higher spatial resolution.
Fluorescence resonance energy transfer
Fluorescence resonance energy transfer, or FRET, is the exchange of energy between
two fluorescent molecules, one acting as a donor and the other acting as an acceptor. FRET
occurs only if the acceptor is within a radial distance of 10 nm (100 Å) from the donor.
According to theory proposed by Förster and verified experimentally in model systems
(reviewed in (10)) the efficiency of energy transfer depends on the inverse sixth power of the
distance between the donor and acceptor. Thus the detection of FRET is a very sensitive measure
of the proximity of two fluorophores. When applied to fluorescence microscopy, a FRET signal
narrows the predicted distance between two fluorophores from within 200 nm to as little as 10
nm. In effect FRET increases the spatial resolution of fluorescence microscopy by 20-fold.
FRET transfer efficiency depends on several factors in addition to distance. An
orientation factor, K2, expresses the dependence on the angular relationship between the donor
and acceptor transition moments. K2 can have a value from 0 to 4, and could in theory have a
large impact on FRET efficiency. However in biological systems K2 is usually considered to be
2/3 because of the rotational freedom of the fluorophores (1, 10, 11).
Besides these geometric variables FRET efficiency also depends on several spectroscopic
variables. These include the spectral overlap of the emission spectrum of the donor with the
excitation spectrum of the acceptor, the rate constant for fluorescence emission of the donor, the
quantum yield of fluorescence of the donor in the absence of acceptor, and to a minor extent the
refractive index of the medium.
5
For the CFP donor/YFP acceptor FRET pair, the distance at which the energy transfer
efficiency is 50% was calculated to be 50 Å (11). This value assumes a K2 of 2/3. It should be
noted that the shortest possible distance between the CFP and YFP fluorophores is 30 Å since the
fluorophores are buried 15 Å beneath the surface of the proteins. Thus the efficiency of transfer
can never be 100%. To enable FRET to occur at efficiencies greater than 25%, proteins tagged
with CFP and YFP must not only be in contact, but the protein-protein interaction must bring
CFP and YFP together to within 30 Å of each other, again assuming a K2 of 2/3.
Practical Approach to FRET Microscopy in Yeast
This paper is meant as a step by step introduction to the use of FRET to identify and
localize interacting proteins in yeast using CFP and YFP protein fusions. Several recent reviews
on FRET microscopy using GFP variants are excellent sources for further information (11, 12,
13, 14).
Equipment
High performance microscopes are required for detecting FRET in yeast. The small size
of yeast and the faint signals from the fluorescent proteins place exacting demands on the optics
and image acquisition. We use a Zeiss Axiovert S-100 TV incorporated into the DeltaVision®
Restoration Microscopy System. Our primary objective is the 100X oil immersion Plan-
Apochromat® with a numerical aperture of 1.4. To check adjustments, calibrations and
sensitivity on our microscope we employ the InSpeck™ Green and FocalCheck™ fluorescent
microbeads from Molecular Probes as external standards.
Images are acquired on a cooled charge-coupled device camera (Roper Scientific,
Photometrics Quantix camera with a Kodak 1401 chip). Again the dim signals argue for a cooled
CCD camera with low electronic noise, high quantum efficiency in the green region of the

6
spectrum, and fast readout speeds. The binning features in a camera are also important. Binning
combines charges from adjacent pixels in a CCD during readout. We routinely increase the
signal to noise ratio by 2x2 binning, which also permits shorter exposure times and reduces
fluorophore bleaching.
Our optical filter sets are from Omega Optical. For CFP, we use 440AF21 for excitation
and 480AF30 for emission. For YFP we use 500AF25 for excitation and 545AF35 for emission.
To observe FRET, the sample is excited with the 440AF21 excitation filter and emission is
examined with the 545 AF35 emission filter. We use a dual pass dichroic mirror, 465-
543DBDR, which decreases the shoulder of the CFP emission into the YFP channel in FRET
experiments. The dual pass dichroic mirror is required if YFP fluorescence is measured during
the FRET experiment as suggested below. The optical filters are placed in filter wheels and
rotated into position through the software that operates the microscope.
Several software packages are available for image analysis and manipulation. We use softWoRx
from Applied Precision, but MetaMorph (Universal Imaging Corp.), ISee (Inovision Corp.) and NIH
Image are also commonly used for image processing.
Technological advances steadily improve the capabilities of fluorescence microscopy. Therefore
this description of equipment is meant only as a guide and not as a shopping list. In particular,
improvements in the sensitivity and speed of cameras and the spectral properties of optical filters often
call for upgrades of equipment.
The FRET Ratio
Several methods to quantify FRET have been published ( reviewed in (14)). We have
found that methods that rely on extensive mathematical corrections (15, 16) can compound
experimental error in ways that are difficult to rigorously control and derive. Numbers of nearly
7
equal value are subtracted and divided, making the methods very sensitive to small errors in the
correction factors.
We prefer a more conventional and straightforward measure of FRET, a FRET ratio, as
an index to the extent of energy transfer (14). The FRET ratio is simply the ratio of the emission
from the acceptor fluorophore divided by the emission from the donor fluorophore while the
sample is excited at the excitation wavelengths of the donor. For the CFP and YFP pair the
FRET ratio is obtained by dividing the fluorescence intensities at 545 nm (YFP emission) by the
fluorescence intensities at 480 nm (CFP emission) while the sample is excited at 440 nm (CFP
excitation) using the excitation and emission filters described above. We will refer to the 545 nm
emission upon 440 excitation as the FRET channel.
The FRET ratio takes advantage of two effects of FRET – increased acceptor emission
and decreased donor emission. First the fluorescence emission from YFP will increase as YFP is
excited by the transfer of excitation energy from CFP. Therefore FRET between CFP and YFP
will increase the emission intensity detected at 545 nm. A FRET interaction also diminishes the
signal from CFP. Without a FRET partner, an excited CFP molecule returns to its ground state
emitting photons with wavelengths which peak around 480 nm. With a FRET partner, the
excited CFP molecule transfers a fraction of that energy to the YFP acceptor, how much
depending on the efficiency of transfer. Thus emission at 480 nm decreases. These two effects
cause the numerator of the FRET ratio to increase and the denominator to decrease, driving the
ratio up.
As described below, the FRET ratio is influenced by several factors in addition to energy
transfer. Some CFP emission tails into the FRET channel. YFP is excited directly, although
inefficiently, at the excitation wavelengths of CFP. Finally changes in the relative amounts of
8
CFP and YFP will alter the ratio. Confidence in the FRET ratio as a measure of FRET requires a
careful assessment of the contributions of the spectral overlap and YFP/CFP stoichiometry.
Strain Construction
The first step is the construction of appropriate strains. For FRET analysis the levels of
expression of the CFP and YFP fusions are best controlled by endogenous promoters. This avoids mis-
localization of the fusion, fluctuations in protein levels that often accompany episomal expression, and
the potential to drive artificial protein-protein interactions by mass action under conditions of
overexpression. Several PCR integration systems use homologous recombination to target a
fluorescent protein ORF to the 5' or 3' end of a gene and leave gene expression under the control of the
native promoter. We have mutated plasmids designed by Wach et al. (3) and Prein et al. (2) so that C-
terminal or N-terminal fusions can be made to CFP or YFP. Our CFP is
F64L/S65T/Y66W/N146I/M153T/V163A/N164H relative to GFP (17). Our YFP is
S65G/V68L/Q69K/S72A/T203Y (17). The plasmids to generate the fusions are available from the
YRC. The YRC has made over 50 functional fusions using these systems. We are evaluating other YFP
mutants (11), including the new citrine (18), for improved spectral characteristics over the current YFP
derivative.
Our protocol for making C-terminal fusions is available at our web site:
http://depts.washington.edu/~yeastrc/. Noteworthy is our experience that 40 bp of homology is
sufficient for recombination and insertion of the PCR product into the genome. Also cost savings are
achieved by PAGE purifying only the forward primer containing the homology to the 3’ end of the
ORF. The reverse primer, with homology to the 3’ UTR, is just desalted. Our primers are synthesized
by Integrated DNA Technologies, Inc.
9
To make N-terminal fusions, a PCR cassette is targeted by homology to the 5' end of a gene (2).
Both primers are PAGE purified. Integration of this cassette at the 5' end inserts the selectable marker,
G418 resistance, and the GFP variant between the target gene and its promoter. Since integration
temporarily disrupts expression, a diploid strain is transformed and G418 selection isolates hemizygous
cells carrying the cassette. Flanking the G418 resistance marker are a pair of loxP sites. A plasmid with
creA recombinase under control of the GAL1 promoter is then transformed into these cells. Induction of
creA on YP gal plates excises the G418 resistance marker to produce a CFP or YFP ORF fused to the 5'
end of the gene of interest with the sequence of one 32 bp lox site added just upstream of the
fluorescent protein ORF. The strain is then sporulated to yield a haploid strain in which the fusion
protein has now replaced the wild-type protein.
FRET is exceptionally sensitive to the distance between CFP and YFP. In the absence of
detailed knowledge of the structure of the proteins, one cannot predict a priori which fusions will better
position the fluorophores for FRET. Neither can one predict which fusion will be tolerated by the
protein and remain functional. The optimal fusion must be determined empirically for each protein.
Interpreting the FRET ratio requires several careful controls. For a positive control, a protein of
interest fused to a tandem CFP-YFP should give a strong FRET signal. We have designed a plasmid,
pDH18, that contains a tandem YFP and CFP ORF separated by a glycine-alanine linker. This plasmid
is based on the Wach et al. plasmids (3) and has the S. pombe his5 gene as a selectable marker. We
used pDH18 as a PCR template to construct a positive control strain, DHY138, that expresses the
tandem YFP-CFP fused to the histone H4 protein Hhf2p. DHY138 is a heterozygous diploid strain with
the genotype of HHF2::YFP-CFP/HHF2. Fluorescent protein fusions to Hhf2p are bright and easy to
quantify.
10
Two negative control strains are needed to characterize the spectral overlap between the
excitation and emission spectra of CFP and YFP. One strain contains a CFP fusion to the donor protein
and the other strain contains a YFP fusion to the acceptor protein. The strains are isogenic except for
the genes encoding the recombinant fusions. These strains serve two purposes. First, since the fusions
are expressed independently, the intensity values in the FRET channel represent a negative control in
which the signal is derived solely from the spectral overlap and the limitations of the optical filter sets.
A second purpose evaluates the relative signal intensities from the CFP and YFP fusions when the
fluorphores are excited at their optimum wavelengths. From these values one assesses the fluctuation in
intensity values from cell to cell for each fusion, and the comparative amount of each fusion. If the
intensity values fluctuate greatly, or if the YFP signal is greater than ~5 fold brighter than the CFP
signal, the evaluation of FRET will be severely compromised. For our general purpose negative
controls we use two heterozygous diploid strains, DHY57 and DHY199, containing HHF2-YFP and
HHF2-CFP, respectively. Both have a wild-type copy of HHF2.
Finally, a set of experimental strains is designed. Each strain carries a donor CFP fusion to one
protein and an acceptor YFP fusion to a protein suspected to closely interact. We tested for contact
between the C-terminal end of Hhf2p and the C-terminal end of an adjacent Hhf2p molecule in the
histone complex by constructing a diploid strain containing Hhf2p-YFP and Hhf2p-CFP in the strain
DHY137 (HHF2-CFP/HHF2-YFP).
Sample Preparation
Imaging of live cells demands that all manipulations are gentle and do not disrupt cell
physiology. We grow cells overnight on YPD plates (19) and in cases where cells carry ade2 and ADE3
we add 0.2 ml of 5 mg/ml adenine to the plates before streaking the strain. The cells have uniformly
low autofluorescence and are growing exponentially as determined by budding index. The cells are
11
carefully scraped from the plate and suspended in 300 µL of SD complete medium (19). In this manner
a high density suspension of cells in log phase is obtained without concentrating the cells by
centrifugation.
To make slides, SD complete medium containing 1.2% agarose (SeaKem LE agarose) is melted
and poured into the 0.5 mm depression in concavity slides (PGC Scientifics Corp). The depression
holds roughly 250 µL. A second flat slide is placed over the filled depression and the agar is cooled.
Once cooled, the top slide is slid off leaving a depression filled with a bed of solid SD complete agar at
an appropriate temperature. The concavity slides are cleaned and reused. For more routine work a thin
film 60 nm thick of agarose medium is created on a microscope slide by sandwiching the agarose
between two slides on which Scotch® tape is applied across both ends of one side. Other techniques
include replacing the agarose with 25% gelatin, and including Oxyrase™ in the medium to deplete
oxygen and reduce bleaching (6).
An aliquot (10 µL) of cells is placed onto the agarose bed and a coverslip is pressed down over
the cells. For long observation times the coverslip is sealed at the edges with nail polish to prevent
drying of the agarose. An alternative to nail polish is valap (lanolin:petroleum jelly:paraffin 1:1:1).
The cells lie in one focal plane at the coverslip surface and are embedded in the agar. The agarose pad
supports the cells nutritionally.
As an alternative to live cell imaging, cells can be fixed with formaldehyde or
paraformaldehyde. Fixation results in decreased signals from the fluorescent proteins, but effective
antifade agents can be added to prevent photobleaching. We add formaldehyde to a cell suspension
(prepared as above) to a final concentration of 3.7%. This solution is placed in a 30°C rotator for 15-20
minutes. Formaldehyde fixed cells are adhered to polylysine-coated coverslips, and glycerol with an
antifade agent such as Citifluor™ (Ted Pella Inc.) is used as a mounting medium.

12
Optimization of Imaging Parameters
We strongly recommend starting with a positive control and optimizing the imaging technique
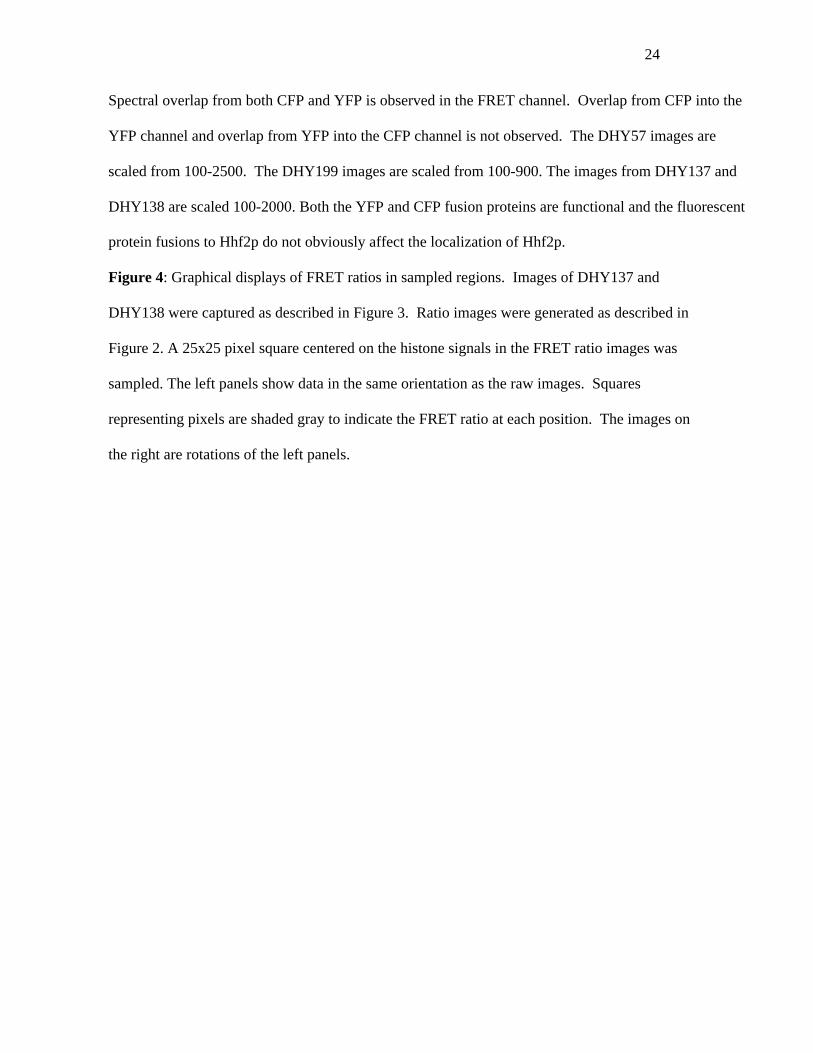
to maximize the FRET ratio. Limiting exposure time is crucial for detecting FRET signals. The YFP
acceptor is very sensitive to bleaching by exposure to the 440 nm light used for CFP excitation, with a
half-life of approximately 600 milliseconds in our experiments (Figure 1). Bleaching of CFP is not as
rapid, but still occurs with a half-life of about 3 seconds (Figure 1). Clearly limiting exposure of the
sample to 440 nm light will assist in FRET detection. Even the strong FRET ratio from the Hhf2p-YFP-
CFP tandem fusion is barely detectable after 5 seconds of total exposure (1 s at 500nm, 4 s at 440nm,
Figure 2). We do the following to protect YFP from bleaching:
1) Use transmitted light for focusing.
Light intensity from a transmitted light source (typically a halogen bulb) is negligible compared
to the light intensity generated by a mercury lamp. We have not observed effects on FRET signals from
exposure to transmitted light.
2) Take very short YFP exposures if additional focusing is necessary.
We bin our camera either 2x2 or 3x3 and take 100 millisecond exposures if focusing the
fluorescent signal is necessary. The FRET signal is bleached slowly by YFP excitation light (500 nm)
compared to 440 nm exposure. Therefore the YFP filter set (Ex500 | Em545) is used for additional
fine focusing. The optimal focal plane is found by raising and lowering the stage in small increments
(<400 nm) and locating the position where the pixel values from the YFP emission signal are
maximized.

13
3) Take short exposures during data acquisition.
Exposure times are minimized when acquiring data. Many CCD cameras generate 12 bit files
with 4096 gray levels. We do not extend the exposure time to make use of the full range since the
FRET signal is destroyed within 5 seconds of exposure.
4) Take the FRET image before the CFP image.
The order of data acquisition affects the strength of a measured FRET signal. The YFP image
(Ex500|Em545) is taken first, the FRET image (Ex440|Em545) is taken second and the image of CFP
emission (Ex440|Em480) third to avoid bleaching the YFP. Typically only minor bleaching of the CFP
occurs while the FRET image is taken (Figure 1).
Using all of these techniques to maximize the FRET signal, our Hhf2p-YFP-CFP tandem
positive control strain generates a mean FRET ratio of 3.55 with a standard deviation of 0.20 (see
below, “Data Analysis”). This ratio will vary depending on the particular optics and camera used for
detection.
Spectral Overlap
Some fluorescence from CFP reaches into the FRET channel since the broad emission spectrum
of CFP extends beyond 545 nm (14). Thus even without an acceptor YFP present, the FRET ratio has a
value that reflects the amount of fluorescence from CFP that spills over into the FRET channel. In
addition, the excitation spectrum of YFP extends below 440 nm into the excitation wavelengths of CFP
(14). Fluorescence from YFP that comes from direct excitation of YFP also appears in the FRET
channel. The negative control strains identify the contribution of the spectral overlap to the signal in
the FRET channel.
14
1. Overlap from CFP
The CFP alone strain is imaged to determine the FRET ratioCFP (Figure 3). The signal intensity
in the FRET channel (Ex440|Ex545) is divided by the signal intensity in the CFP channel
(Ex440|Em480). For the HHF2-CFP/HHF2 diploid strain DHY199, we observe a mean ratio of 1.22
with a standard deviation of 0.072. This ratio will differ from system to system since it depends in part
on the optical filter sets and the quantum efficiency of the CCD camera. Note that CFP does not
contribute any fluorescence to the YFP channel (Figure 3).
2. Overlap from YFP
The amount of fluorescence in the FRET channel for a given amount of YFP (the YFP overlap
factor) is characterized by imaging the YFP-protein fusion strain that does not express the CFP fusion
(Figure 3). Two images are compared: Ex500|Em545 (YFP channel) and Ex440|Em545 (FRET
channel). The YFP overlap factor is the amount of fluorescence in the FRET channel divided by the
amount in the YFP channel. Using our HHF2-YFP/HHF2 diploid strain DHY57, the YFP overlap
factor is 0.26 with a standard deviation of 0.020. This factor is a function of the relative FRET and
YFP exposure times. Therefore the exposure times must remain constant throughout the experiments
for this factor to retain significance. Also note that YFP does not contribute any fluorescence to the
CFP channel (Figure 3).
The Experiment
1. Grow experimental and control strains overnight as described under “Sample Preparation”.
2. Mount cells on slides as described under “Sample Preparation”.
3. Focus with transmitted light as described under “Optimizing Imaging Parameters”.
15
4. Take three images of each sample in the following order: a) YFP filter set (Ex500|Em545), b)
FRET filter set (Ex440|Em545), c) CFP filter set (Ex440|Em480). The parameters for image
capture will depend on the strength of the signal above noise and the pattern of intracellular
localization. For the Hhf2p fusions the exposure times were 200 ms for the YFP channel, 400
ms for the FRET channel and 400 ms for the CFP channel. The camera was binned 2x2. The
images obtained for the positive control strain and the experimental strain are shown in
Figure 3.
Data Analysis
Quantification of Signal Intensities
Analysis of the image depends on the pattern of intracellular localization. For the
histones, the total intensity is summed from a region in the center of the histone signal. We
sampled a 700 x 700 nm square (a 5 x 5 pixel square, 2 x 2 camera binning). An example of the
data we acquired is presented in Table 1. The topographical representations of the FRET ratios
(Figures 2 and 4) show a 25 x 25 pixel square centered on the histone signal.
Data Presentation
As a first step in the analysis, the easiest method to display the FRET ratio is to divide the
intensity values in the FRET channel by the intensity values in the CFP channel across the
image. This manipulation is performed by the image analysis software to generate a three-
dimensional topographical display (Figure 4). The view of the display is rotated to emphasize the
value of the FRET ratio at different positions in the image. Different perspectives visually
portray the FRET ratios across the image. In Figure 4 the positive control (HHF2-YFP-
CFP/HHF2) shows the FRET ratios rising from the plane, while the experimental sample
(HHF2-YFP/HHF2-CFP) remains relatively flat. The image reveals significant energy transfer
16
in the positive control, but none or very little from the experimental sample. The background
noise was not subtracted because background subtracted values for the CFP channel approach
zero in regions void of CFP and cause the FRET ratio around the edges of the image to fluctuate
greatly.
A quantitative analysis requires extracting the intensity values from a number of images
and calculating a mean FRET ratio. Table 1 shows the data from 8 cells of the positive control
expressing the tandem fusion of Hhf2p-YFP-CFP. For these values a background value,
determined for each cell, has been subtracted. The technique to determine the background values
for an image may vary depending on the nature and distribution of the fluorescent signal. For the
Hhf2p fusions the intensity values from an area of equal size to the sampled histone signal, i.e. a
25 pixel square, were summed. The area was inside the cell but away from the histone signal.
The data for the YFP, FRET and CFP channels were analyzed to yield a mean FRET ratio of
3.55 with a standard deviation of 0.20. The mean YFP/CFP ratio was 1.81 with a standard
deviation of 0.15.
Table 1 also shows the corresponding data for the experimental strain expressing Hhf2p-
YFP and Hhf2p-CFP. The absolute values for the YFP and CFP channels are higher than the
values from the positive control since in the experimental strain there is no wild-type Hhf2p
present to diminish the signal. In the experimental strain the calculated mean FRET ratio was
1.75 with a standard deviation of 0.084. The mean YFP/CFP ratio was 1.39 with a standard
deviation of 0.16.
Data Interpretation
The final step analyzes the data to determine whether the FRET ratio obtained from the
experimental strain reflects energy transfer between CFP and YFP. In the absence of energy transfer, a

17
mixture of CFP and YFP proteins will give a signal in the FRET channel. The intensity of that signal
depends in part on the amount of CFP and YFP present. Since that could vary for each donor and
acceptor pair, it must be taken into account for each experiment. The following formula calculates the
ratio expected for a given donor and acceptor if no energy transfer is occurring:
FRET ratioBaseline = FRET ratioCFP + YFP overlap factor x YFP channel
CFP channel
The FRET ratioCFP accounts for the contribution from the CFP fusion protein and is
determined by imaging the strain carrying the CFP fusion alone as described above (“Spectral
Overlap”). The YFP overlap factor accounts for the contribution from the YFP fusion protein and is
determined by imaging the strain carrying the YFP fusion protein alone (see “Spectral Overlap”). The
FRET ratioCFP was 1.22 and the YFP overlap factor was 0.26 for our microscope system and controls.
The ratio of YFP channel/CFP channel is determined from the strains containing both the YFP and CFP
fusion proteins.
Energy transfer is clearly indicated between CFP and YFP in the positive control. Given the
YFP/CFP ratio of 1.81 (Table 1), the calculated FRET ratioBaseline is 1.67 with a standard deviation of
0.011. For the Hhf2p-YFP-CFP labeled histones the observed FRET ratio of 3.55 with a standard
deviation of 0.20 is significantly higher (Table 1). Under ideal in vitro conditions purified CFP-YFP
pairs give a 3 to 4 -fold increase in FRET ratio when the individual proteins are linked by a 25 amino
acid linker (11). The two-fold increase in the observed FRET ratio of the Hhf2p-YFP-CFP over the
calculated FRET ratioBaseline is lower but still easily detectable. The short Gly-Ala linker between the
YFP and CFP in the Hhf2p fusion may impose conformational constraints that limit FRET. However, a
18
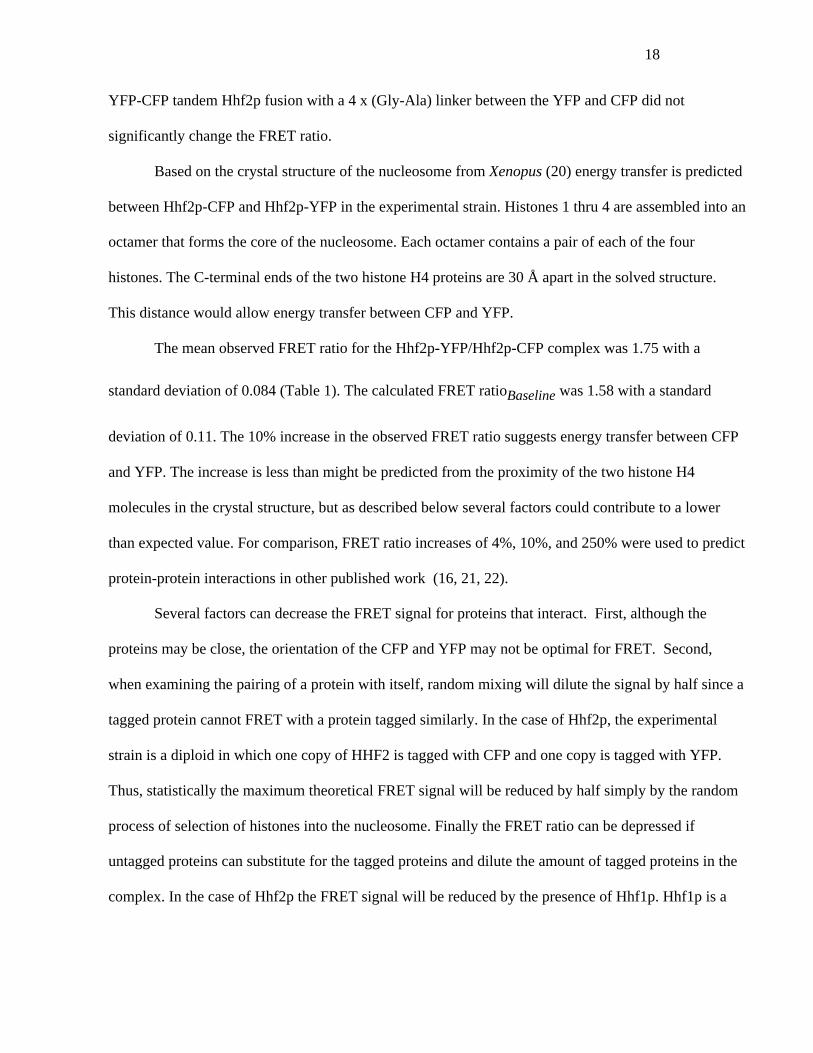
YFP-CFP tandem Hhf2p fusion with a 4 x (Gly-Ala) linker between the YFP and CFP did not
significantly change the FRET ratio.
Based on the crystal structure of the nucleosome from Xenopus (20) energy transfer is predicted
between Hhf2p-CFP and Hhf2p-YFP in the experimental strain. Histones 1 thru 4 are assembled into an
octamer that forms the core of the nucleosome. Each octamer contains a pair of each of the four
histones. The C-terminal ends of the two histone H4 proteins are 30 Å apart in the solved structure.
This distance would allow energy transfer between CFP and YFP.
The mean observed FRET ratio for the Hhf2p-YFP/Hhf2p-CFP complex was 1.75 with a
standard deviation of 0.084 (Table 1). The calculated FRET ratioBaseline was 1.58 with a standard
deviation of 0.11. The 10% increase in the observed FRET ratio suggests energy transfer between CFP
and YFP. The increase is less than might be predicted from the proximity of the two histone H4
molecules in the crystal structure, but as described below several factors could contribute to a lower
than expected value. For comparison, FRET ratio increases of 4%, 10%, and 250% were used to predict
protein-protein interactions in other published work (16, 21, 22).
Several factors can decrease the FRET signal for proteins that interact. First, although the
proteins may be close, the orientation of the CFP and YFP may not be optimal for FRET. Second,
when examining the pairing of a protein with itself, random mixing will dilute the signal by half since a
tagged protein cannot FRET with a protein tagged similarly. In the case of Hhf2p, the experimental
strain is a diploid in which one copy of HHF2 is tagged with CFP and one copy is tagged with YFP.
Thus, statistically the maximum theoretical FRET signal will be reduced by half simply by the random
process of selection of histones into the nucleosome. Finally the FRET ratio can be depressed if
untagged proteins can substitute for the tagged proteins and dilute the amount of tagged proteins in the
complex. In the case of Hhf2p the FRET signal will be reduced by the presence of Hhf1p. Hhf1p is a

19
histone H4 protein that is identical to Hhf2p. HHF1 expression is 5 to 7 fold less than HHF2 (23), so
the reduction in FRET should be minor. These points indicate that a lack of FRET between proteins
does not argue against interaction; however, the observation of FRET between two tagged proteins
demonstrates their close proximity.
Conclusion
Live cell FRET detection in yeast is in its infancy, and there are significant complications
with the CFP and YFP pair. Spectral overlap between the excitation and emission spectra
complicates analysis. The extreme sensitivity of the current YFP to bleaching constrains image
acquisition. Detection of a FRET signal is limited by background cellular autofluorescence and
the relatively weak fluorescent signal intensities. Dynamic intracellular conditions, such as
changes in pH or protein concentrations, can complicate the interpretation of experimental data.
However, with careful controls FRET is a powerful indication of protein-protein interaction. In
instances where interactions give robust FRET signals, FRET is a valuable tool to study the
dynamic spatial and temporal behavior of protein-protein interactions in living cells. Future
improvements in the spectral properties of CFP and YFP will increase the general applicability
of FRET to study a broad range of protein-protein interactions in yeast.

20
References
1. R. Y. Tsien, Annu Rev Biochem 67, 509-44 (1998).
2. B. Prein, K. Natter, and S. D. Kohlwein, FEBS Lett 485, 29-34. (2000).
3. A. Wach, A. Brachat, C. Alberti-Segui, C. Rebischung, and P. Philippsen, Yeast 13,
1065-75. (1997).
4. A. F. Fradkov, et al., FEBS Lett 479, 127-30. (2000).
5. G. S. Baird, D. A. Zacharias, and R. Y. Tsien, Proc Natl Acad Sci U S A 97, 11984-9.
(2000).
6. S. L. Shaw, E. Yeh, K. Bloom, and E. D. Salmon, Curr Biol 7, 701-4. (1997).
7. J. L. Carminati, and T. Stearns, Methods Cell Biol 58, 87-105 (1999).
8. S. D. Kohlwein, Microsc Res Tech 51, 511-529. (2000).
9. E. T. O'Toole, M. Winey, and J. R. McIntosh, Mol Biol Cell 10, 2017-31. (1999).
10. L. Stryer, Annu Rev Biochem 47, 819-46 (1978).
11. R. Heim, Methods Enzymol 278, 408-423 (1999).
12. A. Periasamy, and R. N. Day, Methods Cell Biol 58, 293-314 (1999).
13. B. A. Pollok, and R. Heim, Trends Cell Biol 9, 57-60 (1999).
21
14. A. Miyawaki, and R. Y. Tsien, Methods Enzymol 327, 472-500 (2000).
15. G. W. Gordon, G. Berry, X. H. Liang, B. Levine, and B. Herman, Biophys J 74, 2702-13.
(1998).
16. M. Damelin, and P. A. Silver, Mol Cell 5, 133-40. (2000).
17. A. Miyawaki, O. Griesbeck, R. Heim, and R. Y. Tsien, Proc Natl Acad Sci U S A 96,
2135-40 (1999).
18. A. A. Heikal, S. T. Hess, G. S. Baird, R. Y. Tsien, and W. W. Webb, Proc Natl Acad Sci
U S A 97, 11996-2001. (2000).
19. F. Sherman, G. R. Fink, and J. B. Hicks, Methods in Yeast Genetics (Cold Spring Harbor
Laboratory, Cold Spring Harbor, New York, 1986).
20. K. Luger, A. W. Mader, R. K. Richmond, D. F. Sargent, and T. J. Richmond, Nature 389,
251-60. (1997).
21. R. N. Day, Mol Endocrinol 12, 1410-9 (1998).
22. J. Llopis, et al., Proc Natl Acad Sci U S A 97, 4363-8 (2000).
23. S. L. Cross, and M. M. Smith, Mol Cell Biol 8, 945-54. (1988).
22
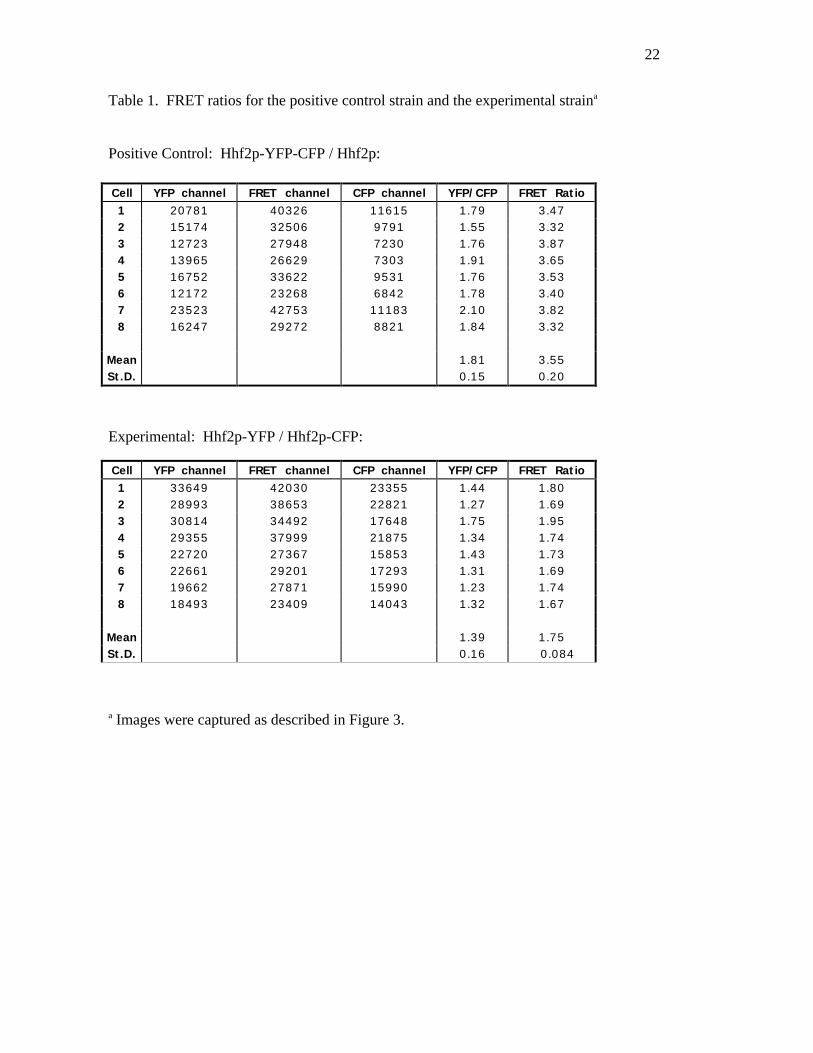
Table 1. FRET ratios for the positive control strain and the experimental straina
Positive Control: Hhf2p-YFP-CFP / Hhf2p:
Experimental: Hhf2p-YFP / Hhf2p-CFP:
a Images were captured as described in Figure 3.
Cell YFP channel FRET channel CFP channel YFP/CFP FRET Ratio1 33649 42030 23355 1.44 1.802 28993 38653 22821 1.27 1.693 30814 34492 17648 1.75 1.954 29355 37999 21875 1.34 1.745 22720 27367 15853 1.43 1.736 22661 29201 17293 1.31 1.697 19662 27871 15990 1.23 1.748 18493 23409 14043 1.32 1.67
Mean 1.39 1.75St.D. 0.16 0.084
Cell YFP channel FRET channel CFP channel YFP/CFP FRET Ratio1 20781 40326 11615 1.79 3.472 15174 32506 9791 1.55 3.323 12723 27948 7230 1.76 3.874 13965 26629 7303 1.91 3.655 16752 33622 9531 1.76 3.536 12172 23268 6842 1.78 3.407 23523 42753 11183 2.10 3.828 16247 29272 8821 1.84 3.32
Mean 1.81 3.55St.D. 0.15 0.20
23
Figure Legends
Figure 1: CFP and YFP bleaching by 440 nm light. The two strains examined were DHY57 (HHF2-
YFP/HHF2) and DHY199 (HHF2-CFP/HHF2). The strains were grown and imaged as described in the
text. Each curve summarizes data collected from 4 different cells. Data was sampled by summing total
intensity inside a 5x5 pixel square. Background was determined from a 5x5 pixel square inside each
cell but away from the histone signal. l , CFP bleaching at 440 nm, repeated 400 ms CFP exposures
were captured. n , YFP bleaching at 440 nm. To mimic the conditions during a FRET experiment, we
repeatedly exposed the sample to a 200 ms YFP exposure followed by an 800 ms CFP exposure.
Bleaching of the YFP during the YFP exposures is negligible. The error bars show the standard
deviation.
Figure 2: Rapid bleaching of the FRET signal during sequential image capture. Strain DHY138
(HHF2::YFP-CFP/HHF2) was grown and imaged as described in the text. Six sequential time points
were taken. At each time point a 200 ms YFP channel, 400 ms FRET channel and 400 ms CFP channel
exposure were captured. Each FRET channel image was divided by the CFP channel image to generate
six sequential FRET ratio images. Pixel values in the ratio images are the FRET ratios at each position
in the image. A 25x25 pixel square centered on the histone signal was sampled. Data from the first,
third and fifth ratio images are shown. The numerical range of the FRET ratios in the sampled region is
indicated by the grayscale. Elapsed total exposure time is indicated beside the plots.
Figure 3: Images of our negative and positive control strains compared with the experimental strain.
Strains DHY57 (YFP overlap control), DHY199 (CFP overlap control) and DHY138 (positive control)
were compared to DHY137 (HHF2-CFP/HHF2-YFP) (brief strain descriptions in text). Samples were
prepared for microscopy as described in text. Three images of each strain were captured in this order: a
200 ms YFP channel exposure, a 400 ms FRET channel exposure and a 400 ms CFP channel exposure.
24
Spectral overlap from both CFP and YFP is observed in the FRET channel. Overlap from CFP into the
YFP channel and overlap from YFP into the CFP channel is not observed. The DHY57 images are
scaled from 100-2500. The DHY199 images are scaled from 100-900. The images from DHY137 and
DHY138 are scaled 100-2000. Both the YFP and CFP fusion proteins are functional and the fluorescent
protein fusions to Hhf2p do not obviously affect the localization of Hhf2p.
Figure 4: Graphical displays of FRET ratios in sampled regions. Images of DHY137 and
DHY138 were captured as described in Figure 3. Ratio images were generated as described in
Figure 2. A 25x25 pixel square centered on the histone signals in the FRET ratio images was
sampled. The left panels show data in the same orientation as the raw images. Squares
representing pixels are shaded gray to indicate the FRET ratio at each position. The images on
the right are rotations of the left panels.
25

26
Figure 2

27
Figure 3

28
Figure 4