
Non-Thermal Plasma Synthesis of Luminescent Silicon ...
177
NON-THERMAL PLASMA SYNTHESIS OF LUMINESCENT SILICON NANOCRYSTALS FROM CYCLOHEXASILANE A Dissertation Submitted to the Graduate Faculty of the North Dakota State University of Agriculture and Applied Science By Todd Andrew Pringle In Partial Fulfillment of the Requirements for the Degree of DOCTOR OF PHILOSOPHY Major Program: Materials and Nanotechnology May 2019 Fargo, North Dakota
-
Upload
khangminh22 -
Category
Documents
-
view
1 -
download
0
Transcript of Non-Thermal Plasma Synthesis of Luminescent Silicon ...
NON-THERMAL PLASMA SYNTHESIS OF LUMINESCENT SILICON NANOCRYSTALS
FROM CYCLOHEXASILANE
A Dissertation
Submitted to the Graduate Faculty
of the
North Dakota State University
of Agriculture and Applied Science
By
Todd Andrew Pringle
In Partial Fulfillment of the Requirements
for the Degree of
DOCTOR OF PHILOSOPHY
Major Program:
Materials and Nanotechnology
May 2019
Fargo, North Dakota
North Dakota State University
Graduate School
Title
NON-THERMAL PLASMA SYNTHESIS OF LUMINESCENT SILICON
NANOCRYSTALS FROM CYCLOHEXASILANE
By
Todd Andrew Pringle
The Supervisory Committee certifies that this disquisition complies with North Dakota
State University’s regulations and meets the accepted standards for the degree of
DOCTOR OF PHILOSOPHY
SUPERVISORY COMMITTEE:
Erik Hobbie
Chair
Phillip Boudjouk
Mohiuddin Quadir
Ben Braaten (Grad School Rep)
Approved:
May 23, 2019 Erik Hobbie
Date Department Chair
iii
ABSTRACT
In this report we establish cyclohexasilane (CHS) as a reliable precursor for non-thermal
plasma synthesis of high quality photoluminescent silicon nanocrystals (SiNCs). We demonstrate
that this synthesis approach can produce high quality, size tunable silicon quantum dots with
quantum yields exceeding 60% as synthesized (subsequent work in our group has measured over
70% quantum yield after density gradient ultracentrifugation size purification).
After a brief background on non-thermal plasma synthesis, the characterization methods
used in this study, and an overview of CHS, we report at length on our development of the
apparatus used, and our exploration of the controllable processing parameters of the synthesis
method. We describe our successes and challenges with size tuning, sample collection, and
passivation.
Finally, we discuss preliminary studies we performed to identify promising future
research areas. Novel reactor designs, blue light passivation, and magnetic confinement of
plasma are described briefly to entice future researchers.
iv
ACKNOWLEDGEMENTS
It has been my honor and privilege to help bring high quality silicon nanocrystal
synthesis capacity to NDSU. First, my deep thanks to Dr. Erik Hobbie for embracing my non-
conventional approach, for working with my constraints (being part-time and self-funded), for
allowing me to chase down paths I found interesting, and for the many ways he worked to
support my efforts.
Additionally, I am grateful to Dr. Phil Boudjouk for providing much needed lab space
(and infrastructure support) and for contributing the CHS precursor used in this study.
Dr. Uwe Kortshagen, at the University of Minnesota, is thanked for his gracious and
enthusiastic collaboration, which included lab space, characterization support, and consultation.
Katharine Hunter, in Dr. Kortshagen’s group, is thanked, many times over, for her
patience and generosity. She gave of her time to help launch this effort, teaching me the basics
and putting up with my endless questions as we built the first demonstration reactor to test CHS
for the first time at UMN. Katharine is also thanked for her continued responses to my questions
over the next many months, and for the time she gave supporting further characterization.
Members of Dr. Hobbie’s team that collaborated on this effort are also thanked. Dr. Sam
Brown, Mahmud Sefannaser, Reed Peterson, Salim Thomas, and Aaron Forde were great to
work with and wonderful contributors. Sam’s technical leadership in calibrating the PLQY setup
was essential to moving us forward. Mahmud’s steadfast enthusiasm and work ethic on PLQY
characterization brought energy to the group.
A shout-out to Dr. Scott “Bring on the Pain” Payne, for once again putting up with me at
the Electronic Microscopy Center. Just like many years ago, when working on my M.S., Scott
was awesome to work with.
v
Lastly, and most importantly, I thank Kenneth Anderson. Kenny put up with an
obnoxious interloper in his lab at R1a, who followed him into his new lab at R2 like a stray trash
panda. This uninvited-guest-who-never-left asked Kenny endless dumb questions and seemed to
take forever to learn how to follow basic protocol that any good chemist would know. This
tenant-who-didn’t-pay-rent squatted in fume hoods, took up precious bench space and made
nests in glove boxes. Through it all Kenny helped, encouraged, and supported this vagrant.
Without Kenny’s lab experience, I fear the school of hard knocks would have delayed this effort
many months. Kenny’s contributions, especially on the wet chemistry side of things, and of
course all efforts to minimize contamination, were essential to our success.

vi
DEDICATION
To my father, Roger Kenneth Pringle.
vii
TABLE OF CONTENTS
ABSTRACT ................................................................................................................................... iii
ACKNOWLEDGEMENTS ........................................................................................................... iv
DEDICATION ............................................................................................................................... vi
LIST OF FIGURES ........................................................................................................................ x
LIST OF ABBREVIATIONS .................................................................................................... xviii
CHAPTER 1. OVERVIEW OF THE STUDY ............................................................................... 1
1.1. Purpose of the Study ......................................................................................................... 1
1.2. Scope of the Study ............................................................................................................ 2
1.3. Collaboration .................................................................................................................... 3
CHAPTER 2. NON-THERMAL PLASMA SYNTHESIS BACKGROUND ............................... 4
2.1. Non-Thermal Plasma Synthesis of Silicon Nanocrystals Development .......................... 4
2.2. Non-Thermal Plasma and Nanoparticle Growth .............................................................. 6
2.3. Particle Heating and Crystallization ............................................................................... 20
2.4. CHS Versus Silane ......................................................................................................... 25
CHAPTER 3. CHARACTERIZATION METHODS................................................................... 26
3.1. Characterization Methods in this Study ......................................................................... 26
CHAPTER 4. CYCLOHEXASILANE ........................................................................................ 30
4.1. CHS Synthesis ................................................................................................................ 30
4.2. CHS Properties ............................................................................................................... 30
4.3. CHS Safety and Storage ................................................................................................. 31
CHAPTER 5. APPARATUS DESIGN AND PARAMETER SPACE DEFINITION ................ 34
5.1. Introduction to the Apparatus ......................................................................................... 34
5.2. Bubbler Considerations .................................................................................................. 39
5.3. Reactor Considerations ................................................................................................... 45

viii
5.3.1. Reactor Considerations: Pressure Monitoring ............................................................. 47
5.4. Sample Collection Considerations ................................................................................. 49
5.5. Pump Down Base Assembly Considerations ................................................................. 56
5.6. Plasma Considerations (Impedance Matching, Cooling) ............................................... 57
5.7. Gas Flow Considerations ................................................................................................ 62
5.8. Control Considerations ................................................................................................... 64
5.9. Discussion on Parameter Space ...................................................................................... 66
5.10. Discussion on Controlling Contamination ................................................................... 69
CHAPTER 6. FIRST SiNCS AND PLASMA STABILITY STUDIES ...................................... 72
6.1. First SiNCs with CHS .................................................................................................... 72
6.2. Striations and Filaments ................................................................................................. 83
6.3. Diffuse Plasma Parameter Space .................................................................................... 86
CHAPTER 7. SIZE TUNING STUDIES ..................................................................................... 90
7.1. Raspberries ..................................................................................................................... 90
7.2. Size: Our Approach, and Measurement.......................................................................... 95
7.3. Residence Time .............................................................................................................. 97
7.4. Residence Time and Size: Diameter and Flow ............................................................... 99
7.5. Size and the Parameter Space ....................................................................................... 105
CHAPTER 8. SAMPLE COLLECTION STUDIES .................................................................. 109
8.1. Size and Sample Yield.................................................................................................. 109
CHAPTER 9. PASSIVATION AND QUANTUM YIELD STUDIES...................................... 118
9.1. Introduction .................................................................................................................. 118
9.2. Microwave Rx Vial and PLQY Results ....................................................................... 118
9.2.2. Passivation Time Study ............................................................................................. 126
9.2.3. Effect of Injected Hydrogen ...................................................................................... 128

ix
9.3. Dual Ligand Preliminary Study .................................................................................... 129
9.4. Blue Light Passivation Preliminary Study ................................................................... 131
9.5. Quantum Yield and the Parameter Space ..................................................................... 133
CHAPTER 10. NOVEL REACTOR PRELIMINARY STUDIES ............................................ 136
10.1. Novel Reactor Designs ............................................................................................... 136
CHAPTER 11. NOVEL MAGNETIC CONFINEMENT PRELIMINARY STUDIES ............ 139
11.1. Plasma Manipulation with Magnetic Fields ............................................................... 139
CHAPTER 12. SUMMARY AND FUTURE STUDIES ........................................................... 141
12.1. CHS as a Precursor ..................................................................................................... 141
12.2. Challenges and Opportunities of Non-Thermal Plasma Synthesis of Silicon
Nanocrystals ........................................................................................................................ 142
12.3. Future Studies: Sample Collection ............................................................................. 143
12.4. Future Studies: Passivation......................................................................................... 143
12.5. Future Studies: Reactor Design and Plasma Control ................................................. 144
12.6. Future Studies: Additional Chemistries...................................................................... 144
12.7. Conclusion .................................................................................................................. 145
REFERENCES ........................................................................................................................... 146
x
LIST OF FIGURES
Figure Page
1.1. Simplified Illustration of Plasma. The tiny red dots illustrate electrons, green dots
are neutral species, blue dots are ions, the grey circles are particles, Q is mass
flow and E is the simplified electric field. Note the accumulations of electrons on
the reactor walls and particles. ............................................................................................ 9
1.2. Simplified Reactor Diagram. Q is mass flow. The plasma is powered by a
radiofrequency (RF) generator at 13.56 megahertz with capacitively coupled ring
electrodes (in red and black) surrounding the reactor tube as shown. Diffuse
plasma is shown in purple. ................................................................................................ 10
1.3. Reactor Plasma Zone Nomenclature for Discussion Purposes. Q is mass flow and
E is the simplified electric field. We break down the reaction flow through the
plasma into these stages: a) Pre-plasma, b) Initial Plasma, c) Upstream Plasma, d)
RF Electrode Plasma, e) Inter-Electrode Plasma, f) Ground Electrode Plasma, g)
Downstream Plasma, h) Final Plasma, and i) Post-Plasma (or Afterglow). ..................... 11
1.4. Plasma “Arcing” to Disconnects. These images show plasma ionization currents
reaching disconnects, which we have observed usually reduces photoluminescent
quantum yield: a) upstream arcing, b) downstream arcing, and c) sideport arcing. ......... 12
1.5. Plasma Effects from Electrode Spacing. These images show SiNCs synthesis
with varying electrode placement. Similar plasma stretching can be induced with
pressure, flows, and power level (each with different interactions and effects on
SiNC size and quality). Note in a) we observed upstream arcing. Hydrogen was
being injected in the sideports of these reactors, otherwise for e) (and possibly d))
we would likely observe downstream arcing. ................................................................... 13
1.6. Plasma Sheath Formation. The tiny red dots illustrate electrons, green dots are
neutral species, blue dots are ions, the grey circles are growing particles. ....................... 15
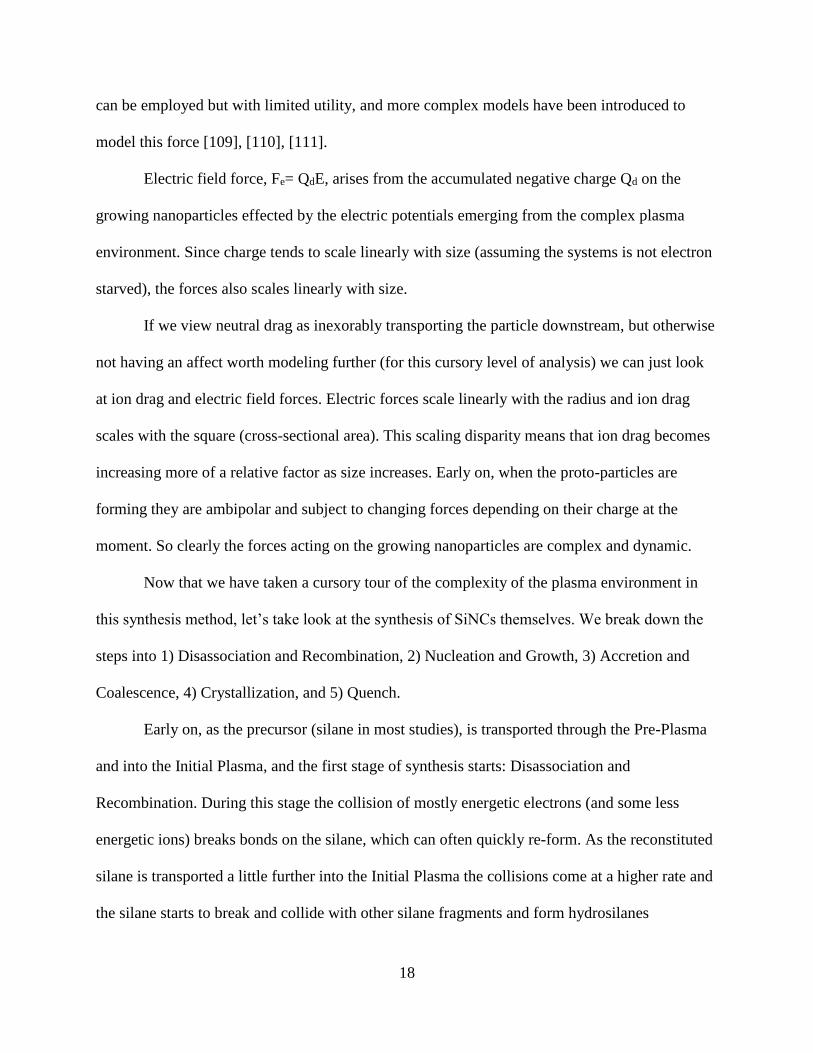
1.7. Silicon Nanoparticle Heating from Electron-Ion Recombination. Figure 1.7
illustrates an argon ion on the nanoparticle surface recombining with an electron,
releasing energy on the silicon nanoparticle surface. This energy of silicon
nanoparticle heating from electron-ion recombination is the equal to the argon
ionization energy. .............................................................................................................. 20
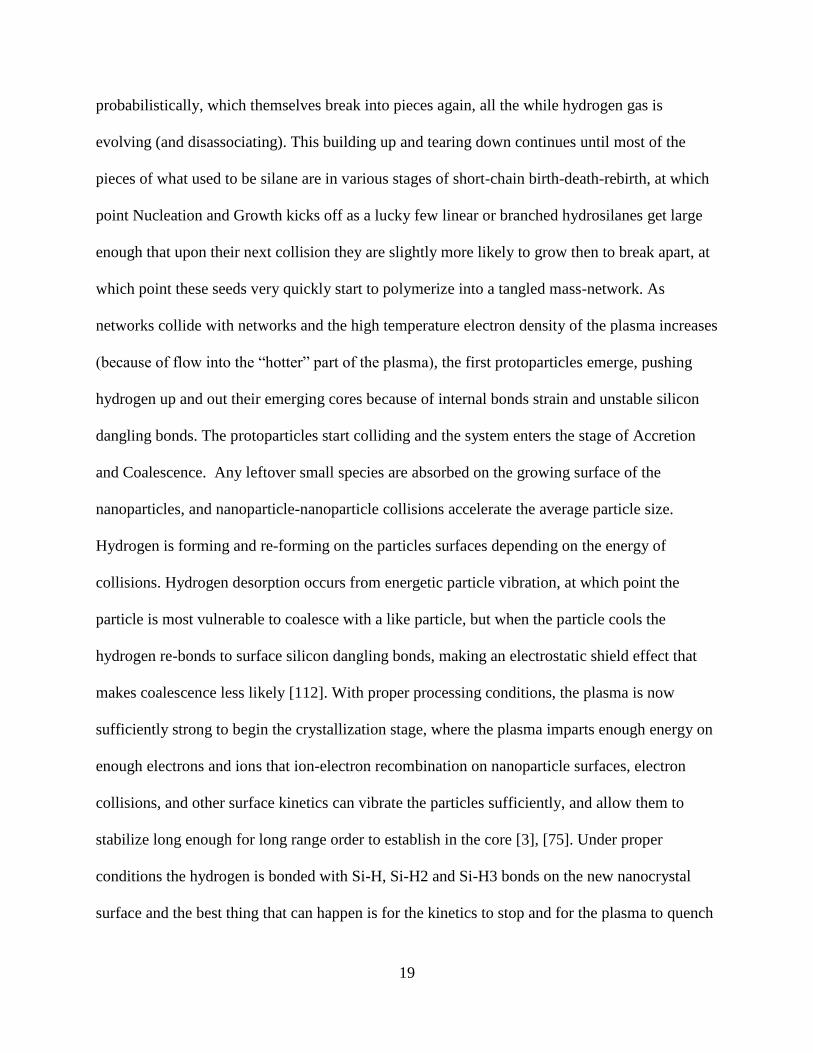
1.8. Silicon Nanoparticle Heating from Hydrogen Recombination. ........................................ 21
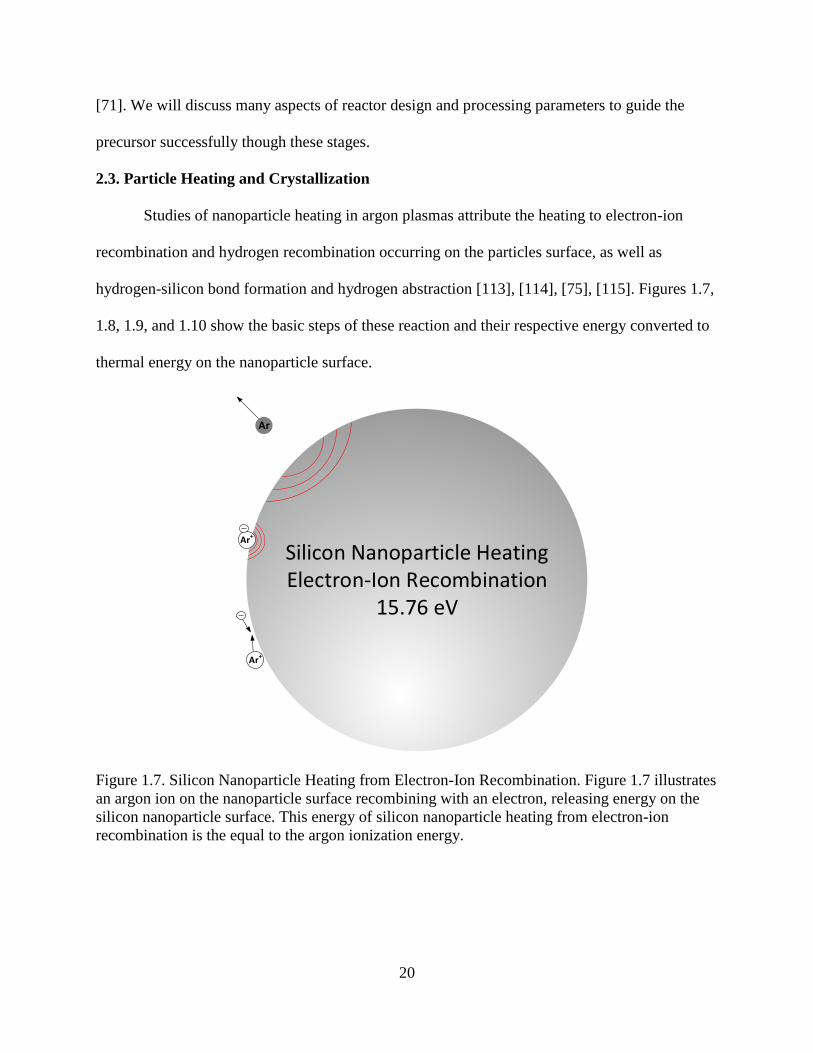
1.9. Silicon Nanoparticle Heating from Hydrogen Attach of Silicon Dangling Bond. ........... 21
1.10. Silicon Nanoparticle Heating Hydrogen from Abstraction. The bond energy of
hydrogen gas is 4.51 eV, the Si-H bond energy was 3.1 eV, the difference, 1.41
eV is released as heat on the silicon nanoparticle surface. ............................................... 22
xi
5.1. Demonstration and First-Generation Apparatus. This image on the left shows the
demonstration apparatus constructed at the University of Minnesota. The image
on the right is the first configuration of the first-generation apparatus constructed
at NDSU. ........................................................................................................................... 34
5.2. Apparatus Nomenclature and Function Diagram. This figure shows the functional
sub-assemblies and the direction of material flow through the apparatus. ....................... 34
5.3. Upstream System of Demonstration Apparatus. This figure shows the components
of the upstream system of the apparatus constructed at the University of
Minnesota. ......................................................................................................................... 36
5.4. Upstream System of NDSU First Generation Apparatus. This figure shows the
components of the upstream system of the apparatus constructed for our first-
generation apparatus. MFC control interface box not shown. .......................................... 37
5.5. Upstream System of First Generation Apparatus. This image shows the upstream
system of the earliest configuration of the first-generation apparatus at NDSU. ............. 37
5.6. Demonstration CHS Bubbler Design. This figure shows four angles of the first
bubbler, comprised of Swagelok fittings, valves and stainless tubes. This bubbler
proved sub-optimal and was replaced by a new design. ................................................... 40
5.7. Demonstration CHS Bubbler Design Parts and Assembly. This figure shows the
design, disassembled (left, without extension tubes or straw) and assembled
(right). This design was relatively inexpensive but resulted in many Swagelok
seals and stress accumulation under moment arm forces. ................................................ 41
5.8. CHS Bubbler Design for First-Generation Apparatus. The image on the left
shows the fully assembled bubbler prior to mounting on the apparatus, with the
inlet valve on the top and the outlet valve on the right-hand side of the image. The
image on the right shows the CHS in the custom cut test tube being loaded into
the bottom assembly of the bubber. The diagonal strip in the image on the left is
the mounting bracket......................................................................................................... 42
5.9. First-Generation CHS Bubbler Design. This figure shows the parts of the bubbler
without the valves. The top assembly is a custom feedthrough with a ¼” FVCR
on one side of a 1.33 Conflat and 1/8” disconnect on the other side (inside the
bubbler headspace, holding the PTFE straw). This bubbler design keeps the CHS
liquid (shown in blue) in a borosilicate container (a test tube flame cut to length)
with a PTFE straw, keeping any metal parts from contacting the liquid, to ensure
long term storage stability of the CHS. Note that the test tube was cut to a length
that ensured that it covered the Conflat seal of the upper and lower assemblies.
This length of test tube prevents any condensed (or splashed from transport or
impacts) CHS from contacting the copper ring gasket of the Conflat fitting before
flowing back into the test tube. ......................................................................................... 43
xii
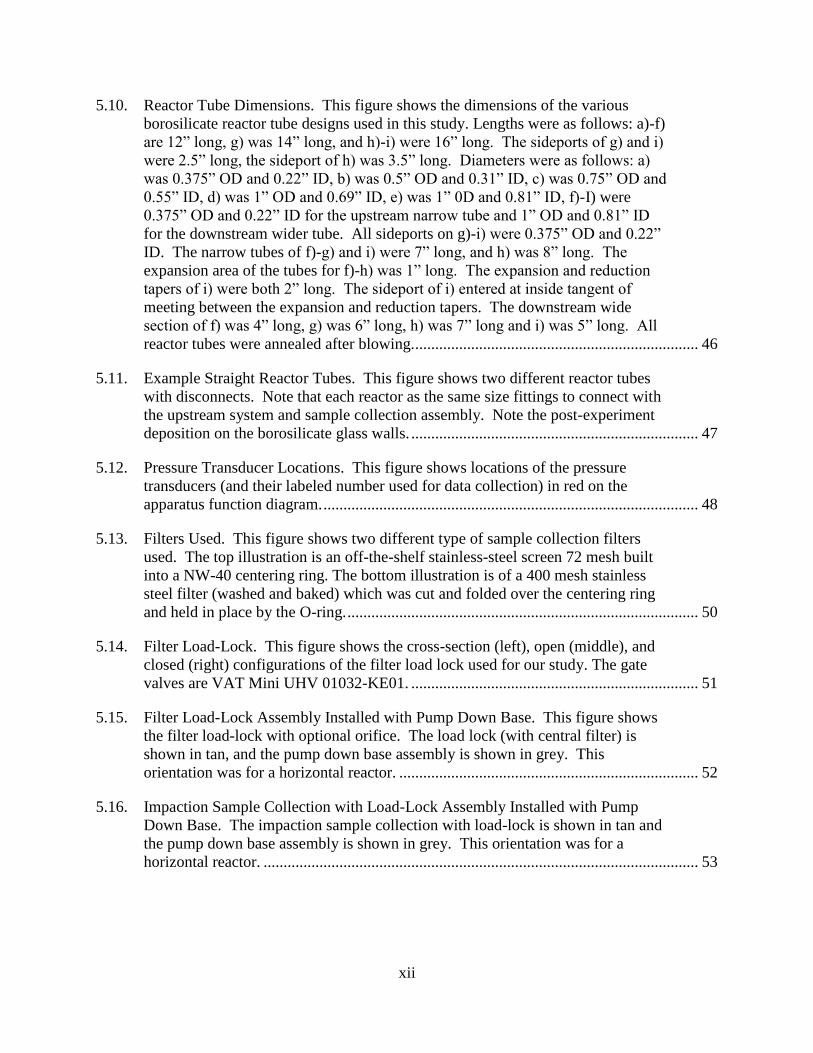
5.10. Reactor Tube Dimensions. This figure shows the dimensions of the various
borosilicate reactor tube designs used in this study. Lengths were as follows: a)-f)
are 12” long, g) was 14” long, and h)-i) were 16” long. The sideports of g) and i)
were 2.5” long, the sideport of h) was 3.5” long. Diameters were as follows: a)
was 0.375” OD and 0.22” ID, b) was 0.5” OD and 0.31” ID, c) was 0.75” OD and
0.55” ID, d) was 1” OD and 0.69” ID, e) was 1” 0D and 0.81” ID, f)-I) were
0.375” OD and 0.22” ID for the upstream narrow tube and 1” OD and 0.81” ID
for the downstream wider tube. All sideports on g)-i) were 0.375” OD and 0.22”
ID. The narrow tubes of f)-g) and i) were 7” long, and h) was 8” long. The
expansion area of the tubes for f)-h) was 1” long. The expansion and reduction
tapers of i) were both 2” long. The sideport of i) entered at inside tangent of
meeting between the expansion and reduction tapers. The downstream wide
section of f) was 4” long, g) was 6” long, h) was 7” long and i) was 5” long. All
reactor tubes were annealed after blowing. ....................................................................... 46
5.11. Example Straight Reactor Tubes. This figure shows two different reactor tubes
with disconnects. Note that each reactor as the same size fittings to connect with
the upstream system and sample collection assembly. Note the post-experiment
deposition on the borosilicate glass walls. ........................................................................ 47
5.12. Pressure Transducer Locations. This figure shows locations of the pressure
transducers (and their labeled number used for data collection) in red on the
apparatus function diagram. .............................................................................................. 48
5.13. Filters Used. This figure shows two different type of sample collection filters
used. The top illustration is an off-the-shelf stainless-steel screen 72 mesh built
into a NW-40 centering ring. The bottom illustration is of a 400 mesh stainless
steel filter (washed and baked) which was cut and folded over the centering ring
and held in place by the O-ring. ........................................................................................ 50
5.14. Filter Load-Lock. This figure shows the cross-section (left), open (middle), and
closed (right) configurations of the filter load lock used for our study. The gate
valves are VAT Mini UHV 01032-KE01. ........................................................................ 51
5.15. Filter Load-Lock Assembly Installed with Pump Down Base. This figure shows
the filter load-lock with optional orifice. The load lock (with central filter) is
shown in tan, and the pump down base assembly is shown in grey. This
orientation was for a horizontal reactor. ........................................................................... 52
5.16. Impaction Sample Collection with Load-Lock Assembly Installed with Pump
Down Base. The impaction sample collection with load-lock is shown in tan and
the pump down base assembly is shown in grey. This orientation was for a
horizontal reactor. ............................................................................................................. 53

xiii
5.17. Examples of 3D printed orifices. This figure shows the side views (top) and slit
view (bottom) of different 3D printed orifices examples. Note that each are
mounted in an NW40-to-NW32 adaptive centering ring, the dimensions of which
were better suited to seat the 3D print. From left to right on the side views (top
image) the sealing method (between the print and ring) used was an O-ring, epoxy
(the reason why the print is discolored), and Teflon tape (which was the easiest to
use and adjust). The Orifice tube is 33 mm diameter with a 38 mm ring to keep
from falling through the centering ring. Inside tube the dimensions taper linearly
into the slit at the end of the tube. ..................................................................................... 55
5.18. Plasma Types. The illustrations show a) diffuse plasma, b) striated, and c)
filamented. Striations have been observed to move downstream in a bucket-
brigade manner, sometimes too fast to observe without motion capture, and
sometimes the striations appeared frozen, depending on conditions. Filamented
plasma were typically observed to rotate rapidly and appeared to be striations that
could not completely fill the tube inner diameter. ............................................................ 58
5.19. Impedance Matching Circuit. The illustration shows component values and
circuit design of the impedance matching circuit. ............................................................ 60
5.20. Frame Sequence of Plasma Piercing the Reactor Tube Wall at High Power (200
W). .................................................................................................................................... 61
5.21. MFC Control Interface. This figure shows the front (left) and the relavane side
(right) views of the MFC control interfaces. Two of these were constructed for
our study, allowing for four independent gas flows (two for each interface). The
DB15 connectors on the side view interface with the MFC. The DB9 connectors
provide DC power to the pressure transducers (which have their own built in
displays). ........................................................................................................................... 65
5.22. RF Generator Control Interface. This figure shows the custom interface for the
Seren R300 13.56 MHz RF generator. On the side was the DB25 connector the
generator. .......................................................................................................................... 66
5.23. Parameter Space Effects and Interactions. The illustrations shows the effects of
increases and decreases controllable parameter values, and their interactions with
other parameters. ............................................................................................................... 68
6.1. XRD of the First Experiment of Demonstration Apparatus. In this XRD plot, at
20 W and 30 W, crystalline planes (111, 220, 311) corresponding to SiNCs were
visible. ............................................................................................................................... 73
6.2. Raman of First Experiment of Demonstration Apparatus. This graph shows a
similar trend to Figure 6.1, with amorphous structures at 10 W and crystalline and
the main ≈521 cm-1 silicon crystallin peak emerging at 20 W and narrowing and
rising at 30 W. ................................................................................................................... 73
xiv
6.3. TEM and Size Histogram of 20 W Sample from the First Experiment of
Demonstration Reactor. .................................................................................................... 74
6.4. TEM and Size Histogram of 30 W Sample from the First Experiment of
Demonstration Apparatus. ................................................................................................ 74
6.5. Mitigating Filamentation in Plasma with Hydrogen. These images show the
plasma at 40 watts power in the demonstration apparatus, a) with only argon as
the carrier gas, and b) with added hydrogen mixed injected via sideport upstream
of the plasma. .................................................................................................................... 75
6.6. Diffuse Plasma with Upstream Sideport Injection of Hydrogen on the
Demonstration Apparatus. ................................................................................................ 76
6.7. Sample Slide (left), XRD Data (middle), and TEM (right) from Upstream
Sideport Injection of Hydrogen on the Demonstration Apparatus. .................................. 76
6.8. Overlapping TEM Images of the Demonstration Apparatus and the First-
Generation NDSU Apparatus. These images are at nearly duplicate conditions
with a) and c) being from the demonstration reactor and b) and d) from the first-
generation NDSU apparatus. The overlapping images are scaled the same. .................... 79
6.9. Overlapping Size Histograms of Nanoparticles from the Demonstration Apparatus
and First-Generation NDSU Apparatus. The Demonstration Apparatus (DA
Experiment 1) and First-Generation NDSU Apparatus (Gen1 Experiment 8) were
both run at 40 sccm argon in the same reactor configuration and pressure. DA
Experiment 1 was at 20 W and 0.08 sccm CHS (calculated) and Gen1 Experiment
8 was at 18 W and 0.044 sccm CHS (calculated). Note the lack of larger sized
outliers with Gen1, likely the result of more stabilized plasma due to slightly
lower wattage and lower CHS. ......................................................................................... 80
6.10. Visible Lattice from the First-Generation NDSU Apparatus Experiment 8 ..................... 81
6.11. Overlapping PL of SiNCs from the Demonstration Apparatus and First-
Generation NDSU Apparatus. .......................................................................................... 82
6.12. Stable (Diffuse) Versus Unstable (Filamented) Plasma. .................................................. 83
6.13. Slow Rotating Filamented Plasma. ................................................................................... 84
6.14. Striated Plasma in Narrow Reactor Tubes. ....................................................................... 84
6.15. Motion Capture Setup Using a Photron FASTCAM Mini. .............................................. 85
xv
6.16. Motion Capture Frame Grabs Showing Plasma Collapse from Diffuse to
Filamented. These images show a sequential motion capture of a 0.69” ID reactor
tube flowing CHS the moment the plasma changed from diffuse to filamented.
The motion capture was performed at 100,000 frames per second and a shutter
speed of 1/200,000th of a second. The sequence shown is from a playback video
with each frame shown at 1/20th second increments........................................................ 85
6.17. Motion Capture Frame Grabs Showing Striated Plasma in Pure Argon at Two
Power Levels. These images show a sequential motion capture of a 0.22” ID
reactor tube flowing pure argon at 40 sccm with plasma power at 5W (left) and
30W (right). Each vertically stacked image is from subsequent frame grabs
showing the motion of the globules. On the left the globules move downstream,
while at the higher power level on the right the globules were stationary but a
daughter globule would exit and flow into the downstream globule at a pattern
that could be changed by changing power level or flow. We found we could also
tune the flow and power to find a condition where the globules were static. ................... 86
7.1. Striated Plasma Example. This figure shows the striated plasma for 60 sccm
argon, 0.08 CHS (calculated0, 30 watts, 0.31” I.D. straight reactor tube with the
RF electrode 6 cm from the downstream disconnect. ....................................................... 90
7.2. TEM Images of Polycrystalline Silicon Nanoparticles Synthesize with Striated
Plasma. The three images on the left side are from the 40 sccm experiment, while
the right side images are 60 sccm. Primary particle lattices consistent with SiNCs
were easily visible on most clustered “raspberries”. ........................................................ 91
7.3. TEM Images of Highly Monodisperse Polycrystalline Silicon Nanoparticles
Synthesized with Striated Plasma. .................................................................................... 92
7.4. Striated Plasma Size Effects. This figure shows the size distribution (from TEM
images) of three samples of silicon nanoparticle synthesis through striated plasma.
R6S1 and R7S2 shown in the graph were synthesized using a 0.31” I.D. straight
reactor tube across differing flow rates of argon (40 sccm for R6S1, 60 sccm for
R7S2), with the RF electrode 6 cm from the downstream disconnect. R15S1
shown in the graph is from a 0.22” I.D. straight reactor tube at 40 sccm argon
with the RF electrode 2.54 cm from the downstream disconnect. All three samples
had 0.08 sccm CHS (calculated), and 30 watts. R7S2 was smaller than R6S1 (the
only change was argon flow) because of higher carrier gas flow. R15S1 was
smaller than R7S1, even though they had same flow rate, but the higher velocity
from the narrow tube, and the shorter plasma distance on R15S1 resulted in
smaller nanoparticles. Note the low polydispersity, especially for R15S1. R15S1
also showed other morphologies (“blueberry muffins” described below) due to
conditions unintentionally changing during the experiment. ............................................ 93
7.5. TEM Image of Amorphous Cluster Containing Small Putative SiNCs. ........................... 94
7.6. Sideport 2.1 Reactor Tube Dimensions .......................................................................... 100
xvi
7.7. Typical Sideport 2.1 Plasma. .......................................................................................... 101
7.8. Typical Deposition on a Reactor Tube After 30-60 minutes of Synthesis. .................... 101
7.9. Carrier Gas Flow Versus Size. ........................................................................................ 102
7.10. Carrier Gas Flow Versus Size, CHS Versus Silane, Our Study with Jurbergs. .............. 104
7.11. Electrode Spacing Effects on PL/Size Experiment. Electrode spacing is varied
with all other parameters locked. White font is sample number with measured
peak PL and QY (quantum yield is discussed in a later chapter). .................................. 107
8.1. Filter Collection Across SiNC Size Range. .................................................................... 110
8.2. Filter Collection Across SiNC Size Range. .................................................................... 111
8.3. Time to Fill the Filter and Flow, Versus SiNC Size. ...................................................... 112
8.4. Deposition Versus SiNC Size. ........................................................................................ 113
8.5. Successful Filter Collection for 900 nm SiNCs Using 72 Mesh Centering Ring. .......... 115
8.6. Impaction Sample Collection Through Viewport. .......................................................... 116
8.7. Impaction Sample Collection Efficiency Examples. These images show typical
examples of some challenges with impaction sample collection. In image a) some
minor orifice clogging can be seen in stutters in the sample line. In image b) the
orifice was not at 90o from the slide direction so there is some angle (not an issue
until this is extreme), but a small clog developed half way through the
experiment, as seen by the v-shaped stutter in the line and the streak in the lines
above this (samples were deposited from the bottom up). In image c) the distance
between the orifice and the slide was too far away for this attempt to raster a
uniform layer of SiNCs on the slide. In image d) the SiNCs were too small (or the
pressure drop across the orifice insufficient) and many attempts to deposit a
sample line failed (red numbers) and those attempts the succeeded (green
numbers) yielded very thin samples. .............................................................................. 117
9.1. Sample Collection and Hydrosilylation Method............................................................. 120
9.2. Scatter Plot of PLQY of As-Passivated SiNCs. .............................................................. 122
9.3. Scatter Plot of PLQY of DGU Purified SiNCs. .............................................................. 123
9.4. Visible PL. ...................................................................................................................... 124
9.5. Quantum Yield Versus Concentration. ........................................................................... 125
9.6. Comparative PLQY Across Groups (NDSU Used Additional Spectral Correction
for Mesitylene NIR Absorbance). ................................................................................... 126

xvii
9.7. Passivation Time Versus QY. ......................................................................................... 127
9.8. PL Blue Shift with Passivation Time. The graph on the left is from 3 runs with
identical conditions. The graph on the right is all 5 runs with arrows connecting
the twin samples which were taken from one run (each instance of 5 spit samples
saw a blue shift in PL from longer passivation time). .................................................... 128
9.9. Hydrogen Injection Versus PLQY. ................................................................................. 129
9.10. Blue Light Passivation Experiment. The image on the left shows the overhead
view of the placement of the lamp (the compressed air cooling hose is visible in
the lower right). The image in the middle shows low level visible PL under
excitation. The four images on the right-hand side show the PL and solution
clarity at 19 and 48 hours for Run 117. .......................................................................... 131
9.11. Effects of Gas Purity on PLQY. This graph shows the PL vs. QY differences
between Industrial grade Ar/H2 95/5 gas with an estimated O2 content of <4 ppm
and Research grade Ar/H2 95/5 with O2 content <0.5 ppm (but used research
grade side-port injected hydrogen). Most (75%) of the 12 samples with research
grade carrier gas established new QY maximums for the respective PL. ...................... 134
10.1. Vortex Tube Design. ....................................................................................................... 136
10.2. Double Co-ax Design. ..................................................................................................... 137
10.3. Double Co-ax Plasma. .................................................................................................... 137
11.1. Magnetic Plasma Confinement. ...................................................................................... 140
xviii
LIST OF ABBREVIATIONS
CHS ................................................................Cyclohexasilane
DC ..................................................................Direct Current
DGU ...............................................................Density Gradient Ultracentrifugation
eV ...................................................................Electron Volt
FCC ................................................................Federal Communication Commission
FTIR ...............................................................Fourier Transform Infrared Spectroscopy
GCMS ............................................................Gas Chromatography-Mass Spectrometry
HRTEM..........................................................High Resolution Transmission Electron Microscopy
ICP-AES ........................................................Inductively Coupled Plasma Atomic Emission
Spectroscopy
LED ................................................................Light Emitting Diode
MHz ...............................................................Megahertz
MFC ...............................................................Mass Flow Controller
NDSU .............................................................North Dakota State University
NIR .................................................................Near-Infrared
OML ...............................................................Orbital Motion Limited
PL ...................................................................Photoluminescence
PLQY .............................................................Photoluminescence Quantum Yield
PTFE ..............................................................Polytetrafluoroethylene
QY ..................................................................Quantum Yield
RF ...................................................................Radio Frequency
SCCM ............................................................Standard Cubic Centimeters per Minute
SiNC ...............................................................Silicon Nanocrystal

xix
SOP ................................................................Standard Operating Procedure
UMN ..............................................................University of Minnesota
UV ..................................................................Ultraviolet
VP ..................................................................Vapor Pressure
XRD ...............................................................X-Ray Diffraction
1
CHAPTER 1. OVERVIEW OF THE STUDY
1.1. Purpose of the Study
The first objective of this study was to establish, at NDSU, the capability to produce high
quality photoluminescent silicon nanocrystals (SiNCs) to support the needs of NDSU researchers
and their collaborative partners. Prior sourcing for, or synthesis of, SiNCs to support past efforts
in our group, and other groups at NDSU, have included SiNCs produced via synthesis methods
including thermal [1], solid phase with etching [2], and non-thermal plasma synthesis from the
Kortshagen group at the University of Minnesota [3]. We made the decision to pursue non-
thermal plasma synthesis because SiNCs produced by this method from the Kortshagen group
(who pioneered the method) had proven suitable for our group’s ongoing size purification and
photophysics studies [4], [5], [6], [7], [8], [9], [10] and self-assembly studies [11], [12], [13] as
well as future ambitions of the group.
A second objective was to establish the process conditions for producing high quality
photoluminescent SiNCs using non-thermal plasma synthesis with cyclohexasilane (CHS) as a
precursor. The synthesis of practical volumes of high purity CHS was pioneered at NDSU by
the Boudjouk group [14], [15]. The properties and unique chemistries of CHS have been studied
[16], [17] and potential applications have been examined [1], [18], [19], [20] for about two
decades, but prior to our study CHS had not been used as a precursor for non-thermal plasma
synthesis.
Our third objective was to map out the territory encountered while achieving the first and
second objectives, and perform preliminary studies for future exploration. Many of our
preliminary studies were born from experiments to overcome process instabilities and
limitations. Non-thermal plasma synthesis was not a capability at NDSU at the start of our
2
study, and very little is published describing the detailed apparatus assemblies or outlining the
fine resolution processing conditions (and inevitable trade-offs within the parameter space), and
it was not known what new challenges would be encountered with CHS as a precursor. The
Kortshagen group was instrumental in getting us started in non-thermal plasma synthesis, and the
knowledge sharing ethos they demonstrated with us is a great example scientific collaboration.
But a “recipe book” of proven running conditions for CHS as a precursor did not exist, and a
proven recipe for silane did not initially produce stable plasma with CHS. Because of our lack of
domain knowledge in the space, we attempted a first principles approach where we could, but
often, because of the complexity of these so-called “dusty” plasmas [21] and the entanglement of
confounding variables, we often had to derive the running conditions empirically, learning many
lessons from the school of hard knocks along the way.
The last objective was that this dissertation would be constructed to serve as a coherent
and comprehensive reference manual for future researchers using CHS as a precursor in non-
thermal plasma synthesis applications. For this reason, the dissertation is lighter on background
information that can be readily gleaned by following the references, in order to make room for an
abundance of practical observations and tips that were learned during this study.
1.2. Scope of the Study
The objectives of the study (stated above) defined the scope, with out-of-scope areas
defined by safety considerations, lack of domain knowledge, or lack of characterization
instruments. Detailed “apples to apples” comparisons of silane versus CHS was not possible
because of the lack of administrative and engineering controls to handle gas tanks of pyrophoric
silane. We recognize that performing dual experiments across a large parameter space,
comparing CHS to silane, could help to elucidate more details of the reaction kinetics, including
3
nucleation and growth of both precursors, by exploring their differences. Also out of scope due
to safety considerations, was the incorporation of toxic dopants. While many aspects of plasma
stability were explored empirically in our study, modeling the complex plasma environment was
beyond our domain knowledge. Molecular modeling of CHS has been pursued by the Kilin
group at NDSU [22], but extension of this modeling work to the kinetics of plasma will have to
wait for a later date. One challenge to our studies was not having FTIR inside an “air free” glove
box at NDSU, which limited the scope of our explorations of surface chemistries of the SiNCs
prior to passivation. While we did utilize “air free” FTIR at the University of Minnesota on a
few occasions, future researchers are strongly encouraged to have this capacity before embarking
on similar studies.
1.3. Collaboration
This study was part of a larger joint effort between three groups at two Universities. The
Hobbie group (NDSU), which includes the author, performed the bulk of the activity outlined in
this dissertation, with the Boudjouk group (NDSU) synthesizing the CHS, and the Kortshagen
group lending their support for the first runs of CHS-synthesized SiNCs in a temporary
“demonstration” reactor we assembled at the University of Minnesota.
4
CHAPTER 2. NON-THERMAL PLASMA SYNTHESIS BACKGROUND
2.1. Non-Thermal Plasma Synthesis of Silicon Nanocrystals Development
Canham first reported dim red photoluminescence of silicon in 1990 from a top-down
(from bulk to nanostructured) electrochemical etching process to produce porous silicon [23].
Silicon structures exhibiting quantum confinement [24] are typically manifest as either 1)
nanostructured silicon (through top-down etching processes from bulk [23] or epitaxial bottom-
up methods), 2) silicon nanocrystals (SiNCs) embedded in a dielectric matrix typically through
additive deposition of silicon onto silicon oxide [25], [26], silicon nitride [27], [28], [29], or
silicon carbide [30], [31], [32], or 3) freestanding SiNCs through various top-down and bottom-
up, dry and wet, methods including thermal decompositions of silane (via tube furnace [33], or
parallel plate [34]), laser pyrolysis of silane [35], [36], [37], ablation of bulk silicon [38], [39],
liquid synthesis [40], [41], [42], dry synthesis [2], [43], [44] and non-thermal plasma synthesis
[3].
The first successful intentional production of practical quantities of high quality
photoluminescent freestanding SiNCs via non-thermal plasma synthesis was achieved by
Mangolini [3] in the Kortshagen group at the University of Minnesota in 2005. This achievement
built upon the work of others, many who initially were investigating the unwanted growth of
nanopowder induced film defects in silane plasma vapor depositions processes. The Bouchoule
and Boufendi group made significant contributions to the study of the kinetics of silicon
nanoparticle growth in non-thermal plasma [45], [46], [47], [48]. The groups of Hollenstien [49],
[50], [51], Shiratani and Watanabe [52], and others contributed to the debate about nucleation
and growth. The groups of Fridman [53], Girshick , Kortshagen, Bhandarkar contributed
numerical and theoretical modeling, including chemical and aerosol models [54], [55], [56], [57].

5
The group of Cabarrocas [58], [59], [60], Oda [61], [62], [63], Kortshagen , [64], [65], [66] and
Tageki [67], studied the plasma synthesis of silicon nanoparticles, setting the stage for
Mangolini’s work [3].
Mangolini, Jurbergs, along with others in the Kortshagen group, extended this work to
include alkylation passivation to boost quantum yield and establish a stable colloid [68], [69],
[70]. Anthony [71], and others in the Kortshagen group [72] showed that hydrogen on the SiNC
surface prior to alkylation improved quantum yields. Anthony et al [73] and Jariwala et al [74]
explored amorphous to crystalline transitions and their surface properties. Mangolini and
Kortshagen also explored the heating of the nanoparticles [75], as well as demonstrating a two-
stage plasma reactor wherein the second stage grafted organic monomer to the SiNC surface (in-
flight passivation) [76]. Gresback et al demonstrated silicon tetrachloride (SiCl4) as a liquid
precursor alternative to silane [77]. Sykora et al [78], Hannah et al [79], and Beard et al [80],
contributed to the “core versus surface” debate on the origin of photoluminescence. Synthesis
has extended to microwave plasma [81], [82] and DC microplasmas [83]. As already mentioned,
the Hobbie group has contributed size purification and photophysics studies [4], [5], [6], [7], [8],
and self-assembly studies [11], [12]. The Kortshagen and Mangolini groups continue to extend
this field to include in situ monitoring [84], doping [72], other inorganic and metal nanoparticles
[85], [86], [87], [88], and core-shell and novel nanostructures [89], [90], [91], [92], [93].
Excellent sources for researchers exploring this area include Kortshagen’s review of non-
thermal plasma synthesis of nanocrystals [94] and SiNCs [95], Mangolini’s review of the
synthesis, properties, and applications of SiNCs [96], Magnolini’s and Kortshagan’s chapter on
non-thermal plasma synthesis of SiNCs in the book Silicon Nanocrystals [97], Watanabe’s

6
review of microplasma synthesis [98], and Mangolini’s review of monitoring of non-thermal
plasma synthesis [99].
2.2. Non-Thermal Plasma and Nanoparticle Growth
Non-thermal plasmas are at thermodynamic non-equilibrium, which is to say that the
temperatures (manifested as velocity) of the differing species in the plasma are not represented
by the same Maxwell-Boltzmann velocity distribution. Non-thermal plasmas often have low
levels of overall ionization (often on the order of a few percent or lower ionization of the main
gas phase), and typically only involve the stripping of the outermost electron in the creation of
ions. In a non-thermal plasma of a homogenous starting gas, the temperatures of liberated
electrons are higher than the more massive ions. Given the low levels of overall ionization, a
non-thermal plasma of a homogenous noble gas phase can be conceptualized as the bulk of the
neutral gas at ambient temperature, with a low level of ions at temperatures at or around ambient,
and including high temperature (high velocity) free electrons corresponding in concentration to
the level of ions.
The plasma environments of this study are non-thermal plasmas as described above, but
they are not simply plasmas of homogenous noble gasses. Most of the experiments in this study
involved argon, hydrogen, the CHS precursor, and the myriad of reactants, products and by-
products of the SiNC synthesis reaction. The net effect of this heterogeneity in the plasma
renders significant complexity to the process, hindering our ability to understand and potentially
model the reactions. We will break down some of these complexities, starting with an overview
of the constituents in the plasma.
Argon in the plasma can be neutral or ionized (having lost a single electron), with neither
species considered to be at high temperature compared to the high velocity free electron species.
7
Hydrogen enters the plasma as a stable gas molecule of H2 with an ionization energy of 13.6 eV,
which is lower than argon’s 15.8 eV. Energetic collisions in the plasma can impart multiple
vibrational modes in the molecular hydrogen bond, collisions can also create full dissociation of
the bond including the creation of free protons. The hydrogen dissociation can quickly become
re-combination back to H2, and the imparted vibrational modes of the H2 molecular bond can rob
the plasma of significant energy that might otherwise contribute to further ionization. Helium,
which has a higher ionization energy level than argon at 24.6 eV, has been used in some studies
[3] and can rob, or “quench”, energy from the plasma, and like argon, but unlike hydrogen,
helium does not participate in the synthesis reaction (helium was not used in our study).
The complexity of the plasma increases by the addition of precursor vapor. Previous
studies, already mentioned, of non-thermal plasma synthesis of SiNCs involved silane or silicon
tetrachloride [77], [100], as precursors, including efforts to model the reaction kinetics [53], [54],
[55], [56], [57]. Modeling of CHS [22] and experiments in film formation [18], [101] indicate a
likelihood of a ring-opening polymerization mechanism that differs from silane’s putative
progression from precursor to proto-particle. The vibrational modes of CHS’s ring structure
would interact with the plasma differently than the tetrahedral structure of silane, resulting in
different average time to the first bond cleavages of each precursor. CHS has an activation
energy of 0.3 eV compared to 1.62-2.5 eV for silane [101], making CHS less stable to collisions
in the plasma. Film formation studies of CHS found deposition rates much higher and at lower
temperatures than silane, and other hydrosilanes smaller than CHS [18], [101]. CHS in non-
thermal plasma likely polymerizes through a progression of networked hydrosilanes, proto-
particles, silicon nanoparticles and finally SiNCs. During this process, as with silane as a
precursor, hydrogen is expected to be pushed to the surface of the growing particles and the
8
surplus hydrogen is abstracted, increasing the concentration of H2 (and its dissociated species) in
the plasma.
The genesis of particles in the plasma introduces another layer of complexity, especially
as these particles grow larger than 1 nm [102], at which point the particles begin robbing the
plasma of electrons (as the large particles start keeping some of the colliding electrons) and net
negative charge builds up on the particles [103], [104], [105]. These charged particles repel each
other, giving the plasma a kind of hierarchical electrostatic interaction where the ions and
electrons attempt to orbit their opposites while being repulsed by their own kind, and
simultaneously on a larger length scale the charged particles push against each to other, and of
course the layers hierarchy interact as well, where the ions are attracted to the negatively charged
particles and the free electrons are repelled. To make things even more complex, as the proto-
particles are forming they go through stochastically determined phases of positive, neutral, and
negative charge, until they reach a size where the collection of electrons dominate [102].
The same phenomenon of net negative charge accumulation on the surface of growing
particles also applies to the walls of the reactor vessel forming, what is referred to as the plasma
sheath. The plasma reactors are typically made of borosilicate glass (as in our study) or quartz if
higher temperatures are needed due to power level requirements, but many dielectric materials
could be used provided they can withstand the pressure, temperature and plasma environment
without undesired contaminative ablations from plasma etching (alumina has been used, for
instance, if transparency is not a requirement). The sheath forms as high velocity electrons strike
the reactor walls and accumulate leaving a dark region of ions proximate to the walls. Some ions
collide with the reactor walls, recombining with electrons, and some free electrons heading
toward the reactor walls are redirected or recombine due to collisions along the way, but the net
9
effect is that more small and fast electron reach the walls than ions do (at equilibrium). The
accumulated charge of the sheath is self-repellant and an equilibrium charge level is established
where no net new electrons make it to the sheath (unless conditions change, such as power levels
driving the plasma increasing).
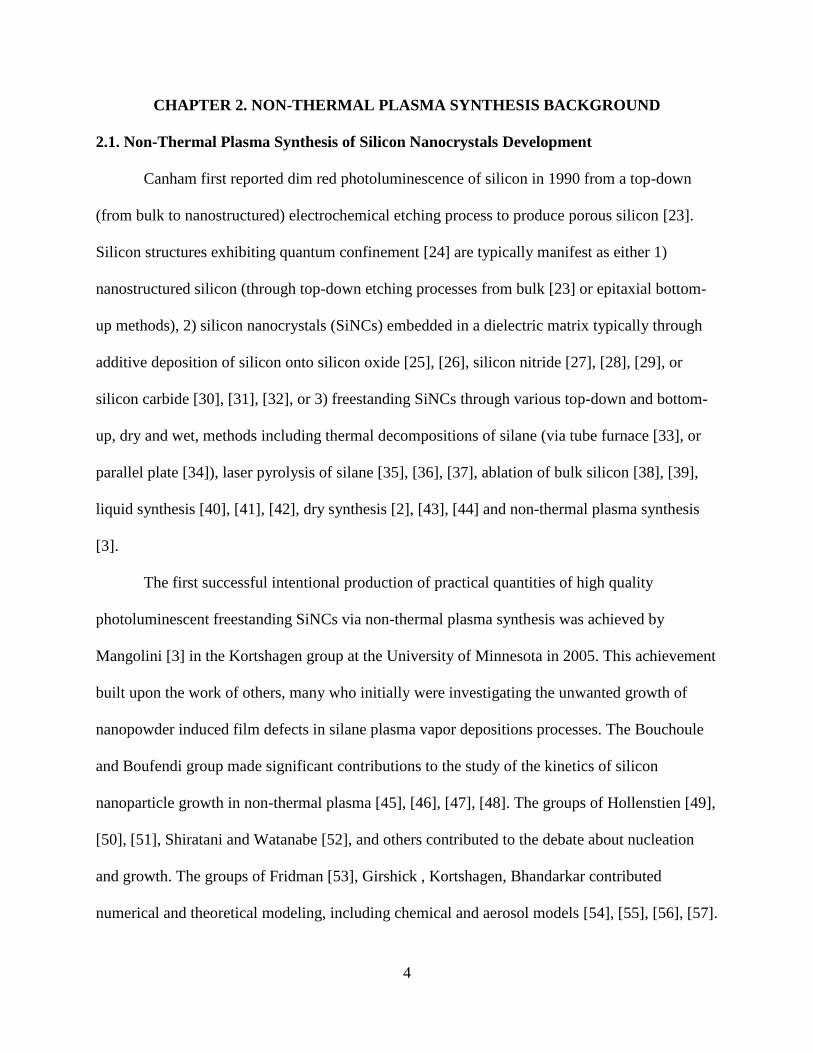
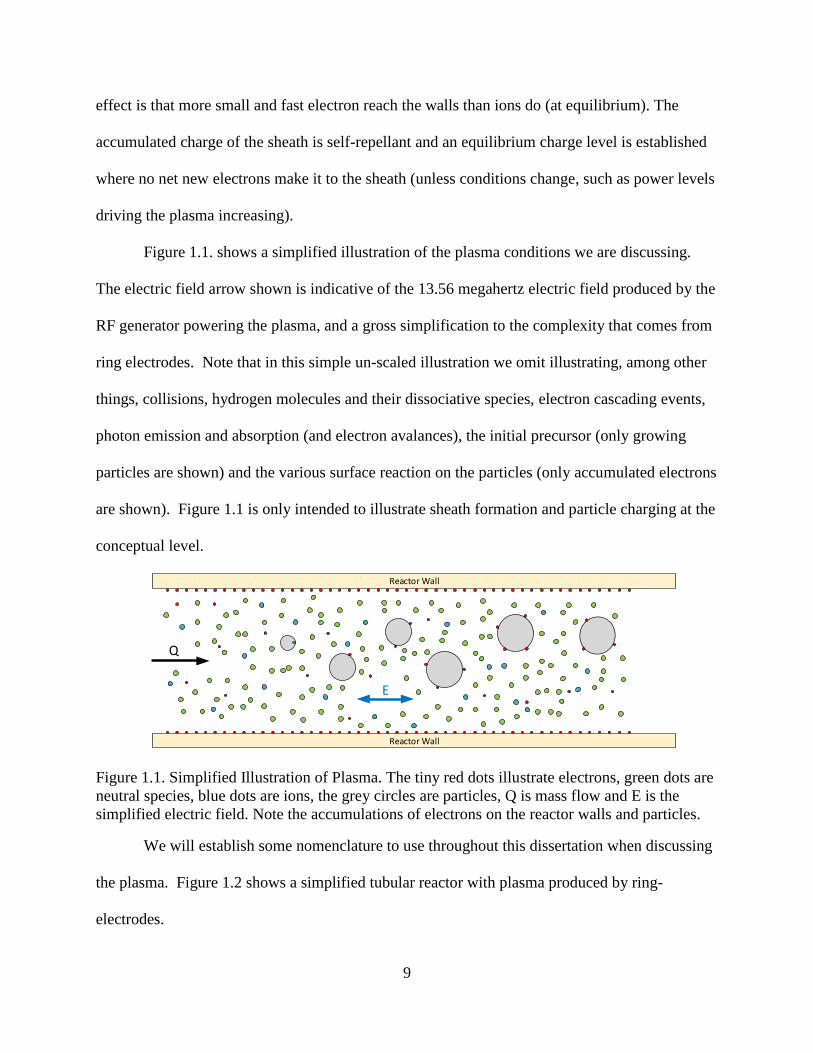
Figure 1.1. shows a simplified illustration of the plasma conditions we are discussing.
The electric field arrow shown is indicative of the 13.56 megahertz electric field produced by the
RF generator powering the plasma, and a gross simplification to the complexity that comes from
ring electrodes. Note that in this simple un-scaled illustration we omit illustrating, among other
things, collisions, hydrogen molecules and their dissociative species, electron cascading events,
photon emission and absorption (and electron avalances), the initial precursor (only growing
particles are shown) and the various surface reaction on the particles (only accumulated electrons
are shown). Figure 1.1 is only intended to illustrate sheath formation and particle charging at the
conceptual level.
Q
E
Reactor Wall
Reactor Wall
Figure 1.1. Simplified Illustration of Plasma. The tiny red dots illustrate electrons, green dots are
neutral species, blue dots are ions, the grey circles are particles, Q is mass flow and E is the
simplified electric field. Note the accumulations of electrons on the reactor walls and particles.
We will establish some nomenclature to use throughout this dissertation when discussing
the plasma. Figure 1.2 shows a simplified tubular reactor with plasma produced by ring-
electrodes.
10
d)
Q
RF
Reactor Wall
Reactor Wall
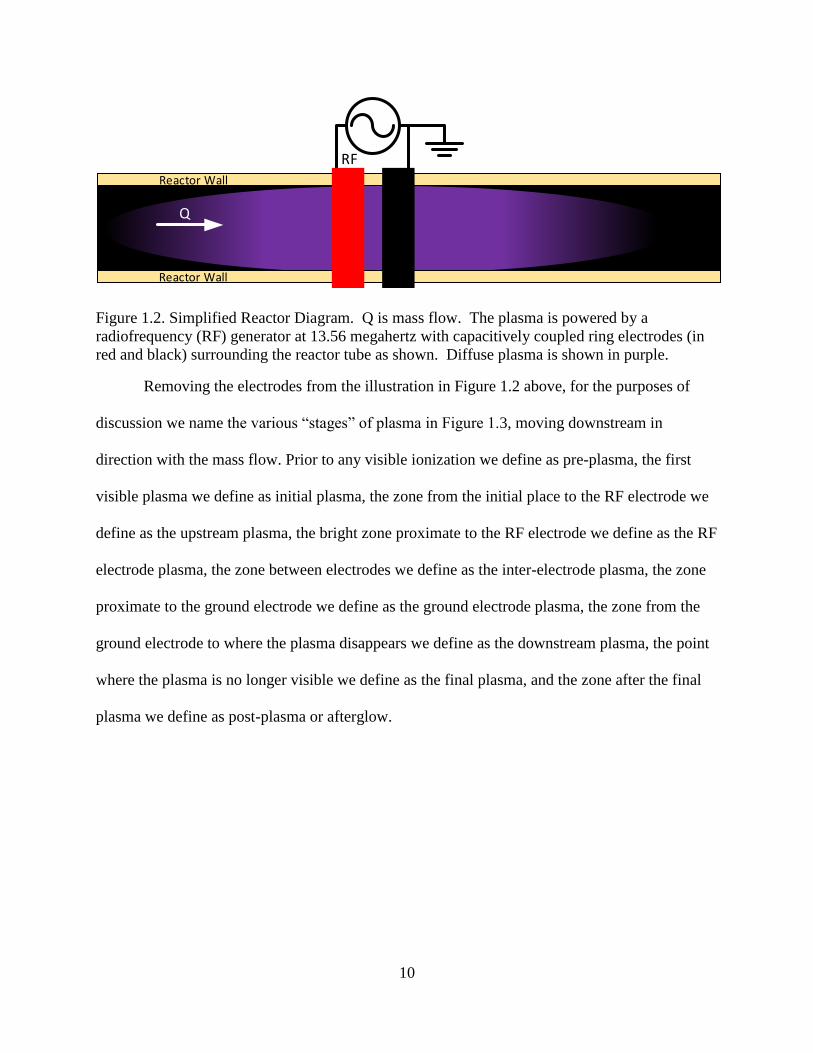
Figure 1.2. Simplified Reactor Diagram. Q is mass flow. The plasma is powered by a
radiofrequency (RF) generator at 13.56 megahertz with capacitively coupled ring electrodes (in
red and black) surrounding the reactor tube as shown. Diffuse plasma is shown in purple.
Removing the electrodes from the illustration in Figure 1.2 above, for the purposes of
discussion we name the various “stages” of plasma in Figure 1.3, moving downstream in
direction with the mass flow. Prior to any visible ionization we define as pre-plasma, the first
visible plasma we define as initial plasma, the zone from the initial place to the RF electrode we
define as the upstream plasma, the bright zone proximate to the RF electrode we define as the RF
electrode plasma, the zone between electrodes we define as the inter-electrode plasma, the zone
proximate to the ground electrode we define as the ground electrode plasma, the zone from the
ground electrode to where the plasma disappears we define as the downstream plasma, the point
where the plasma is no longer visible we define as the final plasma, and the zone after the final
plasma we define as post-plasma or afterglow.
11
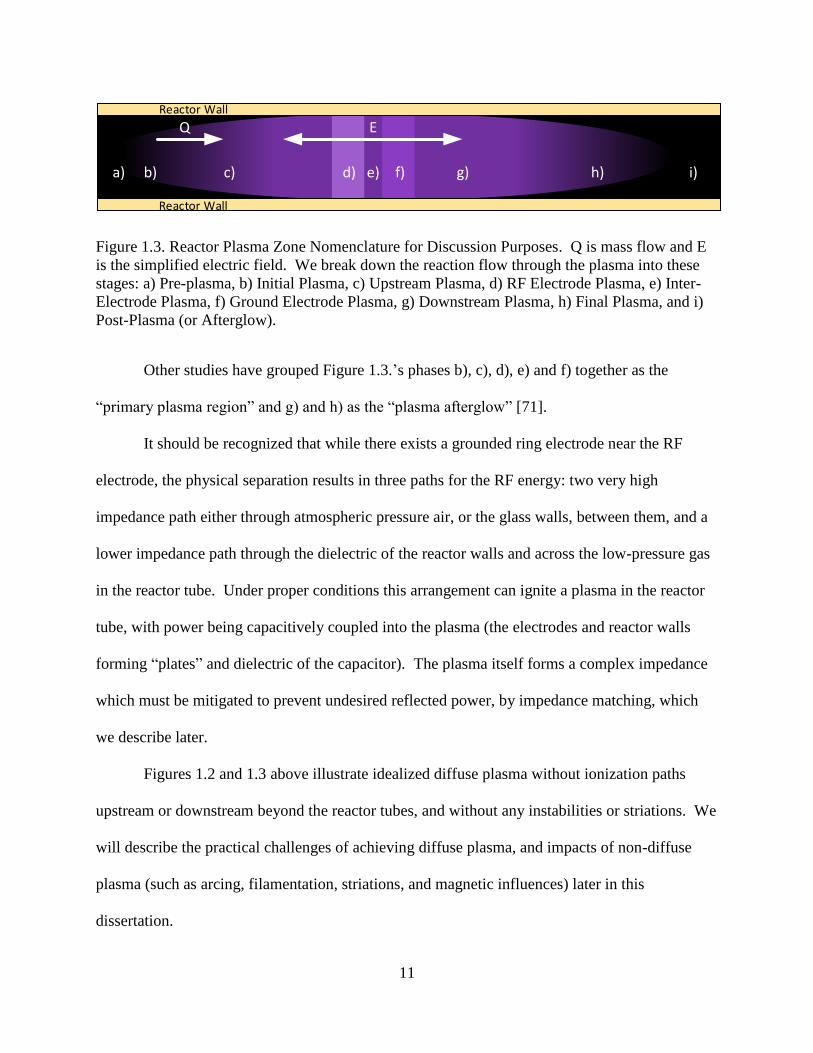
a) b) c) d) e) f) g) h) i)
Reactor Wall
Reactor Wall
Q E
Figure 1.3. Reactor Plasma Zone Nomenclature for Discussion Purposes. Q is mass flow and E
is the simplified electric field. We break down the reaction flow through the plasma into these
stages: a) Pre-plasma, b) Initial Plasma, c) Upstream Plasma, d) RF Electrode Plasma, e) Inter-
Electrode Plasma, f) Ground Electrode Plasma, g) Downstream Plasma, h) Final Plasma, and i)
Post-Plasma (or Afterglow).
Other studies have grouped Figure 1.3.’s phases b), c), d), e) and f) together as the
“primary plasma region” and g) and h) as the “plasma afterglow” [71].
It should be recognized that while there exists a grounded ring electrode near the RF
electrode, the physical separation results in three paths for the RF energy: two very high
impedance path either through atmospheric pressure air, or the glass walls, between them, and a
lower impedance path through the dielectric of the reactor walls and across the low-pressure gas
in the reactor tube. Under proper conditions this arrangement can ignite a plasma in the reactor
tube, with power being capacitively coupled into the plasma (the electrodes and reactor walls
forming “plates” and dielectric of the capacitor). The plasma itself forms a complex impedance
which must be mitigated to prevent undesired reflected power, by impedance matching, which
we describe later.
Figures 1.2 and 1.3 above illustrate idealized diffuse plasma without ionization paths
upstream or downstream beyond the reactor tubes, and without any instabilities or striations. We
will describe the practical challenges of achieving diffuse plasma, and impacts of non-diffuse
plasma (such as arcing, filamentation, striations, and magnetic influences) later in this
dissertation.
12
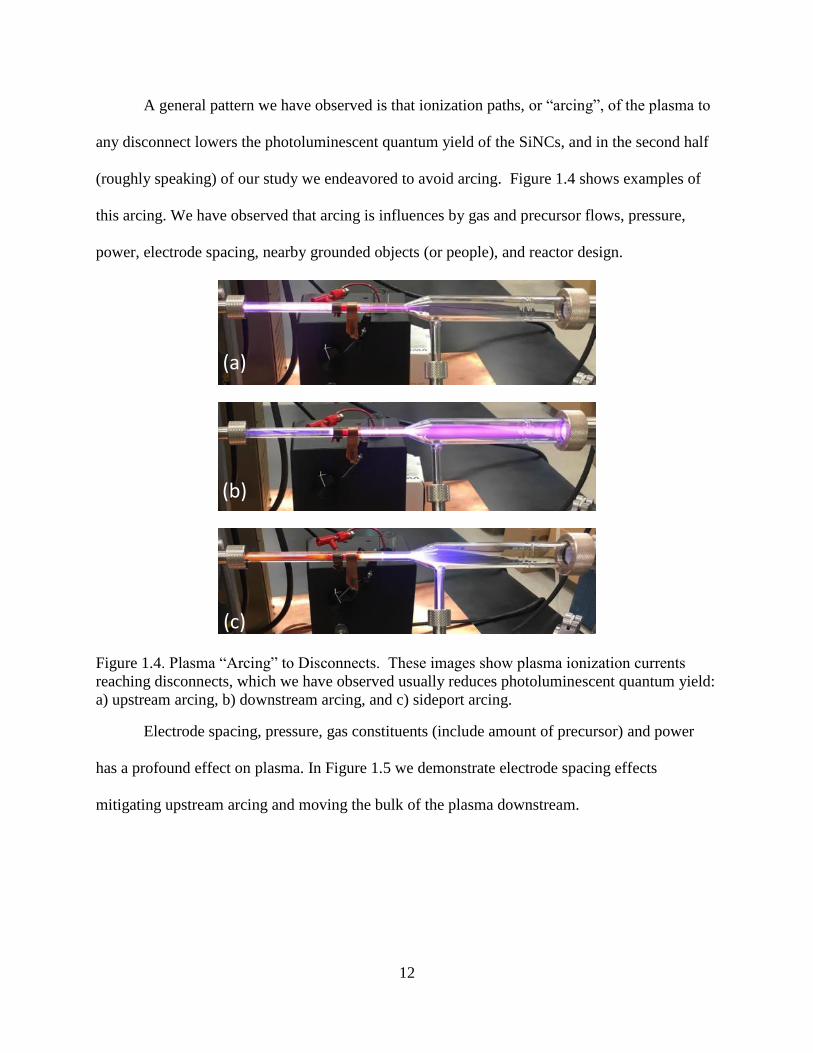
A general pattern we have observed is that ionization paths, or “arcing”, of the plasma to
any disconnect lowers the photoluminescent quantum yield of the SiNCs, and in the second half
(roughly speaking) of our study we endeavored to avoid arcing. Figure 1.4 shows examples of
this arcing. We have observed that arcing is influences by gas and precursor flows, pressure,
power, electrode spacing, nearby grounded objects (or people), and reactor design.
(a)
(b)
(c)
Figure 1.4. Plasma “Arcing” to Disconnects. These images show plasma ionization currents
reaching disconnects, which we have observed usually reduces photoluminescent quantum yield:
a) upstream arcing, b) downstream arcing, and c) sideport arcing.
Electrode spacing, pressure, gas constituents (include amount of precursor) and power
has a profound effect on plasma. In Figure 1.5 we demonstrate electrode spacing effects
mitigating upstream arcing and moving the bulk of the plasma downstream.
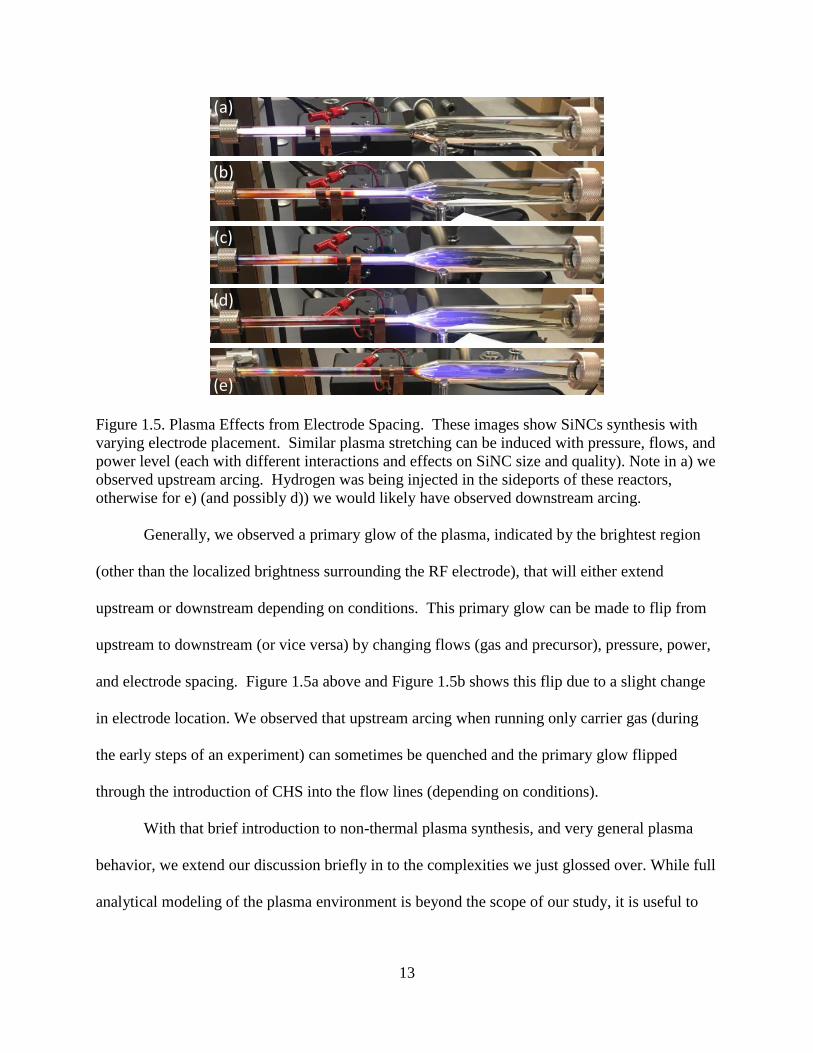
13
(a)
(b)
(c)
(d)
(e)
Figure 1.5. Plasma Effects from Electrode Spacing. These images show SiNCs synthesis with
varying electrode placement. Similar plasma stretching can be induced with pressure, flows, and
power level (each with different interactions and effects on SiNC size and quality). Note in a) we
observed upstream arcing. Hydrogen was being injected in the sideports of these reactors,
otherwise for e) (and possibly d)) we would likely have observed downstream arcing.
Generally, we observed a primary glow of the plasma, indicated by the brightest region
(other than the localized brightness surrounding the RF electrode), that will either extend
upstream or downstream depending on conditions. This primary glow can be made to flip from
upstream to downstream (or vice versa) by changing flows (gas and precursor), pressure, power,
and electrode spacing. Figure 1.5a above and Figure 1.5b shows this flip due to a slight change
in electrode location. We observed that upstream arcing when running only carrier gas (during
the early steps of an experiment) can sometimes be quenched and the primary glow flipped
through the introduction of CHS into the flow lines (depending on conditions).
With that brief introduction to non-thermal plasma synthesis, and very general plasma
behavior, we extend our discussion briefly in to the complexities we just glossed over. While full
analytical modeling of the plasma environment is beyond the scope of our study, it is useful to
14
have a cursory understanding of the underlying complexities that vex researches studying
complex plasma.
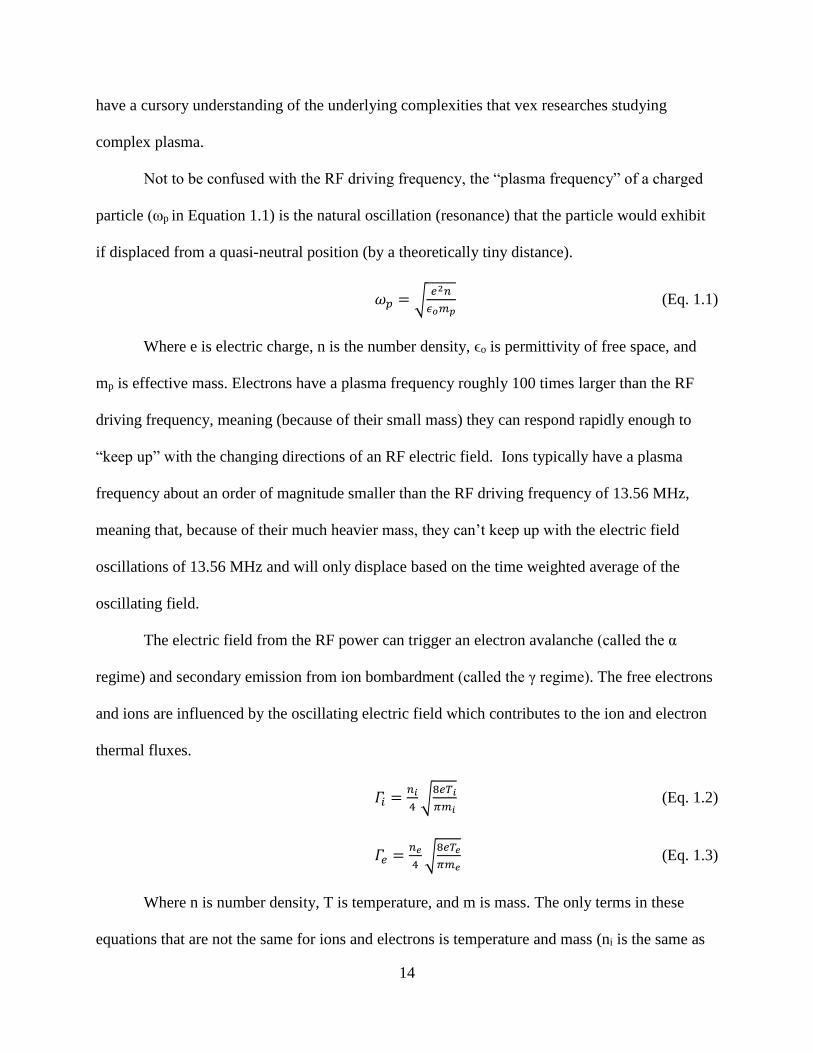
Not to be confused with the RF driving frequency, the “plasma frequency” of a charged
particle (ωp in Equation 1.1) is the natural oscillation (resonance) that the particle would exhibit
if displaced from a quasi-neutral position (by a theoretically tiny distance).
𝜔𝑝 = √𝑒2𝑛
𝜖𝑜𝑚𝑝 (Eq. 1.1)
Where e is electric charge, n is the number density, ϵo is permittivity of free space, and
mp is effective mass. Electrons have a plasma frequency roughly 100 times larger than the RF
driving frequency, meaning (because of their small mass) they can respond rapidly enough to
“keep up” with the changing directions of an RF electric field. Ions typically have a plasma
frequency about an order of magnitude smaller than the RF driving frequency of 13.56 MHz,
meaning that, because of their much heavier mass, they can’t keep up with the electric field
oscillations of 13.56 MHz and will only displace based on the time weighted average of the
oscillating field.
The electric field from the RF power can trigger an electron avalanche (called the α
regime) and secondary emission from ion bombardment (called the γ regime). The free electrons
and ions are influenced by the oscillating electric field which contributes to the ion and electron
thermal fluxes.
𝛤𝑖 =𝑛𝑖
4√8𝑒𝑇𝑖
𝜋𝑚𝑖 (Eq. 1.2)
𝛤𝑒 =𝑛𝑒
4√8𝑒𝑇𝑒
𝜋𝑚𝑒 (Eq. 1.3)
Where n is number density, T is temperature, and m is mass. The only terms in these
equations that are not the same for ions and electrons is temperature and mass (ni is the same as
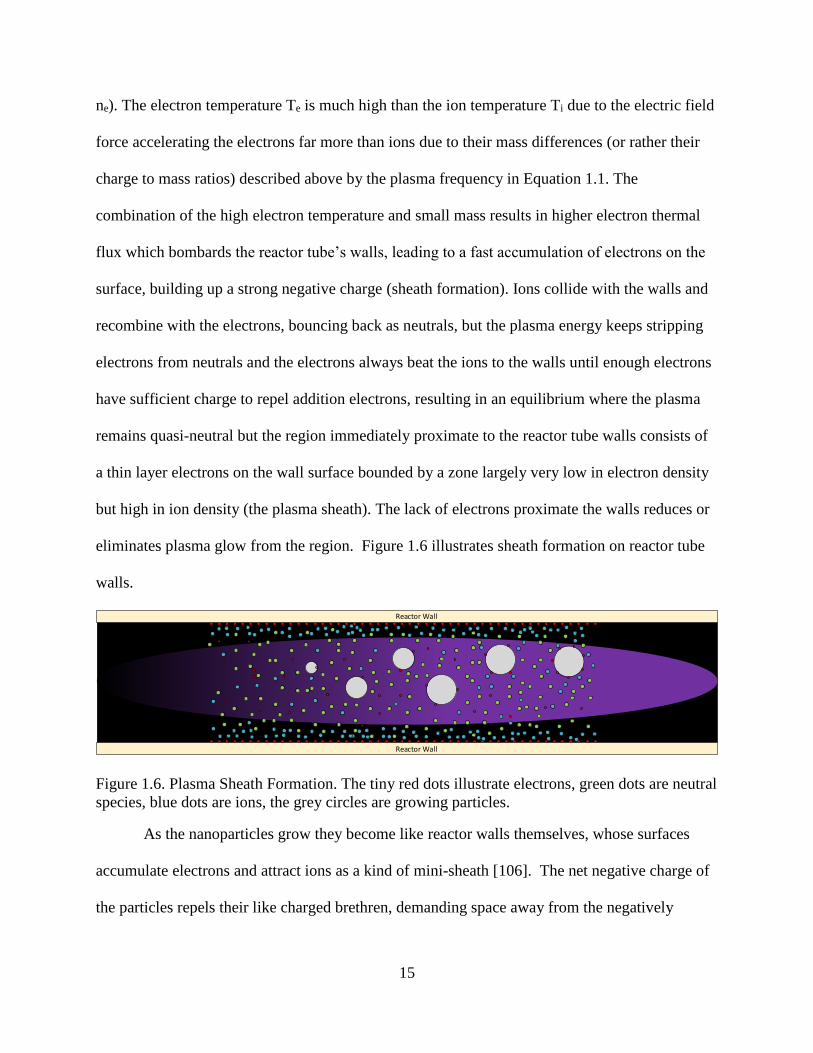
15
ne). The electron temperature Te is much high than the ion temperature Ti due to the electric field
force accelerating the electrons far more than ions due to their mass differences (or rather their
charge to mass ratios) described above by the plasma frequency in Equation 1.1. The
combination of the high electron temperature and small mass results in higher electron thermal
flux which bombards the reactor tube’s walls, leading to a fast accumulation of electrons on the
surface, building up a strong negative charge (sheath formation). Ions collide with the walls and
recombine with the electrons, bouncing back as neutrals, but the plasma energy keeps stripping
electrons from neutrals and the electrons always beat the ions to the walls until enough electrons
have sufficient charge to repel addition electrons, resulting in an equilibrium where the plasma
remains quasi-neutral but the region immediately proximate to the reactor tube walls consists of
a thin layer electrons on the wall surface bounded by a zone largely very low in electron density
but high in ion density (the plasma sheath). The lack of electrons proximate the walls reduces or
eliminates plasma glow from the region. Figure 1.6 illustrates sheath formation on reactor tube
walls.
Reactor Wall
Reactor Wall
Figure 1.6. Plasma Sheath Formation. The tiny red dots illustrate electrons, green dots are neutral
species, blue dots are ions, the grey circles are growing particles.
As the nanoparticles grow they become like reactor walls themselves, whose surfaces
accumulate electrons and attract ions as a kind of mini-sheath [106]. The net negative charge of
the particles repels their like charged brethren, demanding space away from the negatively
16
charged walls and other particles, as they are pushed downstream in the reactor tube by collisions
with neutral, ions, and electrons.
As a side note, charged particles floating (as opposed to flowing in our study) in a
plasma, can under careful conditions, couple to produce astounding behavior including forming
“Coulomb crystal” lattice [107]. These collisions impart vibrations in the nanoparticles,
especially the exothermic reaction of ions recombining with electrons on the particles surface.
Under appropriate conditions this heating of the silicon nanoparticles can be sufficient to
transition the particles form amorphous to crystalline [107].
Recall that the plasma used in this study, and in almost all non-thermal plasma synthesis
for SiNCs, is an RF plasma, typically operating at 13.56 MHz. A further complication to our
understanding of the plasma dynamics is the collapse and reformation of the sheath, and the
various potential differences in the plasma, with every cycle. A re-surging sheath on the upswing
of the power cycle can accelerate charged species in an effect called “wave riding”.
The non-thermal plasma method used in this study is capacitively coupled, the ring
electrodes form capacitor plates and the electric field oscillating between the rings is the driving
energy of the plasma. The dialectic material of the reactor tube walls, with the ring electrode
plate represents a low impedance path for RF frequencies but an open-circuit to emergent DC
self-bias, which can arise because of electrode and sheath interactions (especially with
asymmetric electrodes). The sheath can be looked at as a region where electrons are accelerated
into the bulk of the plasma while ions are accelerated to the walls (because of attraction to
negative charged walls from electron collisions). The plasma is sustained (coupled capacitively
from the electrodes) by the movement (and collisions) of electrons and ions.
17
Plasma exhibits complex wave behavior. The coupling of charged species within the
plasma leads to collective behavior. The presences of particles (usually orders of magnitude
larger than the ions and electrons) adds further complexity to collective and/or wavelike behavior
of plasma. Dust acoustic waves have been extensively studied [108] but the non-linearity,
chaotic influences, and myriad of many-body-problems make true predictive modeling elusive.
The growing nanoparticle in non-thermal plasma synthesis can affected by six forces: 1)
electric fields, 2) neutral drag, 3) ion drag, 4) thermophoretic forces, 5) magnetic forces and 6)
gravity [21]. These forces scale with nanoparticle size, linearly for charge based forces (1 & 5),
by the square (cross-section) for drag forces (2 & 3), and by the cube (volume) for gravity (6).
Given the sub-10 nm size ranges of the luminescent SiNCs, we can essentially ignore gravitation
effects under the tumult of plasma and flow. We only touch briefly on magnetic effects on the
plasma (from externally applied magnetic fields). Thermophoretic forces are noticeable with
large temperature gradients, but in our system only the electrons are at significantly elevated
temperature. We will briefly look at electric field, neutral drag, and ion drag.
The nanoparticles are in the wind…literally. The carrier gas flow, Q, has a net velocity
vector heading downstream in the reactor tube, and while the pressures are low, they are not so
low that this flow doesn’t dominate the transport of the growing particles, keeping them at
roughly the same net velocity as the carrier gas [94]. Because of this velocity matching, it is not
surprising that the SiNC size tends to scale quasi-linearly with carrier gas flow (residence time in
the reactor correlating with synthesis and velocity).
Ion drag exerts force on the nanoparticles towards the direction of the sheath as the ion
thermal flux is in dynamic equilibrium in its movement to continually replenish the positively
charged “dark” area of the sheath. Assuming collisionless orbits around the particle, OML theory
18
can be employed but with limited utility, and more complex models have been introduced to
model this force [109], [110], [111].
Electric field force, Fe= QdE, arises from the accumulated negative charge Qd on the
growing nanoparticles effected by the electric potentials emerging from the complex plasma
environment. Since charge tends to scale linearly with size (assuming the systems is not electron
starved), the forces also scales linearly with size.
If we view neutral drag as inexorably transporting the particle downstream, but otherwise
not having an affect worth modeling further (for this cursory level of analysis) we can just look
at ion drag and electric field forces. Electric forces scale linearly with the radius and ion drag
scales with the square (cross-sectional area). This scaling disparity means that ion drag becomes
increasing more of a relative factor as size increases. Early on, when the proto-particles are
forming they are ambipolar and subject to changing forces depending on their charge at the
moment. So clearly the forces acting on the growing nanoparticles are complex and dynamic.
Now that we have taken a cursory tour of the complexity of the plasma environment in
this synthesis method, let’s take look at the synthesis of SiNCs themselves. We break down the
steps into 1) Disassociation and Recombination, 2) Nucleation and Growth, 3) Accretion and
Coalescence, 4) Crystallization, and 5) Quench.
Early on, as the precursor (silane in most studies), is transported through the Pre-Plasma
and into the Initial Plasma, and the first stage of synthesis starts: Disassociation and
Recombination. During this stage the collision of mostly energetic electrons (and some less
energetic ions) breaks bonds on the silane, which can often quickly re-form. As the reconstituted
silane is transported a little further into the Initial Plasma the collisions come at a higher rate and
the silane starts to break and collide with other silane fragments and form hydrosilanes
19
probabilistically, which themselves break into pieces again, all the while hydrogen gas is
evolving (and disassociating). This building up and tearing down continues until most of the
pieces of what used to be silane are in various stages of short-chain birth-death-rebirth, at which
point Nucleation and Growth kicks off as a lucky few linear or branched hydrosilanes get large
enough that upon their next collision they are slightly more likely to grow then to break apart, at
which point these seeds very quickly start to polymerize into a tangled mass-network. As
networks collide with networks and the high temperature electron density of the plasma increases
(because of flow into the “hotter” part of the plasma), the first protoparticles emerge, pushing
hydrogen up and out their emerging cores because of internal bonds strain and unstable silicon
dangling bonds. The protoparticles start colliding and the system enters the stage of Accretion
and Coalescence. Any leftover small species are absorbed on the growing surface of the
nanoparticles, and nanoparticle-nanoparticle collisions accelerate the average particle size.
Hydrogen is forming and re-forming on the particles surfaces depending on the energy of
collisions. Hydrogen desorption occurs from energetic particle vibration, at which point the
particle is most vulnerable to coalesce with a like particle, but when the particle cools the
hydrogen re-bonds to surface silicon dangling bonds, making an electrostatic shield effect that
makes coalescence less likely [112]. With proper processing conditions, the plasma is now
sufficiently strong to begin the crystallization stage, where the plasma imparts enough energy on
enough electrons and ions that ion-electron recombination on nanoparticle surfaces, electron
collisions, and other surface kinetics can vibrate the particles sufficiently, and allow them to
stabilize long enough for long range order to establish in the core [3], [75]. Under proper
conditions the hydrogen is bonded with Si-H, Si-H2 and Si-H3 bonds on the new nanocrystal
surface and the best thing that can happen is for the kinetics to stop and for the plasma to quench
20
[71]. We will discuss many aspects of reactor design and processing parameters to guide the
precursor successfully though these stages.
2.3. Particle Heating and Crystallization
Studies of nanoparticle heating in argon plasmas attribute the heating to electron-ion
recombination and hydrogen recombination occurring on the particles surface, as well as
hydrogen-silicon bond formation and hydrogen abstraction [113], [114], [75], [115]. Figures 1.7,
1.8, 1.9, and 1.10 show the basic steps of these reaction and their respective energy converted to
thermal energy on the nanoparticle surface.
Silicon Nanoparticle HeatingElectron-Ion Recombination
15.76 eV
Ar+
Ar
Ar+
Figure 1.7. Silicon Nanoparticle Heating from Electron-Ion Recombination. Figure 1.7 illustrates
an argon ion on the nanoparticle surface recombining with an electron, releasing energy on the
silicon nanoparticle surface. This energy of silicon nanoparticle heating from electron-ion
recombination is the equal to the argon ionization energy.
21
Silicon Nanoparticle HeatingHydrogen Recombination
4.5 eV
HH
H
H
H
H
Figure 1.8. Silicon Nanoparticle Heating from Hydrogen Recombination.
Silicon Nanoparticle HeatingHydrogen - Silicon Bonding
3.1 eV
Si
Si
Si
Si
Si
Si
SiSi
Figure 1.9. Silicon Nanoparticle Heating from Hydrogen Attack of Silicon Dangling Bond.
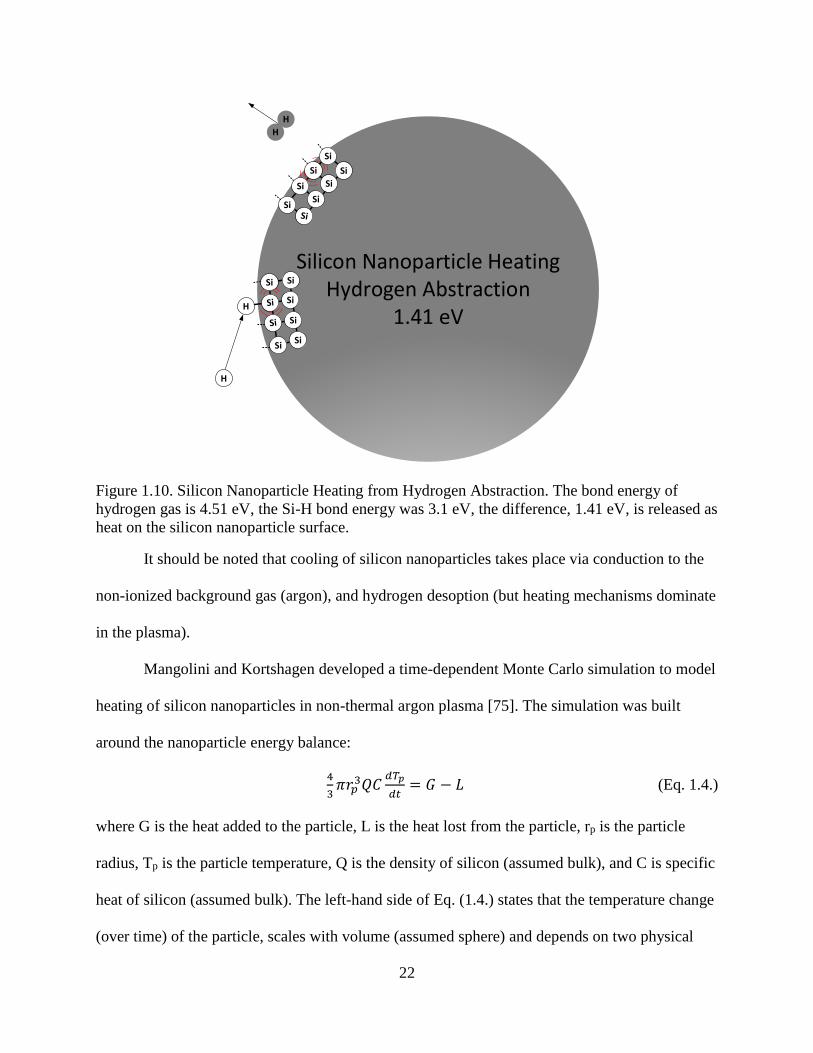
22
Silicon Nanoparticle HeatingHydrogen Abstraction
1.41 eV
H
H
H
Si
Si
Si
Si
SiSi
Si
Si
Si
Si
H
Si
Si
Si
Figure 1.10. Silicon Nanoparticle Heating from Hydrogen Abstraction. The bond energy of
hydrogen gas is 4.51 eV, the Si-H bond energy was 3.1 eV, the difference, 1.41 eV, is released as
heat on the silicon nanoparticle surface.
It should be noted that cooling of silicon nanoparticles takes place via conduction to the
non-ionized background gas (argon), and hydrogen desoption (but heating mechanisms dominate
in the plasma).
Mangolini and Kortshagen developed a time-dependent Monte Carlo simulation to model
heating of silicon nanoparticles in non-thermal argon plasma [75]. The simulation was built
around the nanoparticle energy balance:
4
3𝜋𝑟𝑝
3𝑄𝐶𝑑𝑇𝑝
𝑑𝑡= 𝐺 − 𝐿 (Eq. 1.4.)
where G is the heat added to the particle, L is the heat lost from the particle, rp is the particle
radius, Tp is the particle temperature, Q is the density of silicon (assumed bulk), and C is specific
heat of silicon (assumed bulk). The left-hand side of Eq. (1.4.) states that the temperature change
(over time) of the particle, scales with volume (assumed sphere) and depends on two physical
23
properties of the material (density and specific heat). The right-hand side of Eq. (1.4.) is simply
the heat gain (G) minus heat loss (L). The heat loss, from conduction to the neutral gas, was
calculated as:
1
4𝑛𝑔𝑎𝑠4𝜋𝑟𝑝
2√8𝑘𝐵𝑇𝑔𝑎𝑠
𝜋𝑚𝑔𝑎𝑠
3
2𝑘𝐵(𝑇𝑝 − 𝑇𝑔𝑎𝑠) (1.5.)
Where ngas is the carrier gas density, Tgas is the carrier gas temperature (assumed 300 K),
rp is the nanoparticle radius (used in the equation to calculate the nanoparticle surface area), mgas
is the atomic mass of the carrier gas, kB is Boltzmann’s constant, and Tp is the temperature of the
nanoparticle). The G term in Eq. 1.4. was calculated within the model using the energy levels
established in Figures 1.7, 1.8, 1.9, 1.10, with assumptions 1) that hydrogen would form Si-H2
bonds (as an average of the Si-H, Si-H2 and Si-H3 possibilities, 2) that hydrogen abstraction
would occur on 11% of the circumstances (the Eley-Rideal mechanism [116], [117]) shown in
Figure 1.10 resulting in energy imparted to the nanoparticle, and the other 89% of the time the
hydrogen physiosorbing and diffusing either to a dangling bond (Figure 1.9) or colliding with a
hydrogen free radical (Figure 1.8), 3) any silicon dangling bonds have a 100% chance of bonding
with hydrogen (Figure 1.9), and 4) thermal desorption of hydrogen (cooling mechanism due to
Si-H breakage greater than H-H formation) occurred when Tp was high (900K+) via Langmuir-
Hinshelwood mechanism. Four parameters were needed for the energy balance, electron
temperature (calculated within the model), electron density in the plasma (calculated within the
model), ion density in the plasma (experimentally determined), and atomic hydrogen density in
the plasma (experimentally determined). Nanoparticle charging rate equations relate to the
thermal flux equations (Eq. 1.6.) and Eq. 1.7):
𝐼𝑒 = 𝑒𝑛𝑒4𝜋𝑟𝑝2√
𝑘𝐵𝑇𝑒
2𝜋𝑚𝑒exp (−
𝑒|𝛷|
𝑘𝐵𝑇𝑒) , 𝛷 < 0 (Eq. 1.6.)

24
𝐼𝑖 = 𝑒𝑛𝑖4𝜋𝑟𝑝2√
𝑘𝐵𝑇𝑖
2𝜋𝑚𝑖(1 +
𝑒|𝛷|
𝑘𝐵𝑇𝑖) , 𝛷 < 0 (Eq. 1.7.)
where Ie and Ii are the electron and ion currents, e is elementary charge, rp is the radius of the
nanoparticle (used to calculated surface area), Te and Ti are the electron and ion temperatures, me
and mi are the electron and ion masses, and 𝛷 is the particle potential.
Prior to Mangolini and Kortshagen’s simulation [75] it was not known how the silicon
nanoparticles could attain the necessary temperature to crystalize. Calculations of the silicon
nanoparticle melting temps [118] showed diameters of 4, 6, 8, and 10 nm had melting
temperatures of 773, 1073, 1173, and 1273 K, (respectively). Mangolini and Kortshagen’s
simulation showed small particles do indeed likely reach melting temperatures due to the heat
gain reactions described above. Their modeling showed 2 nm particles spiking intermittently
beyond the melting point of larger particles, and achieving temperatures where hydrogen
desorption was likely. They surmised that these small particles, because of the intermittent nature
of collisional heating, would have enough time to cool in order to crystalize, and that these small
SiNCs served as seed crystals for epitaxial growth of larger SiNCs due to accretion of
dissociated silane (including silicon radicals) in the plasma, and that these small crystals could
coalesce into larger crystals by colliding in their molten state after hydrogen desorption. Previous
modeling [112] studies on hydrogen’s role in coalesces between two particles showed that small
molten particles could coalesce more readily immediately after hydrogen desorption, forming
larger molten particles that cool into larger SiNCs (and that these same nanoparticles, even if
they are melted and in a liquid state, could bounce off each other when their surfaces are
hydrogen passivated).
25
2.4. CHS Versus Silane
One aspect of this study that we sought to bring some light on, is whether our precursor,
CHS would follow the synthesis stages in a similar manner to silane. We theorized that given the
structure of CHS that Disassociation and Recombination might be replaced with Ring Opening
Polymerization as the Step 1 for non-thermal plasma synthesis of SiNCs. Our study adds some
evidence to support this theory (our power levels to make SiNCs were lower than what has been
published with silane, for instance) but it by no means proves it, as we were not able to run a
series of “apples-to-apples” experiments between CHS and silane (through we did succeed in
performing one experiment on two similar reactors). Future research will be needed to get CHS
“caught-up” with the body of analytical, modeling and experimental work on non-thermal
plasma synthesis of SiNCs using silane.
26
CHAPTER 3. CHARACTERIZATION METHODS
3.1. Characterization Methods in this Study
It is assumed the reader is familiar with the characterization methods described. For the
purposes of brevity, we omit detailed apparatus and methods descriptions of the characterization
used in this study.
The purity of CHS was determined previously by the Boudjouk group using proton and
1H and 29Si NMR, gas chromatography–mass spectrometry (GCMS), and inductively coupled
plasma atomic emission spectroscopy (ICP-AES).
The bulk of the characterization in the early phase of this study was high resolution
transmission electron microscopy (HRTEM) and photoluminescence quantum yield (PLQY).
Because CHS was a new precursor to non-thermal plasma synthesis, and we lacked the domain
knowledge in our group to understand the parameter space of non-thermal plasma synthesis of
SiNCs, HRTEM was an invaluable tool to “see” the products of our efforts and gain an
understanding of the variables at play and how to control them. With proper sample collection
and microscopy techniques, we are able to glean important data on the morphology, variability,
and quality of SiNCs. Morphological features we observed include the level of sphericity (or
lack there-of) of the nanoparticles, the presence of sintering, the thickness and consistency of
apparent outer shells around the nanoparticles, and the size of the nanoparticles. Variability data
using HRTEM included the degree of polydispersity of the sizes of the nanoparticles, the relative
presence of Bravais lattice corresponding to silicon crystalline planes versus the presence of
nanoparticles where lattice could not be observed, and other morphological variations including
the variability in sphericity. Quality, in this context, refers to the consistency of lattice,
27
sphericity, relative monodispersity at a target size, and the lack of undesired amorphous
nanoparticles or asymmetrical morphologies including sintering.
A more challenging but sometimes useful application of HRTEM was to provide
qualitative data on mass yield. TEM grids can be very quickly rastered across a slit with
emerging, in-flight SiNCs, in the apparatus, thereby introducing the grid into a “rain” of SiNCs.
If the rastering is timed (and quick) then yhe bulk of the grid can be assessed in HRTEM for its
amount of SiNCs collected, and that amount compared to other experiments, provided the flow
rates, time of rastering and other conditions are controlled. This approach is rough and only
qualitative but can be useful.
Subsequent use of HRTEM was performed for drop-casts of size separated via density
gradient ultracentrifugation (DGU) in the creation of super-lattices by other members of our
research group (to be discussed in later reports).
While HRTEM can be more expensive than other characterization methods, and the
sample preparation and delay (due to instrument availability) can be challenging, we find the
HRTEM is invaluable to gain a fuller understanding and subsequent control over the parameter
space.
As we gained knowledge and could reliably produce size controlled nanoparticles with
consistent lattices (visible in HRTEM) we transitioned to the next phase of our study, where the
bulk of the characterization was photoluminescence and quantum yield (PLQY).
Photoluminescence (PL) was measured with a spectrometer and integrating sphere, with
excitations at 375 nm. Quantum yield (QY) was calculated from the PL data and a baseline
reference, comparing the integrated photon count of PL emission to the integrated photon count
of excitation absorbance by the SiNCs. Our initial measurements of PLQY were performed with
28
SiNCs in solvent where the headspace of the solution was exposed to air immediately prior to
placement in the integrating sphere (due to set-up constraints involving work being performed by
other researchers the integrating sphere orientation prevented capped vials from being used).
This air exposure introduced physiosorbed oxygen and possibly water to the SiNCs, lowering the
measured QY. Despite the air exposure we were still able to learn how to adjust our parameter
space to increase QY. When no further progress was being made to push QY higher, the group
made the considerable investment of time to re-configure the PLQY set-up to accept vials with
caps (keeping the SiNCs in solvent, free from air exposure) and to re-calibrate the system,
including deriving correction factors for spectral absorbance of the solvent used (mesitylene) in
the NIR. This change improved measured QY and significantly reduced variability. As a
verification step, on two occasions we brought multiple samples to the University of Minnesota
for PLQY measurements, which showed PL in close agreement and QY slightly reduced likely
due to the NIR absorbances of mesitylene (because no correction factors were applied to correct
for these absorbances in the UMN data). Unless otherwise stated, all QY data in this dissertation
is from the “air-free” method, with spectral corrections, and the characterization was performed
at NDSU by members of our group. PLQY can provide information about size (via the PL),
polydispersity (via the PL distribution) and quality (via the QY) of passivated SiNCs.
Bruker Alpha Fourier Transform Infrared (FTIR) spectroscopy in diffuse reflectance
(DRIFTS) mode, was performed for select samples. Because un-passivated SiNCs will oxidize
when exposed to air, FTIR is best performed in a glove box under nitrogen or argon. Our
available FTIRs at NDSU were benchtop mounted units (open air), which limited our FTIR
characterization to those samples we brought to the University of Minnesota (UMN), which has
an FTIR inside a glove box. The advantages of FTIR (provided it’s in an air-free environment)
29
to studies such as ours is that, among many other things, it offers data about the SiNC’s surface
prior to passivation. Oxygen contamination can be observed, as can the ratio of -Si-H to -Si-H2 to
-Si-H3 on the surface, and it has been hypothesized [71] that a high ratio of Si-H3 is a good
predictor of the degree of “successful” passivation (resulting in higher QY due to good ligand
coverage on the SiNC surface) provide the SiNCs are otherwise without surface or core defects
unaffected by passivation.
X-ray diffraction (XRD) was performed on selected samples. XRD was used to verify
the presence of lattice structure corresponding to SiNCs, as well as a technique that can assist in
determination of the necessary power level of plasma needed for crystallization of the silicon
nanoparticles (by looking at XRD peak height changes with power level). SiNC size can also be
inferred from XRD data [119]. Because in our studies the only elemental inputs were silicon,
hydrogen, argon, and trace contaminants (at the ppm level), the findings of silicon lattice in XRD
data was pro-forma expectation on samples that produce high QY after passivation. XRD was
performed in open air on “as-produced” SiNC powder, resulting in steady oxidation of the SiNCs
that will, over the course of days, shrink the SiNC as the outer surface grow an oxidized shell.
Raman spectroscopy was performed on selected samples. Like XRD, we used Raman to
verify crystallinity corresponding to silicon lattice planes, as well as inferred (calculated) size
measurement [120], [121]. This technique was also performed in open air, resulting in oxidation
of the samples.
30
CHAPTER 4. CYCLOHEXASILANE
4.1. CHS Synthesis
CHS was synthesized (by the Boudjouk group) by reacting trichlorosilane with an
alkylated polyamine to produce tetradecachlorocyclohexasilane dianion, which was reduced to
CHS using lithium aluminum hydride in diethyl ether, then purified via sulfuric acid wash and
distillation. The details of this synthesis are described elsewhere [14]. Batch quantities for our
studies were typically about 3-5 grams of CHS.
4.2. CHS Properties
CHS is not, at the time of this writing, a large scale commercial product. Very few labs
have the capacity to produce CHS even at the volumes used in this study. The discovery of
physical properties of CHS are still underway, and very little has been published. The Boudjouk
group states that: CHS is colorless, pyrophoric, thermal decomposition (through loss of
hydrogen) is rapid at 220o C, it can be stable up to 100o C for up to 12 hours, and it can be stored
indefinitely under N2 at 0o C. The Boudjouk group further describes CHS as not-light stable
(should be stored away from light), it is prone to polymerization reactions if exposed to
prolonged elevated temperatures or UV (through dismutation of the Si-H and Si-Si bonds,
leading to formation of gaseous silanes), and it freezes below 18o C.
As stated above, prior studies [3], [100] of non-thermal plasma synthesis of SiNCs have
used silane and silicon tetrachloride as precursors. As a new precursor for non-thermal plasma
synthesis of SiNCs, CHS brings the advantage (shared by silane) of only adding silicon and
hydrogen to the reaction, compared to silicon tetrachloride, which can bring undesirable
chlorinated side reactions, corrosive by-products, and produces lower quality SiNCs. CHS has
the further advantage (shared by silicon tetrachloride) of being liquid (at standard temperature
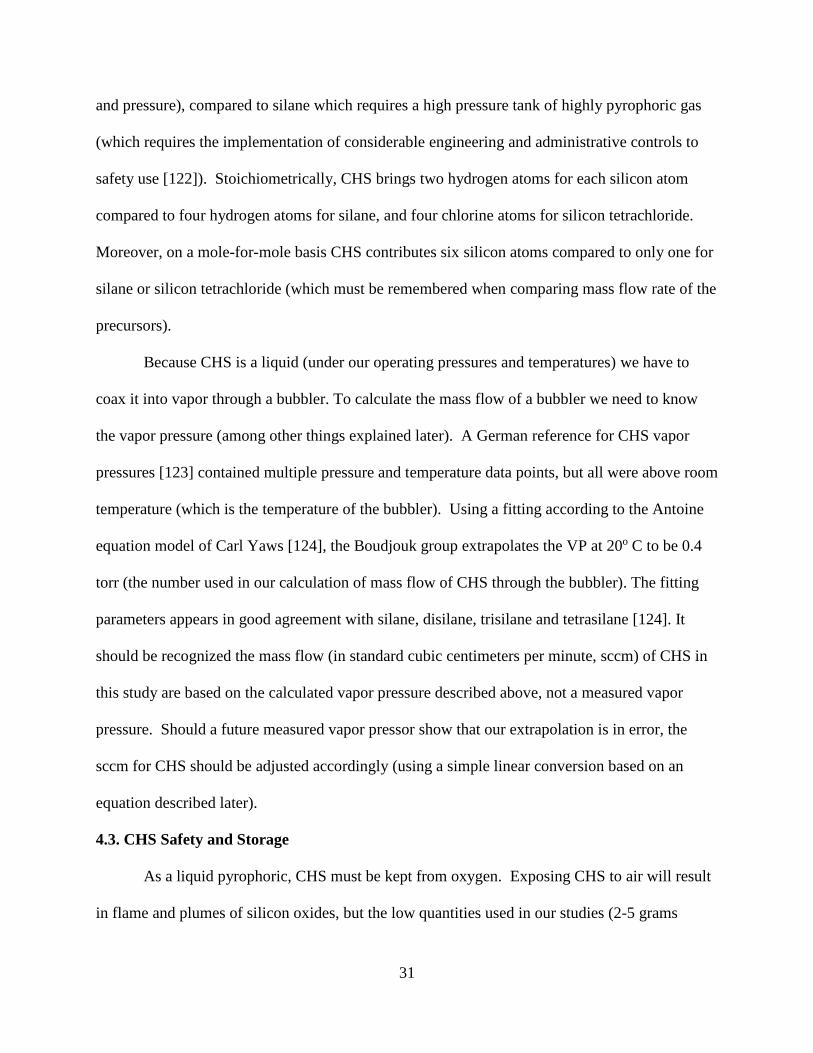
31
and pressure), compared to silane which requires a high pressure tank of highly pyrophoric gas
(which requires the implementation of considerable engineering and administrative controls to
safety use [122]). Stoichiometrically, CHS brings two hydrogen atoms for each silicon atom
compared to four hydrogen atoms for silane, and four chlorine atoms for silicon tetrachloride.
Moreover, on a mole-for-mole basis CHS contributes six silicon atoms compared to only one for
silane or silicon tetrachloride (which must be remembered when comparing mass flow rate of the
precursors).
Because CHS is a liquid (under our operating pressures and temperatures) we have to
coax it into vapor through a bubbler. To calculate the mass flow of a bubbler we need to know
the vapor pressure (among other things explained later). A German reference for CHS vapor
pressures [123] contained multiple pressure and temperature data points, but all were above room
temperature (which is the temperature of the bubbler). Using a fitting according to the Antoine
equation model of Carl Yaws [124], the Boudjouk group extrapolates the VP at 20o C to be 0.4
torr (the number used in our calculation of mass flow of CHS through the bubbler). The fitting
parameters appears in good agreement with silane, disilane, trisilane and tetrasilane [124]. It
should be recognized the mass flow (in standard cubic centimeters per minute, sccm) of CHS in
this study are based on the calculated vapor pressure described above, not a measured vapor
pressure. Should a future measured vapor pressor show that our extrapolation is in error, the
sccm for CHS should be adjusted accordingly (using a simple linear conversion based on an
equation described later).
4.3. CHS Safety and Storage
As a liquid pyrophoric, CHS must be kept from oxygen. Exposing CHS to air will result
in flame and plumes of silicon oxides, but the low quantities used in our studies (2-5 grams
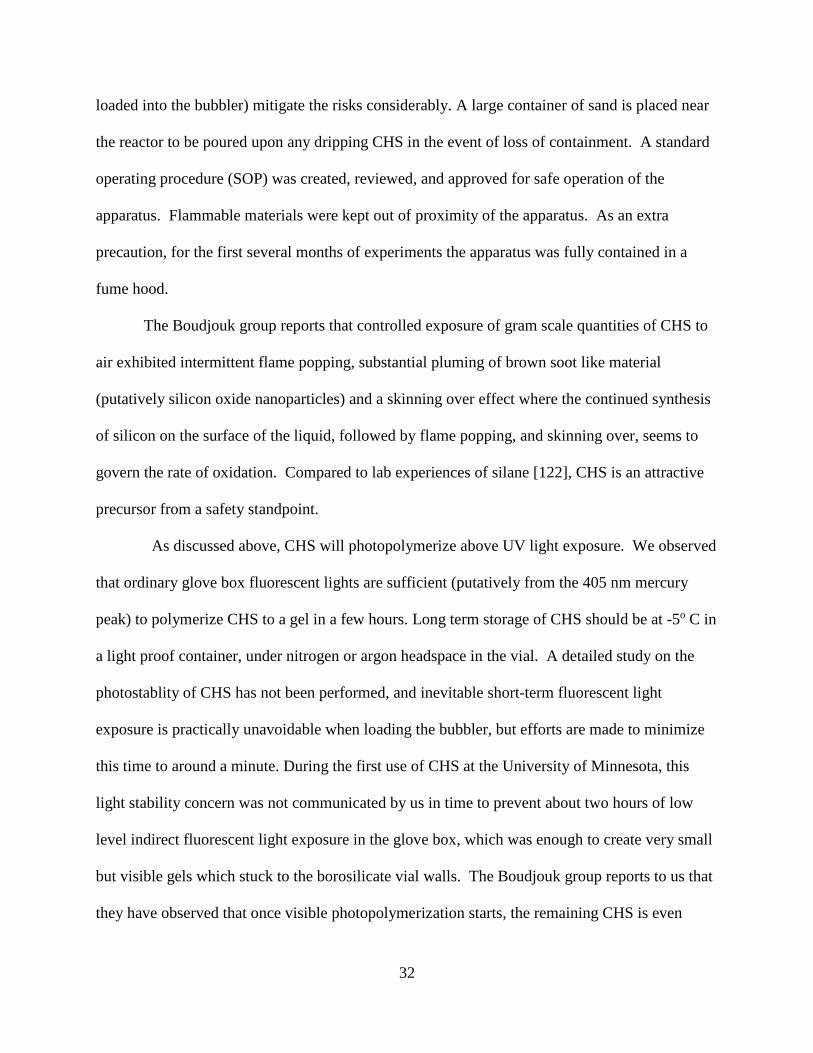
32
loaded into the bubbler) mitigate the risks considerably. A large container of sand is placed near
the reactor to be poured upon any dripping CHS in the event of loss of containment. A standard
operating procedure (SOP) was created, reviewed, and approved for safe operation of the
apparatus. Flammable materials were kept out of proximity of the apparatus. As an extra
precaution, for the first several months of experiments the apparatus was fully contained in a
fume hood.
The Boudjouk group reports that controlled exposure of gram scale quantities of CHS to
air exhibited intermittent flame popping, substantial pluming of brown soot like material
(putatively silicon oxide nanoparticles) and a skinning over effect where the continued synthesis
of silicon on the surface of the liquid, followed by flame popping, and skinning over, seems to
govern the rate of oxidation. Compared to lab experiences of silane [122], CHS is an attractive
precursor from a safety standpoint.
As discussed above, CHS will photopolymerize above UV light exposure. We observed
that ordinary glove box fluorescent lights are sufficient (putatively from the 405 nm mercury
peak) to polymerize CHS to a gel in a few hours. Long term storage of CHS should be at -5o C in
a light proof container, under nitrogen or argon headspace in the vial. A detailed study on the
photostablity of CHS has not been performed, and inevitable short-term fluorescent light
exposure is practically unavoidable when loading the bubbler, but efforts are made to minimize
this time to around a minute. During the first use of CHS at the University of Minnesota, this
light stability concern was not communicated by us in time to prevent about two hours of low
level indirect fluorescent light exposure in the glove box, which was enough to create very small
but visible gels which stuck to the borosilicate vial walls. The Boudjouk group reports to us that
they have observed that once visible photopolymerization starts, the remaining CHS is even
33
more sensitive to light or heat (putatively due to the presence of less stable hydrosilanes
solubilized with the CHS).
Very little is known about potential reactions of CHS to metal or organic solids in long
term exposure (as a container material). As a precaution, we limit storage of CHS to borosilicate
glass or fluoropolymers (PTFE) containers. Additionally, we limited exposure of CHS in the
bubbler and our apparatus to borosilicate glass, PTFE and stainless steel.
34
CHAPTER 5. APPARATUS DESIGN AND PARAMETER SPACE DEFINITION
5.1. Introduction to the Apparatus
Figure 5.1 shows the demonstration apparatus constructed at UMN and first-generation
apparatus constructed at NDSU.
Figure 5.1. Demonstration and First-Generation Apparatus. This image on the left shows the
demonstration apparatus constructed at the University of Minnesota. The image on the right is
the first configuration of the first-generation apparatus constructed at NDSU.
To establish clear nomenclature when discussing our experiments, we introduce Figure
5.2, which shows the sub-system assembly names, delineated by function. The bolded words in
the figure will be the shorthand words we will sometimes use for brevity.
Reactor
Downstream Injection Gas
Assembly
Gas/Precursor Mix Upstream System
Apparatus
Bubbler
Main Gas Feed Assembly
Pump-Down Base Assembly
Vacuum Pump
Sample CollectionAssembly
Figure 5.2. Apparatus Nomenclature and Function Diagram. This figure shows the functional
sub-assemblies and the direction of material flow through the apparatus.
35
The full system will generally be referred to here as the “apparatus”, with recognition that
these studies include multiple configuration of full systems, but each configuration we have used
can be modeled by Figure 5.2.
The upstream system combines the precursor with carrier gas at the desired ratio and
mass flow rate. In our upstream systems, the carrier gas mixed with precursor exiting the
bubbler, constituted only a portion of the desired carrier gas, requiring at least one additional gas
flow assembly. Our first temporary demonstration apparatus was constructed at the University
of Minnesota under the guidance and direction of the Kortshagen group, using available
components. We will refer to the full system as the “demonstration apparatus”. Figure 5.3 shows
the upstream system for the demonstration apparatus.
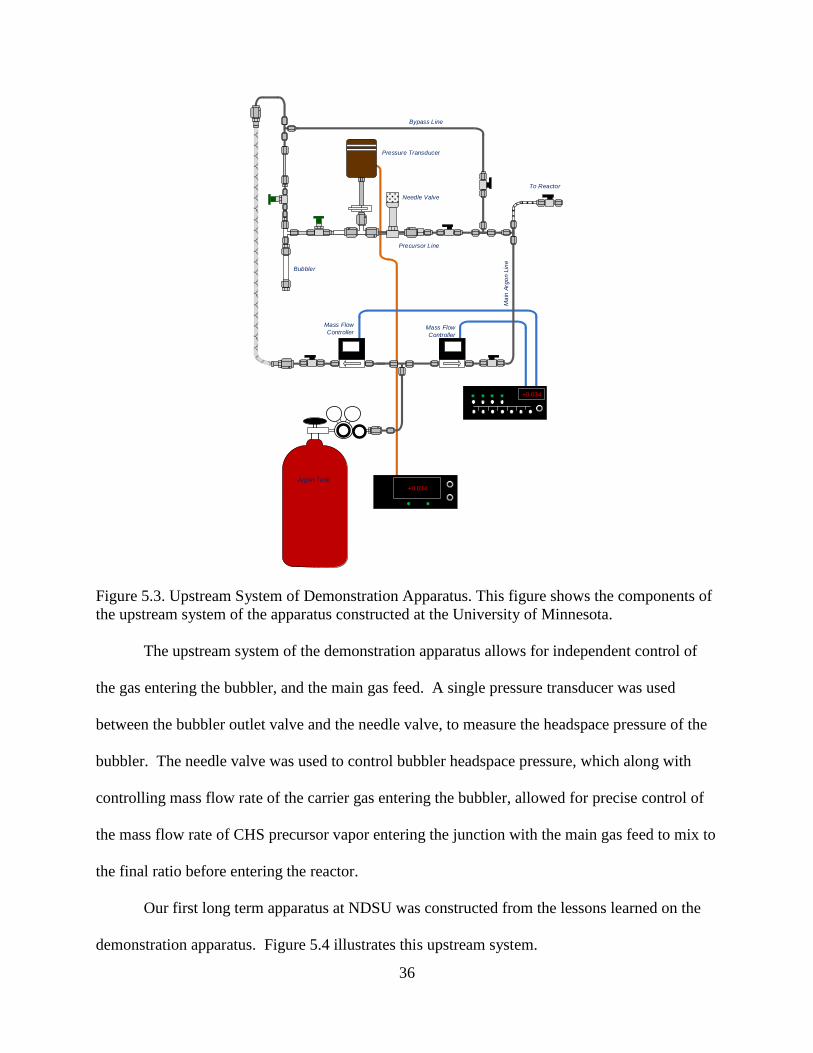
36
Argon Tank
Mass Flow
Controller
Pressure Transducer
Bubbler
Bypass Line
Ma
in A
rgo
n L
ine
Precursor Line
Needle Valve
Mass Flow
Controller
+0.034
+0.034
To Reactor
Figure 5.3. Upstream System of Demonstration Apparatus. This figure shows the components of
the upstream system of the apparatus constructed at the University of Minnesota.
The upstream system of the demonstration apparatus allows for independent control of
the gas entering the bubbler, and the main gas feed. A single pressure transducer was used
between the bubbler outlet valve and the needle valve, to measure the headspace pressure of the
bubbler. The needle valve was used to control bubbler headspace pressure, which along with
controlling mass flow rate of the carrier gas entering the bubbler, allowed for precise control of
the mass flow rate of CHS precursor vapor entering the junction with the main gas feed to mix to
the final ratio before entering the reactor.
Our first long term apparatus at NDSU was constructed from the lessons learned on the
demonstration apparatus. Figure 5.4 illustrates this upstream system.
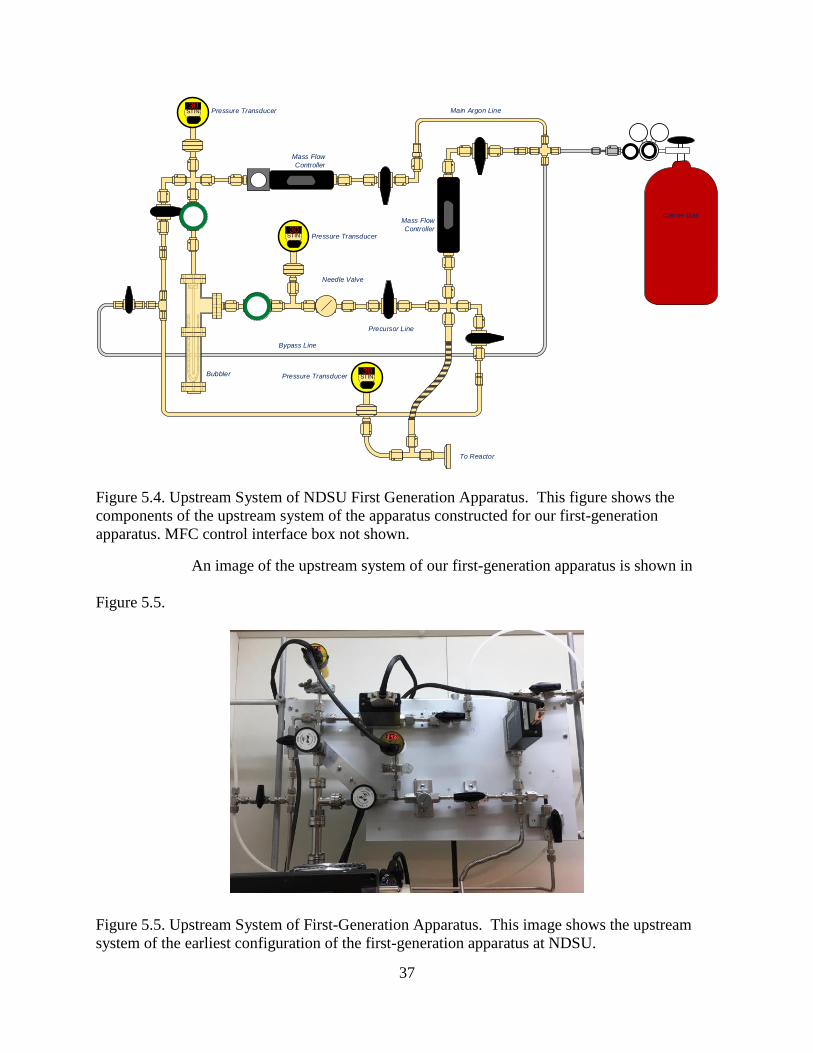
37
30STINGER
30STINGER
30STINGER
Mass Flow
Controller
Pressure Transducer
Bubbler
Bypass Line
Main Argon Line
Precursor Line
Needle Valve
Mass Flow
ControllerPressure Transducer
Pressure Transducer
Carrier Gas
To Reactor
Figure 5.4. Upstream System of NDSU First Generation Apparatus. This figure shows the
components of the upstream system of the apparatus constructed for our first-generation
apparatus. MFC control interface box not shown.
An image of the upstream system of our first-generation apparatus is shown in
Figure 5.5.
Figure 5.5. Upstream System of First-Generation Apparatus. This image shows the upstream
system of the earliest configuration of the first-generation apparatus at NDSU.
38
The upstream system of our first-generation apparatus performed the same function as the
upstream system of our demonstration apparatus, but with many improvements. Most of the
fittings were VCR, whereas most of the fittings of the demonstration apparatus upstream system
were Swagelok standard. Using VCR resulted in a configuration that could be disassembled and
reassembled (with new gaskets) with less concern for leaks. We used three pressure transducers
for the upstream system instead of one for the upstream system of the demonstration apparatus.
The added data on pressure helps to anticipate problems, control the system better, and know
when actions can be performed without having to calculate pressure and time. Moreover, we
utilized pressure transducers (Instrutech Stingers) which display pressure at the transducer,
allowing much easier visual understanding of the state of the system. Stingers are not gas
independent, requiring that conversion tables be used to know true pressure, but as longs as the
gas used is the same across the Stingers in the system the relative pressures are accurate.
Because the apparatus is kept at higher than atmospheric pressure when not in operation (to
ensure that any leaks that might exist cause carrier gas to escape instead of oxygen to enter the
system), it is important that the pressure transducers used have a range of transduced pressures
from about 10 millatorr (to indicate when sufficient pressure is reached when performing
decontaminating purges) to greater then atmospheric pressure (to indicate when the system is
ready for full shut down. It is also critically important that the pressure of the inlet to the bubbler
and the pressure of the outlet of the bubbler, as well as the headspace pressure in the bubbler, be
known before either bubbler valve is carefully opened (to prevent CHS from rapidly exiting
either valve should there be a substantial pressure differential).
The configuration of the upstream system was modified periodically during our studies to
reflect the needs of experiment, such as additional mass flow controllers for added carrier gas
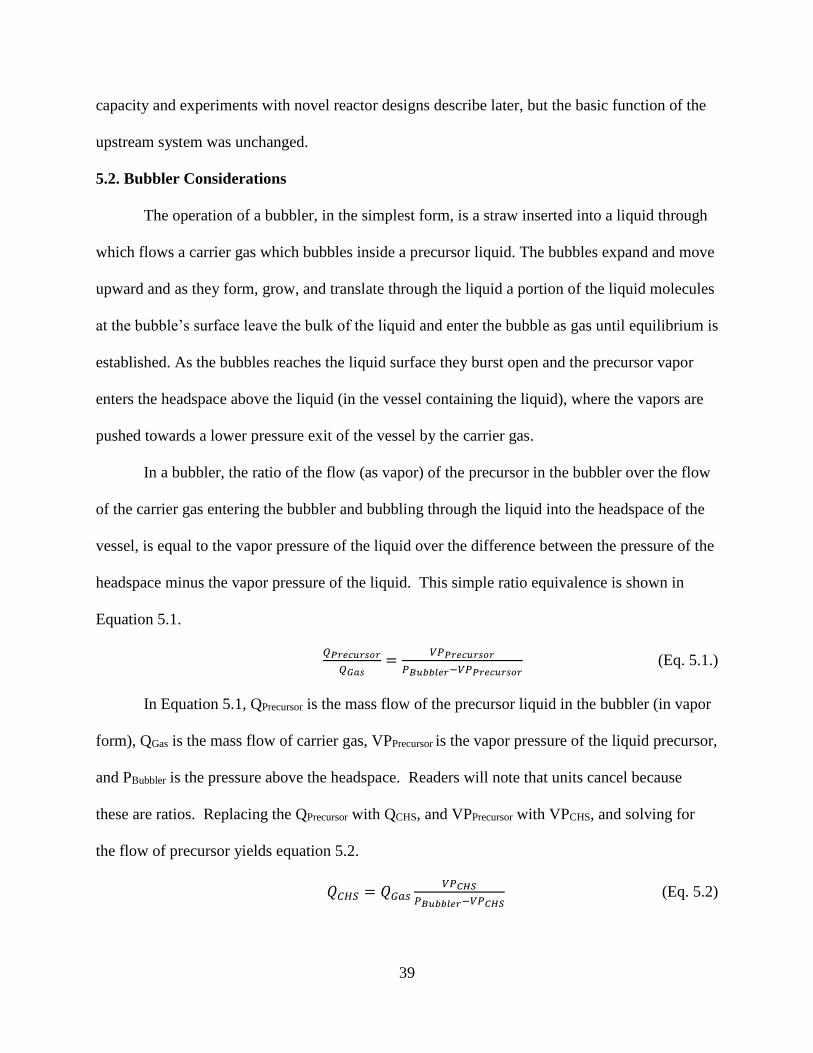
39
capacity and experiments with novel reactor designs describe later, but the basic function of the
upstream system was unchanged.
5.2. Bubbler Considerations
The operation of a bubbler, in the simplest form, is a straw inserted into a liquid through
which flows a carrier gas which bubbles inside a precursor liquid. The bubbles expand and move
upward and as they form, grow, and translate through the liquid a portion of the liquid molecules
at the bubble’s surface leave the bulk of the liquid and enter the bubble as gas until equilibrium is
established. As the bubbles reaches the liquid surface they burst open and the precursor vapor
enters the headspace above the liquid (in the vessel containing the liquid), where the vapors are
pushed towards a lower pressure exit of the vessel by the carrier gas.
In a bubbler, the ratio of the flow (as vapor) of the precursor in the bubbler over the flow
of the carrier gas entering the bubbler and bubbling through the liquid into the headspace of the
vessel, is equal to the vapor pressure of the liquid over the difference between the pressure of the
headspace minus the vapor pressure of the liquid. This simple ratio equivalence is shown in
Equation 5.1.
𝑄𝑃𝑟𝑒𝑐𝑢𝑟𝑠𝑜𝑟
𝑄𝐺𝑎𝑠=
𝑉𝑃𝑃𝑟𝑒𝑐𝑢𝑟𝑠𝑜𝑟
𝑃𝐵𝑢𝑏𝑏𝑙𝑒𝑟−𝑉𝑃𝑃𝑟𝑒𝑐𝑢𝑟𝑠𝑜𝑟 (Eq. 5.1.)
In Equation 5.1, QPrecursor is the mass flow of the precursor liquid in the bubbler (in vapor
form), QGas is the mass flow of carrier gas, VPPrecursor is the vapor pressure of the liquid precursor,
and PBubbler is the pressure above the headspace. Readers will note that units cancel because
these are ratios. Replacing the QPrecursor with QCHS, and VPPrecursor with VPCHS, and solving for
the flow of precursor yields equation 5.2.
𝑄𝐶𝐻𝑆 = 𝑄𝐺𝑎𝑠𝑉𝑃𝐶𝐻𝑆
𝑃𝐵𝑢𝑏𝑏𝑙𝑒𝑟−𝑉𝑃𝐶𝐻𝑆 (Eq. 5.2)
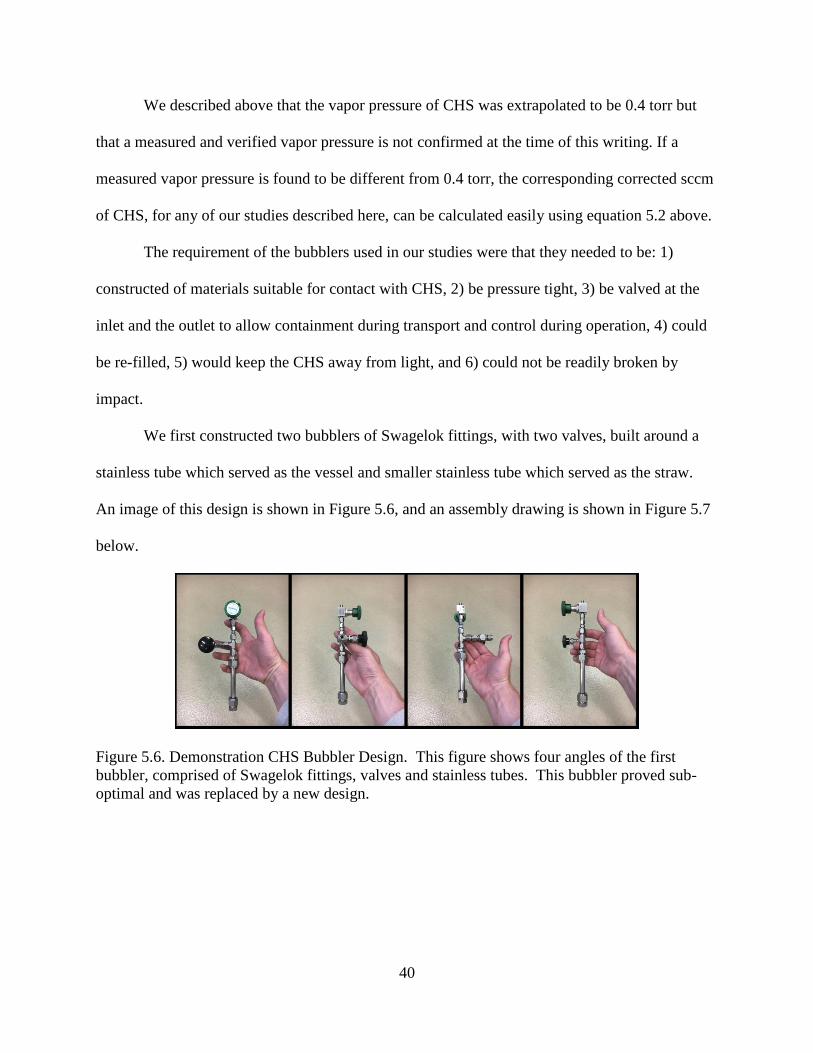
40
We described above that the vapor pressure of CHS was extrapolated to be 0.4 torr but
that a measured and verified vapor pressure is not confirmed at the time of this writing. If a
measured vapor pressure is found to be different from 0.4 torr, the corresponding corrected sccm
of CHS, for any of our studies described here, can be calculated easily using equation 5.2 above.
The requirement of the bubblers used in our studies were that they needed to be: 1)
constructed of materials suitable for contact with CHS, 2) be pressure tight, 3) be valved at the
inlet and the outlet to allow containment during transport and control during operation, 4) could
be re-filled, 5) would keep the CHS away from light, and 6) could not be readily broken by
impact.
We first constructed two bubblers of Swagelok fittings, with two valves, built around a
stainless tube which served as the vessel and smaller stainless tube which served as the straw.
An image of this design is shown in Figure 5.6, and an assembly drawing is shown in Figure 5.7
below.
Figure 5.6. Demonstration CHS Bubbler Design. This figure shows four angles of the first
bubbler, comprised of Swagelok fittings, valves and stainless tubes. This bubbler proved sub-
optimal and was replaced by a new design.
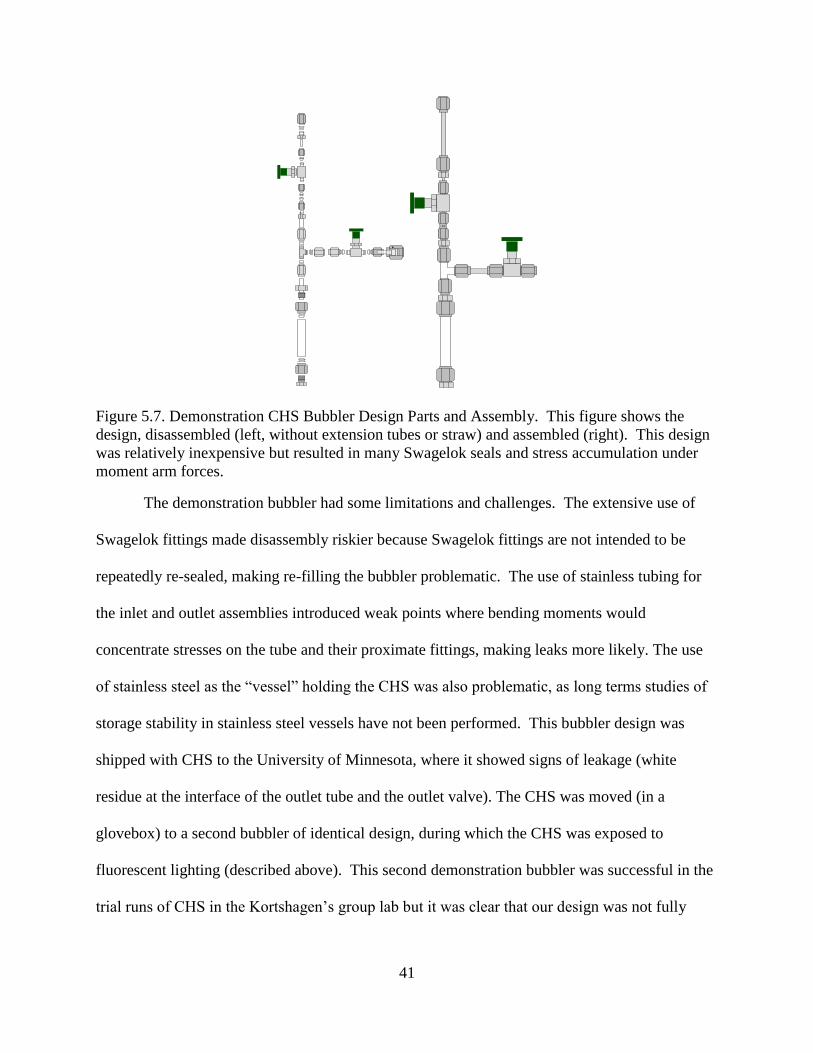
41
Figure 5.7. Demonstration CHS Bubbler Design Parts and Assembly. This figure shows the
design, disassembled (left, without extension tubes or straw) and assembled (right). This design
was relatively inexpensive but resulted in many Swagelok seals and stress accumulation under
moment arm forces.
The demonstration bubbler had some limitations and challenges. The extensive use of
Swagelok fittings made disassembly riskier because Swagelok fittings are not intended to be
repeatedly re-sealed, making re-filling the bubbler problematic. The use of stainless tubing for
the inlet and outlet assemblies introduced weak points where bending moments would
concentrate stresses on the tube and their proximate fittings, making leaks more likely. The use
of stainless steel as the “vessel” holding the CHS was also problematic, as long terms studies of
storage stability in stainless steel vessels have not been performed. This bubbler design was
shipped with CHS to the University of Minnesota, where it showed signs of leakage (white
residue at the interface of the outlet tube and the outlet valve). The CHS was moved (in a
glovebox) to a second bubbler of identical design, during which the CHS was exposed to
fluorescent lighting (described above). This second demonstration bubbler was successful in the
trial runs of CHS in the Kortshagen’s group lab but it was clear that our design was not fully
42
meeting our requirements and the first-generation bubbler was designed for the main
experiments in our lab at NDSU.
In the new design, VCR fittings replaced Swagelok, borosililcate replaced stainless steel
in the vessel, PTFE replaced stainless steel in the straw, and a robust Conflat sealed assembly
replaced custom steel tubing and multiple Swagelok parts. The new design is shown in Figure
5.8.
Figure 5.8. CHS Bubbler Design for First-Generation Apparatus. The image on the left shows
the fully assembled bubbler prior to mounting on the apparatus, with the inlet valve on the top
and the outlet valve on the right-hand side of the image. The image on the right shows the CHS
in the custom cut test tube being loaded into the bottom assembly of the bubber. The diagonal
strip in the image on the left is the mounting bracket.
This bubbler design for the first-generation apparatus has proven to be very robust and
reliable. Using VCR fittings and Conflat seals allows for disassembly and re-filling CHS without
as much concern of subsequent leaks compared to the demonstration design using Swagelok
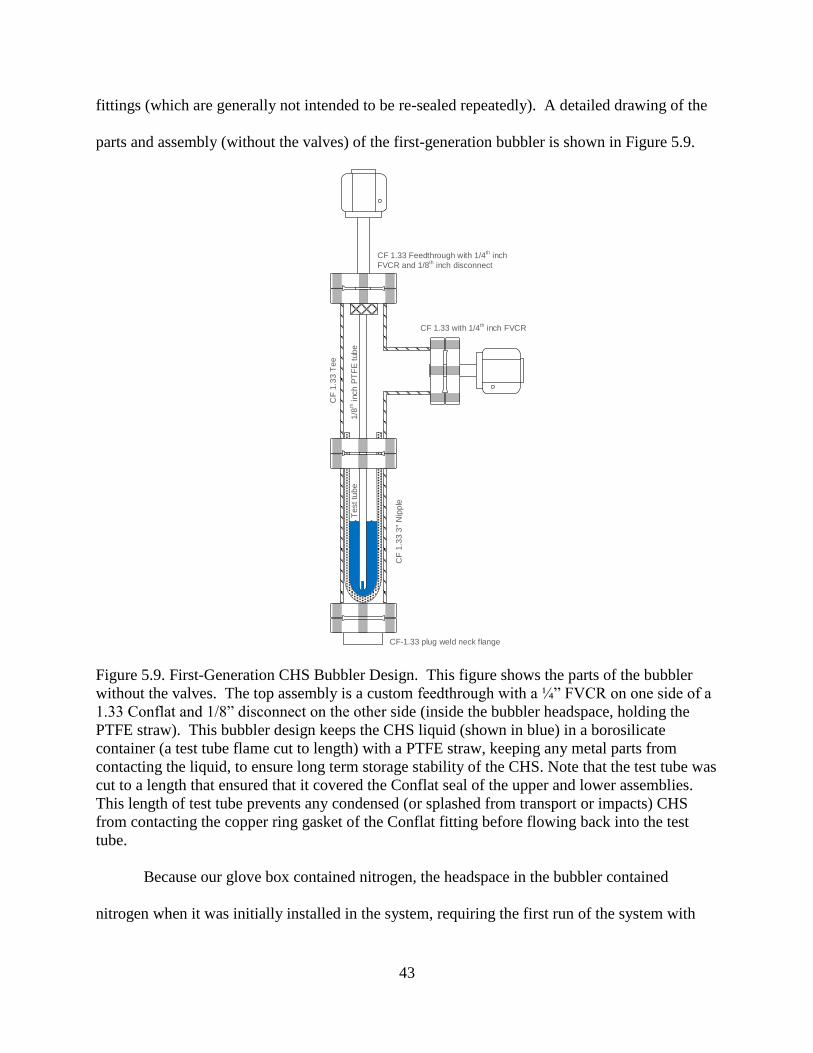
43
fittings (which are generally not intended to be re-sealed repeatedly). A detailed drawing of the
parts and assembly (without the valves) of the first-generation bubbler is shown in Figure 5.9.
CF
1.3
3 3
" N
ipp
le
CF
1.3
3 T
ee
CF 1.33 with 1/4th inch FVCR
CF-1.33 plug weld neck flange
CF 1.33 Feedthrough with 1/4th inch
FVCR and 1/8th inch disconnect
Te
st
tub
e1/8
th inch
PT
FE
tub
e
Figure 5.9. First-Generation CHS Bubbler Design. This figure shows the parts of the bubbler
without the valves. The top assembly is a custom feedthrough with a ¼” FVCR on one side of a
1.33 Conflat and 1/8” disconnect on the other side (inside the bubbler headspace, holding the
PTFE straw). This bubbler design keeps the CHS liquid (shown in blue) in a borosilicate
container (a test tube flame cut to length) with a PTFE straw, keeping any metal parts from
contacting the liquid, to ensure long term storage stability of the CHS. Note that the test tube was
cut to a length that ensured that it covered the Conflat seal of the upper and lower assemblies.
This length of test tube prevents any condensed (or splashed from transport or impacts) CHS
from contacting the copper ring gasket of the Conflat fitting before flowing back into the test
tube.
Because our glove box contained nitrogen, the headspace in the bubbler contained
nitrogen when it was initially installed in the system, requiring the first run of the system with
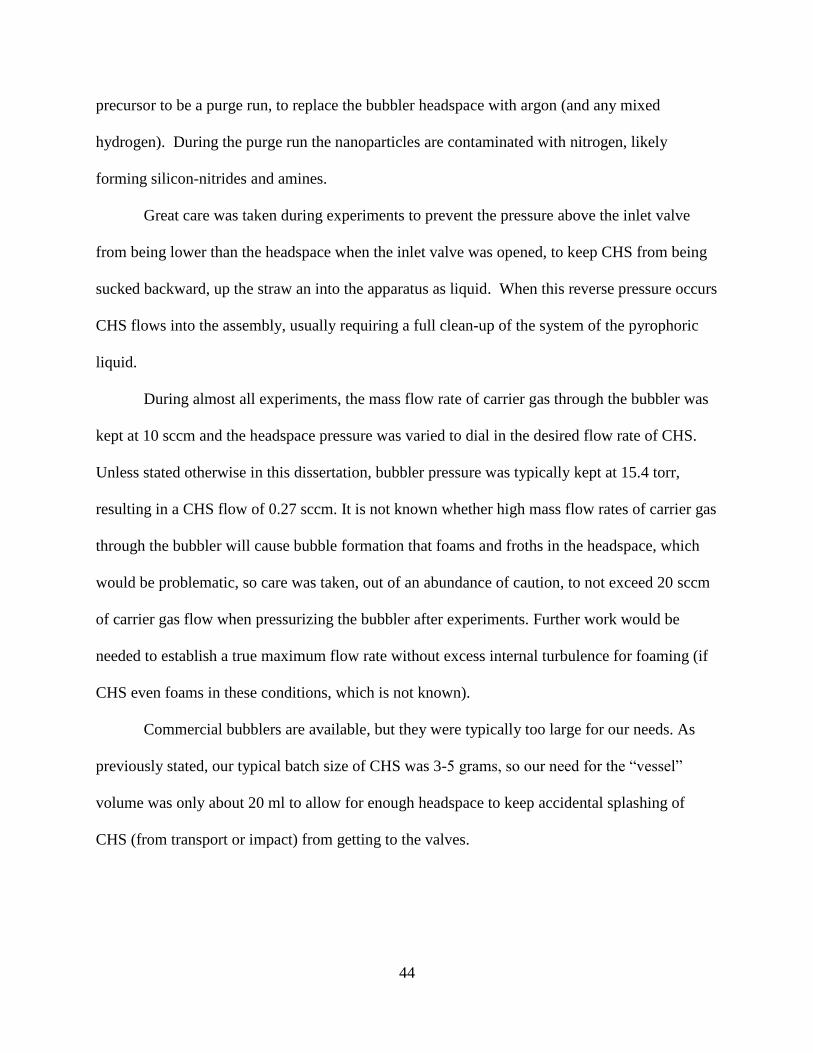
44
precursor to be a purge run, to replace the bubbler headspace with argon (and any mixed
hydrogen). During the purge run the nanoparticles are contaminated with nitrogen, likely
forming silicon-nitrides and amines.
Great care was taken during experiments to prevent the pressure above the inlet valve
from being lower than the headspace when the inlet valve was opened, to keep CHS from being
sucked backward, up the straw an into the apparatus as liquid. When this reverse pressure occurs
CHS flows into the assembly, usually requiring a full clean-up of the system of the pyrophoric
liquid.
During almost all experiments, the mass flow rate of carrier gas through the bubbler was
kept at 10 sccm and the headspace pressure was varied to dial in the desired flow rate of CHS.
Unless stated otherwise in this dissertation, bubbler pressure was typically kept at 15.4 torr,
resulting in a CHS flow of 0.27 sccm. It is not known whether high mass flow rates of carrier gas
through the bubbler will cause bubble formation that foams and froths in the headspace, which
would be problematic, so care was taken, out of an abundance of caution, to not exceed 20 sccm
of carrier gas flow when pressurizing the bubbler after experiments. Further work would be
needed to establish a true maximum flow rate without excess internal turbulence for foaming (if
CHS even foams in these conditions, which is not known).
Commercial bubblers are available, but they were typically too large for our needs. As
previously stated, our typical batch size of CHS was 3-5 grams, so our need for the “vessel”
volume was only about 20 ml to allow for enough headspace to keep accidental splashing of
CHS (from transport or impact) from getting to the valves.

45
5.3. Reactor Considerations
The previously cited literature on non-thermal plasma synthesis of SiNCs (and many
other nanoparticles and nanocrystals) themselves usually derive their reactor design from
Mangolini’s reactor [3]. Mangolini, in his Ph.D. dissertation [125] stated “Many different reactor
designs have been tested during the first part of this project, and it would be cumbersome to
describe all of these steps. At the end of this developing process, the simple and effective design
shown in figure 2.1 [of the dissertation] was found to be the most efficient at producing silicon
nanocrystals in a controllable way.” As we have discussed, CHS is not the same precursor as
silane. We surmised that CHS likely has properties that would impact the SiNC synthesis
process via non-thermal plasma significantly differently than silane (lower activation energy,
lower hydrogen to silicon ratio, propensity for ring-opening polymerization, etc), so we decided
to explore the effects of reactor dimensions and morphology in a systematic, first principles
manner, instead of simply starting with a duplicate of Mangolini’s chosen design.
We define the reactor as the section of the apparatus where all chemical reactions occur,
the vessel around the reactions, and the proximate fittings which connect the reactor to the
upstream assembly, the sample collection assembly, and the injection assembly (if there is one).
The portion of the reactors consisting of borosilicate glass we define as the “reactor tube”, even
though the reactor tube evolved in our study to include custom glass blown reactor tubes with
multiple tube diameters and with sideport injection tubes. Figure 5.10 shows the dimensions of
the various reactor tubes used in this study.
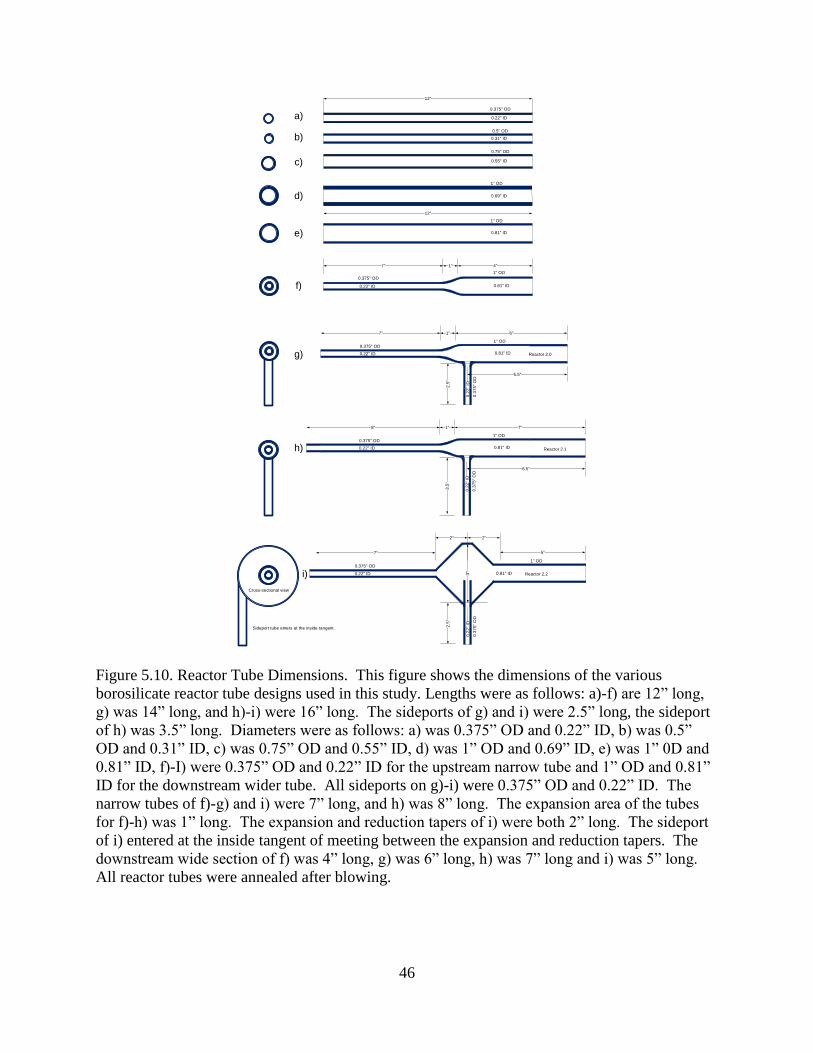
46
0.375" OD
0.22" ID
1" OD
0.81" ID
6"7" 1"
5.5"
0.3
75"
OD
0.2
2"
ID
2.5
"
0.375" OD
0.22" ID
1" OD
0.81" ID
7"8" 1"
6.5"0
.37
5"
OD
0.2
2"
ID
3.5
"
0.375" OD
0.22" ID
1" OD
0.81" ID
5"7"
2"
0.3
75"
OD
0.2
2"
ID
2.5
"
2"
Sideport tube enters at the inside tangent.
Cross-sectional view
Reactor 2.0
Reactor 2.1
Reactor 2.2
0.375" OD
1" OD
4"7" 1"
0.22" ID 0.81" ID
1" OD
0.81" ID
1" OD
0.69" ID
12"
0.55" ID
0.75" OD
0.31" ID
0.5" OD
0.22" ID
0.375" OD
12"
a)
b)
c)
d)
e)
f)
g)
h)
i)
Figure 5.10. Reactor Tube Dimensions. This figure shows the dimensions of the various
borosilicate reactor tube designs used in this study. Lengths were as follows: a)-f) are 12” long,
g) was 14” long, and h)-i) were 16” long. The sideports of g) and i) were 2.5” long, the sideport
of h) was 3.5” long. Diameters were as follows: a) was 0.375” OD and 0.22” ID, b) was 0.5”
OD and 0.31” ID, c) was 0.75” OD and 0.55” ID, d) was 1” OD and 0.69” ID, e) was 1” 0D and
0.81” ID, f)-I) were 0.375” OD and 0.22” ID for the upstream narrow tube and 1” OD and 0.81”
ID for the downstream wider tube. All sideports on g)-i) were 0.375” OD and 0.22” ID. The
narrow tubes of f)-g) and i) were 7” long, and h) was 8” long. The expansion area of the tubes
for f)-h) was 1” long. The expansion and reduction tapers of i) were both 2” long. The sideport
of i) entered at the inside tangent of meeting between the expansion and reduction tapers. The
downstream wide section of f) was 4” long, g) was 6” long, h) was 7” long and i) was 5” long.
All reactor tubes were annealed after blowing.
47
We will discuss in later sections our observation on the effects of reactor tube
morphology on plasma stability, flow, SiNC size and SiNC quality (particularity quantum yield).
Reactor tubes were connected to the reactor assembly with “Ultra-Torr” style disconnect
fittings which compress an O-ring between a stainless fitting and the glass tube. Examples of
two reactors are below in Figure 5.11.
Figure 5.11. Example Straight Reactor Tubes. This figure shows two different reactor tubes with
disconnects. Note that each reactor as the same size fittings to connect with the upstream system
and sample collection assembly. Note the post-experiment deposition on the borosilicate glass
walls.
Teflon tape was wrapped around the portion of the reactor tube that nested inside the
fitting (but not were the O-ring compressed) to reduce bending moments of the assemblies from
concentrating too much stress on the tubes. Breakage of the glass reactor tubes during an active
experiment would result in oxygen rushing into the bubbler and likely ruining the precursor
batch (as well as safety hazards), so care must be taken to reduce stress on the glass.
5.3.1. Reactor Considerations: Pressure Monitoring
The exiting literature consistently show pressure transducers on the downstream side of
the reactors, and this pressure measurement is referred to when discussing the pressure of the
synthesis reaction, and when calculating so-called “residence time” of the synthesis. We feel that
given the high likelihood that the size of the SiNCs are substantially established upstream of the
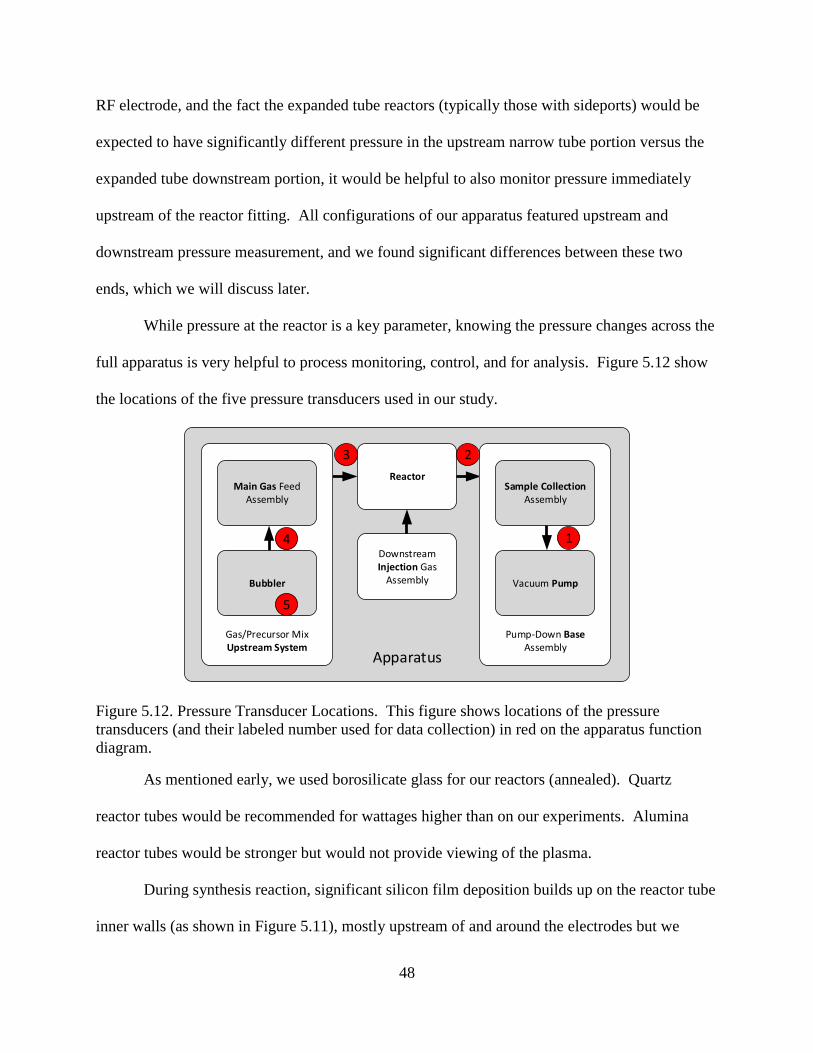
48
RF electrode, and the fact the expanded tube reactors (typically those with sideports) would be
expected to have significantly different pressure in the upstream narrow tube portion versus the
expanded tube downstream portion, it would be helpful to also monitor pressure immediately
upstream of the reactor fitting. All configurations of our apparatus featured upstream and
downstream pressure measurement, and we found significant differences between these two
ends, which we will discuss later.
While pressure at the reactor is a key parameter, knowing the pressure changes across the
full apparatus is very helpful to process monitoring, control, and for analysis. Figure 5.12 show
the locations of the five pressure transducers used in our study.
Reactor
Downstream Injection Gas
Assembly
Gas/Precursor Mix Upstream System
Apparatus
Bubbler
Main Gas Feed Assembly
Pump-Down Base Assembly
Vacuum Pump
Sample CollectionAssembly
1
23
4
5
Figure 5.12. Pressure Transducer Locations. This figure shows locations of the pressure
transducers (and their labeled number used for data collection) in red on the apparatus function
diagram.
As mentioned early, we used borosilicate glass for our reactors (annealed). Quartz
reactor tubes would be recommended for wattages higher than on our experiments. Alumina
reactor tubes would be stronger but would not provide viewing of the plasma.
During synthesis reaction, significant silicon film deposition builds up on the reactor tube
inner walls (as shown in Figure 5.11), mostly upstream of and around the electrodes but we
49
observed that deposition will occur anywhere that nucleation and growth of the nanoparticles is
occurring (and putatively plasma etching of SiNCs). As observed in other sources [125], we also
observe that the mass yield losses to undesired film deposition is considerable and we will
discuss this in a later section.
We have found that our best quality SiNCs to date, at least in terms of high quantum
yield, were mostly synthesized with the reactor tube design shown in Figure 5.10g and 5.10h),
but that more work is needed before a conclusive “optimal” reactor morphology and dimensions
could be defined. We have performed preliminary studies on some novel reactor designs that we
will discuss later.
5.4. Sample Collection Considerations
Efficient collect of as-produced SiNCs exiting the reactor presents many tradeoffs and
requirements. The collection mechanism needs to stop the movement of the SiNCs but not
through overly kinetic collisions that might cause particles to coalesce or crystalline structures to
be degraded. The mechanics would ideally capture all SiNCs exiting the reactor but not cause
undesired backpressure. The collection mechanism would ideally not change process conditions
(typically due to changing backpressure) over time as the collection substrate filled with SiNCs.
The collection substrate must not contaminate the SiNCs with any react-able or physisorb-able
species. The collection mechanism needs to be able to be brought to atmospheric pressure under
carrier gas, and sealable for transport to the glove box. In some circumstance the collection
substrate is desired to be observable via viewports during sample collection. The collection
substrate needs to be of a material or composition that allows for an efficient remove of the
SiNCs for passivation or other post processing or characterization (without contamination).
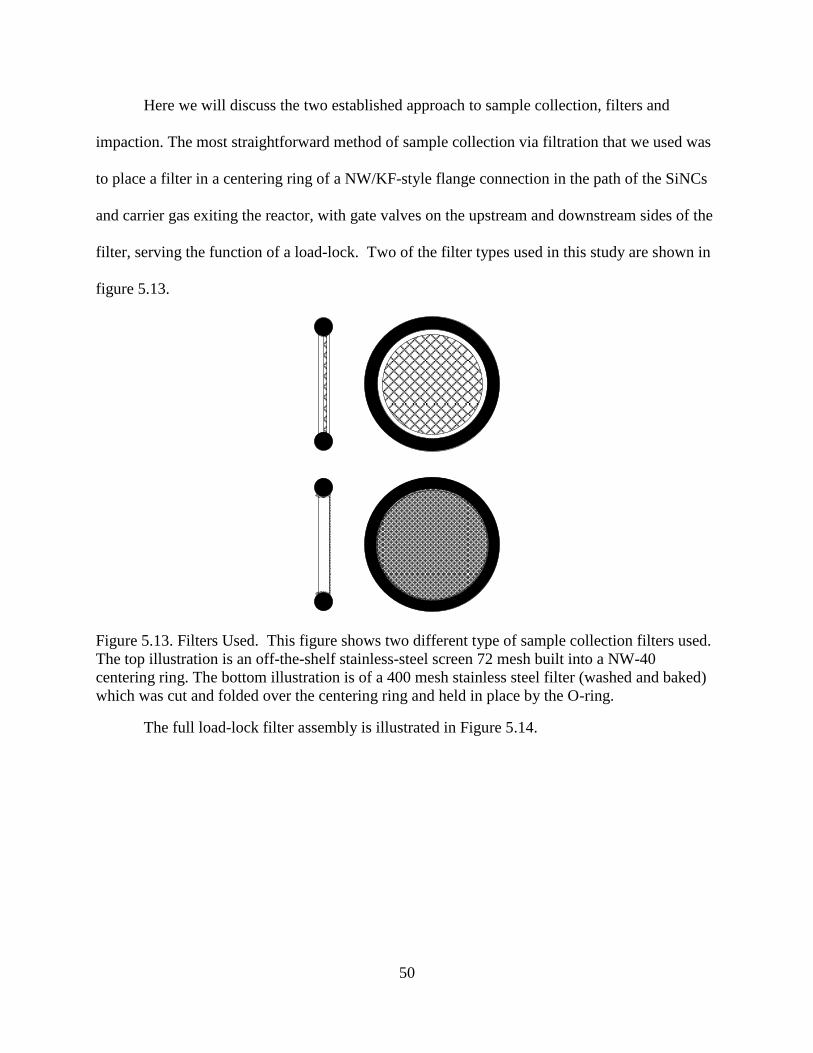
50
Here we will discuss the two established approach to sample collection, filters and
impaction. The most straightforward method of sample collection via filtration that we used was
to place a filter in a centering ring of a NW/KF-style flange connection in the path of the SiNCs
and carrier gas exiting the reactor, with gate valves on the upstream and downstream sides of the
filter, serving the function of a load-lock. Two of the filter types used in this study are shown in
figure 5.13.
Figure 5.13. Filters Used. This figure shows two different type of sample collection filters used.
The top illustration is an off-the-shelf stainless-steel screen 72 mesh built into a NW-40
centering ring. The bottom illustration is of a 400 mesh stainless steel filter (washed and baked)
which was cut and folded over the centering ring and held in place by the O-ring.
The full load-lock filter assembly is illustrated in Figure 5.14.
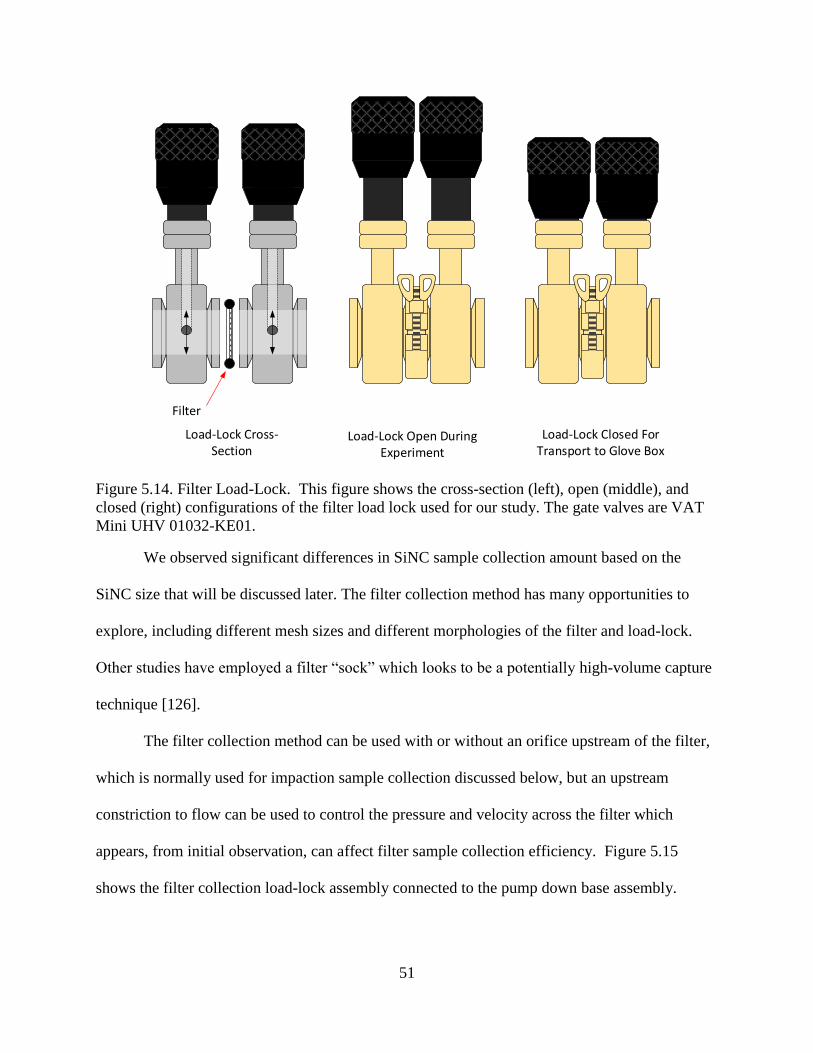
51
Load-Lock Cross-Section
Load-Lock Open During Experiment
Load-Lock Closed For Transport to Glove Box
Filter
Figure 5.14. Filter Load-Lock. This figure shows the cross-section (left), open (middle), and
closed (right) configurations of the filter load lock used for our study. The gate valves are VAT
Mini UHV 01032-KE01.
We observed significant differences in SiNC sample collection amount based on the
SiNC size that will be discussed later. The filter collection method has many opportunities to
explore, including different mesh sizes and different morphologies of the filter and load-lock.
Other studies have employed a filter “sock” which looks to be a potentially high-volume capture
technique [126].
The filter collection method can be used with or without an orifice upstream of the filter,
which is normally used for impaction sample collection discussed below, but an upstream
constriction to flow can be used to control the pressure and velocity across the filter which
appears, from initial observation, can affect filter sample collection efficiency. Figure 5.15
shows the filter collection load-lock assembly connected to the pump down base assembly.
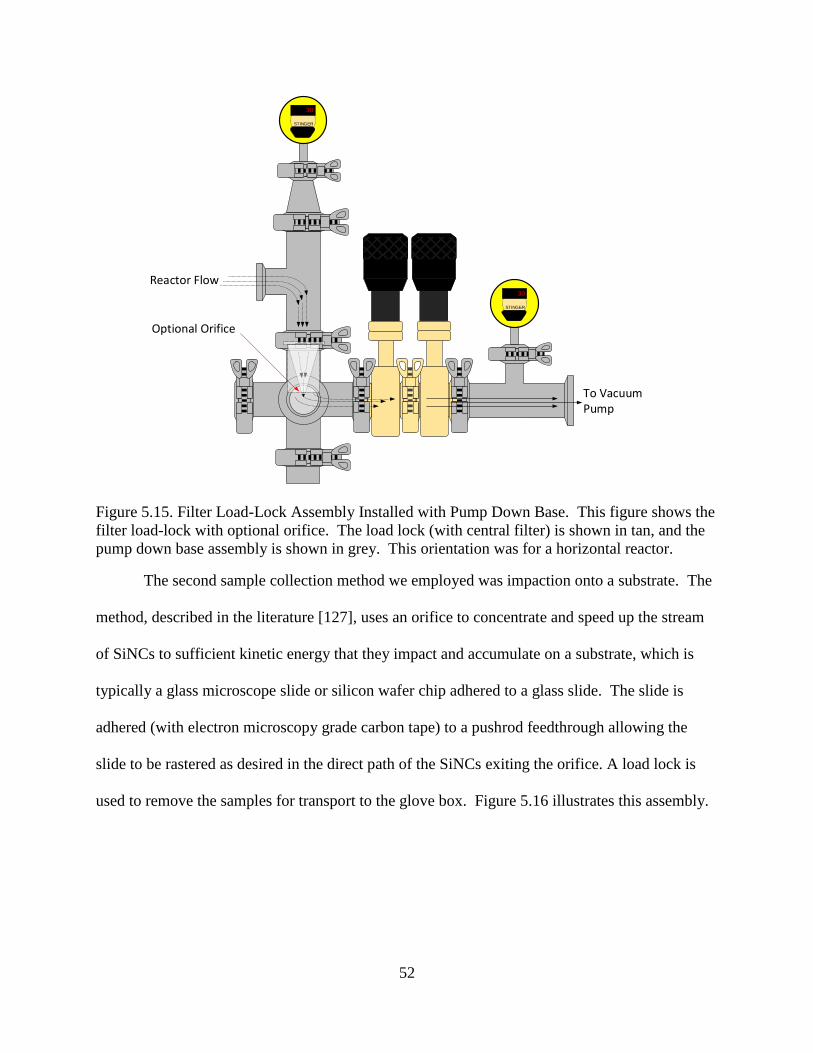
52
30
STINGER
Reactor Flow
To Vacuum Pump
30
STINGER
Optional Orifice
Figure 5.15. Filter Load-Lock Assembly Installed with Pump Down Base. This figure shows the
filter load-lock with optional orifice. The load lock (with central filter) is shown in tan, and the
pump down base assembly is shown in grey. This orientation was for a horizontal reactor.
The second sample collection method we employed was impaction onto a substrate. The
method, described in the literature [127], uses an orifice to concentrate and speed up the stream
of SiNCs to sufficient kinetic energy that they impact and accumulate on a substrate, which is
typically a glass microscope slide or silicon wafer chip adhered to a glass slide. The slide is
adhered (with electron microscopy grade carbon tape) to a pushrod feedthrough allowing the
slide to be rastered as desired in the direct path of the SiNCs exiting the orifice. A load lock is
used to remove the samples for transport to the glove box. Figure 5.16 illustrates this assembly.
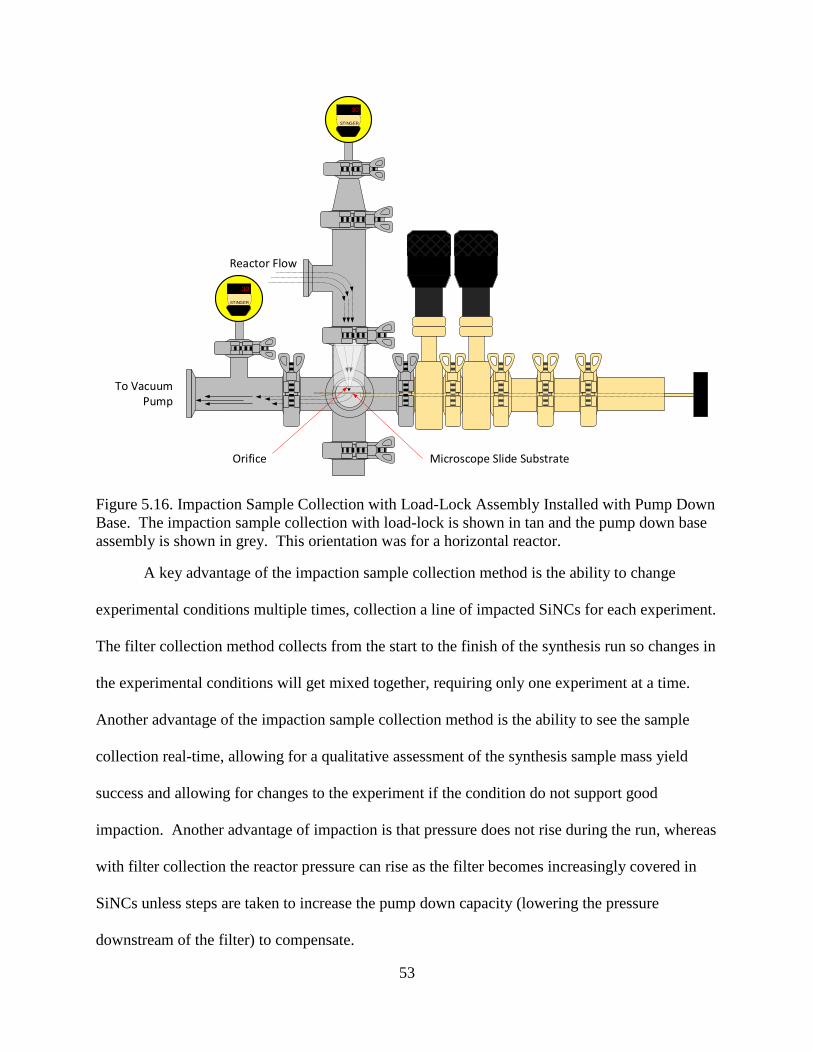
53
30
STINGER
30
STINGER
Reactor Flow
To Vacuum Pump
Orifice Microscope Slide Substrate
Figure 5.16. Impaction Sample Collection with Load-Lock Assembly Installed with Pump Down
Base. The impaction sample collection with load-lock is shown in tan and the pump down base
assembly is shown in grey. This orientation was for a horizontal reactor.
A key advantage of the impaction sample collection method is the ability to change
experimental conditions multiple times, collection a line of impacted SiNCs for each experiment.
The filter collection method collects from the start to the finish of the synthesis run so changes in
the experimental conditions will get mixed together, requiring only one experiment at a time.
Another advantage of the impaction sample collection method is the ability to see the sample
collection real-time, allowing for a qualitative assessment of the synthesis sample mass yield
success and allowing for changes to the experiment if the condition do not support good
impaction. Another advantage of impaction is that pressure does not rise during the run, whereas
with filter collection the reactor pressure can rise as the filter becomes increasingly covered in
SiNCs unless steps are taken to increase the pump down capacity (lowering the pressure
downstream of the filter) to compensate.
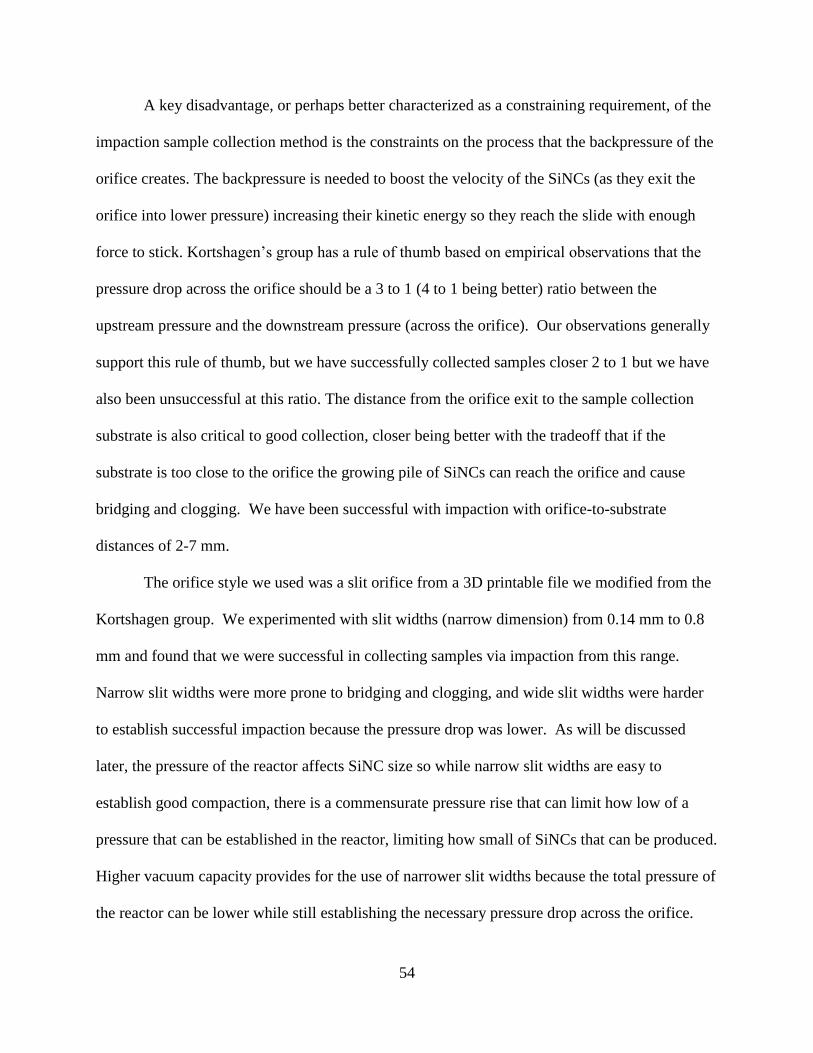
54
A key disadvantage, or perhaps better characterized as a constraining requirement, of the
impaction sample collection method is the constraints on the process that the backpressure of the
orifice creates. The backpressure is needed to boost the velocity of the SiNCs (as they exit the
orifice into lower pressure) increasing their kinetic energy so they reach the slide with enough
force to stick. Kortshagen’s group has a rule of thumb based on empirical observations that the
pressure drop across the orifice should be a 3 to 1 (4 to 1 being better) ratio between the
upstream pressure and the downstream pressure (across the orifice). Our observations generally
support this rule of thumb, but we have successfully collected samples closer 2 to 1 but we have
also been unsuccessful at this ratio. The distance from the orifice exit to the sample collection
substrate is also critical to good collection, closer being better with the tradeoff that if the
substrate is too close to the orifice the growing pile of SiNCs can reach the orifice and cause
bridging and clogging. We have been successful with impaction with orifice-to-substrate
distances of 2-7 mm.
The orifice style we used was a slit orifice from a 3D printable file we modified from the
Kortshagen group. We experimented with slit widths (narrow dimension) from 0.14 mm to 0.8
mm and found that we were successful in collecting samples via impaction from this range.
Narrow slit widths were more prone to bridging and clogging, and wide slit widths were harder
to establish successful impaction because the pressure drop was lower. As will be discussed
later, the pressure of the reactor affects SiNC size so while narrow slit widths are easy to
establish good compaction, there is a commensurate pressure rise that can limit how low of a
pressure that can be established in the reactor, limiting how small of SiNCs that can be produced.
Higher vacuum capacity provides for the use of narrower slit widths because the total pressure of
the reactor can be lower while still establishing the necessary pressure drop across the orifice.
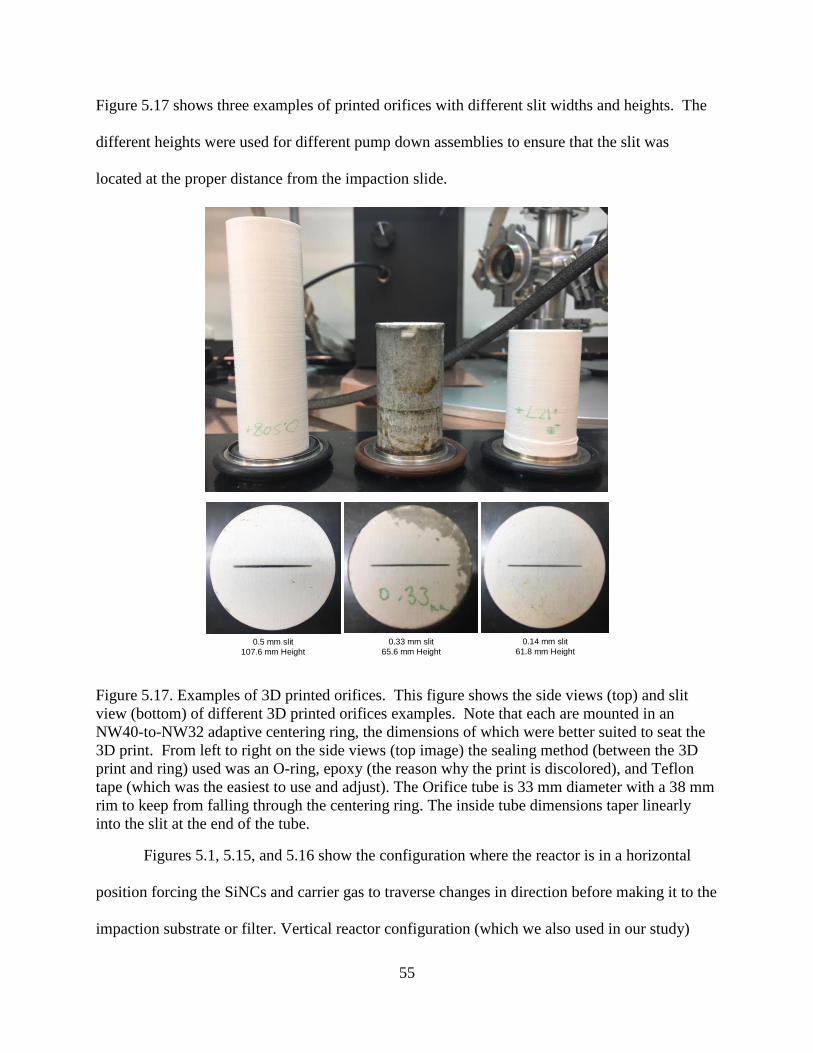
55
Figure 5.17 shows three examples of printed orifices with different slit widths and heights. The
different heights were used for different pump down assemblies to ensure that the slit was
located at the proper distance from the impaction slide.
0.5 mm slit
107.6 mm Height
0.33 mm slit
65.6 mm Height
0.14 mm slit
61.8 mm Height
Figure 5.17. Examples of 3D printed orifices. This figure shows the side views (top) and slit
view (bottom) of different 3D printed orifices examples. Note that each are mounted in an
NW40-to-NW32 adaptive centering ring, the dimensions of which were better suited to seat the
3D print. From left to right on the side views (top image) the sealing method (between the 3D
print and ring) used was an O-ring, epoxy (the reason why the print is discolored), and Teflon
tape (which was the easiest to use and adjust). The Orifice tube is 33 mm diameter with a 38 mm
rim to keep from falling through the centering ring. The inside tube dimensions taper linearly
into the slit at the end of the tube.
Figures 5.1, 5.15, and 5.16 show the configuration where the reactor is in a horizontal
position forcing the SiNCs and carrier gas to traverse changes in direction before making it to the
impaction substrate or filter. Vertical reactor configuration (which we also used in our study)
56
more easily allow for straight runs from synthesis to collection, which can reduce backpressure
and allow for either lower pressure and/or high flows, which are desirable for producing small
SiNCs (which we describe later). We do know the extent to which extended pathway or changes
in direction might contribute to loss of negative charge of the SiNCs and how this hypothetical
charge loss would affect sample collection efficiency. Another aspect of mild concern with the
configuration shown in Figure 5.X is that the carrier gas flows horizontally across the impaction
substrate, which can sometimes knock over the piles of SiNCs and blow them downstream (if
they are tall piles). A configuration where the carrier gas goes around the slide and vectors down
ward (with the pump down base assembly configured such that the vacuum pump line is below
the impaction substrate) would likely reduce this knocking over of tall piles.
We noted in two experiments where the filters were placed (and the gate valve load lock)
immediately downstream of the reactor in a vertical configuration, that the plasma afterglow was
close enough to the filters to depositing a very thin film of silicon (we assume) over the SiNCs
on the filter, destroying the quantum yield. Faint deposition was noted on the reactor tubes
proximate of the downstream disconnect. In both of these experiments the carrier gas flow was
very high (200 and 300 sccm) resulting in stretched out plasma.
5.5. Pump Down Base Assembly Considerations
As shown in the apparatus functional diagram in Figure 5.12, the pump down base
assembly interfaces with the reactor, accommodates the sample collection assembly and
facilitates the carrier gas flow to the vacuum pump. General consideration for the base are low
impedance to flow through the use of large size fittings without too many turns or constrictions.
The base is often the structural support of the sample collection assembly and sometimes the
reactor as well, so a stable mounting systems and robust design is needed. We employed a
57
unbored stub flange (LDS Vacuumshopper part number NW40-10-US) at the bottom a 6-way
cross, secured to a large electrical conduit compression connector mounted in a flange, which
was mounted to a large aluminum disk to serves as a structural support for the base assembly.
We frequently also employ a gate valve between the vacuum pump line and the rest of
the base assembly to regulate reactor pressure by controlling the flow the pump. We also
incorporated two vacuum pumps in parallel to provide higher capacity, which allowed for higher
flow rates of carrier gas without a rise in reactor pressure (within the limits of the dual pump
capacity).
5.6. Plasma Considerations (Impedance Matching, Cooling)
For the creation of high quality SiNCs, the plasma conditions in the reactor ideally
perform the following function in order: 1) at least partially de-bond CHS to start CHS
polymerizing into a network, 2) support the conditions for nucleation and growth of silicon
proto-particles, 3) support the densification of the nanoparticles to drive hydrogen out of the core
of the particle, 4) sustain the growth of the nanoparticle to the desired size, 5) provide sufficient
energy to crystalize the nanoparticle into SiNCs, 6) foster the development of a defect free
hydrogen terminated surface of the SiNCs, and 7) drop off in energy so as not to induce
undesired surface or core changes to the SiNCs.
The type of plasma generator most commonly used in this research area is 13.56 MHz
because that is designed by the FCC for experimental work, though some studies have used other
frequency bands including 144 MHz [61] and microwave bands [81], [82]. To our knowledge a
detailed study examining if frequency or waveform shape significantly effects non-thermal
plasma synthesis has not been performed, though there has been some experimentation with
square waves and duty cycle as a means to “dial in” crystallization [128].
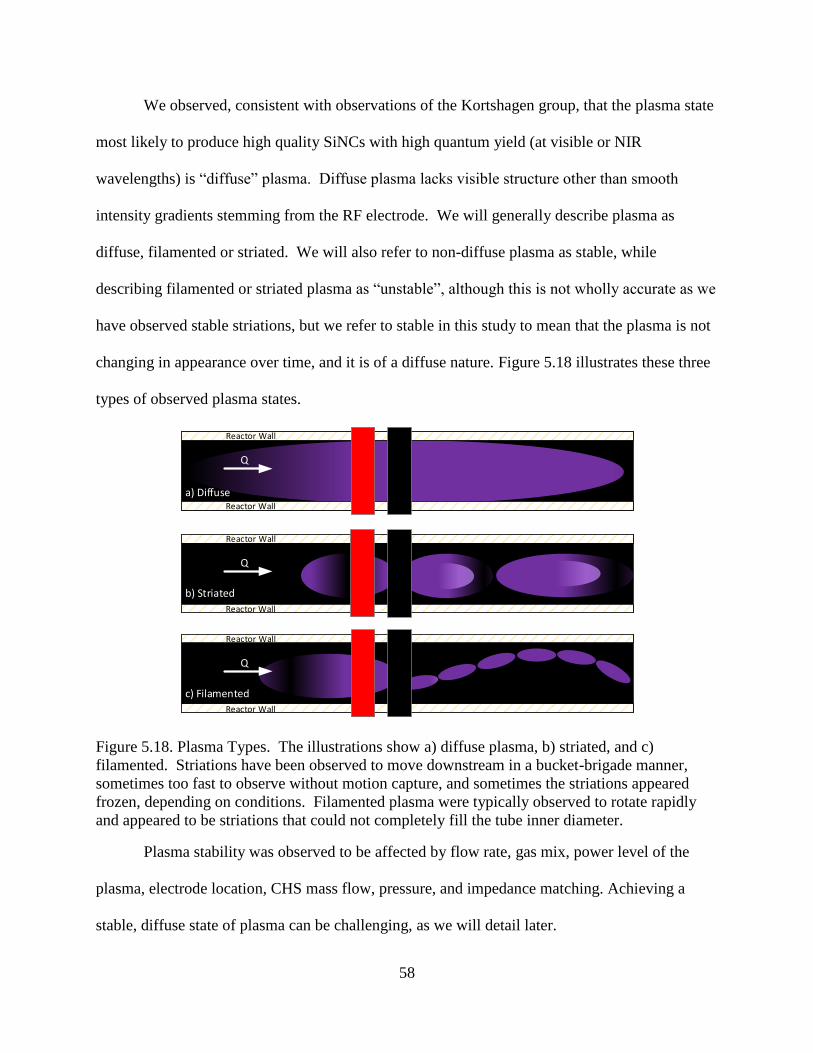
58
We observed, consistent with observations of the Kortshagen group, that the plasma state
most likely to produce high quality SiNCs with high quantum yield (at visible or NIR
wavelengths) is “diffuse” plasma. Diffuse plasma lacks visible structure other than smooth
intensity gradients stemming from the RF electrode. We will generally describe plasma as
diffuse, filamented or striated. We will also refer to non-diffuse plasma as stable, while
describing filamented or striated plasma as “unstable”, although this is not wholly accurate as we
have observed stable striations, but we refer to stable in this study to mean that the plasma is not
changing in appearance over time, and it is of a diffuse nature. Figure 5.18 illustrates these three
types of observed plasma states.
d)
Q
Reactor Wall
Reactor Wall
Q
Reactor Wall
Reactor Wall
d)
Q
Reactor Wall
Reactor Wall
a) Diffuse
b) Striated
c) Filamented
Figure 5.18. Plasma Types. The illustrations show a) diffuse plasma, b) striated, and c)
filamented. Striations have been observed to move downstream in a bucket-brigade manner,
sometimes too fast to observe without motion capture, and sometimes the striations appeared
frozen, depending on conditions. Filamented plasma were typically observed to rotate rapidly
and appeared to be striations that could not completely fill the tube inner diameter.
Plasma stability was observed to be affected by flow rate, gas mix, power level of the
plasma, electrode location, CHS mass flow, pressure, and impedance matching. Achieving a
stable, diffuse state of plasma can be challenging, as we will detail later.
59
We used a Seren R300 13.56 MHz plasma generator with a custom built interface to
power the plasma. This generator was purchased on ebay and required some repair. The Seren
R300 is rated for 300 watts of plasma which we found to be an order of magnitude more power
than we needed for our study. Previous published studies list a wide range of plasma power
wattage, many of these state power levels that are much higher than we observed was needed to
make high quality SiNCs, and this may be due to RF generators without proper impedance
matching and without a reflected power display, or from resistive heat losses. The Kortshagen
group calculated that the real power coupled to the plasma was only 8-10% of generated power
[128]. Plasma can have a complex impedance (that we observed changes when CHS is
introduced) and an impedance matching circuit with some adjustability is essential for
minimizing reflected power and knowing what the real wattage is going into the plasma.
The Kortshagen group shared with us the circuit used for impedance matching that had
worked well for them for most of their non-thermal plasma synthesis projects, which we used as
a starting design, but we added adjustable taps to the inductors. Normal tuning to minimize
reflected power is performed using the air-variable capacitor but the inductor taps were used to
find the inductance where the capacitor’s adjustable range could have the most tuning effect.
This was not a trivial undertaking. The high-voltage air-variable capacitor that is used at the
Kortshagen group appears to no longer be available and sourcing a viable replacement was
challenging. We found that even small changes to proximity of the components or the length of
wire connecting the components influences the impedance and can move the tunable range of the
full circuit out of the desired range. Heat management is an issue as well and a few promising
designs had to be abandoned due to poor thermal management. Fifteen revisions later we had a
working impedance matchbox. The schematic for our matchbox is shown in Figure 5.19. The
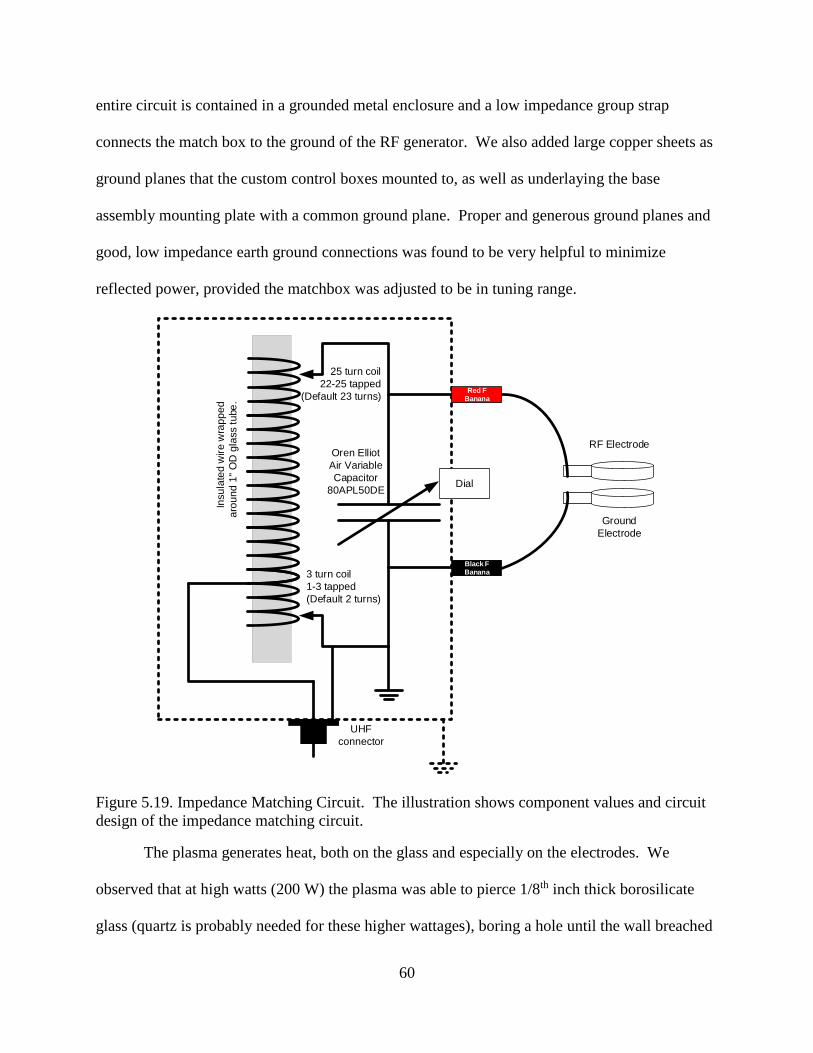
60
entire circuit is contained in a grounded metal enclosure and a low impedance group strap
connects the match box to the ground of the RF generator. We also added large copper sheets as
ground planes that the custom control boxes mounted to, as well as underlaying the base
assembly mounting plate with a common ground plane. Proper and generous ground planes and
good, low impedance earth ground connections was found to be very helpful to minimize
reflected power, provided the matchbox was adjusted to be in tuning range.
Black F Banana
Dial
UHF
connector
3 turn coil
1-3 tapped
(Default 2 turns)
Red F Banana
25 turn coil
22-25 tapped
(Default 23 turns)
Oren Elliot
Air Variable
Capacitor
80APL50DE
RF Electrode
Ground
Electrode
Insu
late
d w
ire
wra
pp
ed
aro
un
d 1
" O
D g
lass t
ube
.
Figure 5.19. Impedance Matching Circuit. The illustration shows component values and circuit
design of the impedance matching circuit.
The plasma generates heat, both on the glass and especially on the electrodes. We
observed that at high watts (200 W) the plasma was able to pierce 1/8th inch thick borosilicate
glass (quartz is probably needed for these higher wattages), boring a hole until the wall breached
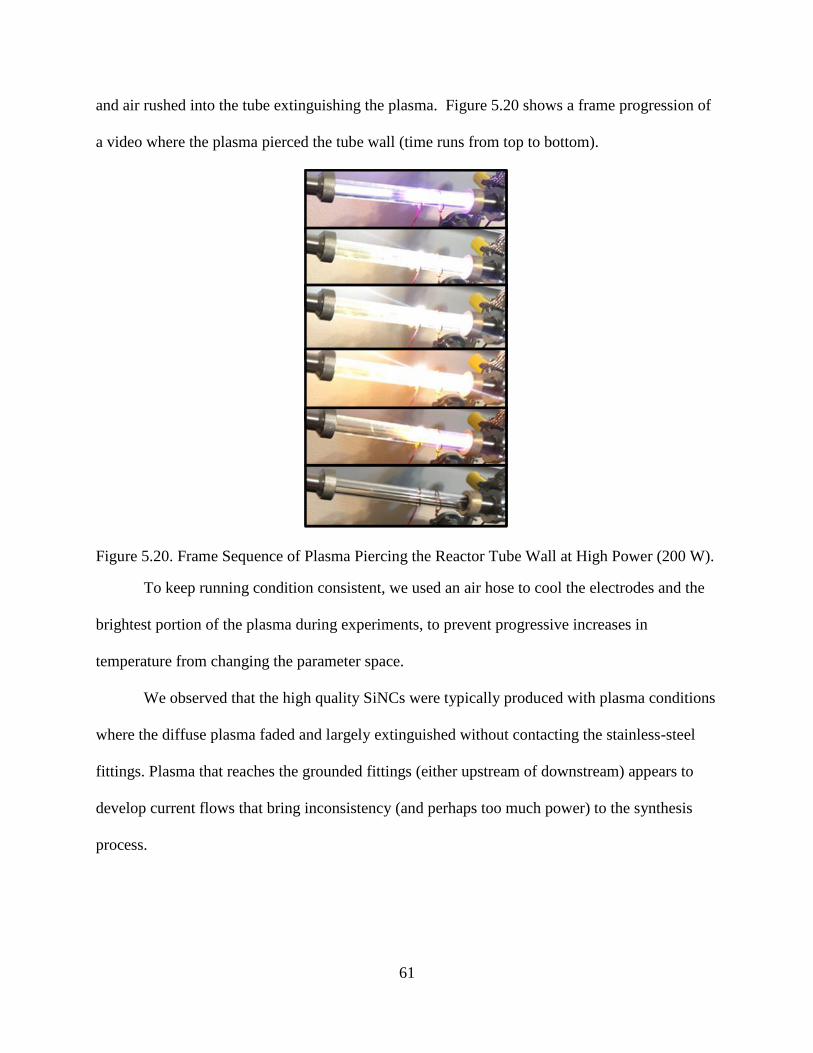
61
and air rushed into the tube extinguishing the plasma. Figure 5.20 shows a frame progression of
a video where the plasma pierced the tube wall (time runs from top to bottom).
Figure 5.20. Frame Sequence of Plasma Piercing the Reactor Tube Wall at High Power (200 W).
To keep running condition consistent, we used an air hose to cool the electrodes and the
brightest portion of the plasma during experiments, to prevent progressive increases in
temperature from changing the parameter space.
We observed that the high quality SiNCs were typically produced with plasma conditions
where the diffuse plasma faded and largely extinguished without contacting the stainless-steel
fittings. Plasma that reaches the grounded fittings (either upstream of downstream) appears to
develop current flows that bring inconsistency (and perhaps too much power) to the synthesis
process.
62
The RF energy source from the generator is sufficient to product RF burns and serious
electric shock. Care was taken when operating the generator to only use insulated materials to
adjust the electrode position.
5.7. Gas Flow Considerations
We have discussed some gas flow considerations in our discussion about bubbler
considerations, but flow as a process parameter effects many other parameters. Increasing the
mass flow rate of the total carrier gas into the reactor will increase net velocity (in the
downstream vector) of precursor and the growing particles in the reactor. It is natural then to
expect, and we observed, that increasing the velocity of the carrier gas and precursor flowing
into the reactor results in less time in residence of the reactor, which correspond to less time for
synthesis, resulting in smaller SiNCs. We will explore velocity and SiNCs size in more detail
later.
The mass flow controllers (MFCs) used were calibrated for standard cubic centimeters
per min (sccm), which is based on the mass of the gas the MFC is calibrated to, in a cubic
centimeter at standard temperature and pressure (STP). This flow is volumetric flow (Q) of the
gas if the flow was at STP, so to determine the volumetric flow rate through a reactor tube (under
experimental conditions) we must convert QSTP to Q(T,P) where T is the temperature of the gas in
the reactor tube, and P is the pressure, as show in Equation 5.3.
𝑄(𝑇,𝑃) = 𝑄𝑆𝑇𝑃𝑃𝑆𝑇𝑃𝑇
𝑃𝑇𝑆𝑇𝑃 (Eq. 5.3)
With proper electrode cooling, the temperature difference between STP and the bulk of
the gas flowing through the reactor is nearly identical (the plasma is non-thermal), leaving only
the ratio of pressure to convert Q, as shown in Equation 5.4.
𝑄(𝑇,𝑃) ≈ 𝑄𝑆𝑇𝑃𝑃𝑆𝑇𝑃
𝑃 (Eq. 5.4)
63
Pressure in torr at STP is 760, while a typical pressure of the reactor tube is 1 to 2 Torr,
so volumetrically the gas is 380 to 760 times more voluminous (or 1/380 to 1/760 as dense). So
an MFC set to 60 sccm would be 60 cubic centimeter per minute, or 1 cc per second, if the gas
was at STP. At 1 torr that gas at 60 sccm or 1 scc/sec is flowing at 45,600 cc/min or 760 cc/sec
(keep in mind the mass is the same, that mass is just spread out to a volume 760 times larger). To
convert the Q at the reactor pressure to the net velocity of the mass moving in the direction of the
flow (ignoring individual atomic level velocities not in the direction of Q) we need to know the
area that Q is constricted to, as shown in Equation 5.5.
𝑉𝑒𝑙𝑜𝑐𝑖𝑡𝑦 =𝑄(𝑇,𝑃)
𝐴𝑟𝑒𝑎=
𝑄(𝑆𝑇𝑃)
𝐴
𝑃𝑆𝑇𝑃𝑇
𝑃𝑇𝑆𝑇𝑃≈
𝑄(𝑆𝑇𝑃)𝑃𝑆𝑇𝑃
𝐴𝑃 (Eq. 5.5)
We take the flow from the MFC in sccm, multiply it by the pressure ratio, and divide by
the cross-section areas of the inside diameter of the reactor tube to get net velocity of the flow in
the tube. This velocity can be used to calculate the residence time of the mass flowing through a
section of the plasma, and as expected (and as previously established by Mangolini [125]) we
observe high correlation between residence time and SiNC size, but which area of the plasma
dictates SiNC size is complicated (and flow effects the plasma so it’s also confounded) and will
be discussed later.
We calculated Reynolds numbers of argon for the range of tube sizes used in our study, at
the mass flow rates typically used for the study, and found that the smallest tube size (0.22” ID)
was consistently turbulent flow while the largest tube size was transitional (between laminar and
turbulent) depending on the flow rate. We have not explored the literature to understand how the
plasma affects this, but it is assumed that plasma would have a net dis-ordering effect on any
structured flow and would likely push transitional flow more towards turbulent. Understanding
this flow complexity may allow for the design of a reactor where, with proper manipulation of
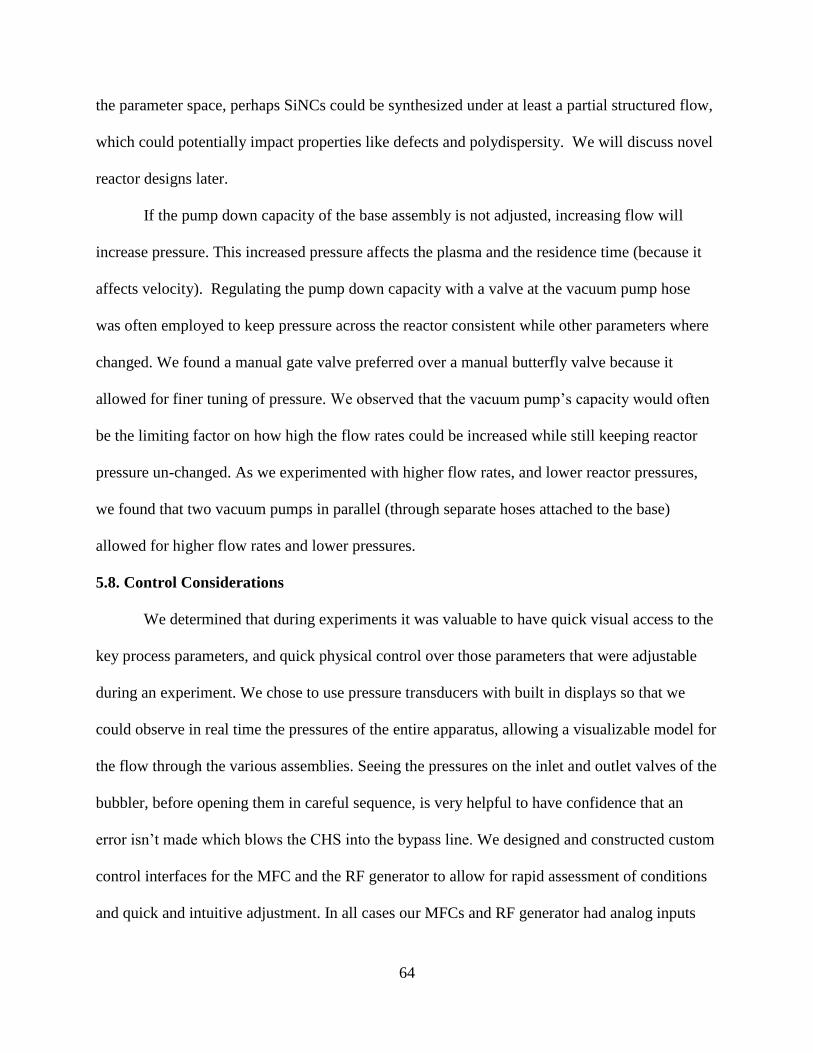
64
the parameter space, perhaps SiNCs could be synthesized under at least a partial structured flow,
which could potentially impact properties like defects and polydispersity. We will discuss novel
reactor designs later.
If the pump down capacity of the base assembly is not adjusted, increasing flow will
increase pressure. This increased pressure affects the plasma and the residence time (because it
affects velocity). Regulating the pump down capacity with a valve at the vacuum pump hose
was often employed to keep pressure across the reactor consistent while other parameters where
changed. We found a manual gate valve preferred over a manual butterfly valve because it
allowed for finer tuning of pressure. We observed that the vacuum pump’s capacity would often
be the limiting factor on how high the flow rates could be increased while still keeping reactor
pressure un-changed. As we experimented with higher flow rates, and lower reactor pressures,
we found that two vacuum pumps in parallel (through separate hoses attached to the base)
allowed for higher flow rates and lower pressures.
5.8. Control Considerations
We determined that during experiments it was valuable to have quick visual access to the
key process parameters, and quick physical control over those parameters that were adjustable
during an experiment. We chose to use pressure transducers with built in displays so that we
could observe in real time the pressures of the entire apparatus, allowing a visualizable model for
the flow through the various assemblies. Seeing the pressures on the inlet and outlet valves of the
bubbler, before opening them in careful sequence, is very helpful to have confidence that an
error isn’t made which blows the CHS into the bypass line. We designed and constructed custom
control interfaces for the MFC and the RF generator to allow for rapid assessment of conditions
and quick and intuitive adjustment. In all cases our MFCs and RF generator had analog inputs
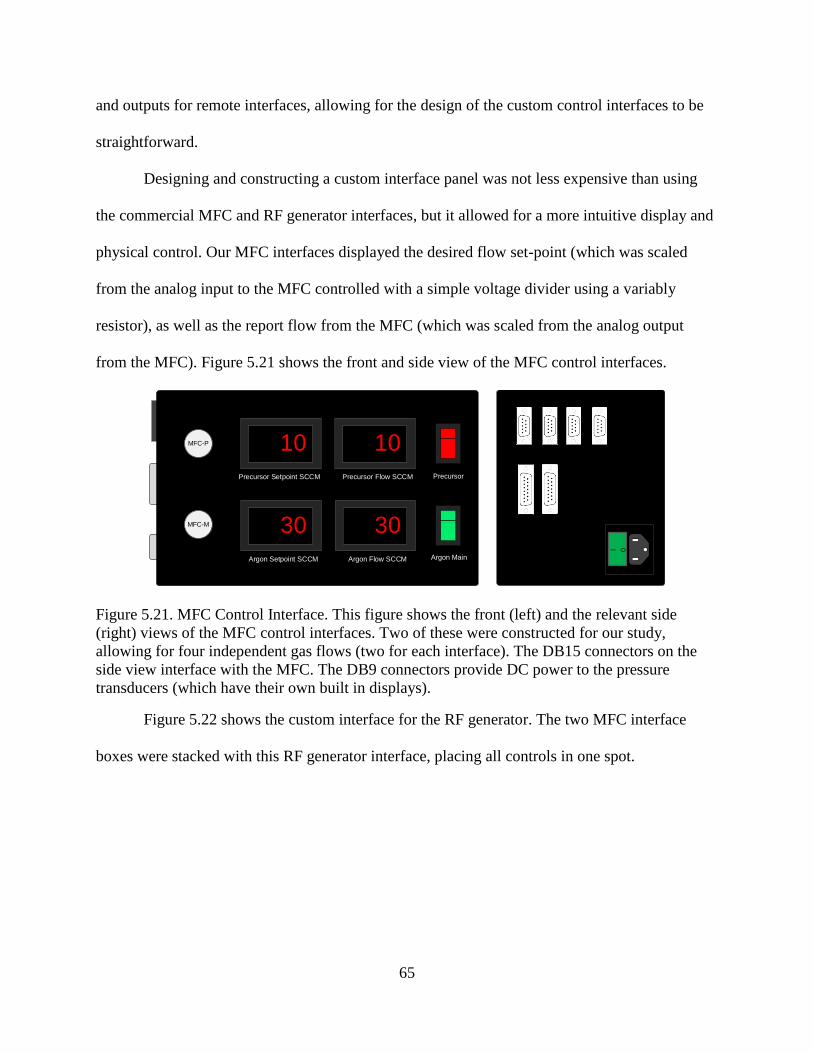
65
and outputs for remote interfaces, allowing for the design of the custom control interfaces to be
straightforward.
Designing and constructing a custom interface panel was not less expensive than using
the commercial MFC and RF generator interfaces, but it allowed for a more intuitive display and
physical control. Our MFC interfaces displayed the desired flow set-point (which was scaled
from the analog input to the MFC controlled with a simple voltage divider using a variably
resistor), as well as the report flow from the MFC (which was scaled from the analog output
from the MFC). Figure 5.21 shows the front and side view of the MFC control interfaces.
Precursor Setpoint SCCM Precursor Flow SCCM
Argon Setpoint SCCM Argon Flow SCCM Argon Main
Precursor
10 10
30 30MFC-M
MFC-P
I 0
Figure 5.21. MFC Control Interface. This figure shows the front (left) and the relevant side
(right) views of the MFC control interfaces. Two of these were constructed for our study,
allowing for four independent gas flows (two for each interface). The DB15 connectors on the
side view interface with the MFC. The DB9 connectors provide DC power to the pressure
transducers (which have their own built in displays).
Figure 5.22 shows the custom interface for the RF generator. The two MFC interface
boxes were stacked with this RF generator interface, placing all controls in one spot.
66
RF Setpoint
RF Forward Power RF Reflected PowerAC Main
RF
12
11 1
Cap pot knob
DB
-25
Ma
le
Figure 5.22. RF Generator Control Interface. This figure shows the custom interface for the
Seren R300 13.56 MHz RF generator. On the side was the DB25 connector the generator.
The impedance match box was described above, and its only controllable feature (during
an experiment) was the dial to adjust the air variable capacitance.
All control boxes were built in metal enclosures and secured to a large copper sheet
which connected to the copper ground plane, which was connected to earth ground.
The MFCs were purchased on eBay and had to be validated and sometime re-calibrated
with gain and offset adjustments. Most of the Instrutech Stingers were eBay and had to be
validated and sometimes re-calibrated. Because Stingers are not gas independent pressure
transducers, look up tables to map displayed pressure to true pressure had be empirically derived
using a gas-independent pressure transducer. We purchased an Instrutech Micro Bee and an
Instrutech Busy Bee with gas independence across a desired range, which were incorporated in
later parts of the study to get real time true pressure reading on the downstream side of the
reactor (just to reduce the need for conversion).
5.9. Discussion on Parameter Space
We defined the parameter space for this study as those variables that affect the properties
of the SiNCs during non-thermal plasma synthesis. These parameters include:
• Flow rate of carrier gas
• Mass flow rate of CHS

67
• The mix ratio of the carrier gas
• The type of gas or gases used for the carrier gas
• Type of gas and flow rate of sideport injection gas
• The dimensions of the reactor (lengths, shape, features including sideport injection
and expansions)
• The type and location of electrodes (include their distance from each other)
• The temperature in the reactor
• The location and flow of cooling gas over the electrode and plasma
• The power level (net power, which is forward power minus reflected power)
• The pressure across the reactor
Needless to say, this is a large parameter space. But this parameter definition is not
comprehensive and excludes the conditions and method of sample collection, the methods of
decontamination and purging, the effects on the plasma from spatial intrusions around the RF
field (objects, including hands, in the proximity of the plasma can affect the plasma), parameters
that effect CHS production, storage, and transport, parameters related to passivation and other
post-processing, and others too numerous or unknown.
A major added challenge to the complexity of the parameter space is the interactions
where changing one parameter affects another. Through a review of the literature, and
manipulation of parameters across 126 experiments, we have developed a general, high level,
understanding of many of these interactions. Often these interactions work against the intent of
the original changed parameter. For example, increasing carrier gas mass flow in order to reduce
SiNCs size (which we will refer to as blue-shifting the SiNC since the PL will shift to shorter
wavelengths when the SiNC size is reduced) by increasing the net velocity downstream of the
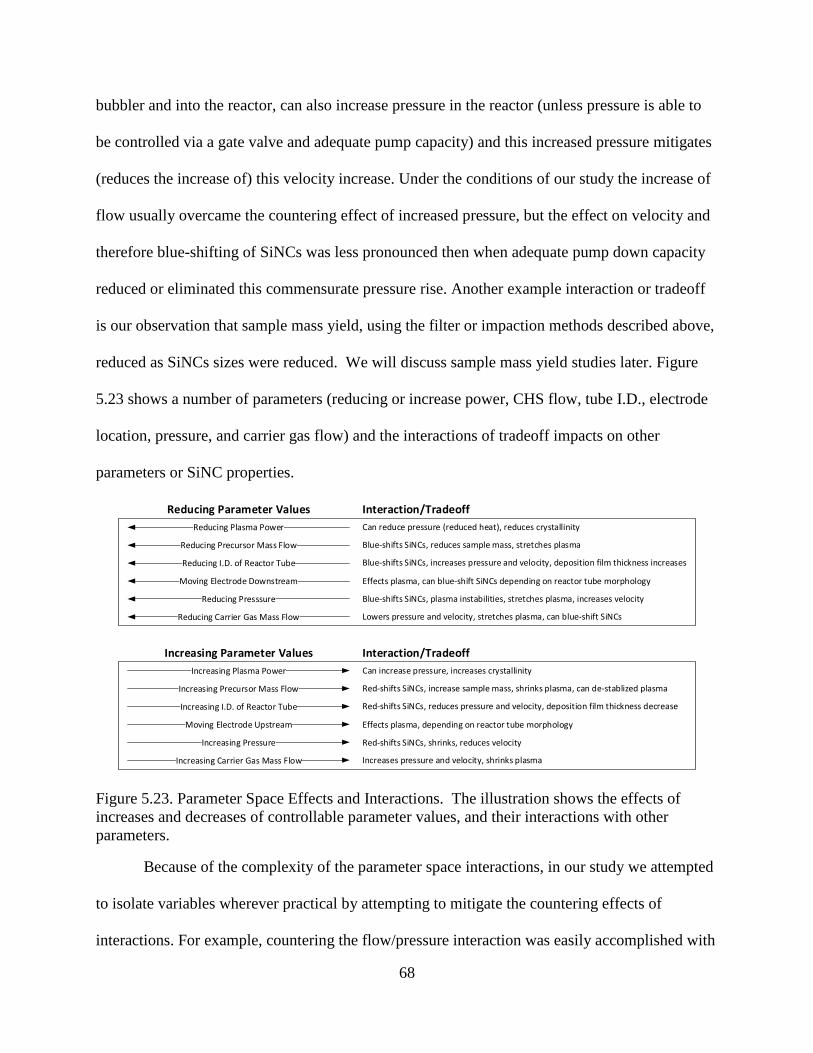
68
bubbler and into the reactor, can also increase pressure in the reactor (unless pressure is able to
be controlled via a gate valve and adequate pump capacity) and this increased pressure mitigates
(reduces the increase of) this velocity increase. Under the conditions of our study the increase of
flow usually overcame the countering effect of increased pressure, but the effect on velocity and
therefore blue-shifting of SiNCs was less pronounced then when adequate pump down capacity
reduced or eliminated this commensurate pressure rise. Another example interaction or tradeoff
is our observation that sample mass yield, using the filter or impaction methods described above,
reduced as SiNCs sizes were reduced. We will discuss sample mass yield studies later. Figure
5.23 shows a number of parameters (reducing or increase power, CHS flow, tube I.D., electrode
location, pressure, and carrier gas flow) and the interactions of tradeoff impacts on other
parameters or SiNC properties.
Reducing Carrier Gas Mass Flow
Reducing Presssure
Moving Electrode Downstream
Reducing I.D. of Reactor Tube
Reducing Precursor Mass Flow
Reducing Plasma Power
Interaction/Tradeoff
Can reduce pressure (reduced heat), reduces crystallinity
Blue-shifts SiNCs, reduces sample mass, stretches plasma
Blue-shifts SiNCs, increases pressure and velocity, deposition film thickness increases
Effects plasma, can blue-shift SiNCs depending on reactor tube morphology
Blue-shifts SiNCs, plasma instabilities, stretches plasma, increases velocity
Lowers pressure and velocity, stretches plasma, can blue-shift SiNCs
Reducing Parameter Values
Increasing Carrier Gas Mass Flow
Increasing Pressure
Moving Electrode Upstream
Increasing I.D. of Reactor Tube
Increasing Precursor Mass Flow
Increasing Plasma Power Can increase pressure, increases crystallinity
Red-shifts SiNCs, increase sample mass, shrinks plasma, can de-stablized plasma
Red-shifts SiNCs, reduces pressure and velocity, deposition film thickness decrease
Effects plasma, depending on reactor tube morphology
Increases pressure and velocity, shrinks plasma
Increasing Parameter Values
Red-shifts SiNCs, shrinks, reduces velocity
Interaction/Tradeoff
Figure 5.23. Parameter Space Effects and Interactions. The illustration shows the effects of
increases and decreases of controllable parameter values, and their interactions with other
parameters.
Because of the complexity of the parameter space interactions, in our study we attempted
to isolate variables wherever practical by attempting to mitigate the countering effects of
interactions. For example, countering the flow/pressure interaction was easily accomplished with
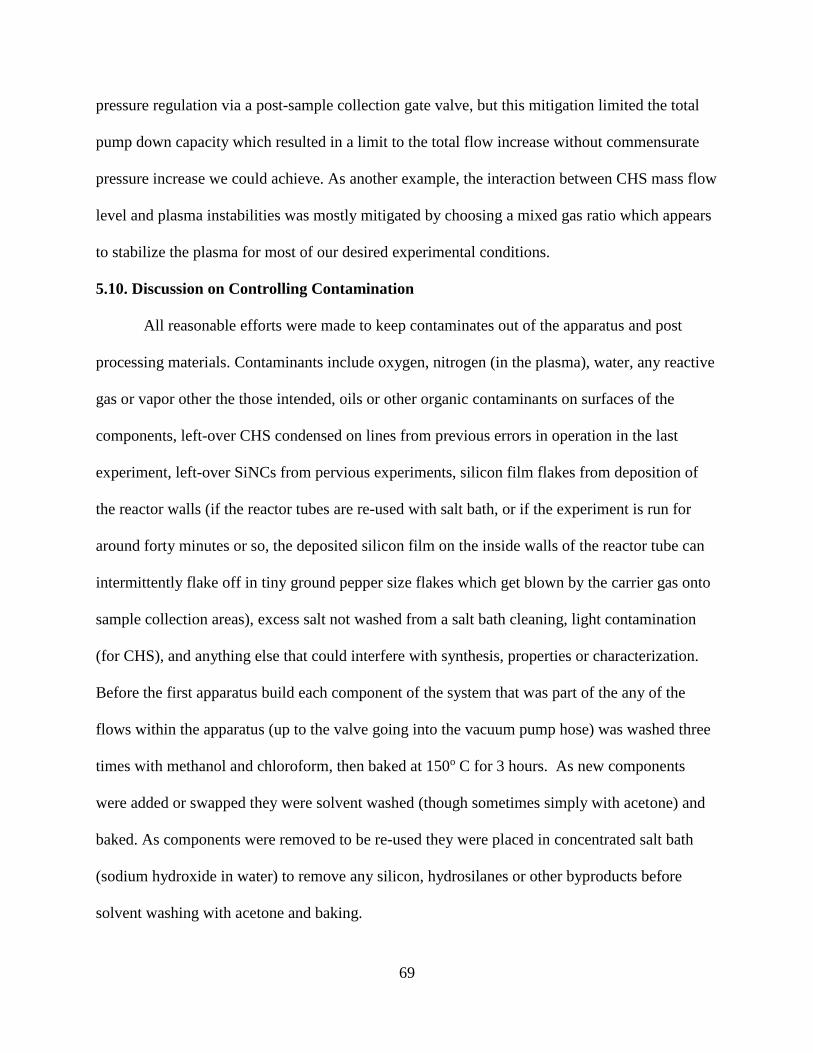
69
pressure regulation via a post-sample collection gate valve, but this mitigation limited the total
pump down capacity which resulted in a limit to the total flow increase without commensurate
pressure increase we could achieve. As another example, the interaction between CHS mass flow
level and plasma instabilities was mostly mitigated by choosing a mixed gas ratio which appears
to stabilize the plasma for most of our desired experimental conditions.
5.10. Discussion on Controlling Contamination
All reasonable efforts were made to keep contaminates out of the apparatus and post
processing materials. Contaminants include oxygen, nitrogen (in the plasma), water, any reactive
gas or vapor other the those intended, oils or other organic contaminants on surfaces of the
components, left-over CHS condensed on lines from previous errors in operation in the last
experiment, left-over SiNCs from pervious experiments, silicon film flakes from deposition of
the reactor walls (if the reactor tubes are re-used with salt bath, or if the experiment is run for
around forty minutes or so, the deposited silicon film on the inside walls of the reactor tube can
intermittently flake off in tiny ground pepper size flakes which get blown by the carrier gas onto
sample collection areas), excess salt not washed from a salt bath cleaning, light contamination
(for CHS), and anything else that could interfere with synthesis, properties or characterization.
Before the first apparatus build each component of the system that was part of the any of the
flows within the apparatus (up to the valve going into the vacuum pump hose) was washed three
times with methanol and chloroform, then baked at 150o C for 3 hours. As new components
were added or swapped they were solvent washed (though sometimes simply with acetone) and
baked. As components were removed to be re-used they were placed in concentrated salt bath
(sodium hydroxide in water) to remove any silicon, hydrosilanes or other byproducts before
solvent washing with acetone and baking.

70
As discussed we used VCR fittings instead of Swagelok fittings wherever possible. We
avoided polymer cored flex lines in any part of the system that operated under low pressure (to
prevent oxygen diffusion through the tubing from getting into the flow lines). We did use braid-
armored fluoropolymer tubing between the hydrogen tank and the hydrogen gas MFC, and we
used un-armored fluoropolymer tubing between the carrier gas tank and the other MFCs, but we
always maintained greater than atmospheric pressure in these lines to prevent inward diffusion of
air through the tube walls.
Pressure loss tests were done on sub-sections of the apparatus on static low pressure to
chase down and correct leaks. Helium leak testers are great tools if you have access to them.
When not in operation, or purging, we maintained greater than atmospheric pressure across all
lines in the apparatus so any minor leaks that might be present would leak carrier gas outward.
During shutdown the CHS bubbler outlet valve was closed, allowing the inlet gas to bring the
bubbler to higher than atmospheric pressure before the inlet valve was closed.
Filters were solvent washed and baked, as were all substrates used for impaction. Care
was taken to keep the glove box at less than 1 ppm O2, preferably down to the lowest readable
level of the sensor, often 0.2 ppm O2, if practical. Passivation was performed in strict air-free
manner, and SiNCs in solvent, post passivation were stored in a glove box.
FTIR inside an air-free glove box is a very helpful tool to evaluate SiNCs for potential
exposure to contamination, as discussed earlier. When performing characterization where an air-
free environment was not practical (such as the air exposure to TEM grids as they are placed into
the TEM) care was taken to keep the SiNCs in sealed containers containing nitrogen or argon for
storage and transport and only opened to be immediately mounted and characterized (this applied
to Raman and XRD, as well as TEM).

71
We used both industrial grade and research grade gasses for our studies. With industrial
grade argon/hydrogen mixed at 95/5 assumed (but not tested) to be about 2-4 ppm oxygen we
were still able to produce very high quality SiNCs with “unpurifed” quantum yields of close to
60% and size separated “purified” quantum yields greater than 70%. With research grade
argon/hydrogen at 95/5 ratio we exceeded 60% (shown later).
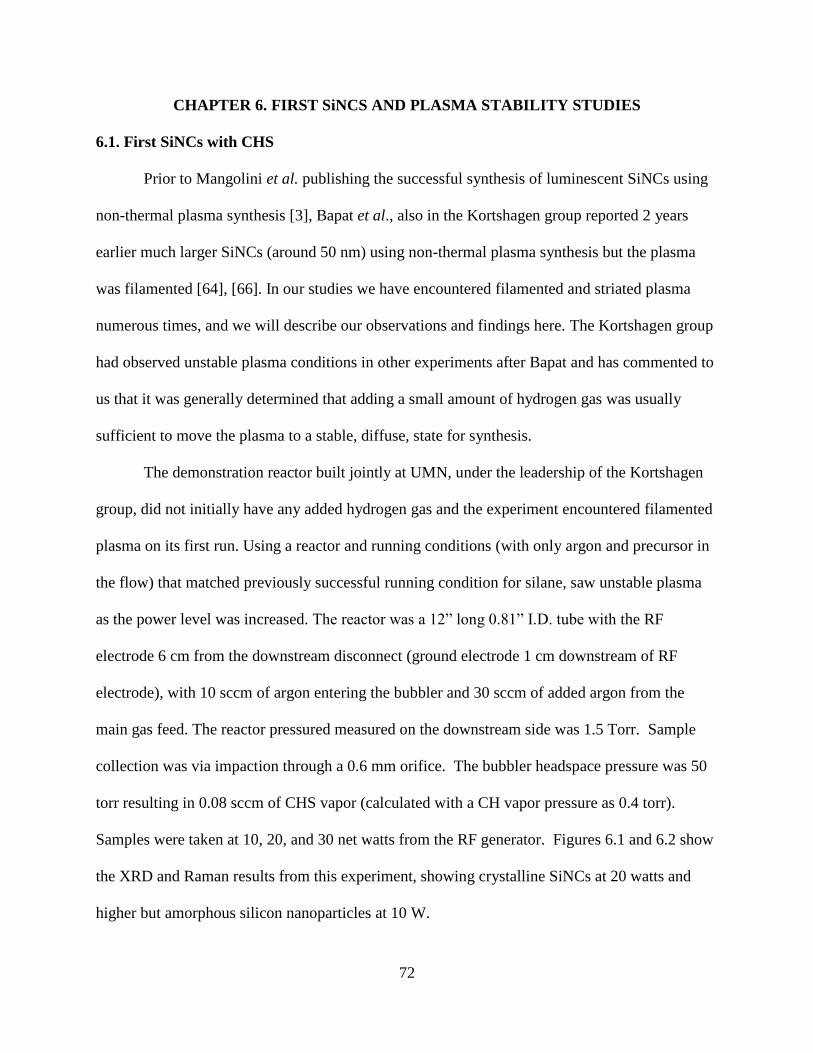
72
CHAPTER 6. FIRST SiNCS AND PLASMA STABILITY STUDIES
6.1. First SiNCs with CHS
Prior to Mangolini et al. publishing the successful synthesis of luminescent SiNCs using
non-thermal plasma synthesis [3], Bapat et al., also in the Kortshagen group reported 2 years
earlier much larger SiNCs (around 50 nm) using non-thermal plasma synthesis but the plasma
was filamented [64], [66]. In our studies we have encountered filamented and striated plasma
numerous times, and we will describe our observations and findings here. The Kortshagen group
had observed unstable plasma conditions in other experiments after Bapat and has commented to
us that it was generally determined that adding a small amount of hydrogen gas was usually
sufficient to move the plasma to a stable, diffuse, state for synthesis.
The demonstration reactor built jointly at UMN, under the leadership of the Kortshagen
group, did not initially have any added hydrogen gas and the experiment encountered filamented
plasma on its first run. Using a reactor and running conditions (with only argon and precursor in
the flow) that matched previously successful running condition for silane, saw unstable plasma
as the power level was increased. The reactor was a 12” long 0.81” I.D. tube with the RF
electrode 6 cm from the downstream disconnect (ground electrode 1 cm downstream of RF
electrode), with 10 sccm of argon entering the bubbler and 30 sccm of added argon from the
main gas feed. The reactor pressured measured on the downstream side was 1.5 Torr. Sample
collection was via impaction through a 0.6 mm orifice. The bubbler headspace pressure was 50
torr resulting in 0.08 sccm of CHS vapor (calculated with a CH vapor pressure as 0.4 torr).
Samples were taken at 10, 20, and 30 net watts from the RF generator. Figures 6.1 and 6.2 show
the XRD and Raman results from this experiment, showing crystalline SiNCs at 20 watts and
higher but amorphous silicon nanoparticles at 10 W.
73
Figure 6.1. XRD of the First Experiment of Demonstration Apparatus. In this XRD plot, at 20
W and 30 W, crystalline planes (111, 220, 311) corresponding to SiNCs were visible.
Figure 6.2. Raman of First Experiment of Demonstration Apparatus. This graph shows a similar
trend to Figure 6.1, with amorphous structures at 10 W and crystalline and the main ≈520 cm-1
silicon crystalline peak emerging at 20 W and narrowing and rising at 30 W.
TEM images of this first run of CHS at the demonstration reactor revealed amorphous
particles at 10 W, as expected, and particles more consistent with SiNCs for 20 and 30 W, but
TEM also show outliers consisting of much larger nanoparticles mixed with a distribution of
SiNCs, the outliers getting bigger and more numerous at the highest power level. Figure 6.3
shows a TEM image of nanoparticles from the 20 W sample and the subsequent size distribution

74
performed visually form an assortment of representative TEM images. Likewise Figure 6.4
shows the same for the 30 W sample. Note the size disparity of the outliers.
Figure 6.3. TEM and Size Histogram of 20 W Sample from the First Experiment of
Demonstration Reactor.
Figure 6.4. TEM and Size Histogram of 30 W Sample from the First Experiment of
Demonstration Apparatus.
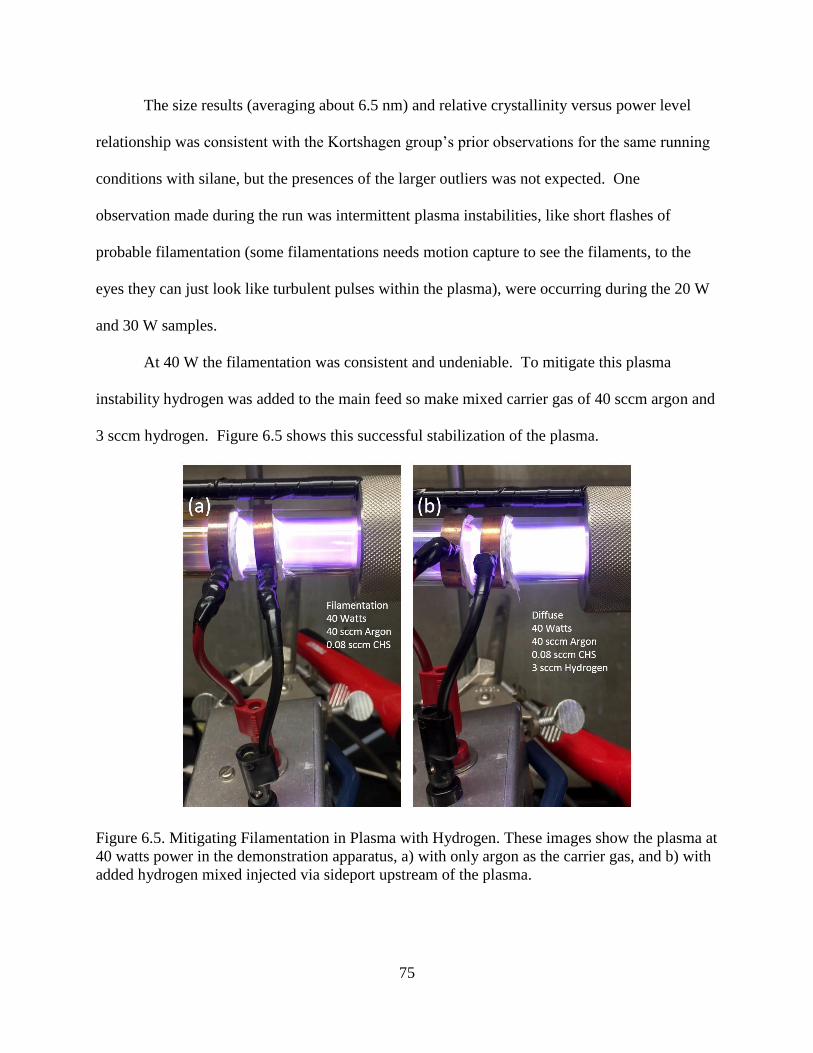
75
The size results (averaging about 6.5 nm) and relative crystallinity versus power level
relationship was consistent with the Kortshagen group’s prior observations for the same running
conditions with silane, but the presences of the larger outliers was not expected. One
observation made during the run was intermittent plasma instabilities, like short flashes of
probable filamentation (some filamentations needs motion capture to see the filaments, to the
eyes they can just look like turbulent pulses within the plasma), were occurring during the 20 W
and 30 W samples.
At 40 W the filamentation was consistent and undeniable. To mitigate this plasma
instability hydrogen was added to the main feed so make mixed carrier gas of 40 sccm argon and
3 sccm hydrogen. Figure 6.5 shows this successful stabilization of the plasma.
Figure 6.5. Mitigating Filamentation in Plasma with Hydrogen. These images show the plasma at
40 watts power in the demonstration apparatus, a) with only argon as the carrier gas, and b) with
added hydrogen mixed injected via sideport upstream of the plasma.
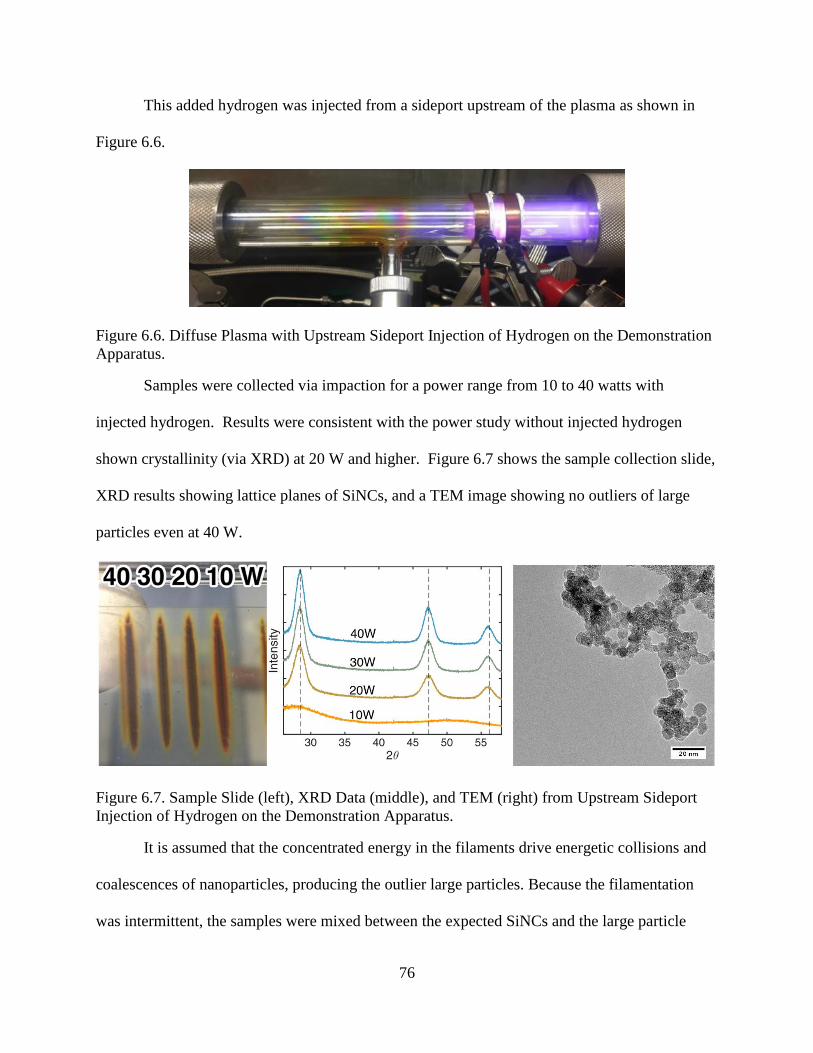
76
This added hydrogen was injected from a sideport upstream of the plasma as shown in
Figure 6.6.
Figure 6.6. Diffuse Plasma with Upstream Sideport Injection of Hydrogen on the Demonstration
Apparatus.
Samples were collected via impaction for a power range from 10 to 40 watts with
injected hydrogen. Results were consistent with the power study without injected hydrogen
shown crystallinity (via XRD) at 20 W and higher. Figure 6.7 shows the sample collection slide,
XRD results showing lattice planes of SiNCs, and a TEM image showing no outliers of large
particles even at 40 W.
Figure 6.7. Sample Slide (left), XRD Data (middle), and TEM (right) from Upstream Sideport
Injection of Hydrogen on the Demonstration Apparatus.
It is assumed that the concentrated energy in the filaments drive energetic collisions and
coalescences of nanoparticles, producing the outlier large particles. Because the filamentation
was intermittent, the samples were mixed between the expected SiNCs and the large particle
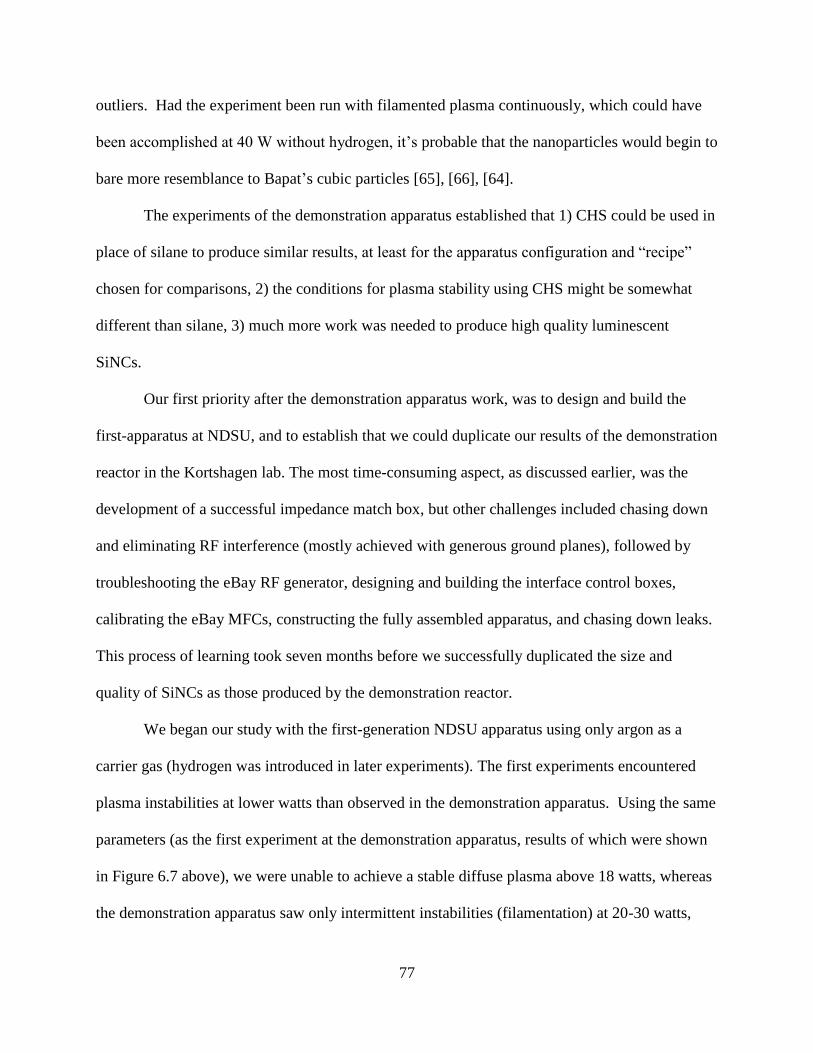
77
outliers. Had the experiment been run with filamented plasma continuously, which could have
been accomplished at 40 W without hydrogen, it’s probable that the nanoparticles would begin to
bare more resemblance to Bapat’s cubic particles [65], [66], [64].
The experiments of the demonstration apparatus established that 1) CHS could be used in
place of silane to produce similar results, at least for the apparatus configuration and “recipe”
chosen for comparisons, 2) the conditions for plasma stability using CHS might be somewhat
different than silane, 3) much more work was needed to produce high quality luminescent
SiNCs.
Our first priority after the demonstration apparatus work, was to design and build the
first-apparatus at NDSU, and to establish that we could duplicate our results of the demonstration
reactor in the Kortshagen lab. The most time-consuming aspect, as discussed earlier, was the
development of a successful impedance match box, but other challenges included chasing down
and eliminating RF interference (mostly achieved with generous ground planes), followed by
troubleshooting the eBay RF generator, designing and building the interface control boxes,
calibrating the eBay MFCs, constructing the fully assembled apparatus, and chasing down leaks.
This process of learning took seven months before we successfully duplicated the size and
quality of SiNCs as those produced by the demonstration reactor.
We began our study with the first-generation NDSU apparatus using only argon as a
carrier gas (hydrogen was introduced in later experiments). The first experiments encountered
plasma instabilities at lower watts than observed in the demonstration apparatus. Using the same
parameters (as the first experiment at the demonstration apparatus, results of which were shown
in Figure 6.7 above), we were unable to achieve a stable diffuse plasma above 18 watts, whereas
the demonstration apparatus saw only intermittent instabilities (filamentation) at 20-30 watts,

78
with consistent filamentation at 40 watts (so the threshold for continuous filamentation at the
demonstration reactor was somewhere above 30 W).
This consistent filamentation above 18 W also for the first-generation apparatus at NDSU
clogged the orifice with nanoparticles and rapidly built up backpressure requiring the experiment
be stopped. We had to account for why the large discrepancy between the power levels threshold
for plasma stability (versus the demonstration apparatus), and why our orifice was plugging
under unstable plasma.
The filamentation experienced at the conditions (pressure, flow, gas type, power, and
reactor/electrode morphologies) of the demonstration apparatus and the first-generation
apparatus at NDSU only occurred with CHS present. Only under very different conditions
(outside of the pressure range used in the study for synthesizing SiNCs) could we produce a
slowly rotating filamentation without CHS, but under the experiment conditions for producing
SiNCs it was the addition of CHS that was the critical change that could destabilize the plasma.
This effect is likely because adding precursor and subsequent nanoparticles creates a so-called
“dusty plasma”, which has additional complexity and wave behavior [108]. Unlike filaments, we
did see striations in the plasma for certain reactor morphologies at some experimental conditions
for producing SiNCs but also without CHS present. Recall from Figure 6.6 that filaments appear
as a thin thread of striations, with the thread itself showing 3D wave behavior.
After several experiments we observed that there were several parameters that affected
plasma stability, and we could usually manipulate one parameter at time and find the instability
thresholds at several points in the parameter space (power level being already discussed). We
will discuss our findings about plasma instability and parameter space shortly, but one parameter
we observed early on with the first-generation apparatus that effected plasma stability was CHS
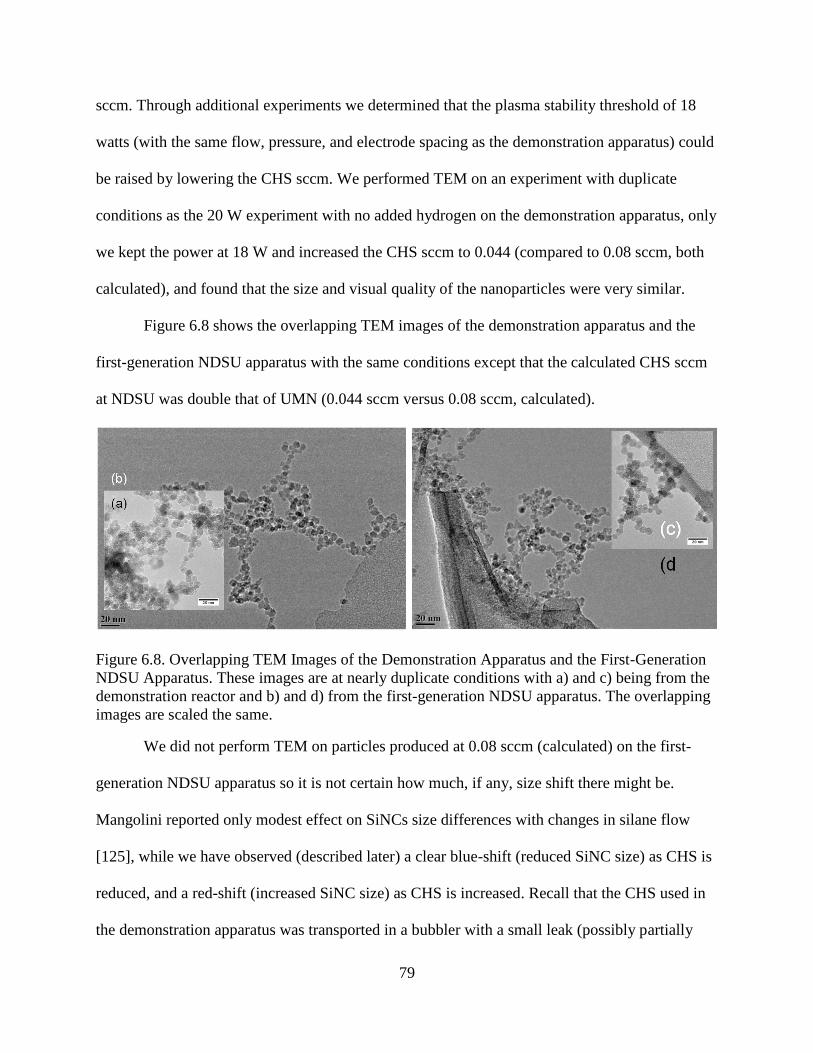
79
sccm. Through additional experiments we determined that the plasma stability threshold of 18
watts (with the same flow, pressure, and electrode spacing as the demonstration apparatus) could
be raised by lowering the CHS sccm. We performed TEM on an experiment with duplicate
conditions as the 20 W experiment with no added hydrogen on the demonstration apparatus, only
we kept the power at 18 W and increased the CHS sccm to 0.044 (compared to 0.08 sccm, both
calculated), and found that the size and visual quality of the nanoparticles were very similar.
Figure 6.8 shows the overlapping TEM images of the demonstration apparatus and the
first-generation NDSU apparatus with the same conditions except that the calculated CHS sccm
at NDSU was double that of UMN (0.044 sccm versus 0.08 sccm, calculated).
Figure 6.8. Overlapping TEM Images of the Demonstration Apparatus and the First-Generation
NDSU Apparatus. These images are at nearly duplicate conditions with a) and c) being from the
demonstration reactor and b) and d) from the first-generation NDSU apparatus. The overlapping
images are scaled the same.
We did not perform TEM on particles produced at 0.08 sccm (calculated) on the first-
generation NDSU apparatus so it is not certain how much, if any, size shift there might be.
Mangolini reported only modest effect on SiNCs size differences with changes in silane flow
[125], while we have observed (described later) a clear blue-shift (reduced SiNC size) as CHS is
reduced, and a red-shift (increased SiNC size) as CHS is increased. Recall that the CHS used in
the demonstration apparatus was transported in a bubbler with a small leak (possibly partially
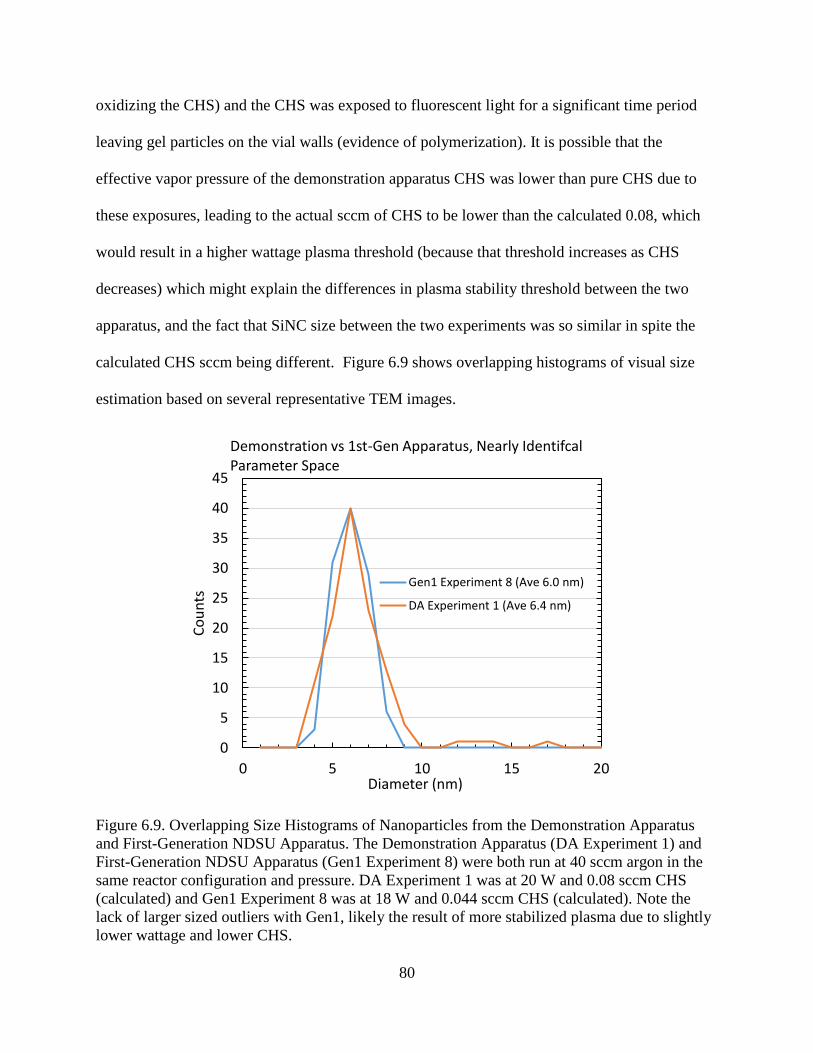
80
oxidizing the CHS) and the CHS was exposed to fluorescent light for a significant time period
leaving gel particles on the vial walls (evidence of polymerization). It is possible that the
effective vapor pressure of the demonstration apparatus CHS was lower than pure CHS due to
these exposures, leading to the actual sccm of CHS to be lower than the calculated 0.08, which
would result in a higher wattage plasma threshold (because that threshold increases as CHS
decreases) which might explain the differences in plasma stability threshold between the two
apparatus, and the fact that SiNC size between the two experiments was so similar in spite the
calculated CHS sccm being different. Figure 6.9 shows overlapping histograms of visual size
estimation based on several representative TEM images.
Figure 6.9. Overlapping Size Histograms of Nanoparticles from the Demonstration Apparatus
and First-Generation NDSU Apparatus. The Demonstration Apparatus (DA Experiment 1) and
First-Generation NDSU Apparatus (Gen1 Experiment 8) were both run at 40 sccm argon in the
same reactor configuration and pressure. DA Experiment 1 was at 20 W and 0.08 sccm CHS
(calculated) and Gen1 Experiment 8 was at 18 W and 0.044 sccm CHS (calculated). Note the
lack of larger sized outliers with Gen1, likely the result of more stabilized plasma due to slightly
lower wattage and lower CHS.
0
5
10
15
20
25
30
35
40
45
0 5 10 15 20
Co
un
ts
Diameter (nm)
Demonstration vs 1st-Gen Apparatus, Nearly Identifcal Parameter Space
Gen1 Experiment 8 (Ave 6.0 nm)
DA Experiment 1 (Ave 6.4 nm)
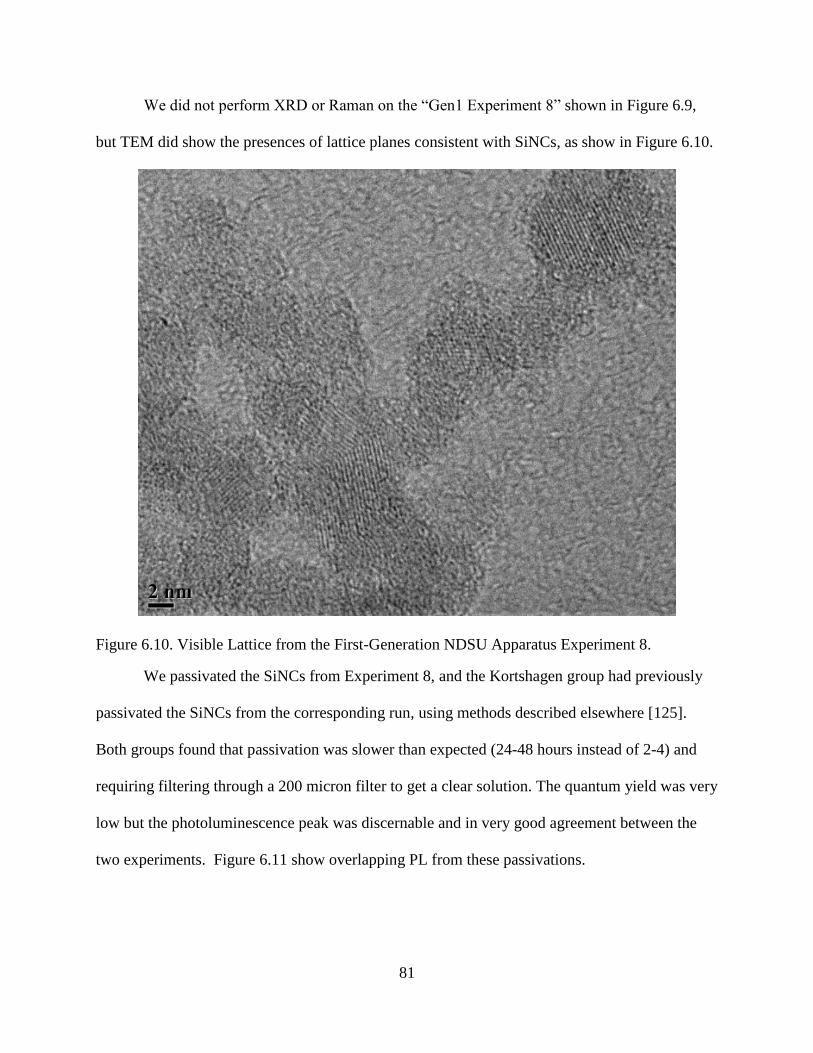
81
We did not perform XRD or Raman on the “Gen1 Experiment 8” shown in Figure 6.9,
but TEM did show the presences of lattice planes consistent with SiNCs, as show in Figure 6.10.
Figure 6.10. Visible Lattice from the First-Generation NDSU Apparatus Experiment 8.
We passivated the SiNCs from Experiment 8, and the Kortshagen group had previously
passivated the SiNCs from the corresponding run, using methods described elsewhere [125].
Both groups found that passivation was slower than expected (24-48 hours instead of 2-4) and
requiring filtering through a 200 micron filter to get a clear solution. The quantum yield was very
low but the photoluminescence peak was discernable and in very good agreement between the
two experiments. Figure 6.11 show overlapping PL from these passivations.
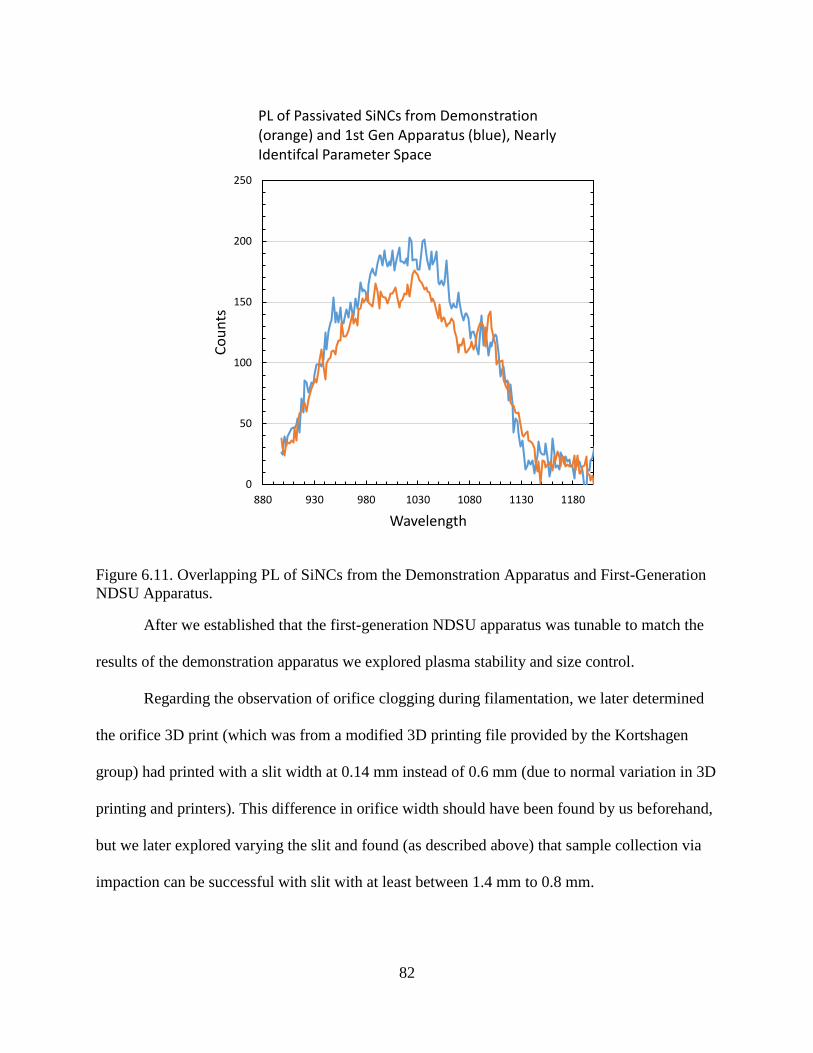
82
Figure 6.11. Overlapping PL of SiNCs from the Demonstration Apparatus and First-Generation
NDSU Apparatus.
After we established that the first-generation NDSU apparatus was tunable to match the
results of the demonstration apparatus we explored plasma stability and size control.
Regarding the observation of orifice clogging during filamentation, we later determined
the orifice 3D print (which was from a modified 3D printing file provided by the Kortshagen
group) had printed with a slit width at 0.14 mm instead of 0.6 mm (due to normal variation in 3D
printing and printers). This difference in orifice width should have been found by us beforehand,
but we later explored varying the slit and found (as described above) that sample collection via
impaction can be successful with slit with at least between 1.4 mm to 0.8 mm.
0
50
100
150
200
250
880 930 980 1030 1080 1130 1180
Co
un
ts
Wavelength
PL of Passivated SiNCs from Demonstration (orange) and 1st Gen Apparatus (blue), Nearly Identifcal Parameter Space
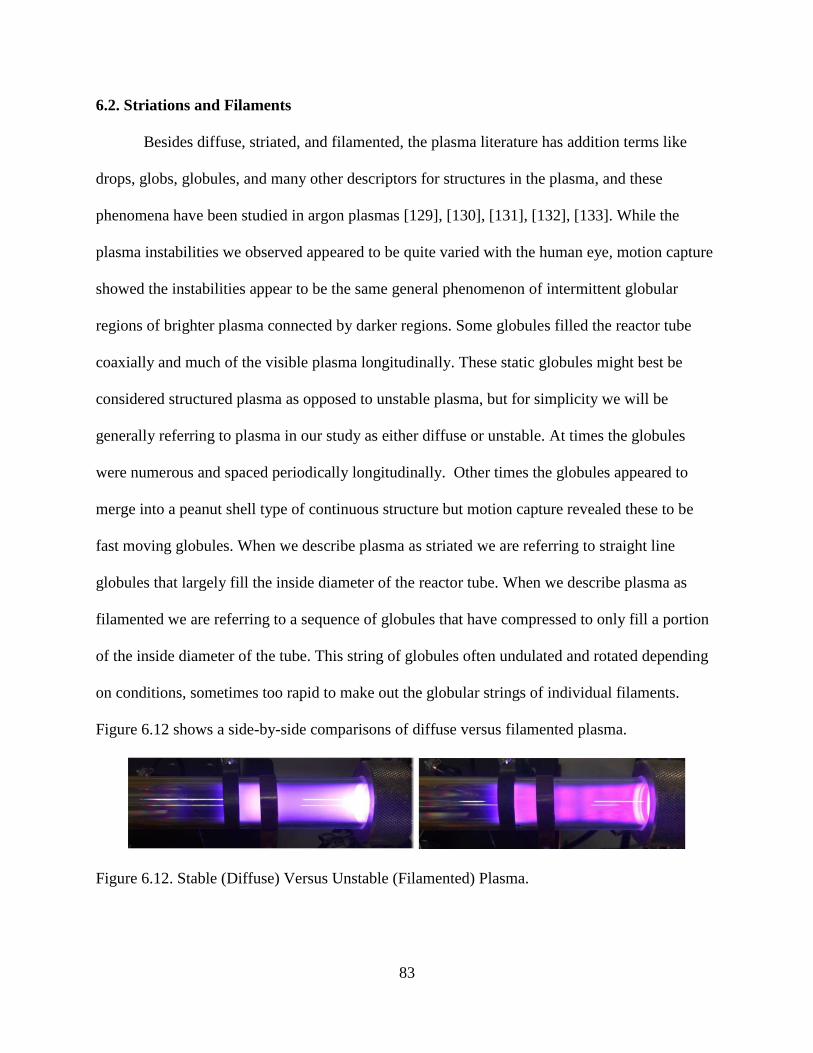
83
6.2. Striations and Filaments
Besides diffuse, striated, and filamented, the plasma literature has addition terms like
drops, globs, globules, and many other descriptors for structures in the plasma, and these
phenomena have been studied in argon plasmas [129], [130], [131], [132], [133]. While the
plasma instabilities we observed appeared to be quite varied with the human eye, motion capture
showed the instabilities appear to be the same general phenomenon of intermittent globular
regions of brighter plasma connected by darker regions. Some globules filled the reactor tube
coaxially and much of the visible plasma longitudinally. These static globules might best be
considered structured plasma as opposed to unstable plasma, but for simplicity we will be
generally referring to plasma in our study as either diffuse or unstable. At times the globules
were numerous and spaced periodically longitudinally. Other times the globules appeared to
merge into a peanut shell type of continuous structure but motion capture revealed these to be
fast moving globules. When we describe plasma as striated we are referring to straight line
globules that largely fill the inside diameter of the reactor tube. When we describe plasma as
filamented we are referring to a sequence of globules that have compressed to only fill a portion
of the inside diameter of the tube. This string of globules often undulated and rotated depending
on conditions, sometimes too rapid to make out the globular strings of individual filaments.
Figure 6.12 shows a side-by-side comparisons of diffuse versus filamented plasma.
Figure 6.12. Stable (Diffuse) Versus Unstable (Filamented) Plasma.
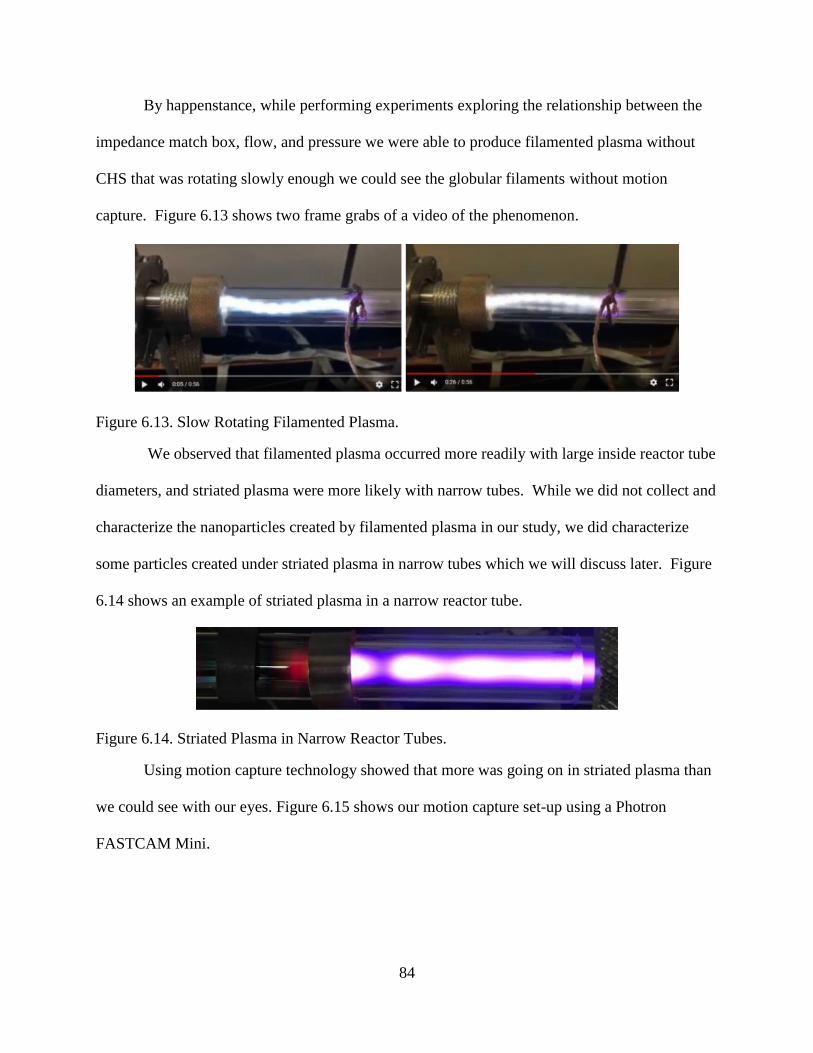
84
By happenstance, while performing experiments exploring the relationship between the
impedance match box, flow, and pressure we were able to produce filamented plasma without
CHS that was rotating slowly enough we could see the globular filaments without motion
capture. Figure 6.13 shows two frame grabs of a video of the phenomenon.
Figure 6.13. Slow Rotating Filamented Plasma.
We observed that filamented plasma occurred more readily with large inside reactor tube
diameters, and striated plasma were more likely with narrow tubes. While we did not collect and
characterize the nanoparticles created by filamented plasma in our study, we did characterize
some particles created under striated plasma in narrow tubes which we will discuss later. Figure
6.14 shows an example of striated plasma in a narrow reactor tube.
Figure 6.14. Striated Plasma in Narrow Reactor Tubes.
Using motion capture technology showed that more was going on in striated plasma than
we could see with our eyes. Figure 6.15 shows our motion capture set-up using a Photron
FASTCAM Mini.
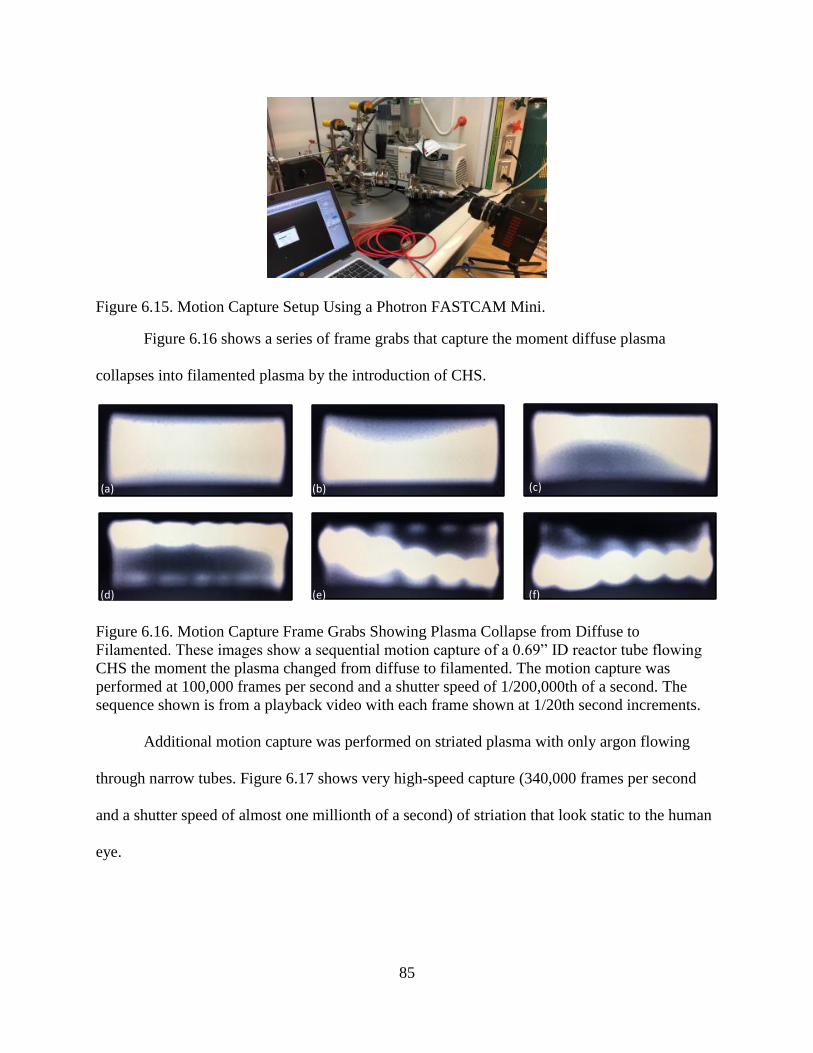
85
Figure 6.15. Motion Capture Setup Using a Photron FASTCAM Mini.
Figure 6.16 shows a series of frame grabs that capture the moment diffuse plasma
collapses into filamented plasma by the introduction of CHS.
(a) (b)
(d) (e) (f)
(c)
Figure 6.16. Motion Capture Frame Grabs Showing Plasma Collapse from Diffuse to
Filamented. These images show a sequential motion capture of a 0.69” ID reactor tube flowing
CHS the moment the plasma changed from diffuse to filamented. The motion capture was
performed at 100,000 frames per second and a shutter speed of 1/200,000th of a second. The
sequence shown is from a playback video with each frame shown at 1/20th second increments.
Additional motion capture was performed on striated plasma with only argon flowing
through narrow tubes. Figure 6.17 shows very high-speed capture (340,000 frames per second
and a shutter speed of almost one millionth of a second) of striation that look static to the human
eye.

86
0.22" ID, 40 SCCM Ar, 5 W 0.22" ID, 40 SCCM Ar, 30 W
Slow Motion (340K FPS) Slow Motion (340K FPS)
Figure 6.17. Motion Capture Frame Grabs Showing Striated Plasma in Pure Argon at Two Power
Levels. These images show a sequential motion capture of a 0.22” ID reactor tube flowing pure
argon at 40 sccm with plasma power at 5W (left) and 30W (right). Each vertically stacked image
is from subsequent frame grabs showing the motion of the globules. On the left the globules
move downstream, while at the higher power level on the right the globules were stationary but a
daughter globule would exit and flow into the downstream globule at a pattern that could be
changed by changing power level or flow. We found we could also tune the flow and power to
find a condition where the globules were static.
6.3. Diffuse Plasma Parameter Space
Most of our studies on plasma instabilities was targeted toward mapping the parameter
space where diffuse plasma could be maintained. Many doors remain unopened while exploring
the fascinating wave structures we are dismissively and unfairly calling instabilities. Here we
will present our findings on which parameters could be manipulated to effect plasma stability.
As mentioned, narrow tubes tended to form striations and wide tubes tended toward
filaments. In all tubes, the appearance of argon-only plasma minimally had static structures and
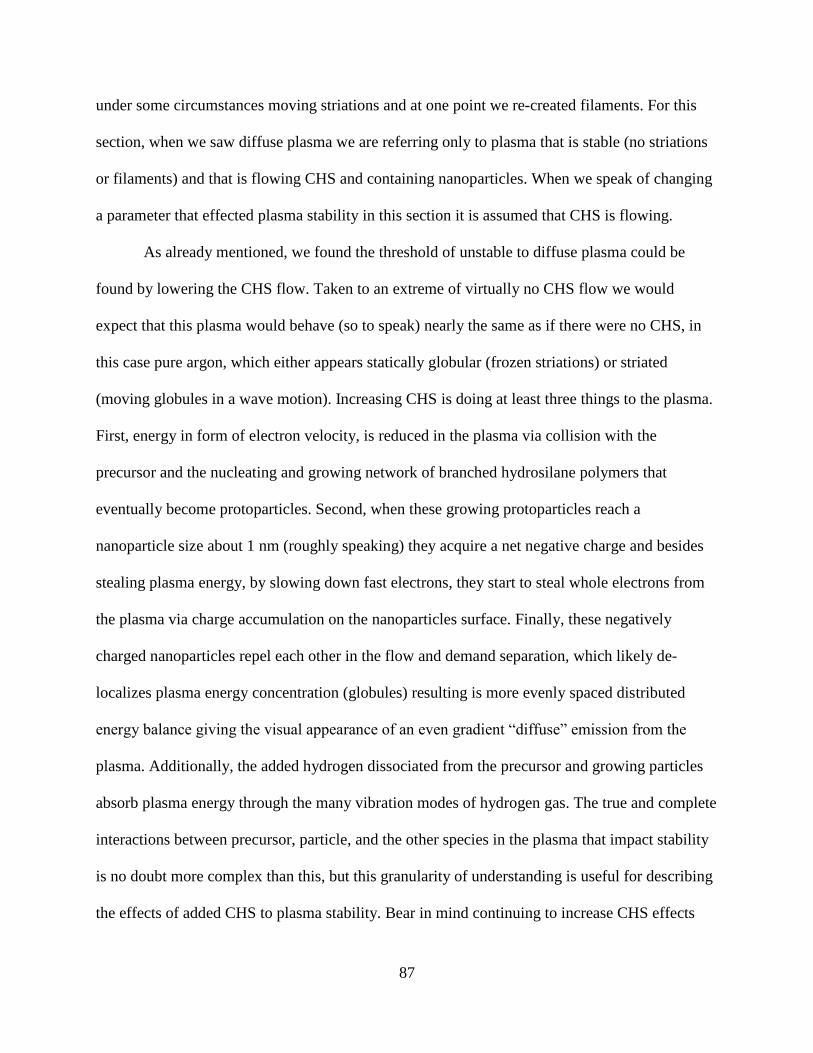
87
under some circumstances moving striations and at one point we re-created filaments. For this
section, when we saw diffuse plasma we are referring only to plasma that is stable (no striations
or filaments) and that is flowing CHS and containing nanoparticles. When we speak of changing
a parameter that effected plasma stability in this section it is assumed that CHS is flowing.
As already mentioned, we found the threshold of unstable to diffuse plasma could be
found by lowering the CHS flow. Taken to an extreme of virtually no CHS flow we would
expect that this plasma would behave (so to speak) nearly the same as if there were no CHS, in
this case pure argon, which either appears statically globular (frozen striations) or striated
(moving globules in a wave motion). Increasing CHS is doing at least three things to the plasma.
First, energy in form of electron velocity, is reduced in the plasma via collision with the
precursor and the nucleating and growing network of branched hydrosilane polymers that
eventually become protoparticles. Second, when these growing protoparticles reach a
nanoparticle size about 1 nm (roughly speaking) they acquire a net negative charge and besides
stealing plasma energy, by slowing down fast electrons, they start to steal whole electrons from
the plasma via charge accumulation on the nanoparticles surface. Finally, these negatively
charged nanoparticles repel each other in the flow and demand separation, which likely de-
localizes plasma energy concentration (globules) resulting is more evenly spaced distributed
energy balance giving the visual appearance of an even gradient “diffuse” emission from the
plasma. Additionally, the added hydrogen dissociated from the precursor and growing particles
absorb plasma energy through the many vibration modes of hydrogen gas. The true and complete
interactions between precursor, particle, and the other species in the plasma that impact stability
is no doubt more complex than this, but this granularity of understanding is useful for describing
the effects of added CHS to plasma stability. Bear in mind continuing to increase CHS effects
88
other parameters, as we have discussed, and plasma stability is just part of this challenging
tradeoff space.
Recall that we used multiple reactor tube morphologies in our study. During the first part
of our study where we were using only argon as a carrier gas (with the exception of one run at
the demonstration reactor) we only used straight reactor tubes (expanded tubes, with and without
sideports were introduced later, with a change in carrier gas to with 95/5 Ar/H2). For our all
argon (as a carrier gas) experiments, we used five inside diameters of straight tubes: 0.81”, 0.69”,
0.55”, 0.31”, and 0.22”. All five diameters produced striated plasma with only argon (no CHS).
For synthesis (with 0.08 calculated CHS sccm used in most these early experiments) only 0.69”
and 0.81” I.D.s achieved diffuse plasma for the parameter space we experimented with
(approximately 1-2 torr, 40-70 sccm argon, 15-40 watts, electrode spacings from 2-6 cm from
downstream disconnect). Attempts to achieve diffuse plasma for 0.55”, 0.31” and 0.22” I.D.
tubes within this parameter space failed.
Within the reactor tubes that we could produce diffuse plasma with, 0.69” and 0.81”
I.D.s, we observed that the maximum plasma wattage before filamentation decreased as the
electrodes moved upstream (assuming the diffuse plasma was brighter downstream of the
electrodes versus upstream, and that the plasma was visible to the downstream disconnect). In
other words, if the power was not changed but the electrodes (or just the RF electrode) was
moved upstream the diffuse plasma would stretch until a threshold was reached were it would
collapse into filamentation. The higher the power level the shorter the distance the electrodes
could be moved upstream. We also observed that high pressure (created either with high flow
rates or with orifices) increased the maximum power level required to cause filamentation. We
89
did not experiment with changing CHS sccm to see if it affected on plasma stability during this
experiment.
Recall that in the demonstration reactor only one experiment was performed (a power
study) with pure argon, before switching to added hydrogen to stabilize the plasma for the
second experiment. After spending time exploring plasma instabilities, we switched gas tanks on
the first-generation NDSU reactor from pure argon to 95/5 argon/hydrogen, which provided a
very broad parameter space without plasma instabilities. We could achieve experimental
conditions for diffuses plasma regardless of tube I.D. or reactor morphology (within the range of
reactor tubes already described). More studies would be needed to determine the optimal level
of added hydrogen for a given location in the parameter space (and changing the hydrogen level
will change the optimal values of other parameters in that space because of the confounding
interactions), but Ar/H2 95/5 is a common gas pre-mixture, and we used that ratio for the
production of high quality (good QY) SiNCs.
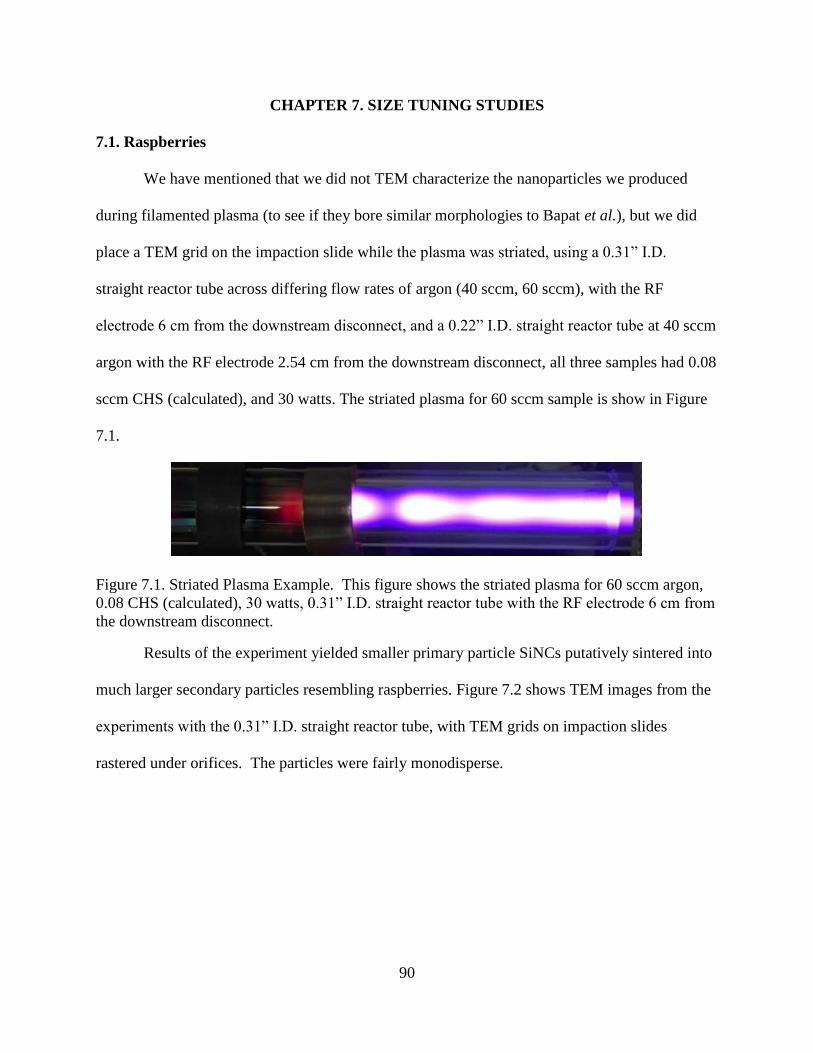
90
CHAPTER 7. SIZE TUNING STUDIES
7.1. Raspberries
We have mentioned that we did not TEM characterize the nanoparticles we produced
during filamented plasma (to see if they bore similar morphologies to Bapat et al.), but we did
place a TEM grid on the impaction slide while the plasma was striated, using a 0.31” I.D.
straight reactor tube across differing flow rates of argon (40 sccm, 60 sccm), with the RF
electrode 6 cm from the downstream disconnect, and a 0.22” I.D. straight reactor tube at 40 sccm
argon with the RF electrode 2.54 cm from the downstream disconnect, all three samples had 0.08
sccm CHS (calculated), and 30 watts. The striated plasma for 60 sccm sample is show in Figure
7.1.
Figure 7.1. Striated Plasma Example. This figure shows the striated plasma for 60 sccm argon,
0.08 CHS (calculated), 30 watts, 0.31” I.D. straight reactor tube with the RF electrode 6 cm from
the downstream disconnect.
Results of the experiment yielded smaller primary particle SiNCs putatively sintered into
much larger secondary particles resembling raspberries. Figure 7.2 shows TEM images from the
experiments with the 0.31” I.D. straight reactor tube, with TEM grids on impaction slides
rastered under orifices. The particles were fairly monodisperse.
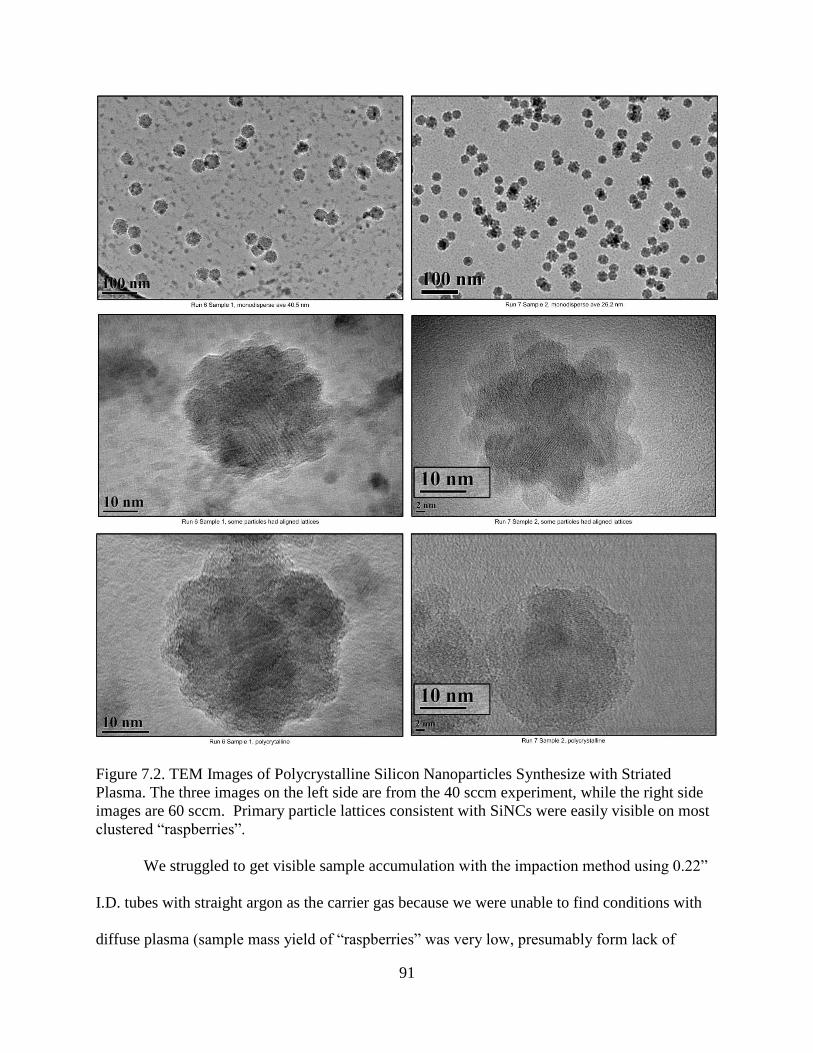
91
Figure 7.2. TEM Images of Polycrystalline Silicon Nanoparticles Synthesize with Striated
Plasma. The three images on the left side are from the 40 sccm experiment, while the right side
images are 60 sccm. Primary particle lattices consistent with SiNCs were easily visible on most
clustered “raspberries”.
We struggled to get visible sample accumulation with the impaction method using 0.22”
I.D. tubes with straight argon as the carrier gas because we were unable to find conditions with
diffuse plasma (sample mass yield of “raspberries” was very low, presumably form lack of
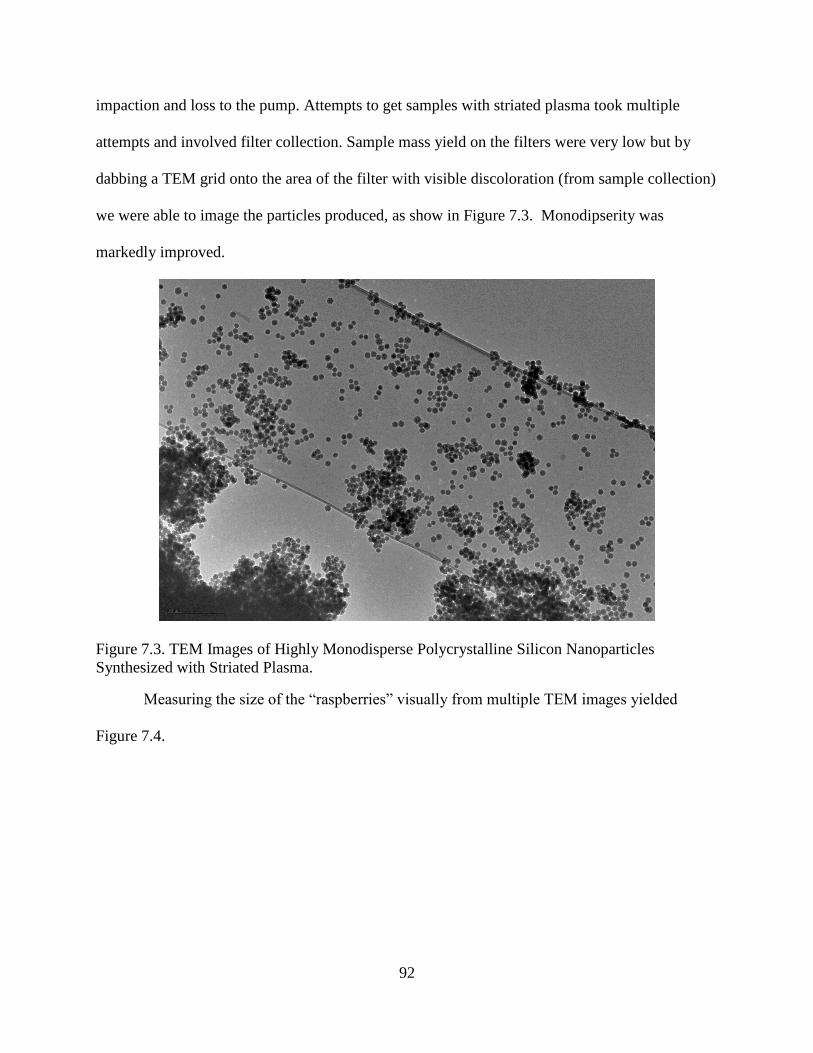
92
impaction and loss to the pump. Attempts to get samples with striated plasma took multiple
attempts and involved filter collection. Sample mass yield on the filters were very low but by
dabbing a TEM grid onto the area of the filter with visible discoloration (from sample collection)
we were able to image the particles produced, as show in Figure 7.3. Monodipserity was
markedly improved.
Figure 7.3. TEM Images of Highly Monodisperse Polycrystalline Silicon Nanoparticles
Synthesized with Striated Plasma.
Measuring the size of the “raspberries” visually from multiple TEM images yielded
Figure 7.4.
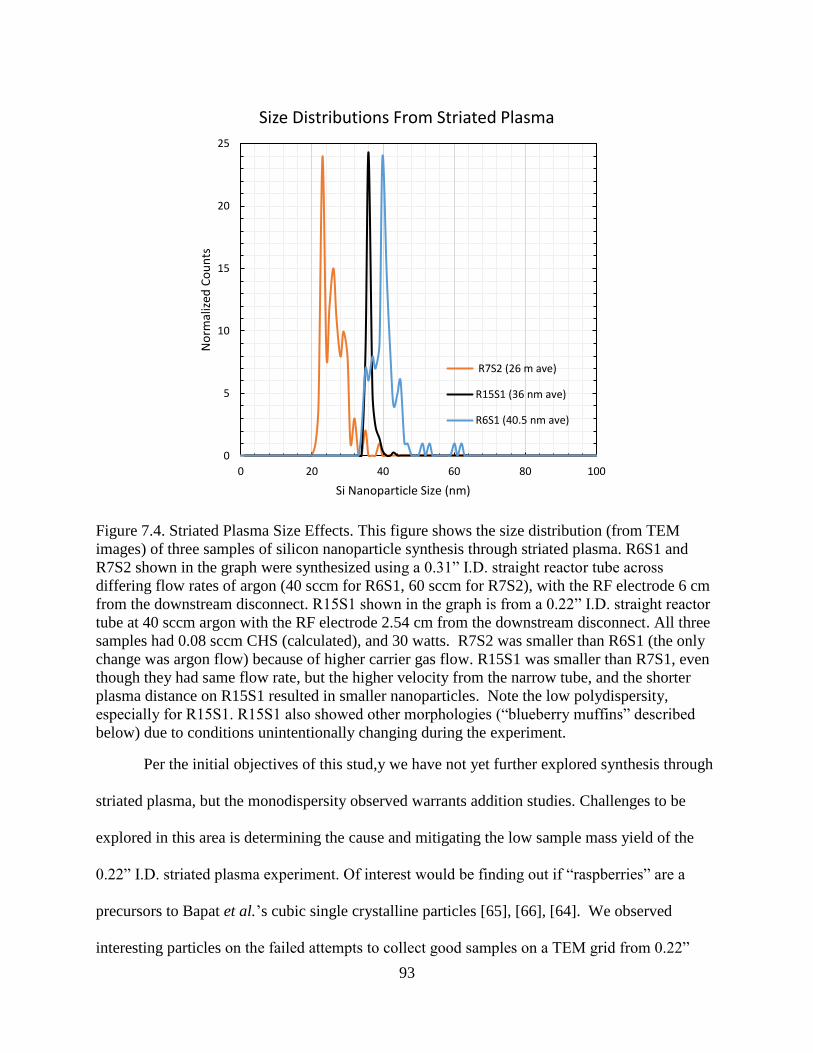
93
Figure 7.4. Striated Plasma Size Effects. This figure shows the size distribution (from TEM
images) of three samples of silicon nanoparticle synthesis through striated plasma. R6S1 and
R7S2 shown in the graph were synthesized using a 0.31” I.D. straight reactor tube across
differing flow rates of argon (40 sccm for R6S1, 60 sccm for R7S2), with the RF electrode 6 cm
from the downstream disconnect. R15S1 shown in the graph is from a 0.22” I.D. straight reactor
tube at 40 sccm argon with the RF electrode 2.54 cm from the downstream disconnect. All three
samples had 0.08 sccm CHS (calculated), and 30 watts. R7S2 was smaller than R6S1 (the only
change was argon flow) because of higher carrier gas flow. R15S1 was smaller than R7S1, even
though they had same flow rate, but the higher velocity from the narrow tube, and the shorter
plasma distance on R15S1 resulted in smaller nanoparticles. Note the low polydispersity,
especially for R15S1. R15S1 also showed other morphologies (“blueberry muffins” described
below) due to conditions unintentionally changing during the experiment.
Per the initial objectives of this stud,y we have not yet further explored synthesis through
striated plasma, but the monodispersity observed warrants addition studies. Challenges to be
explored in this area is determining the cause and mitigating the low sample mass yield of the
0.22” I.D. striated plasma experiment. Of interest would be finding out if “raspberries” are a
precursors to Bapat et al.’s cubic single crystalline particles [65], [66], [64]. We observed
interesting particles on the failed attempts to collect good samples on a TEM grid from 0.22”
0
5
10
15
20
25
0 20 40 60 80 100
No
rmal
ized
Co
un
ts
Si Nanoparticle Size (nm)
Size Distributions From Striated Plasma
R7S2 (26 m ave)
R15S1 (36 nm ave)
R6S1 (40.5 nm ave)
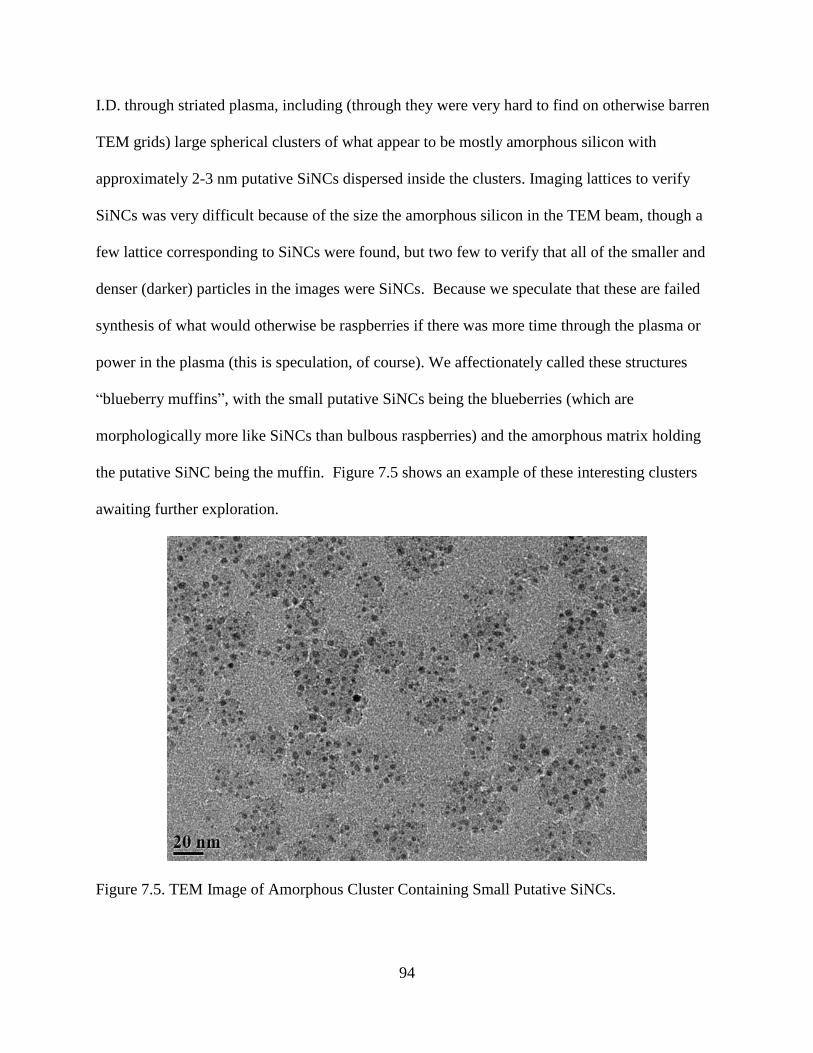
94
I.D. through striated plasma, including (through they were very hard to find on otherwise barren
TEM grids) large spherical clusters of what appear to be mostly amorphous silicon with
approximately 2-3 nm putative SiNCs dispersed inside the clusters. Imaging lattices to verify
SiNCs was very difficult because of the size the amorphous silicon in the TEM beam, though a
few lattice corresponding to SiNCs were found, but two few to verify that all of the smaller and
denser (darker) particles in the images were SiNCs. Because we speculate that these are failed
synthesis of what would otherwise be raspberries if there was more time through the plasma or
power in the plasma (this is speculation, of course). We affectionately called these structures
“blueberry muffins”, with the small putative SiNCs being the blueberries (which are
morphologically more like SiNCs than bulbous raspberries) and the amorphous matrix holding
the putative SiNC being the muffin. Figure 7.5 shows an example of these interesting clusters
awaiting further exploration.
Figure 7.5. TEM Image of Amorphous Cluster Containing Small Putative SiNCs.
95
7.2. Size: Our Approach, and Measurement
Recall from Figure 5.10 that we experimented with multiple reactor diameters and reactor
morphologies. Much of our focus for the first half of our study was endeavoring to understand
how the parameter space affects SiNCs size (the second half of our study was to improve
quality). We have discussed how the parameter space has many interactions, and while we can
isolate one controllable parameter (meaning we can change the value of one controllable
parameter, such as flow, without changing other controllable parameters, such as electrode
spacing) we cannot stop other parameters that are not directly controlled from changing (such as
the morphology of the plasma, of the efficacy of the sample collection method).
Because of this highly interacting parameter space we are most interested in developing
an understanding of the multi-variable effects on SiNC size (and quality). We performed
experiments where we isolated one controllable parameter at a time, changing its value and
collecting samples. But as we developed an understanding of some of the interaction between
parameters, we made changes to more than one parameter at a time, in the pursuit of the highest
quality SiNCs of desired size. An example of two controllable parameters that we would
sometimes change together is CHS sccm and plasma watts. Increasing CHS drains energy from
the plasma which can affect crystallinity if sufficient plasma energy is lost to collisions with the
numerous species in the plasma (including greater electron loss due to charge accumulation).
But increasing plasma also increasing the probably of instability, and plasma arcing to the
disconnects, both of which we have observed can effect SiNC size and quality.
Mangolini performed factor design of experiment, deriving an equation for peak PL
(essentially SiNC size) and quantum yield for argon sccm, H2 sccm, SiH4 sccm (in helium),
presumably leaving pressure, plasma power, electrode spacing, reactor dimensions, sample
96
collection method, and all other controllable parameters unchanged [125]. The experiment
yielded a range of SiNCs with PL (as a viable stand-in for size) between 706 nm and 796 nm.
While this equation was predictive, it would also be limited to the range of changes within the
controlled parameters and would be constrained to the parameter space where the unchanged
controllable parameters remain locked out of any change in the value, less the equation lose its
predictive ability. From this work Mangolini derived an equation for predicting PL (size):
λmax(nm)=795.81-0.675Var-11.5VH2+2.15VSiH4 which essentially says increasing argon or
hydrogen will shorten PL wavelength (reducing SiNCs size) with hydrogen roughly twice as
influential as argon, while increasing silane will increase SiNC size. Further he derived an
equation to predict QY: QY(%)=90.64-0.57Var-9.8VH2+5VSiH4 which essentially shows a similar
relationship for QY only with different weightings (hydrogen flow being about 20 times more
influential than argon, for instance). Empirically Mangolini had observed a quasi-linear drop in
QY from roughly 800-700 nm which was correctly recognized by the Kortshagen group as a
portion of a downward slope (the quasi-linear part) of a more Gaussian distribution of QY for PL
across a wider range PL (roughly 600-1000 nm) that has been observed in studies [134], with the
peak roughly centering on the exciton Bohr radius for silicon of 4.5 nm. It is not a surprise to
find a straightforward predictive equation for a quasi linear range of size (via PL) for flow rates
of gas and precursor. We chose not to perform factor experimental design for CHS and gas flow
rates because in the end it seems no more valuable than a look up table of empirically data.
Moreover, we have observed that SiNC size can be readily steered with flow rate of the carrier
gas alone and a quasi-linear relationship was empirically derived across a much wider size range.
Because flow rates affect the so-called “residence time” in the reactor, our observation is
consistent with the literature [76]. We have observed that many additional parameters effect QY
97
that do not affect size, and we have observed evidence that the drop of QY for SiNCs is not as
steep (in the blue direction) as observed in prior studies [76], [134], further constraining
Mangolini’s derived QY equation to the parameter space locations existing during the designed
experiment. We will discuss QY in more detail later.
SiNC size can be determined from many characterization methods, with some varying
offsets between the methods. While we have performed size measurement via XRD and Raman,
all data in this study, unless otherwise indicated is from manual image analyses of the size as
designated in nanometers diameter, or from PLQY if the size is designed as peak wavelength
(which is an effective stand-in for SiNC size for the purposes of this study). We have observed
slight differences in TEM determined SiNC size between dry methods where SiNCs are
collected on a TEM grid from an impaction slide or collection filter, versus wet methods where
passivated SiNC solutions are drop cast onto a grid (likely due to the manner that polydispersity
drives clustering in dry SiNCs versus the physics of drying effects for wet passivated SiNCs.
7.3. Residence Time
Mangolini discussed SiNC size as largely a function of residence time in the portion of
plasma from the RF electrode to the downstream disconnect [76], observing that as that distance
was reduced the SiNC size reduces. This portion of the plasma was acknowledged by Mangolini
as a somewhat arbitrary measurement (perhaps made convenient with the downstream
disconnect serving as a datum), and not necessarily because that was contended to be the only
region of the plasma were size was determined. Mangolini, and others in Kortshagen’s group
surmised [97] that nucleation and growth was logically occurring in the upstream region of the
plasma, especially considering this region exhibited reactor tube wall deposition consistent with
the creation of ambipolar silicon protoparticles and nanoparticles. Later, as part of Mangolini’s
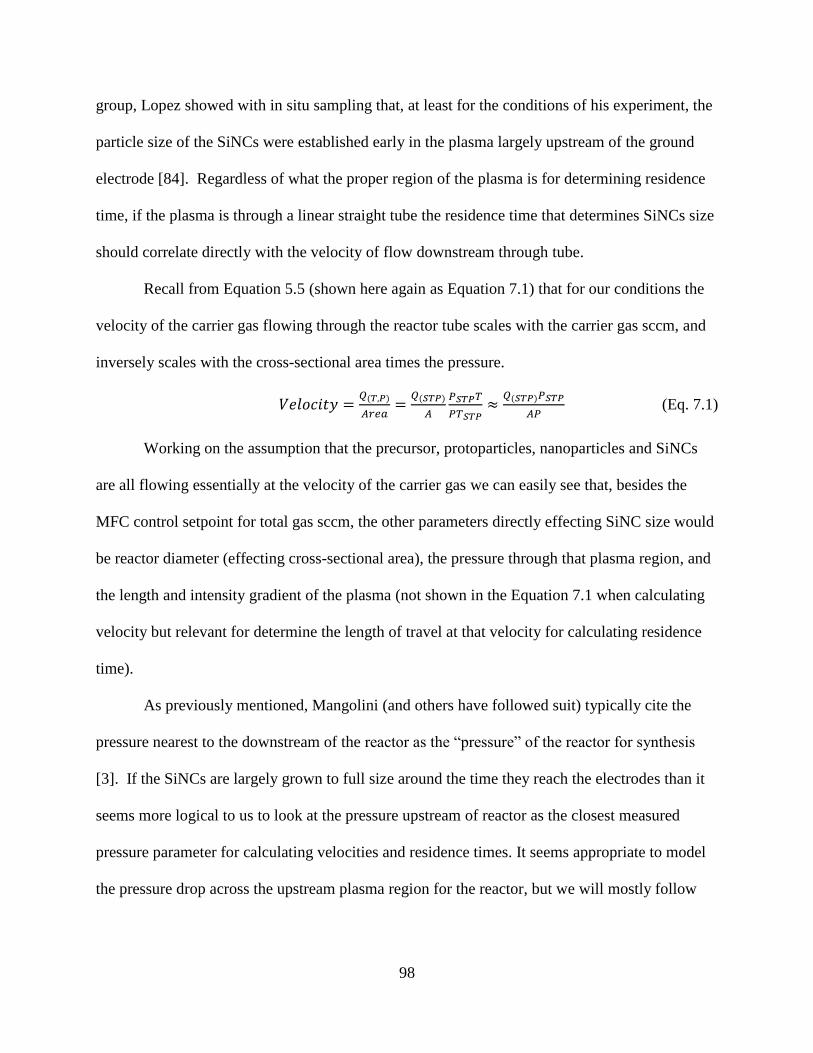
98
group, Lopez showed with in situ sampling that, at least for the conditions of his experiment, the
particle size of the SiNCs were established early in the plasma largely upstream of the ground
electrode [84]. Regardless of what the proper region of the plasma is for determining residence
time, if the plasma is through a linear straight tube the residence time that determines SiNCs size
should correlate directly with the velocity of flow downstream through tube.
Recall from Equation 5.5 (shown here again as Equation 7.1) that for our conditions the
velocity of the carrier gas flowing through the reactor tube scales with the carrier gas sccm, and
inversely scales with the cross-sectional area times the pressure.
𝑉𝑒𝑙𝑜𝑐𝑖𝑡𝑦 =𝑄(𝑇,𝑃)
𝐴𝑟𝑒𝑎=
𝑄(𝑆𝑇𝑃)
𝐴
𝑃𝑆𝑇𝑃𝑇
𝑃𝑇𝑆𝑇𝑃≈
𝑄(𝑆𝑇𝑃)𝑃𝑆𝑇𝑃
𝐴𝑃 (Eq. 7.1)
Working on the assumption that the precursor, protoparticles, nanoparticles and SiNCs
are all flowing essentially at the velocity of the carrier gas we can easily see that, besides the
MFC control setpoint for total gas sccm, the other parameters directly effecting SiNC size would
be reactor diameter (effecting cross-sectional area), the pressure through that plasma region, and
the length and intensity gradient of the plasma (not shown in the Equation 7.1 when calculating
velocity but relevant for determine the length of travel at that velocity for calculating residence
time).
As previously mentioned, Mangolini (and others have followed suit) typically cite the
pressure nearest to the downstream of the reactor as the “pressure” of the reactor for synthesis
[3]. If the SiNCs are largely grown to full size around the time they reach the electrodes than it
seems more logical to us to look at the pressure upstream of reactor as the closest measured
pressure parameter for calculating velocities and residence times. It seems appropriate to model
the pressure drop across the upstream plasma region for the reactor, but we will mostly follow
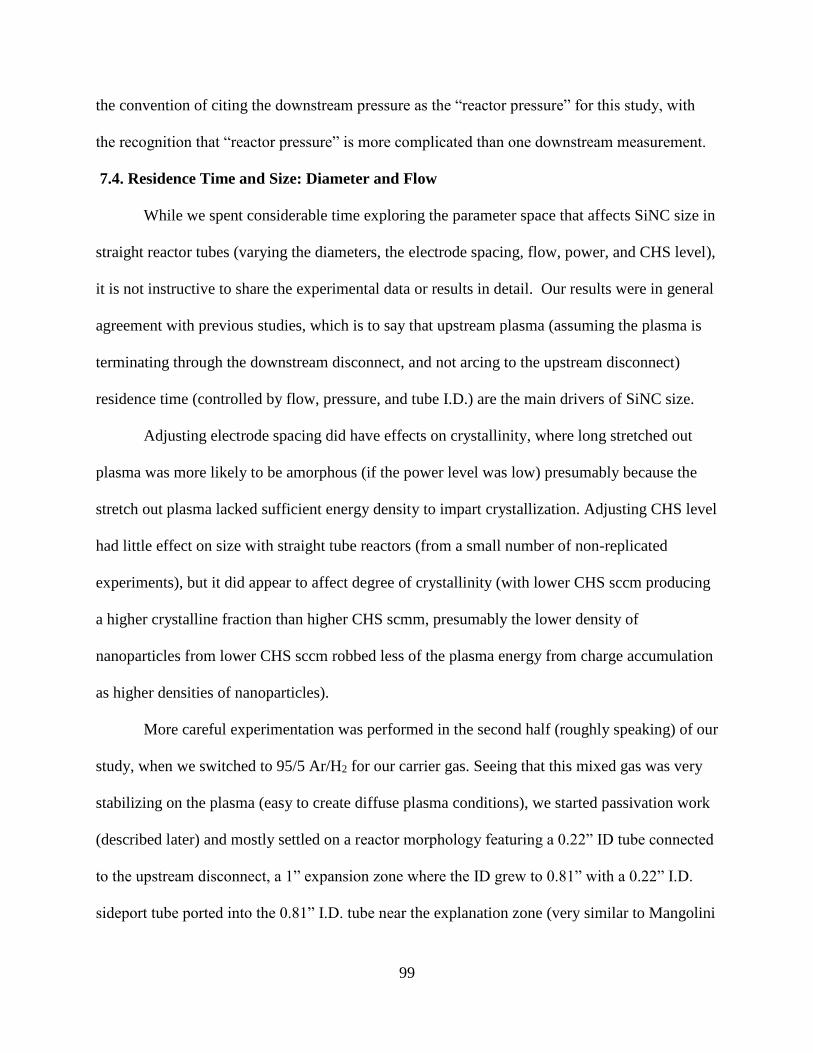
99
the convention of citing the downstream pressure as the “reactor pressure” for this study, with
the recognition that “reactor pressure” is more complicated than one downstream measurement.
7.4. Residence Time and Size: Diameter and Flow
While we spent considerable time exploring the parameter space that affects SiNC size in
straight reactor tubes (varying the diameters, the electrode spacing, flow, power, and CHS level),
it is not instructive to share the experimental data or results in detail. Our results were in general
agreement with previous studies, which is to say that upstream plasma (assuming the plasma is
terminating through the downstream disconnect, and not arcing to the upstream disconnect)
residence time (controlled by flow, pressure, and tube I.D.) are the main drivers of SiNC size.
Adjusting electrode spacing did have effects on crystallinity, where long stretched out
plasma was more likely to be amorphous (if the power level was low) presumably because the
stretch out plasma lacked sufficient energy density to impart crystallization. Adjusting CHS level
had little effect on size with straight tube reactors (from a small number of non-replicated
experiments), but it did appear to affect degree of crystallinity (with lower CHS sccm producing
a higher crystalline fraction than higher CHS scmm, presumably the lower density of
nanoparticles from lower CHS sccm robbed less of the plasma energy from charge accumulation
as higher densities of nanoparticles).
More careful experimentation was performed in the second half (roughly speaking) of our
study, when we switched to 95/5 Ar/H2 for our carrier gas. Seeing that this mixed gas was very
stabilizing on the plasma (easy to create diffuse plasma conditions), we started passivation work
(described later) and mostly settled on a reactor morphology featuring a 0.22” ID tube connected
to the upstream disconnect, a 1” expansion zone where the ID grew to 0.81” with a 0.22” I.D.
sideport tube ported into the 0.81” I.D. tube near the explanation zone (very similar to Mangolini
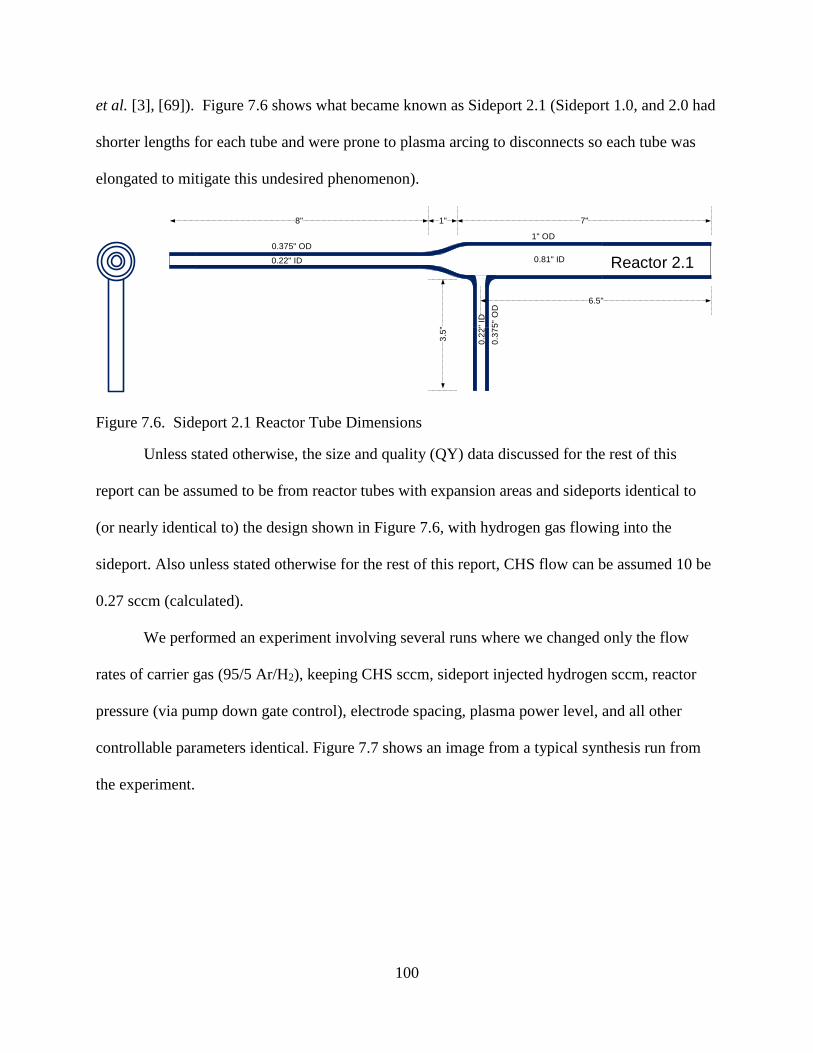
100
et al. [3], [69]). Figure 7.6 shows what became known as Sideport 2.1 (Sideport 1.0, and 2.0 had
shorter lengths for each tube and were prone to plasma arcing to disconnects so each tube was
elongated to mitigate this undesired phenomenon).
0.375" OD
0.22" ID
1" OD
0.81" ID
7"8" 1"
6.5"
0.3
75"
OD
0.2
2"
ID
3.5
"
Reactor 2.1
Figure 7.6. Sideport 2.1 Reactor Tube Dimensions
Unless stated otherwise, the size and quality (QY) data discussed for the rest of this
report can be assumed to be from reactor tubes with expansion areas and sideports identical to
(or nearly identical to) the design shown in Figure 7.6, with hydrogen gas flowing into the
sideport. Also unless stated otherwise for the rest of this report, CHS flow can be assumed 10 be
0.27 sccm (calculated).
We performed an experiment involving several runs where we changed only the flow
rates of carrier gas (95/5 Ar/H2), keeping CHS sccm, sideport injected hydrogen sccm, reactor
pressure (via pump down gate control), electrode spacing, plasma power level, and all other
controllable parameters identical. Figure 7.7 shows an image from a typical synthesis run from
the experiment.
101
Figure 7.7. Typical Sideport 2.1 Plasma.
After each run, the reactor tube was removed and cleaned in a base bath, rinsed in
deionized water and bake at 150o C for 3 hours for use again. Multiple reactor tubes were used,
after extensive re-use they did seem prone to brittle failure (possibly from repeated etching from
the base bath), but getting at least five runs from a tube was normal. Figure 7.8 shows the typical
wall deposition from a long run (30-60 min).
Figure 7.8. Typical Deposition on a Reactor Tube After 30-60 minutes of Synthesis.
With multiple duplicates, we covered the range of carrier gas flow from 30 sccm to 160
sccm. Results from 27 runs is shown in Figure 7.9 (size is inferred from PL peak wavelength.)
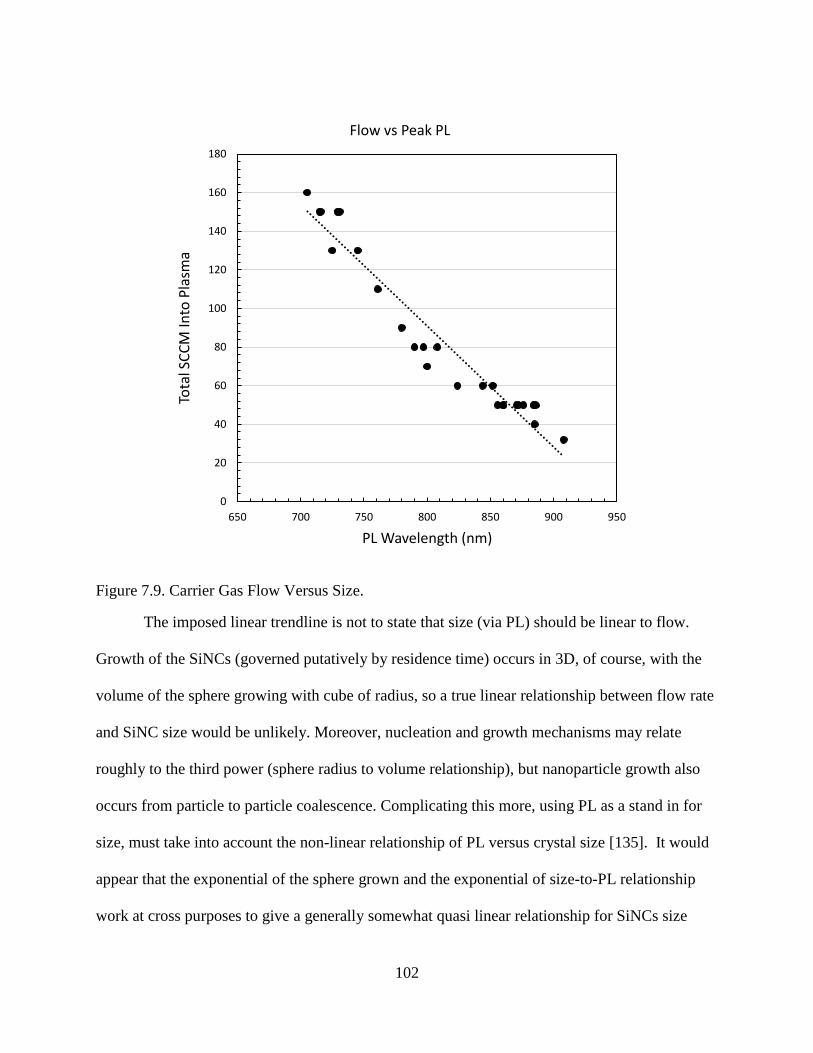
102
Figure 7.9. Carrier Gas Flow Versus Size.
The imposed linear trendline is not to state that size (via PL) should be linear to flow.
Growth of the SiNCs (governed putatively by residence time) occurs in 3D, of course, with the
volume of the sphere growing with cube of radius, so a true linear relationship between flow rate
and SiNC size would be unlikely. Moreover, nucleation and growth mechanisms may relate
roughly to the third power (sphere radius to volume relationship), but nanoparticle growth also
occurs from particle to particle coalescence. Complicating this more, using PL as a stand in for
size, must take into account the non-linear relationship of PL versus crystal size [135]. It would
appear that the exponential of the sphere grown and the exponential of size-to-PL relationship
work at cross purposes to give a generally somewhat quasi linear relationship for SiNCs size
0
20
40
60
80
100
120
140
160
180
650 700 750 800 850 900 950
Tota
l SC
CM
Into
Pla
sma
PL Wavelength (nm)
Flow vs Peak PL
103
versus carrier gas flow. This is a gross oversimplification, but nonetheless apparently useful
when tuning for size. Looking at Figure 7.9 we could have imposed are poorly fit but visibly
“reasonable” exponential curve as well.
It is difficult to find experimental data in the literature that can be compared on the same
graph as our data, because no other data on CHS synthesis in non-thermal plasma exits (to our
knowledge) outside of our study, and because of the complex interactions of the parameter space
(making apple-to-apples comparisons dubious). Looking at our flow vs size/PL data, it is
interesting to plot it next to Jurbergs et al. [70], who duplicated Mangolini’s reactor. Jurbergs has
similar enough running condition and a similar enough experimental sequence of flow rates
(alas, only on 5 data points compared to our 27) to at least compare apparent trendlines, as
shown in Figure 7.10.
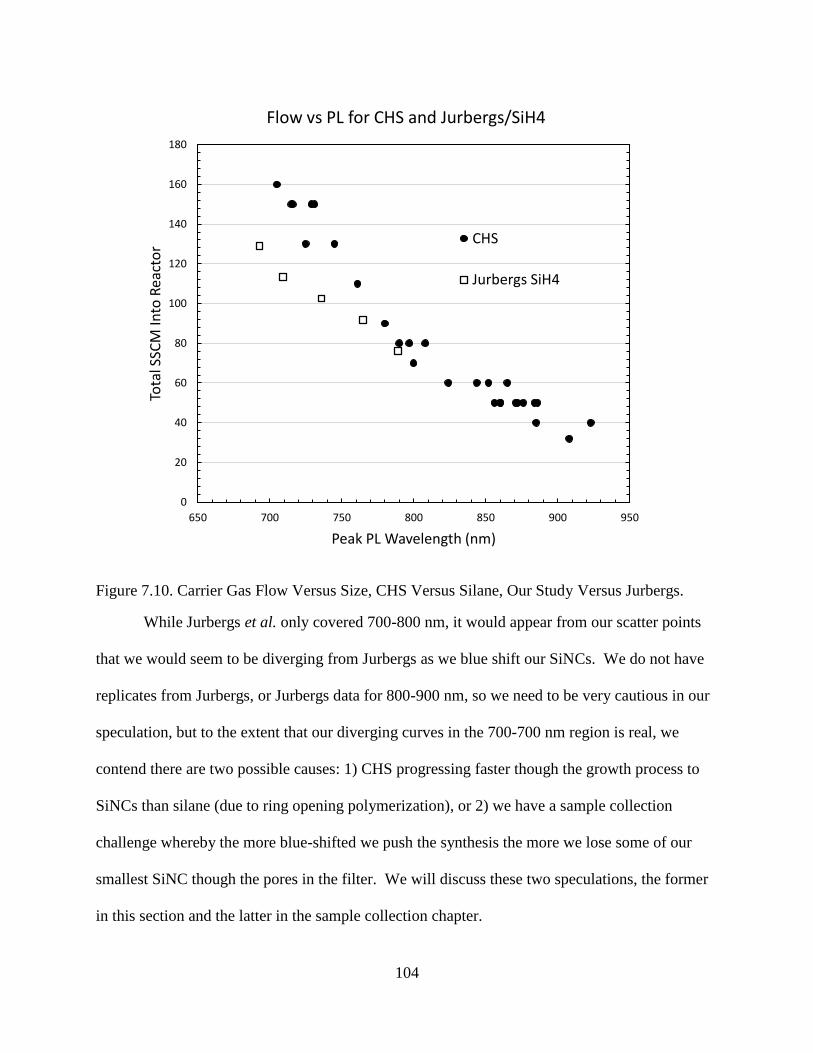
104
Figure 7.10. Carrier Gas Flow Versus Size, CHS Versus Silane, Our Study Versus Jurbergs.
While Jurbergs et al. only covered 700-800 nm, it would appear from our scatter points
that we would seem to be diverging from Jurbergs as we blue shift our SiNCs. We do not have
replicates from Jurbergs, or Jurbergs data for 800-900 nm, so we need to be very cautious in our
speculation, but to the extent that our diverging curves in the 700-700 nm region is real, we
contend there are two possible causes: 1) CHS progressing faster though the growth process to
SiNCs than silane (due to ring opening polymerization), or 2) we have a sample collection
challenge whereby the more blue-shifted we push the synthesis the more we lose some of our
smallest SiNC though the pores in the filter. We will discuss these two speculations, the former
in this section and the latter in the sample collection chapter.
0
20
40
60
80
100
120
140
160
180
650 700 750 800 850 900 950
Tota
l SSC
M In
to R
eact
or
Peak PL Wavelength (nm)
Flow vs PL for CHS and Jurbergs/SiH4
CHS
Jurbergs SiH4
105
CHS has a lower activation energy than silane [18], [101], [1]. While a detailed model is
beyond the scope of this work, we find it likely that the ring opening polymerization mechanism
of CHS would grow molecular weight faster than silane in the earliest part of the plasma. Silane
is believed to go through a disassociation and recombination period where most the average
hydrosilane size stays very small and plasma kinetics are as likely to break the hydrosilane into
two smaller species as it is likely to grow the species (essentially forming, breaking, re-forming,
breaking), until enough oligomeric species reach a size where growth is slightly more likely than
breakage, after which these growing molecules become the nucleating seeds which accrete into
protoparticles. We contend that it is likely that CHS largely bypasses this disassociation and
recombination stalling out period, and proceeds directly from ring opening to nucleation. As
stated, building evidence for this contention is beyond the scope of this study, but the diverging
Flow vs PL scatter plots in Figure 7.10 arguably support this speculation. The other interesting
observation that supports the speculation is that we consistently observed much lower wattage to
achieve high quality SiNCs than most published studies. The vast majority of our highest
quantum yield SiNCs were synthesized at only 18 watts. The Kortshagen group has indicated
that crystallization has been observed at much lower watts as well [128], so this remains an area
needing more detailed exploration. It may be that prior studies reporting much high wattage were
simply not properly impedance matched and the wattage was either reflected or dissipated as
resistance.
7.5. Size and the Parameter Space
As we became more confident in our ability to tune the parameters for SiNC size, we re-
visited parameters than had previously not been shown (in our straight reactor tube experiments)
to consistently affect size, such as reactor lengths, electrode spacing, power level, and CHS flow.
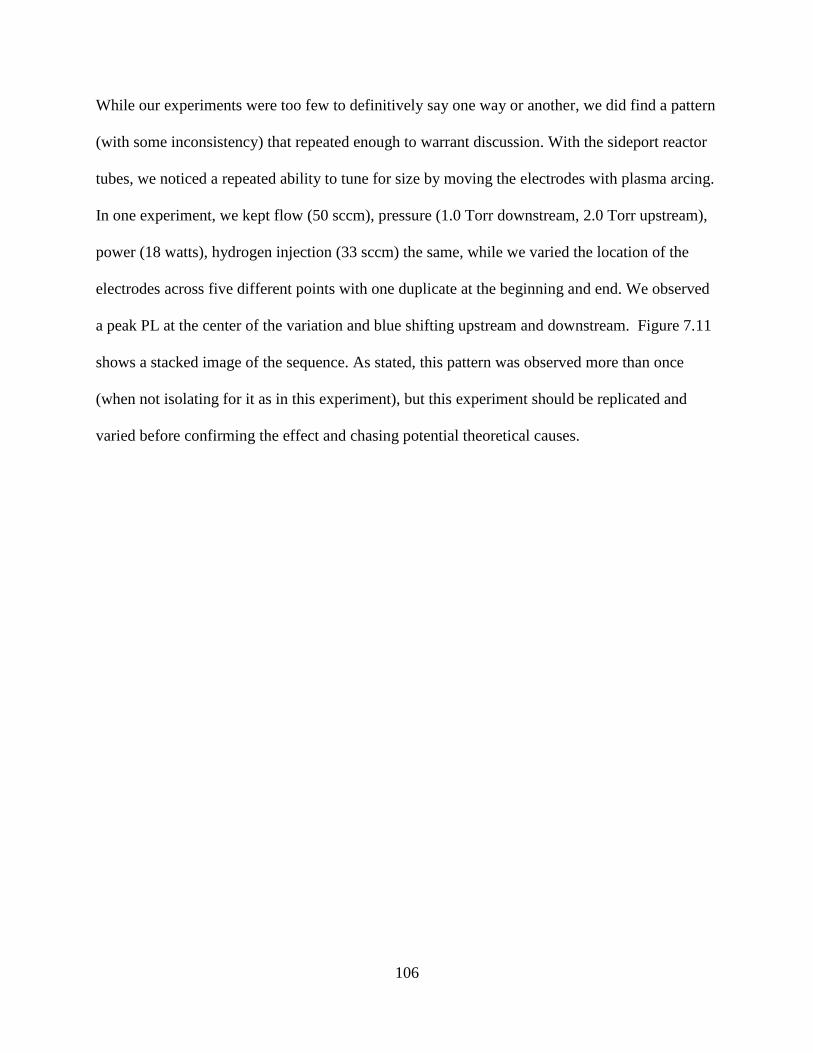
106
While our experiments were too few to definitively say one way or another, we did find a pattern
(with some inconsistency) that repeated enough to warrant discussion. With the sideport reactor
tubes, we noticed a repeated ability to tune for size by moving the electrodes with plasma arcing.
In one experiment, we kept flow (50 sccm), pressure (1.0 Torr downstream, 2.0 Torr upstream),
power (18 watts), hydrogen injection (33 sccm) the same, while we varied the location of the
electrodes across five different points with one duplicate at the beginning and end. We observed
a peak PL at the center of the variation and blue shifting upstream and downstream. Figure 7.11
shows a stacked image of the sequence. As stated, this pattern was observed more than once
(when not isolating for it as in this experiment), but this experiment should be replicated and
varied before confirming the effect and chasing potential theoretical causes.
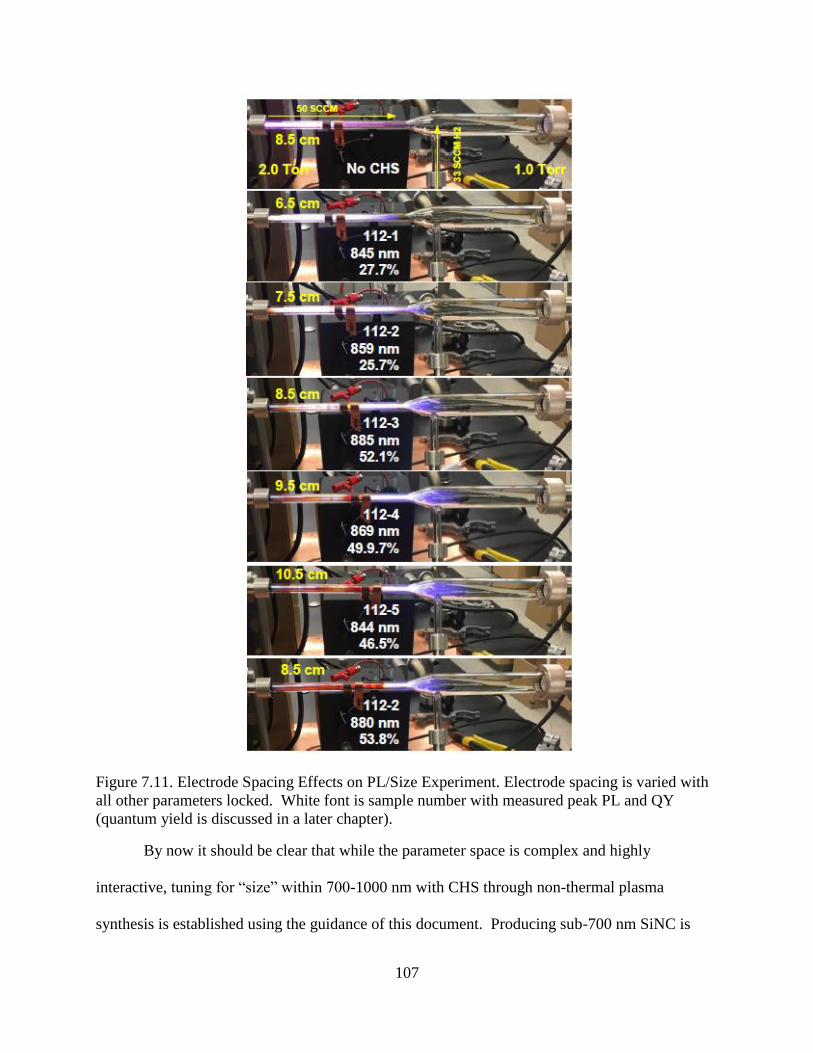
107
Figure 7.11. Electrode Spacing Effects on PL/Size Experiment. Electrode spacing is varied with
all other parameters locked. White font is sample number with measured peak PL and QY
(quantum yield is discussed in a later chapter).
By now it should be clear that while the parameter space is complex and highly
interactive, tuning for “size” within 700-1000 nm with CHS through non-thermal plasma
synthesis is established using the guidance of this document. Producing sub-700 nm SiNC is

108
another matter. While we were successful at producing SiNCs with peak PL in the 600s, the
sample mass yields made continued tuning into the visible range very challenging, as we will
discuss in the next chapter.
109
CHAPTER 8. SAMPLE COLLECTION STUDIES
8.1. Size and Sample Yield
We have discussed impaction and filtering for sample collection. As part of our goal to
map out the necessary processing conditions for size tuning high quality SiNCs with CHS
through non-thermal plasma synthesis, we investigated the efficiency of various filtering
methods. We did not extensively perform weight gain measurement on filters (our mass yield
investigation used impaction sample collection), but we did notice a pattern with filtering.
Mangolini states that in-flight filtering via 400 mesh stainless steel was effective at capturing
nearly all of the SiNCs encountering the filter [125]. Our experience with in-flight filtering is not
so straightforward. We consistently find that filtering as per the set-up in Figure 5.15 (showing
the load lock assembly in the pump down base assembly) loses efficiency as the SiNCs reduce in
size. While larger SiNCs with PL approaching 900 nm or higher fill the filter quickly and with
substantial yields, as we progress to shorter PL (smaller SiNCs), particularly smaller than 750
nm, the filter took longer to fill (to fill meaning the filter was clogged enough to affect reactor
pressure requiring the experiment to end) and had less sample yield. Qualitatively this trend can
be observed looking at an assortment of filters sorted by PL/size as shown in Figure 8.1. The
filters in Figure 8.1 smaller than 750 nm are not even filled, in some cases despite abnormally
long collection times.
110
Figure 8.1. Filter Collection Across SiNC Size Range.
The images in Figure 8.1 only clearly show reduced yield for the smallest SiNCs, but the
general trend of lower yield as size reduced across the range was visible as the samples were
removed the filter to be passivated. Up close the filters tell a better story. Figure 8.2 has
representative filters from the PL/size spectrum. Note that at 908 nm the sample is thick enough
to observe flakes, while at the other end (686 nm) both directions of the stainless mesh cross-
hatching is visible under the sample, and much of the periphery of the filter is without sample.
Looking across the slides in Figure 8.2 a subtle trend of filling in is observed as the PL/size
increases (and effect much more obvious to the naked eye).
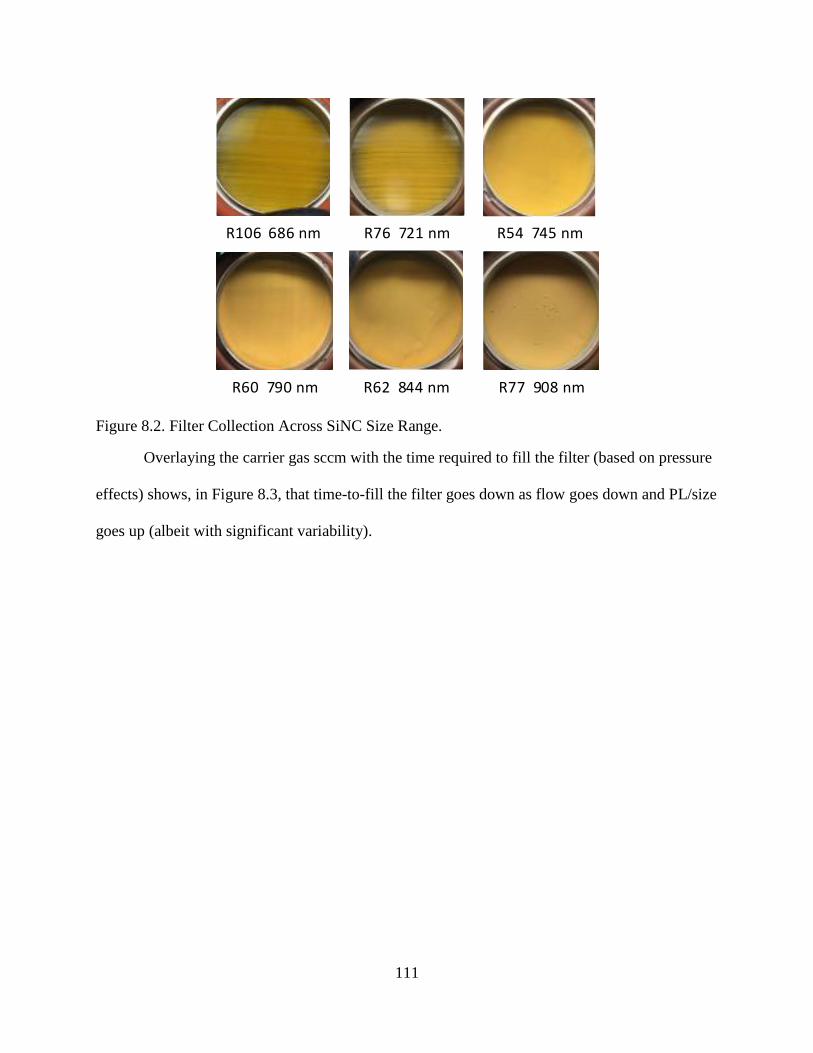
111
R77 908 nm
R54 745 nm
R60 790 nm R62 844 nm
R76 721 nmR106 686 nm
Figure 8.2. Filter Collection Across SiNC Size Range.
Overlaying the carrier gas sccm with the time required to fill the filter (based on pressure
effects) shows, in Figure 8.3, that time-to-fill the filter goes down as flow goes down and PL/size
goes up (albeit with significant variability).
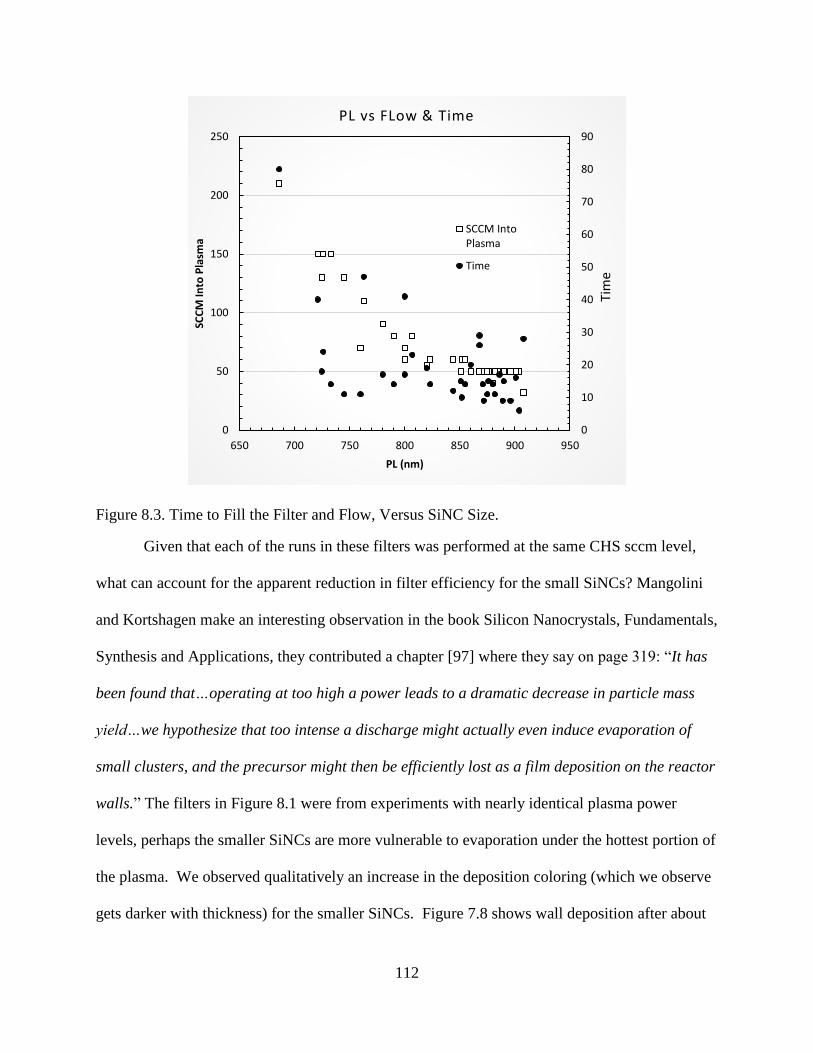
112
Figure 8.3. Time to Fill the Filter and Flow, Versus SiNC Size.
Given that each of the runs in these filters was performed at the same CHS sccm level,
what can account for the apparent reduction in filter efficiency for the small SiNCs? Mangolini
and Kortshagen make an interesting observation in the book Silicon Nanocrystals, Fundamentals,
Synthesis and Applications, they contributed a chapter [97] where they say on page 319: “It has
been found that…operating at too high a power leads to a dramatic decrease in particle mass
yield…we hypothesize that too intense a discharge might actually even induce evaporation of
small clusters, and the precursor might then be efficiently lost as a film deposition on the reactor
walls.” The filters in Figure 8.1 were from experiments with nearly identical plasma power
levels, perhaps the smaller SiNCs are more vulnerable to evaporation under the hottest portion of
the plasma. We observed qualitatively an increase in the deposition coloring (which we observe
gets darker with thickness) for the smaller SiNCs. Figure 7.8 shows wall deposition after about
0
10
20
30
40
50
60
70
80
90
0
50
100
150
200
250
650 700 750 800 850 900 950
SCC
M In
to P
lasm
a
PL (nm)
PL vs FLow & Time
SCCM IntoPlasma
Time
Tim
e
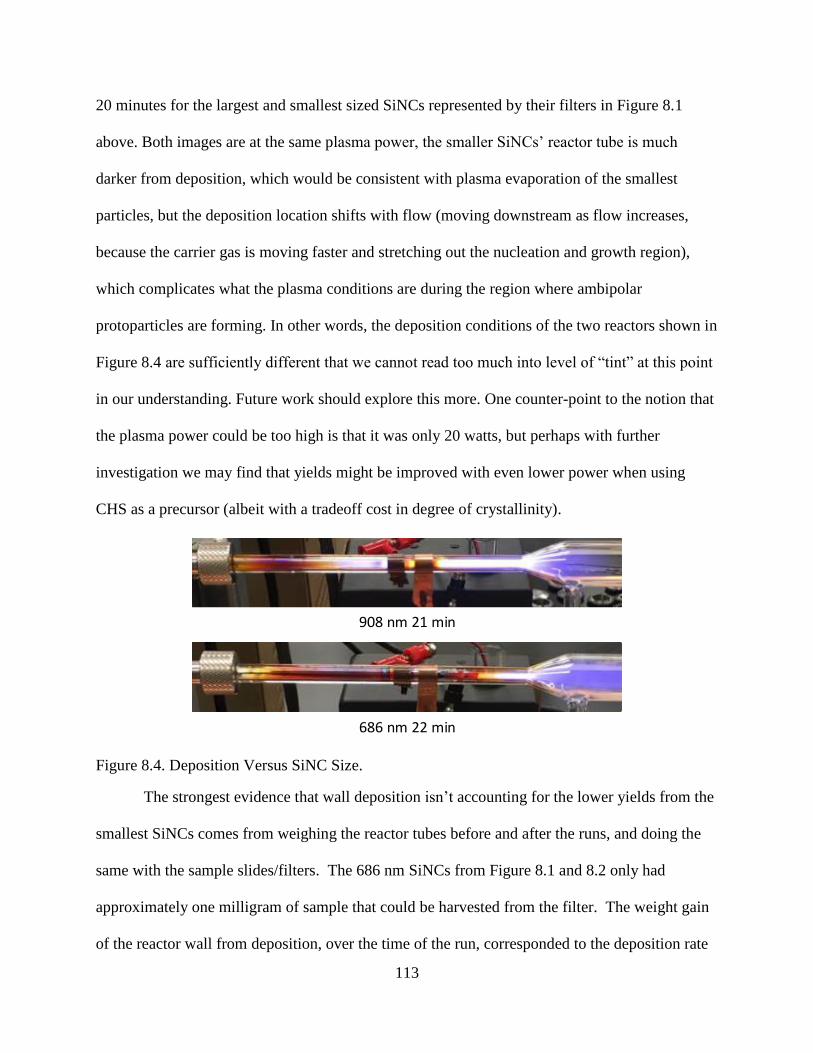
113
20 minutes for the largest and smallest sized SiNCs represented by their filters in Figure 8.1
above. Both images are at the same plasma power, the smaller SiNCs’ reactor tube is much
darker from deposition, which would be consistent with plasma evaporation of the smallest
particles, but the deposition location shifts with flow (moving downstream as flow increases,
because the carrier gas is moving faster and stretching out the nucleation and growth region),
which complicates what the plasma conditions are during the region where ambipolar
protoparticles are forming. In other words, the deposition conditions of the two reactors shown in
Figure 8.4 are sufficiently different that we cannot read too much into level of “tint” at this point
in our understanding. Future work should explore this more. One counter-point to the notion that
the plasma power could be too high is that it was only 20 watts, but perhaps with further
investigation we may find that yields might be improved with even lower power when using
CHS as a precursor (albeit with a tradeoff cost in degree of crystallinity).
908 nm 21 min
686 nm 22 min
Figure 8.4. Deposition Versus SiNC Size.
The strongest evidence that wall deposition isn’t accounting for the lower yields from the
smallest SiNCs comes from weighing the reactor tubes before and after the runs, and doing the
same with the sample slides/filters. The 686 nm SiNCs from Figure 8.1 and 8.2 only had
approximately one milligram of sample that could be harvested from the filter. The weight gain
of the reactor wall from deposition, over the time of the run, corresponded to the deposition rate

114
of 51 mg/hr. The mass of CHS evaporated by the bubbler and flowed into the plasma (from the
calculated vapor pressure of 0.4 torr) was 129 mg/hr. Since 1 mg was all that was collected for
an hour of running that means that 77 mg/hr of precursor mass with less than 3 mg of that being
hydrogen gas did not end up on the walls or the filter! Similar measurement for larger SiNCs saw
sample collection rates via impaction of 30-60 mg/hr (much better than 1 mg/hr!) with wall
deposition rates of 53-71 mg/hr and missing masses of 3-47 mg hr. All samples had missing
mass, implying neither impaction or filtering are as efficient as they could be under the condition
of our study. Interestingly, the lowest wall deposition rate was for the smallest SiNCs (through
not by much). Given the measurement error of weighing changes of tens of milligrams on
reactor tubes that weigh tens or grams, it is safer to say the we measured depositions rates that
were roughly the same across the range of SiNC sizes in our study (until more accurate scales
can show otherwise).
In the early part of our study, we used a 72 mesh filter centering ring, instead of 400
mesh used for the bulk of the filter collection. Despite the wide mesh we found we could harvest
excellent yields of larger SiNCs, but smaller SiNCs were nearly impossible to corral into the
filter. Figure 8.5 shows excellent collection for a 900 nm SiNC sample
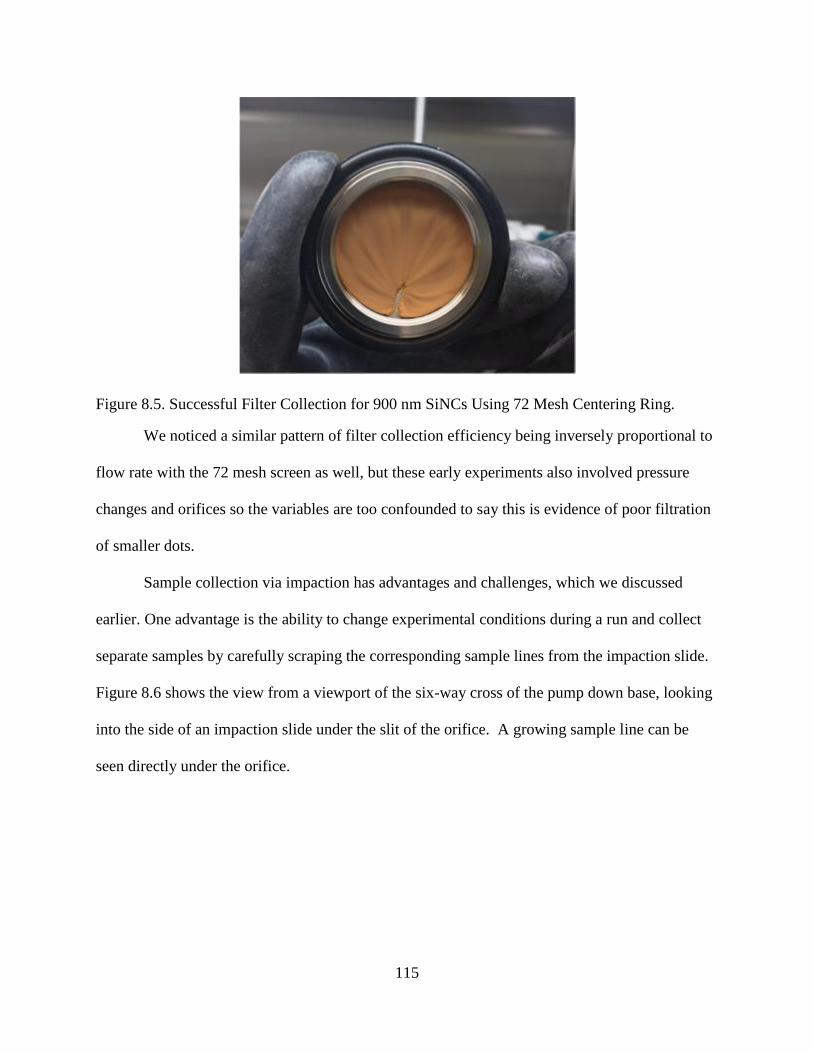
115
Figure 8.5. Successful Filter Collection for 900 nm SiNCs Using 72 Mesh Centering Ring.
We noticed a similar pattern of filter collection efficiency being inversely proportional to
flow rate with the 72 mesh screen as well, but these early experiments also involved pressure
changes and orifices so the variables are too confounded to say this is evidence of poor filtration
of smaller dots.
Sample collection via impaction has advantages and challenges, which we discussed
earlier. One advantage is the ability to change experimental conditions during a run and collect
separate samples by carefully scraping the corresponding sample lines from the impaction slide.
Figure 8.6 shows the view from a viewport of the six-way cross of the pump down base, looking
into the side of an impaction slide under the slit of the orifice. A growing sample line can be
seen directly under the orifice.
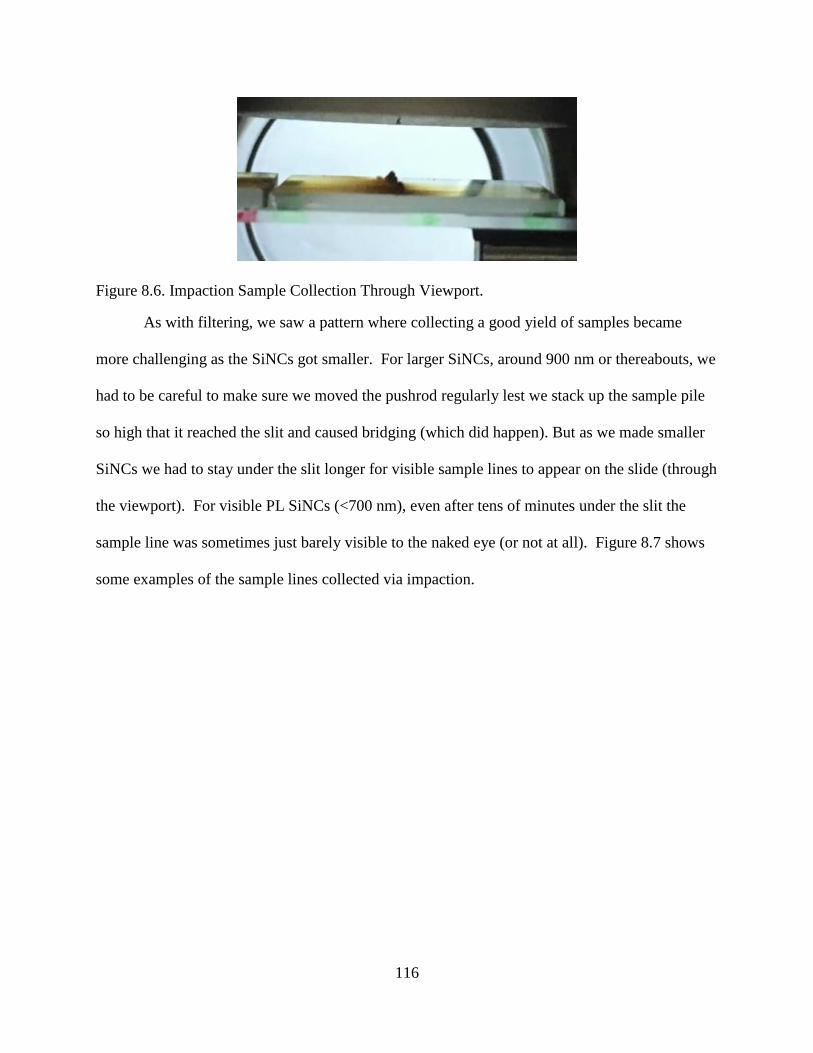
116
Figure 8.6. Impaction Sample Collection Through Viewport.
As with filtering, we saw a pattern where collecting a good yield of samples became
more challenging as the SiNCs got smaller. For larger SiNCs, around 900 nm or thereabouts, we
had to be careful to make sure we moved the pushrod regularly lest we stack up the sample pile
so high that it reached the slit and caused bridging (which did happen). But as we made smaller
SiNCs we had to stay under the slit longer for visible sample lines to appear on the slide (through
the viewport). For visible PL SiNCs (<700 nm), even after tens of minutes under the slit the
sample line was sometimes just barely visible to the naked eye (or not at all). Figure 8.7 shows
some examples of the sample lines collected via impaction.
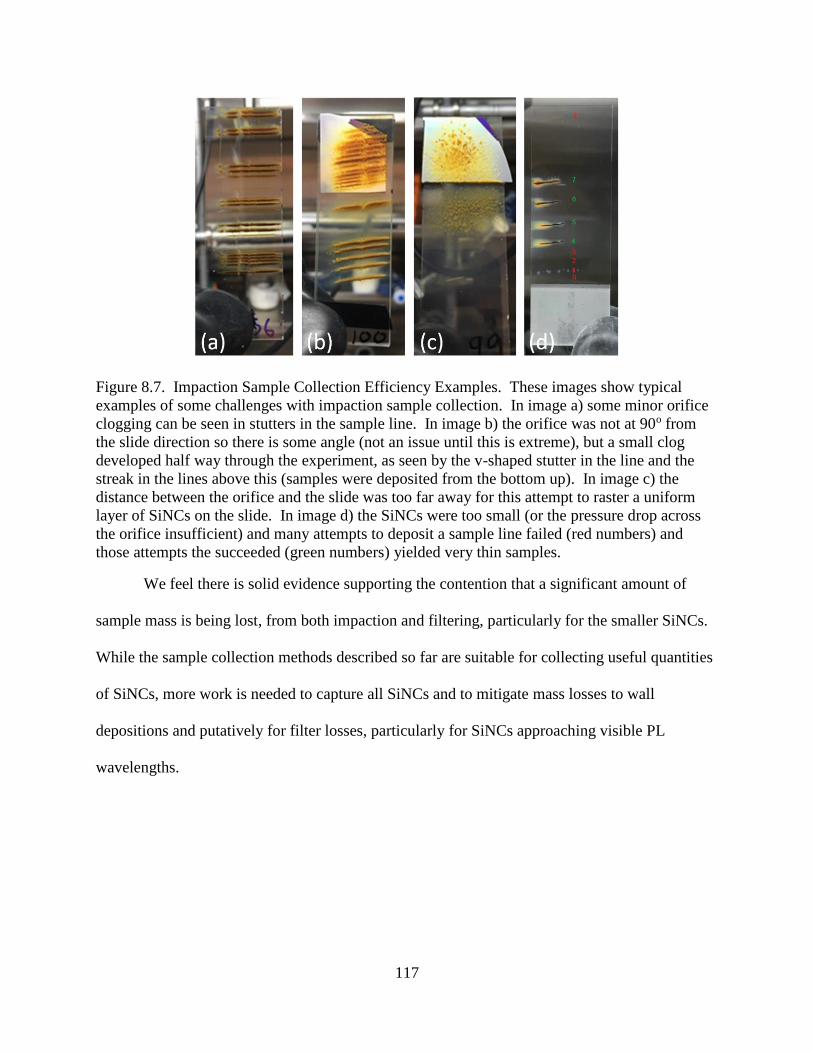
117
Figure 8.7. Impaction Sample Collection Efficiency Examples. These images show typical
examples of some challenges with impaction sample collection. In image a) some minor orifice
clogging can be seen in stutters in the sample line. In image b) the orifice was not at 90o from
the slide direction so there is some angle (not an issue until this is extreme), but a small clog
developed half way through the experiment, as seen by the v-shaped stutter in the line and the
streak in the lines above this (samples were deposited from the bottom up). In image c) the
distance between the orifice and the slide was too far away for this attempt to raster a uniform
layer of SiNCs on the slide. In image d) the SiNCs were too small (or the pressure drop across
the orifice insufficient) and many attempts to deposit a sample line failed (red numbers) and
those attempts the succeeded (green numbers) yielded very thin samples.
We feel there is solid evidence supporting the contention that a significant amount of
sample mass is being lost, from both impaction and filtering, particularly for the smaller SiNCs.
While the sample collection methods described so far are suitable for collecting useful quantities
of SiNCs, more work is needed to capture all SiNCs and to mitigate mass losses to wall
depositions and putatively for filter losses, particularly for SiNCs approaching visible PL
wavelengths.
118
CHAPTER 9. PASSIVATION AND QUANTUM YIELD STUDIES
9.1. Introduction
As mentioned previously, the first objective of this study was to establish, at NDSU, the
capability to produce high quality photoluminescent silicon nanocrystals (SiNCs) to support the
needs of NDSU researchers and their collaborative partners. Key to meeting this objective was
established a reliable method for passivation, combined with PLQY characterization, to enable
iteration and analysis within the parameter space to work out the best conditions for reliably
producing high quantum yield (high quality) SiNCs. Several passivation methods have been
established for SiNCs [136]. We chose thermal hydrosilylation as our preferred passivation
scheme for our study because of the body of literature supporting the method [136], [94], [97],
[96], [125]. Initially we sought to repeat the thermal hydrosilylation passivation scheme with 1-
Dodecene in mesitylene (1:5 ratio) performed at the Kortshagen group using a Schlenk line and a
refluxing assembly, but we quickly settled on a method we prefer and recommend for its
simplicity and reliability, which we will described next.
9.2. Microwave Rx Vial and PLQY Results
Thermal hydrosilylation of SiNCs involves placing the SiNCs (as a dry powder) into a
vessel containing a ligand (or ligand precursor) and a compatible solvent. The ligand often has a
vinyl termination for free radical attachment to the SiNC (typically attacking the Si-Hx bond).
The hydrosilylation reaction is typically performed at temperatures near or above the boiling
point of the solvent (at atmospheric pressure), requiring continual reflux and/or a pressure vessel.
Kenny Anderson of the Boudjouk group recommended a microwave reaction vial with a crimped
lid, which is designed for high temperatures and moderate pressure. This approach eliminated the
need for a reflux assembly or a Schlenk line. Dry power SiNCs from scraping from impaction
119
slides could be dropped into the ligand/solvent in the vial, sealed, sonicated, and placed in a bath
at 185o C (with a small stirbar in the vial, and hot plate equipped with a magnetic stirrer).
Filtered samples with a thick layer of SiNCs could also simply be scraped into the vial, but
filtered samples with a thin layer needed the extra step of cutting the filter and dropping the
pieces into the solution, sealing, sonicating, un-sealing, removing the filter pieces, re-sealing,
sonicating aging, and placing the sealed vial in the hot bath. Of course, the SiNCs are placed in
the vial in an air-free glove box, but the sonicator is on a lab bench (otherwise water vapor would
contaminate the glove box) so after any sealing step the vial is removed from the glove box for
sonication, and placed back in the glove box for un-sealing, filter removal, and re-sealing.
Figure 9.1 shows the steps for filter samples, as just described. In the case of impaction sample
collection (or easily scraped filers), the steps in Figure 9.1 are less because the lines of samples
are scraped into the microwave reaction vial in glove box.
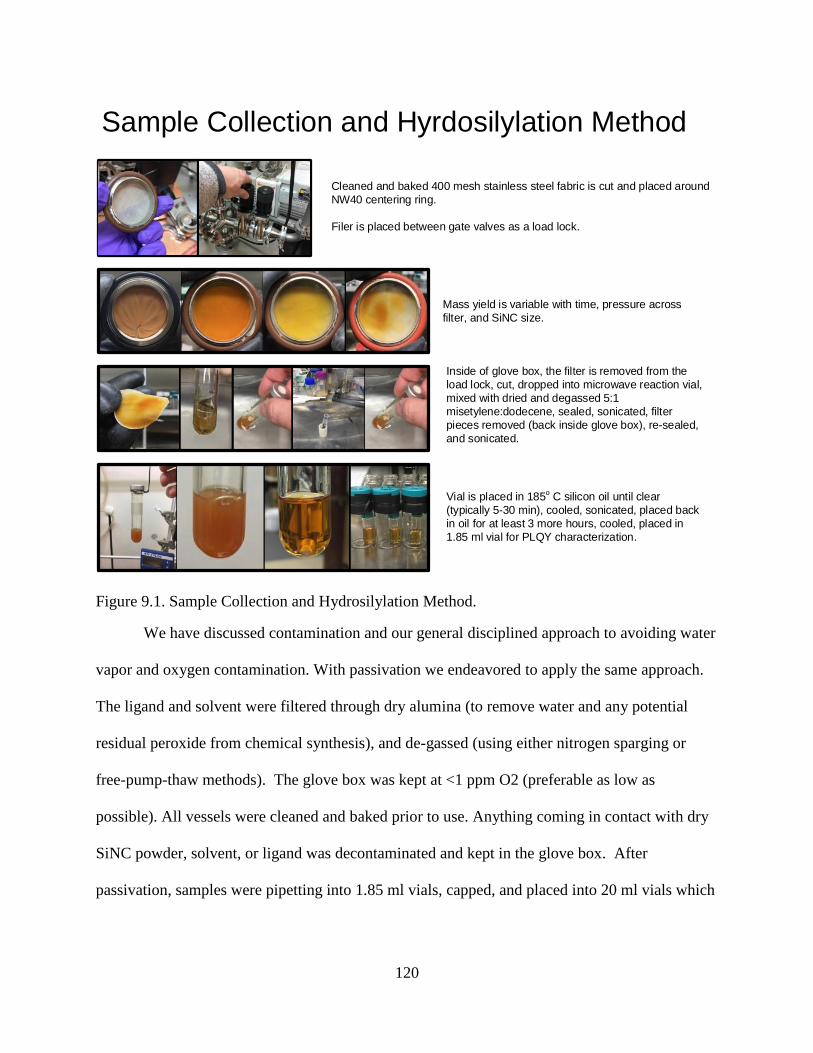
120
Cleaned and baked 400 mesh stainless steel fabric is cut and placed around
NW40 centering ring.
Filer is placed between gate valves as a load lock.
Mass yield is variable with time, pressure across
filter, and SiNC size.
Inside of glove box, the filter is removed from the
load lock, cut, dropped into microwave reaction vial,
mixed with dried and degassed 5:1
misetylene:dodecene, sealed, sonicated, filter
pieces removed (back inside glove box), re-sealed,
and sonicated.
Vial is placed in 185o C silicon oil until clear
(typically 5-30 min), cooled, sonicated, placed back
in oil for at least 3 more hours, cooled, placed in
1.85 ml vial for PLQY characterization.
Sample Collection and Hyrdosilylation Method
Figure 9.1. Sample Collection and Hydrosilylation Method.
We have discussed contamination and our general disciplined approach to avoiding water
vapor and oxygen contamination. With passivation we endeavored to apply the same approach.
The ligand and solvent were filtered through dry alumina (to remove water and any potential
residual peroxide from chemical synthesis), and de-gassed (using either nitrogen sparging or
free-pump-thaw methods). The glove box was kept at <1 ppm O2 (preferable as low as
possible). All vessels were cleaned and baked prior to use. Anything coming in contact with dry
SiNC powder, solvent, or ligand was decontaminated and kept in the glove box. After
passivation, samples were pipetting into 1.85 ml vials, capped, and placed into 20 ml vials which
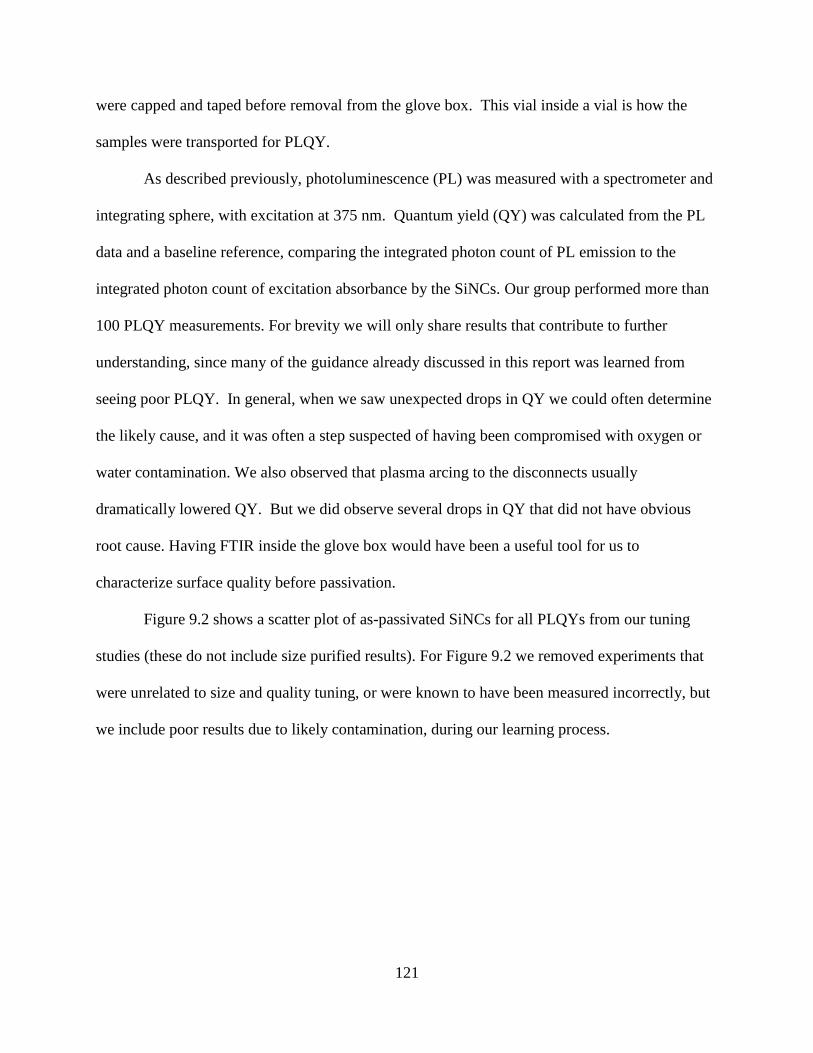
121
were capped and taped before removal from the glove box. This vial inside a vial is how the
samples were transported for PLQY.
As described previously, photoluminescence (PL) was measured with a spectrometer and
integrating sphere, with excitation at 375 nm. Quantum yield (QY) was calculated from the PL
data and a baseline reference, comparing the integrated photon count of PL emission to the
integrated photon count of excitation absorbance by the SiNCs. Our group performed more than
100 PLQY measurements. For brevity we will only share results that contribute to further
understanding, since many of the guidance already discussed in this report was learned from
seeing poor PLQY. In general, when we saw unexpected drops in QY we could often determine
the likely cause, and it was often a step suspected of having been compromised with oxygen or
water contamination. We also observed that plasma arcing to the disconnects usually
dramatically lowered QY. But we did observe several drops in QY that did not have obvious
root cause. Having FTIR inside the glove box would have been a useful tool for us to
characterize surface quality before passivation.
Figure 9.2 shows a scatter plot of as-passivated SiNCs for all PLQYs from our tuning
studies (these do not include size purified results). For Figure 9.2 we removed experiments that
were unrelated to size and quality tuning, or were known to have been measured incorrectly, but
we include poor results due to likely contamination, during our learning process.
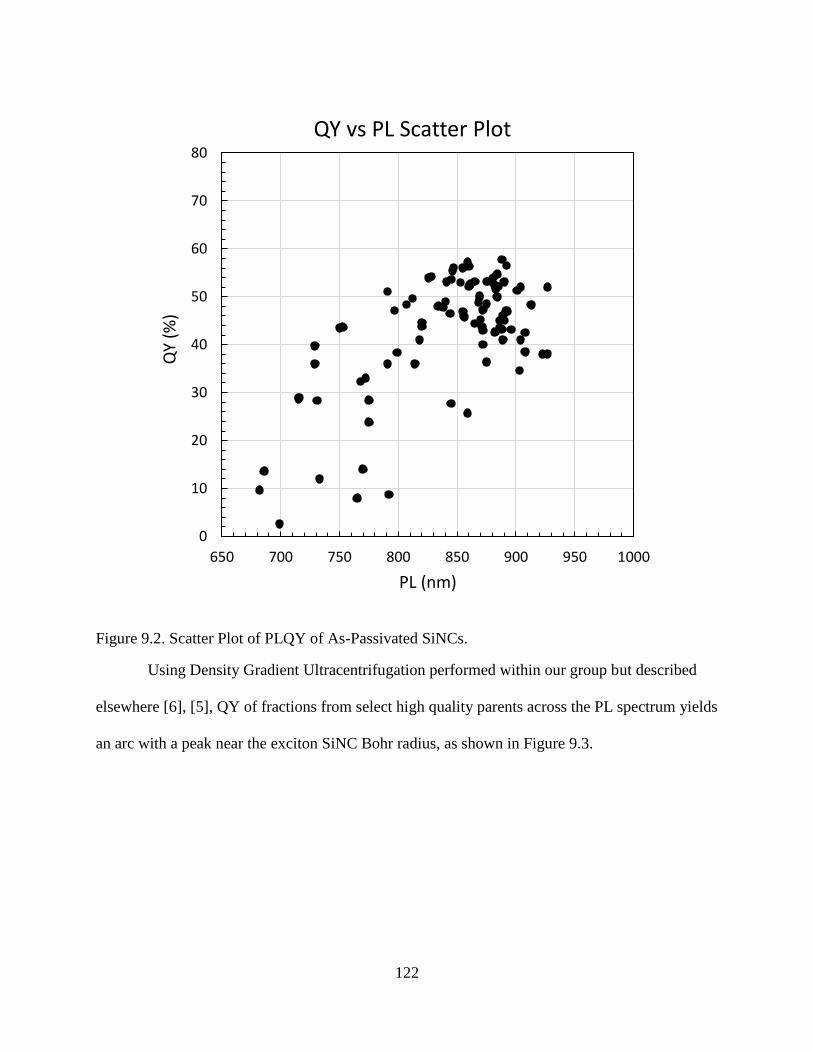
122
Figure 9.2. Scatter Plot of PLQY of As-Passivated SiNCs.
Using Density Gradient Ultracentrifugation performed within our group but described
elsewhere [6], [5], QY of fractions from select high quality parents across the PL spectrum yields
an arc with a peak near the exciton SiNC Bohr radius, as shown in Figure 9.3.
0
10
20
30
40
50
60
70
80
650 700 750 800 850 900 950 1000
QY
(%)
PL (nm)
QY vs PL Scatter Plot
123
Figure 9.3. Scatter Plot of PLQY of DGU Purified SiNCs.
Measurement of PL was very reliable, given that it is a characteristic of size, and not of
processing or contamination. In other words, PL was measurable regardless of impacts on QY,
provided there was enough QY to make a clear PL peak. But QY is very sensitive to conditions,
so decisions about changing the parameter space, in an attempt to improve QY, needed to be
made carefully, less we chase our tails. With careful conditions and duplicate runs we have
generally observed a variation of ±5% for QY (absolute).
As peak PL approached closer to visible wavelength the human visible PL under
excitation (365-405 nm LEDs) was striking, as shown in Figure 9.4.
0
10
20
30
40
50
60
70
80
650 700 750 800 850 900 950 1000
QY
(%)
PL (nm)
QY vs PL for Size Purified Fractions
77-DGU QY
79-DGU QY
80 DGU QY
103C-DGU QY
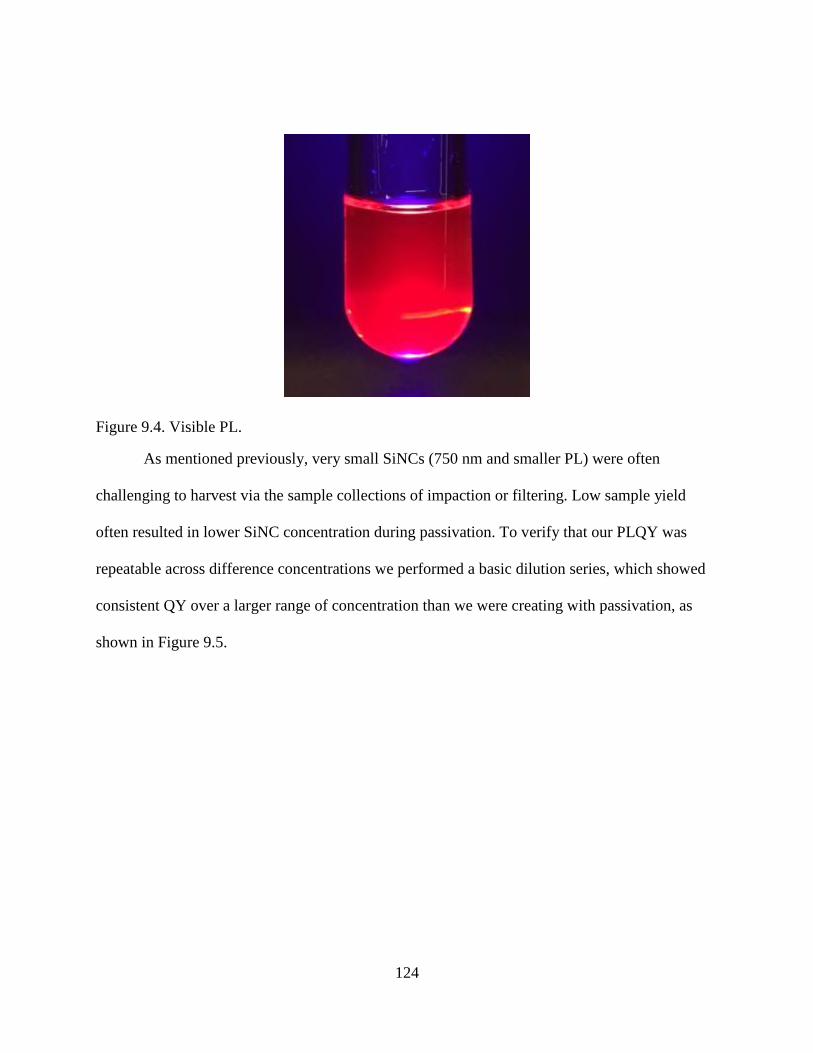
124
Figure 9.4. Visible PL.
As mentioned previously, very small SiNCs (750 nm and smaller PL) were often
challenging to harvest via the sample collections of impaction or filtering. Low sample yield
often resulted in lower SiNC concentration during passivation. To verify that our PLQY was
repeatable across difference concentrations we performed a basic dilution series, which showed
consistent QY over a larger range of concentration than we were creating with passivation, as
shown in Figure 9.5.
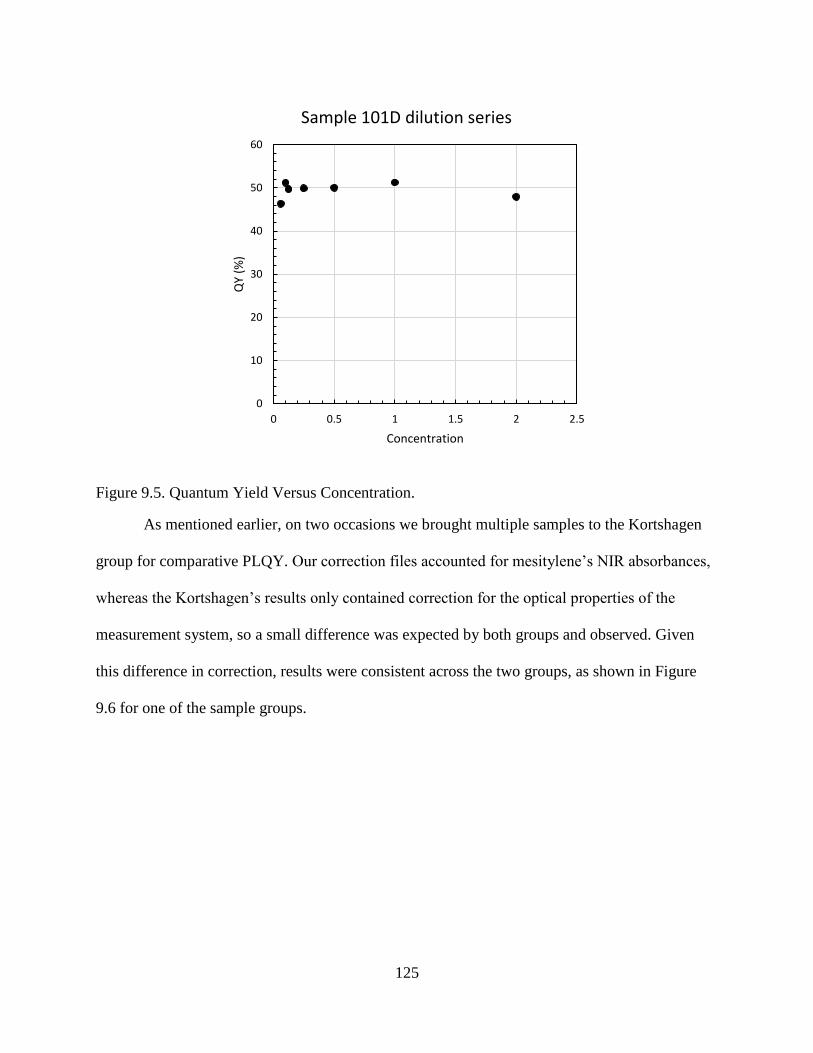
125
Figure 9.5. Quantum Yield Versus Concentration.
As mentioned earlier, on two occasions we brought multiple samples to the Kortshagen
group for comparative PLQY. Our correction files accounted for mesitylene’s NIR absorbances,
whereas the Kortshagen’s results only contained correction for the optical properties of the
measurement system, so a small difference was expected by both groups and observed. Given
this difference in correction, results were consistent across the two groups, as shown in Figure
9.6 for one of the sample groups.
0
10
20
30
40
50
60
0 0.5 1 1.5 2 2.5
QY
(%)
Concentration
Sample 101D dilution series
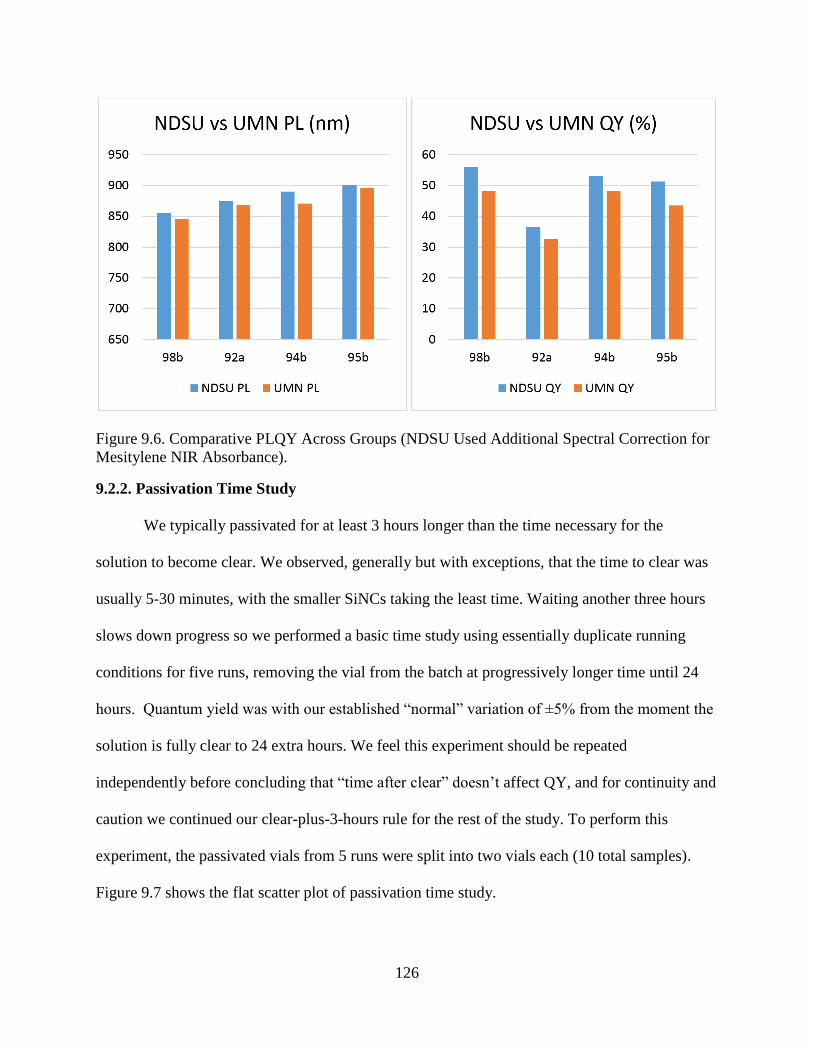
126
Figure 9.6. Comparative PLQY Across Groups (NDSU Used Additional Spectral Correction for
Mesitylene NIR Absorbance).
9.2.2. Passivation Time Study
We typically passivated for at least 3 hours longer than the time necessary for the
solution to become clear. We observed, generally but with exceptions, that the time to clear was
usually 5-30 minutes, with the smaller SiNCs taking the least time. Waiting another three hours
slows down progress so we performed a basic time study using essentially duplicate running
conditions for five runs, removing the vial from the batch at progressively longer time until 24
hours. Quantum yield was with our established “normal” variation of ±5% from the moment the
solution is fully clear to 24 extra hours. We feel this experiment should be repeated
independently before concluding that “time after clear” doesn’t affect QY, and for continuity and
caution we continued our clear-plus-3-hours rule for the rest of the study. To perform this
experiment, the passivated vials from 5 runs were split into two vials each (10 total samples).
Figure 9.7 shows the flat scatter plot of passivation time study.
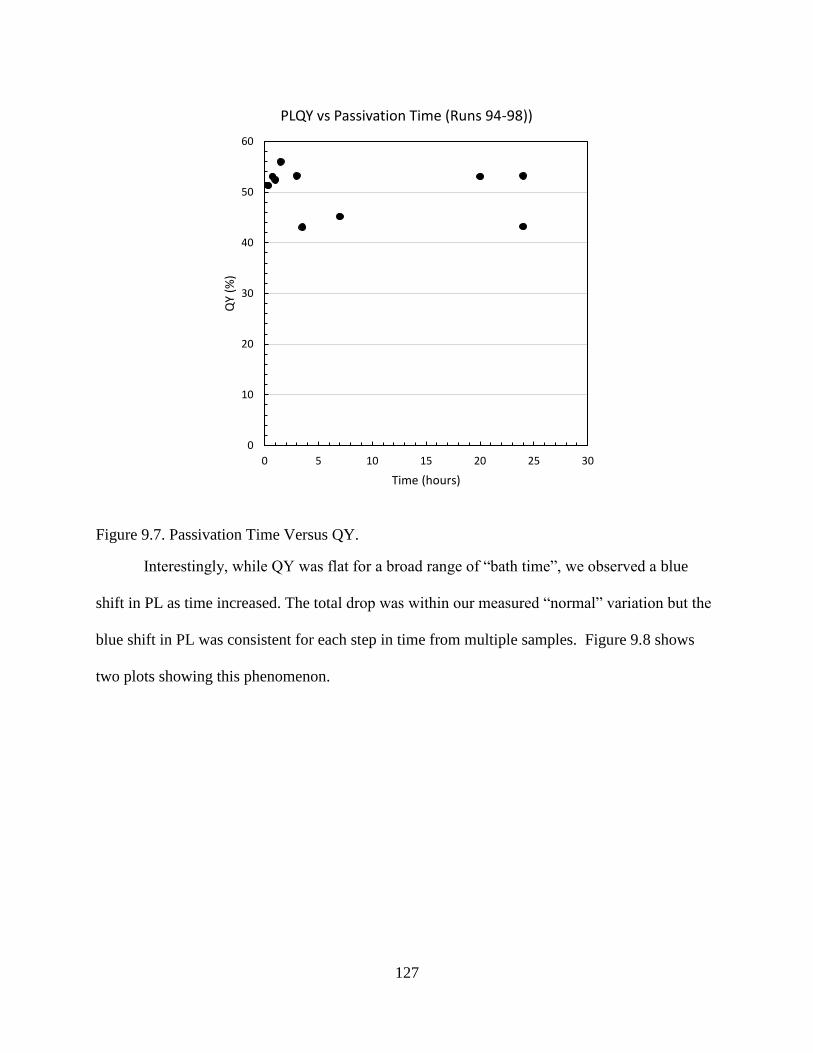
127
Figure 9.7. Passivation Time Versus QY.
Interestingly, while QY was flat for a broad range of “bath time”, we observed a blue
shift in PL as time increased. The total drop was within our measured “normal” variation but the
blue shift in PL was consistent for each step in time from multiple samples. Figure 9.8 shows
two plots showing this phenomenon.
0
10
20
30
40
50
60
0 5 10 15 20 25 30
QY
(%)
Time (hours)
PLQY vs Passivation Time (Runs 94-98))
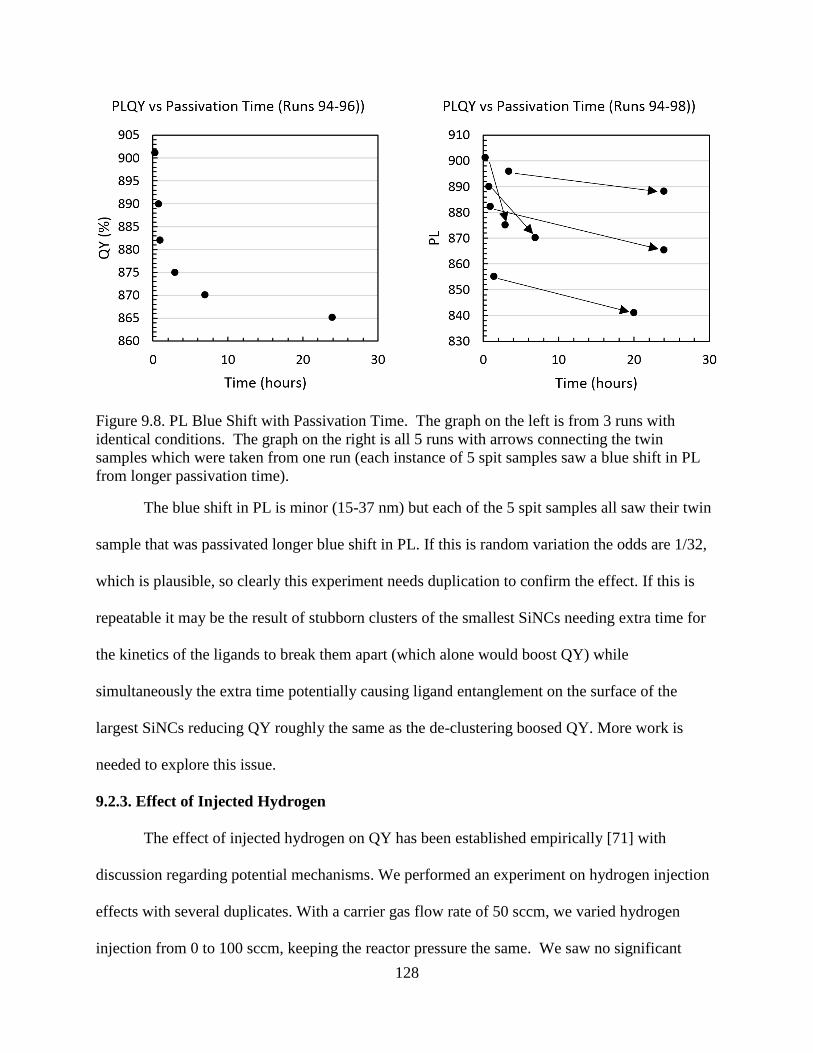
128
Figure 9.8. PL Blue Shift with Passivation Time. The graph on the left is from 3 runs with
identical conditions. The graph on the right is all 5 runs with arrows connecting the twin
samples which were taken from one run (each instance of 5 spit samples saw a blue shift in PL
from longer passivation time).
The blue shift in PL is minor (15-37 nm) but each of the 5 spit samples all saw their twin
sample that was passivated longer blue shift in PL. If this is random variation the odds are 1/32,
which is plausible, so clearly this experiment needs duplication to confirm the effect. If this is
repeatable it may be the result of stubborn clusters of the smallest SiNCs needing extra time for
the kinetics of the ligands to break them apart (which alone would boost QY) while
simultaneously the extra time potentially causing ligand entanglement on the surface of the
largest SiNCs reducing QY roughly the same as the de-clustering boosed QY. More work is
needed to explore this issue.
9.2.3. Effect of Injected Hydrogen
The effect of injected hydrogen on QY has been established empirically [71] with
discussion regarding potential mechanisms. We performed an experiment on hydrogen injection
effects with several duplicates. With a carrier gas flow rate of 50 sccm, we varied hydrogen
injection from 0 to 100 sccm, keeping the reactor pressure the same. We saw no significant
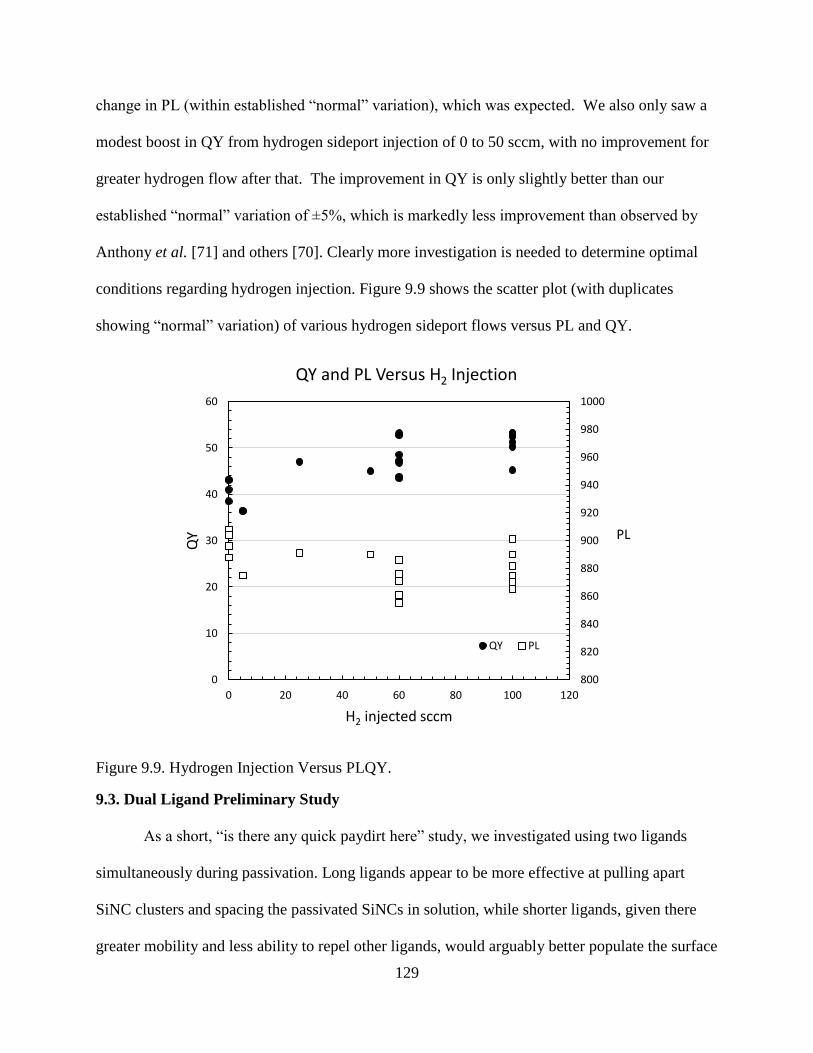
129
change in PL (within established “normal” variation), which was expected. We also only saw a
modest boost in QY from hydrogen sideport injection of 0 to 50 sccm, with no improvement for
greater hydrogen flow after that. The improvement in QY is only slightly better than our
established “normal” variation of ±5%, which is markedly less improvement than observed by
Anthony et al. [71] and others [70]. Clearly more investigation is needed to determine optimal
conditions regarding hydrogen injection. Figure 9.9 shows the scatter plot (with duplicates
showing “normal” variation) of various hydrogen sideport flows versus PL and QY.
Figure 9.9. Hydrogen Injection Versus PLQY.
9.3. Dual Ligand Preliminary Study
As a short, “is there any quick paydirt here” study, we investigated using two ligands
simultaneously during passivation. Long ligands appear to be more effective at pulling apart
SiNC clusters and spacing the passivated SiNCs in solution, while shorter ligands, given there
greater mobility and less ability to repel other ligands, would arguably better populate the surface
800
820
840
860
880
900
920
940
960
980
1000
0
10
20
30
40
50
60
0 20 40 60 80 100 120
QY
H2 injected sccm
QY and PL Versus H2 Injection
QY PL
PL
130
of SiNCs, resulting in better surface passivation. This tradeoff between the oppositional
advantages and disadvantages of ligand chain length appears to have led to 1-dodecene as a good
compromise of coverage and spacing. We theorized that a combination of short and long ligands
together might provide better passivation, with the short ligand providig greater surface coverage
and the long ligand providing better spacing.
Short ligands have lower boiling points, with some short ligands existing as gasses at
room temperature. Given that we needed relatively high temperatures for thermal
hydrosilylation, the shorter the ligand would mean a greater pressure resistance requirement of
the reaction vessel. We chose hexene and dodecene as our small and large ligands, through both
are really “medium” in their chain length. Using the sample method for passivation as outlined in
Figure 9.1 we experiment with 6 data points of hexene:dodecene ratios. We split sample filters
into multiple vials so we could reduce sample variability. In other words one sample filter from
one run was cut into multiple pieces and spit across two or more vials, each vial with a different
hexene:dodecene ratio. Results were inconclusive. Using hexene:dodecene ratios of 1:0, 1:1,
1:2, 1:3, 1:5, and 0:1 we saw some potential indicators that pure dodecene was slightly better
than pure hexane, and that a mixture was better than either pure ligands, but this was within
variation and borders on reckless signal calling to declare a pattern from what is just as likely
noise. We feel this experiment continues to have merit and a strong theoretical justification, but
we did not pursue it further because we observed that thermally hydrosilylating with hexene is
much slower than dodecene, in some cases requiring three days in the bath for the solution to
become clear. We feel this experiment should continue with many more replicates and with a
higher pressure rated vessel to allow for incorporation of smaller ligands, such as perhaps butene
(and octodecene could be included on the “long” ligand candidates).
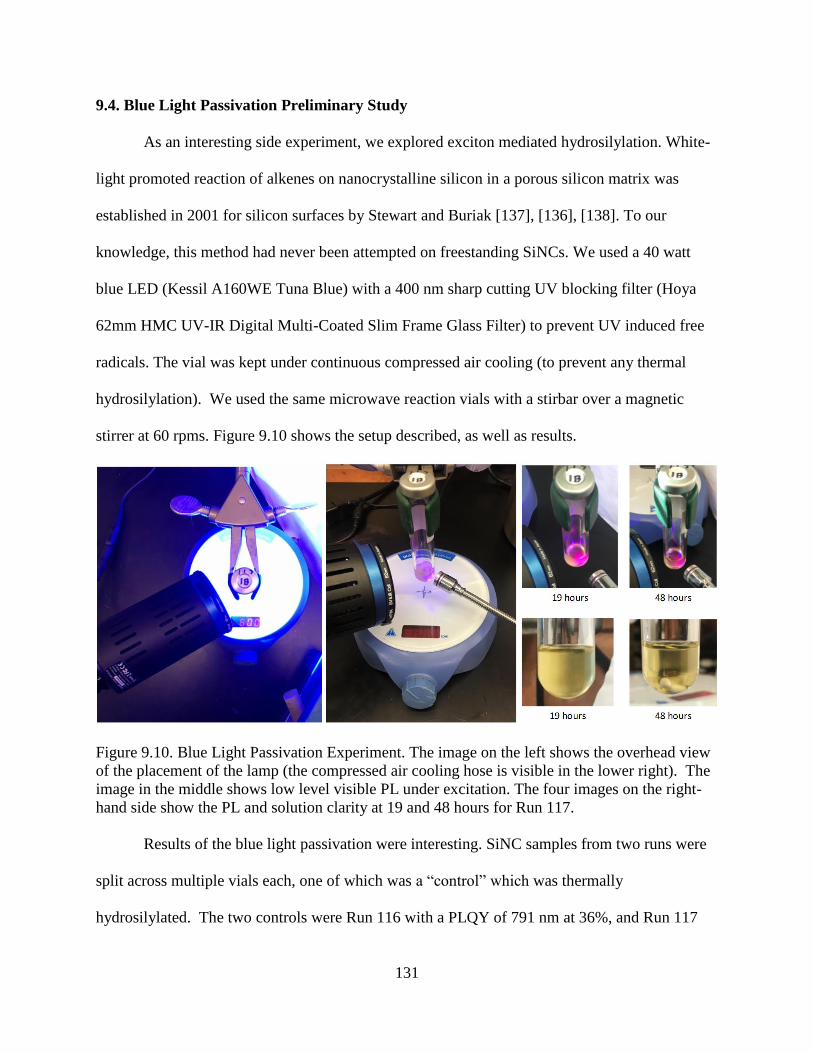
131
9.4. Blue Light Passivation Preliminary Study
As an interesting side experiment, we explored exciton mediated hydrosilylation. White-
light promoted reaction of alkenes on nanocrystalline silicon in a porous silicon matrix was
established in 2001 for silicon surfaces by Stewart and Buriak [137], [136], [138]. To our
knowledge, this method had never been attempted on freestanding SiNCs. We used a 40 watt
blue LED (Kessil A160WE Tuna Blue) with a 400 nm sharp cutting UV blocking filter (Hoya
62mm HMC UV-IR Digital Multi-Coated Slim Frame Glass Filter) to prevent UV induced free
radicals. The vial was kept under continuous compressed air cooling (to prevent any thermal
hydrosilylation). We used the same microwave reaction vials with a stirbar over a magnetic
stirrer at 60 rpms. Figure 9.10 shows the setup described, as well as results.
Figure 9.10. Blue Light Passivation Experiment. The image on the left shows the overhead view
of the placement of the lamp (the compressed air cooling hose is visible in the lower right). The
image in the middle shows low level visible PL under excitation. The four images on the right-
hand side show the PL and solution clarity at 19 and 48 hours for Run 117.
Results of the blue light passivation were interesting. SiNC samples from two runs were
split across multiple vials each, one of which was a “control” which was thermally
hydrosilylated. The two controls were Run 116 with a PLQY of 791 nm at 36%, and Run 117
132
with a PLQY of 818 nm at 41%. The second sample from Run 116 was placed under the blue
light for 68 hours, after which the PLQY was measured at 765 nm at 8%, after the measurement
the sample was thermal hydrosilylated for 3+ hours after which the PLQY was measured at 770
nm at 14%. The second sample from Run 117 was placed under the blue light for 24 hours, after
which the PLQY was measured at 730 nm at 3%, after which the sample was thermally
hydrosilylated for 3+ hours, after which the PLQY was measured at 740 nm at 15%. The
observation of passivation via alkenes and photoluminescence, without heat or UV, using only
blue light and time, is worth future exploration, and supporting evidence that exciton mediated
hydrosilylation is possible with freestanding SiNCs.
Perhaps more interesting is that both samples were significantly blue-shifted from their
controls. We speculate that perhaps either 1) increased strain of silicon bonds on smaller SiNCs
(due to a tighter radius), or 2) an effect related to exciton lifetimes lasting longer with smaller
SiNCs, or 3) some as yet determined effect, is causing the preferential hydrosiliation of more
blue shifted SiNCs. It is important to note that when these blue light exposed samples were
subsequently exposed to standard thermal hydrosilyation the improve QY they red shifted
somewhat and increased QY somewhat but not nearly to the PLQY that the controls were (from
the same run). We speculate that perhaps the much lower temperatures and the long timespans
allowed trace oxygen to physiosorbe on the surface, perhaps leading to some oxidation, limiting
the “return” to the PLQY of the controls. Since these samples didn’t fully red-shift back to the
control level we speculate the mechanism that causes the blue-shifting is related to the
mechanism the prevented the full red-shift after heat was introduced. Perhaps the oxidation
reduced the QY in a manner than effected a disproportionate amount of the large SiNCs. Our
observations with blue light passivation warrant further investigation.
133
9.5. Quantum Yield and the Parameter Space
We feel the best way to look at the parameter space when attempting to maximize
quantum yield is to think about it as a process of elimination of those factors that reduce
quantum yield. First and foremost, in our opinion, is purity and cleanliness. It is essential that
components are cleaned and baked, that systems or routinely and repeatedly purged and free of
leaks, that carrier and injection gases be as pure as possible. The improved quantum yield effects
of switching from industrial grade carrier gas (with an estimated oxygen level of up to 4 ppm) to
research grade gas (<0.5 ppm oxygen) can be seen in Figure 9.11. Likewise, it is essential that
the glove box gas and all materials and chemicals involved in sample handling and passivation
be maximally pure and clean (de-gassed or freeze-pump-thawed for liquids, cleaned and baked
for vessels and tools, catalyzed and purge for glove box gas).
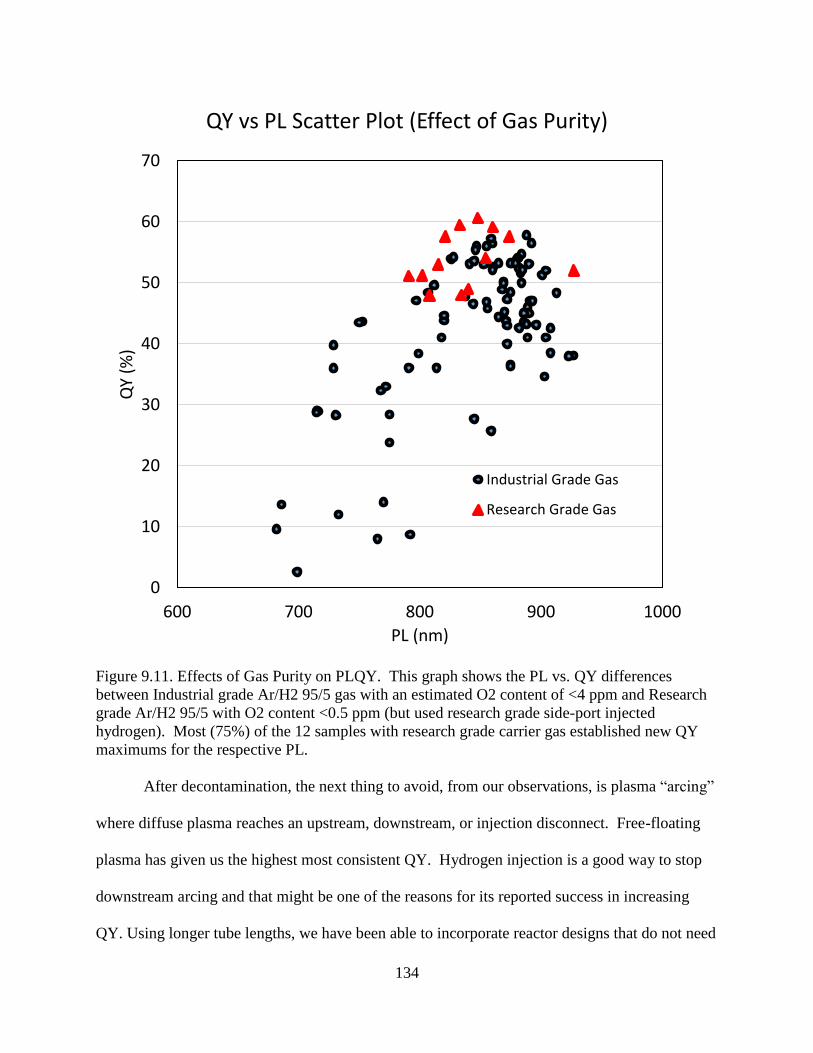
134
Figure 9.11. Effects of Gas Purity on PLQY. This graph shows the PL vs. QY differences
between Industrial grade Ar/H2 95/5 gas with an estimated O2 content of <4 ppm and Research
grade Ar/H2 95/5 with O2 content <0.5 ppm (but used research grade side-port injected
hydrogen). Most (75%) of the 12 samples with research grade carrier gas established new QY
maximums for the respective PL.
After decontamination, the next thing to avoid, from our observations, is plasma “arcing”
where diffuse plasma reaches an upstream, downstream, or injection disconnect. Free-floating
plasma has given us the highest most consistent QY. Hydrogen injection is a good way to stop
downstream arcing and that might be one of the reasons for its reported success in increasing
QY. Using longer tube lengths, we have been able to incorporate reactor designs that do not need
0
10
20
30
40
50
60
70
600 700 800 900 1000
QY
(%)
PL (nm)
QY vs PL Scatter Plot (Effect of Gas Purity)
Industrial Grade Gas
Research Grade Gas
135
hydrogen injection to prevent downstream arcing, and our QY for zero hydrogen injection is
very good (although not quite as good as with hydrogen injection). Other experienced
researchers have presented good evidence for the need for hydrogen injection (for high QY),
including compelling theoretical frameworks [71], but we remain open minded that proper
manipulation of the plasma through reactor design might be just as effective.
Passivation remains a big opportunity, in our opinion. We contend that our incorporation
of sealed microwave vials as passivation reaction vessels are less prone to contamination than
Schlenk line based techniques, and that might account for some of our robust repeatability.
Experimenting with subtle changes to the passivation method could be a promising way to find
additional factors that hold back the QY potential.
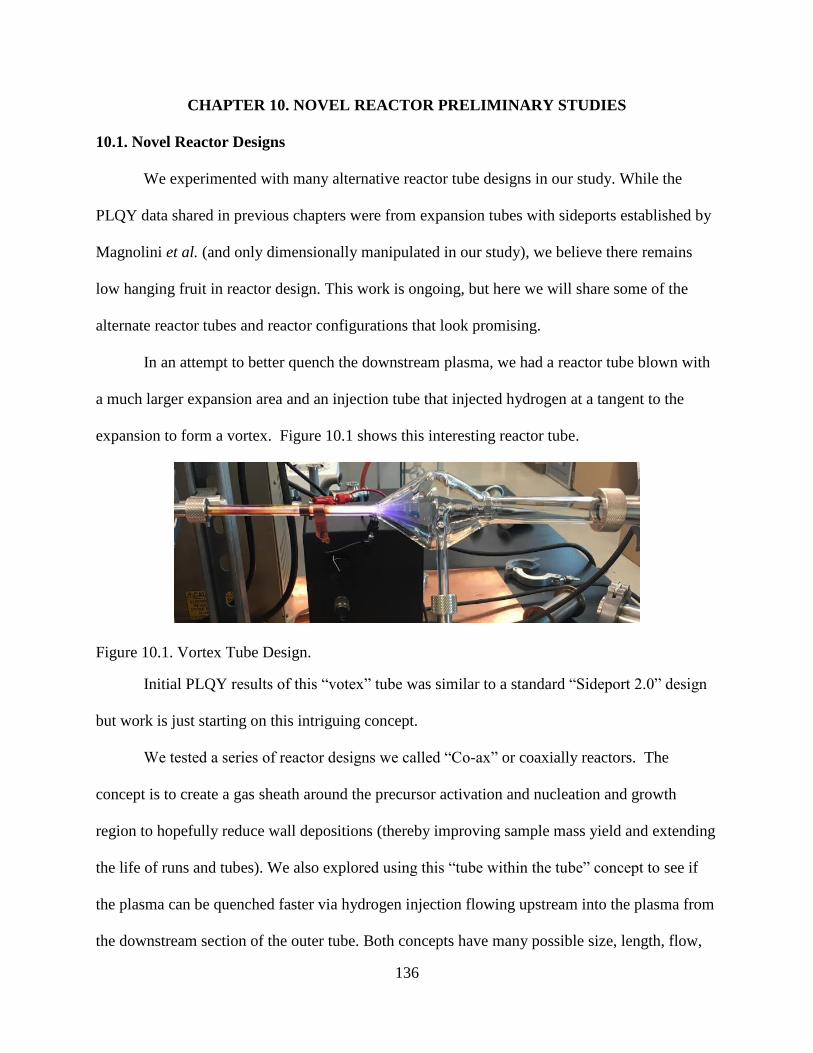
136
CHAPTER 10. NOVEL REACTOR PRELIMINARY STUDIES
10.1. Novel Reactor Designs
We experimented with many alternative reactor tube designs in our study. While the
PLQY data shared in previous chapters were from expansion tubes with sideports established by
Magnolini et al. (and only dimensionally manipulated in our study), we believe there remains
low hanging fruit in reactor design. This work is ongoing, but here we will share some of the
alternate reactor tubes and reactor configurations that look promising.
In an attempt to better quench the downstream plasma, we had a reactor tube blown with
a much larger expansion area and an injection tube that injected hydrogen at a tangent to the
expansion to form a vortex. Figure 10.1 shows this interesting reactor tube.
Figure 10.1. Vortex Tube Design.
Initial PLQY results of this “votex” tube was similar to a standard “Sideport 2.0” design
but work is just starting on this intriguing concept.
We tested a series of reactor designs we called “Co-ax” or coaxially reactors. The
concept is to create a gas sheath around the precursor activation and nucleation and growth
region to hopefully reduce wall depositions (thereby improving sample mass yield and extending
the life of runs and tubes). We also explored using this “tube within the tube” concept to see if
the plasma can be quenched faster via hydrogen injection flowing upstream into the plasma from
the downstream section of the outer tube. Both concepts have many possible size, length, flow,

137
plasma power, and electrode spacing variables and we are also just starting to explore this
concept. Figure 10.2 shows the diagram we used for a configuration we called “Double Co-ax”
where the CHS and carrier gas mix flow though the center tube and are sheathed by carrier gas
when they enter the wider tube, and the plasma is quenched by an downstream coaxially tube
which flow hydrogen upstream.
Figure 10.2. Double Co-ax Design.
Figure 10.3 shows the plasma for a Double Co-ax run.
Figure 10.3. Double Co-ax Plasma.
Plasma Sheath
Dissociation
Nucleation and Growth
Dusty Plasma
Sheath Gas Plasma
Quench (or Precursor) Gas
Quench Gas Plasma
Sheath Gas
Precursor Mixed Gas
Sample Stream
Dusty Plasma Surface Modification Mixing Zone
Sh
ea
th G
as (
no
CH
S)
Ar/H/CHS mix
RF variable
Quenching Gas
(H2)
30STI
NG
ER
30STI
NG
ER

138
Results of the “Co-ax” are still being explored. Initial results have shown that QY can be
high and low from run to run, implying that we need to determine new sensitivities that might be
present in these configurations (such as the increased number of disconnect seals increasing the
probability of leaks). Pressure control was initially beyond our vacuum pump capacity to target
small SiNCs because the added sheath gas increased reactor pressure without commensurate
pump down capacity. We observed, as can be seen in Figure 10.3 that electrode spacing can
keep deposition out of the inner tube but qualitatively it’s too early to say if the outer tube
depositions is reduced. In our opinion this reactor design approach holds promise and should
continue to be investigated.
139
CHAPTER 11. NOVEL MAGNETIC CONFINEMENT PRELIMINARY STUDIES
11.1. Plasma Manipulation with Magnetic Fields
We have observed that manipulation of the plasma morphology and energy density
gradients is very useful for size tuning and improving QY in SiNCs. This manipulation has been
performed via carrier gas flow, reactor tube design, electrode placement, power level, hydrogen
injection, and CHS flow. Precise manipulation of the upstream plasma energy density gradient
would be highly useful for controlling SiNC size and polydispersity. Precise control of the zone
of hottest plasma necessary for crystallization of amorphous silicon nanoparticles into SiNCs
would be extremely useful for both size and QY. Precise control of the downstream plasma
gradient, especially the ability very quickly quench the plasma after crystallization would be very
useful to preventing mechanisms that might reduce QY or introduce additional polydispersity.
Magnetic field manipulation of plasma, especially confinement of plasma, has been
studied for decades by some of the brightest minds pursuing fusion power. A small research area
has been studying magnetic field effects on dusty plasma, including the Thomas group at Auburn
University [139], [140]. We theorize that magnetic confinement of the plasma, or magnetic field
manipulation of the “dust” could be useful to producing SiNCs via non-thermal plasma
synthesis.
As another “see if there is any pay dirt” experiment, we used off-the-shelf automotive
solenoid electrode magnets that fit readily over the reactor tubes to observe the effect on carrier
gas only plasma, but results were disappointing. The grounded assembly of the solenoid and the
weak magnetic field produced appeared to make the solenoid nearly indistinguishable in its
effect on the plasma versus a basic ground electrode. Recognizing we wanted maximum
magnetic field strength with minimum occlusion of the plasma (so we could observe the effects)
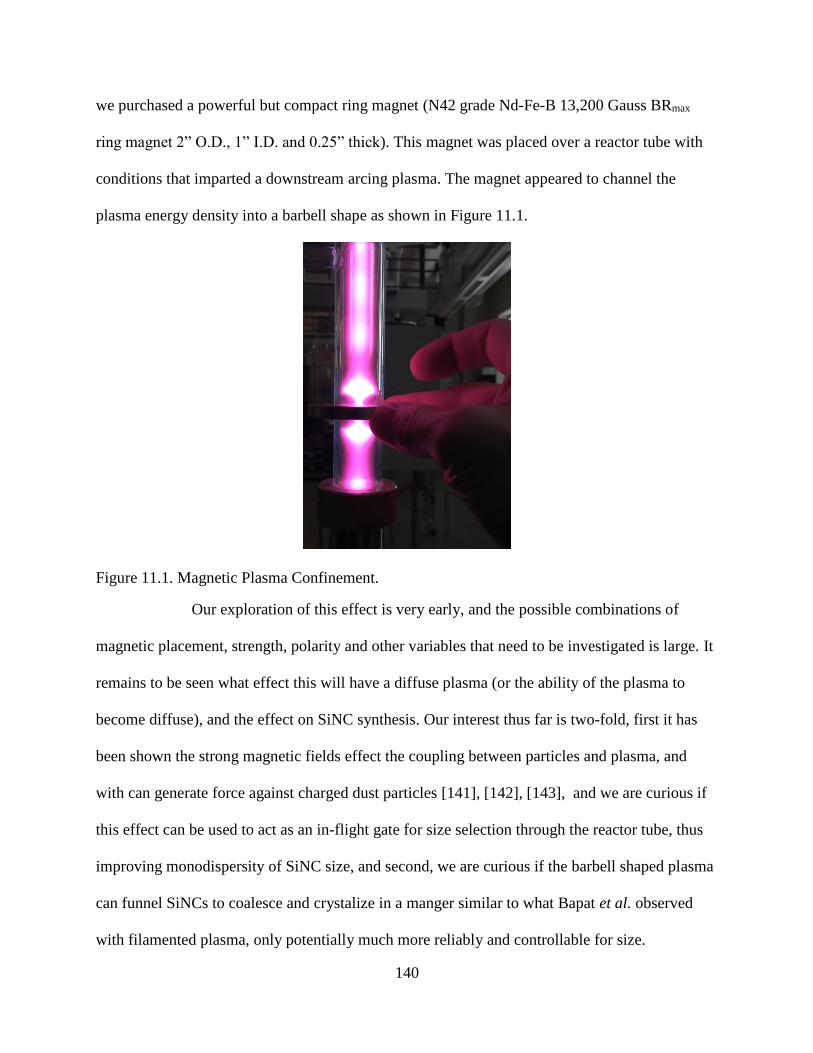
140
we purchased a powerful but compact ring magnet (N42 grade Nd-Fe-B 13,200 Gauss BRmax
ring magnet 2” O.D., 1” I.D. and 0.25” thick). This magnet was placed over a reactor tube with
conditions that imparted a downstream arcing plasma. The magnet appeared to channel the
plasma energy density into a barbell shape as shown in Figure 11.1.
Figure 11.1. Magnetic Plasma Confinement.
Our exploration of this effect is very early, and the possible combinations of
magnetic placement, strength, polarity and other variables that need to be investigated is large. It
remains to be seen what effect this will have a diffuse plasma (or the ability of the plasma to
become diffuse), and the effect on SiNC synthesis. Our interest thus far is two-fold, first it has
been shown the strong magnetic fields effect the coupling between particles and plasma, and
with can generate force against charged dust particles [141], [142], [143], and we are curious if
this effect can be used to act as an in-flight gate for size selection through the reactor tube, thus
improving monodispersity of SiNC size, and second, we are curious if the barbell shaped plasma
can funnel SiNCs to coalesce and crystalize in a manger similar to what Bapat et al. observed
with filamented plasma, only potentially much more reliably and controllable for size.
141
CHAPTER 12. SUMMARY AND FUTURE STUDIES
12.1. CHS as a Precursor
We have demonstrated the reliable production of high quantum yields at tunable SiNC
size using CHS as a precursor in non-thermal plasma synthesis. This is the first such synthesis
using CHS, and the highest quantum yield for SiNCs produced from CHS by any other method.
We also demonstrated a successful bubbler design for CHS, and we have discussed proper care
and handling of this unique precursor.
The quantum yields and size tunability we demonstrated are on par with the best
achievements with silane for the same process, making CHS an attractive precursor for future
research in this area. While our group has not performed synthesis with silane, but based on the
literature and conversations with the Kortshagen group, we have not observed any limitation to
CHS that would not also apply to silane, since both are introduced into the reactor as gas and
both are comprised of the same elements. Future research may demonstrate that CHS’s ring-
structure and liquid state (in the bubbler) can be leveraged to produce synthesis or properties
advantages over silane as a precursor.
From the perspective of our group, and first objective of this study (to establish the
capability to produce high quality SiNCs at NDSU) would not have been attempted with silane,
because of the training and infrastructure requirements for it’s safe handling and use. Safety is
clearly and advantage of CHS over silane, but some groups at other universities might be
challenged to gain access to CHS (making sourcing a disadvantage of CHS for those groups).
142
12.2. Challenges and Opportunities of Non-Thermal Plasma Synthesis of Silicon
Nanocrystals
The number one issue, in our opinion, regarding non-thermal plasma synthesis of SiNCs,
in terms of limiting the process from scale-up, is the loss of roughly half of the precursor to
reactor wall depositions. This mass loss is not an issue for the production of lab scale research
samples, but for intermediate production scale up for future devices made with SiNCs produced
by this process it remains a key obstacle. Future research into new reactor design, or technology
to manipulate flow or plasma morphology, needs to be a priority for scale-up ambitions.
The second issue, in our opinion, is the physics hurdle that might require some clever
engineering to find a way around. We observe that the “fine tuning” needed to produce and
capture high quality SiNCs appears to get more difficult with decreasing size. While the Bohr
radius would imply that the best QY is in the NIR, just shy of visible, we are not convinced that
the dropping QY as we move below 700 nm is simply a limitation of the photophysics, but also a
limitation of the process, as currently manifest. Sample collection becomes very challenging at
visible PL sizes, making sample mass yields very low. The size of the small SiNCs is much
closer to the size of growing particles that tend to be more ambipolar (unlikely to reliably have a
net negative charge), meaning we are trying to stop growth just after the particles are too small to
avoid wall collisions. If the plasma is energetic enough to impart crystallinity on the targeted
SiNC size the plasma immediately upstream of this crystallization region still be quite energetic.
When targeting larger SiNCs the plasma just upstream of the crystallization region is only
“heating up” SiNCs that are slightly smaller than the target size, but when targeting visible PL
SiNCs that upstream region is now heating much more “fragile” ambipolar particles, driving
evaporation, wall collision, and/or coalescence to bigger than targeted SiNC size. This plasma
143
may also be contributing to SiNC surface damage that could be reducing the QY on the smallest
SiNCs. Determiningthe process parameters and system design to enable steeper or more
asymmetric plasma density gradients might be required to produce high sample mass yields of
high quality visible wavelength SiNCs.
12.3. Future Studies: Sample Collection
While mass loss to wall deposition may be greater than sample collection loss (much
greater for larger SiNCs), clearly improved sample collection efficiency for the smaller SiNCs
should be a priority for future work. A potentially promising approach to sample collection is to
leverage the negative charge of the SiNCs exiting the reactor by using grounded or positively
charged sample collection substrates. Cooling the sample collection substrates to liquid nitrogen
temperatures would induce a thermophoretic effect that could be manipulated slow down and
capture SiNCs more effectively. A fractionation tunnel with an electric field and/or steep thermal
gradient in the normal direction to the flow (or a directed magnetic field) could serve to slow
down and enable capture of SiNCs that are at least partially separated by size.
12.4. Future Studies: Passivation
Our preliminary study of blue light passivation should be pursued to determine its full
potential. Exciton mediation could potentially be utilized to segregate the high quality SiNCs
from low quality (no PL), since theoretically a defective SiNC without PL would likely
extinguish excitons (through electron hole recombination) much faster than photoluminescent
SiNCs, resulting in preferential hydrosilyation of high quality SiNCs would could be separated
by filtered from the solution the un-hydrosilylated SiNCs. The putative size selection effects
observed in our preliminary study (where the QY was blue-shifted from the control) should be
investigated and the mechanism determined.
144
Dual ligand (or more than two) passivation should be pursued. The theoretical basic for
using a short chain alkene for coverage and a long chain alkene for separation of clusters and
spacing of SiNCs remains compelling.
In-flight passivation has been reported by others [125] and remains a research area of
great opportunity for the simplicity that it could bring to the process (eliminating several manual
steps in sample handling).
12.5. Future Studies: Reactor Design and Plasma Control
Priorities for reactor designs should be, in our opinion, targeted towards reducing wall
deposition and controlling the plasma morphology. Our preliminary study of co-axial reactor
tubes should be continued, with focus on fluid dynamics and plasma modeling to determine the
optimal design that minimizes diffusion of silicon species radially. Our preliminary study on
magnetic confinement should be continued, a vast knowledge domain exists in plasma physics
related to magnetic confinement and this expertise should be cultivated and leveraged to develop
methods to manipulate plasma morphology and power density gradients to allow for better
tuning of the process, and controlled transport, separation and collection of SiNCs.
12.6. Future Studies: Additional Chemistries
CHS has unique chemistries that might be leveraged for dopants and core-shell
structures. Liquid dopants mixed at calculated ratios with CHS in the bubbler could potentially
enable production of doped SiNCs through one bubber. The fast rate CHS ring-opening
polymerization could be paired with slower reacting, more plasma sable precursors that
participate in particle accretion later in the flow, possibly resulting in natural core-shell
structures, or relying on phase separation to form heterogenous structures in the hottest region of
the plasma.

145
12.7. Conclusion
Non-thermal plasma synthesis of SiNCs remains a valuable production method of these
promising materials. CHS has been shown to be an attractive and reliable precursor for this
process. We have outlined many compelling pathways for future research. We hope this
dissertation can serve as a valuable guiding document for researchers in the exciting domain.

146
REFERENCES
[1] S. Guruvenket, J. M. Hoey, K. J. Anderson, M. T. Frohlich, R. Krishnan, J. Sivaguru, M.
P. Sibi and P. Boudjouk, "Synthesis of silicon quantum dots using cyclohexasilane
(Si6H12)," J. Mater. Chem. C, vol. 4, no. 10, p. 8206—8213 , 2016.
[2] C. M. Hessel, D. Reid, M. G. Panthani, M. R. Rasch, B. W. Goodfellow, J. Junwei Wei,
H. Fujii, V. Akhavan and B. A. Korgel, "Synthesis of Ligand-Stabilized Silicon
Nanocrystals with Size-Dependen Photoluminescence Spanning Visible to Near-Infrared
Wavelengths," Chem. Mater., vol. 24, no. 2, pp. 393-401, 2012.
[3] L. Mangolini, L. Thimsen and U. Kortshagen, "High-Yield Plasma Synthesis of
Luminescnet Silicon Nanocrystals," Nano Letters, vol. 5, no. 4, pp. 655-659, 2005.
[4] J. B. Miller, A. R. Van Sickle, R. J. Anthony, D. M. Kroll, U. R. Kortshagen and E. K.
Hobbie, "Ensemble brightening and enhanced quantum yield in size purified silicon
nanocrystals," ACS Nano, vol. 6, p. 7389, 2012.
[5] A. R. Van Sickle, J. B. Miller, C. Moore, R. J. Anthony, U. R. Kortshagen and E. K.
Hobbie, "Temperature dependent photoluminescence of size purified silicon
nanocrystals," ACS Applied Materials and Interfaces, vol. 5, p. 4233 , 2013.
[6] J. B. Miller, J. M. Harris and E. K. Hobbie, "Purifying colloidal nanoparticles through
ultracentrifugation with implications for interfaces and materials," Langmuir, vol. 10, p.
7936, 2014.
[7] J. B. Miller, N. Dandu, K. A. Velizhanin, R. J. Anthony, U. R. Kortshagen, D. M. Kroll,
S. Kilina and E. K. Hobbie, "Enhanced luminescent stability through particle interactions
in silicon nanocrystal aggregates," ACS Nano, vol. 9, p. 9772, 2015.
[8] S. L. Brown, D. J. Vogel, J. B. Miller, T. M. Inerbaev, R. J. Anthony, U. R. Kortshagen,
D. D. Kilin and E. K. Hobbie, "Enhancing silicon nanocrystal photoluminescence through
temperature and microstructure," Journal of Physical Chemistry C, vol. 120, p. 18909,
2016.
[9] J. B. Miller, "Optical Properties and Ensemble Characteristics of Size Purified Silicon
Nanocrystals," North Dakota State University Ph.D. Thesis, Fargo, ND, 2014.
[10] A. R. Van Sickle, "Temperature Dependent Optical Properties of Silicon Quantum
Dot/Polymer Nanocomposites," North Dakota Statu Univeristy Ph.D. Thesis, Fargo, ND,
2012.
147
[11] S. L. Brown, J. B. Miller, R. J. Anthony, U. R. Kortshagen, A. Kryjevski and E. K.
Hobbie, "Abrupt size partitioning of multimodal photoluminescence relaxation in
monodisperse silicon nanocrystals," ACS Nano, vol. 11, p. 1597, 2017.
[12] A. Elbaradei, S. L. Brown, J. B. Miller, S. May and E. K. Hobbie, "Interaction of
polymer-coated silicon nanocrystals with lipid bilayers and surfactant interfaces,"
Physical Review E, vol. 94, p. 042804, 2016.
[13] S. L. Brown, "Silicon Nanocrystals: Optical Properties and Self-Assembly," North Dakota
State University Ph. D. Thesis, Fargo, ND, 2018.
[14] S. B. Choi, B. K. Kim, P. Boudjouk and D. G. Grier, "Amine-promoted
disproportionation and redistribution of trichlorosilane: Formation of
tetradecachlorocyclohexasilane dianion," J. Am. Chem. Soc., vol. 123, p. 8117–8118,
2001.
[15] A. Elangovan, K. Anderson, P. R. Boudjouk and D. L. Schulz, "Method of Producing
Cyclohexasilane Compounds," 2015.
[16] P. Boudjouk, D. Schulz, K. Andersone and X. Dia, "Some New Chemistry of
Cyclohexasilane," in 42ndSilicon Symposium, Long Branch, NJ, 2009.
[17] X. Dai, D. L. Schulz, C. W. Braun, A. Ugrinov and P. Boudjouk, "“Inverse Sandwich”
Complexes of Perhalogenated Cyclohexasilane," Organometallics, vol. 29, no. 10, p.
2203–2205, 2010.
[18] S. Guruvenket, J. Hoey, K. Anderson, M. Frohlich, G. Strommen, R. Sailer and P.
Boudjouk, "Atmospheric Pressure Chemical Vapor Deposition of Silicon thin films using
cyclohexasilane," in 2014 IEEE 40th Photovoltaic Specialist Conference (PVSC), Denver,
CO, 2014.
[19] T. Masuda, H. Takagishi, K. Yamazaki and T. Shimoda, "Direct Imprinting of Liquid
Silicon," ACS Appl. Mater. Interface, vol. 8, p. 9969−9976, 2016.
[20] T. Shimoda and T. Masuda, "Liquid silicon and its application in electronics Japanese,"
Journal of Applied Physics, vol. 53, p. 02BA01, 2014.
[21] S. V. Vladimirov, K. Ostrikov and A. A. Samarian, Physics And Applications Of
Complex Plasmas, London, U.K.: Imperial College Press, 2005.
[22] Y. Han, K. Anderson, E. K. Hobbie, P. Boudjouk and D. S. Kinin, "Unraveling
Photodimerization of Cyclohexasilane from Molecular Dynamics Studies," J. Phys.
Chem. Lett., vol. 9, no. 15, p. 4349–4354, 2018.
148
[23] L. T. Canham, "Silicon quantum wire array fabrication by electrochemical and chemical
dissolution of wafers," Appl. Phys. Lett., vol. 57, p. 1046, 1990.
[24] A. P. Alivisatos, "Semiconductor Clusters, Nanocrystals, and Quantum Dots," Science,
vol. 271, no. 5251, pp. 933-937, 1996.
[25] Z. H. Lu, D. J. Lockwood and J. -M. Baribeau, "Quantum confinement and light emission
in SiO2/Si superlattices," Nature, vol. 378, p. 258–260, 1995.
[26] T. Shimizu-Iwayama and N. Kurumado, "Optical properties of silicon nanoclusters
fabricated by ion implantation," Journal of Applied Physics, vol. 83, p. 6018, 1998.
[27] N. -M. Park, C. -J. Choi, T. -Y. Seong and S. -J. Park, "Quantum confinement in
amorphous silicon quantum dots embedded in silicon nitride," Phys. Rev. Lett., vol. 86, p.
1355 , 2001.
[28] N. -M. Park, T. -S. Kim and S. -J. Park, "Band gap engineering of amorphous silicon
quantum dots for light-emitting diodes," Appl. Phys. Lett., vol. 78, p. 2575, 2001.
[29] T. -W. Kim, C. -H. Cho, B. -H. Kim and S.-J. Park, "Quantum confinement effect in
crystalline silicon quantum dots in silicon nitride grown using SiH4 and NH3," Appl.
Phys. Lett., vol. 88, p. 123102, 2006.
[30] E. -C. Cho, M. A. Green, G. Conibeer, D. Song, Y. -H. Cho, G. Scardera, S. Huang, S.
Park, X. J. Hao, Y. Huang and L. V. Dao, "Silicon Quantum Dots in a Dielectric Matrix
for All-Silicon Tandem Solar Cells," Advances in OptoElectronics, vol. 2007, p. 69578,
2007.
[31] Z. Wan, S. Huang, M. A. Green and G. Conibeer, "Rapid thermal annealing and
crystallization mechanisms study of silicon nanocrystal in silicon carbide matrix,"
Nanoscale Research Letters, vol. 6, p. 129, 2011.
[32] Q. Cheng, S. Xu and K. Ostrikov, "Single-step, rapid low-temperature synthesis of Si
quantum dots embedded in an amorphous SiC matrix in high-density reactive plasmas,"
Acta Materialia, vol. 58, no. 2, pp. 560-569, 2010.
[33] M. K. Alam and R. C. Flagan, "Controlled Nucleation Aerosol Reactors: Production of
Bulk Silicon," Aerosol Science and Technology, vol. 5, no. 2, p. 237, 1986.
[34] A. A. Onischuk, V. P. Strunin, M. A. Ushakova and V. N. Panfilov, "Studying of silane
thermal decomposition mechanism," Int. J. Chem. Kinet., vol. 30, p. 99, 1998.
149
[35] W. R. Cannon, S. C. Danforth, J. H. Flint, J. S. Haggerty and R. A. Marra, "Sinterable
Ceramic Powders from Laser‐Driven Reactions: I, Process Description and Modeling," J.
Am. Ceram. Soc., vol. 65, no. 7, p. 324, 1982.
[36] M. Ehbrecht, H. Ferkel, F. Huisken, L. Holz, Y. N. Polivanov, V. V. Smirnov, O. M.
Stelmakh and R. Schmidt, "Deposition and analysis of silicon clusters generated by laser‐induced gas phase reaction," J. Appl. Phys., vol. 78, no. 9, p. 5302, 1995.
[37] X. Li, Y. He, S. S. Talukdar and M. T. Swihart, "Process for Preparing Macroscopic
Quantities of Brightly Photoluminescent Silicon Nanoparticles with Emission Spanning
the Visible Spectrum," Langmuir, vol. 19, no. 20, p. 8490, 2003.
[38] S. Maruyama, L. R. Anderson and R. E. Smalley, "Laser annealing of silicon clusters," J.
Chem. Phys., vol. 93, no. 7, p. 5349, 1990.
[39] A. A. Seraphin, S. T. Ngiam and K. Kolenbrander, "Surface control of luminescence in
silicon nanoparticles," J. Appl. Phys., vol. 80, p. 6429, 1996.
[40] R. A. Bley and S. M. Kauzlarich, "A Low-Temperature Solution Phase Route for the
Synthesis of Silicon Nanoclusters," J. Am. Chem. Soc., vol. 118, no. 49, pp. 12461-12462,
1996.
[41] D. Mayeri, B. L. Phillips, M. P. Augustine and S. M. Kauzlarich, "NMR Study of the
Synthesis of Alkyl-Terminated Silicon Nanoparticles from the Reaction of SiCl4 with the
Zintl Salt, NaSi," Chem. Mater., vol. 13, no. 3, pp. 765-770, 2001.
[42] J. D. Holmes, K. J. Ziegler, R. C. Doty, L. E. Pell, K. P. Johnston and B. A. Korgel,
"Highly Luminescent Silicon Nanocrystals with Discrete Optical Transitions," J. Am.
Chem. Soc., vol. 123, no. 16, pp. 3743-3748, 2001.
[43] E. J. Henderson, J. A. Kelly and J. G. C. Veinot, "Influence of HSiO1.5 Sol−Gel Polymer
Structure and Composition on the Size and Luminescent Properties of Silicon
Nanocrystals," Chem. Mater., vol. 21, no. 22, pp. 5426-5434, 2009.
[44] M. L. Mastronardi, F. Maier-Flaig, D. Faulkner, E. J. Henderson, C. Kubel, U. Lemmer
and G. A. Ozin, "Size-Dependent Absolute Quantum Yields for Size-Separated
Colloidally-Stable Silicon Nanocrystals," Nano Lett., vol. 12, no. 1, pp. 337-342, 2012.
[45] A. Bouchoule, A. Plain, L. Boufendi, J. Bloundeau and C. Laure, "Particle generation and
behavior in a silane‐argon low‐pressure discharge under continuous or pulsed radio‐frequency excitation," J. Appl. Phys., vol. 70, no. 4, pp. 1991-2000, 1991.
150
[46] A. Bouchoule and L. 2. 3. 2. (. Boufendi, "Particulate formation and dusty plasma
behaviour in argon-silane RF discharge," Plasma Sources Sci. Technol., vol. 2, no. 3, p.
204, 1993.
[47] L. Boufendi and A. Bouchoule, "Particle nucleation and growth in a low-pressure argon-
silane discharge," Plasma Sources Sci. Technol., vol. 3, no. 3, p. 262, 1994.
[48] A. Bouchoule, L. Boufendi, J. Hermann, A. Plain, T. Hbid, G. Kroesen, E. Stoffels and
W. W. Stoffels, "Formation of dense submicronic clouds in low p 5essure Ar-SiH4 RF
reactor: Diagnostics and growth processes from monomers to large size particulates,"
Pure Appl. Chem., vol. 68, p. 1121, 1996.
[49] A. A. Howling, J. L. Dorier and C. Hollenstein, "Negative ion mass spectra and
particulate formation in radio frequency silane plasma deposition experiments," Appl.
Phys. Lett., vol. 62, no. 12, p. 1341, 1993.
[50] A. A. Howling, L. Sansonnens, J. L. Dorier and C. Hollenstein, "Negative hydrogenated
silicon ion clusters as particle precursors in RF silane plasma deposition experiments," J.
Phys. D: Appl. Phys., vol. 26, no. 6, p. 1003, 1993.
[51] A. A. Howling, L. Sansonnens, J. L. Dorier and C. Hollenstein, "Time‐resolved
measurements of highly polymerized negative ions in radio frequency silane plasma
deposition experiments," J. Appl. Phys., vol. 75, no. 3, p. 1340, 1994.
[52] Y. Watanabe, M. Shiratani, T. Fukuzawa, H. Kawasaki, Y. Ueda, S. Singh and H.
Ohkura, "Contribution of short lifetime radicals to the growth of particles in SiH4 high
frequency discharges and the effects of particles on deposited films," J. Vac. Sci. Technol.
A, vol. 14, no. 3, p. 995, 1996.
[53] A. A. Fridman, L. Boufendi, T. Hbid, B. V. Potapkin and A. Bouchoule, "Dusty plasma
formation: Physics and critical phenomena. Theoretical approach," J. Appl. Phys, vol. 79,
no. 3, p. 1303, 1995.
[54] U. Kortshagen and U. Bhandarkar, "Modeling of particulate coagulation in low pressure
plasmas," Phys. Rev. E , vol. 60, no. 1, p. 887, 1999.
[55] U. R. Kortshagen, U. V. Bhandarkar, M. T. Swihart and S. L. Girshick, "Generation and
growth of nanoparticles in low-pressure plasmas," Pure Appl. Chem., vol. 71, no. 10, p.
1871, 1999.
[56] U. V. Bhandarkar, M. T. Swihart, S. L. Girshick and U. R. Kortshagen, "Modelling of
silicon hydride clustering in a low-pressure silane plasma," J. Phys. D: Appl. Phys., vol.
33, no. 21, p. 2731–2746, 2000.
151
[57] U. Bhandarkar, U. Kortshagen and S. L. Girshick, "Numerical study of the effect of gas
temperature on the time for onset of particle nucleation in argon–silane low-pressure
plasmas," J. Phys. D: Appl. Phys., vol. 36, no. 12, p. 1399–1408, 2003.
[58] P. R. i. Cabarrocas, P. Gay and A. Hadjadj, "Experimental evidence for nanoparticle
deposition in continuous argon–silane plasmas: Effects of silicon nanoparticles on film
properties," J. Vac. Sci. Technol. A, vol. 14, no. 2, p. 655, 1996.
[59] C. Longeaud, J. P. Kleider, P. R. i. Cabarrocas, S. Hamma, R. Meaudre and M. Meaudre,
"Properties of a new a-Si:H-like material: hydrogenated polymorphous silicon," J.Non-
Cryst. Solids, vol. 227, pp. 96-99, 1998.
[60] P. R. i. Cabarrocas, S. S. Hamma, S. N. Sharma, G. Viera, E. Bertran and J. Costa,
"Nanoparticle formation in low-pressure silane plasmas: bridging the gap between a-Si:H
and μc-Si films," J. Non-Cryst. Solids, vol. 227, p. 871, 1998.
[61] M. Otobe, T. Kanai, T. Ifuku, H. Yajima and S. Oda, "Nanocrystalline silicon formation
in a SiH4 plasma cell," J. Non–Cryst. Solids, vol. 198, p. 875, 1996.
[62] T. Ifuku, M. Otobe, A. Itoh and S. Oda, "Fabrication of Nanocrystalline Silicon with
Small Spread of Particle Size by Pulsed Gas Plasm," Jpn. J. Appl. Phys., vol. 36, no. 68,
p. 4031, 1997.
[63] S. Oda, "Preparation of nanocrystalline silicon quantum dot structure by a digital plasma
process," dv. Colloid Interface Sci., vol. 31, pp. 71-72, 1997.
[64] A. Bapat, C. R. Perrey, S. A. Campbell, C. B. Carter and U. Kortshagen, "Synthesis of
highly oriented, single-crystal silicon nanoparticles in a low-pressure, inductively coupled
plasma," J. Appl. Phys., vol. 94, p. 1969, 2003.
[65] A. Bapat, C. Anderson, C. R. Perrey, C. B. Carter, S. Campbell and U. Kortshagen,
"Plasma synthesis of single-crystal silicon nanoparticles for novel electronic device
applications," Controlled Fusion, vol. 46, p. B97, 2004.
[66] A. Bapat, M. Gatti, Y. Ding, S. A. Campbell and U. Kortshagen, "A plasma process for
the synthesis of cubic-shaped silicon nanocrystals for nanoelectronic devices," J. Phys. D:
Appl. Phys., vol. 48, no. 8, pp. 2247-2257, 2007.
[67] H. Takagi, H. Ogawa, Y. Yamazaki, A. Ishizaki and T. Nakagiri, "Quantum size effects
on photoluminescence in ultrafine Si particles," Appl. Phys. Lett., vol. 56, no. 24, p. 2379,
1990.
152
[68] L. Mangolini, D. R. E. Jurbergs and U. Kortshagen, "Plasma synthesis and liquid-phase
surface passivation of brightly luminescent Si nanocrystals," Journal of Luminescence,
vol. 121, no. 2, p. 327–334, 2006.
[69] L. Mangolini, D. Jurbergs, E. Rogojina and U. Kortshagen, "High efficiency
photoluminescence from silicon nanocrystals prepared by plasma synthesis and organic
surface passivation," phys. stat. sol. (c), vol. 3, no. 11, pp. 3975-3978, 2006.
[70] D. Jurbergs, E. Rogojina, L. Mangolini and U. Kortshagen, "Silicon nanocrystals with
ensemble quantum yields exceeding 60%," Appl. Phys. Lett., vol. 88, p. 233116 , 2006.
[71] R. J. Anthony, D. J. Rowe, M. Stein, J. Yang and U. Kortshagen, " Routes to Achieving
High Quantum Yield Luminescence from Gas-Phase-Produced Silicon Nanocrystals,"
Adv. Funct. Mater., vol. 21, no. 21, p. 4042–4046, 2011.
[72] X. D. Pi, R. Gresback, R. W. Liptak, S. A. Campbell and U. Kortshagen, "Doping
efficiency, dopant location, and oxidation of Si nanocrystals," Appl. Phys. Lett., vol. 92,
no. 12, p. 123102, 2008.
[73] R. Anthony and U. Kortshagen, "Photoluminescence quantum yields of amorphous and
crystalline silicon nanoparticles," PHYSICAL REVIEW B, vol. 80, no. 11, p. 115407,
2009.
[74] B. N. Jariwala, N. J. Kramer, M. C. Petcu, D. C. Bobela, M. C. M. van de Sanden, P.
Stratins, C. V. Cieobanu and S. Agarwal, "Surface Hydride Composition of Plasma-
Synthesized Si Nanoparticles," J. Phys. Chem. C, vol. 115, no. 42, p. 20375–20379, 2011.
[75] L. Mangolini and U. Kortshagen, "Selective nanoparticle heating: Another form of
nonequilibrium in dusty plasmas," PHYSICAL REVIEW E, vol. 79, no. 2, p. 026405,
2009.
[76] L. Mangolini and U. Kortshagen, "Plasma‐Assisted Synthesis of Silicon Nanocrystal
Inks," Advanced Materials, vol. 19, no. 18, pp. 2513-2519, 2007.
[77] R. Gresback, T. Nozaki and K. Okazaki, "Synthesis and oxidation of luminescent silicon
nanocrystals from silicon tetrachloride by very high frequency nonthermal plasma,"
Nanotechnology , vol. 22, no. 30, p. 305605, 2011.
[78] M. Sykora, L. Mangolini, R. D. Schaller, U. Kortshagen, D. Jurbergs and V. I. Klimov,
"Size-Dependent Intrinsic Radiative Decay Rates of Silicon Nanocrystals at Large
Confinement Energies," Phys. Rev. Lett., vol. 100, p. 067401, 2008.
[79] D. C. Hannah, J. Yang, P. Podsiadlo, M. K. Y. Chan, A. Demortière, D. J. Gosztola, V. B.
Prakapenka, G. C. Schatz, U. Kortshagen and R. D. Schaller, "On the Origin of
153
Photoluminescence in Silicon Nanocrystals: Pressure-Dependent Structural and Optical
Studies," Nano Lett., vol. 12, no. 8, p. 4200, 2012.
[80] M. C. Beard, K. P. Knutsen, P. Yu, J. M. Luther, Q. Song, W. K. Metzger, R. J. Ellingson
and A. J. Nozik, "Multiple Exciton Generation in Colloidal Silicon Nanocrystals," Nano
Lett., vol. 7, no. 8, p. 2506–2512, 2007.
[81] B. Giesen, H. Wiggers, A. Kowalik and P. Roth, "Formation of Si-nanoparticles in a
microwave reactor: Comparison between experiments and modelling," Journal of
Nanoparticle Research, vol. 7, no. 1, pp. 29-41, 2005.
[82] J. Knipping, H. Wiggers, B. Rellinghaus, P. Roth, D. Konjhodzic and C. J. Meier,
"Synthesis of High Purity Silicon Nanoparticles in a Low Pressure Microwave Reactor,"
Nanosci. Nanotechnol., vol. 4, p. 1039, 2004.
[83] R. M. Sankaran, D. Holunga, R. C. Flagan and K. P. Giapis, "Synthesis of Blue
Luminescent Si Nanoparticles Using Atmospheric-Pressure Microdischarges," Nano Lett.,
vol. 5, p. 537, 2005.
[84] T. Lopez and L. Mangolini, "In situ monitoring of hydrogen desorption from silicon
nanoparticles dispersed in a nonthermal plasma," J. Vac. Sci. Technol. B, vol. 34, no. 4,
pp. 041206-1 - 041206-6, 2016.
[85] A. M. Ahadi, K. I. Hunter, N. J. Kramer, T. Strunskus, H. Kersten, F. Faupel and U. R.
Kortshagen, "Controlled synthesis of germanium nanoparticles by nonthermal plasmas,"
Applied Physics Letters, vol. 108, no. 9, p. 093105, 2016.
[86] R. Gresback, Z. Holman and U. Kortshagen, "Nonthermal plasma synthesis of size-
controlled, monodisperse, freestanding germanium nanocrystals," Appl. Phys. Lett., vol.
91, no. 9, p. 093119, 2007.
[87] A. A. Barragan, N. V. Ilawe, L. Zhong, B. M. Wong and L. A. Mangolini, "Non-Thermal
Plasma Route to Plasmonic TiN Nanoparticles," J. Phys. Chem. C, vol. 121, no. 4, p.
2316–2322, 2017.
[88] A. Woodard, L. Xu, A. A. Barragan, G. Nava, B. W. Wong and L. Lorenzo Mangolini,
"On the non-thermal plasma synthesis of nickel nanoparticles," Plasma Process Polym.,
vol. 15, no. 1, p. e1700104, 2018.
[89] K. I. Hunter, J. T. Held, K. A. Mkhoyan and U. R. Kortshagen, "Nonthermal Plasma
Synthesis of Core/Shell Quantum Dots: Strained Ge/Si Nanocrystals," ACS Appl. Mater.
Interfaces, vol. 9, no. 9, p. 8263–8270, 2017.
154
[90] O. Yasar-Inceoglu and L. Mangolini, "Characterization of Si–Ge alloy nanocrystals
produced in a non-thermal plasma reactor," Materials Letters, vol. 101, no. 15, pp. 76-79,
2013.
[91] O. Yasar-Inceoglu, L. Zhong and M. L., "Core/shell silicon/polyaniline particles via in-
flight plasma-induced polymerization," J. Phys. D: Appl. Phys., vol. 48, no. 31, p.
314009, 2015.
[92] D. Coleman, T. Lopez, O. Yasar-Inceoglu and L. Mangolini, "Hollow silicon carbide
nanoparticles from a non-thermal plasma process," J. Appl. Phys., vol. 117, no. 19, p.
193301, 2015.
[93] S. Exarhos, A. A. Barragan, E. Aytan, A. A. Balandin and L. Mangolini, "Plasmonic
Core-shell Zirconium Nitride – Silicon Oxynitride Nanoparticles," ACS Energy Lett., vol.
3, p. 2349−2356, 2018.
[94] U. R. Kortshagen, R. M. Sankaran, R. N. Pereira, S. L. Girshick, J. J. Wu and E. S. Aydil,
"Nonthermal Plasma Synthesis of Nanocrystals: Fundamental Principles, Materials, and
Applications," Chem. Rev., vol. 116, p. 11061−11127, 2016.
[95] U. R. Kortshagen, "Nonthermal Plasma Synthesis of Nanocrystals: Fundamentals,
Applications, and Future Research Needs," Plasma Chem Plasma Process, vol. 36, no. 1,
p. 73–84, 2016, .
[96] L. Mangolini, "Synthesis, properties, and applications of silicon nanocrystals," J. Vac. Sci.
Technol. B, vol. 31, no. 2, p. 0801, 2013.
[97] L. Mangolini and U. Kortshagen, Silicon Nanocrystals: Fundamentals, Synthesis and
Applications, L. Pavesi and R. Turan, Eds., Germany: Wiliey-VCH, 2010.
[98] Y. Watanabe, "Formation and behaviour of nano/micro-particles in low pressure
plasmas," Journal of Physics D: Applied Physics, vol. 39, no. 19, p. R329, 2006.
[99] L. Mangolini, "Monitoring non-thermal plasma processes for nanoparticle synthesis," J.
Phys. D: Appl. Phys., vol. 50, no. 37, pp. 373003-373016, 2017.
[100] O. Yasar-Inceoglu, T. Lopez, E. Farshihagro and L. Mangolini, "Silicon nanocrystal
production through non-thermal plasma synthesis: a comparative study between silicon
tetrachloride and silane precursors," Nanotechnology , vol. 23, no. 25, p. 255604, 2012.
[101] S. Guruvenket, J. M. Hoey, K. J. Anderson, M. T. Frohlich, R. A. Sailer and P. Boudjouk,
"Aerosol assisted atmospheric pressure chemical vapor deposition of silicon thin films
using liquid cyclic hydrosilanes," Thin Solid Films, vol. 589, p. 465–471, 2015.
155
[102] M. Mamunuru, R. Le Picard, Y. Sakiyama and S. L. Girshick, "The Existence of Non-
negatively Charged Dust Particles in Nonthermal Plasmas," Plasma Chem Plasma
Process, vol. 37, p. 701–715, 2017.
[103] R. Le Picard, "Mechanisms for Nanoparticle Synthesis and Charging in Nonthermal
Plasma," Minneapolis, 2016.
[104] R. Le Picard and S. L. Girshick, "The effect of single-particle charge limits on charge
distributions in dusty plasmas," J. Phys. D: Appl. Phys., vol. 49, p. 095201, 2016.
[105] P. Agarwal and S. L. Girshick, "Sectional modeling of nanoparticle size and charge
distributions in dusty plasmas," Plasma Sources Sci. Technol., vol. 21, no. 5, p. 055023,
2012.
[106] J. E. Daugherty, R. K. Porteous, M. D. Kilgore and D. B. Graves, "Sheath structure
around particles in low-pressure discharges," J. Appl. Phys., vol. 72, no. 9, pp. 3934-3942,
1992.
[107] V. E. Fortov and O. F. Petrov, "Crystal and Liquid Structures in Strongly Nonideal Dusty
Plasmas under Laboratory and Microgravity Conditions," High Temperature, vol. 48, no.
6, pp. 943-956, 2010.
[108] R. L. Merlino, " 25 Years of Dust Acoustic Waves," J. Plasma Physics, vol. 80, no. 06,
pp. 773-786, 2014.
[109] M. Gatti and U. R. Kortshagen, "Analytical model of particle charging in plasmas over a
wide range of collisionality," Physical Review E, vol. 78, no. 4, p. 046402, 2008.
[110] M. Lampe, V. Gavrishchaka, G. Ganguli and J. G., "Effect of trapped ions on shielding of
a charged spherical object in a plasma," Physical Review Letters, vol. 86, no. 23, p. 5278,
2001.
[111] A. V. Zobnin, A. P. Nefedov, V. A. SinelShchikov and V. E. Fortov, "On the charge of
dust particles in a low-pressure gas discharge plasma," Journal of Experimental and
Theoretical Physics, vol. 91, no. 3, pp. 483-487, 2000.
[112] T. Hawa and M. R. Zachariah, "Molecular dynamics study of particle–particle collisions
between hydrogen-passivated silicon nanoparticles," PHYSICAL REVIEW B, vol. 69, no.
3, p. 035417, 2004.
[113] D. B. Graves, J. E. Daugherty, M. D. Kilgore and R. K. Porteous, "Charging, transport
and heating of particles in radiofrequency and electron cyclotron resonance plasmas,"
Plasma Sources Science and Technology, vol. 3, no. 3, p. 433, 1994.
156
[114] J. E. Daugherty and D. B. Graves, "Particulate temperature in radio frequency glow
discharges," Journal of Vacuum Science & Technology A 11, vol. 11, no. 4, p. 1126, 1993.
[115] F. Galli and U. R. Kortshagen, "Charging, Coagulation, and Heating Model of
Nanoparticles in a Low-Pressure Plasma Accounting for Ion–Neutral Collisions," IEEE
Transactions on Plasma Science, vol. 38, no. 4, pp. 803-809, 2010.
[116] D. D. Koleske, S. M. Gates and B. Jackson, "Atomic H abstraction of surface H on Si: An
Eley–Rideal mechanism," J. Chem. Phys., vol. 101, no. 4, p. 3301, 1994.
[117] M. S. Valipa and D. Maroudas, "Atomistic Analysis of the Mechanism of Hydrogen
Diffusion in Plasma Deposited Amorphous Silicon Thin Films," Appl. Phys. Lett., vol. 87,
p. 261911, 2005.
[118] M. Hirasawaa, T. Orii and T. Seto, "Size-dependent crystallization of Si nanoparticles,"
Appl. Phys. Lett., vol. 88, no. 9, p. 093119, 2006.
[119] A. L. Patterson, "The Scherrer Formula for X-Ray Particle Size Determination," Phys.
Rev., vol. 56, p. 978, 1939.
[120] I. Doğan and M. C. M. van de Sanden, "Direct characterization of nanocrystal size
distribution using Raman spectroscopy," Journal of Applied Physics, vol. 114, no. 13, p.
134310, 2013.
[121] I. Dogan and M. C. M. van de Sanden, "Characterization of Nanocrystal Size Distribution
using Raman Spectroscopy with a Multi-particle Phonon Confinement Model," J. Vis.
Exp., vol. 102, p. 53026, 2015.
[122] E. Ngai and V. Fthenakis, "Silane Safety/Lessons Learned and Accident Prevention," in
IEEE Photovoltaic Conference, San Diego, California, 2008.
[123] E. Hengge and D. K. Zeitschrift, "Darstellung und Charakterisierung von Cyclohexasilan
Si6H12," für anorganische Chemie, vol. 459, no. 1, pp. 123-130, 1979.
[124] C. L. Yaws, Handbook of Vapor Pressures: Inorganic Compounds and Elements, 1st ed.,
vol. 4, Houston, Texas : Gulf Professional Publishing , 1995.
[125] L. Mangolini, "Non-Thermal Plasma Synthesis and Passivation of Luminescent Silicon
Nanocrystals," Minneapolis, MN, 2007.
[126] O. Yasar-Inceoglu, "Synthesis and Surface Modification of Group IV Nanoparticles
Using Non-Thermal Plasmas," Riverside, CA, 2015.
[127] F. Di Fonzo, A. Gidwani, F. M. H., D. Neumann, D. I. Iordanoglou, J. V. R. Heberlein,
M. P. H., S. L. Girshick, N. Tymiak, W. W. Gerberich and N. P. Rao, "Focused
157
nanoparticle-beam deposition of patterned microstructures," Appl. Phys. Lett., Vol. , vol.
6, no. 7, pp. 910-912, 2000.
[128] F. Galli, "Charge and Energy Interactions between Nanoparticles and Low Pressure
Plasmas Dissertation," Minneapolis, MN, 2010.
[129] L. H. J. L. Jackson and 2. 349., "Plasma Striations in Vacuum Chambers," Annandale-on-
Hudson, NY, 2017.
[130] V. I. Kolobov, "Striations in rare gas plasmas," J. Phys. D: Appl. Phys. , vol. 39, no. 24, p.
R487–R506 , 2006.
[131] Y. Liu, I. Korolov, E. Schungel, Y. Wang, Z. Donko and J. Schulze, "Striations in
electronegative capacitively coupled radio-frequency plasmas: Effects of the pressure,
voltage, and electrode gap," Physics of Plasmas, vol. 24, no. 7, 2017.
[132] H. C. J. Mulders, W. J. M. Brok and W. W. Soffels, "Striations in a Low-Pressure RF-
Driven Argon Plasma," IEEE Transactions on Plasma Science, vol. 36, no. 4, pp. 1380-
1381, 2008.
[133] Y. B. Golubovskii, V. I. Kolobov and V. O. Nekuchaev, "On electron bunching and
stratification of glow discharges," PHYSICS OF PLASMAS, vol. 20, no. 10, p. 101602,
2013.
[134] W. Sun, "Synthesis and Surface Reactions of Hydride Terminated Silicon Nanocrystals
with Strong Quantum Size Effect," Toronto Ontario, 2016.
[135] L. -W. Wang and A. Zunger, "Electronic Structure Pseudopotential Calculations of Large
( - 1000 Atoms) Si Quantum Dots," J. Phys. Chem. , vol. 98, pp. 2158-2165, 1994.
[136] J. M. Buriak, "Organometallic Chemistry on Silicon and Germanium Surfaces," Chemical
Reviews, vol. 102, no. 5, pp. 1272-1308, 2002.
[137] M. P. Stewart and J. M. Buriak, "Exciton-Mediated Hydrosilylation on Photoluminescent
Nanocrystalline Silicon," J. Am. Chem. Soc., vol. 123, no. 32, pp. 7821-7830, 2001.
[138] L. A. Huck and J. M. Buriak, "Toward a Mechanistic Understanding of Exciton-Mediated
Hydrosilylation on Nanocrystalline Silicon," J. Am. Chem. Soc., vol. 134, pp. 489-497,
2012.
[139] E. E. Thomas, R. L. Merlino and M. Rosenberg, "Design Criteria for the Magnetized
Dusty Plasma experiment," IEEE Trans. Plasma Sci., vol. 41, p. 811, 2013.
158
[140] E. Thomas, U. Konopka, R. L. Merlino and M. Rosenberg, "Initial measurements of two-
and three-dimensional ordering, waves, and plasma filamentation in the Magnetized
Dusty Plasma Experiment," Physics of Plasmas, vol. 23, no. 5, p. 055701, 2016.
[141] H. Fujiyama, H. Kawasaki, S. -C. Yang and Y. Matsuda, "Dynamics of Silicon Particles
in DC Silane Plasmas Transported by a Modulated Magnetic Field," Japanese journal of
applied physics, vol. 33, no. 7S, p. 4216, 1994.
[142] S. -C. Yang, Y. Nakajima, Y. Maemura, Y. Matsuda and H. Fujiyama, "Mechanism of
particle transport in magnetized silane plasmas," Plasma Sources Science and Technology
, vol. 5, no. 2, p. 333, 1996.
[143] Y. Maemura, S. -C. Yang and H. Fujiyama, "Transport of negatively charged particles by
E× B drift in silane plasmas," Surface and Coatings Technology, vol. 98, no. 1, pp. 1351-
1358, 1998.