Synthesis and Evaluation of Luminescent Tracers and Hapten ...
Upload
khangminh22Category
view
1download
0
HAL Id: hal-01218122https://hal.archives-ouvertes.fr/hal-01218122
Submitted on 28 Oct 2015
HAL is a multi-disciplinary open accessarchive for the deposit and dissemination of sci-entific research documents, whether they are pub-lished or not. The documents may come fromteaching and research institutions in France orabroad, or from public or private research centers.
L’archive ouverte pluridisciplinaire HAL, estdestinée au dépôt et à la diffusion de documentsscientifiques de niveau recherche, publiés ou non,émanant des établissements d’enseignement et derecherche français ou étrangers, des laboratoirespublics ou privés.
Luminescent properties of novel red-emitting phosphor:Gd2O2CN2:Eu3+
Luting Wang, Shuanglong Yuan, Yunxia Yang, François Cheviré, FranckTessier, Guorong Chen
To cite this version:Luting Wang, Shuanglong Yuan, Yunxia Yang, François Cheviré, Franck Tessier, et al.. Luminescentproperties of novel red-emitting phosphor: Gd2O2CN2:Eu3+. Optical Materials Express, OSA pub,2015, 5 (11), pp.2626-2624. �10.1364/OME.5.002616�. �hal-01218122�

Luminescent properties of novel red-emitting phosphor:
Gd2O2CN2:Eu3+
Luting Wang1,Shuanglong Yuan
1,3,Yunxia Yang1,Francois Chevire
2,4,Franck
Tessier2, Guorong Chen
1
1. Key Laboratory for Ultrafine Materials of Ministry of Education, School of Materials Science and
Engineering, East China University of Science and Technology, Shanghai 200237, China 2Institut des Sciences Chimiques de Rennes (UMR CNRS 6226), équipe Verres et Céramiques,
Université de Rennes 1, F-35042 Rennes cedex, France [email protected]
Abstract: Eu3+
-doped Gd2O2CN2 was firstly synthesized by a classical solid-state
reaction of Li2CO3, Eu2O3 and GdF3 under NH3 gas flow in the presence of graphite at
low firing temperature. Powder X-ray diffraction (XRD) analysis indicated that
Gd2O2CN2: Eu3+
crystallizes in a trigonal-type structure with space group P-3m1.
Gd2O2CN2: Eu3+
shows a sharp red emission band peaking at 626 nm under excitation
at 300 nm at room temperature. PL spectra indicates that Eu3+
doped Gd2O2CN2
samples emit the typical emission peaks at 614 nm and 626 nm originated from the
hypersensitive electric dipole transition (5D0→
7F2) of Eu
3+ ions. The optimized doping
concentration of Eu3+
ions was found to be 7.5 at.%, and the critical transfer distance
was calculated to be 10.907 Å.
1. Introduction:
Recently, much attention has been paid on investigating red emitting phosphors
owing to their potential applications in X-ray mammography [1]
, in display devices [2-3]
and especially in white light emitting diodes (WLEDs) [4-6]
. Eu3+
- doped luminescent
materials as the main and outstanding red-emitting phosphors, such as Eu3+
doped
Y2O3 [3]
, Y2O2S [7]
, R2(MoO4)3 (R=La, Y, Gd)[8]
and NaEu(WO4)2[5]
, have been studied
for decades due to the transition of 5D0-
7FJ (J = 1-6) of Eu
3+ . However, these excellent
red emitting phosphors can hardly fulfill the demands for novel high-performance

materials. Therefore, the exploration of novel luminescent host materials remains a
meaningful work.
The crystal structures of rare earth oxysulfides RE2O2S and oxycyanamides
RE2O2CN2 are closely related [9]
and consist of RE2O22+
layers and their interleaving
anions. Eu3+
doped RE2O2S has been widely used as phosphor for CRT [10]
. The
luminescence properties of Y2O2CN2: Eu3+
are quite similar to those of the
commercially used red emitter Y2O2S: Eu3+
[9]
. Therefore, oxycyanamide compounds
are considered to be efficient host candidates for good luminescence performance.
Rare earth dioxymonocyanamides (RE2O2CN2, RE=La, Ce, Pr, Nd, Sm, Eu, Gd)[11]
were prepared by nitriding a mixture of rare earth oxide in flowing ammonia at
950 °C. The luminescent properties of RE2O2CN2:M3+
(Ln = Y, Gd and La, M3+
=
Tb3+
, Eu3+
, Pr3+
, Er3+
and Er3+
/Tb3+
) have been previously studied[11-14]
. Eu3+
doped
Gd2O2CN2 was firstly prepared by sol-gel method by Takeda et al., but the
luminescence intensity was weak because of its low crystallinity and the suppression
of concentration quenching was not recognized because of the presence of impurities
for high Eu-doping concentration [15]
. Thus, we propose here to further investigate the
preparation and photoluminescence properties of pure micrometric Gd2O2CN2:Eu3+
phosphors.
In this paper, a series of Eu3+
doped Gd2O2CN2 samples with 1-3 m particle size
were successfully prepared for the first time by a classic solid state route using GdF3,
Li2CO3 and Eu2O3 as raw material. The phase structures of the samples were
determined by powder X-ray diffraction (XRD). Luminescence properties and the
concentration quenching characteristics were also investigated in detail.
2. Experimental:
Powder samples with the general formula (Gd1-xEux)2O2CN2 [x=0.005(GOCN-1),
0.02(GOCN-2), 0.035(GOCN-3), 0.05(GOCN-4), 0.075(GOCN-5) and 0.10
(GOCN-6)] were prepared starting from high purity GdF3 (99.99%), Eu2O3 (99.99%),
Li2CO3 (99.99%), and active carbon (CARBIO 12 SA—ref: C1220 G 90) as raw
materials. All starting materials were weighted in the proper stoichiometries, and
finely mixed in an agate mortar. The mixture was placed at the end of a graphite boat,

while active carbon was put in the upcoming flowing gas at the other end. After that,
the mixture was fired at 600 °C for 9 h, then 750 °C for 12 h and finally cooled down
to room temperature under NH3 atmosphere in a tubular furnace. The sintered samples
were further washed with distilled water to remove LiF by-products (determined by
XRD) from the reaction product and dried at 120 °C in air. Finally, the as-prepared
fine powders were collected for characterization.
2(1-x)GdF3 + xEu2O3 + 3(1-x)Li2CO3 +C + 2NH3 →
(Gd1-xEux)2O2CN2 + 6(1-x)LiF + 3(1-x)CO2 + H2O + 2H2
Powder X-ray diffraction (XRD) data were recorded using a Bruker AXS D8
Advance diffractometer (Voltage 50 kV, current 40 mA, Cu-Ka) with a step width of
0.02. Photoluminescence (PL) and photoluminescence excitation (PLE) spectra were
measured by a Fluorolog-3-P UV-vis-NIR fluorescence spectrophotometer (Jobin
Yvon, longjumeau, France) with a 450 W Xenon lamp as the excitation source. The
surface morphology and particles size of the phosphor samples were examined by a
field emission scanning electron microscope (FE-SEM, S-4800, Hitachi
High-Technologies) with high voltage of 15 kV. The BET-specific surface area was
measured by ASAP 2460 surface area and porosity analyzer made by Micromeritics
Instrument Corporation. The FTIR spectrum was measured in transmission mode
using a KBr standard (Bruker, Model vector 22). The color chromaticity coordinates
were obtained according to Commission Internationale de I’Eclairage (CIE) using
Radiant Imaging color calculator software. All spectroscopic measurements were
carried out at room temperature.
3. Results and Discussion
Eu2O2CN2 and Gd2O2CN2 have the same crystal structure based on a trigonal unit
cell with the space group P-3m1 and the linear CN22-
ions lay perpendicular to
RE2O22+
(RE=Eu and Gd) layers [11]
. The Eu3+
and Gd3+
ions are both coordinated with
four oxygen and three nitrogen atoms in a seven-fold coordination with the oxygen
and the metal in the same plane. Thus, Eu3+
ions can partially substitute for Gd3+
ions
to form a (Gd1-xEux)2O2CN2 (x=0.005-0.10) solid solution as illustrated by XRD
patterns presented in Fig. 1. The characteristic diffraction peaks of all samples can be

ascribed to the trigonal structure of Gd2O2CN2 (PDF#49-1169) with the space group
P-3m1. No other impurity phase can be detected at the current doping concentrations.
With the increase of Eu3+
-doping concentration, the diffraction peaks of the samples
slightly shift to lower diffraction angles compared with those of Gd2O2CN2
(PDF#49-1169), as shown in the second part of Fig. 1. The shift of diffraction angles
can be attributed to the replacement of the smaller Gd3+
(r = 0.100 nm) by relatively
larger Eu3+
(r = 0.101 nm), indicating a compacter lattice configuration. Meanwhile,
the Eu3+
doping limit has been increased to 10 at. % compared to 4 at. % previously
reported in sol-gel synthesis [15]
.
Fig.1. XRD patterns of (Gd1-xEux)2O2CN2 (x=0.005, 0.02, 0.035, 0.050, 0.075, 0.100) with PDF
standard card of Gd2O2CN2.
Figure 2 shows the IR spectra of Gd2O2CN2:Eu3+
samples with different
concentration of Eu3+
. All IR spectra samples show two typical absorption peaks in
the vicinity of 652 and 2100 cm-1
. These absorption peaks ca. 652 and 2100 cm-1
were
assigned to the ν2 (bending vibration) and ν3 (asymmetric stretching vibration) modes
of the CN22-
ion which were comparable to the IR spectrum of RE2O2CN2 [16, 17]
(RE=
Ce, Pr, Nd, Sm, Eu, Gd), indicating the presence of CN22-
ions in the Gd2O2CN2:Eu3+
samples. The other peaks around 400-500cm-1
have not been assigned as yet.
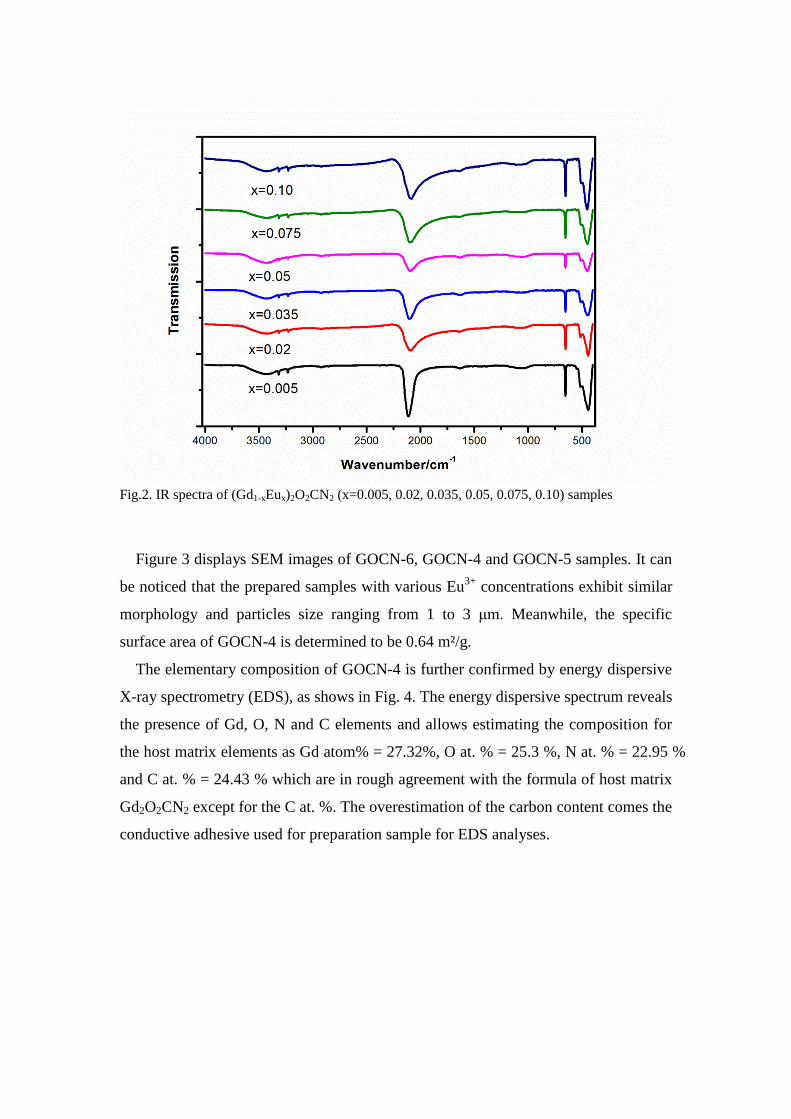
Fig.2. IR spectra of (Gd1-xEux)2O2CN2 (x=0.005, 0.02, 0.035, 0.05, 0.075, 0.10) samples
Figure 3 displays SEM images of GOCN-6, GOCN-4 and GOCN-5 samples. It can
be noticed that the prepared samples with various Eu3+
concentrations exhibit similar
morphology and particles size ranging from 1 to 3 μm. Meanwhile, the specific
surface area of GOCN-4 is determined to be 0.64 m²/g.
The elementary composition of GOCN-4 is further confirmed by energy dispersive
X-ray spectrometry (EDS), as shows in Fig. 4. The energy dispersive spectrum reveals
the presence of Gd, O, N and C elements and allows estimating the composition for
the host matrix elements as Gd atom% = 27.32%, O at. % = 25.3 %, N at. % = 22.95 %
and C at. % = 24.43 % which are in rough agreement with the formula of host matrix
Gd2O2CN2 except for the C at. %. The overestimation of the carbon content comes the
conductive adhesive used for preparation sample for EDS analyses.
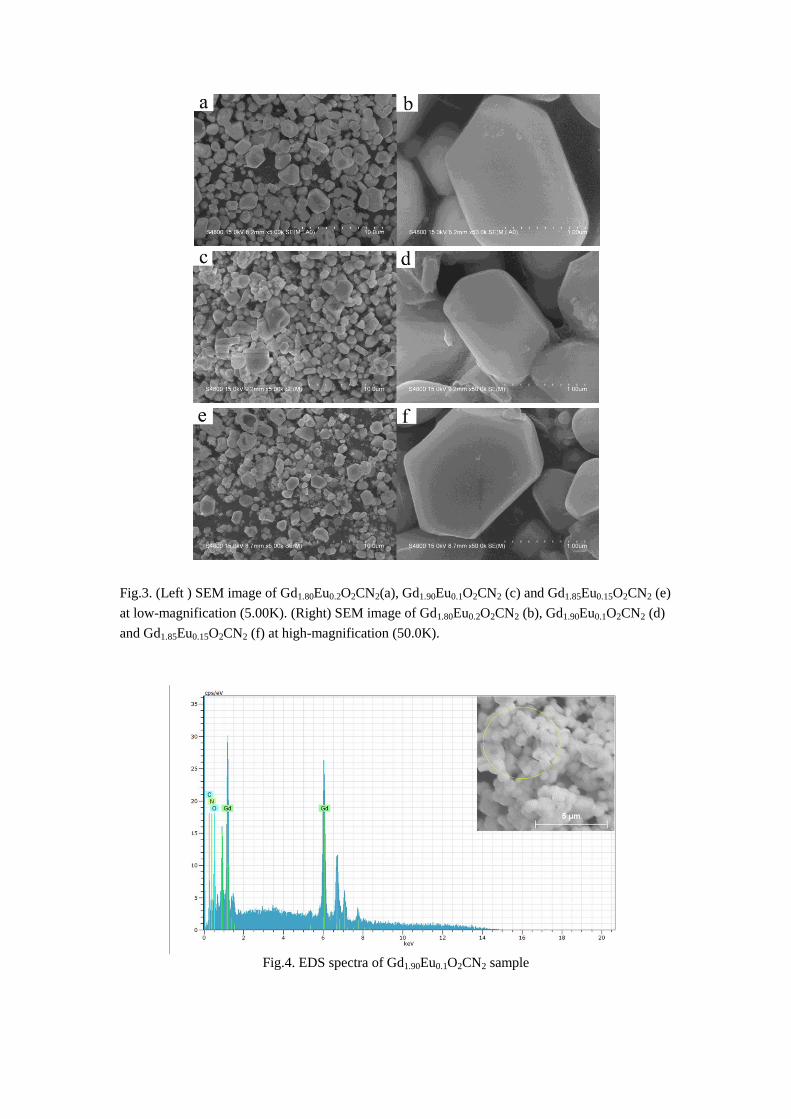
Fig.3. (Left ) SEM image of Gd1.80Eu0.2O2CN2(a), Gd1.90Eu0.1O2CN2 (c) and Gd1.85Eu0.15O2CN2 (e)
at low-magnification (5.00K). (Right) SEM image of Gd1.80Eu0.2O2CN2 (b), Gd1.90Eu0.1O2CN2 (d)
and Gd1.85Eu0.15O2CN2 (f) at high-magnification (50.0K).
Fig.4. EDS spectra of Gd1.90Eu0.1O2CN2 sample
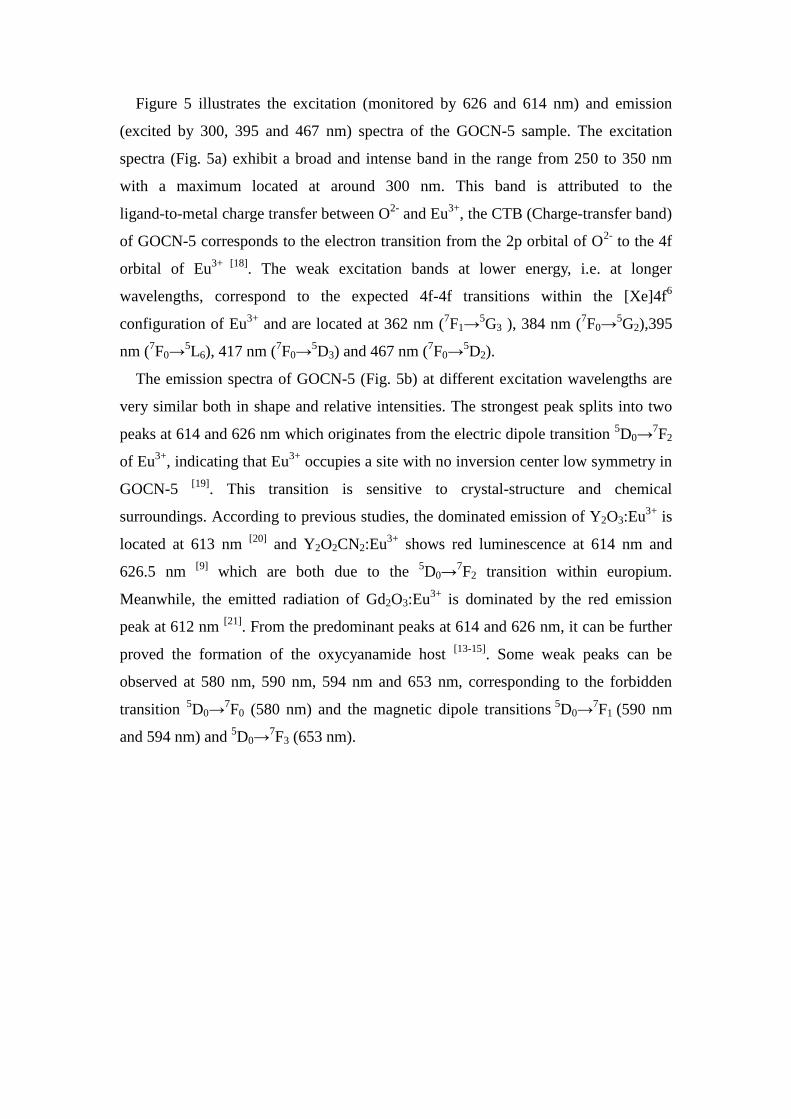
Figure 5 illustrates the excitation (monitored by 626 and 614 nm) and emission
(excited by 300, 395 and 467 nm) spectra of the GOCN-5 sample. The excitation
spectra (Fig. 5a) exhibit a broad and intense band in the range from 250 to 350 nm
with a maximum located at around 300 nm. This band is attributed to the
ligand-to-metal charge transfer between O2-
and Eu3+
, the CTB (Charge-transfer band)
of GOCN-5 corresponds to the electron transition from the 2p orbital of O2-
to the 4f
orbital of Eu3+ [18]
. The weak excitation bands at lower energy, i.e. at longer
wavelengths, correspond to the expected 4f-4f transitions within the [Xe]4f6
configuration of Eu3+
and are located at 362 nm (7F1→
5G3 ), 384 nm (
7F0→
5G2),395
nm (7F0→
5L6), 417 nm (
7F0→
5D3) and 467 nm (
7F0→
5D2).
The emission spectra of GOCN-5 (Fig. 5b) at different excitation wavelengths are
very similar both in shape and relative intensities. The strongest peak splits into two
peaks at 614 and 626 nm which originates from the electric dipole transition 5D0→
7F2
of Eu3+
, indicating that Eu3+
occupies a site with no inversion center low symmetry in
GOCN-5 [19]
. This transition is sensitive to crystal-structure and chemical
surroundings. According to previous studies, the dominated emission of Y2O3:Eu3+
is
located at 613 nm [20]
and Y2O2CN2:Eu3+
shows red luminescence at 614 nm and
626.5 nm [9]
which are both due to the 5D0→
7F2 transition within europium.
Meanwhile, the emitted radiation of Gd2O3:Eu3+
is dominated by the red emission
peak at 612 nm [21]
. From the predominant peaks at 614 and 626 nm, it can be further
proved the formation of the oxycyanamide host [13-15]
. Some weak peaks can be
observed at 580 nm, 590 nm, 594 nm and 653 nm, corresponding to the forbidden
transition 5D0→
7F0 (580 nm) and the magnetic dipole transitions
5D0→
7F1 (590 nm
and 594 nm) and 5D0→
7F3 (653 nm).

Fig.5. Excitation (a) and Emission (b) spectra of the Gd1.85Eu0.15O2CN2 sample. The right inset is
the photograph image of the Eu3+
-doped sample being excited by the 300 nm lights.
Fig. 6 shows the PL and PLE spectra of Gd2O2CN2: Eu3+
samples with various
concentrations of Eu3+
ions. While the spectral shape and locations of excitation and
emission peaks do not vary with the doping concentration of Eu3+
ions, the
photoluminescence intensity strongly depends on it. With the increase of doped Eu3+
ions concentration, the excitation and the emission intensity increases gradually
ranging from 0.5 to 7.5 at. % and decreases from 7.5 to 10 at. %. Thus the optimized
Eu3+
ions doping concentration in Gd2O2CN2 host matrix is about 7.5 at. %.
Considering the mechanism of energy transfer in phosphors, the concentration
quenching can be explained in more detail by the critical distance (Rc) between Eu3+
ions which can be calculated by the following formula [22]
:
Rc=2×(3V/4π Xc N)1/3
(2)
Where V is the volume of the unit cell, Xc is the critical concentration of Eu3+
ions
and N is the number of lattice sites in the unit cells that can be occupied by Eu3+
ions.
For the Gd2O2CN2 host, V=101.9 Å3, Xc =0.075 and N=2. Therefore, the average
distances Rc between Eu3+
ions is calculated to be Rc=10.907 Å when the optimized
doping molar concentration is 7.5 at. %.
It is interesting to note that the optimized Eu3+
concentration in Gd2O2CN2 host

matrix (7.5 at. %) is higher than that in Gd2O2S and Gd2O3 host matrix that is around
5 at% [23]
. The suppression of concentration quenching is attributed to the
two-dimensional character of the Gd2O2CN2 structure. The trigonal structure of
Gd2O2CN2 consists of Gd2O22+
and CN22-
layers. The Gd2O22+
layers are
perpendicular to the c axis and the linear CN22-
ions are parallel to the c axis [11]
. This
kind of structure leads to a long interlayer distance between the Gd2O22+
slabs (≈0.57
nm) which contributes to the higher doping concentration of Eu3+[15]
.

Fig.6. Excitation (a) and emission (b) spectra of (Gd1-xEux)2O2CN2 (x=0.005, 0.02, 0.035, 0.05,
0.075, 0.100) samples. The inset is the dependence of its PL intensity on the Eu3+
content in the
Gd2O2CN2 matrix.
The color chromaticity coordinates have been calculated for the optimized sample
Gd1.85Eu0.15O2CN2 under a 467 nm excitation (Fig. 7). The calculated values (0.6475,
0.3488) are very close to the CIE color coordinates of the red region, indicating
Gd1.85Eu0.15O2CN2 phosphor is a promising red emitting phosphor for WLEDs
application.

Fig.7. The 1931 CIE chromaticity coordinate for Gd1.85Eu0.15O2CN2under 467nm excitation.
4. Conclusion
In this paper, pure phase (Gd1-xEux)2O2CN2(x=0.005, 0.02, 0.035, 0.050, 0.075,
0.100) phosphors with space group P-3m1 have been prepared using GdF3, Li2CO3
and Eu2O3 as raw materials at low firing temperature (750 °C), for the first time. The
Eu3+
doped Gd2O2CN2 phosphors exhibit a characteristic red emission. The strongest
and second strongest peaks are located at 626 and 614 nm (5D0→
7F2 transition) under
excitation of 300, 395 and 467 nm. The strongest luminescent intensity of
Gd2O2CN2:Eu3+
is obtained when the doping concentration of Eu3+
reaches 7.5 at. %.
The optimized Eu3+
doping concentration in Gd2O2CN2 is higher than that in Gd2O3
and Gd2O2S host lattices, which is due to the 2D structure of the Gd2O2CN2 host
matrix. The CIE chromaticity coordinates (0.6475, 0.3488) for Gd1.85Eu0.15O2CN2
phosphor are located in the red region. All the results indicate that Gd2O2CN2:Eu3+
is a
promising red phosphor for white LEDs.
References
[1] C.M. Michail, G.P. Fountos, I.G. Valais, N.I. Kalyvas, P.F. Liaparinos, I.S. Kandarakis,
and G.S. Panayiotakis, “Evaluation of the red emitting Gd2O2CN2:Eu powder scintillator for
use in indirect X-Ray digital mammography detectors”, IEEE Transactions on Nuclear
Science , 2011, 58, 2503-2511.
[2] T.W. Chou, S. Mylswamy, R.S. Liu, S.Z. Chuang,“Eu substitution and particle size control
of Y2O2S for the excitation by UV light emitting diodes”, Solid State Communications, 2005,
136, 205–209.

[3] V. Sivakumar, A. Lakshmanan, R.S. Kumar, S. Kalpana, R.S. Rani, and M.T. Jose,
“Preparation and characterisation of yttrium based luminescence phosphors”, Indian Journal
of Pure &Applied Physics, 2012, 50, 123-128.
[4] Z.W. Zhang, L. Liu, S.T. Song, J.P. Zhang, D.J. Wang, “A novel red-emitting phosphors
Ca9Bi(PO4)7:Eu3+
for near ultraviolet white light-emitting diodes”, Current Applied Physics,
2015, 15, 248-252.
[5] Q.Y. Shao, H.J. Li, K.W. Wu, Y. Dong, J.Q. Jiang, “Photo luminescence studies of
red-emitting NaEu(WO4)2 as a near-UV or blue convertible phosphor”, Journal of
Luminescence, 2009, 129, 879-883.
[6] V.P. Hedaoo, V.B. Bhatkar, S.K. Omanwar, “PbCaB2O5 doped with Eu3+
: A novel red
emitting phosphor”, Optical Materials, 2015, 45, 91-96.
[7] S. Neeraj, N. Kijima, A.K. Cheetham, Solid State Commun,2004,131, 65.
[8] C.F. Guo, T. Chen, L. Luan, W. Zhang, D.X. Huang, “Luminescent properties of
R2(MoO4)3:Eu3+
(R=La, Y, Gd) phosphors prepared by sol-gel process”, Journal of Physics and
Chemistry of Solid, 2008, 69, 1905-1911.
[9] J. Sindlinger, J. Glaser, H. Bettentrup, T. Jüstel, and H.-J. Meyer, “Synthesis of Y2O2(CN2)
and luminescence properties of Y2O2(CN2):Eu”, Z. Anorg. Allg. Chem., 2007, 633,
1686-1690.
[10] C.L. Lo, J.G. Duh, B.S. Chiou, C.C. Peng, L. Ozawa, “Synthesis of Eu3+
-activated
yttrium oxysulfide red phosphor by flux fusion method”, Materials Chemistry and Physics,
2001, 71, 179-189.
[11] Y. Hashimoto, M. Takahashi, S. Kikkawa, and F. Kanamaru, “Syntheses and Crystal
Structures of Trigonal Rare-Earth Dioxymonocyanamides, Ln2O2CN2 (Ln = Ce, Pr, Nd, Sm,
Eu, Gd)”, Journal of solid state chemistry, 1996, 125, 37–42.
[12] J. Holsä , R.-J. Lamminmäki , M. Lastusaari, P. Porcher, and E. Säilynoja, “Crystal field
effect in RE -doped lanthanum oxycyanamide, La2O2CN2:RE3+
(RE =Pr3+
and Eu3+
) ”, Journal
of Alloys and Compounds,1998, 275–277,402–406.
[13] X. M. Guo, W. S. Yu, X. T. Dong, J. X. Wang, Q. L. Ma, G. X. Liu, and M. Yang, “A
Technique to Fabricate La2O2CN2:Tb3+ Nanofibers and Nanoribbons with the Same
Morphologies as the Precursors”, Eur. J. Inorg. Chem. 2015, 389–396.
[14] X. M. Guo, J. X. Wang, X. T. Dong, W. S. Yu, and G. X. Liu, “New strategy to achieve
La2O2CN2:Eu3+
novel luminescent one-dimensional nanostructures” CrystEngComm, 2014,
16, 5409-5417.
[15] T. Takeda, N. Hatta, and S. Kikkawa, “Gel Nitridation Preparation and Luminescence
Property of Eu-doped RE2O2CN2 (RE =La and Gd) Phosphor”, Chemistry Letters, 2006, 35,
988-989.
[16] Y. Hashimoto, M. Takahshi, S. Kikkawa, and F. Kanamaru, “Synthesis and Crystal
Structure of a new compound, lanthanum dioxymonocyanamide (La2O2CN2)”, Journal of
solid state chemistry, 1995, 114, 592-594.
[17] Y. Hashimoto, M. Takahashi, S. Kikkawa, and F. Kanamaru, “Syntheses of rare earth
dioxymonocyanamides (Ln2O2CN2, Ln=La, Ce, Pr, Nd, Sm, Eu, Gd)”, Chemistry Letters,
1994, 1963-1966.
[18] P. Dorenbos, “ The Eu3+
charge transfer energy and the relation with the band gap of
compounds”, Journal of luminescence, 2005, 111, 89-104.

[19] J. Y. Kuang, Y. L. Liu, and D. S. Yuan, “Preparation and characterization of Y2O2S:Eu3+
phosphor via one-step solvothermal process”, Electrochemical and Solid-State Letters, 2005,
8(9), H72-H74.
[20] G. Blasse and B.C Grabmaier, Luminescent Materials, Springer, Berlin (1994).
[21] S.S. Yi, J.S. Bae, B.K. Moon, J.H. Jeong and J.H. Kim, “Crystallinity of Li-doped
Gd2O3:Eu3+
thin-film phosphors grown on Si (100) substrate”, Applied Physics Letters, 2005,
7(86), 1921-1923.
[22] G. Blasse, “Energy transfer in oxidic phosphors”, Physics Letters A, 1968, 28,444-445.
[23] X. L, L. Y. Yang, Q. L. Ma, J. Tian, X. T. Dong, “A novel strategy to synthesize
Gd2O2S:Eu3+ luminescent nanobelts via inheriting the morphology of precursor”, Mater
Electron, 2014, 25, 5388–5394.
Copyright © 2022 FDOKUMEN