Fluorescent and Lanthanide Labeling for Ligand Screens, Assays, and Imaging
38
89 Seetharama D. Satyanarayanajois (ed.), Drug Design and Discovery: Methods and Protocols, Methods in Molecular Biology, vol. 716, DOI 10.1007/978-1-61779-012-6_6, © Springer Science+Business Media, LLC 2011 Chapter 6 Fluorescent and Lanthanide Labeling for Ligand Screens, Assays, and Imaging Jatinder S. Josan, Channa R. De Silva, Byunghee Yoo, Ronald M. Lynch, Mark D. Pagel, Josef Vagner, and Victor J. Hruby Abstract The use of fluorescent (or luminescent) and metal contrast agents in high-throughput screens, in vitro assays, and molecular imaging procedures has rapidly expanded in recent years. Here we describe the development and utility of high-affinity ligands for cancer theranostics and other in vitro screening studies. In this context, we also illustrate the syntheses and use of heteromultivalent ligands as targeted imaging agents. Key words: Cy5, DELFIA, DTPA, DOTA, Dual-modal agents, Heteromultivalent ligands, Lanthaligands, PARACEST MRI, Solid-phase synthesis, Targeted imaging agents Abbreviations d-OR Delta-opioid receptor Ado 8-Amino-3,6-dioxaoctanoyl Arsenazo (III) 2,7-Bis(2-arsenophenylazo)-1,8-dihydroxyaphthalene-3, 6-disulfonic acid BB Bromophenol blue Boc tert-Butyloxycarbonyl CCK(6) Nle-Gly-Trp-Nle-Asp-Phe-NH 2 CCK(8) Asp-Tyr-Nle-Gly-Trp-Nle-Asp-Phe-NH 2 CCK2R Cholecystokinin receptor subtype 2 CDI N,N¢-carbonyldiimidazole CEST Chemical exchange saturation transfer CH 3 CN Acetonitrile CT Computed tomography Cy5 Cyanine 5 dye DCM Dichloromethane
-
Upload
independent -
Category
Documents
-
view
1 -
download
0
Transcript of Fluorescent and Lanthanide Labeling for Ligand Screens, Assays, and Imaging

89
Seetharama D. Satyanarayanajois (ed.), Drug Design and Discovery: Methods and Protocols, Methods in Molecular Biology, vol. 716, DOI 10.1007/978-1-61779-012-6_6, © Springer Science+Business Media, LLC 2011
Chapter 6
Fluorescent and Lanthanide Labeling for Ligand Screens, Assays, and Imaging
Jatinder S. Josan, Channa R. De Silva, Byunghee Yoo, Ronald M. Lynch, Mark D. Pagel, Josef Vagner, and Victor J. Hruby
Abstract
The use of fluorescent (or luminescent) and metal contrast agents in high-throughput screens, in vitro assays, and molecular imaging procedures has rapidly expanded in recent years. Here we describe the development and utility of high-affinity ligands for cancer theranostics and other in vitro screening studies. In this context, we also illustrate the syntheses and use of heteromultivalent ligands as targeted imaging agents.
Key words: Cy5, DELFIA, DTPA, DOTA, Dual-modal agents, Heteromultivalent ligands, Lanthaligands, PARACEST MRI, Solid-phase synthesis, Targeted imaging agents
Abbreviations
d-OR Delta-opioid receptorAdo 8-Amino-3,6-dioxaoctanoylArsenazo (III) 2,7-Bis(2-arsenophenylazo)-1,8-dihydroxyaphthalene-3,
6-disulfonic acidBB Bromophenol blueBoc tert-ButyloxycarbonylCCK(6) Nle-Gly-Trp-Nle-Asp-Phe-NH2CCK(8) Asp-Tyr-Nle-Gly-Trp-Nle-Asp-Phe-NH2CCK2R Cholecystokinin receptor subtype 2CDI N,N¢-carbonyldiimidazoleCEST Chemical exchange saturation transferCH3CN AcetonitrileCT Computed tomographyCy5 Cyanine 5 dyeDCM Dichloromethane

90 Josan et al.
DELFIA Dissociation-enhanced lanthanide fluoroimmunoassayDIC N,N¢-diisopropylcarbodiimideDIEA DiisopropylethylamineDMBA 1,3-Dimethylbarbituric acidDMEM Dulbecco’s modified eagle mediumDMF N,N¢-dimethylformamideDMSO DimethylsulfoxideDmt 2¢,6¢-Dimethyl-l-tyrosineDOTA 1,4,7,10-Tetraazacyclododecane-1,4,7,10-tetraacetic acidDPLCE c[dPen2,Cys5]enkephalinDTPA Diethylenetriamine-N,N,N¢,N′,N²-pentaacetic acidEDC 1-Ethyl-3-(3-dimethylaminopropyl) carbodiimide hydrochlorideEDT 1,2-EthanedithiolESI-MS Electrospray ionization-mass spectrometryFmoc (9H-fluoren-9-ylmethoxy)carbonylFT-ICR Fourier transform-ion cyclotron resonanceHBTU 2-(1H-benzotriazol-1-yl)-1,1,3,3-tetramethyluronium
hexafluoro-phosphatehMC4R Human melanocortin-4 receptorHOBt N-hydroxybenzotriazoleHOCt 6-Chloro-1H-hydroxybenzotriazolehtBVLs Heterobivalent ligandshtMVL Heteromultivalent ligandMALDI-TOF Matrix-assisted laser desorption ionization-time of flightMRI Magnetic resonance imagingMSH Melanocyte-stimulating hormoneMSH-7 Ser-Nle-Glu-His-dPhe-Arg-TrpMtt 4-MethyltritylNDP-a-MSH Ac-Ser-Tyr-Ser-Nle-Glu-His-dPhe-Arg-Trp-Gly-Lys-Pro-Val-NH2NHS N-hydroxysuccinimide esterNIR Near-infraredPARACEST Paramagnetic chemical exchange saturation transferPbf 2,2,4,6,7-Pentamethyl-dihydrobenzofuran-5-sulfonylPEG PolyethyleneglycolPego 19-Amino-5-oxo-3,10,13,16-tetraoxa-6-azanonadecan-1-oic acidRP-HPLC Reverse-phase high-performance liquid chromatographySPECT Single photon emission computed tomographySPPS Solid-phase peptide synthesisTA ThioanisoletBu tert-butylTFA Trifluoroacetic acidTHF TetrahydrofuranTic 1,2,3,4-Tetrahydroisoquinoline-3-carboxylic acidTIS TriisopropylsilaneTRL Time-resolved luminescenceTrt Triphenylmethyl (trityl)

91Fluorescent and Lanthanide Labeling for Ligand Screens, Assays, and Imaging
The field of medical imaging is rapidly evolving towards the ability to visualize molecular events occurring at the cellular and whole animal level. High-throughput assays can utilize similar technology to rapidly screen cell populations for specific molecular phenotypes. We have applied the use of fluorescent and lanthanide-labeled monovalent and multivalent ligands (see Fig. 1 for examples) in the field of cancer “theranostics” (see Note 1). In this context, we have demonstrated the use of heteromultivalency to enhance by orders of magnitude the binding avidity and specificity to cells that express complementary receptors (1–3). Heteromultivalent ligands (htMVLs) are characterized by the presence of two or more different ligands linked together on a scaffold, which would bind with enhanced affinity only to cells that express complemen-tary heterologous receptors on their surface. We hypothesize that a high degree of selectivity in tandem with high avidity could be achieved with these constructs (Fig. 2). Towards this end, we have tested two receptor pairs – human melanocortin type 4 receptor (hMC4R)/cholecystokinin-2 receptor (CCK-2R) and d-opioid receptor (dOR)/hMC4R – as models of cell-surface receptor targeting by multivalent ligands. Using these two sys-tems, we demonstrated an enhanced “apparent” binding affinity of heterobivalent ligands (htBVLs) to their complementary recep-tor pairs by 10–80-fold. The optimized bivalent ligands were then labeled with fluorescent (Cyanine 5 dye (Cy5) and lanthanide labels (e.g., Eu-DOTA) and were demonstrated to have high specific binding to cells expressing the cognate receptor pairs, but weak interaction with cells expressing the single receptor (Fig. 2).
The use of fluorescence detection is desirable because of its high sensitivity, excellent spatial and temporal resolution, and multiple detection capabilities by simultaneous use of several complimen-tary probes. Therefore, the use of fluorescently labeled agents has rapidly expanded in recent years for cell-based imaging (micros-copy) and high-throughput assays (see Fig. 1 for representative structures). Fluorescence allows ready monitoring of superficial cancerous lesions in vivo (Fig. 3) and can detect targets at centi-meter depths, though with decreased resolution (4). Extension into in vivo settings allows visualization of biology in its intact and native physiological state. However, there is a fundamental barrier to optical imaging in tissues due to autofluorescence and high absorption (e.g., hemoglobin ([Hb]) in the midvisible band. Tissue penetration is limited and depends upon wavelength. The use of red and near-infrared (NIR) light (wavelengths beyond
1. Introduction
1.1. In Vitro and In Vivo Fluorescence Imaging

92 Josan et al.
Fig. 1. Examples of fluorescent and lanthanide-labeled ligands.

93Fluorescent and Lanthanide Labeling for Ligand Screens, Assays, and Imaging
Fig. 2. In vitro imaging of Cy5-labeled htBVL 9 (conc.: 5 nM) of cells expressing both CCK-2R and hMC4R (a, b) or CCK-2R only (c). Images (a) and (c) were acquired 2 min following incubation with the ligand, while image (b) was acquired 10 min after ligand addition to the same cells shown in (a). The difference in fluorescence intensity levels between (a) and (c) is due to greater than 40-fold higher binding to the dual receptor expressing cells (a) than to the monoexpressing cells (c), at this ligand concentration. (b) Capping and endocytosis of ligand/receptor complex was nearly complete after 5 min at which time the addition of a saturating concentration of cold ligand to the media had no effect on the fluorophore intensity or distribution, i.e., the receptors were internalized.
Fig. 3. Examples of in vivo imaging with optical agent. (a, b) Fluorescence imaging of Cy5-labeled targeted imaging agent 3. Mice were bilaterally implanted with HCT116 xenografts of cells overexpressing dOR ( left flank ) and control cells (right flank ). (a) Mouse imaged 72 h postintravenous (i.v.) injection of 100 mg of ligand 3. (b) Mouse imaged 24 h post-iv injection of 10 mg of ligand 3 (reprinted with permission from Ref. 16: Josan et al., Organic Letters (2009), American Chemical Society).

94 Josan et al.
650 nm) confers the advantage of less autofluorescence from tissues (mainly pyridine nucleotides, folates, and flavins) that are observed over lower bands. The most common organic NIR fluorophores are polymethines such as pentamethine and hep-tamethine cyanines. Their physical properties, biodistribution, pharmacokinetics, and applications for in vivo fluorescence imaging have been summarized in recent reviews (5–7). Briefly, the sulphonated cyanine dyes have good aqueous solubility, quan-tum yields greater than 0.1, and high extinction coefficients (e.g., e650 for Cy5 >250,000). They are stable over a broad pH range (3–10) and exhibit low nonspecific binding to tissues and are more photostable than dyes like fluorescein (8). This allows repeated excitation cycles with limited loss of signal. Further, their small size (compared to fluorescent proteins) and spectral properties make them an excellent choice for whole cell assays including high-throughput screens.
An additional approach for limiting the contributions of auto-fluorescence and improving the quantification of fluorescence signal is to utilize measurements of the fluorescence lifetime (9–11). Luminescent lanthanide chelates exhibit unusual spectral characteristics and are optimized for lifetime analyses making them useful as nonradiolabeled alternatives to organic fluoro-phores for screening and biodistribution analyses, particularly in applications where background autofluorescence is a significant problem. For luminescence, the lanthanide complex requires close proximity of a sensitizing chromophore, which is capable of transferring its excited state energy to the encapsulated lanthanide(III) ion (12, 13). This is essential since direct excita-tion of the Ln3+ ion is very inefficient, leading to low values of extinction coefficients (e £ 1 M/cm) as the relevant f-f transitions are parity forbidden. Alternatively, the lanthanide can be dissoci-ated from the chelate and then incorporated into an in situ fluo-rescent chelate (see Note 2). Lanthanide emission bands are very sharp compared to organic fluorophores, typically with a full width at half maximum of ca. 10–20 nm. The detection limits of lanthanide chelates are conservatively in the range of 10−12 to 10−15 M (14). The two most important characteristics of lan-thanide emission that make them very useful for bioassays are the extremely large Stokes’ shift (often exceeding 200 nm) and the long-lived luminescence, which typically range from microsec-onds (Yb, Er, Nd) to milliseconds (Eu, Tb) (14). These long lifetimes immediately offer a signal/noise advantage as they allow time-resolved fluorescence (TRF) spectroscopy and microscopy to be used (see Note 3). The high sensitivity of these assays com-bined with the elimination of radiation and radioactivity disposal renders them amenable to easy automation and makes them
1.2. Time-Resolved Fluorescence and DELFIA-Based Binding Assays

95Fluorescent and Lanthanide Labeling for Ligand Screens, Assays, and Imaging
highly attractive for high-throughput screening (HTS). Finally, some lanthanide ions display in vivo toxicity, but are considered nontoxic when complexed to a strong chelator (15).
An example of this luminescence-based technology is the dissociation-enhanced lanthanide fluoroimmunoassay (DELFIA®) (see Fig. 4 for examples of assays performed with DELFIA) (9, 10, 16, 17). This protocol requires the use of a lanthanide complex (e.g., DTPA) that is easily dissociable at acidic pH (~3.5). Our recent modifications to the DELFIA protocol have allowed its successful use with lanthanide chelates that are considerably more stable (e.g., DOTA, 1,4,7,10-tetraazacyclododecane-N,N¢,N′′,N′′′-tetraacetic acid) (18). Lanthanide-DOTA chelates can be used to label peptides/ligands (“lanthaligands;” see Note 1) for in vivo applications with magnetic resonance imaging (MRI) and posi-tron emission tomography/single photon emission computed
Fig. 4. Examples of DELFIA-based binding assays with Eu-DTPA/DOTA labels as an alternative to radiolabeled binding assays. (a) Saturation binding assay with DPLCE-(Eu-DTPA) ligand 1 binding to CHO cells overexpressing the d-opioid receptor (dOR). (b) Competition binding assay of Dmt-Tic-Lys(Cy5) ligand 3 carried out with DPLCE-(Eu-DTPA) 1 on the same CHO cells. (c) Saturation binding study of Eu-DOTA-NDP-a-MSH (see text for modifications needed in DELFIA protocol for assaying Eu-DOTA labels) performed on HEK293 cells overexpressing hMC4R. (d) Competitive binding curve of NDP-a-MSH binding to HEK293/hMC4R using Eu-DOTA-NDP-a-MSH (Fig. 4a, b reprinted with permissions from Ref. 17: Heather et al. (2005), Analytical biochemistry, Elsevier Inc. Josan et al., Organic Letters (2009), American Chemical Society, respectively.)

96 Josan et al.
tomography (PET/SPECT) techniques (19). For example, radioactive 153Sm and 177Lu lanthanides can be detected with SPECT and are used for radiotherapy (20). In addition, many radioactive metals such as 111In, 99mTm, and 64Cu can bind to the same chelators used for lanthanides, thereby expanding the scope of this tag’s utility (20). Thus, modification of this DELFIA pro-tocol for lanthanide-DOTA chelates provides a platform technol-ogy for vertical integration of this tag for in vitro and in vivo applications.
The lanthanides are also paramagnetic, which makes them useful as MRI contrast agents (such as gadolinium and dysprosium) by inducing the relaxation of water protons and, thus, decreasing T1 and/or T2 relaxation (21). More recently, lanthanide che-lates have been used to create PARACEST MRI contrast agents for molecular imaging (22). PARACEST (PARAmagnetic Chemical Exchange Saturation Transfer) employs the ability of paramagnetic lanthanide ions to shift the MR frequencies of the protons of the chelator by as much as ±50 ppm (23). These extremely shifted frequencies (relative to the typical 0–10 ppm MR frequency range for nonparamagnetic molecules) facilitate selective saturation of an MR frequency of one PARACEST agent in the presence of other agents. This MR saturation pro-cedure is similar to the fluorescence recovery after photobleach-ing (FRAP) used with optical imaging, in that the coherent MR signal is reduced or obliterated. Chemical exchange of the MR-saturated proton from the contrast agent to a water mole-cule transfers the saturation to water, which causes the MR sig-nal of water to be reduced to levels that can be detected with standard MRI methods.
PARACEST MRI contrast agents provide advantages relative to T1/T2* MRI contrast agents for molecular imaging. Two or more PARACEST agents can be detected during the same experi-ment (similar to detecting multiple optical imaging dyes), which can be used to perform in situ comparative analyses with improved quantification (24). For example, the pharmacokinetics of two PARACEST agents with different sizes may be measured to inves-tigate tumor vascular permeability characteristics (Fig. 5) (25). In addition, the chemical exchange rates of PARACEST agents can be very responsive to interactions with disease biomarkers (26). For example, we have created PARACEST agents that alter their chemical exchange rate after their peptidyl ligand is cleaved by an enzyme (24, 27, 28). The detection of a change in the PARACEST effect is used to detect the enzyme biomarker (Fig. 6). These examples demonstrate that lanthanide chelates that label peptides and other molecules are a useful platform technology for in vivo molecular imaging studies.
1.3. (PARACEST) Magnetic Resonance Imaging (MRI)

97Fluorescent and Lanthanide Labeling for Ligand Screens, Assays, and Imaging
Fig. 5. Monitoring the pharmacokinetics of PARACEST-labeled albumin in a mouse model of mammary carcinoma. (a) An axial MR image showing the location of a subcutaneous flank MCF7 tumor on the back of an athymic nude mouse (upper right side of the image). The mammary fat pads on the front of the mouse were also clearly visible. (b) The change in MRI signal measured 60 min after injecting the PARACEST-labeled albumin into the tail vein of the mouse. The decrease in MRI signal in the tumor region indicated accumulation of the labeled albumin in this tissue. The periphery of the mouse showed increased and decreased MRI signals due to magnetic susceptibility artifacts. (c) The PARACEST map refined the analysis by reducing magnetic susceptibility artifacts and by normalizing the change in MRI signals after injection relative to the preinjection MRI signals. (d) The temporal evolution of the measured CEST effect showed an initial accumulation and subsequent retention of PARACEST-labeled albumin in the tumor. These results were used to assess tumor angiogenesis.
Fig. 6. Detection of urokinase plasminogen activator (uPA) with 7. (a) The proposed mechanism of uPA-mediated cleav-age of the Z-GGR peptide ligand from the agent and showing conversion of an amide proton to an amine. (b) The MTRasy spectrum showed a CEST effect from the amide at −52 ppm before uPA was added (red). The disappearance of this CEST effect after uPA was added (blue) was used to detect uPA. An enzyme-unresponsive agent, Yb-DOTA-Gly, showed a CEST effect at −16 ppm before and after uPA was added, which served as an internal control.

98 Josan et al.
1. An Fmoc/tBu strategy is used here for the synthesis of peptides. For manual assembly of peptides, plastic syringe reactors equipped with a frit and piston can be employed. For manual multiple syntheses in a parallel fashion, use a Domino solid-phase synthesizer (Torviq, Niles, MI).
2. Na-Fmoc derivatives of amino acids, N-hydroxybenzotria zole (HOBt), 6-chloro-1H-hydroxybenzotriazole (HOCt), N,N¢-diisopropyl carbodiimide (DIC), and 2-(1H-benzotriazol-1-yl)-1,1,3,3-tetramethyluronium hexafluoro-phosphate (HBTU).
3. Rink amide Tentagel S resin (Rapp Polymere, Tubingen, Germany), Wang resin.
4. Polyethylene glycol-based flexible linkers – Fmoc-Ado-OH (Ado: 8-amino-3,6-dioxaoctanoyl; 9-atoms long linker) and Fmoc-Pego-OH (Pego: 19-amino-5-oxo-3,10,13,16-tetraoxa-6-azanonadecan-1-oyl; 20-atoms long linker) (Novabiochem, Gibbstown, NJ). Alternatively, Pego linker can be assembled with diglycolic anhydride (TCI America, Portland, OR), N,N¢-carbonyldiimidazole (CDI) (Sigma-Aldrich, Milwaukee, WI), and 4,7,10-trioxa-1,13-tridecane-diamine (PEG3 diamine) (TCI America, Portland, OR) on the solid-phase.
5. 1,4,7,10-tetraazacyclododecane-1,4,7,10-tetraacetic acid mono N-hydroxysuccinimide ester (DOTA-NHS ester) (Macrocyclics, Dallas, TX). Diethylenetriaminepentaacetic dianhydride (DTPA dianhydride), Arsenazo(III) dye (Sigma-Aldrich).
6. A hydrogenator for hydrogenation reactions (Parr Instruments, Moline, IL).
7. Human serum albumin (HAS), benzylcarbamate, glyoxylic acid monohydrate, phosphorous tribromide, tert-butyl 2-bromoacetate, 10%-Pd/C, Fmoc-Cl, zinc dust, 1-ethyl-3-(3-dimethylaminopropyl) carbodiimide hydrochloride (EDC), N-hydroxysuccinimide (HOSu), 2-morpholinoethanesulfonic acid, bromophenol blue (BB), diisopropylethylamine (DIEA), N,N-dimethylbarbituric acid (DMBA), 1,2-ethandithiol (EDT), 2-mercaptoethanol, sodium diethyldithiocarbamate trihydride, tetrahydrofuran (THF), tetrakis(triphenylphosphine) palladium(0) [Pd(0)TPP4], thioanisole (TA), trifluoroacetic acid (TFA), and triisopropylsilane (TIS).
1. Analyze the purity of final products using high-performance liquid chromatography (HPLC) apparatus (Waters® HPLC used in this work) equipped with a C18 reverse-phase column
2. Materials
2.1. Chemical Syntheses
2.2. Purification and Characterization

99Fluorescent and Lanthanide Labeling for Ligand Screens, Assays, and Imaging
(e.g., Vydac column, diameter × length: 4.6 × 150 mm, pore size: 3 mm). A linear gradient of buffer B under various gradi-ent conditions at a flow rate of 0.3–1 mL/min can be used. Monitor the separations at 220 and 280 nm. Achieve the purification of compounds using a preparative HPLC (Waters 600 HPLC apparatus) equipped with a C-18 reverse-phase column (e.g., Vydac column: 22 × 250 mm, 5 mm pore size) with similar buffers and 3–10 mL/min flow rate. Monitor the separations at 230 and 280 nm.
2. See Table 1 for HPLC conditions used. 3. Employ solid-phase extraction (SPE) where simple isolation
of the final compounds is needed, with the C-18 Sep-Pak™ Vac RC cartridges (100 or 500 mg) (Waters, Milford, MA). Precondition the Sep-Pak cartridge with 5 column volumes (5 times the volume of packed column bed) each of ace-tonitrile, methanol, and water, in that order. After loading the compound, wash the column several times with water, and then gradually with 5, 10, 60, and 90% of aqueous acetonitrile to elute the peptide. Monitor the fractions for the required compound with analytical HPLC. The elution gradient here is designed such that most compounds will elute in the 60% fraction.
4. Size-exclusion chromatography (SEC) can be performed with a borosilicate glass column (2.6 × 250 mm) filled with medium-sized Sephadex G-25 or G-10 resin. Elute the com-pounds with an isocratic flow of 1.0 M aq. AcOH.
5. Cellulose membrane tubing with a molecular weight cut-off of 5,000 for dialysis purification (Pierce Biotechnology, Rockford, IL).
6. Mass spectra of positive or negative ions with a single stage reflectron matrix-assisted laser desorption ionization-time of flight (MALDI-TOF) mass spectrometer (Bruker Rexlex III, Bruker Daltonics, Billerica, MA; a-cyanocinnamic acid as a matrix) in reflectron mode or with a low resolution electrospray
Table 1 HPLC conditions used for various compounds
Phase A Phase B
A1: 0.1% TFA in water B1: 0.1% TFA in acetonitrile
A2: 0.1% TEA/AcOH (TEAA) in water (pH 6.0)
B2: 90% acetonitrile in Phase A2 (pH adjusted to 6.0 with AcOH)
Method A: 10–40% Phase B1 in Phase A1 in 30 min; Method B: 10–60% Phase B1 in Phase A1 in 50 min; Method C: 10–90% Phase B1 in Phase A1 in 30 min; Method D: 20–60% Phase B1 in Phase A1 in 50 min; Method E: 10–60% Phase B2 in Phase A2 in 50 min; Method F: 10–90% Phase B2 in Phase A2 in 40 min
100 Josan et al.
ionization (ESI) mass spectrometer (Finnigan, Thermoquest LCQ ion trap instrument, Lake Forrest, CA), and/or using a high-resolution Fourier transform mass spectrometer (FT-ICR MS, Bruker Apex Qh, Bremen, Germany) equipped with an ESI source. For internal calibration, use an appropriate mix-ture of standard peptides with an average resolution of ca. 10,000 and 60,000 on the Reflex III and the FT-ICR instru-ment, respectively.
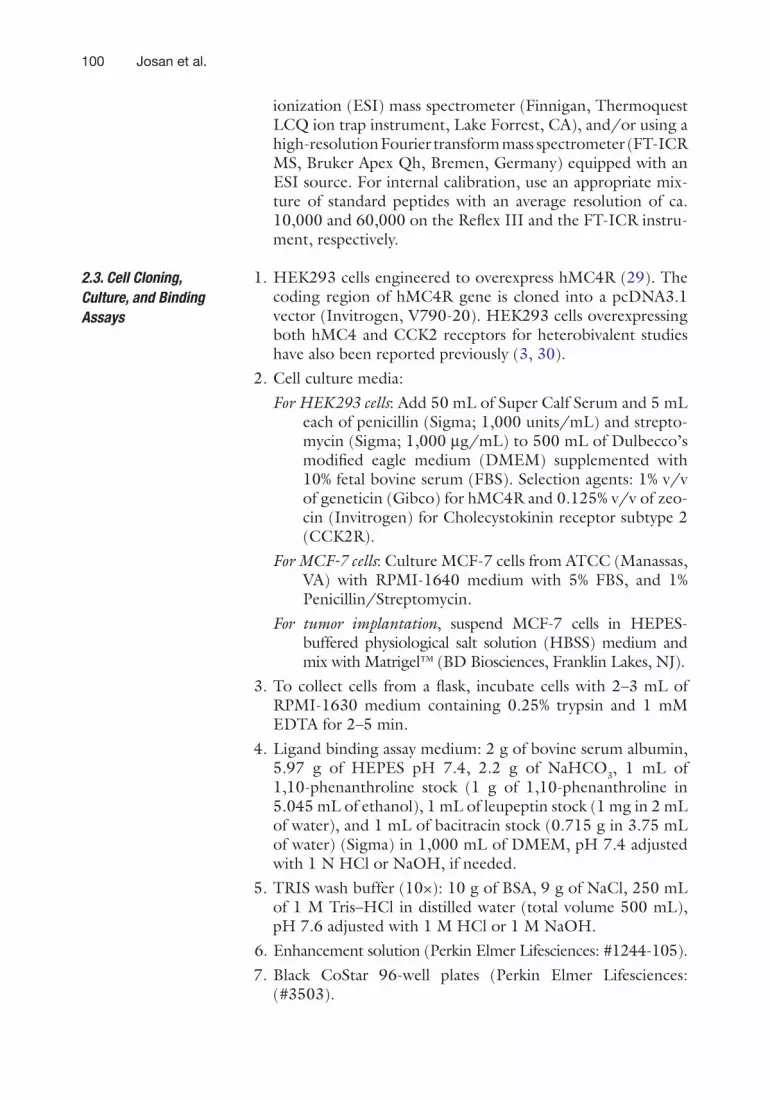
1. HEK293 cells engineered to overexpress hMC4R (29). The coding region of hMC4R gene is cloned into a pcDNA3.1 vector (Invitrogen, V790-20). HEK293 cells overexpressing both hMC4 and CCK2 receptors for heterobivalent studies have also been reported previously (3, 30).
2. Cell culture media:For HEK293 cells: Add 50 mL of Super Calf Serum and 5 mL
each of penicillin (Sigma; 1,000 units/mL) and strepto-mycin (Sigma; 1,000 mg/mL) to 500 mL of Dulbecco’s modified eagle medium (DMEM) supplemented with 10% fetal bovine serum (FBS). Selection agents: 1% v/v of geneticin (Gibco) for hMC4R and 0.125% v/v of zeo-cin (Invitrogen) for Cholecystokinin receptor subtype 2 (CCK2R).
For MCF-7 cells: Culture MCF-7 cells from ATCC (Manassas, VA) with RPMI-1640 medium with 5% FBS, and 1% Penicillin/Streptomycin.
For tumor implantation, suspend MCF-7 cells in HEPES-buffered physiological salt solution (HBSS) medium and mix with Matrigel™ (BD Biosciences, Franklin Lakes, NJ).
3. To collect cells from a flask, incubate cells with 2–3 mL of RPMI-1630 medium containing 0.25% trypsin and 1 mM EDTA for 2–5 min.
4. Ligand binding assay medium: 2 g of bovine serum albumin, 5.97 g of HEPES pH 7.4, 2.2 g of NaHCO3, 1 mL of 1,10-phenanthroline stock (1 g of 1,10-phenanthroline in 5.045 mL of ethanol), 1 mL of leupeptin stock (1 mg in 2 mL of water), and 1 mL of bacitracin stock (0.715 g in 3.75 mL of water) (Sigma) in 1,000 mL of DMEM, pH 7.4 adjusted with 1 N HCl or NaOH, if needed.
5. TRIS wash buffer (10×): 10 g of BSA, 9 g of NaCl, 250 mL of 1 M Tris–HCl in distilled water (total volume 500 mL), pH 7.6 adjusted with 1 M HCl or 1 M NaOH.
6. Enhancement solution (Perkin Elmer Lifesciences: #1244-105). 7. Black CoStar 96-well plates (Perkin Elmer Lifesciences:
(#3503).
2.3. Cell Cloning, Culture, and Binding Assays

101Fluorescent and Lanthanide Labeling for Ligand Screens, Assays, and Imaging
1. An inverted Olympus IX70 microscope equipped with a 40× 1.4 NA ultrafluor objective, and a 200 W Hg lamp as the excitation source.
2. Matching excitation and emission filters for the fluorophore of interest. For Cy5, select the excitation light at 650 nm to focus onto the cell, and filter the emitted light at 670 nm (10 nm BP) prior to imaging onto a CCD camera.
3. HBSS Buffer: 5 mM KCl, 0.3 mM KH2PO4, 138 mM NaCl, 0.2 mM NaHCO3, 0.3 mM Na2HPO4, 20 mM HEPES, 1.3 mM CaCl2, 0.4 mM MgSO4, and 5.6 mM glucose, pH 7.3 at 37°C.
4. A coverslip containing cells into a chamber held at 37°C on the stage of the microscope in 1 mL of HBSS.
1. Construct a customized MRI cradle, similar to a standard tube rack, for study of PARACEST MRI contrast agents in biochemical solutions. This cradle can be crafted from a PVC pipe, sheets of polycarbonate, electrical tape, and a Dremel drilling and shaping tool (see Note 4).
2. For in vivo imaging, construct a customized MRI compatible “mouse sled” with a nosecone for gas anesthetic for study of PARACEST MRI contrast agents within in vivo models. This can be crafted from sheets of polycarbonate, a 30 mL syringe, electrical tape, and a Dremel drilling and shaping tool.
3. For in vivo MRI, anesthetize the mice with isofluorane (Aerrane™, Henry Schein Animal Health, Inc., Melville, NY) in 100% Oxygen gas (Praxair, Inc.).
4. To perform in vivo MR imaging, use physiological monitor-ing instrumentation (SA Instruments, Stony Brook, NY), syringes, needles, PE20 tubing, suture thread, tape and a Gaymar heat pad (Henry Schein Animal Health, Inc., Melville, NY), a 150 W heat lamp (PetSmart, Inc.), and a 9.4T Biospec MRI Scanner (Bruker Biospin Corp., Billerica, MA) for in vivo MR imaging.
5. Gd-DTPA (Magnevist™, Bayer Health Pharmaceuticals, Inc.) for in vivo MR imaging without further purification.
The following subheadings describe in detail the individual steps necessary to incorporate Cy5 dye, chelates, and lanthanide labels (Eu, Yb, and Tm) into ligands. The solid-phase strategy was favored for labeling, wherever possible. Also, many ligands
2.4. In Vitro Live Cell Imaging Microscopy
2.5. PARACEST MR Imaging
3. Methods

102 Josan et al.
need a free N-terminus to preserve the high binding affinity and potency to their cognate receptors, such as endorphins to the d-opioid receptor. This requires orthogonal protection schemes during synthesis (e.g., Fmoc/tBu/Aloc or Mtt). Thus, if a free N-terminal amine is needed, an orthogonal group is introduced at the C-terminus, either on the amino acid side chain or on the linker coupled to the C-terminus (final product as secondary amide). This group can then be selectively cleaved to label via solid-phase procedures (see Subheadings 3.2 and 3.3). For lan-thaligands, DTPA solid-phase labeling procedures are simple, but very few published procedures are available that describe the effi-cient reduction of dimer products often seen with DTPA dianhy-dride reagent. Most of these protocols require selective protection of the carboxylates. Since we routinely prepare many lanthali-gands by these methods, we will describe here an efficient and yet simple route for DTPA coupling (31). Whereas DTPA is desirable for in vitro applications, in vivo settings require a stronger chela-tor such as DOTA. Standard solid-phase synthesis methods can easily couple the DTPA/DOTA chelates to the amine terminus of a resin-bound peptide during solid-phase peptide synthesis. However, conjugation on carboxyl terminus requires some modi-fications and is usually done by introducing a C-terminus residue (e.g., lysine) or a linker coupled on the C-terminus (see Subheadings 3.2 and 3.3 for examples). We have developed an alternative method to create a resin-bound amine-derivatized DOTA, which has an amine that can couple to the carboxyl ter-minus of amino acids during standard Fmoc solid-phase synthesis (24). The synthesis of a resin-bound a-amino-DOTA for Fmoc chemistry is described in Subheading 3.5.
1. Solid-phase syntheses can be carried out in polypropylene syringes (5–20 mL) fitted with polyethylene porous disks (32). Solvents and soluble reagents can be removed with a syringe fitted with piston or by vacuum if using a manual solid-phase synthesizer. The compounds described here can be synthesized on a Tentagel Rink amide resin (the initial loading 0.2–0.26 mmol/g) using Na-Fmoc protecting groups and a standard DIC/HOCt or HBTU/HOBt activation strategy, unless otherwise noted. An on-resin BB test can be used for qualitative and continuous monitoring of reaction progress. For quantitative analyses, a Kaiser test can be per-formed (see Note 5).
2. Swell the resin in THF for an hour, and wash with N,N¢-dimethylformamide [DMF] (2×). Remove Fmoc group with 20% piperidine in DMF (2 + 20 min), followed by washing the resin with DMF (3×), dichloromethane [DCM] (3×), 0.2 M HOBt in DMF (2×), and finally with DMF (3×).
3.1. General Solid-Phase Synthesis

103Fluorescent and Lanthanide Labeling for Ligand Screens, Assays, and Imaging
3. Couple the first amino acid using preactivated 0.3 M HOCt ester in DMF or DMF-DCM 1:1 mixture (3 eq of Na-Fmoc amino acid, 3 eq of HOCt, and 3 eq of DIC). To avoid dele-tion sequences, perform a double coupling at all steps with 3 eq of amino acid, 3 eq of HBTU, and 6 eq of DIEA or 2,4,6-collidine in DMF. If the Kaiser test is positive at this stage, perform a third coupling using the symmetric anhy-dride method (stir 4 eq of amino acid and 2 eq of DIC in DCM or DMF-DCM mixture for 5 min, and add it to resin). Cap any unreacted NH2 groups on the resin using 50% acetic anhydride in pyridine for 5 min. Following completion of coupling reaction, wash the resin with DMF and repeat the same procedure for the next amino acid until all the amino acids have been coupled.
4. Frequently during the synthetic steps, cleave a small amount of the peptide from the resin (see Subheading 3.1, step 6) and analyze by HPLC and MS to monitor the synthesis and purity of the peptide intermediates.
5. After the final amino acid has been incorporated, cleave Na-Fmoc groups and acetylate or label the free Na-termini as required. If free N-termini are desired, use a Boc-protected amino acid for the last residue coupling.
6. For cleavage of the peptide from the resin, wash the resin with DCM (3×), DMF (5×), THF (2×), DCM (2×), and dry it over vacuum. A cleavage cocktail (10 mL per 1 g of resin) of 82.5% TFA, 5% water, 5% TIS, 5% TA, and 2.5% EDT can be used, unless otherwise noted. Inject the TFA cocktail into the resin-containing vessel and stir for 3–6 h at room tem-perature. Isolate the crude peptides from the resin by filtra-tion, reduce the filtrate to low volume by evaporation using a stream of nitrogen, and precipitate the peptides in ice-cold diethyl ether, centrifuge, wash several times with ether, dry the crude mass, dissolve in 1.0 M (6%) aq. acetic acid, and then lyophilize to give solid powders that can be stored as solid or 2 mM solution in dimethylsulfoxide [DMSO] at −20°C. Purify the peptides by preparative HPLC and/or gel-filtration.
This example (Fig. 7) illustrates the synthesis of a cyclic ligand with free N-terminus (required for opioid binding in this case) and a DTPA chelate assembled on the C-terminus using a lysine side chain as a functional handle. The Aloc group has been used as an orthogonal protection that is cleaved after the completion of peptide sequence and prior to DTPA coupling. Lanthanide complexation is then accomplished in solution following purifica-tion of linear peptide and disulfide formation.
3.2. Synthesis of DPLCE-Lys (Eu-DTPA) Lanthaligand 1

104 Josan et al.
1. The chelate-derivatized c[dPen2,Cys5]enkephalin (DPLCE) peptide can be synthesized on a Tentagel Rink amide resin (initial loading: 0.2–0.26 mmol/g) using Na-Fmoc protect-ing groups and a standard DIC/HOCt or HBTU/HOBt activation strategy as described in Subheading 3.1 (Fig. 7). Introduce the last residue as Boc-Tyr(tBu)-OH to obviate a subsequent deprotection step. These protecting groups (Boc/tBu) will be removed upon cleavage of entire product off the resin.
2. Carefully wash the resin-bound peptide 11 with dry, oxygen-free DCM (argon-flushed), and introduce an argon atmo-sphere using a Domino block (see Note 6).
3. The Aloc deprotection can be carried out with Pd[0] reagents under argon and oxygen-free solvents as follows (33, 34): dis-solve 0.5% w/v of tetrakis(triphenylphosphine) palladium(0) [Pd(0)TPP4] and 3% w/v of dimethylbarbituric acid (DMBA) in DCM (10 mL per 1 g of resin). Treat the resin with the deprotection reagent mixture (2 × 30 min). Wash the resin with DCM (3×), DMF (3×), 5% DIEA in DMF (3×), DMF (2×), 1% sodium diethyldithiocarbamate trihydride in DMF (2×, 5 min; this step removes the resin-bound palladium), DMF (2×), 5% piperidine in DMF (2×), DMF (3×), 0.2 M HOBt in DMF (2×), DMF (2×), and DCM (3×).
4. DTPA coupling: In a glass scintillation vial, dissolve 20 eq of DTPA dianhydride (in final concentration of 0.6 M) and 40 eq of HOBt in dry DMSO by heating it to 50°C, followed by stirring for another 20 min at room temperature. If pre-cipitation occurs, briefly heat the reagent mixture again to 80°C and stir until cooled to room temperature. Add the
Fig. 7. Synthesis of Eu-DTPA-labeled DPLCE lanthaligand 1.

105Fluorescent and Lanthanide Labeling for Ligand Screens, Assays, and Imaging
HOBt diester mixture to the resin and vortex for 30 min (see Notes 7 and 8).
5. Wash the resin in the following sequence: DMSO (3×), THF (3×), 20% aq. THF (3×, 5 min), 10% DIEA and 10% water in THF (2×, 5 min), 20% aq. THF (2×, 1 min), THF (3×), and DCM (3×). It is necessary to comply with this washing pro-tocol and at no stage must the resin be exposed to DMF (see Note 7).
6. Cleave the peptide off the resin 12 using TFA-scavenger cocktail (91% TFA, 3% water, 3% EDT, and 3% TA). Wash the resin with neat TFA, pool the collected filtrates, and evapo-rate TFA under a stream of nitrogen. Precipitate the peptide with cold Et2O (add 2% of 2-mercaptoethanol to prevent pre-mature oxidation). Follow the Subheading 3.1, step 6, to achieve a lyophilized product.
7. For disulfide formation, dissolve the purified peptide (0.1 mg/mL) in 0.1 M ammonium acetate buffer (pH 8) and stir in an open jar with a few drops of DMSO (see Note 9).
8. For europium chelation to DTPA, add 3 eq of EuCl3 ⋅ 6H2O to the reaction above and stir the solution overnight (see Note 10). Purify the final product using SPE with a C-18 Sep-Pak™ cartridge.
This procedure illustrates a solid-phase synthetic methodology devised for coupling labels on-resin or in-solution as desired. The applicability of this synthetic approach is demonstrated by deriva-tizing a Dmt-Tic-Lys(R)-OH with the lanthanide chelator on a solid-phase support, and the Cy5 label in solution.
1. In a 50 mL bottle containing 1 g of Wang resin (0.93 mmol/g) and equipped with a magnetic stir bar, add dry DCM to swell the resin for 1 h. Carefully decant the solvent, close the bottle with a septum, and flush with nitrogen. Add DIEA (9 eq, 1.4 mL) in 15 mL of DCM. Cool the resin slurry to 0°C and add dropwise mesyl chloride (MsCl, 8 eq, 0.57 mL) in 2 mL of DCM. Stir the reaction for 20 min, remove the ice bath, and continue the stirring for another 20 min at room tem-perature. Transfer the resin to a 20 mL syringe reactor and wash with dry DCM (5×) and dry DMF (3×). Add Fmoc-Lys(Mtt)-OH (2 eq, 1.2 g), CsI (2 eq, 0.5 g), and DIEA (2 eq, 0.32 mL) in 10 mL of dry DMF and stir the reaction overnight at room temperature.
2. Wash the resin with DMF (3×), DCM (2×), and remove Na-Fmoc with 20% piperidine in DMF (2 + 20 min). Subsequently, wash the resin with DMF (3×), DCM (3×), 0.2 M HOBt in DMF (2×), and DMF (3×). Add Fmoc-Tic-OH (3 eq), HOCt (3 eq), and DIC (3 eq) in DMF and stir the resin for 2 h.
3.3. Synthesis of Labeled Dmt-Tic-Lys Derivatives

106 Josan et al.
3. Wash the resin above and cleave Na-Fmoc protection with 20% piperidine in DMF (2 + 5 min). A shorter deprotection time should be used here to prevent dioxopiperazine-mediated cyclative cleavage of the unprotected dipeptide from the resin. Wash the resin with DMF (3×), DCM (3×), 0.2 M HOBt in DMF (2×), and DMF (3×). Add Boc-Dmt-OH (3 eq), HBTU (3 eq), and DIEA (6 eq) in DMF to the resin. Heat the reaction in a household microwave for 3 s, followed by stirring until it cools to room temperature; repeat the heating/cooling agitation (5×) and stir the resin for another 2 h at room temperature. A small amount of 2¢,6¢-dimethyl-l-tyrosine (Dmt) oligomers (acylated via unprotected phenol) is formed. To remove these oligomers, treat the resin with 50% piperidine in DCM:MeOH (1:1) to conveniently convert back this side product to desired compound (see Note 11).
4. After coupling completion, wash the resin with DMF (3×) and DCM (7×) and dry over vacuum. Cleave the peptide from the resin with 82.5% TFA, 5% TIS, 5% water, 5% TA, and 2.5% EDT.
5. For Cy5 labeling, we prefer the more cost-effective conjuga-tion of the dye in solution via a thiol–maleimide reaction. Cleave the Mtt protection on lysine by repetitive treatment with 3% TFA and 5% TIS in DCM (2 min each). Between steps, wash the resin with 5% TIS in DCM (2×). Following final cleavage treatment, wash the resin with 5% TIS in DCM (3×), DCM (2×), 5% DIEA in DCM (3×), DMF (3×), and finally with DCM (3×). Couple TrtS-CH2CH2COOH (Trt-Mpr-OH) to 15 using the HOCt/DIC protocol and then cleave the peptide with acidic cocktail (82.5% TFA, 5% H2O, 5% TIS, 5% TA, and 2.5% EDT) to give 2 (Fig. 8). Purify the compound by preparative HPLC. To carry out Cy5 dye con-jugation to obtain compound 3, dissolve the lyophilized product in DMSO and add 1.3 eq of Cy5-maleimide in DMSO. Stir the reaction and monitor every hour with ana-lytical HPLC (see Note 12).
6. For the synthesis of the dual-modal agent 4, we have employed a bifunctional handle for labeling. This is comprised of a short 8-amino-3,6-dioxaoctanyl (Ado) linker with an orthogonally protected Cys residue (Fmoc-Cys(Mmt)-OH) incorporated at the end of the Ado linker. Couple Fmoc-Ado-OH and Fmoc-Cys(Mmt)-OH using a standard HOCt/DIC coupling protocol to give intermediate 16. For coupling DOTA on-resin, we have chosen the amine group of Cys for coupling. This can be accomplished by reacting the free amines with DOTA-NHS ester (2 eq) and DIEA (8 eq) in DMF for over-night to give 17 (alternatively, the thiol group can be used for

107Fluorescent and Lanthanide Labeling for Ligand Screens, Assays, and Imaging
conjugation with DOTA–maleimide compound, if the amine group is desired for other conjugations). Cleave the peptide from the resin using 82.5% TFA, 5% water, 5% TIS, 5% TA, and 2.5% EDT. Following purification of the peptide, both Cy5 conjugation and europium chelation can be carried out in a one-pot reaction. Add 1.1 eq of Cy5-maleimide to the purified peptide in DMSO and monitor the reaction with HPLC every hour. Add additional aliquots of dye, if neces-sary, until HPLC indicates complete conversion to Cy5 prod-uct. For Europium chelation to DOTA, add 3 eq of EuCl3.6H2O in DMSO to the reaction above and stir the solution overnight (see Note 10). Purify the final product using SPE with C-18 Sep-Pak™ cartridge.
Fig. 8. Synthesis of Cy5-labeled and/or Eu-DOTA-labeled derivatives of Dmt-Tic 3 and 4.

108 Josan et al.
In lieu of the utility of htMVLs vis-à-vis monovalent ligands described earlier in the text, examples of an htBVL labeled with either a lanthanide chelator or a dye label are demonstrated. These ligands, composed of both peptide and nonpeptide building blocks, illustrate feasibility and successful assembly of complex ligands with the labels attached in the middle of a long sequence. We have previously reported the syntheses of these htBVLs using a modular strategy based on parallel solid-phase synthesis (1). Representative examples of two labeled htBVLs are shown in Fig. 1 and their syntheses shown in Fig. 9.
1. Assemble the htBVL peptides using the Na-Fmoc/tBu strat-egy on Tentagel Rink amide resin (initial loading: 0.2 mmol/g). To avoid deletion sequences and slower cou-pling rates, perform double coupling (HOCt/DIC and HBTU/HOBt/DIEA) and N-capping at each step as described in Subheading 3.1. The Pego linkers and other modifications to incorporate labels are discussed below.
3.4. Synthesis of Labeled Heterobivalent Ligands (htBVLs)
Fig. 9. Synthesis of Cy5 and Eu-DOTA-labeled heterobivalent ligands 9 and 10.

109Fluorescent and Lanthanide Labeling for Ligand Screens, Assays, and Imaging
For parallel library generation (see refs. (1, 2) for examples), complete the assembly of first ligand (CCK6 ligand in this case), then split the resin into appropriate units, continue the assembly of different linkers and linker length on each, incor-porate an orthogonally protected functional handle, wherever appropriate, for later derivatization, and finally assembly the second ligand.
2. Pego coupling: The Pego spacers can be introduced in the following manner. Couple the N-terminus of 19 with the gly-colic acid spacer using 50 eq of diglycolic anhydride in DMF (10 mL per 1 g of resin; 1 M concentration of reagent) for 5 min (see Note 13). Wash the resin with DMF (3×), with the last washing with dry DMF (1×). Activate the free carboxylic acid groups using 10 eq of carbonyldiimidazole (CDI) in dry DMF for 30 min. Wash the resin with dry DMF (3×), couple the PEG3 diamine using excess of 50% 4,7,10-trioxa-1,13-tridecanediamine in dry DMF, and stir the resin for 30 min (vigorous vortexing for first 5 min).
3. For later modifications of these ligands with various labels/payloads, we have incorporated an orthogonally protected Lys residue as a functional handle (the N-terminal of melano-cyte-stimulating hormone [MSH] ligand is acetylated and no other free amine-bearing group is present in the multivalent ligand). This handle can be incorporated in between Pego and poly(Pro-Gly) linker region, in order to keep an adequate spacing between the tag and the ligands, thus minimizing any influence on ligand binding. After the first Pego linker assem-bly on the resin, couple Fmoc-Lys(Mmt) to the peptide, fol-lowed by coupling as many Pro and Gly residues as are needed to build the required poly(Pro-Gly) linker.
4. Following poly(Pro-Gly) linker construction on the resin, cou-ple another Pego unit as described above. Continue the addi-tion of amino acid residues to complete the synthesis of second ligand, MSH (7). Finally, deprotect the N-terminus and acety-late with an excess of acetic anhydride/pyridine (1:1).
5. For Cy5-labeled htBVL 9, cleave the peptide from the resin using TFA-scavenger cocktail (see Subheading 3.1), and purify with preparative HPLC. Add 1.1 eq of Cy5-NHS ester to a solution of purified compound 9 in DMSO and monitor the reaction as described in Subheading 3.3, step 6.
6. For Eu-DOTA-labeled htBVL 10, cleave the side chain Mmt protection from Lys by repetitive treatment with 10% TFA, 5% TIS in DCM (see Note 14). Wash the resin with 5% TIS in DCM (2×). Following final cleavage treatment, wash the resin with 5% TIS in DCM (3×), DCM (2×), 5% DIEA in DCM (3×), DMF (3×), and finally with DCM (3×). Couple

110 Josan et al.
the Ado linker with 3 eq of Fmoc-Ado-OH, 3 eq of HBTU, 3 eq of HOBt, and 6 eq of DIEA in DMF, and stir the resin overnight. Remove the Fmoc protection from Ado linker with 20% piperidine in DMF, and couple the DOTA chelator with 2 eq of DOTA-NHS ester, 8 eq of DIEA in DMF, and stir the resin overnight.
7. Following acidic cleavage of peptides from the resin and HPLC purification, the Europium complexation to the DOTA chelate can be carried out in solution. Add 3 eq of EuCl3 ⋅ 6H2O to a solution of DOTA-labeled peptide in DMSO (see Note 10), and stir the solution for 24 h. Check the completion of chelation reaction with analytical HPLC (Methods E and F in Table 1). Purify the final product from excess of Eu ions using SPE with a C-18 Sep-Pak™ cartridge (see Note 15).
The following procedure provides flexibility in assembly of DOTA chelate to either terminus of the peptide or within the peptide backbone, in contrast to many other procedures that label DOTA to the N-terminus of the peptide. Further, various DOTA deriva-tives have been described in the literature for various imaging needs/properties. The synthesis below provides a representative template for making such DOTA contrast agents, in this case with a derivatized glycine for the PARACEST effect.
1. Prepare Z-Gly(Br)-OMe (methyl 2-(benzyloxycarbonyl-amino)-2-bromoacetate) as follows (35): combine an equimo-lar ratio of benzyl carbamate and glyoxylic acid monohydrate in diethylether for 7 days. Filter the precipitate and use the crude product for further reaction. Add 0.5 mL of concen-trated sulfuric acid to an ice-cooled solution of 3 g of N-(benzyloxycarbonyl)-a-hydroxyglycine in anhydrous meth-anol (50 mL). Allow the reaction to warm to room tempera-ture and stir for 2 days. Quench the reaction with ice-saturated NaHCO3 and extract with EtOAc (3×), dry the pooled organic phase over Na2SO4, filter, and concentrate in vacuo to obtain N-(benzyloxycarbonyl)-a-methoxyglycinate. To a sus-pension of the latter in chloroform, under a N2 atmosphere, add 3 eq of phosporus tribromide. Stir the reaction for 7 days. Concentrate the reaction mixture in vacuo and triturate with dry pentane for 24 h. Filter the reaction mixture to obtain the final racemic product, Z-Gly(Br)-OMe (see Fig. 10).
2. Add 3 eq of tert-butyl 2-bromoacetate and 6 eq of trieth-ylamine to selectively trialkylate cyclen in chloroform to give compound 23 (36).
3. Prepare a suspension of Z-Gly(Br)-OMe (2.66 g, 8.8 mmol), compound 23 (4.52 g, 8.8 mmol), and K2CO3 (12.02 g, 88 mmol) in 100 mL of dry acetonitrile and heat to 60°C
3.5. Synthesis of Peptidyl-PARACEST MRI Agents

111Fluorescent and Lanthanide Labeling for Ligand Screens, Assays, and Imaging
for 6 h. Remove solids by filtration, and evaporate the solvent to obtain compound 24 in 83% yield.
4. Dissolve compound 24 (5.15 g, 7.0 mmol) in 50 mL of abso-lute ethanol, and add a dispersion of 10% Pd/C (1.4 g, 1.3 mmol). Hydrogenate the reaction mixture for 4 h at 40 psi. Remove the catalyst and solvent to obtain compound 25 in quantitative yield.
5. Compound 26 can be prepared from 25 by use of Fmoc-Cl with zinc dust. Add activated zinc dust (100 mg) to a solu-tion of 25 (6.6 mmol) in 20 mL of anhydrous acetonitrile. The reaction mixture attains a neutral pH. Add a solution of Fmoc-Cl (1.78 g, 6.6 mmol) in 5 mL of acetonitrile in one portion and stir the reaction mixture for 20 min. Wash the dibenzofulvene with diethyl ether and dry the product to yield a white solid 26 (87%).
6. Deprotect tert-butyl ester from compound 26 using 95% TFA in DCM for 4 h, producing a quantitative yield of a pale yellowish compound 27.
Fig. 10. Synthesis of a peptidyl-PARACEST MRI contrast agent.

112 Josan et al.
7. Couple compound 27 (3.63 g, 5.54 mmol, 1.5 eq) to the Wang resin (4 g, 3.72 mmol; initial resin loading: 0.93 mmol/g) using the HBTU procedure overnight (see Subheading 3.1, step 3). Wash the resin with NMP (3×), DCM (3×), then treat with 50% tert-butanol in DCM for 2 h. Wash the resin again with DCM (3×), then acetylate (3 mL of acetic anhydride in 50 mL DCM for 20 min) to cap unre-acted hydroxyl groups. Determine the resin loading using a Fmoc release method (0.41 mmol/g; 71% in this case), or using a picric acid titration, correcting for the effect of ter-tiary amines on DOTA (0.44 mmol/g; 76% with this method) (see Note 16).
8. Assemble the Z-GGR peptide onto the a-amino group of the resin-bound DOTA resin 28 using the solid-phase synthesis procedure listed in Subheading 3.1. Perform the last cou-pling reaction with Z-Gly-OH to gain the Z-peptidyl-resin. Finally, cleave the peptide from the resin with 95% TFA in DCM, yielding white solid (1.2 g, 1.4 mmol, 88% vs. amine contents on the resin).
9. To chelate the final product 7, add 1 eq of Tm(III) triflate to peptidyl-DOTA in acetonitrile and stir the solution at 50°C for 12 h. Maintain a neutral pH during the chelation by peri-odically adding DIEA. Raise the pH to 9–10 with concen-trated NaOH to precipitate free lanthanide ions, which then can be removed by filtration. Lyophilize the final product to yield 7 as a fluffy powder.
This procedure is described to produce a contrast agent with a high molar ratio of contrast moiety on the biocompatible nanocarrier. For the specific PARACEST application, the use of Gly on DOTA further increases the high molar ratio of amide groups, while also acting as a spacer between albumin and the contrast moiety.
1. Dissolve ethyl glycinate hydrochloride (H-Gly-OEt ⋅ HCl, 14 g, 0.1 mol) and pyridine (20 mL, 0.25 mol) in DCM, and cool the solution to 0°C. Add 2-bromoacetyl bromide (10.5 mL, 0.12 mol) in dropwise manner for 1 h and stir for 3 h at 0°C followed by 1 h stirring at room temperature. Wash the solution with 1 N HCl (150 mL × 3), water (150 mL × 2), and brine (150 mL × 2) sequentially, and dry in vacuo to give N-(2-bromoacetyl) ethyl glycinate.
2. Couple N-(2-bromoacetyl) ethyl glycinate (9.19 g, 41 mmol) to cyclen (1,3,5,7-tetraazacyclododecane, 1.72 g, 10 mmol) in the presence of K2CO3 (11.06 g, 80 mmol) in acetonitrile. Heat the reaction to 70°C for 6 h under N2 purging. Cool the solution to room temperature and remove any undissolved materials by filtration. Evaporate the solvent to obtain DOTA-Gly4-OEt (7.40 g, quantitative yield).
3.6. Synthesis of PARACEST-Labeled Albumin
3.6.1. Synthesis of DOTA-Gly4 (see Fig. 11)

113Fluorescent and Lanthanide Labeling for Ligand Screens, Assays, and Imaging
3. In order to hydrolyze the ester from DOTA-Gly4-OEt, adjust the pH to ~11 with 1 N NaOH solution in ethanol/water (1:1), and heat at 60°C for 1 h. Trace the reaction with TLC to verify the reaction completion after 1 h. Acidify the cooled reaction mixture to pH 3 with 1 N HCl. Lyophilize the prod-uct and purify with ion-exchange chromatography using Amberlite® XAD-1600 (eluent: water, 5.04 g, yield: 80%).
1. Dissolve DOTA-Gly4 (633 mg, 1 mmol) in 5 mL of water (pH 6.5) at 60°C. Add YbCl3 (273 mg, 1 mmol) in 3 mL of water dropwise for 1 h and adjust the pH to 7.5 with 0.1 N NaOH. Stir this solution for 12 h at 60°C and adjust to pH 7.5 whenever the pH drops below 5.
2. Cool the reaction mixture to room temperature and adjust the pH to 10 to precipitate the residual lanthanides in a lan-thanide–hydroxide complex. Remove this precipitate by filtration.
3. Evaluate the final product for the presence of free lanthanide ions with an Arsenazo III color test (see Note 17). If free lanthanide ions are present, repeat the previous steps. If free lanthanide ions are absent, lyophilize the final product (755 mg, yield: 94.5%).
1. Dissolve 400 mg of Yb-DOTA-Gly4 (0.5 mmol), 0.15 g EDC, and 30 mg of NHS in 5 mL of MES (2-morpholino-ethanesulfonic acid) buffer (pH 5) and stir at 4°C for 1 h.
2. Dissolve HSA (0.34 g) in MES buffer in an ice bath with stirring.
3.6.2. Lanthanide Complexation (Yb-DOTA-Gly4 )
3.6.3. Yb-DOTA-Gly4 Conjugation to Human Serum Albumin (HSA)
Fig. 11. Synthesis of a PARACEST-labeled albumin 8.

114 Josan et al.
3. Add the activated Yb-DOTA-Gly4-EDC adduct in a dropwise manner to the HSA solution for 30 min. Stir the solution for 6 h. Dialyze the product by adding the solution of labeled HSA to cellulose membrane tubing with a molecular weight cut-off of 5,000, immersing the tubing in a larger container of water (with at least a 1:20 ratio of tubing volume to con-tainer volume) and gently stirring the water and tubing in the container.
4. Lyophilize the dialyzed solution to obtain (Yb-DOTA-Gly4)n-HSA as white fluffy solid (0.63 g, yield: 79%).
5. The coupling efficiency (the ratio of Yb-DOTA-Gly4:HAS) can be measured with MALDI-mass spectrometry and compared with MALDI-MS results with unlabeled HSA as a control. Typical coupling efficiencies range from 8 to 15 Yb-DOTA-Gly4 labels per HSA.
The protocols below provide a comprehensive methodology to screen ligands on whole cells using DELFIA technology. DELFIA methods have been widely employed to study receptor binding of ligands labeled with DTPA derivatives. These lanthaligands can be employed for both saturation binding (direct read-outs) and com-petitive binding schemes (indirect read-outs). Further, examples from our recently modified DELFIA protocol for DOTA-labeled ligands (a stronger chelator than DTPA) are also described.
1. Grow cells in T75 sterilized flasks containing 250 mL SCS media and incubate at 37°C with 5% CO2. At 90% cell conflu-ency (determined by microscopy), split the cells for passage or harvest for plating into 96-well plates. Aspirate the growth media and cover the cells with 2 mL of trypsinization solution for 2–5 min at 37°C to detach the cells from the plastic sur-face (see Note 18). Add 5 mL of cell culture medium to stop the trypsin digestion, and transfer the cell containing media to 15 or 50 mL falcon tubes. Collect the cells by centrifuga-tion for 3 min at 750 × g, followed by aspirating the media and replacing it with 5 mL of fresh cell culture media (see Note 19). Detach cells from each other by gentle pipetting. Count the cell density on a hemocytometer. For passage, dilute the media to about 1 × 10⁵ cells/mL of media and then transfer to a sterile T75 flask. Change the media every third day or as per cell requirement (see Note 20). For plating in 96-wells, dilute the cell containing media to 200,000 cells/mL.
1. Plate cells in black Costar 96-well plates (white translucent walls and bottom) at a density of 20,000 cells/well by adding 100 mL of cell containing culture media. Incubate the cells at 37°C and under 5% CO2 atmosphere for 3 days, and monitor for growth and morphology by light microscopy (see Note 22).
3.7. Lanthanide-Based Cell Binding Assays
3.7.1. Plating Cells
3.7.2. Saturation Binding Assay Using Eu-DTPA Ligand 1 on CHO/dOR Cells (see Note 21)

115Fluorescent and Lanthanide Labeling for Ligand Screens, Assays, and Imaging
2. Prepare requisite dilutions of the Eu-DTPA ligand 1 in bind-ing buffer in a deep well dilution plate. For initial assay, a concentration range of 10−5 to 10−12 M can be used. Make dilutions across a row (e.g., from A12 to A1, right to left) and repeat in eight rows from A to H using an 8-channel micropi-pette. For instance, for a 1:3 dilution scheme, add 200 mL of binding buffer to each well from A1 to H11 (first 11 col-umns). To the 12th column (A12–H12), add 250 mL of 10 mM ligand solution. Transfer 100 mL of the solution from 12th column wells to 11th column wells, mix properly by aspiration, and continue the dilutions until 1st column is reached (see Note 23).
3. On the day of the experiment, aspirate the cell culture medium from all wells containing cells prior to the addition of the ligand to be tested (see Note 20). Add 50 mL of 20 mM cold competitive ligand (naloxone in this experiment) to rows E–H (to test nonspecific binding), and 50 mL of binding buffer to rows A–D (to test total binding), and preincubate for 15 min at 37°C (see Note 24).
4. Add increasing concentrations of the Eu-labeled peptide (50 mL/well) to all wells, and incubate the cells again for 1 h at 37°C.
5. Gently aspirate the ligand-containing binding buffer using a vacuum manifold, without disturbing the cell monolayer (see Note 20).
6. Wash each well three times with 100 mL of wash buffer by adding buffer to each well and immediately removing by vacuum aspiration.
7. Add the enhancement solution to the wells (100 mL/well) and incubate the plates for at least 30 min at 37°C.
8. Read the plates on a Wallac VICTOR3 instrument using the standard Eu time-resolved luminescence (TRL) measurement (340 nm excitation, 400 ms delay, and emission collection for 400 ms at 615 nm).
9. Analyze the data with GraphPad Prism or other appropriate software using nonlinear regression analyses (Fig. 4).
1. Follow steps 1–6 in Subheading 3.7.2, with a modification of the cold ligand (100 mL of NDP-a-MSH, ligand 5, in this case). Then follow the procedure for the detection of DOTA-bound Eu(III) as follows.
2. Following ligand incubation and washings (Subheading 3.7.2, step 6), add 50 mL of 2.0 M HCl to each well and incubate the plate at 37°C for 2 h.
3. Neutralize the acidic solution with addition of 55 mL of 2.0 M NaOH to each well. Subsequently, add 115 mL of the
3.7.3. Saturation Binding Assay Using Eu-DOTA Ligand 6 on HEK293/hMC4R Cells

116 Josan et al.
DELFIA enhancement solution to each well (see Note 25), followed by incubation for 30 min at 37°C.
4. Perform the Eu TRF measurements and analysis as described above.
1. Competitive binding assays can be performed using variable concentrations of nonlabeled ligand and a fixed concentra-tion of Eu-DOTA (or Eu-DTPA)-labeled ligand, using oth-erwise identical assay conditions provided above. In a 96-well plate format, two assays (of the same or different ligands) can be performed with rows A–D and E–H (quadruplicate mea-surements for each).
2. Prepare the dilutions of the nonlabeled ligand in binding buffer and concentrations ranging from 1 × 10⁻⁵ to 1 × 10⁻¹² M, in an identical fashion as described in Subheading 3.7.2, step 6 above (also see Note 23), taking note of the fact that each concentration will be halved upon addition of Eu-labeled ligand during the assay.
3. The choice of concentration for the Eu-labeled ligand is based on its Kd value and the sensitivity of the DELFIA (see Note 26). For Eu-DOTA-labeled NDP-a-MSH, 10 nM concen-tration can be used for adequate signal/noise ratio. Thus, prepare 20 nM of ligand 6 in binding buffer considering the 1:1 dilution during the assay.
4. Aspirate the cell culture medium and add 50 mL of nonla-beled ligand (“cold”) dilution, followed by addition of 50 mL of 20 nM Eu-DOTA-labeled ligand 9 (“hot”) to each well (see Note 24).
5. Incubate the plates at 37°C for 1 h under 5% CO2. 6. Follow the above detailed wash steps and Eu(III) count
measurement protocols (see Subheadings 3.7.2 and 3.7.3). (If DTPA-labeled ligand is used instead, the extra acidifica-tion and neutralization step is not necessary; follow Subheading 3.7.2.)
1. Split the cells from 75 mm culture flasks in 3 mL, and place 100 mL of the suspension onto the center of a 25 mm round #1 coverslip housed in a well of a 6-well plate.
2. After approximately 30 min, add 5 mL of fresh incubation media to each well, and maintain the cells under CO2-controlled incubator until the cover-slips are 40–60% confluent.
3. Dilute an aliquot of the labeled (Cy5) ligand into 0.5 mL of HBSS to make a solution that is 2× the final required concen-tration (see Note 27).
3.7.4. Competition Binding Assay of Ligand 5 Using Eu-DOTA Ligand 6 on HEK293/hMC4R Cells
3.8. In Vitro Single Cell Imaging

117Fluorescent and Lanthanide Labeling for Ligand Screens, Assays, and Imaging
4. Remove a single coverslip and place it into a chamber held at 37°C on the stage of the microscope (3, 30), and add 0.5 mL of a HBSS (see Subheading 2.3 for materials).
5. Acquire several images at equally spaced intervals (~ every 3 min) to provide a background for subsequent subtraction following addition of the labeled ligand.
6. Add 0.5 mL of the solution containing the 2× ligand media to the incubation chamber.
7. Acquire images at regular intervals (see Notes 28 and 29). 8. Remove the ligand-containing media after 2–3 min, and
replace it with 1 mL of media without the ligand to decrease out-of-cell background.
9. Continue to acquire images at regular intervals.
This procedure is intended to correlate the detected PARACEST effect with concentration of the agent, in order to establish a cali-bration that can be used for in vivo studies. The calibration estab-lishes the minimum concentration for detection of the agent during in vivo studies. To perform PARACEST MRI studies with biochemical solutions:
1. Place the solutions in multiple 200 mL PCR tubes, and posi-tion the tubes in a customized cradle in a vertical orientation.
2. Insert the cradle into a horizontal-bore MRI magnet. 3. Acquire the MR image slices in a coronal orientation to show
the contents of each tube as a filled circle that has a minimal surface-to-volume ratio, in order to minimize magnetic field susceptibilities within the image of each solution (37).
Research with animal models must be conducted with the highest standards of care. This procedure has been devised to ensure these standards, and improve the reproducibility of results among greatly variable in vivo conditions (37).
1. To ensure the safety of the mouse, secure the mouse to a cus-tomized sled with masking tape. This type of tape ensures that the mouse is immobilized without compromising the long-term health of the mouse.
2. Attach the respiration, ECG, and temperature probes to the mouse to monitor physiology. Changes in respiration rate are often the first sign of physiological changes during the MRI study. Monitoring and maintaining core body tempera-ture and ECG are essential for ensuring hemodynamic consistency.
3.9. In Vitro PARACEST MR Imaging
3.10. Preparation for In Vivo PARACEST MR Imaging

118 Josan et al.
3. Position the mouse and sled in a customized cradle, and place the latter into an MRI magnet.
4. Warm an anesthetized mouse with either an electrical pad, a water pad, or a heat lamp, and/or with warm air until the core body temperature is at least 37°C.
5. Warm the tail with hot water (45–50°C) or hot air, or tempo-rarily coat it with Oil of Wintergreen to dilate the tail veins. Installation of a catheter in the tail vein is facilitated by first dilating the veins with heat or a vasodilator.
6. Insert a catheter (consisting of a 0.5-in., 27 g needle attached to PE20 tubing) into a tail vein prior to inserting the mouse into the magnet (37) (also see Note 30).
7. Apply a temporary tourniquet to the base of the tail to retain high blood volume in the tail veins. This tourniquet can be constructed by inserting both ends of the PE20 tubing in a syringe without a plunger and then reinserting the plunger into the syringe to hold the tubing in place, with a loop of tubing protruding from the needle-end of the syringe and the two tubing ends protruding from the plunger end of the syringe.
8. Verify that the catheter is patent, and then secure the catheter to the tail with suture ties and/or tape. The tubing is designed to hold a solution of contrast agent near the catheter needle and should be long enough to stretch from the center of the MRI magnet to a place outside the magnet where a blunt-needle syringe can be connected to the tubing. Small ~2 mL air bubbles can be used to separate the contrast agent solu-tion in the PE20 tubing from the rest of the tubing, but oth-erwise the tubing should be devoid of air to prevent cardiac arrest upon injection of the tubing contents into the mouse.
9. Acquire preinjection images, and then inject the contrast agent into the mouse through the tail vein catheter. No more than 300 mL of fluid should be injected into the mouse (smaller injections volumes are preferred), and no faster than 10 mL/s.
Prepend a period of selective saturation to a standard MRI acqui-sition scheme as described previously (38). A saturation power of 20 mT provides sufficient power to generate a strong chemical exchange saturation transfer (CEST) effect while minimizing sample heating. When the T1 MR relaxation time of the sample with the contrast agent is greater than 1 s, then a saturation time period ³2 s and a multiple-echo acquisition scheme provide a good CEST detection in a reasonable experiment time. If the T1 MR relaxation time is less than 1 s, then a saturation time period £300 ms and a single-echo acquisition scheme provide a good
3.11. Acquisition of PARACEST MR Images

119Fluorescent and Lanthanide Labeling for Ligand Screens, Assays, and Imaging
CEST detection within a practical time frame. Three methods may be employed to measure CEST as follows:
1. Selectively saturate the MR frequency of the exchangeable proton of the PARACEST agent (+w relative to the MR fre-quency of water that is conventionally defined to be 0). Then selectively saturate the opposite MR frequency (−w) as a con-trol. Calculate the percent decrease in MR water signal with saturation at +w relative to saturation at −w. This method works well for static biochemical solutions that have negligi-ble magnetic field susceptibilities (39).
2. Selectively saturate the +w MR frequency before and after injecting the contrast agent. Calculate the percent decrease in MR water signal after injection relative to before injection. This method works well for in vivo studies with negligible magnetic field susceptibilities and negligible changes in T2* relaxation times following the injection (37).
3. Selectively saturate a series of MR frequencies to acquire a Z-spectrum (a.k.a. a CEST spectrum). This series of MR fre-quencies ranges beyond +w and −w to ensure that the full spectrum has been acquired. Then analyze the CEST spec-trum using line-fitting methods to measure the percent decrease in MR water signal. This method works well for samples with magnetic field susceptibilities (in which the MR frequency of water is not necessarily at 0 ppm) or those have dynamic changes in T2* relaxation times during the experiment (25).
1. Terminology: Theranostics (var. theragnostics) – The term denotes the fusion of therapeutics and diagnostics, an emerg-ing trend in healthcare management. Recent progress in tar-geted therapies will provide individualized medicines in the future according to the genotype-–phenotype of the patient and the underlying pathology (pharmacogenomics). The key is to identify patients who respond or do not respond (or adversely respond) to a treatment, monitor the response to a treatment, and determine the most effective, nontoxic drug dosage for a given patient. In this context, in vivo diagnostic imaging is being combined with therapy to provide rational therapeutic choices for individual patients. Lanthaligands (40) – The term has been used here to denote lanthanide-chelate labeled ligands such as Eu-DTPA, Gd-DOTA, etc., which is suitable for diagnosis, therapy, or for research-oriented biomolecular studies.
4. Notes

120 Josan et al.
2. This is usually accomplished with a buffered solution containing a polyanion (typically a polyacid such as nitrilotriacetic acid to dissociate the lanthanide from the chelate), an enhancer reagent, i.e., a fluorophoric antenna for excitation (such as 2-naphthoyltrifluoroacetone), and a synergistic detergent to enhance fluorescence by forming micelles and shielding the complex from water (typically a Lewis base such as trioc-tylphosphine oxide, TOPO) (10, 41, 42).
3. The introduction of a time delay (say 400 ms) prior to detec-tion of the emitted light eliminates the interference from light scattering and autofluorescence. This greatly enhances the signal/noise ratio with further signal amplification by multi-ple read-outs, thus increasing the reliability of detection and monitoring during automated HTS.
4. A cradle can hold multiple 200 mL PCR tubes in a vertical orientation in a horizontal-bore MRI magnet. An MR image slice in a coronal orientation can show the contents of each tube as a filled circle that has a minimal surface-to-volume ratio, which minimizes magnetic field inhomogeneities within the image of each solution.
5. The BB on-resin color test was used to monitor the progress of amino acid coupling reaction (32). Add a few drops of 0.01% w/v solution of BB in N,N-dimethylacetamide to 0.2 M solution of HOBT/DMF (yellow color is produced). Inject the solution into the syringe reactor containing resin, stir for few seconds when a dark blue color develops, and wash with DMF to remove excess BB. Free amino groups yield blue color to beads and remove yellow color from solu-tion. The blue resin beads turn yellow as the coupling pro-ceeds (no basic amino groups available). Note that if the resin contains a trace of base (e.g., DIEA), the resin cannot be properly colorized and the solution turns blue. Therefore, this method cannot be used for HBTU/base coupling proto-cols. For quantitative determination of coupling efficiency, perform a Kaiser test by heating a few resin beads to 100°C for 2 min with a mixture of one drop each of Reagent A (40 g phenol in 10 mL of dry ethanol), Reagent B (0.2 mM KCN in pyridine; dilute 2 mL of 10 mM aq. KCN stock solution in 100 mL of pyridine), and Reagent C (6% w/v of ninhydrin in ethanol). An intense blue color is generated with free primary amines, and a slight yellow coloration appears when the cou-pling is complete (level of sensitivity: 1 mmol/g resin » 99.5% coupling).
6. If a Domino block is not available, fill the syringe with DCM up to the full capacity of the reactor, then puncture with a stainless steel needle close to the orifice but in front of the piston. Remove the solvent with a stream of argon, preferably

121Fluorescent and Lanthanide Labeling for Ligand Screens, Assays, and Imaging
in a vertical position. When the needle is removed, the syringe can still function as a reactor because the puncture is outside of the piston’s working range.
7. The reaction of DTPA dianhydride with free N-terminus of peptides has to be carried out in DMSO. DTPA dianhydride is sparingly soluble in organic solvents, except in DMSO and DMF. However, DMF leads to severe side reactions, espe-cially when trace impurities of dimethylamine are presented. Therefore, the resin must be washed with DMSO prior to reaction, and all postreaction washings should be without DMF. Use THF, 20% aq. THF, 10% DIEA and 10% water in THF, and 20% aq. THF for hydrolysis. Finally wash with THF and DCM and dry the resin in vacuo. If DTPA dianhydride is insoluble at 0.6 M concentration in DMSO after rigorous stirring even at 80°C, the dianhydride is likely decomposed resulting in inefficient coupling. Therefore, store DTPA dian-hydride stock under argon to minimize decomposition.
8. It is absolutely imperative to vigorously agitate the resin when the DTPA reagent mix is added. Initial attempts led to high content of peptide head-to-head dimer cross-linked by DTPA. Therefore, the DTPA reaction was optimized, and the side reaction was suppressed by vigorous agitation, selection of leaving group (HOBt = HONSu = HOCt < anhydride), nature of resin (Tentagel < PS/DVB), lower resin substitution (0.6 < 0.2 » 0.1 mmol/g), higher DTPA concentration, and higher DTPA stoichiometry (up to 20-fold excess). The lower ratio of HOBt/DTPA (such as 1 eq each) and higher tem-perature did not suppress this side reaction. Optimized con-dition did not eliminate this side reaction completely, but suppressed it to a reasonable level ~5%. Antiparallel DTPA-dimer can be efficiently separated with SEC (Sephadex G25, 1.0 M aq. acetic acid).
9. The detailed procedures for solution-phase disulfide forma-tion in peptides have been reviewed before (43). Alternatively, the on-resin oxidation can be carried out prior to the Aloc deprotection and DTPA coupling step (44, 45). However, this alternative approach is limited to peptides that do not need thiol scavengers during acidic cleavage (e.g., peptides not containing Trp, Arg, etc.).
10. Europium chelation: Europium chelation to DTPA is relatively fast (~4 h). However, Eu-DOTA chelation is quite slow and needs 12–48 h. In either case, the completion of chelation reaction must be verified with analytical HPLC using a rela-tively basic solvent system (such as Method E in Table 1; cf. TFA system). A TFA-based gradient should be avoided as it results in removal of the metal from the chelate. Also, note that the amount of EuCl3 salt required in the described procedures

122 Josan et al.
is usually very small and can be conveniently handled by first dissolving an easily weighable quantity in 1–5 mL of solvent and adding an appropriate aliquot of it to the reaction.
11. The coupling of Boc-Dmt-OH with an unprotected side chain (free phenol) leads to limited oligomerization. Up to four Dmt oligomers can be noticed in MS with decreasing intensities. However, the formed phenolic esters can be read-ily cleaved with 50% piperidine in MeOH:DCM (1:4). In this particular sequence, Boc-Dmt-Tic-Lys, the extent of oli-gomerization is relatively high because of stronger coupling condition (HBTU/DIEA) needed for the sterically hindered secondary amine of Tic.
12. For ease in handling of costly Cy5 dyes, dissolve the stock amount (usually 5 mg) in 5 mL of water or 20% acetonitrile/water mixture, aliquot them into 1 mL (or as appropriate) vials, and lyophilize and store them under argon for later use. For Cy5 coupling in the cited example, weigh 1.3 eq of Cy5-NHS ester or use the aliquot as directed above. Add 1.1 eq of dye to the reaction and stir it for 1 h. Run an analytical HPLC on a small amount. If unreacted starting material is noticed, add additional 0.2 eq of dye. Repeat until full conversion is obtained. Typically, the conjugation is fairly rapid and reacts to completion within an hour of addition of the dye to the free amine of ligand.
13. Avoid the use of a base during diglycolic anhydride reaction because a diglycolic imine can be formed that terminates the peptide elongation on the resin.
14. It was noticed that the usually recommended 1–3% TFA con-centration for cleavage of Mmt group was insufficient to deprotect lysine side chain in the htBVLs, resulting in par-tially unprotected peptides (~25% still Mmt-protected). This can be checked by acetylating the free amine groups of lysine followed by cleavage of the peptide from resin and comparing the HPLC chromatogram of acetylated and unacetylated peptide products.
15. Before loading the peptide on the C-18 Sep-Pak cartridge, dilute the 1 mL solution with 50 mL of water. This is done to reduce the DMSO concentration to less than 5% and thus prevent elution of peptide from the column.
16. To measure the loading of an amine-derivatized DOTA on the resin, remove the Fmoc group from the amino group and measure the Fmoc concentration spectrophotometrically (46). Alternatively, perform a picric acid titration by treating the amine-containing resin with picric acid to form an adduct between the picrate and the amines. After washing to remove excess picric acid, treat the resin with a base to release the picrate from the amine groups and measure the concentration of the picrate spectrophotometrically (47).

123Fluorescent and Lanthanide Labeling for Ligand Screens, Assays, and Imaging
17. Perform an Aresenazo (III) dye test to detect the presence of free lanthanide ions (48). Add a few drops of the chelation product to a ~0.2 mL volume of 25 mM Arsenazo (III) in 2 mM-Tris/1 mM-acetate buffer. Measure absorbance at 655 nm to quantify the concentration of free lanthanide ions at concentrations of ³20 mM. A qualitative visual change from red/pink to blue/aqua indicates the qualitative presence of free lanthanide ions. The absence of absorbance at 655 nm or the absence of a color change indicates that free lanthanide ions are present at <20 mM. Alternatively, a similar spectro-photometric test with xylenol orange can be conducted, although xylenol orange is more sensitive to variations in physiological pH and the presence of cations (49).
18. Addition of too much trypsin can inhibit the cell attachment to the wells or cover-slips. The time required for the detach-ment of cells from the flask depends on the cell type.
19. The volume of the culture media used to suspend the cells can be adjusted depending on cell confluency.
20. HEK293 cells are weakly adherent and all medium changes should be performed with extreme care and minimal agita-tion. If vacuum aspiration (adjust suction to as low as possi-ble) removes the adherent cells, manual pipetting can be used instead. This precaution should be taken until the ligand incu-bation and washings (Subheading 3.7.2, step 6) during the assay have been completed when no additional buffer remov-als are needed. The cells are likely compromised after this stage when the enhancement solution (acidic pH) is added.
21. All binding assays were carried out in quadruplicate, unless otherwise noted.
22. For observing cell growth and morphology and evaluating confluency, use a 96-well plate with clear bottom (with trans-lucent white walls) for binding assays, or a separate 96-well clear plate for better visualization (plate a sample row).
23. For initial assays, a general range of 10−5 to 10−12 M ligand concentration is appropriate. Alternative 1:2 or 1:4 dilution scheme, instead of the 1:3 dilution scheme described, can be used to increase or decrease this range. Once hysteresis is established, narrow the concentration range (e.g., 0.1–100 nM) in follow-up assays for more conclusive results. While preparing dilutions, take note of the fact that each ligand concentration will be diluted in half during addition to the plate (with either 50 mL of binding buffer or cold ligand for saturation binding assay; and 50 mL of labeled ligand for competition binding assay).
24. Disposable polystyrene reagent reservoirs (Cole Parmer) can be used for multipipetting stock solutions and binding buffers during the assay. For example, for saturation binding assay,

124 Josan et al.
prepare 6 mL of 20 mM cold ligand, and using a 12-channel pipette, add 50 mL of ligand to each well (one row at a time).
25. Neutralization must be tested using 2.0 M HCl and 2.0 M NaOH before using them in binding assay protocols (with Eu(III)-DOTA-labeled peptides) as the detection of Eu ions cannot be accomplished at pH less than 2. Extreme care must be taken during the neutralization and enhancement steps to prevent the contamination among wells. It is recommended to use fresh micropipette tips during each reagent transfer.
26. For competition binding assays, it is best to keep the concen-tration of labeled ligand as low as possible (well below Kd), while binding no more than 20% of the ligand (ideally, below 10% to minimize ligand depletion effects). Since the nonspe-cific background usually increases linearly with concentration, this is necessary to keep an adequate signal/noise (S/N) ratio (~4–10) to generate data of good precision.
27. A larger volume of ligand stock solution can be made at the appropriate concentration if multiple experiments are to be performed.
28. As shown in Fig. 2, binding occurred rapidly with substantial internalization within 3 min. The ligand was fully internalized within 10 min. A standard time course for image acquisition should be selected to allow for combination of data from multiple experiments over the full time course.
29. An acquisition time should be selected that provides a signal/background of at least 2.5:1, based on initial image sets acquired at the selected ligand concentration.
30. The MRI study must be conducted by acquiring the images before and after administration of the contrast agent. The mouse must not be moved before and after to facilitate the comparison of images. A catheter is installed in the tail vein for administering the contrast agent while the mouse is inside the MRI scanner.
Acknowledgments
The authors would like to thank Prof. Robert J. Gillies and his team for development of various cell lines and animal model for dOR tumor animal model described in this work. This work was supported by the National Cancer Institute through NIH Grant R21CA133455-01, R01 CA09736, and R01 CA 123547, and by the U.S. Army Medical Research and Materiel Command under W81XWH-04-1-0731. This work was also supported by the Northeastern Ohio Animal Imaging Resource Center, an NIH-funded program, R24CA110943.

125Fluorescent and Lanthanide Labeling for Ligand Screens, Assays, and Imaging
References
1. Josan, J. S., Vagner, J., Handl, H. L., Sankaranarayanan, R., Gillies, R. J., and Hruby, V. J. (2008) Solid-phase synthesis of heterobivalent ligands targeted to melanocor-tin and cholecystokinin receptors. Int J Pep Res Ther. 14: 293–300.
2. Vagner, J., Xu, L., Handl, H., Josan, J. S., Morse, D. L., Mash, E. A., Gillies, R. J., and Hruby, V. J. (2008) Heterobivalent ligands crosslink multiple cell-surface recep-tors: the human melanocortin-4 and delta-opioid receptors. Angew Chem Int Ed. 47: 1685–1688.
3. Xu, L., Vagner, J., Josan, J., Lynch, R. M., Morse, D. L., Baggett, B., Han, H., Mash, E. A., Hruby, V. J., and Gillies, R. J. (2009) Enhanced targeting with heterobivalent ligands. Mol Cancer Ther. 8: 2356–2365.
4. Sokolov, K., Follen, M., and Richards-Kortum, R. (2002) Optical spectroscopy for detection of neoplasia. Curr Opin Chem Biol. 6: 651–658.
5. Ballou, B., Ernst, L. A., and Waggoner, A. S. (2005) Fluorescence imaging of tumors in vivo. Curr Med Chem. 12: 795–805.
6. Frangioni, J. V. (2003) In vivo near-infrared fluorescence imaging. Curr Opin Chem Biol. 7: 626–634.
7. Sevick-Muraca, E. M., Houston, J. P., and Gurfinkel, M. (2002) Fluorescence-enhanced, near infrared diagnostic imaging with con-trast agents. Curr Opin Chem Biol. 6: 642–650.
8. Mujumdar, R. B., Ernst, L. A., Mujumdar, S. R., Lewis, C. J., and Waggoner, A. S. (1993) Cyanine dye labeling reagents: sulfoindocya-nine succinimidyl esters. Bioconjug Chem. 4: 105–111.
9. Handl, H. L., Vagner, J., Yamamura, H., Hruby, V. J., and Gillies, R. J. (2004) Lanthanide-based time-resolved fluorescence of in cyto ligand–receptor interactions. Anal Biochem. 330: 242–250.
10. Handl, H. L., and Gillies, R. J. (2005) Lanthanide-based luminescent assays for ligand-receptor interactions. Life Sci. 77: 361–371.
11. Pandya, S., Yu, J., and Parker, D. (2006) Engineering emissive europium and terbium complexes for molecular imaging and sensing. Dalton Trans. 23: 2757–2766.
12. Selvin, P. (2002) Principles and biophysical applications of lanthanide-based probes. Annu Rev Biophys Biomol Struct. 31: 275–302.
13. Steinkamp, T., and Karst, U. (2004) Detection strategies for bioassays based on luminescent
lanthanide complexes and signal amplifica-tion. Anal Bioanal Chem. 380: 24–30.
14. Parker, D. (2004) Excitement in f block: structure, dynamics and function of nine-coordinate chiral lanthanide complexes in aqueous media. Chem Soc Rev. 33: 156–165.
15. Thunus, L., and Lejeune, R. (1999) Overview of transition metal and lanthanide complexes as diagnostic tools. Coord Chem Rev. 184: 125–155.
16. Josan, J. S., Morse, D. L., Xu, L., Trissal, M., Baggett, B., Davis, P., Vagner, J., Gillies, R. J., and Hruby, V. J. (2009) Solid-phase synthetic strategy and bioevaluation of a Labeled d-opioid receptor ligand Dmt-Tic-Lys for in vivo imaging. Org Lett. 11: 2479–2482.
17. Handl, H. L., Vagner, J., Yamamura, H. I., Hruby, V. J., and Gillies, R. J. (2005) Development of a lanthanide-based assay for detection of receptor–ligand interactions at the d-opioid receptor. Anal Biochem. 343: 299–307.
18. De-Silva, C. R., Vagner, J., Lynch, R., Gillies, R. J., and Hruby, V. J. (2010) Optimization of time-resolved fluorescence assay for detec-tion of Eu-DOTA labeled ligand-receptor interactions. Anal Biochem. 398: 15–23.
19. Leon-Rodriguez, L. M. D., and Kovacs, Z. (2008) The synthesis and chelation chemistry of DOTA-peptide conjugates. Bioconjug Chem. 19: 391–402.
20. Uusijärvi, H., Bernhardt, P., Rösch, F., Maecke, H. R., and Forssell-Aronsson, E. (2006) Electron- and positron-emitting radi-olanthanides for therapy: aspects of dosimetry and production. J Nucl Med. 47: 807–814.
21. Merbach, A. F., and Toth, E. (2001) The chemistry of contrast agents in medical mag-netic resonance imaging. Wiley, New York.
22. Zhang, S., Merritt, M., Woessner, D. E., Lenkinski, R. E., and Sherry, A. D. (2003) PARACEST agents: modulating MRI contrast via water proton exchange. Acc Chem Res. 36: 783–790.
23. Aime, S., Barge, A., Delli Castelli, D., Fedeli, F., Mortillaro, A., Nielsen, F. U., and Terreno, E. (2002) Paramagnetic lanthanide (III) com-plexes as pH sensitive chemical exchange satu-ration transfer (CEST) contrast agents for MRI applications. Magn Reson Med. 47: 639–648.
24. Yoo, B., Sheth, V., and Pagel, M. D. (2009) An amine-derivatized, DOTA-loaded poly-meric support for Fmoc solid phase peptide synthesis. Tet Lett. 50: 4459–4462.
25. Ali, M. M., Liu, G., Shah, T., Flask, C. A., and Pagel, M. D. (2009) Using two chemical

126 Josan et al.
exchange saturation transfer magnetic reso-nance imaging contrast agents for molecular imaging studies. Acc Chem Res. 42: 915–924.
26. Yoo, B., and Pagel, M. D. (2008) An over-view of responsive MRI contrast agents for molecular imaging. Front Biosci. 13: 1733–1752.
27. Yoo, B., and Pagel, M. D. (2006) A PARACEST MRI contrast agent to detect enzyme activity. J Am Chem Soc. 128: 14032–14033.
28. Yoo, B., Raam, M., Rosenblum, R., and Pagel, M. D. (2007) Enzyme-responsive PARACEST MRI contrast agents: a new biomedical imag-ing approach for studies of the proteasome. Contrast Media Mol Imaging. 2: 189–198.
29. Grieco, P., Lavecchia, A., Cai, M., Trivedi, D., Weinberg, D., MacNeil, T., Van der Ploeg, L. H., and Hruby, V. J. (2002) Structure-activity studies of the melanocortin peptides: discov-ery of potent and selective affinity antagonists for the hMC3 and hMC4 receptors. J Med Chem. 45: 5287–5294.
30. Martinez-Zaguilan, R., Tompkins, L. S., Gillies, R. J., and Lynch, R. M. (1999) Simultaneous analysis of intracellular pH and Ca2+ from cell populations. Meth Mol Biol. 114: 287–306.
31. Edwards, W. B., Fields, C. G., Anderson, C. J., Pajeau, T. S., Welch, M. J., and Fields, G. B. (1994) Generally applicable, convenient solid-phase synthesis and receptor affinities of oct-reotide analogs. J Med Chem. 37: 3749–3757.
32. Krchnák, V., Vágner, J., and Lebl, M. (1988) Noninvasive continuous monitoring of solid-phase peptide synthesis by acid-base indicator. Int J Pept Prot Res. 32: 415–416.
33. Bräse, S., Kirchhoff, J. H., and Köbberling, J. (2003) Palladium-catalysed reactions in solid phase organic synthesis. Tetrahedron. 59: 885–939.
34. Gomez-Martinez, P., Dessolin, M., Guibé, F., and Albericio, F. (1999) Na-Alloc temporary protection in solid-phase peptide synthesis. The use of amine–borane complexes as allyl group scavengers. J Chem Soc Perkin Trans. 1: 2871–2874.
35. Williams, R. M., Aldous, D. J., and Aldous, S. C. (1990) General synthesis of b, g-alkynylg-lycine derivatives. J Org Chem. 55: 4657–4663.
36. Moore, D. A. (2008) Selective trialkylation of cyclen with tert-butyl bromoacetate. Org Synth. 85: 10–14.
37. Ali, M., Yoo, B., and Pagel, M. D. (2009) Tracking the relative in vivo pharmacokinetics of nanoparticles with PARACEST MRI. Mol Pharm. 6: 1409–1416.
38. Liu, G., Ali, M. M., Yoo, B., Griswold, M. A., Tkach, J. A., and Pagel, M. D. (2009) PARACEST MRI with improved temporal resolution. Magn Reson Med. 61: 399–408.
39. Liu, G., Li, Y., and Pagel, M. D. (2007) Design and characterization of a new irrevers-ible responsive PARACEST MRI contrast agent that detects nitric oxide. Magn Reson Med. 58: 1249–1256.
40. Josan, J. S. (2008) Heteromultivalent ligands directed targeting of cell-surface receptors – implications in cancer diagnostics & therapeu-tics. Ph.D. dissertation. The University of Arizona, Tucson.
41. Dakubu, S. (1992) Method of determining a biological substance involving labelling with a metal chelate. US Patent 5,124,268.
42. Wilkinson, D. (1999) A one-step fluorescent detection method for lipid fingerprints; Eu(TTA)3.2TOPO. Forensic Sci Int. 99: 5–23.
43. Albericio, F., Annis, I., Royo, M., and Barany, G. (2000) Preparation and handling of pep-tides containing methionine and cysteine. In: Chan, W. C., White P. D. (eds) Fmoc solid phase peptide synthesis, 1st ed., Oxford University Press, Oxford, pp 77–114.
44. Annis, I., Hargittai, B., and Barany, G. (1997) Disulfide bond formation in peptides. Meth Enzymol. 289: 198–221.
45. Chen, L., Annis, I., and Barany, G. (2001) Disulfide bond formation in peptides. Curr Protocols Prot Sci. 18.16.11–18.16.19.
46. Fields, G. B., Lauer-Fields, J. L., Liu, R., and Barany, G. (1992) Principles and practice of solid phase peptide synthesis. In: Grant, G. A. (ed) Synthetic Peptides: A User’s Guide, 2nd ed., Oxford University Press, Oxford, pp 93–219.
47. Gisin, B. F. (1972) The monitoring of reac-tions in solid-phase peptide synthesis with picric acid. Anal Chim Acta. 58: 248–249.
48. Rowatt, E., and Williams, R. J. (1989) The interaction of cations with the dye Arsenazo III. Biochem J. 259: 295–298.
49. Barge, A., Cravotto, G., Gianolio, E., and Fedeli, F. (2006) How to determine free Gd and free ligand in solution of Gd chelates. A technical note. Contrast Media Mol Imaging. 1: 184–188.