Data-controlled automation of liquid chromatography/tandem ...
9
Data-Controlled Automation of Liquid Chromatography/Tandem Mass Spectrometry Analysis of Peptide Mixtures Douglas C. Stahl, Kristine M. Swiderek, Michael T. Davis, and Terry D. Lee Beckman Research Institute of the City of Hope, Duarte, California, USA The structural characterization of proteins and pep tides isolated in minute quantities re- quires the most efficient use of available sample. A mass spectrometer data system was programmed to continuously evaluate incoming liquid chromatography/mass spectrometry data against a user-defined array of information. The resulting conclusions were used to automatically set and modify acquisition parameters in real time to collect collision-induced dissociation spectra for selected ions (tandem mass spectrometry), This approach has pro- vided a mechanism to target specific subsets of masses in a complex mixture and/or to discriminate selectively against masses that are known or not of interest. Masses of contami- nants or peptide masses derived from known proteins can be automatically recorded and removed from further consideration for collision-induced dissociation analysis. Once recorded, these "libraries" of masses can be used across multiple analyses. This technique directs the mass spectrometer data system to focus on the analysis of masses significant to the user, even if their signal intensities are well below the intensities of contaminating masses. When combined with a database search program to correlate tandem mass spectra to known protein sequences, the identity of the protein can be established unequivocally by using less than 100 fmol of sample. (} Am Sac Mass Specirom 1996, 7, 532-540) I t is axiomatic in the biological sciences that under- standing the function of a protein or peptide re- quires determination of its structure. Unfortu- nately, proteins and peptides of biological interest are often purified in minute quantities and/or as compo- nents of complex mixtures. For this reason, an empha- sis has been placed on increasing the sensitivity of mass spectrometry, chromatography, and Edrnan se- quence analysis for primary structure elucidation. The development of methodologies that directly couple liquid chromatography separations to tandem mass spectral analysis (LC/MS/MS) [1-6] has significantly reduced the sample losses that inevitably occur during multistep characterization procedures. The characteri- zation of a complex mixture typically requires multiple liquid chromatography/mass spectrometry (LC/MS) runs and consumes larger quantities of sample than are required for a single component. A thorough inter- pretation of the collected data for each run is usually necessary to determine how to proceed with the next analysis. This postacquisition evaluation of data often yields information that could have been used to opti- mize the analysis if it had been available in real time. Address reprint fPqllPsts to Or. Terry D. Lee. Division of Immunol- ogy, Beckman Research Institute of the City of Hope, 1450 East Duarte Road, f)uarte, CA 91010 @ 1996 American Society for Mass 5pectrometry 1044 0305/96/$15.00 PH 51044-0305(96)00057-8 We report the development of automated procedures that utilize incoming or previously collected data to control data acquisition. Such "data-controlled" proce- dures greatly increase the efficiency of LC/MS/MS analyses of pep tides in complex mixtures by reducing the amount of sample and time required to perform the analysis. Experimental Methods Mass Spectrometry All mass spectrometry was performed on a Finnigan- MAT (San Jose, CA) TSQ-700 triple quadrupole mass spectrometer equipped with a Finnigan-MAT electro- spray ion source modified for microelectrospray as previously described [7]. The electrospray source was coupled to a gradient capillary high-performance liq- uid chromatography (HPLC) system built by the au- thors [8]. Both the mass spectrometer and the HPLC system were controlled by a Digital Equipment Corp. (Merrimack, NH) DECStation 5000/240 computer run- ning Finnigan lCIS data system software version 7.2. Programs for data acquisition and instrument control were developed by using Finnigan Instrument Control Language (ICL) version 7.27. Copies of the programs are available from the authors. Received October 17, 1995 Revised January 17, 1996 Accepted January 22, 1996
-
Upload
khangminh22 -
Category
Documents
-
view
0 -
download
0
Transcript of Data-controlled automation of liquid chromatography/tandem ...

Data-Controlled Automation of LiquidChromatography/Tandem Mass SpectrometryAnalysis of Peptide Mixtures
Douglas C. Stahl, Kristine M. Swiderek, Michael T. Davis, andTerry D. LeeBeckman Research Institute of the City of Hope, Duarte, California, USA
The structural characterization of proteins and peptides isolated in minute quantities requires the most efficient use of available sample. A mass spectrometer data system wasprogrammed to continuously evaluate incoming liquid chromatography/mass spectrometrydata against a user-defined array of information. The resulting conclusions were used toautomatically set and modify acquisition parameters in real time to collect collision-induceddissociation spectra for selected ions (tandem mass spectrometry), This approach has provided a mechanism to target specific subsets of masses in a complex mixture and/or todiscriminate selectively against masses that are known or not of interest. Masses of contaminants or peptide masses derived from known proteins can be automatically recorded andremoved from further consideration for collision-induced dissociation analysis. Oncerecorded, these "libraries" of masses can be used across multiple analyses. This techniquedirects the mass spectrometer data system to focus on the analysis of masses significant tothe user, even if their signal intensities are well below the intensities of contaminatingmasses. When combined with a database search program to correlate tandem mass spectra toknown protein sequences, the identity of the protein can be established unequivocally byusing less than 100 fmol of sample. (} Am Sac Mass Specirom 1996, 7, 532-540)
It is axiomatic in the biological sciences that understanding the function of a protein or peptide requires determination of its structure. Unfortu
nately, proteins and peptides of biological interest areoften purified in minute quantities and/or as components of complex mixtures. For this reason, an emphasis has been placed on increasing the sensitivity ofmass spectrometry, chromatography, and Edrnan sequence analysis for primary structure elucidation. Thedevelopment of methodologies that directly coupleliquid chromatography separations to tandem massspectral analysis (LC/MS/MS) [1-6] has significantlyreduced the sample losses that inevitably occur duringmultistep characterization procedures. The characterization of a complex mixture typically requires multipleliquid chromatography/mass spectrometry (LC/MS)runs and consumes larger quantities of sample thanare required for a single component. A thorough interpretation of the collected data for each run is usuallynecessary to determine how to proceed with the nextanalysis. This postacquisition evaluation of data oftenyields information that could have been used to optimize the analysis if it had been available in real time.
Address reprint fPqllPsts to Or. Terry D. Lee. Division of Immunology, Beckman Research Institute of the City of Hope, 1450 EastDuarte Road, f)uarte, CA 91010
@ 1996 American Society for Mass 5pectrometry1044 0305/96/$15.00PH 51044-0305(96)00057-8
We report the development of automated proceduresthat utilize incoming or previously collected data tocontrol data acquisition. Such "data-controlled" procedures greatly increase the efficiency of LC/MS/MSanalyses of peptides in complex mixtures by reducingthe amount of sample and time required to performthe analysis.
Experimental Methods
Mass Spectrometry
All mass spectrometry was performed on a FinniganMAT (San Jose, CA) TSQ-700 triple quadrupole massspectrometer equipped with a Finnigan-MAT electrospray ion source modified for microelectrospray aspreviously described [7]. The electrospray source wascoupled to a gradient capillary high-performance liquid chromatography (HPLC) system built by the authors [8]. Both the mass spectrometer and the HPLCsystem were controlled by a Digital Equipment Corp.(Merrimack, NH) DECStation 5000/240 computer running Finnigan lCIS data system software version 7.2.Programs for data acquisition and instrument controlwere developed by using Finnigan Instrument ControlLanguage (ICL) version 7.27. Copies of the programsare available from the authors.
Received October 17, 1995Revised January 17, 1996
Accepted January 22, 1996

J Am Sac Mass Spectrom 1996, 7, 532-540 DATA CONTROLLED AUTOMATION OF LC/MS/MS 533
Precursor mass spectra were collected by scanningthe first quadrupole analyzer from mr: 500 to 2000 in2.5 s. Collision-induced decomposition (CID) production spectra were collected by setting the firstquadrupole analyzer to pass the precursor ion (2-6-uwindow) and scanning the third quadrupole analyzerover the range of m/z 50-2000 in 3.4 s. For bothprecursor spectra and CID product ion spectra, theargon collision gas in the second octupole collision cellwas kept constant at a pressure of 2-3 mtorr. Precursorscanning through a pressurized collision cell attenuated the signal by a factor of 2-3. The collision energywas 17 eV for all data shown. Although the collisiongas pressure and collision energies are not optimumfor all peptides, empirically, these values yield usefulCID spectra for the majority of peptides analyzed. Theresolution of the final quadrupole analyzer was set to1.5-2.5 u.
Automated Data Collection
Precursor ions were selected automatically by the computer based on a user-defined set of criteria. After eachscan, the mass and signal-to-noise ratio (SNR) of thebase peak were determined. SNR was defined as theintensity of a given mass divided by the standarddeviation of the intensity of all signals in the spectrum.If the SNR was below a user-defined threshold, nomasses were selected for CID analysis and the nextscan was acquired (Figure 1). If the SNR prerequisitewas met, the base peak mass was compared with auser-defined list of masses. The list is a floating pointarray that can be both read and updated betweenscans. The user-defined array described in this work isavailable through the UUST view of the Finnigan TSQdata system. ICL programs define the mass list aseither a list of masses to select for CID analysis or a listof masses to reject. If the base peak mass is rejected,the next most intense peak in the spectrum is considered. This process continues until a mass is found thatmeets the criteria for CID analysis or until the SNR ofthe peak under consideration is below the minimumvalue. The real time analysis of each incoming spectrum typically requires 0.5-1.5 s and is proportional tothe number of masses contained in the user list.
For the work presented in this report, two differentcriteria were used to determine how many CID spectrato collect. For the LC/MS runs that analyze the synthetic protein digest and the serotransferrin proteindigest, CID scans were performed as long as the totalion chromatogram (TIC) of the last product ion spectrum exceeded the TIC of the last precursor ion spectrum or until eight CID spectra were acquired for thatmass. At low sample levels, these criteria were notsufficient to distinquish between weak but useful tandem mass spectra and spectra that were largely noise.Recently, we found that spectral reproducibility is amore useful criterion for determination of how longtandem mass spectrometry data collection should con-
S811n..ru....n11orQ1MSprecursor kN'I .c8nnlngwnh com.1on g.. ON
(*) Decisionsmade when
ULlST containsmassesto target
Figure 1. Flow chart for the computer program used for datacontrolled Le/MS/MS analyses of peptide mixtures.
tinue. As long as one of the three most abundantions is the same mass as the base peak in the previousscan, the spectra are considered "similar" and tandemmass spectrometry data collection continues for a userdefined maximum number of scans (generally four toeight).
For the analysis of the protein samples derived fromin-gel digestions, the program was modified to analyzethe first collected CID spectrum for the presence of acharacteristic contaminant "fingerprint." If the mostabundant ion in the mass range below m / z 300 was88, 133, or 175, CID data collection was stopped andthe instrument was reset to collect precursor ion spectra.
Sample Preparation
The endo-Lys C digestion of horse heart cytochrome cwas performed in lOO-mM ammonium bicarbonate,pH 7.8 at an E:S ratio of 1:100 and a substrate concentration of 20 pmol z'u.L, The reaction was incubatedovernight at 37°C. The digest mixture was quantitatedby amino acid analysis and brought to a final concentration of 5 pmol z'p,L in 5% acetic acid for storage.
534 STAHL ET AL. J Am Sac Mass Spectrom 1996, 7, 532-540
The synthetic polypeptide used in this work wassynthesized (Peptide Synthesis Core Facility, City ofHope) for an unrelated project. The sample was digested with trypsin under the same conditions as described in the preceding text. The mixture was notquantitated by amino acid analysis.
The unknown protein sample that was matched tothe sequence for human serotransferrin precursor(SWISS-PROT: locus TRFE~HUMAN, accessionP02787) was isolated by Dr. Steve Akman (City ofHope). The unknown protein sample that was matchedto the sequence for human endoplasmin precursor(SWISS-PROT: locus ENPL_HUMAN, accessionP14625) was isolated by Dr. Jennifer M. Turley (National Cancer Institute, Frederick, MD). In both cases,the investigators had separated the protein by polyacrylamide gel electrophoresis [sodium dodecylsulfate-polyacrylamide gel electrophoresis (SDS-PAGE)]and the protein bands were stained with Coomassieblue. The protein bands were excised and digested insitu with trypsin in accordance with the protocol described by Hellman et al. [9]. The in-gel digestion wascarried out in the presence of the detergent Tween-20at a concentration of 0.1% as described in the protocol.
High-Performance Liquid ChromatographySeparations
On-line separations were performed via a microscaleHPLC system built by the authors [8] by using columnsand procedures previously described [10]. All separations were done by using a packed capillary column6-8 cm long and 100 p,m i.d. Samples were analyzedby using linear gradients from 2 to 92% buffer B [A,0.1% trifluoroacetic acid (TFA) in water; B, 90% acetonitrile, 0.07% TFA in water, v/vl at 100-200 nl.yrnin.Postcolumn UV detection was performed at 200 nmvia an Applied Biosystems 759A UV/VIS spectrophotometer (Applied Biosystems, Inc., Foster City, CA)equipped with a capillary flow-cell holder.
Off-line separation of the peptide mixture obtainedfrom the in-gel digestion of endoplasmin was achievedvia a C18 microcapillary column (0.53 mm i.d., 20 cmlong) packed with 5 p,m Vydac support (SeparationsGroup, Hesperia, CA) [11]. A linear gradient from 2 to90% buffer B in 60 min at 20 p,L/min was used toelute the peptides. Absorbance was monitored at awavelength of 214 nm via a SPD-6A UV/Vis spectrophotometer (Shimadzu, Columbia, MD) equippedwith a modified microflow cell.
Microsequence Analysis
Microsequence analysis of peptides by automated Edman degradation was carried out via the HewlettPackard G1005A protein sequencing system (HewlettPackard, Palo Alto, CA). The sequencing system wasoperated by using standard reagents, solvents, andprograms (routine 3.0) as supplied by the manufac-
turer. The total collected HPLC fraction was loadedonto the hydrophobic half of the biphasic cartridgeafter 1:10 dilution with 2% TFA via the sample loadingstation.
Tandem Mass Spectrometry Data Correlationwith Protein Databases
Tandem mass spectra were correlated with the OWLnonredundant composite protein sequence databaseversion 26.0 using the SEQUEST database searchingprogram [6, 12].
Results and Discussion
Criteria to Change Scan Modes
Data-controlled approaches to LC/MS/MS analysesrequire real time analysis of each incoming spectrum.High-resolution separations of peptide mixtures placesevere constraints on the amount of time available toanalyze individual spectra. Typically, peaks from theliquid chromatography column are 10-30 s wide. Witha typical scan cycle time of 3 s for the quadrupoleanalyzer, a total of 3-10 scans are available to collectdata for each component. Thus, the time spent toanalyze a spectrum prior to making a decision must bekept to a minimum. The simplest approach is to selections for CID analysis based on an intensity or signalto-noise ratio (SNR) value for the most intense ion inthe spectrum. However, most ions of interest are notthe most intense ion in the spectrum during the earlypart of an eluting peak when the decision should bemade to switch modes. Also, many useless tandemmass spectra would be collected for background ionsor ions whose structures are already known. A list ofmasses (designated UUST in Figure 1) to which ions inthe spectrum can be compared greatly increases thedepth of analysis that can be applied to a spectrum. Ifthe sample has been analyzed previously, the list canbe used to designate ions for which fragment ionspectra are to be collected. Because the spectra areanalyzed and ions are selected in real time, the need tohave reproducible retention times for the chromatography is eliminated. Alternatively, the list can be used toexclude ions from consideration. Background ions andions for which the structures are known are ignored.Ions for which tandem mass spectra are collected aregenerally added to the list automatically. This preventscomputer selection of that ion again if it is still intensewhen the precursor mass spectrometry mode is resumed. Also, a list is generated that can be used toexclude ions from consideration in a subsequent run.Analysis times between precursor scans are typically0.5-1.5 s dependent on the length of the list (up to 500masses). If the list of masses is used to exclude ionsfrom tandem mass spectrometry analysis, there existsthe possibility that an ion of interest will not be considered because it has the same mass as a known ion in
JAm Soc Mass Spectrom 1996, 7,532-540 DATA CONTROLLED AUTOMATION OF LC/MS/MS 535
Ac ~I I IGDVEKGKKIFVQKCAQCHTVEKGGKHKTGPNlHGlFGRKTGQAPGFTYTDANKNK
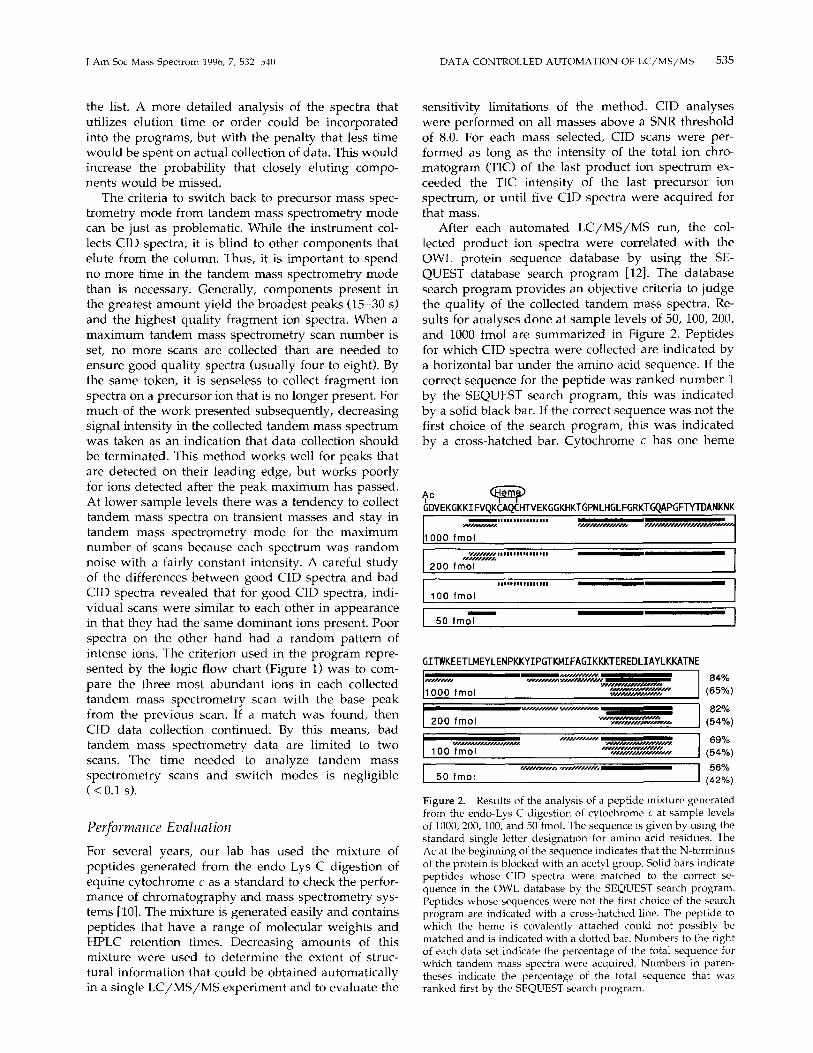
Figure 2. Results of the analysis of a peptide mixture generatedfrom the endo-Lys C digestion of cytochrome c at sample levelsof 1000, 200, 100, and 50 fmol. The sequence is given by using thestandard single letter designation for amino acid residues. TheAc at the beginning of the sequence indicates that the N-terminusof the protein is blocked with an acetyl group. Solid bars indicatepeptides whose CID spectra were matched to the correct sequence in the OWL database by the SEQUEST search program.Peptides whose sequences were not the first choice of the searchprogram are indicated with a cross-hatched line. The peptide towhich the heme is covalently attached could not possibly bematched and is indicated with a dotted bar. Numbers to the rightof each data set indicate the percentage of the total sequence forwhich tandem mass spectra were acquired. Numbers in parentheses indicate the percentage of the total sequence that wasranked first by the SEQUEST search program.
sensitivity limitations of the method. CID analyseswere performed on all masses above a SNR thresholdof 8.0. For each mass selected, CID scans were performed as long as the intensity of the total ion chromatogram (TIC) of the last product ion spectrum exceeded the TIC intensity of the last precursor ionspectrum, or until five CID spectra were acquired forthat mass.
After each automated LC/MS/MS run, the collected product ion spectra were correlated with theOWL protein sequence database by using the SEQUEST database search program [12]. The databasesearch program provides an objective criteria to judgethe quality of the collected tandem mass spectra. Results for analyses done at sample levels of 50, 100,200,and 1000 fmol are summarized in Figure 2. Peptidesfor which CID spectra were collected are indicated bya horizontal bar under the amino acid sequence. If thecorrect sequence for the peptide was ranked number 1by the SEQUEST search program, this was indicatedby a solid black bar. If the correct sequence was not thefirst choice of the search program, this was indicatedby a cross-hatched bar. Cytochrome c has one heme
82%(54%)
69%(54%)
56%(42%)
84%(65%)
v,n"""",,""''''''''''."""""""",,~""""""""",
."",,.,,,,,,,,,,,,'"'"""""""",,'"
""""""""11 .""""""""""""",,,
-""""""",.""""" .""""""""""""""""'4",~""",,,,,,,,V"",,,.,,.,.,,,,,,,,.,,...
""""",. ,.""""",'"
_ .~"""",.
-50 fmol
50 fmol
200 fmol
'lI"'",''''''...'H''..,.....'',,,100 fmol
100 fmol
,.""",,, 11.11 11'
""""""200 fmol
1000 fmol
1000 fmol
GITWKEETlMEYlENPKKYIPGTKMIFAGIKKKTEREDlIAYlKKATNE
Performance Evaluation
For several years, our lab has used the mixture ofpeptides generated from the endo Lys C digestion ofequine cytochrome c as a standard to check the performance of chromatography and mass spectrometry systems [10]. The mixture is generated easily and containspeptides that have a range of molecular weights andHPLC retention times. Decreasing amounts of thismixture were used to determine the extent of structural information that could be obtained automaticallyin a single LC/MS/MS experiment and to evaluate the
the list. A more detailed analysis of the spectra thatutilizes elution time or order could be incorporatedinto the programs, but with the penalty that less timewould be spent on actual collection of data. This wouldincrease the probability that closely eluting components would be missed.
The criteria to switch back to precursor mass spectrometry mode from tandem mass spectrometry modecan be just as problematic. While the instrument collects CID spectra, it is blind to other components thatelute from the column. Thus, it is important to spendno more time in the tandem mass spectrometry modethan is necessary. Generally, components present inthe greatest amount yield the broadest peaks OS-3D s)and the highest quality fragment ion spectra. When amaximum tandem mass spectrometry scan number isset, no more scans are collected than are needed toensure good quality spectra (usually four to eight). Bythe same token, it is senseless to collect fragment ionspectra on a precursor ion that is no longer present. Formuch of the work presented subsequently, decreasingsignal intensity in the collected tandem mass spectrumwas taken as an indication that data collection shouldbe terminated. This method works well for peaks thatare detected on their leading edge, but works poorlyfor ions detected after the peak maximum has passed.At lower sample levels there was a tendency to collecttandem mass spectra on transient masses and stay intandem mass spectrometry mode for the maximumnumber of scans because each spectrum was randomnoise with a fairly constant intensity. A careful studyof the differences between good CID spectra and badCID spectra revealed that for good CID spectra, individual scans were similar to each other in appearancein that they had the same dominant ions present. Poorspectra on the other hand had a random pattern ofintense ions. The criterion used in the program represented by the logic flow chart (Figure 1) was to compare the three most abundant ions in each collectedtandem mass spectrometry scan with the base peakfrom the previous scan. If a match was found, thenCID data collection continued. By this means, badtandem mass spectrometry data are limited to twoscans. The time needed to analyze tandem massspectrometry scans and switch modes is negligible«O.ls).

536 5TAHL ET AL. J Am Sac Mass Spectrom 1996, 7, 532-540
covalently attached to the two Cys residues. Consequently, for the search parameters used, this peptidewould not be found in the database and it is indicatedby a dotted bar.
At higher sample levels (> 200 frnol) peptides selected for tandem mass spectrometry analysis cover82% of the cytochrome c sequence. If care is taken toload the sample in a minimum volume of nearly 100%aqueous solvent and start the gradient at 0% acetonitrile, the N- and C-terminal peptides are observed.However, under normal conditions, these hydrophilicpeptides elute very early in the gradient as broadpeaks and are not observed. The other peptides notdetected are short (1-3 amino acid residues) and hydrophilic, and are not retained on the column. Inaddition to the expected products of an endo Lys Cdigestion (cleavage after Lys residues), a number ofpeptides are observed due to incomplete cleavage, andin two instances, additional cleavages after Tyr andPhe.
For the experiment that used 1 pmol of sample, 18peptides (84% of the sequence) were selected for tandem mass spectrometry analysis by the computer. Thedatabase search program matched the correct sequenceto the CID spectrum for seven of the peptides (65% ofthe sequence). The search program ranked an additional seven peptides as second or third in its list ofpossible matches. At the 200-fmol level, only 12 of thecytochrome c peptides were selected for tandem massspectrometry analysis. This still represents 82% of thecytochrome c sequence because peptides selected inthe 1-pmol run and not selected in the 200-fmol runcovered the same regions of the protein (Figure 2). Thequality of some of the tandem mass spectra decreased.The correct sequence was ranked first by the searchprogram for five of the peptides (54% of the sequence).Still fewer peptides (69% of the sequence) were selected for tandem mass spectrometry analysis at the100-fmol level. The correct sequence was ranked firstfor only four peptides. However, the portion of thesequence covered (54%) was the same as for the 200fmol run. When the digest mixture was analyzed at the50-fmol level with a SNR threshold of 8, only fourpeptide ions (39% of the sequence) were selected forCID analysis, and the correct sequence was rankedfirst by the database search program for only two ofthem (24% of sequence; this run is not included inFigure 2).
With a second run that used a SNR threshold levelof 6.5, six cytochrome c peptides were selected fortandem mass spectrometry analysis (56% of the sequence) and the correct sequence was matched for fourof them (42% of the sequence; Figure 2). Using thelower SNR threshold, a large number (21) of other ionswere selected for CID analysis. None of these otherspectra was consistently matched to any protein in thedatabase; they are probably low level contaminants,both peptide and nonpeptide, that elute from the HPLCsystem. The 50-fmollevel represents the practical limit
for our instrumentation in its present form. At thislevel, there are still enough quality tandem mass spectra to obtain a good match by using the SEQUESTsearch program without an excessive amount of interference from noise and low level contaminants.
Applications
Characterization of a synthetic protein. The data-controlled approach to LC/MS/MS analyses is particularly well suited to determine the modifications ofproteins that have a known sequence. A list of massesfor all of the expected digest peptides can be generatedby the user and the mass spectrometer can be programed to collect CID spectra only for ions not foundin the list. An example of this type of analysis is thecharacterization of a synthetic protein that had a mass64 u higher than expected (expected mass = 10,342 u).A tryptic digestion was performed and analyzed in asingle LC/MS/MS run. Results are summarized inFigure 3. Of the seven expected tryptic peptides (designated Tj-T7 ) , three were observed (Tt, T3 , and T4 ) andonly normal spectra were collected. Fragment Ts is asmall hydrophilic peptide (sequence NDAR) that probably was not retained on the column. A total of 13 ions(numbered 1-13 in Figure 3a) were selected for tandem mass spectrometry analysis.
Ions 2, 3, 4, 7, and 10 were of low intensity andyielded tandem mass spectra that had only one or twoscans. No useful sequence data were obtained fromthese spectra and no assignments could be made withconfidence based on the observed mass value alone.Ion 1 was assigned as the iron adduct of peptide T3 .
The mass of ion 5 was consistent with the disulfidedimer of peptide T6 • Ion 6 gave a reasonably goodtandem mass spectrum from which a partial sequencecould be derived. However, the sequence was notrelated to any part of the synthetic protein and wasassumed to be an impurity in the sample. The mass ofion 8 was 64 u higher than that expected for peptide T7
and the tandem mass spectrum (Figure 3b) clearlyindicated that Tyr had been substituted for Val atposition 8 of the sequence. The fragment ion spectracollected for ions 9 (Figure 3d and 11 (spectrum notshown) clearly indicated that these peptides resultedfrom an additional cleavage at a chymotryptic site. Themass-to-charge ratio of ion 12 (1364) corresponded tothe 5+ charge state of the disulfide dimer of T2 cornplexed with iron (MW 6814). The 4+, 6+, and 7+charge states also were observed. As might be expected, the tandem mass spectrum of the 5 + chargestate gave very little useful information. The portion ofthe sequence that corresponded to T2 also was observed in combination with T j (the result of incompletedigestion). Finally, the mass-to-charge ratio of ion 13(1523) corresponded to the 7+ charge state of a peptidewith a molecular weight of 10,657 (five other chargestates also were observed). This mass is higher thanthe mass of the starting protein and was assumed to be

J Am Soc Mass Spectrom 1996, 7, 532-540 DATA CONTROLLED AUTOMATlON OF LC/MS/MS 537
Chymotryptic FragmentTLTLF
Ua:I-ll.u.(J)
~ «>D >ll.UJ a: 'Ea: «-'z 8 D(J)> -c Glll. ~oll. E(J)~
(J) DC)(J) Cii > a: 01> UJzE (J) £l!ll. C\J»z s u.-'Z 0 Z Z Gl _ll.~00 o(J) u, ~~(J) Z 0:0 I-(J)(J)
~ (5(5 u,
~+ z-,
ii5 -' Ciio-u I-~~ll.
~ ~ -' 9 0> E~ I-
~~ 0ll. -c « -z-'
~~ C\J (J)o
UJ ()-' I- ~«..:- J 10 ~ •
Il.W
5 -'ll..l UJUJ
3 / 11 12.13
200 300 400 500 600 700Scan Number
a:zC)z(J)-'9~
100
a
b T7 Val > Tyr cSDPVTLofitYG MW
100100
Gl IX2 Gl0 B9
BlOoc c
ca ca"0 Ixa "0c C::::l
B7::::l
.050
.050« • Ba «
Gl Ba Gl> >~ ~a; a;a: a:
200 400 600 800 1000 1200rn/z
Figure 3. LC/MS/MS analysis of the tryptic digest of a synthetic protein. (a) Total ion chromatogram (TIC). Black bands indicatetandem mass spectra and are numbered 1-13. Peaks in the chromatogram assigned to specific tryptic peptides are marked with atryptic peptide number (T,,) based on the order in which they occur in the sequence. The sequence of each peptide by using the singleletter amino acid code also is given. Those sequences designated dimers result from disulfide bond formation between two Cysresidues. (b) Tandem mass spectrum (peak 8) of the T7 peptide used to determine that a Tyr had been substituted for a Val (indicatedby a box around the Y in the sequence) during the synthesis. (c) Tandem mass spectrum for peak 9 that confirms peptide was achymotryptic fragment.
due to an impurity, possibly a by-product of the synthesis in which some of the protecting groups were notremoved.
This experiment is a good example of the problemsencountered when trying to characterize "real life"protein digest mixtures by LC/MS/MS. There arealways more peptides found than expected either because of foreign protein contamination or lack of specificity by the enzyme. Many of these components willbe present in amounts insufficient to yield good fragment ion spectra. Even the expected peptides mayhave unexpected masses because of oxidation of Cysand Met residues or adduct formation with traceamounts of metal ions. Although the complete characterization of any digest mixture is always tedious, it isoften possible to rapidly acquire enough informationto solve a given problem. In the example just cited, asingle LC/MS run was sufficient to confirm the majorportion of the sequence and to determine the exactlocation of the error in the synthesis. Of equal importance, the necessary information was obtained by using about 1 pmol of sample.
Elimination of contaminant interference. Another problem frequently encountered is the contamination of a
peptide sample with nonpeptide components. A typical example is the analysis of a protein band excisedfrom a single SDS-P AGE gel, digested in situ, andextracted from the supporting gel. In this instance, apreliminary LC/MS analysis by using 2% of the sample was performed. The collected spectra were analyzed manually to generate a list of candidate massesfor CID analysis. In a second analysis, the mass spectrometer was programed to collect CID spectra for allof the candidate masses. As a result, 26 tandem massspectra were automatically acquired. Analysis of thespectra revealed that only 12 of the 26 CID spectrawere derived from peptides. The 14 nonpeptide CIDspectra were for a set of contaminant compounds derived from the polyacrylamide gel.
The contaminant compounds had different molecular weights and HPLC retention times. Consequently,there was considerable interference throughout thecourse of the LC/MS run. However, CID spectra forall contaminants were found to contain a characteristic"fingerprint" of ions in the low mass region of thespectrum (Figure 4). Thus, the possibility existed toquickly identify a contaminant ion from information inthe first tandem mass spectrometry scan, and spendless time collecting CID spectra of nonpeptide compo-

Figure 4. Tandem mass spectrum of one of the contaminantions (l1I/z 738.7) derived from the polyacrylamide gel. Ions atlIl/z 88, 133, and 175 characterize a "fingerprint" common tomembers of this class of compounds.
538 STAHL ET AL.
100
80 CID "fingerprint"for gel derivedcontaminant
60 A40
88.5 133.1
20
175.3,I IJ
200 400rn/z
MH+738.7
I600
JAm Soc Mass Spectrom 1'J96, 7, 532-540
LC/MS/MS run and four of the peptides from thesecond LC/MS/MS run were found to match peptidesderived from human serotransferrin precursor (Figure5). An additional four spectra had protonated molecular ion masses that matched portions of the serotransferrin sequence, but the quality of the tandem massspectrometry data was insufficient to be confident ofthe sequence. All other peptide CID spectra were presumed to be derived from contaminants, disulfidedimers, or other posttranslationally modified components. (The Asn residues at positions 432 and 630 areknown to be glycosylated [13].) Serotransferrin precursor is a relatively high molecular weight protein (77ku) with 40 Cys residues. It is not surprising that manyof the calculated tryptic peptides were not detectedand many of the observed peptide ions could not beassigned readily, given the large number of possibledisulfide-bonded dimers that could exist. Note that 13of the 27 tryptic fragments that would not contain Cyswere identified.
Mass spectrometry method compared to Edman microsequencing. The power of automated LC/MS/MS and
.. .. .MRLAVGALLVCAVLGLCLAVPDKTVRWCAVSEHEATKCQSFRDHMKSVIPSDGPSVACVK 60
. . .. .ADGTDFPQLCQLCPGCGCSTLNQYFGYSGAFKCLKDGAGDVAFVKHSTIFENLANKADR0 240
lE __ lE --I1+979.1 • 2+638.0. .
QYELLCLDNTRKPVDEYKDCHLAQVPSHTVVARSMGGKEDLIWELLNQAQEHFGKDKSKE 300~
.KASYLDCIRAlAANEADAVTLDAGLVYDAYLAPNNLKPWAEFYGSKEDPQTFYVAVAW 120
KKDSGFQt-'NQLRGKKSCHTGLGRSAGWNIPIGLLYCDLPEPRKPLEKAVANFFSGSCAPC 180~
1+614.3
600
660
420
480
540
360
. . . .APNHAVVTRKDKEACVHKILRQQQHLFGSNVTDCSGNFCLFRSETKDLLFRDDTVCLAKL
. . .. .IPMGLLYNKINHCRFDEFFSEGCAPGSKKDSSLCKLCMGSGLNLCEPNNK,EGYVGYTGAF
""'
. . . .VKWCALSHHERLKCDEWSVNSVGKIECVSAETIEDCIAKllotlGEADAMSLDGGFVYIAGK.. .CGLVPVLAENYNKSDNCEDTPEAGYFAVAVVK~ASDL TWDNL~GKKSCHT AVGRTAGWN
E __
2+625.9'
. .HDRNTYEKYLGEEYVK/l.VGNLR.KCSTSSLLEACTFRRP
lE ~ ~1+1001.0' P 629.8
Figure 5. Results from the LC/MS/MS analysis of the in-geldigestion of human serotransferrin precursor. The amino acidsequence is given by using single letter code. Numbers to theright are the residue numbers of the amino acids at the end ofeach line. For clarity, Cys residues are marked with a black dot.Peptides identified by mass spectrometry are designated byarrows under the corresponding length of sequence. Both thecharge states and the observed mass-tn-charge ratio values aregiven underneath the arrow. An asterisk to the right of themass-to-charge ratio value indicates that the CID spectrum of thepeptide matched human serotransferrin precursor in the OWLdatabase by using the SEQUEST database search program.
2+ 642.8·. ..R.CLVEK.GDVAFVK.HQTVPQNTGGKNPDPWAI\NLNEKDYELLCLDGTRKPVEEYANCHLAR~ lE ~ ~
1+735.9 2+583.5 •
. .FQLFSSPHGKDLLFKDSAHGFLKVPPRMlAKMYLGYEYVTAIRNLREGTCPEAPTDECKP
-----'--~I ~ lE --I2+639.2 • 1+874.9 • 2+740.2 •lE __ I
2+746.3'
nents. An additional ICL procedure was written thatreturned the mass spectrometer to the precursor scanmode whenever the base peak in the mass range belowm/z 300 in the first tandem mass spectrometry scanwas 88, 133, or 175. Otherwise, the normal criteriawould be used to terminate tandem mass spectra collection. This procedure proved to be an effective meansto detect contaminant ions without a significant increase in the time needed for the computer to analyzethe spectrum. The actual time spent to analyze a contaminant ion is reduced from 18 to 4 s in the situationwhen five tandem mass spectra are collected.
In theory, a list of masses of known gel contaminants could be used to avoid collection of CID spectraon these components. However, given the number ofthese components in the mass range of m r z 500-900,there is a high probability of having peptide masseswith the same values that also would be excluded. Useof HPLC retention times as a further constraint wouldrequire very reproducible chromatography, which forthe most part is impractical.
A second LC/MS/MS analysis was performed byusing the same amount of the protein digest sample.The ions for which CID spectra were obtained duringthe first LC/MS/MS run were specifically excluded ascandidates for tandem mass spectrometry analysis.Otherwise, all masses above the SNR threshold wereselected for CID analysis. When the contaminant fingerprint was detected, the CID analysis was terminated immediately and the parent mass was appendedto a user list for rejection in all subsequent scans. Atotal of 35 contaminant ions were detected during thecourse of the run. CID spectra were collected for anadditional 16 peptide ions.
The SEQUEST database search program was usedto correlate the peptide CID spectra with the sequencesof known proteins. Five of the spectra from the first
J Am SOl' Mass Spcctrom 1996, 7, 532 - 540 DATA CONTROLLED AUTOMATION OF Le/MS/MS 539
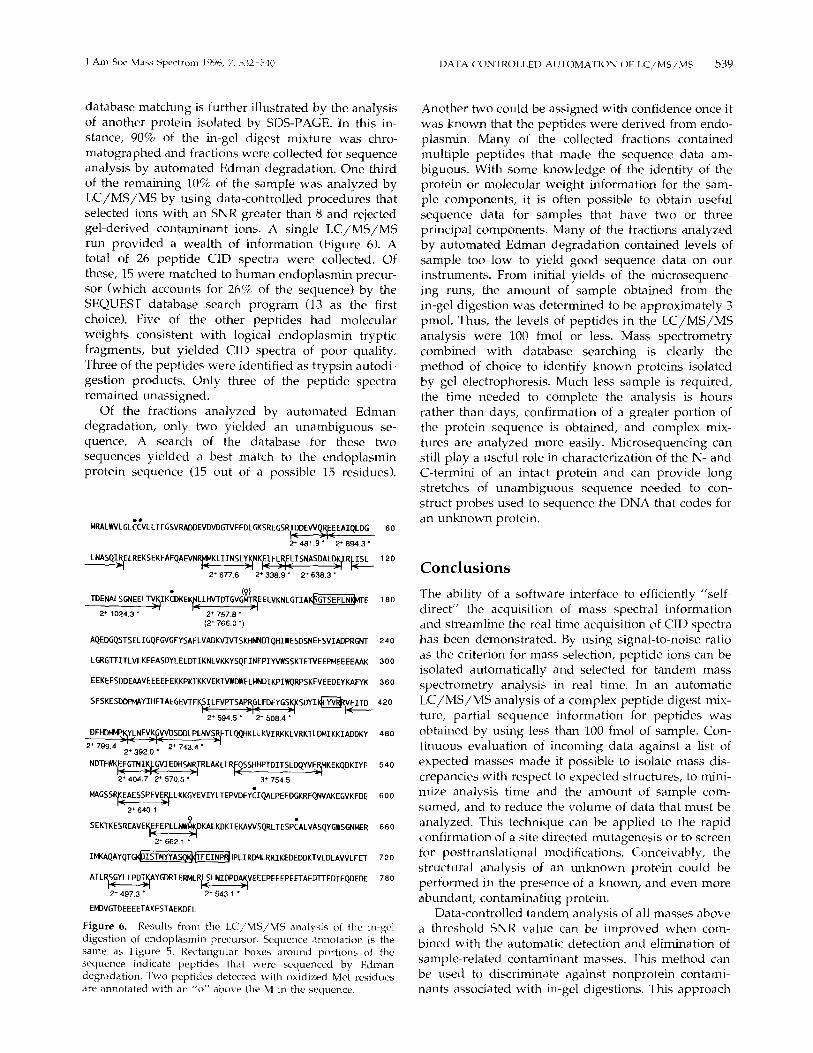
database matching is further illustrated by the analysisof another protein isolated by SDS-PAGE. In this instance, 90% of the in-gel digest mixture was chromatographed and fractions were collected for sequenceanalysis by automated Edman degradation, One thirdof the remaining 10% of the sample was analyzed byLC/MS/MS by using data-controlled procedures thatselected ions with an SNR greater than 8 and rejectedgel-derived contaminant ions. A single LC/MS/MSrun provided a wealth of information (Figure 6). Atotal of 26 peptide CID spectra were collected, Ofthese, 15 were matched to human endoplasmin precursor (which accounts for 26% of the sequence) by theSEQUEST database search program (13 as the firstchoice), Five of the other peptides had molecularweights consistent with logical endoplasmin trypticfragments, but yielded CID spectra of poor quality,Three of the peptides were identified as trypsin autodigestion products. Only three of the peptide spectraremained unassigned.
Of the fractions analyzed by automated Edmandegradation, only two yielded an unambiguous sequence. A search of the database for these twosequences yielded a best match to the endoplasminprotein sequence (15 out of a possible 15 residues).
MRAlWVlGlCCVllTFGSVRADOEVDVDGTVEEDlGKSREGSRr~EW~EAIQlDG 60
2+481.9 " 2+894.3 "
lNASQIRElREKSEKFAFQAEVN~KlIINSlYK,NK.EIFlR,ELISNASDAlDK.IR~ISl 120~ ~ ~ ~ :otE )01 ~
2" 677.6 2+338.9 " 2+638.3 "
Another two could be assigned with confidence once itwas known that the peptides were derived from endoplasmin. Many of the collected fractions containedmultiple peptides that made the sequence data ambiguous. With some knowledge of the identity of theprotein or molecular weight information for the sample components, it is often possible to obtain usefulsequence data for samples that have two or threeprincipal components. Many of the fractions analyzedby automated Edman degradation contained levels ofsample too low to yield good sequence data on ourinstruments. From initial yields of the microsequencing runs, the amount of sample obtained from thein-gel digestion was determined to be approximately 3pmol. Thus, the levels of peptides in the LC/MS/MSanalysis were 100 fmol or less. Mass spectrometrycombined with database searching is clearly themethod of choice to identify known proteins isolatedby gel electrophoresis. Much less sample is required,the time needed to complete the analysis is hoursrather than days, confirmation of a greater portion ofthe protein sequence is obtained, and complex mixtures are analyzed more easily. Microsequencing canstill play a useful role in characterization of the N- andC-termini of an intact protein and can provide longstretches of unambiguous sequence needed to construct probes used to sequence the DNA that codes foran unknown protein.
Conclusions
SFSKESDDPMAYIHFTAEGEVTF~ILFVPTSAP~GLFDEYGS~SDYIidlYVRRVFITD4200( y" )0 =~2+594.5 " 2+508.4 "
The ability of a software interface to efficiently "selfdirect" the acquisition of mass spectral informationand streamline the real time acquisition of CID spectrahas been demonstrated. By using signal-to-noise ratioas the criterion for mass selection, peptide ions can beisolated automatically and selected for tandem massspectrometry analysis in real time. In an automaticLC/MS/MS analysis of a complex peptide digest mixture, partial sequence information for peptides wasobtained by using less than 100 frnol of sample. Continuous evaluation of incoming data against a list ofexpected masses made it possible to isolate mass discrepancies with respect to expected structures, to minimize analysis time and the amount of sample cornsumed, and to reduce the volume of data that must beanalyzed. This technique can be applied to the rapidconfirmation of a site directed mutagenesis or to screenfor posttranslational modifications. Conceivably, thestructural analysis of an unknown protein could beperformed in the presence of a known, and even moreabundant, contaminating protein.
Data-controlled tandem analysis of all masses abovea threshold SNR value can be improved when combined with the automatic detection and elimination ofsample-related contaminant masses. This method canbe used to discriminate against nonprotein contaminants associated with in-gel digestions. This approach
180
360
780
660
600
480
300
240
540
720
• (0)TDENALSGNEEL~IKCDKE~LHVTDTGVGMT:fELVKNLGTIAKliGTSEFLNitrrE
2+ 1024.3" 2+757.8 "(2+766.0")
AQEDGQSTSELIGQFGVGFYSAFLVADKVIVTSKHNNDTQHIWESDSNEFSVIADPRGNT
LGRGTTITlVLKEEASDYlELDTIKNlVKKYSQFINFPIYVWSSKTETVEEPMEEEEMK
EEKEESDDEMVEEEEEEKKPKTKKVEKTVWDWELMNDIKPIWQRPSKEVEEDEYKAFYK
DFHlJI.tPK.YLNFVKGWDSDDLPLNVSR,ETLQQHKLLKVIRKKLVRKTLDMIKKIADDKY~o( )o~ ~
2+799.4 2+392.0" 2+743.4 "
NDTFW~~GTNI~GVIEDHS~TRlAKLL~SSHHPTDITSLDQYV~KEKQDKIYF
2+404.7 2+570.5" 3+754.5
MAGSSRj:.iAESSPFV~LKKGYEVIYLTEPVDEYCIQALPEFDGKRFQNVAKEGVKFDE
2+640.1o •
SEKTKESREAVE~~EPll~KALKDKIEKAWSQRLTESPCALVASQYGWSGNMER
2+662.' "
IMKAQAYQTGt4lISTNYYASQ~PLIRDMlRRIKEDEDDKTVLDLAVVLFET
ATlR,SGYlLPDT!<AYGDRIERMlR)..SLNIDPDAKVEEEPEEEPEETAEDTTEDTEQDEDEi"'" ~ i"'" )012+497.3 " 2+5431 "
EMDVGTDEEEETAKESTAEKDEL
Figure 6. Results from the Le/MS/MS analysis of the in-geldigestion of endoplasm in precursor. Sequence annotation is thesame as Figure 5. Rectangular boxes around portions of thesequence indicate peptides that were scquenced by Edmandegradation. Two peptides detected with oxidized Met residuesare annotated with an "0" above the M in the sequence.

540 STAHL ET AL. J Am Sac Mass Spectrom 1996, 7, 532-540
logically can be extended to the analysis of othercomplex peptide mixtures such as cell lysates.
The power of data-controlled LC/MS/MS analysiscombined with the SEQUEST database search programclearly has been demonstrated [12]. By using the fragment ion information in the CID spectra, the accuracyof the sequence assignment is improved greatly overthat achieved by using molecular mass informationalone. When combined with the microelectrospray interface, the methodology provides rapid confirmationof large portions of protein sequence at sample levelsbelow 100 fmol.
AcknowledgmentsThis work was supported in part by the Public Health Service(NIH CA33572 and NIH RR06217). The synthetic protein wasprovided by Bruce Kaplan. We particularly thank John R. Yatesfor the SEQUEST database search program. A preliminary reportof this work was published in the Proceedings of the 43rd ASMSConference on Mass Spectrometry and Allied Topics, Atlanta,Georgia, May 21-26, 1995.
References
1. Huang, E. c.; Hcnion, J. D. J. A 111. Soc. Mass Spcctront. 1990,1. 158-165.
2. Kassel, D. B.; Shushan, B.; Sakuma, T; Salzmann, J. P. Anal.Chem. 1994, 66, 236-243.
3. Stahl, D. c.. Martino, P. A.; Swiderek, K. M.; Davis, M. T.;Lee, T. D. Proceedings of the 40th ASMS Conference on MassSpcctrometru and Allied Topics; Washington, DC, 1992.
4. Davis, M. T.; Stahl, D. c. Swiderek, K. M.; Lee, T. D.Methods: A Companion to Methods in Enzymology 1994, 6.304-314.
5. Hunt, D. F.; Henderson, R. A.; Shabanowitz, j., Sakaguchi, K.;Michel, H.; Sevilir, N.; Cox, A. L.; Appella, E.; Engelhard,V. H. Science 1992, 255, 1261-1263.
6. Yates, J. R. I.; Eng,]. K.; McCormack, A. L.; Schieltz, D. Anal.Clwm. 1995, 34, 1426-1436.
7. Davis, M. T.; Stahl, D. c. Hefta, S. A.; Lee, T D. Anal. Chcm.1995, 67,4549-4556.
8. Davis, M. T; Stahl, D. c. Lee, T D. J. Am. Soc. AlassSpectrom. 1995, 6, 571-577.
9. Hellman, C.; Wernstedt, c.; Gonez, ].; Heldin, C.-H. Anal.Biochem. 1995, 224, 451-455.
10. Davis, M. T; Lee, T. D. Protein s« 1992, 3, 935-944.
11. Sw iderek, K. M.; Lee, T. D.; Shivelv, J. E. In Methods inEnzynlOlogy, Vo!. 271; Karger, B. L.; Hancock, W. S., Eds.;Spectrum Publisher Services, York, PA, 1996.
12. Eng.}. K.; McCormack, A. L.; Yates. [. R. J. Amcr. Soc. MassSpectrom. 1994, 5. 976-989.
13. MacGillivary, R. TA.; Mendez, E.; Shewale, J. G.; Sinha,S. K.; Lineback-Zins, J.; Brew, K. J. BioI. Chcm. 1983, 258,3543-3553.