Validation of a confirmatory method for the determination of melamine in egg by gas...
8
Journal of Chromatography A, 1157 (2007) 281–288 Validation of a confirmatory method for the determination of macrolides in liver and kidney animal tissues in accordance with the European Union regulation 2002/657/EC Houda Berrada a,∗ , Francesc Borrull b , Guillermina Font a , Juan Carlos Molt ´ o a , Rosa Maria Marc´ e b a Laboratory of Food Chemistry and Toxicology, Faculty of Pharmacy, Universitat de Val` encia, Avda Vicent Andres Estell´ es s/n, 46100 Burjassot, Spain b Department of Analytical Chemistry and Organic Chemistry, University Rovira i Virgili, Sescelades Campus, Marcel l´ ı Domingo s/n, 43007 Tarragona, Spain Received 27 November 2006; received in revised form 2 May 2007; accepted 7 May 2007 Available online 13 May 2007 Abstract This study proposes a simple multiresidue liquid chromatography–diode array detector (LC–DAD) method capable of determining seven macrolide antibiotics in samples of liver and kidney animals at concentrations lower than those allowed by current legislation. Samples were prepared by homogenizing the tissue with EDTA–McIlvaine’s buffer and extracted with an Oasis HLB cartridge. The consumption of organic solvent during extraction was minimum. The analytes were detected by LC–DAD and also by liquid chromatography–mass spectrometry with electrospray ionization (LC–(ESI)MS). The method was specific, stable and robust enough for the required purposes. The DAD method was validated in accordance with the European Commission Decision 657/2002. Recovery data were also satisfactory with values higher than 67% for most macrolide antibiotics extracted from liver and kidney samples spiked at 200 g/kg, the lowest MRL established for the macrolides studied. The relative standard deviations (RSD (%), (n = 3)) were lower than 13% and 15% for intra-day and inter-day assays. The method was applied to investigate the occurrence of the studied macrolides in 31 beef and kidney animal samples. The results obtained by LC–DAD for positive samples were compared to those obtained by LC–(ESI)MS. Therefore, the method with simpler instrumentation than a LC–(ESI)MS can be used as a control method and the results of the validation process demonstrate that this method is suitable for application in a European Union program for monitoring residues of veterinary drugs. © 2007 Elsevier B.V. All rights reserved. Keywords: Macrolides; Liver; Kidney; Liquid chromatography-DAD; ESI-MS; SPE 1. Introduction Macrolides are a group of antibacterial compounds that are active against Gram-positive and some Gram-negative bacteria. They are basic and lipophilic molecules that consist of macro- cyclic lacton rings containing 14–18 atoms with sugars linked via glycosidic bonds. They are widely used in human and vet- erinary medicine to prevent microbial infections. As veterinary drugs they are used in food-producing animals with either a ∗ Corresponding author. Tel.: +34 96 3544958; fax: +34 96 3544954. E-mail address: [email protected] (H. Berrada). curative and prophylactic aim or added directly to human food to prolong its freshness [1,2]. The incorrect use of these drugs can leave residues in food products and this can have such undesirable effects on consumer health as the development of allergic reactions, the appearance of resistant bacteria and even cross-resistance to other antibiotics with similar structures or mechanisms of action [3]. Therefore, the application of these antibiotics in feeding stuffs is regulated by Council Directive 70/524/EC [4]. Maximum residue limits (MRLs) have been established for these substances in animal products. The European Parlia- ment decided to ban the use in humans of related antibiotics that were administered to promote animal growth, so some 0021-9673/$ – see front matter © 2007 Elsevier B.V. All rights reserved. doi:10.1016/j.chroma.2007.05.021
Transcript of Validation of a confirmatory method for the determination of melamine in egg by gas...
A
mpsevmTiwcm©
K
1
aTcved
0d
Journal of Chromatography A, 1157 (2007) 281–288
Validation of a confirmatory method for the determination ofmacrolides in liver and kidney animal tissues in accordance
with the European Union regulation 2002/657/EC
Houda Berrada a,∗, Francesc Borrull b, Guillermina Font a,Juan Carlos Molto a, Rosa Maria Marce b
a Laboratory of Food Chemistry and Toxicology, Faculty of Pharmacy, Universitat de Valencia,Avda Vicent Andres Estelles s/n, 46100 Burjassot, Spain
b Department of Analytical Chemistry and Organic Chemistry, University Rovira i Virgili, Sescelades Campus,Marcel lı Domingo s/n, 43007 Tarragona, Spain
Received 27 November 2006; received in revised form 2 May 2007; accepted 7 May 2007Available online 13 May 2007
bstract
This study proposes a simple multiresidue liquid chromatography–diode array detector (LC–DAD) method capable of determining sevenacrolide antibiotics in samples of liver and kidney animals at concentrations lower than those allowed by current legislation. Samples were
repared by homogenizing the tissue with EDTA–McIlvaine’s buffer and extracted with an Oasis HLB cartridge. The consumption of organicolvent during extraction was minimum. The analytes were detected by LC–DAD and also by liquid chromatography–mass spectrometry withlectrospray ionization (LC–(ESI)MS). The method was specific, stable and robust enough for the required purposes. The DAD method wasalidated in accordance with the European Commission Decision 657/2002. Recovery data were also satisfactory with values higher than 67% forost macrolide antibiotics extracted from liver and kidney samples spiked at 200 �g/kg, the lowest MRL established for the macrolides studied.he relative standard deviations (RSD (%), (n = 3)) were lower than 13% and 15% for intra-day and inter-day assays. The method was applied to
nvestigate the occurrence of the studied macrolides in 31 beef and kidney animal samples. The results obtained by LC–DAD for positive samples
ere compared to those obtained by LC–(ESI)MS. Therefore, the method with simpler instrumentation than a LC–(ESI)MS can be used as aontrol method and the results of the validation process demonstrate that this method is suitable for application in a European Union program foronitoring residues of veterinary drugs.2007 Elsevier B.V. All rights reserved.
eywords: Macrolides; Liver; Kidney; Liquid chromatography-DAD; ESI-MS; SPE
ct
pho
. Introduction
Macrolides are a group of antibacterial compounds that arective against Gram-positive and some Gram-negative bacteria.hey are basic and lipophilic molecules that consist of macro-yclic lacton rings containing 14–18 atoms with sugars linked
ia glycosidic bonds. They are widely used in human and vet-rinary medicine to prevent microbial infections. As veterinaryrugs they are used in food-producing animals with either a∗ Corresponding author. Tel.: +34 96 3544958; fax: +34 96 3544954.E-mail address: [email protected] (H. Berrada).
wtb
tmt
021-9673/$ – see front matter © 2007 Elsevier B.V. All rights reserved.oi:10.1016/j.chroma.2007.05.021
urative and prophylactic aim or added directly to human foodo prolong its freshness [1,2].
The incorrect use of these drugs can leave residues in foodroducts and this can have such undesirable effects on consumerealth as the development of allergic reactions, the appearancef resistant bacteria and even cross-resistance to other antibioticsith similar structures or mechanisms of action [3]. Therefore,
he application of these antibiotics in feeding stuffs is regulatedy Council Directive 70/524/EC [4].
Maximum residue limits (MRLs) have been established forhese substances in animal products. The European Parlia-
ent decided to ban the use in humans of related antibioticshat were administered to promote animal growth, so some
2 atog
m[
wlmbm
mlsctatriavmdopmi
hctcird[
otfob
cSpuosM
tvsooaI
oS
pmm
jd
2
2
smFwffa
a(
dPJ
2
h(cF
wsfwba
2
LStTe
82 H. Berrada et al. / J. Chrom
acrolides are now restricted to veterinary therapeutic use5,6].
Since macrolides are used in animal and human medicine, aide spectrum of samples from different origins need to be ana-
yzed. The analysis of animal tissues (such as liver and kidney)ainly involves residue analysis, whereas the analysis of human
iological fluids (such as serum and urine) mainly involves phar-acokinetic and clinical studies [7,8].Several techniques for the analytical determination of
acrolides have been reported in the literature [8]. Microbio-ogical and immunological assays (ELISA) are the traditionalcreening techniques, but they are often lengthy and not suffi-iently specific for analytical purposes [9]. Chromatographicechniques, which allow multiresidue analysis, are appropri-te alternatives and some methods have been described forhe quantitative analysis of macrolides by liquid chromatog-aphy. The literature reports the determination of macrolidesn urine, plasma, soil, animal tissues and sludge using suchnalytical techniques as liquid chromatography (LC) with ultra-iolet (UV) or fluorimetric detection, liquid chromatographyass spectrometry (LC–MS) and liquid chromatography tan-
em mass spectrometry (LC/MS/MS) [10–12]. However, mostf the methods in the literature are used to determine a singlearent antibiotic [13,14] and there are relatively few publishedultiresidue methods for determining the selected macrolides
n animal tissues [15].Liver and kidney are complex matrices because of their
igh protein and fat content, which often interfere in analyti-al procedures. In edible raw portions of these animal tissues,he average protein content is around 20% and the total lipidontent is around 5%, which means that isolating macrolidess particularly complicated and laborious [16]. The fact thatecoveries of macrolides from the matrix are lower than fromeionized water indicates that matrix effects are important13,17].
Extracting the drug from the matrix and cleaning it up isne of the most difficult steps in the antibiotic analysis ofhese samples. In most cases, macrolides have been extractedrom samples after proteins and fat have been eliminated byrganic solvents. Subsequently, they are further preconcentratedy solid-phase extraction (SPE) [11,17–21].
Aqueous extraction of other antibiotics from biomatrices isommonly conducted by using EDTA–McIlvaine’s buffer priorPE clean-up. Presence of EDTA and citric acid prevent againstrecipitation of cations and this property has been extensivelysed in the extraction of tetracycline [22]. However, to the best ofur knowledge, no studies have been conducted into extractingolely macrolide antibiotics from a biological matrix using a
cIlvaine’s buffer.The European Union (EU) is still revising the technical cri-
eria that must be applied in the screening and confirmation ofeterinary residues in food of animal origin. The EU has issued apecific regulation (2002/657/EC) concerning the performance
f methods and the interpretation of results in the official controlf residues in animal products. The methods currently used tonalyze official samples of the substances in group B of Annexof Council Directive 96/23/EC [23], such as macrolide antibi-g5
(
r. A 1157 (2007) 281–288
tics, will have to comply with decision 2002/657/EC by 1eptember 2007 [24].
This study focuses on developing a robust, simple andractical method capable of simultaneously extracting and deter-ining seven macrolide antibiotics, which belong to differentacrolide subgroups in tissues from animal liver and kidney.The macrolide antibiotics selected were erythromycin,
osamycin, roxithromycin, spiramycin, tilmicosin, trolean-omycin and tylosin.
. Experimental
.1. Materials and reagents
Potassium dihydrogenphosphate, phosphoric acid andodium hydroxide were obtained from Merck (Darmstadt, Ger-any) and sodium hydroxide was purchased from Prolabo (Bois,rance). Acetonitrile and methanol (supergradient LC grade)ere purchased from Scharlau (Barcelona, Spain), ethyl acetate
rom Sigma–Aldrich (Madrid, Spain), and dichloromethanerom Fluka (Steinheim, Germany). All reagents used were ofnalytical grade or better.
The deionized water (18.2 M� cm) used for preparing all thequeous solutions was obtained using a Milli-Q water systemMillipore Iberica, Madrid, Spain).
Disodium hydrogen phosphate and disodium salt of ethylene-iaminetetraacetic acid (Na2EDTA) were purchased fromrobus (Barcelona, Spain) and citric acid monohydrate from.T. Baker (Deventer, Holland)
.2. Standards
Commercial macrolide standards erythromycin, tylosinemitartrate and spiramycin were supplied by Riedel-de HaenSeelze, Germany); roxithromycin, troleandomycin and tilmi-osin were purchased from Sigma–Aldrich and josamycin fromluka.
Standard stock solutions of individual macrolides (1 mg/ml)ere prepared by dissolving 25 mg in 25 ml of methanol. These
olutions were stored in dark glass bottles at 4 ◦C and were stableor at least 3 months. A final standard mixture of macrolidesas freshly prepared by diluting with 20 mM KH2PO4/H3PO4uffer (pH 3.5)/acetonitrile (80:20, v/v). These solutions werelso stored at 4 ◦C.
.3. Apparatus
The chromatographic system was an HP 1100 seriesC–Diode array detector (Agilent technologies, Barcelona,pain) equipped with a 20 �l manual injector, a degasser, a qua-
ernary pump and a photodiode array detection (DAD) system.he same LC system coupled to a mass selective detector with anlectrospray ionization (ESI) (Agilent) was used. The chromato-
raphic column was a Kromasil 100 C18 (25.0 cm × 0.46 cm,-�m particle size) (Teknokroma, Barcelona, Spain).Animal tissue was homogenized with an Ultra-Turrax T-25Jankle & Kunkel, IKA-Labortechnik, Staufen, Germany) and a
atog
DrHmu0w
2
epaitriwa4mts
teBLaowdFuft
2
atDa
tuatbtta
5(5aosifi
2d
2
tl5tTc
2
rfil
2
2cq
TR
A
EJRSTTT
R
H. Berrada et al. / J. Chrom
idacen II centrifuge (Alresa, Madrid, Spain) was used to sepa-ate the supernatant from the solid phase. Some 500 mg OASISLB cartridges (Waters, Milford, MA, USA) connected to aanifold (Tecknokroma) and a pump as a vacuum source were
sed for the SPE procedure. To filter the concentrated extracts,.22-�m nylon syringe filters (Teknokroma, Barcelona, Spain)ere used.
.4. Chromatographic conditions
For the LC–DAD, a binary mobile phase with a gradientlution was used. Solvent A was Milli-Q water with phos-hate/phosphoric acid buffer (pH 3.5) and solvent B wascetonitrile. The gradient was 20% B: it increased to 60%n 25 min, to 100% in 35 min, stayed at 100% for 2 min andhen returned to the initial composition in 4 min. The flow-ate was 1 ml/min, and the column temperature was 35 ◦C. Thenjection volume was 20 �l and the compounds studied elutedithin 23 min. The diode array detector was used to developmethod and the response was monitored between 200 and
00 nm and quantified at the wavelengths that were the maxi-um absorbance analytically used: 210 nm for erythromycin A,
roleandomycin and roxithromycin, 232 nm for josamycin andpiramycin, and 287 nm for tilmicosin and tylosin.
The mass spectrometer worked under selected-ion moni-oring (SIM) acquisition mode. Three ions were acquired forach analyte except for josamycin, as Table 1 shows. Solvent
and the gradient were the same as the ones used in theC–DAD system but solvent A was Milli-Q water with 1%cetic acid (pH 2.8). The average conditions selected for theptimum performance of the ESI interface in the positive modeere: nebulizer pressure 40 psi, drying gas flow-rate 12 l/min,rying gas temperature 350 ◦C and capillary voltage 3500 V.ragmentation voltages were defined individually and the val-es were: 75 V for tilmicosin and troleandomycin and 125 Vor erythromycin, josamycin, roxithromycin, spiramycin andylosin.
.5. Sample preparation
The tissue sample was cut into small pieces, homogenized
nd (5.00 ± 0.02g) weighed in propylene centrifuge tubes. Aotal of 20 mL EDTA–McIlvaine’s buffer (prepared with 0.2 Misodium hydrogen phosphate, 0.1 M citric acid monohydratend 0.1 M Na2EDTA adjusted to pH 3.5 [25]) was added to
iaac
able 1etention time (tR), wavelength used at LC–DAD and main ions obtained at LC–(ES
nalyte tR (min)
rythromycin A 14.10osamycin 21.08oxithromycin 18.40piramycin 8.90ilmicosin 12.19roleandomycin 18.76ylosin 15.23
elative abundances shown in parentheses.
r. A 1157 (2007) 281–288 283
he centrifuge tube, the mixture was homogenized for 1 minsing a Ultra-Turrax T-25 and then the mixture was centrifugedt 9000 rpm for 5 min. The pellet was then blended and cen-rifuged twice more with 20 and 10 mL EDTA–McIlvaine’suffer, respectively. The supernatants obtained were jointly cen-rifuged for 15 min and, after the supernatant had been filteredhrough Whatman No. 1 filter paper, the filtrate was applied inSPE step.
The 500 mg Oasis HLB cartridges were preconditioned withml of MeOH and 2 ml of Milli-Q water. The filtrate solution
50 ml) was passed through the cartridge at a flow-rate of aboutml/min. The cartridge was washed with 10 ml Milli-Q waternd the macrolides were eluted from the cartridge with 5 mlf methanol. The extract was concentrated to dryness under atream of N2 and then redissolved with 1 ml of a mixture ofnitial mobile phase. After filtration through a 0.22 �m syringelter, this solution was injected into the LC-system.
.6. Method Validation according to the 2002/657/ECecision
.6.1. Calibration curvesBeef liver samples known to be negative were subjected
o the analytical procedure to serve as matrix standards. Beefiver spiked at five concentrations – 50.0, 100.0, 200.0, 300.0,00.0 and 1000.0 �g/kg – was used for matrix-matched calibra-ion standard curves in the analytical range 50.0–1000.0 �g/kg.hese spiked samples containing macrolide standards were pro-essed through the complete extraction procedure.
.6.2. SpecificityTo verify the absence of interfering substances around the
etention time of analytes, we analyzed four liver samples fromve species (beef, chicken, lamb, pig and rabbit). In all, then, 20
iver samples were analyzed.
.6.3. Decision limit and detection capabilityAccording to the European Commission Decision
002/657/EC, CC� (Decision Limit) and CC� (Detectionapability) are new limits that replace limits of detection anduantification, respectively. CC�, is the limit at which a sample
s considered to be truly violative (greater than the MRL) withn error probability of α = 5% for group B substances, suchs antibiotics. CC�, the Detection Capability, is the smallestontent of analyte that can be detected, identified and quantifiedI)MS
λ (nm) Ions
210 735 (100), 576 (60), 158 (55)232 829 (100), 174 (15)210 838 (100), 414 (80), 679 (35)232 422 (100), 174 (35), 843 (15)287 435 (100), 869 (20), 174 (18)210 772 (100), 814 (10), 435(10)287 916 (100), 174 (15), 772 (10)
2 atog
it
2
oawtpss
2
fea
3
3
rt
spbbsd
mot
0tcfeM5
c[sstah
mtT
5wptrawa
dR
3
pilmqadttnmiewim
Tt5icReaa
fswaefottL2
84 H. Berrada et al. / J. Chrom
n a sample with an error probability of �, which should be lesshan or equal to 5%.
.6.4. Recovery and repeatabilityRepeatability and recovery were assessed by performing tests
n beef liver blank samples. Six aliquots were fortified at 0.5, 1nd 1.5 times the lowest MRL among the selected antibiotics,hich means at 100, 200 and 300 �g/kg, respectively according
o the 2002/657/EC decision. At each level, the analyses wereerformed at least in triplicate to find the mean concentration,tandard deviation and coefficient of variation (%) of the fortifiedamples.
.6.5. StabilityThe stability of the macrolides was determined in two dif-
erent ways: in solvent (stock solutions) and in sample purifiedxtracts (spiked livers at 200 �g/kg) stored before the LC–DADnalysis.
. Results and discussion
.1. Method optimization
Macrolides are basic compounds. This basicity is mainly theesult of their aminosugar content. Consequently, their retentionime is greatly affected by the pH of the mobile phase [25].
For the mobile phase, acetonitrile and phosphate buffer wereelected to adjust the aqueous component of the mobile phase toH 3.5 because of its low absorbance at low wavelengths. Theinary elution gradient used was selected because it provided theest-defined peaks and sufficient separation for the macrolidestudied. The retention times and detector parameters used toetermine the seven macrolides are shown in Table 1.
Experimental and instrumental conditions were first opti-ized for the liquid chromatography analysis in a single run
f standard mixtures of these compounds. In the second step,he method was applied to real liver and kidney samples.
The concentrations for the calibration graphs were between.05 and 5 �g/ml because the MRLs of macrolides in foods afterreatment were probably within this range. The linear correlationoefficients (r2) were all above 0.9990 except the erythromycinor which it was 0.992. The instrumental detection limit (DL) ofach analyte was calculated following the equation proposed byiller and Miller [26]. All detection limit values were 20 and
0 �g/l, except for erythromycin for which it was 100 �g/l.It has been reported that basic molecules (e.g. macrolides)
ontaining amino sugars are strongly affected by silanol groups27]. Because of the polarity of this aminosugar, a polymerorbent with a hydrophilic group in its structure seemed to beuitable for the SPE. In a published study, Wang et al. [28] testedhe C18 and Oasis HLB cartridges to find the most appropri-te sorbent for binding the target compounds. Recoveries wereighest for the Oasis HLB cartridges.
Before the SPE of real samples was studied, the perfor-ance of the SPE cartridge was tested on 50-ml volumes of
he McIlvaine–EDTA buffer containing macrolide solutions.hese solutions were prepared at the concentration levels of
ree
r. A 1157 (2007) 281–288
0.0, 100.0, 200.0, 300.0, 500.0 and 1000 �g/l and the resultsere optimized by combining good cleaning power with a highreconcentration factor. As in studies with spiked aqueous solu-ions, methanol was the eluting solvent which gave highestecoveries [28,29]. Different volumes of the methanol (2, 5, 10nd 15 ml) were tested to determine which gave good recoveriesith minor dilutions. With 10 ml of methanol, the recoveries for
ll compounds at 200 �g/kg level were higher than 76%.Different volumes of water (5, 10, 15 and 20) were tested to
etermine which gave the cleanest extract and good recoveries.esults were best with 10 ml of water.
.2. Method validation
As Wang et al. [28] showed endogenous impurities in sam-le extracts affected the quantitative results of macrolides. Thenvestigation was performed on beef liver and kidney. We usediver for validative purposes but also investigated kidney. Matrix-
atched calibration standard curves were used for LC–DAD touantify the macrolides in beef liver and to make the methods accurate as possible. All matrix-matched calibration stan-ard curves were prepared with beef liver, and the correlation ofhe coefficient values (R2) were above 0.99. For the macrolidehat MRL was set, the lowest level permitted at beef and kid-ey animal is 200 �g/kg, so this concentration was chosen as theinimum required performance limit for all the macrolides stud-
ed. The recovery and repeatability of the LC–DAD method wasvaluated by spiking six blank samples of beef liver in triplicateith 100, 200 and 300 �g/kg of each macrolide, correspond-
ng to 0.5, 1 and 1.5 times the lowest permitted limit of theacrolides studied.For intra-day assays, recovery data were also satisfactory.
he values were higher than 67% at 200 �g/kg except for ery-hromycin and troleandomycin, whose recovery values were2% and 60%, respectively and all RSDs were below 13%. Thenter-day repeatability was determined in triplicate on 4 suc-essive days. The recovery values were higher than 62% andSDs were below 10% for all the macrolides studied, exceptrythromycin and troleandomycin which had values of 49%nd 58%, respectively, and the RSDs were below 15%. Thenalytical results are summarized in Table 2.
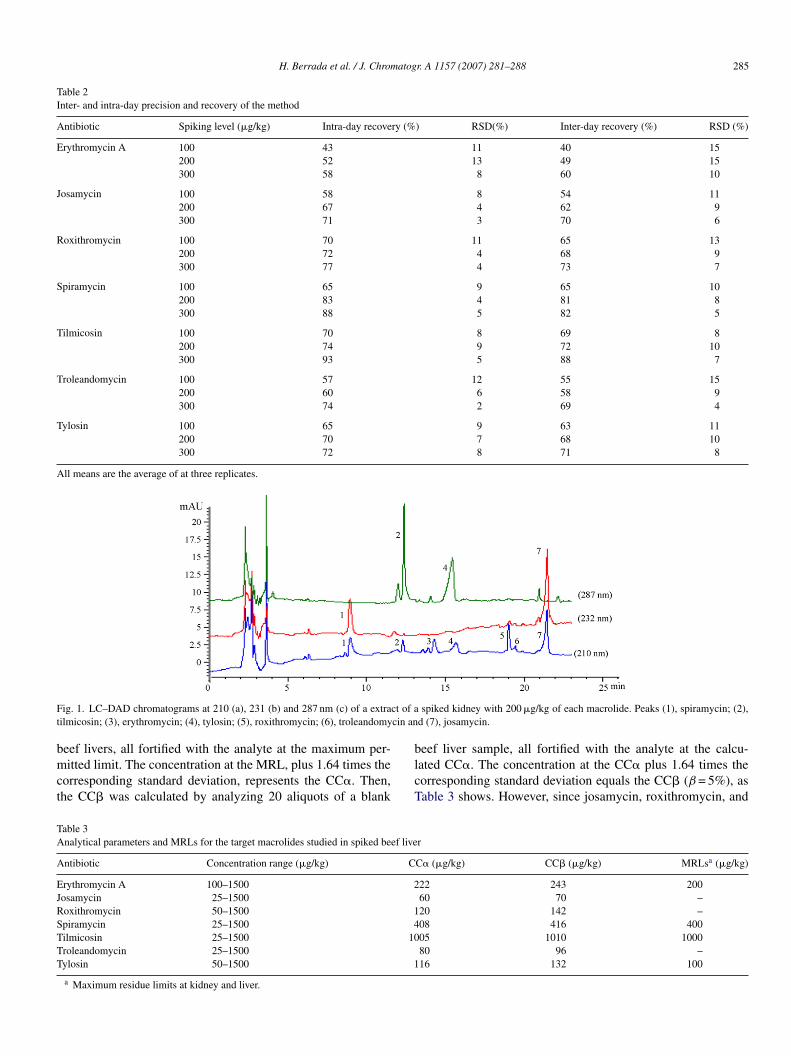
The whole procedure was applied to 20 blank samples of dif-erent origins (beef, chicken, lamb, pig and rabbit) to verify thepecifity of the method and it was shown that no interferenceas detected around the retention time of the seven analytes in
ny of the livers analyzed. The recovery values of the macrolidesxtracted from different matrices were similar (the differencesound were less than 15%), indicating that the matrix effectsf the origin liver were minimal. The specified SPE extrac-ion procedures generated interference-free chromatograms athe retention times of the macrolides studied and Fig. 1 showsC–DAD chromatograms of spiked beef kidney samples at00 �g/kg.
The analytical limits CC� and CC� were determined asequired by Commission Decision 2002/657/EC. In the case ofrythromycin, spiramycin, tylosin and tilmicosin, which have anstablished MRL, CC� was calculated by analyzing 20 blank
H. Berrada et al. / J. Chromatogr. A 1157 (2007) 281–288 285
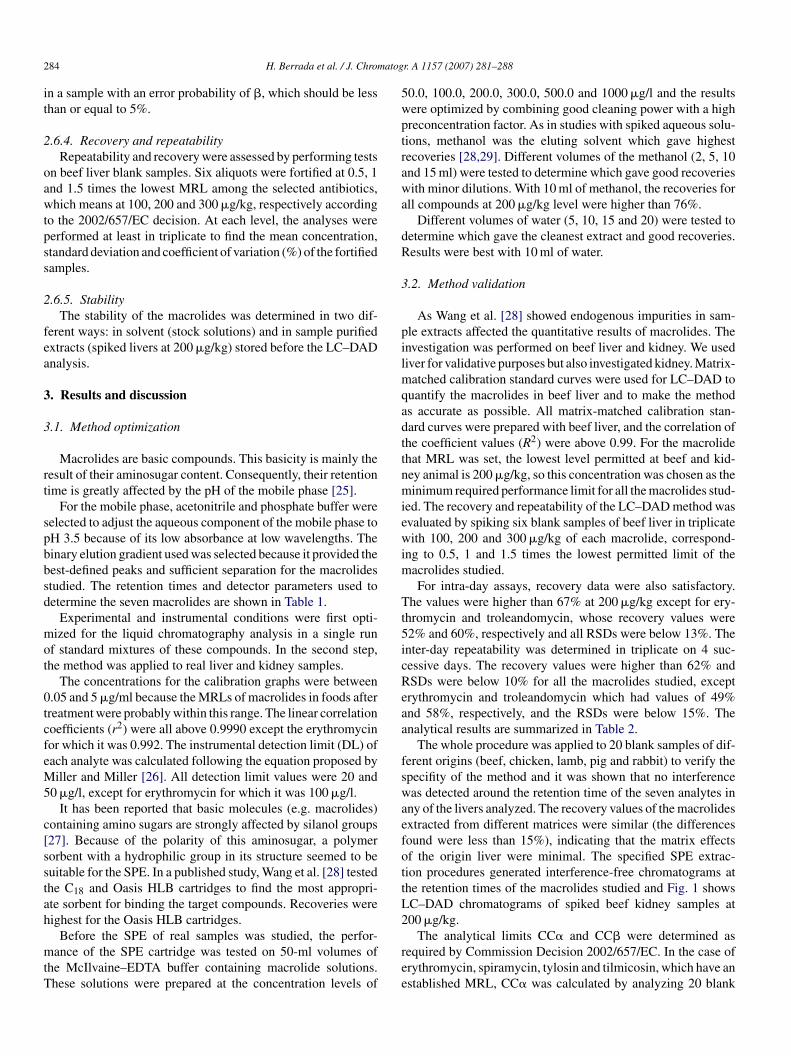
Table 2Inter- and intra-day precision and recovery of the method
Antibiotic Spiking level (�g/kg) Intra-day recovery (%) RSD(%) Inter-day recovery (%) RSD (%)
Erythromycin A 100 43 11 40 15200 52 13 49 15300 58 8 60 10
Josamycin 100 58 8 54 11200 67 4 62 9300 71 3 70 6
Roxithromycin 100 70 11 65 13200 72 4 68 9300 77 4 73 7
Spiramycin 100 65 9 65 10200 83 4 81 8300 88 5 82 5
Tilmicosin 100 70 8 69 8200 74 9 72 10300 93 5 88 7
Troleandomycin 100 57 12 55 15200 60 6 58 9300 74 2 69 4
Tylosin 100 65 9 63 11200 70 7 68 10300 72 8 71 8
All means are the average of at three replicates.
F ct of at cin an
bmct
TA
A
EJRSTTT
ig. 1. LC–DAD chromatograms at 210 (a), 231 (b) and 287 nm (c) of a extrailmicosin; (3), erythromycin; (4), tylosin; (5), roxithromycin; (6), troleandomy
eef livers, all fortified with the analyte at the maximum per-itted limit. The concentration at the MRL, plus 1.64 times the
orresponding standard deviation, represents the CC�. Then,he CC� was calculated by analyzing 20 aliquots of a blank
blcT
able 3nalytical parameters and MRLs for the target macrolides studied in spiked beef live
ntibiotic Concentration range (�g/kg) C
rythromycin A 100–1500 2osamycin 25–1500oxithromycin 50–1500 1piramycin 25–1500 4ilmicosin 25–1500 10roleandomycin 25–1500ylosin 50–1500 1
a Maximum residue limits at kidney and liver.
spiked kidney with 200 �g/kg of each macrolide. Peaks (1), spiramycin; (2),d (7), josamycin.
eef liver sample, all fortified with the analyte at the calcu-ated CC�. The concentration at the CC� plus 1.64 times theorresponding standard deviation equals the CC� (β = 5%), asable 3 shows. However, since josamycin, roxithromycin, and
r
C� (�g/kg) CC� (�g/kg) MRLsa (�g/kg)
22 243 20060 70 –20 142 –08 416 40005 1010 100080 96 –16 132 100
2 atog
tifaoartCsst[
iiocot
hawscctd2
ptgiiftaiii
pitws
2cthtr
3
mcbews
tf(ia<F
rswrs
f
86 H. Berrada et al. / J. Chrom
roleandomycin are not licensed for use in veterinary products,t does not have an established MRL and as a consequence, foodor human consumption should be free from. Therefore, CC�nd CC� cannot be calculated with the same method as thether macrolides. CC� was calculated for these macrolides bynalyzing 20 blanks to be able to calculate the signal to noiseatio at the time window in which the analyte is expected. Threeimes the signal to noise ratio can be used as decision limit andC� was calculated by analyzing 20 blanks spiked at the deci-
ion limit. The values of the decision limit plus 1.64 times thetandard deviation of the within-laboratory reproducibility ofhe measured content equals the detection capability (β = 5%)24].
The stability of the standard solutions in methanol was stud-ed. The stock solutions were analyzed every week and thenstrumental responses were compared with the peak areasbtained at the moment of solution preparation. The acceptanceriterion was a response between 95% and 105% of the initialne and no degradation phenomena observable during a storageime of 3 months at 4 ◦C.
In order to check the stability of the purified extracts, aomogenized blank beef liver sample was divided into fiveliquots and each aliquot was fortified at 200 �g/kg. One aliquotas analyzed immediately and the remaining aliquots were
tored at 4 ◦C and analyzed after 2, 7, 10 and 15 days. Theoncentration of the analytes in each aliquot was calculated byonsidering the solution of the analyte freshly prepared at theime of analysis to be 100%. It was shown to be stable up to 15ays. Consequently, the purified extract can be stored for at leastweeks before instrumental determination.LC–(ESI)MS also provides structural data about the com-
ounds. It is a very useful tool for confirmatory purposes andhe qualitative information provided enabled us to confirm theood chromatographic separations of the seven macrolides stud-ed. However, since the fragmentation with the ESI interfaces rather limited, it is often difficult to meet the EU criteriaor residue analysis and satisfactorily confirm the identity ofhe analytes. In this case, LC–(ESI)-MS supplies information
bout the molecular ion, which is very valuable for checking thedentity of the compound, especially when its molecular masss relatively high, as it is for macrolides. Erythromycin, rox-thromycin, spiramycin, tilmicosin, troleandomycin and tylosinFig. 2. LC–DAD chromatogram of extract of rabbit liver sample where tilm
c
tt
r. A 1157 (2007) 281–288
rovided the three diagnostic ions required to confirm thedentity of compounds with an established MRL. No fragmen-ation was obtained for josamycin. Therefore, LC–(ESI)MSas used as a complementary technique to confirm positive
amples.Therefore, the calibration curves were established between
5 and 1000 �g/kg and linearity was good with a deviationoefficient (r2) equal or higher than 0.99. As expected, rela-ive standard deviations (RSDs) ranged between 12% and 26%,igher than those obtained with DAD detection, even thoughhe limits of detection at ESI-MS detector were 10 times lower,anged from 15 to 50 �g/kg.
.3. Application to real samples
The analytical method developed was used to determine theacrolides studied in 25 animal livers and 6 animal kidneys pur-
hased from the Tarragona and Reus market places (Spain). Sixeef livers, five chicken livers, four lamb livers, seven pig liv-rs, three rabbit livers, three beef kidneys and three pig kidneysere purchased to investigate the occurrence of the macrolides
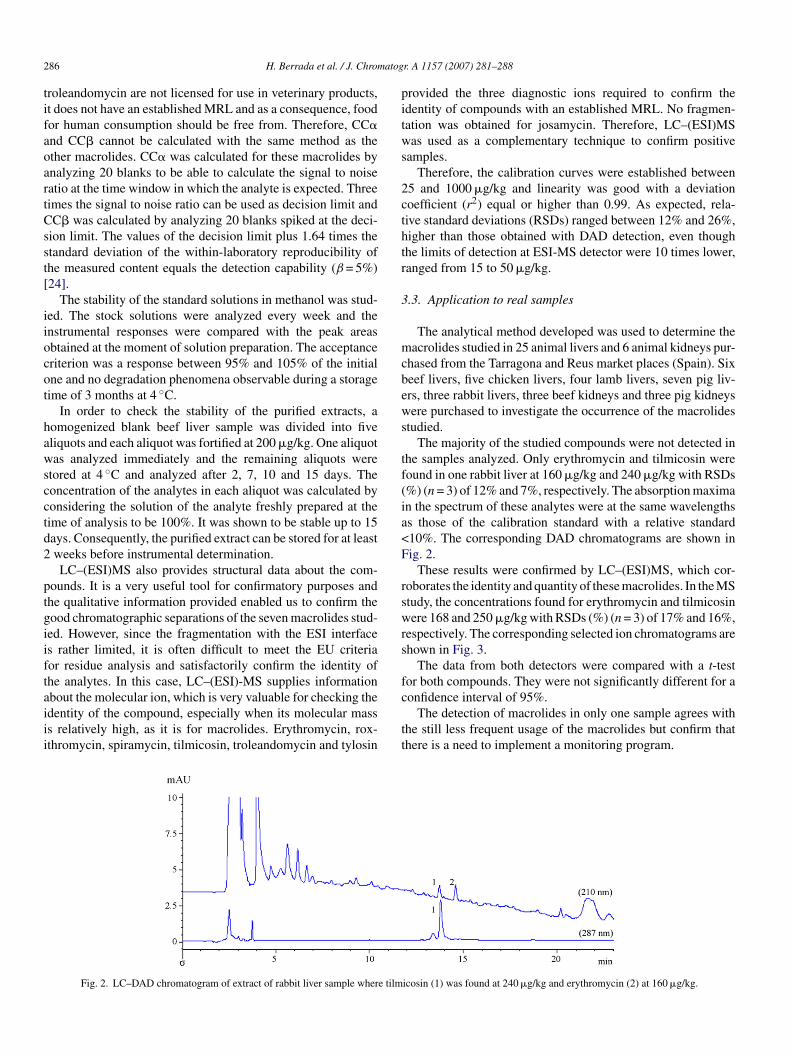
tudied.The majority of the studied compounds were not detected in
he samples analyzed. Only erythromycin and tilmicosin wereound in one rabbit liver at 160 �g/kg and 240 �g/kg with RSDs%) (n = 3) of 12% and 7%, respectively. The absorption maximan the spectrum of these analytes were at the same wavelengthss those of the calibration standard with a relative standard10%. The corresponding DAD chromatograms are shown inig. 2.
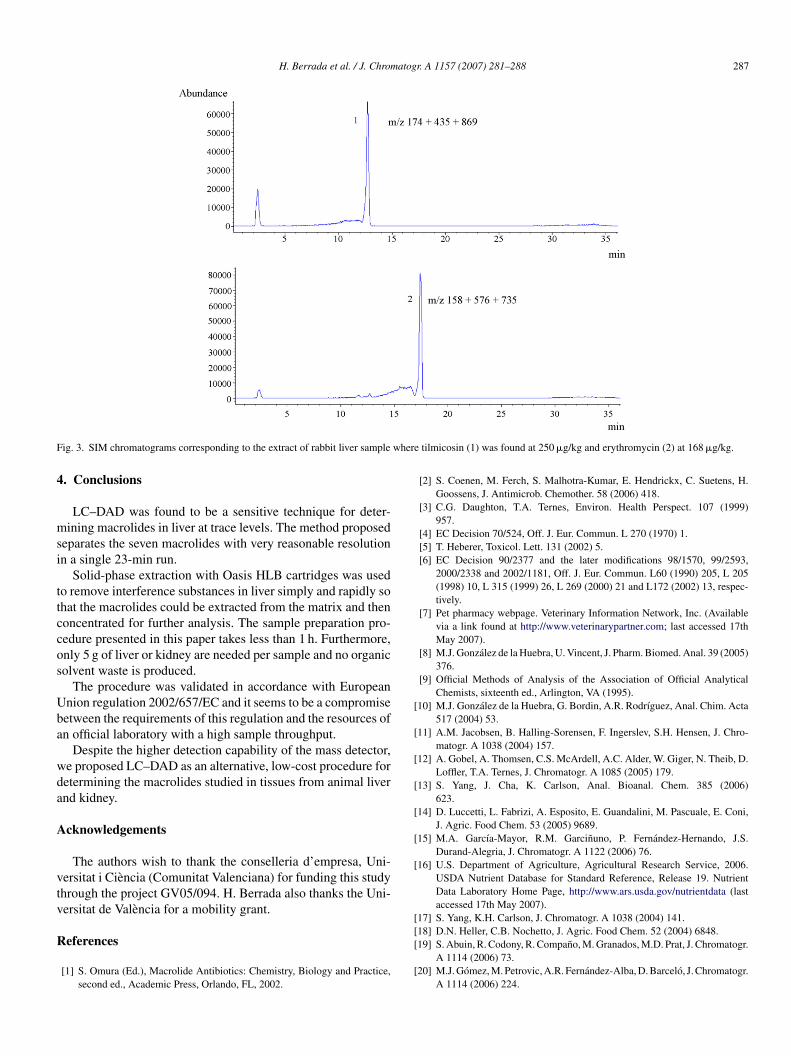
These results were confirmed by LC–(ESI)MS, which cor-oborates the identity and quantity of these macrolides. In the MStudy, the concentrations found for erythromycin and tilmicosinere 168 and 250 �g/kg with RSDs (%) (n = 3) of 17% and 16%,
espectively. The corresponding selected ion chromatograms arehown in Fig. 3.
The data from both detectors were compared with a t-testor both compounds. They were not significantly different for a
icosin (1) was found at 240 �g/kg and erythromycin (2) at 160 �g/kg.
onfidence interval of 95%.The detection of macrolides in only one sample agrees with
he still less frequent usage of the macrolides but confirm thathere is a need to implement a monitoring program.
H. Berrada et al. / J. Chromatogr. A 1157 (2007) 281–288 287
F where
4
msi
ttccos
Uba
wda
A
vtv
R
[
[
[
[
[
[
[
[
ig. 3. SIM chromatograms corresponding to the extract of rabbit liver sample
. Conclusions
LC–DAD was found to be a sensitive technique for deter-ining macrolides in liver at trace levels. The method proposed
eparates the seven macrolides with very reasonable resolutionn a single 23-min run.
Solid-phase extraction with Oasis HLB cartridges was usedo remove interference substances in liver simply and rapidly sohat the macrolides could be extracted from the matrix and thenoncentrated for further analysis. The sample preparation pro-edure presented in this paper takes less than 1 h. Furthermore,nly 5 g of liver or kidney are needed per sample and no organicolvent waste is produced.
The procedure was validated in accordance with Europeannion regulation 2002/657/EC and it seems to be a compromiseetween the requirements of this regulation and the resources ofn official laboratory with a high sample throughput.
Despite the higher detection capability of the mass detector,e proposed LC–DAD as an alternative, low-cost procedure foretermining the macrolides studied in tissues from animal livernd kidney.
cknowledgements
The authors wish to thank the conselleria d’empresa, Uni-ersitat i Ciencia (Comunitat Valenciana) for funding this studyhrough the project GV05/094. H. Berrada also thanks the Uni-ersitat de Valencia for a mobility grant.
eferences
[1] S. Omura (Ed.), Macrolide Antibiotics: Chemistry, Biology and Practice,second ed., Academic Press, Orlando, FL, 2002.
[[
[
tilmicosin (1) was found at 250 �g/kg and erythromycin (2) at 168 �g/kg.
[2] S. Coenen, M. Ferch, S. Malhotra-Kumar, E. Hendrickx, C. Suetens, H.Goossens, J. Antimicrob. Chemother. 58 (2006) 418.
[3] C.G. Daughton, T.A. Ternes, Environ. Health Perspect. 107 (1999)957.
[4] EC Decision 70/524, Off. J. Eur. Commun. L 270 (1970) 1.[5] T. Heberer, Toxicol. Lett. 131 (2002) 5.[6] EC Decision 90/2377 and the later modifications 98/1570, 99/2593,
2000/2338 and 2002/1181, Off. J. Eur. Commun. L60 (1990) 205, L 205(1998) 10, L 315 (1999) 26, L 269 (2000) 21 and L172 (2002) 13, respec-tively.
[7] Pet pharmacy webpage. Veterinary Information Network, Inc. (Availablevia a link found at http://www.veterinarypartner.com; last accessed 17thMay 2007).
[8] M.J. Gonzalez de la Huebra, U. Vincent, J. Pharm. Biomed. Anal. 39 (2005)376.
[9] Official Methods of Analysis of the Association of Official AnalyticalChemists, sixteenth ed., Arlington, VA (1995).
10] M.J. Gonzalez de la Huebra, G. Bordin, A.R. Rodrıguez, Anal. Chim. Acta517 (2004) 53.
11] A.M. Jacobsen, B. Halling-Sorensen, F. Ingerslev, S.H. Hensen, J. Chro-matogr. A 1038 (2004) 157.
12] A. Gobel, A. Thomsen, C.S. McArdell, A.C. Alder, W. Giger, N. Theib, D.Loffler, T.A. Ternes, J. Chromatogr. A 1085 (2005) 179.
13] S. Yang, J. Cha, K. Carlson, Anal. Bioanal. Chem. 385 (2006)623.
14] D. Luccetti, L. Fabrizi, A. Esposito, E. Guandalini, M. Pascuale, E. Coni,J. Agric. Food Chem. 53 (2005) 9689.
15] M.A. Garcıa-Mayor, R.M. Garcinuno, P. Fernandez-Hernando, J.S.Durand-Alegria, J. Chromatogr. A 1122 (2006) 76.
16] U.S. Department of Agriculture, Agricultural Research Service, 2006.USDA Nutrient Database for Standard Reference, Release 19. NutrientData Laboratory Home Page, http://www.ars.usda.gov/nutrientdata (lastaccessed 17th May 2007).
17] S. Yang, K.H. Carlson, J. Chromatogr. A 1038 (2004) 141.
18] D.N. Heller, C.B. Nochetto, J. Agric. Food Chem. 52 (2004) 6848.19] S. Abuin, R. Codony, R. Compano, M. Granados, M.D. Prat, J. Chromatogr.A 1114 (2006) 73.20] M.J. Gomez, M. Petrovic, A.R. Fernandez-Alba, D. Barcelo, J. Chromatogr.
A 1114 (2006) 224.
2 atog
[
[[[[
[
88 H. Berrada et al. / J. Chrom
21] M. Juhel-Gaugain, B. Anger, M. Laurentie, J. AOAC Int. 82 (1999)
1046.22] M. Hernandez, F. Borrull, M. Calull, Chromatographia 54 (2001) 355.23] EC Decision 96/23, Off. J. Eur. Commun. L 125 (1996) 10.24] EC Decision 2002/657, Off. J. Eur. Commun. L 221 (2002) 8.25] J.R. Meinertz, G.R. Stehly, W.H. Gingerich, J. AOAC Int. 81 (1998) 702.
[
[[
r. A 1157 (2007) 281–288
26] J.C. Miller, J.N. Miller, Statistics for Analytical Chemistry, third ed., Ellis
Horwood TR Prentice-Hall, West Sussex, UK, 1993, pp. 115.27] M. Horie, K. Saito, I. Ishii, T. Yoshida, Y. Haramaki, H. Nakazawa, J.Chromatogr. A 812 (1998) 295.
28] J. Wang, D. Leung, F. Butterworth, J. Agric. Food Chem. 53 (2005) 1857.29] J. Wang, J. Agric. Food Chem. 52 (2004) 171.