Determination of some endocrine disrupter chemicals in urban wastewater samples using liquid...
8
Determination of some endocrine disrupter chemicals in urban wastewater samples using liquid chromatography–mass spectrometry Alberto Zafra-Gómez, Oscar Ballesteros ⁎ , Alberto Navalón, José Luís Vílchez Research Group of Analytical Chemistry and Life Sciences, Department of Analytical Chemistry, University of Granada, Campus of Fuentenueva, E-18071 Granada, Spain Received 20 August 2007; received in revised form 5 October 2007; accepted 5 October 2007 Available online 16 October 2007 Abstract An analytical method for the simultaneous determination of trace amounts of fourteen endocrine disrupter chemicals (EDCs) in urban wastewater samples has been developed. The studied compounds were: bisphenol A and its chlorinated derivatives (monochloro, dichloro, trichloro and tretrachlorobisphenol A), three alkylphenols (4-n-nonyl, 4-n-octyl and 4-(tert-octyl)phenol) and six well known phthalate esters (dimethyl, diethyl, di-n-butyl, butylbenzyl, bis(2-ethylhexyl) and di-n-octylphthalate). The method involves extraction from the samples and preconcentration of the analytes using a solid-phase extraction (SPE) procedure and subsequent liquid chromatographic separation with mass spectrometric detection (LC-MS). Bisphenol F was used as a surrogate. Quantification limits found ranged between 12 ng L - 1 for diethylphthalate and 69 ng L - 1 for 4-(tert-octyl)phenol. The method was satisfactorily used for determination of these chemicals in urban wastewater samples of Granada City (Spain) and validated using a recovery assay with spiked samples. © 2007 Elsevier B.V. All rights reserved. Keywords: Alkylphenols; Bisphenol A; Bisphenol A chlorinated derivatives; Alkylphenols; Phthalate esters; Liquid chromatography–mass spectrometry (LC–MS); Wastewater analysis 1. Introduction In recent years, a specific category of human made chemicals, called commonly endocrine disrupter chemicals (EDCs), has attracted a great deal of public and scientific attention because of their suspected carcinogenic and estrogenic properties. In 1996, the European Union (EU) defined this class of compounds as “exogenous substances that cause adverse health effects in an intact organism, or its progeny, consequent to changes in endocrine function” [1]. Emerging evidence from wildlife and laboratory studies indicates that some synthetic chemicals may interfere with the endocrine system in a broad variety of ways, including the initiation of hormones, blocking their action or accelerating their breakdown [2]. Aware of the problem, both, the EU and the US Environmental Protection Agency (EPA) have authored a “priority” list of substances for further evaluation of their role in endocrine disruption [3,4] indicating the need to assess the levels and effects of EDCs. A report from the EU [5] proposed a candidate list of 533 substances for further evaluation of their role in endocrine disruption. Moreover, incremental growth in dysfunctions related to male reproductive health has been demonstrated [6,7]. Both, human and wildlife are exposed to complex mixtures of these compounds. Effects are cumulative and it could be that they will only appear in subsequent generations. Meantime the resulting effects may be irreversible, threatening sustainable human development. Most EDCs are introduced into the environment by way of anthropogenic inputs and are therefore ubiquitous in aquatic environments receiving wastewater effluents. Although it is possible that a large amount of EDCs remain yet unidentified, it is clear that there are some identified families of compounds showing potential estrogenic activity. Plastic industry intermediates Available online at www.sciencedirect.com Microchemical Journal 88 (2008) 87 – 94 www.elsevier.com/locate/microc ⁎ Corresponding author. Tel.: +34 958 243326; fax: +34 958 243328. E-mail address: [email protected] (O. Ballesteros). 0026-265X/$ - see front matter © 2007 Elsevier B.V. All rights reserved. doi:10.1016/j.microc.2007.10.003
-
Upload
independent -
Category
Documents
-
view
2 -
download
0
Transcript of Determination of some endocrine disrupter chemicals in urban wastewater samples using liquid...
Available online at www.sciencedirect.com
88 (2008) 87–94www.elsevier.com/locate/microc
Microchemical Journal
Determination of some endocrine disrupter chemicals in urban wastewatersamples using liquid chromatography–mass spectrometry
Alberto Zafra-Gómez, Oscar Ballesteros ⁎, Alberto Navalón, José Luís Vílchez
Research Group of Analytical Chemistry and Life Sciences, Department of Analytical Chemistry, University of Granada,Campus of Fuentenueva, E-18071 Granada, Spain
Received 20 August 2007; received in revised form 5 October 2007; accepted 5 October 2007Available online 16 October 2007
Abstract
An analytical method for the simultaneous determination of trace amounts of fourteen endocrine disrupter chemicals (EDCs) in urbanwastewater samples has been developed. The studied compounds were: bisphenol A and its chlorinated derivatives (monochloro, dichloro,trichloro and tretrachlorobisphenol A), three alkylphenols (4-n-nonyl, 4-n-octyl and 4-(tert-octyl)phenol) and six well known phthalate esters(dimethyl, diethyl, di-n-butyl, butylbenzyl, bis(2-ethylhexyl) and di-n-octylphthalate). The method involves extraction from the samples andpreconcentration of the analytes using a solid-phase extraction (SPE) procedure and subsequent liquid chromatographic separation with massspectrometric detection (LC−MS). Bisphenol F was used as a surrogate. Quantification limits found ranged between 12 ng L− 1 fordiethylphthalate and 69 ng L− 1 for 4-(tert-octyl)phenol. The method was satisfactorily used for determination of these chemicals in urbanwastewater samples of Granada City (Spain) and validated using a recovery assay with spiked samples.© 2007 Elsevier B.V. All rights reserved.
Keywords: Alkylphenols; Bisphenol A; Bisphenol A chlorinated derivatives; Alkylphenols; Phthalate esters; Liquid chromatography–mass spectrometry (LC–MS);Wastewater analysis
1. Introduction
In recent years, a specific category of human madechemicals, called commonly endocrine disrupter chemicals(EDCs), has attracted a great deal of public and scientificattention because of their suspected carcinogenic and estrogenicproperties. In 1996, the European Union (EU) defined this classof compounds as “exogenous substances that cause adversehealth effects in an intact organism, or its progeny, consequentto changes in endocrine function” [1].
Emerging evidence from wildlife and laboratory studiesindicates that some synthetic chemicals may interfere with theendocrine system in a broad variety of ways, including theinitiation of hormones, blocking their action or acceleratingtheir breakdown [2].
⁎ Corresponding author. Tel.: +34 958 243326; fax: +34 958 243328.E-mail address: [email protected] (O. Ballesteros).
0026-265X/$ - see front matter © 2007 Elsevier B.V. All rights reserved.doi:10.1016/j.microc.2007.10.003
Aware of the problem, both, the EU and the USEnvironmental Protection Agency (EPA) have authored a“priority” list of substances for further evaluation of their rolein endocrine disruption [3,4] indicating the need to assess thelevels and effects of EDCs. A report from the EU [5] proposed acandidate list of 533 substances for further evaluation of theirrole in endocrine disruption. Moreover, incremental growth indysfunctions related to male reproductive health has beendemonstrated [6,7]. Both, human and wildlife are exposed tocomplex mixtures of these compounds. Effects are cumulativeand it could be that they will only appear in subsequentgenerations. Meantime the resulting effects may be irreversible,threatening sustainable human development.
Most EDCs are introduced into the environment by way ofanthropogenic inputs and are therefore ubiquitous in aquaticenvironments receiving wastewater effluents. Although it ispossible that a large amount of EDCs remain yet unidentified, itis clear that there are some identified families of compoundsshowing potential estrogenic activity. Plastic industry intermediates
88 A. Zafra-Gómez et al. / Microchemical Journal 88 (2008) 87–94
as bisphenol A or phthalate esters, detergent degradationcompounds, as 4-n-nonylphenol, 4-n-octylphenol and 4-(tert-octyl)phenol are described in scientific literature. It is nowknown that phthalate esters, alkylphenols and bisphenol A (BPA)are potential endocrine disrupter chemicals [8,9]. Let us see someof their uses till now.
Bisphenol A is mainly used as a monomer in the preparationof epoxide resins, polycarbonate plastic and as an antioxidant inpolyvinylchloride [10]. Levels of BPA have been found indifferent matrices such as body fluids, canned food andenvironmental samples as wastewaters. The use of chlorinefor disinfecting wastewaters or drinking water has becomewidespread over the years. BPA present in waters may reactwith residual chlorine originally used as a disinfectant,producing chlorinated BPA derivatives [11]. PolychlorinatedBPA has been recently identified and biodegradation tests usingactivated sludge revealed that it is not easily biodegraded [12],and chlorinated BPA being more cytotoxic than BPA [13].
Alkylphenols such as 4-n-nonylphenol, 4-n-octylphenoland 4-(tert-octyl)phenol are widely used as intermediates toproduce surfactants (anionic and non-ion surfactants) and asstabilizers of ethyl cellulose resin, oil-soluble phenol resin andesters [14,15].
Phthalate esters are one of the most abundant man-madeenvironmental pollutants. They are widely used as additives inthe manufacture of plastics to make them flexible. Because oftheir properties as plasticizers in plastic production and becauseits use has increased significantly in recent years, they are oftenfound in environmental matrices such as waters and soils [16].Six of the most commonly used phthalates are dimethyl, diethyl,di-n-butyl, butylbenzyl, bis(2-ethylhexyl) and di-n-octylphtha-late. Bis(2-ethylhexyl) phthalate is the most used and accountsfor up to one quarter of the total production of plasticizers [17].There is a high industrial activity associated with them andrelatively large amounts of these compounds are released intothe environment, wastewater being the most common way tointroduce these contaminants into the environment [16–19].
Gas chromatography (GC) and liquid chromatography (LC),after previous concentration and clean-up, have been used fordetermining these compounds in water samples. Commonly,their preconcentration and clean-up involves liquid–liquidextraction (LLE) with cyclohexane [20] or dichloromethane[21,22], solid-phase extraction (SPE) [16–19,23–25] or solid-phase microextraction (SPME) [26]. After an extensivebibliographic revision, SPE seems to be the most usedprocedure for the isolation, preconcentration and clean-up ofEDCs in environmental matrices.
In this paper a new liquid chromatographic–mass spectro-metric (LC−MS) method has been developed for determinationof EDCs in wastewaters. It involves a SPE procedure for theextraction of studied compounds from the samples. Theexperimental conditions for SPE were optimized and themethod was validated under the best conditions using urbanwastewater samples from Granada City. The method is simple,reducing the potential for analyte loss during the extraction,avoiding derivatization steps, minimizing solvent use andconsequently reducing environmental contamination.
2. Experimental
2.1. Reagents
All reagents were of analytical grade unless specifiedotherwise. Water (18 MΩ/cm) was purified with a Milli-Qplus system (Millipore, Bedford, MA, USA).
4-n-Nonylphenol (4-NP), 4-n-octylphenol (4-OP), 4-(tert-octyl)phenol (4-t-OP), bisphenol F (BPF), bisphenol A (BPA)and tretrachlorobisphenol A (Cl4-BPA) were supplied bySigma-Aldrich (Madrid, Spain). Monochloro, dichloro andtrichloro bisphenol A (Cl-BPA, Cl2-BPA, Cl3-BPA) weresynthesized in our laboratory [27]. Phthalate esters dimethyl(DMP), diethyl (DEP), di-n-butyl (DBP), butylbenzyl (BBP),bis(2-ethylhexyl) (BEHP) and di-n-octylphthalate (DOP) weresupplied by Fluka (Buchs, Switzerland).
Stock standard solutions (100 mg L− 1) of each EDC wereprepared in acetonitrile and stored in dark bottles at 4 °C untiluse, remaining stable for at least three months.
Acetonitrile (HPLC-gradient grade), methanol, diethyl ether,dichloromethane, hexane, o-phosphoric acid, acetic acid andsodium hydroxide were purchased from Panreac (Barcelona,Spain). Formic acid and trifluoroacetic acid were supplied bySigma-Aldrich. All solvents and reagents were checked toensure they were free of contamination from phthalate esters.
Solid-phase extraction sorbents used were silica-basedbonded C18 cartridges LiChrolut RP-18 (500 mg, 3 mL) fromMerck (Darmstadt, Germany).
All solvents and solutions prepared for LC were filteredthrough 0.22 μm cellulose acetate disk filters (Millipore) beforeuse.
2.2. Instrumentation and software
Analyses were performed using a Waters Alliance 2695(Mildford, MA, USA) high-performance liquid chromatographequipped with a quaternary pump, a vacuum membranedegasser, a thermostated column compartment, an automaticautosampler, an automatic injector and connected “on-line” to aWaters 2996 photodiode array detector (DAD) and a WatersMicromass ZQ 2000 quadrupole mass spectrometer system thatcan use either atmospheric pressure chemical ionization (APCI)or electrospray ionization (ESI) interfaces. Acquisition modes(SIM and full SCAN) can be used simultaneously. Masslynx 4.0software (Waters) was used for instrument control and for dataacquisition and analysis.
A Gemini C18 (150 mm×4.6 mm i.d., 5 μm particle size)from Phenomenex (Torrance, CA, USA), a Chromolith RP-18e(100 mm×4.6 mm i.d.) from Merck and a Zorbax EclipseXDB-C8 (150 mm×4.6 mm i.d., 5 μm particle size) fromAgilent Technologies (Palo Alto, CA, USA) liquid chromato-graphic columns were tested.
SPE was carried out on a Supelco (Madrid, Spain) vacuummanifold for 12 columns connected to a Supelco vacuum tankand to a vacuum pump.
Statgraphics software package [28] was used for the statisticalanalysis of data.
89A. Zafra-Gómez et al. / Microchemical Journal 88 (2008) 87–94
2.3. Sample preparation
Urbanwastewater samples were collected from different pointsin the city ofGranada. Theywere placed in glass bottles previouslycleaned with nitric acid (1:1; v/v) and the usual precautions weretaken to avoid contamination. Samples were centrifuged at4500 rpm (2400 ×g) for 10 min, filtered through a 0.22 μmcellulose acetate disk filter (Millipore) and stored in the dark at4 °C, until treatment was performed, which occurred within 48 hof sample collection in all cases. The analysis was performed withthe minimum possible delay and as is described below.
2.4. Solid-phase extraction procedure
Prior to extraction, the wastewater samples were spiked withbisphenol F as a surrogate at a concentration of 1 μg L−1. TheLiChrolut RP-18 solid-phase extraction cartridges were condi-tioned with 5 mL of diethyl ether, 5 mL methanol and 5 mL of
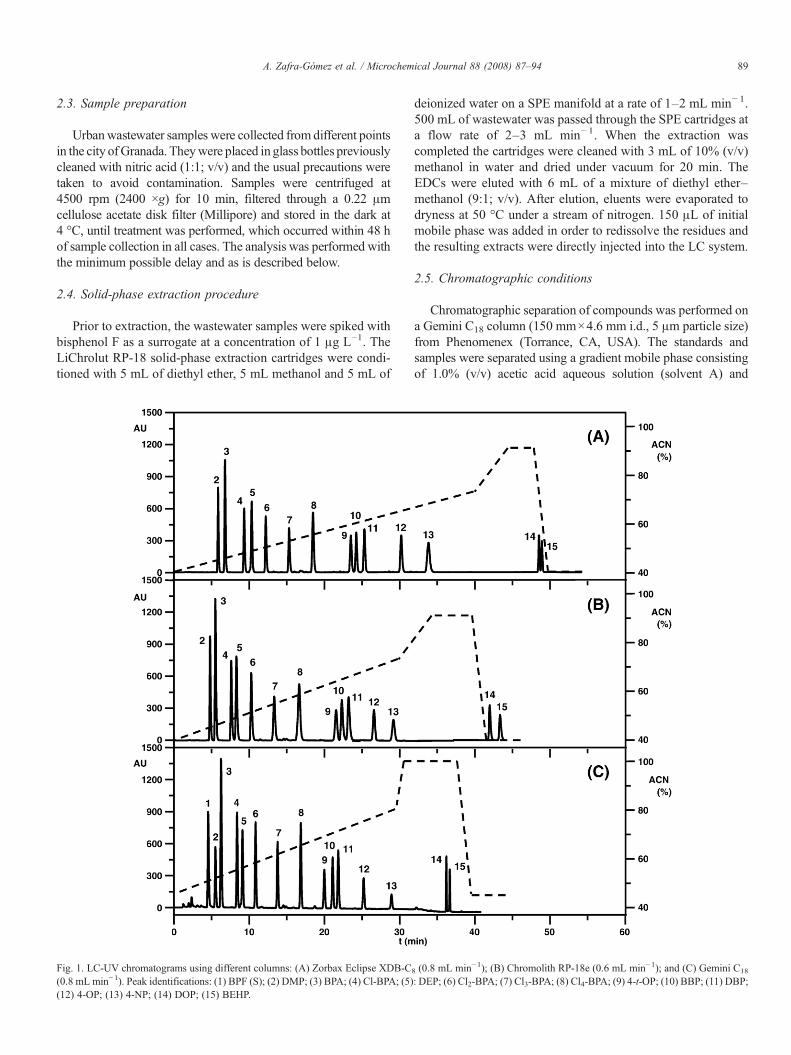
Fig. 1. LC-UV chromatograms using different columns: (A) Zorbax Eclipse XDB-C(0.8 mL min−1). Peak identifications: (1) BPF (S); (2) DMP; (3) BPA; (4) Cl-BPA; (5)(12) 4-OP; (13) 4-NP; (14) DOP; (15) BEHP.
deionized water on a SPE manifold at a rate of 1–2 mL min− 1.500 mL of wastewater was passed through the SPE cartridges ata flow rate of 2–3 mL min− 1. When the extraction wascompleted the cartridges were cleaned with 3 mL of 10% (v/v)methanol in water and dried under vacuum for 20 min. TheEDCs were eluted with 6 mL of a mixture of diethyl ether–methanol (9:1; v/v). After elution, eluents were evaporated todryness at 50 °C under a stream of nitrogen. 150 μL of initialmobile phase was added in order to redissolve the residues andthe resulting extracts were directly injected into the LC system.
2.5. Chromatographic conditions
Chromatographic separation of compounds was performed ona Gemini C18 column (150 mm×4.6 mm i.d., 5 μm particle size)from Phenomenex (Torrance, CA, USA). The standards andsamples were separated using a gradient mobile phase consistingof 1.0% (v/v) acetic acid aqueous solution (solvent A) and
8 (0.8 mL min−1); (B) Chromolith RP-18e (0.6 mL min−1); and (C) Gemini C18
: DEP; (6) Cl2-BPA; (7) Cl3-BPA; (8) Cl4-BPA; (9) 4-t-OP; (10) BBP; (11) DBP;
90 A. Zafra-Gómez et al. / Microchemical Journal 88 (2008) 87–94
acetonitrile (solvent B). The gradient conditions were: 0–30 min,45–80% B; 30–31 min, 80–100% B; and then washing columnwith 100% B for 7 min and return to 45% B in 2 min; finally,reconditioning the column with 45% B isocratic for 5 min. Theflow ratewas 0.8mLmin− 1 and the injection volumewas 100μL.The column temperature was maintained at 40 °C. Total run timewas 40 min and post-delay time was 5 min.
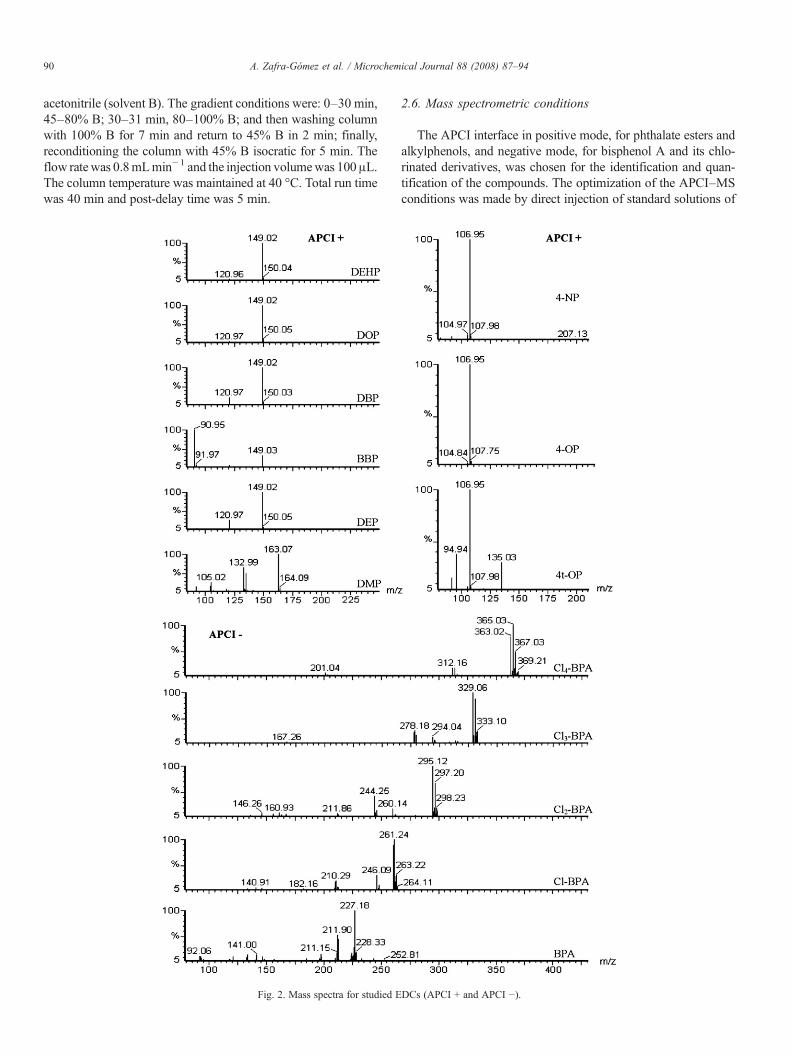
Fig. 2. Mass spectra for studied E
2.6. Mass spectrometric conditions
The APCI interface in positive mode, for phthalate esters andalkylphenols, and negative mode, for bisphenol A and its chlo-rinated derivatives, was chosen for the identification and quan-tification of the compounds. The optimization of the APCI–MSconditions was made by direct injection of standard solutions of
DCs (APCI + and APCI −).
91A. Zafra-Gómez et al. / Microchemical Journal 88 (2008) 87–94
each compound (1 mg L− 1) and the selected parameters were asfollows: source temperature, 120 °C; cone temperature, 20 °C;desolvation temperature, 350 °C; discharge voltage, 4.0 kV inpositive mode and 3.0 kV in negative mode; LM and HM res-olution, 15.0; ion energy 0.5 and multiplier, 650 V. Nitrogen wasused as both the desolvation gas (400 L h− 1) and as the cone gas(80 L h− 1). Optimization of the cone voltage was carried out byscanning the voltage from 10 to 100 V with the full SCAN modewith a scan time of 0.1 s; 50 V for both ionizationmodes (positiveand negative) was selected.
3. Results and discussion
3.1. Preconcentration procedure
Due to the complex nature of wastewater, a SPE was selectedas appropriate to extract analytes from the samples previouslyfiltered.
Solid-phase extraction procedure, described in Section 2.4,was optimized by the authors in a previous work [29].
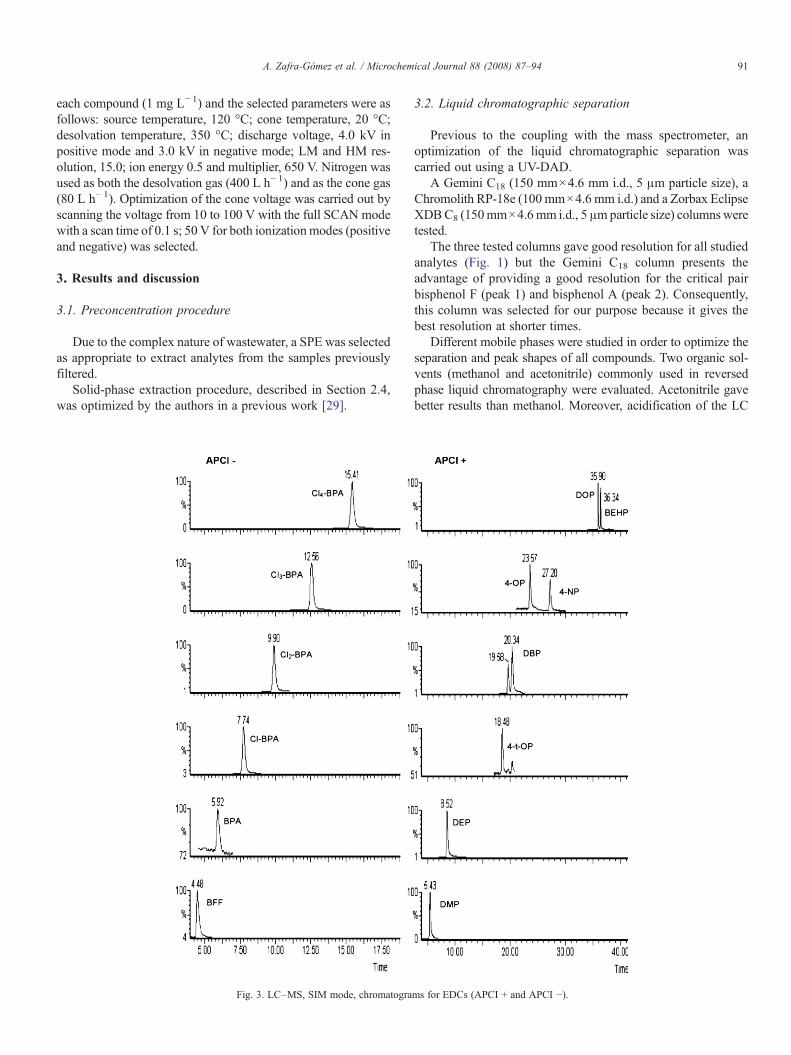
Fig. 3. LC–MS, SIM mode, chromatogra
3.2. Liquid chromatographic separation
Previous to the coupling with the mass spectrometer, anoptimization of the liquid chromatographic separation wascarried out using a UV-DAD.
A Gemini C18 (150 mm×4.6 mm i.d., 5 μm particle size), aChromolith RP-18e (100 mm×4.6 mm i.d.) and a Zorbax EclipseXDBC8 (150mm×4.6mm i.d., 5 μmparticle size) columnsweretested.
The three tested columns gave good resolution for all studiedanalytes (Fig. 1) but the Gemini C18 column presents theadvantage of providing a good resolution for the critical pairbisphenol F (peak 1) and bisphenol A (peak 2). Consequently,this column was selected for our purpose because it gives thebest resolution at shorter times.
Different mobile phases were studied in order to optimize theseparation and peak shapes of all compounds. Two organic sol-vents (methanol and acetonitrile) commonly used in reversedphase liquid chromatography were evaluated. Acetonitrile gavebetter results than methanol. Moreover, acidification of the LC
ms for EDCs (APCI + and APCI −).
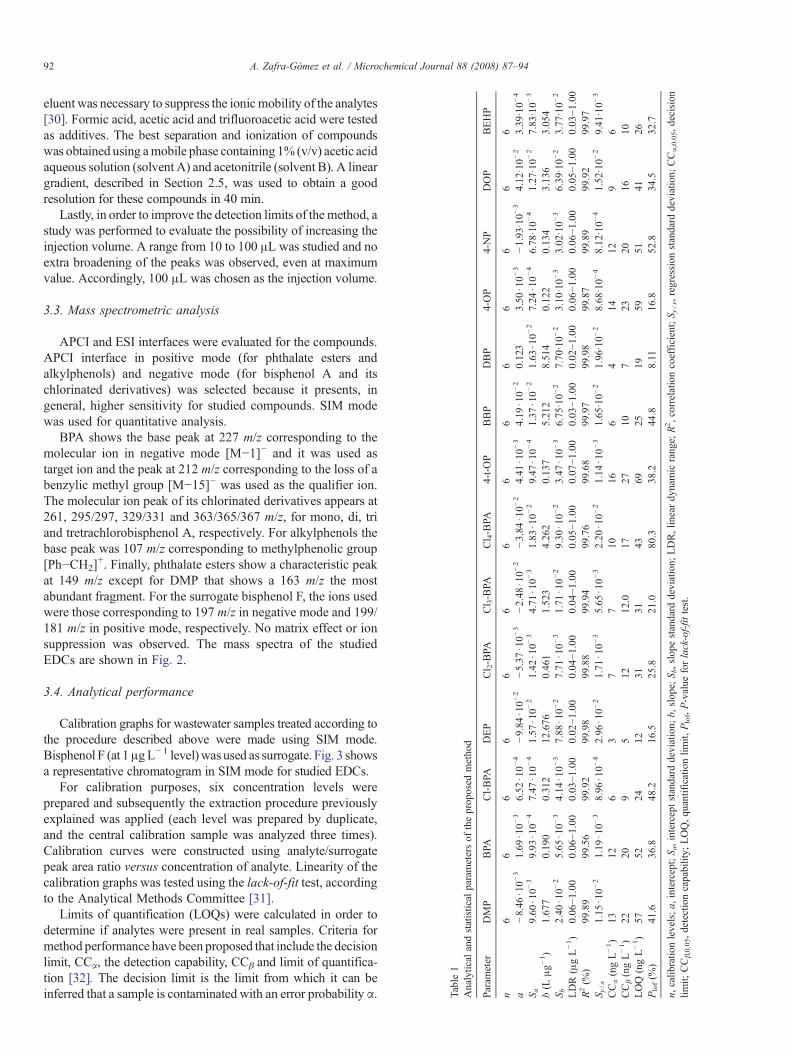
Table1
Analytical
andstatistical
parametersof
theproposed
method
Param
eter
DMP
BPA
Cl-BPA
DEP
Cl 2-BPA
Cl 3-BPA
Cl 4-BPA
4-t-OP
BBP
DBP
4-OP
4-NP
DOP
BEHP
n6
66
66
66
66
66
66
6a
−8.46
·10−
31.69
·10−
36.52
·10−
4−9.84
·10−
2−5.37
·10−
3−2.48
·10−
2−3.84
·10−
24.41
·10−
34.19
·10−
20.123
3.50
·10−
3−1.93·10−
34.12
·10−
23.39·10−
4
S a9.60
·10−
39.93
·10−
47.47
·10−
41.57
·10−
21.42
·10−
34.71
·10−
31.83
·10−
29.47
·10−
41.37
·10−
21.63
·10−
27.24
·10−
46.78·10−
41.27
·10−
27.83·10−
3
b(L
μg−1)
1.67
70.190
0.31
212
.676
0.46
11.523
4.262
0.13
75.212
8.514
0.12
20.134
3.13
63.054
S b2.40
·10−
25.65
·10−
34.14
·10−
37.88
·10−
27.71
·10−
31.71
·10−
29.30
·10−
23.47
·10−
36.75·10−
27.70·10−
23.10
·10−
33.02·10−
36.39
·10−
23.77·10−
2
LDR(μgL−1)
0.06−1
.00
0.06−1
.00
0.03−1
.00
0.02−1
.00
0.04−1
.00
0.04−1
.00
0.05−1
.00
0.07−1
.00
0.03−1
.00
0.02−1
.00
0.06−1
.00
0.06−1
.00
0.05−1
.00
0.03−1
.00
R2(%
)99
.89
99.56
99.92
99.98
99.88
99.94
99.76
99.68
99.97
99.98
99.87
99.89
99.92
99.97
S y/x
1.15
·10−
21.19
·10−
38.96
·10−
42.96
·10−
21.71
·10−
35.65
·10−
32.20
·10−
21.14
·10−
31.65·10−
21.96·10−
28.68
·10−
48.12·10−
41.52
·10−
29.41·10−
3
CCα(ngL−1)
1312
63
77
1016
64
1412
96
CCβ(ngL−1)
2220
95
1212
.017
2710
723
2016
10LOQ
(ngL−1)
5752
2412
3131
4369
2519
5951
4126
Plof(%
)41
.636
.848
.216
.525
.821
.080
.338
.244
.88.11
16.8
52.8
34.5
32.7
n,calib
ratio
nlevels;a,
intercept;S a,intercept
standard
deviation;
b,slop
e;S b,slope
standard
deviation;
LDR,lineardy
namicrang
e;R2,correlatio
ncoefficient;S y
/x,regressionstandard
deviation;
CCα,0.05,d
ecision
limit;
CCβ,0.05,detectioncapability;
LOQ,quantificationlim
it,Plof,P-value
forlack-of-fit
test.
92 A. Zafra-Gómez et al. / Microchemical Journal 88 (2008) 87–94
eluent was necessary to suppress the ionic mobility of the analytes[30]. Formic acid, acetic acid and trifluoroacetic acid were testedas additives. The best separation and ionization of compoundswas obtained using amobile phase containing 1% (v/v) acetic acidaqueous solution (solvent A) and acetonitrile (solvent B). A lineargradient, described in Section 2.5, was used to obtain a goodresolution for these compounds in 40 min.
Lastly, in order to improve the detection limits of the method, astudy was performed to evaluate the possibility of increasing theinjection volume. A range from 10 to 100 μL was studied and noextra broadening of the peaks was observed, even at maximumvalue. Accordingly, 100 μL was chosen as the injection volume.
3.3. Mass spectrometric analysis
APCI and ESI interfaces were evaluated for the compounds.APCI interface in positive mode (for phthalate esters andalkylphenols) and negative mode (for bisphenol A and itschlorinated derivatives) was selected because it presents, ingeneral, higher sensitivity for studied compounds. SIM modewas used for quantitative analysis.
BPA shows the base peak at 227 m/z corresponding to themolecular ion in negative mode [M−1]− and it was used astarget ion and the peak at 212 m/z corresponding to the loss of abenzylic methyl group [M−15]− was used as the qualifier ion.The molecular ion peak of its chlorinated derivatives appears at261, 295/297, 329/331 and 363/365/367 m/z, for mono, di, triand tretrachlorobisphenol A, respectively. For alkylphenols thebase peak was 107 m/z corresponding to methylphenolic group[Ph−CH2]
+. Finally, phthalate esters show a characteristic peakat 149 m/z except for DMP that shows a 163 m/z the mostabundant fragment. For the surrogate bisphenol F, the ions usedwere those corresponding to 197 m/z in negative mode and 199/181 m/z in positive mode, respectively. No matrix effect or ionsuppression was observed. The mass spectra of the studiedEDCs are shown in Fig. 2.
3.4. Analytical performance
Calibration graphs for wastewater samples treated according tothe procedure described above were made using SIM mode.Bisphenol F (at 1μgL− 1 level)was used as surrogate. Fig. 3 showsa representative chromatogram in SIM mode for studied EDCs.
For calibration purposes, six concentration levels wereprepared and subsequently the extraction procedure previouslyexplained was applied (each level was prepared by duplicate,and the central calibration sample was analyzed three times).Calibration curves were constructed using analyte/surrogatepeak area ratio versus concentration of analyte. Linearity of thecalibration graphs was tested using the lack-of-fit test, accordingto the Analytical Methods Committee [31].
Limits of quantification (LOQs) were calculated in order todetermine if analytes were present in real samples. Criteria formethod performance have been proposed that include the decisionlimit, CCα, the detection capability, CCβ and limit of quantifica-tion [32]. The decision limit is the limit from which it can beinferred that a sample is contaminated with an error probability α.
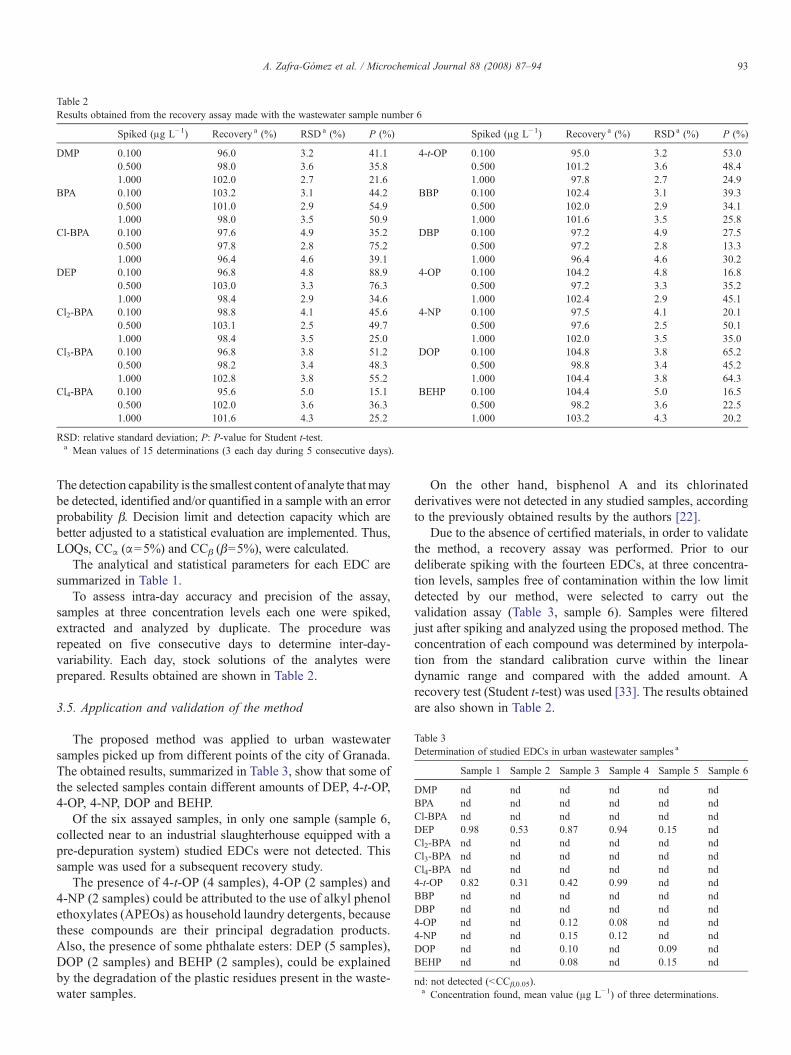
Table 2Results obtained from the recovery assay made with the wastewater sample number 6
Spiked (μg L−1) Recovery a (%) RSDa (%) P (%) Spiked (μg L−1) Recovery a (%) RSDa (%) P (%)
DMP 0.100 96.0 3.2 41.1 4-t-OP 0.100 95.0 3.2 53.00.500 98.0 3.6 35.8 0.500 101.2 3.6 48.41.000 102.0 2.7 21.6 1.000 97.8 2.7 24.9
BPA 0.100 103.2 3.1 44.2 BBP 0.100 102.4 3.1 39.30.500 101.0 2.9 54.9 0.500 102.0 2.9 34.11.000 98.0 3.5 50.9 1.000 101.6 3.5 25.8
Cl-BPA 0.100 97.6 4.9 35.2 DBP 0.100 97.2 4.9 27.50.500 97.8 2.8 75.2 0.500 97.2 2.8 13.31.000 96.4 4.6 39.1 1.000 96.4 4.6 30.2
DEP 0.100 96.8 4.8 88.9 4-OP 0.100 104.2 4.8 16.80.500 103.0 3.3 76.3 0.500 97.2 3.3 35.21.000 98.4 2.9 34.6 1.000 102.4 2.9 45.1
Cl2-BPA 0.100 98.8 4.1 45.6 4-NP 0.100 97.5 4.1 20.10.500 103.1 2.5 49.7 0.500 97.6 2.5 50.11.000 98.4 3.5 25.0 1.000 102.0 3.5 35.0
Cl3-BPA 0.100 96.8 3.8 51.2 DOP 0.100 104.8 3.8 65.20.500 98.2 3.4 48.3 0.500 98.8 3.4 45.21.000 102.8 3.8 55.2 1.000 104.4 3.8 64.3
Cl4-BPA 0.100 95.6 5.0 15.1 BEHP 0.100 104.4 5.0 16.50.500 102.0 3.6 36.3 0.500 98.2 3.6 22.51.000 101.6 4.3 25.2 1.000 103.2 4.3 20.2
RSD: relative standard deviation; P: P-value for Student t-test.a Mean values of 15 determinations (3 each day during 5 consecutive days).
Table 3Determination of studied EDCs in urban wastewater samples a
Sample 1 Sample 2 Sample 3 Sample 4 Sample 5 Sample 6
DMP nd nd nd nd nd ndBPA nd nd nd nd nd ndCl-BPA nd nd nd nd nd ndDEP 0.98 0.53 0.87 0.94 0.15 ndCl2-BPA nd nd nd nd nd ndCl3-BPA nd nd nd nd nd ndCl4-BPA nd nd nd nd nd nd4-t-OP 0.82 0.31 0.42 0.99 nd ndBBP nd nd nd nd nd ndDBP nd nd nd nd nd nd4-OP nd nd 0.12 0.08 nd nd4-NP nd nd 0.15 0.12 nd ndDOP nd nd 0.10 nd 0.09 ndBEHP nd nd 0.08 nd 0.15 nd
nd: not detected (bCCβ,0.05).a Concentration found, mean value (μg L−1) of three determinations.
93A. Zafra-Gómez et al. / Microchemical Journal 88 (2008) 87–94
The detection capability is the smallest content of analyte thatmaybe detected, identified and/or quantified in a sample with an errorprobability β. Decision limit and detection capacity which arebetter adjusted to a statistical evaluation are implemented. Thus,LOQs, CCα (α=5%) and CCβ (β=5%), were calculated.
The analytical and statistical parameters for each EDC aresummarized in Table 1.
To assess intra-day accuracy and precision of the assay,samples at three concentration levels each one were spiked,extracted and analyzed by duplicate. The procedure wasrepeated on five consecutive days to determine inter-day-variability. Each day, stock solutions of the analytes wereprepared. Results obtained are shown in Table 2.
3.5. Application and validation of the method
The proposed method was applied to urban wastewatersamples picked up from different points of the city of Granada.The obtained results, summarized in Table 3, show that some ofthe selected samples contain different amounts of DEP, 4-t-OP,4-OP, 4-NP, DOP and BEHP.
Of the six assayed samples, in only one sample (sample 6,collected near to an industrial slaughterhouse equipped with apre-depuration system) studied EDCs were not detected. Thissample was used for a subsequent recovery study.
The presence of 4-t-OP (4 samples), 4-OP (2 samples) and4-NP (2 samples) could be attributed to the use of alkyl phenolethoxylates (APEOs) as household laundry detergents, becausethese compounds are their principal degradation products.Also, the presence of some phthalate esters: DEP (5 samples),DOP (2 samples) and BEHP (2 samples), could be explainedby the degradation of the plastic residues present in the waste-water samples.
On the other hand, bisphenol A and its chlorinatedderivatives were not detected in any studied samples, accordingto the previously obtained results by the authors [22].
Due to the absence of certified materials, in order to validatethe method, a recovery assay was performed. Prior to ourdeliberate spiking with the fourteen EDCs, at three concentra-tion levels, samples free of contamination within the low limitdetected by our method, were selected to carry out thevalidation assay (Table 3, sample 6). Samples were filteredjust after spiking and analyzed using the proposed method. Theconcentration of each compound was determined by interpola-tion from the standard calibration curve within the lineardynamic range and compared with the added amount. Arecovery test (Student t-test) was used [33]. The results obtainedare also shown in Table 2.
94 A. Zafra-Gómez et al. / Microchemical Journal 88 (2008) 87–94
As the P-values calculated in all cases are greater than 0.05(5%), the null hypothesis appears to be valid, i.e., recoveries areclose to 100% (Table 2).
4. Conclusions
The determination and quantification of a series of EDCs byliquid chromatography with APCI–MS detection in wastewaterwas successfully performed on a Gemini C18 column, with alinear gradient composed of acetonitrile and 1% acetic acidaqueous solution. A solid-phase extraction procedure was usedfor preconcentration of analytes and removal of interferences.The analytical performance of the proposed method wasvalidated and the method has been successfully used for thedetermination of these compounds in urban wastewater samplesfrom different points of the Granada City, with different com-positions, consequently.
Acknowledgement
This work was supported by the Spanish InterministerialCommission of Science and Technology (CICYT) in its “Juande la Cierva” program.
References
[1] W. Summerfield, I. Cooper, Food Addit. Contam. 18 (2001) 77–88.[2] R. Carabias-Martínez, E. Rodríguez-Gonzalo, P. Revilla-Ruiz, J. Chroma-
togr. A 1056 (2004) 131–138.[3] C.H. Groshart, P.C. Okkerman, (BKH, Consulting Engineers), European
Commission DG ENV. 2000, Inform M0355008/1786Q/10/11/00, p 35.[4] USA Environmental Protection Agency, Multi-Year Plan (FY2000-2012)
for Endocrine Disruptors, Office of Research and Development, 2003Available at http://www.epa.gov/osp/myp/edc.pdf.
[5] Communication from the Commission to the Council and the EuropeanParliament, Implementation of the Community Strategy for EndocrineDisruptors: ARange of Substances Suspected of Interferingwith theHormoneSystems of Human and Wildlife, COM (1999) 706, Brussels, 14-06-2001COM (2001) 262 final.
[6] J.A. Brotons, M.F. Olea-Serrano, M. Villalobos, V. Pedraza, N. Olea,Environ. Health Persp. 103 (1995) 608–612.
[7] R. White, S. Jobling, S.A. Hoare, J.P. Sumpter, M.G. Parker, Endocrinol-ogy 135 (1994) 175–182.
[8] N. Casajuana, S. Lacorte, J. Agr. Food Chem. 52 (2004) 3702–3707.[9] G.G. Ying, B. Williams, R. Kookana, Environ. Int. 28 (2002) 215–226.[10] C. Lambert, M. Larroque, J. Chromatogr. Sci. 35 (1997) 57–62.[11] T. Yamamoto, A. Yasuhara, Chemosphere 46 (2002) 1215–1223.[12] H. Fukazawa, M. Watanabe, F. Shiraishi, H. Shiraishi, T. Shiozawa, H.
Matsushita, Y. Terao, J. Health Sci. 48 (2002) 242–249.[13] R. Kuruto-Niwa, Y. Terao, R. Nozawa, Environ. Toxicol. Phar. 12 (2002)
27–35.[14] J. Dachs, D.A. van Ry, S.J. Eisenreich, Environ. Sci. Technol. 33 (1999)
2676–2679.[15] T. Furuichi, K. Kannan, J.P. Giesy, S. Masunaga, Water Res. 38 (2004)
4491–4501.[16] A. Peñalver, E. Pocurull, F. Borrull, R.M. Marcé, J. Chromatogr. A 872
(2000) 191–201.[17] M. Castillo, A. Oubiña, D. Barceló, Environ. Sci. Technol. 32 (1998)
2180–2184.[18] R. Jeannot, H. Sabik, E. Sauvard, T. Dagnac, K.Dohrendorf, J. Chromatogr.A
974 (2002) 143–159.[19] R. Loos, G. Hanke, S.J. Eisenreich, J. Environ. Monit. 5 (2003) 384–394.[20] M. Ahel, W. Giger, Anal. Chem. 57 (1985) 1577–1583;
A. Laganà, A. Bacaloni, I. de Leva, A. Faberi, G. Fago, A. Marino, Anal.Chim. Acta 501 (2004) 79–88.
[21] M. Del Olmo, A. González-Casado, A. Navas, J.L. Vílchez, Anal. Chim.Acta 346 (1997) 87–92;J.D. Stuart, C.P. Capulong, K.D. Launer, X. Pan, J. Chromatogr. A 1079(2005) 136–145.
[22] A. Zafra, B. Suárez, M. del Olmo, E. Hontoria, A. Navalón, J.L. Vílchez,Water Res. 37 (2003) 735–742.
[23] N. Casajuana, S. Lacorte, Chromatographia 57 (2003) 649–655.[24] I.C. Beck, R. Bruhn, J. Gandrass, W. Ruck, J. Chromatogr. A 1090 (2005)
98–106.[25] R. Loos, G. Hanke, G. Umlauf, S.J. Eisenreich, Chemosphere 66 (2007)
690–699.[26] M. del Olmo, A. Zafra, B. Suárez, A. González-Casado, J. Taoufiki, J.L.
Vílchez, J. Chromatogr. B 817 (2005) 167–172.[27] J.L. Vílchez, M. del Olmo, A. González-Casado, A. Navalón, Patrones
químicos Monocloro, Dicloro y Tricloro derivados del Bisfenol-A,Spanish Patent No. 2190852 (2005).
[28] Statgraphics Plus 5.0, Statistical Graphics Corporation &Manugistics Inc.,Rockville, MO, USA, 2000.
[29] O. Ballesteros, A. Zafra, A. Navalón, J.L. Vílchez, J. Chromatogr. A 1121(2006) 154–162.
[30] T.C.R. Santos, J.C. Rocha, D. Barceló, J. Chromatogr. A 879 (2000) 3–12.[31] Analytical Methods Committee, Analyst 119 (1994) 2363–2366.[32] EU Commission Decision No. 2002/657/EC, Off. J. Eur. Commun. L 221
(2002) 8–36.[33] J.C. Miller, J.N. Miller, Statistics for Chemical Analysis, Addison-Wesley
Iberoamericana, Wilmington, DE, USA, 1993.