Identification and quantitation of pesticides in vegetables by liquid chromatography time-of-flight...
12
Identification and quantitation of pesticides in vegetables by liquid chromatography time-of-flight mass spectrometry Imma Ferrer, Juan Francisco Garcı ´a-Reyes, Amadeo Fernandez-Alba This overview covers pesticide-residue determination in food samples by liquid chromatography time-of-flight mass spectrometry (LC-TOF-MS). We present the application of LC-TOF-MS in terms of accuracy, sensitivity and robustness for the quantitative analysis of pesticides in fruit and vegetable samples. The analytical performance of the methodology is validated for various types of vegetables matrices. Accurate mass measurements (with accuracy better than 3 ppm error) for both the (de)protonated molecule and characteristic fragment ions together with the high-resolution chlorine isotopic signature present in a large number of pesticides and the retention time represent reliable identification criteria for these species in such complex samples. We demonstrated linea- rity of response over two orders of magnitude (r > 0.99) with no significant matrix effects (less than 30%). Low limits of detection at the low mg/kg level, depending on the commodity and pesticide studied, were obtained, all within European Union regulations for food-monitoring programs. The high degree of confirmation for target pesticides by accurate mass measurements demonstrated the applicability of TOF-MS techniques in routine analysis. This overview is a valuable indicator of the potential of LC-TOF-MS to provide high-order structural information for the unequivocal identification of both targeted and non-targeted pesticide residues present in fruit and vegetables. ª 2005 Elsevier Ltd. All rights reserved. Keywords: Food; Liquid chromatography; Mass spectrometry; Pesticides; Time-of-flight; TOF; Vegetables 1. Introduction Pesticides are widely used in agricultural practices. The main applications can be classified in production and post-harvest treatment of agricultural commodities for transport purposes. In this sense, pro- duction agriculture comprises the main category of use of pesticides subject to control requirements and, therefore, legal action levels [e.g., maximum residue limits (MRLs) or tolerances] have been fixed to assess food safety. For example, the European Union (EU) has set new Directives for pesticides at low levels in vegetables in order to meet these health concerns. New laws, such as the Euro- pean Directive 91/414/EEC or the Food Quality Protection Act (FQPA) in the USA, have increased the standards for human health, and worker and environ- mental protection. The quality standards include the re-assessment of the MRLs, which are typically lower than the pre- vious ones, so EU Directives are setting different MRLs for each pesticide within each food group. Typically, the MRLs are in the range 0.01–3 mg/kg depending on the combination commodity and pesticide [1]. For fruits and vegetables intended for production of baby food, an MRL of 0.01 mg/kg is applicable for all pesticides [2], and, finally, banned compounds typi- cally have MRLs at 0.01 mg/kg considered to be lowest limits of detection (LODs) achievable. Finally, review programs have withdrawn authorizations for many crop- protection products currently on the mar- ket. This means that a reduction of about 50% in the number of authorized com- pounds can be expected in Europe and USA in the near future. Furthermore, these regulations have special provisions for infants and children, including additional safety factors. Two Baby Food Directives in Europe set zero LODs for 11 substances being phased out and LODs close to zero for another five. All aspects commented upon above have an important impact on LC–MS method development, because it is clear Imma Ferrer, Juan Francisco Gracı ´a-Reyes, Amadeo Fernandez-Alba* Pesticide Residue Research Group, University of Almerı ´a, ES-04120 La Can ˜ada de San Urbano, Almerı ´a, Spain * Corresponding author. Tel.: +34 950 01 50 34; Fax: +34 950 01 50 84; E-mail: [email protected]. Trends in Analytical Chemistry, Vol. XX, No. X, 2005 Trends 0165-9936/$ - see front matter ª 2005 Elsevier Ltd. All rights reserved. doi:10.1016/j.trac.2005.04.004 1 0165-9936/$ - see front matter ª 2005 Elsevier Ltd. All rights reserved. doi:10.1016/j.trac.2005.04.004 1 ARTICLE IN PRESS
Transcript of Identification and quantitation of pesticides in vegetables by liquid chromatography time-of-flight...
Trends in Analytical Chemistry, Vol. XX, No. X, 2005 Trends
ARTICLE IN PRESS
Identification and quantitation ofpesticides in vegetables by liquidchromatography time-of-flight massspectrometryImma Ferrer, Juan Francisco Garcıa-Reyes, Amadeo Fernandez-Alba
This overview covers pesticide-residue determination in food samples by
liquid chromatography time-of-flight mass spectrometry (LC-TOF-MS). We
present the application of LC-TOF-MS in terms of accuracy, sensitivity and
robustness for the quantitative analysis of pesticides in fruit and vegetable
samples. The analytical performance of the methodology is validated for
various types of vegetables matrices.
Accurate mass measurements (with accuracy better than 3 ppm error) for
both the (de)protonated molecule and characteristic fragment ions together
with the high-resolution chlorine isotopic signature present in a large
number of pesticides and the retention time represent reliable identification
criteria for these species in such complex samples. We demonstrated linea-
rity of response over two orders of magnitude (r > 0.99) with no significant
matrix effects (less than 30%). Low limits of detection at the low mg/kg
level, depending on the commodity and pesticide studied, were obtained, all
within European Union regulations for food-monitoring programs. The high
degree of confirmation for target pesticides by accurate mass measurements
demonstrated the applicability of TOF-MS techniques in routine analysis.
This overview is a valuable indicator of the potential of LC-TOF-MS to
provide high-order structural information for the unequivocal identification
of both targeted and non-targeted pesticide residues present in fruit and
vegetables.
ª 2005 Elsevier Ltd. All rights reserved.
Keywords: Food; Liquid chromatography; Mass spectrometry; Pesticides; Time-of-flight;
TOF; Vegetables
Imma Ferrer,
Juan Francisco Gracıa-Reyes,
Amadeo Fernandez-Alba*
Pesticide Residue Research
Group, University of Almerıa,
ES-04120 La Canada de San
Urbano, Almerıa, Spain
*Corresponding author.
Tel.: +34 950 01 50 34;
Fax: +34 950 01 50 84;
E-mail: [email protected].
0165-9936/$ - see front matter ª 20050165-9936/$ - see front matter ª 2005
1. Introduction
Pesticides are widely used in agriculturalpractices. The main applications can beclassified in production and post-harvesttreatment of agricultural commodities fortransport purposes. In this sense, pro-duction agriculture comprises the maincategory of use of pesticides subject tocontrol requirements and, therefore, legalaction levels [e.g., maximum residuelimits (MRLs) or tolerances] have beenfixed to assess food safety. For example,
Elsevier Ltd. All rights reserved. doi:10.1016/j.trac.2005.04.004Elsevier Ltd. All rights reserved. doi:10.1016/j.trac.2005.04.004
the European Union (EU) has set newDirectives for pesticides at low levels invegetables in order to meet these healthconcerns. New laws, such as the Euro-pean Directive 91/414/EEC or the FoodQuality Protection Act (FQPA) in theUSA, have increased the standards forhuman health, and worker and environ-mental protection. The quality standardsinclude the re-assessment of the MRLs,which are typically lower than the pre-vious ones, so EU Directives are settingdifferent MRLs for each pesticide withineach food group. Typically, the MRLs arein the range 0.01–3 mg/kg depending onthe combination commodity and pesticide[1]. For fruits and vegetables intended forproduction of baby food, an MRL of0.01 mg/kg is applicable for all pesticides[2], and, finally, banned compounds typi-cally have MRLs at 0.01 mg/kg consideredto be lowest limits of detection (LODs)achievable. Finally, review programs havewithdrawn authorizations for many crop-protection products currently on the mar-ket. This means that a reduction of about50% in the number of authorized com-pounds can be expected in Europe and USAin the near future.Furthermore, these regulations have
special provisions for infants and children,including additional safety factors. TwoBaby Food Directives in Europe set zeroLODs for 11 substances being phased outand LODs close to zero for another five.All aspects commented upon above
have an important impact on LC–MSmethod development, because it is clear
11
Trends Trends in Analytical Chemistry, Vol. XX, No. X, 2005
ARTICLE IN PRESS
that all these factors are interdependent with the re-quired performance of the analytical method. In addi-tion, the EU institutions stress that monitoring residuesin food significantly affects the development of new andhigh-performance multi-residue methods for pesticides.Low MRLs have promoted the development of morepowerful, sensitive analytical methods to meet therequirements in complex samples, such as food. In thissense, liquid-chromatography tandem mass spectrome-try (LC–MS2) with triple quadrupole (TQ) in selectedreaction monitoring (SRM) mode has become the mostwidely used technique for the quantitation of (polar)pesticides in food so far, as reported extensively in theliterature [3–13]. On the other hand, high-resolution MStechniques, such as time-of-flight MS (TOF-MS) havebeen applied mainly for structure elucidation or confir-mation purposes for environmental analyses [14–18].However, the limitations of applying TOF-MS to
pesticide-residue analysis in comparison with other MStechniques have occurred because of its low efficiency inobtaining quantitative information. The need for lowLODs (e.g., 0.01 mg/kg), adequate linear ranges androbustness have prevented TOF analyzers being efficientin pesticide-residue control with respect to other ana-lyzers, such as TQ mass spectrometers. Nevertheless,new improvements in this technique with respect to thenumber of scans per second and new digital samplingtechniques [18] have overcome the initial drawbacks.LC-TOF-MS has been applied for confirmatory analyses
mainly because of well-known limitations, such as thenarrow dynamic linear range obtained with this type ofinstrumentation. Another disadvantage has been thelack of accuracy of some instruments to achieve the2–5 ppm error level, usually needed when analyzingcomplex matrices for a correct identification of the targetanalytes [18,19]. However, the use of TOF-MS tech-niques has become necessary in the last few years for theunequivocal identification of contaminants in veterinarydrugs in meat [20] and to achieve the EU requirementsregarding the number of identification points for apositive finding [21]. In addition, TOF-MS has thecapability of non-target identification, because the fullspectrum is recorded at all times, which is not possiblewith standard monitoring practices that use single-ionmonitoring or multiple reaction monitoring (MRM)techniques.LC–MS techniques, especially LC–MS2 under selected
reaction monitoring (SRM) mode, have shown theirsuperiority in target-pesticide determinations due to theexcellent sensitivity, selectivity and efficiency achieved.However, when it is suspected that unknown pesticideresidues are present in the sample, these MS2 techniquesusually do not offer identification and structural eluci-dation of non-targeted compounds. In this sense, full-scan TOF analyses improve the structural informationachieved at expense of sensitivity.
2 http://www.elsevier.com/locate/trac
Using LC–MS2 techniques in this way, pesticides notpreviously incorporated as standards for the multi-residue methods (MRMs) applied are out of the analyticalrange, so they are not detected. This can cause signifi-cant oversights in detection due to the high number ofpossible compounds that could be present and the diffi-culties (e.g., cost and time required) of laboratoriesmanaging large numbers of compounds as targets (e.g.,300). In recent years, TOF mass analyzers have gainedconsiderable acceptance by offering high selectivityunder full-scan conditions, resolutions of around10,000, and especially high mass accuracies as a resultof very stable calibration [22]. All these characteristicsallow the presence of analytes to be confirmed in singleMS mode and also with the same performance as tandemmass spectrometers.This article presents an overview of the main
achievements of LC-TOF-MS in multi-residue analysis offood. It also discusses the advantages and the difficultiesencountered when using this technique for qualitativeand quantitative analyses of fruit and vegetables afterfast, inexpensive extraction. It also describes presentstrategies and technical developments for solving theproblems of identification and quantification.
2. Identification by LC-TOF-MS
Recently, LC-TOF-MS has been successfully applied tothe identification and the determination of severalclasses of pesticides in vegetable samples [22–25]. Theidentification and confirmation criteria are provided byaccurate mass measurements for each molecular ion andsubsequent fragments, allowing unambiguous identifi-cation when measurements involve isobaric compoundsin the sample matrix [23]. The following sectionsdescribe each of the capabilities of LC-TOF-MS for thedetermination of pesticides in detail.
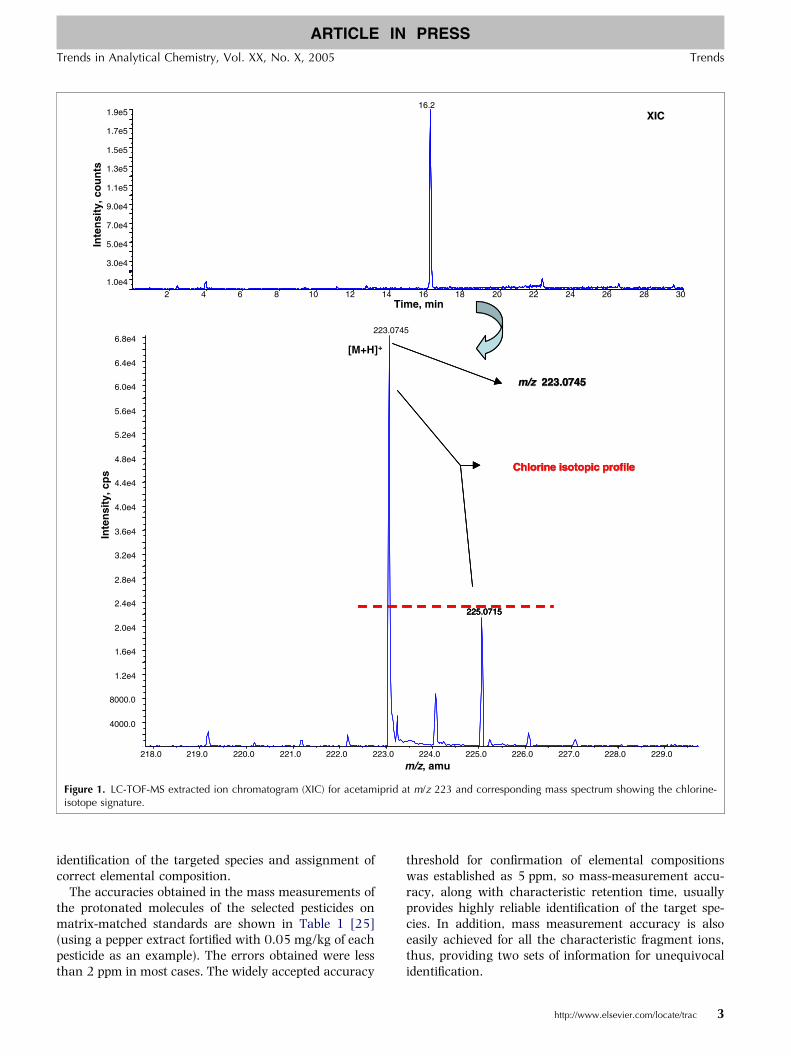
2.1. Accurate mass measurementsThe list of tentative empirical formulae can be dramati-cally reduced by refining the minimum and the maxi-mum number of atoms for each molecule and the errorlevel. This is the case for analytes with one or morechlorine atoms, a number that can be easily deducedfrom the isotopic profile of the accurate mass spectra. Asan example, the accurate mass spectrum of acetamipridobtained in a matrix-matched standard pepper sample isshown in Fig. 1. As can be seen in Fig. 1, both thepattern and the abundance of the chlorine isotope in themolecular ion can be easily used as a valuable tool foridentification [14]. In addition, a large number of pro-posed formulae are often ‘‘chemically incoherent’’because they contain atoms that are not present in mostorganic compounds. This also helps in unequivocal
2 4 6 8 10 12 14 16 18 20 22 24 26 28 30Time, min
1.0e4
3.0e4
5.0e4
7.0e4
9.0e4
1.1e5
1.3e5
1.5e5
1.7e5
1.9e5In
ten
sity
, cp
s16.2
218.0 219.0 220.0 221.0 222.0 223.0 224.0 225.0 226.0 227.0 228.0 229.0
m/z, amu
4000.0
8000.0
1.2e4
1.6e4
2.0e4
2.4e4
2.8e4
3.2e4
3.6e4
4.0e4
4.4e4
4.8e4
5.2e4
5.6e4
6.0e4
6.4e4
6.8e4
Inte
nsi
ty, c
ou
nts
223.0745
225.0715
m/zm/z 223.0745223.0745
[M+H]+
225.0715
m/zm/z 223.0745223.0745
225.0715
XICXIC
223.0745223.0745
Chlorine isotopic profileChlorine isotopic profileChlorine isotopic profileChlorine isotopic profileChlorine isotopic profileChlorine isotopic profile
Figure 1. LC-TOF-MS extracted ion chromatogram (XIC) for acetamiprid at m/z 223 and corresponding mass spectrum showing the chlorine-isotope signature.
Trends in Analytical Chemistry, Vol. XX, No. X, 2005 Trends
ARTICLE IN PRESS
identification of the targeted species and assignment ofcorrect elemental composition.The accuracies obtained in the mass measurements of
the protonated molecules of the selected pesticides onmatrix-matched standards are shown in Table 1 [25](using a pepper extract fortified with 0.05 mg/kg of eachpesticide as an example). The errors obtained were lessthan 2 ppm in most cases. The widely accepted accuracy
threshold for confirmation of elemental compositionswas established as 5 ppm, so mass-measurement accu-racy, along with characteristic retention time, usuallyprovides highly reliable identification of the target spe-cies. In addition, mass measurement accuracy is alsoeasily achieved for all the characteristic fragment ions,thus, providing two sets of information for unequivocalidentification.
http://www.elsevier.com/locate/trac 3

Table 1. Liquid chromatography time-of-flight mass spectrometry (LC-TOF-MS): accurate mass measurements in a pepper extract fortified with apesticide mixture (concentration level: 0.05 mg/kg)
Compound Formula Selected ion m/zexperimental m/zcalculated Error
mDa ppm
Cyromazine C6H10N6 [M + H]+ 167.1031 167.10397 �0.9 �5.2Carbendazim C9H9N3O2 [M + H]+ 192.0767 192.07675 �0.05 �0.3Thiabendazole C10H7N3S [M + H]+ 202.0435 202.04334 0.15 0.76Methomyl C5H10N2O2S [M + Na]+ 185.0351 185.03552 �0.4 �2.3Imidaclopriil C9H10N5O2Cl [M + H]+ 256.0596 256.05957 0.02 0.08Acetamipricl C10HnN4Cl [M + H]+ 223.0741 223.07450 �0.4 �1.8Thiacloprid C10H9N4ClS [M + H]+ 253.0308 253.03092 �0.12 �0.5Spinosyn A C41H65NO10 [M + H]+ 732.4672 732.46812 �0.9 �1.2Spinosyn D C42H67NO10 [M + H]+ 746.4822 746.48377 �1.6 �2.1Dimethomorph C21H22NO4C1 [M + H]+ 388.1306 388.13101 �0.4 �1.1Azoxystrobiti C22H17N3O5 [M + H]+ 404.1243 404.12409 0.2 0.5Triflumizol C15H15N3OF3Cl [M + H]+ 346.0932 346.09285 0.35 1.0Hexaflumuron C16H8N2O3F6Cl2 [M + H]+ 460.9882 460.98889 �0.7 �1.5Teflubenzuron C14H6N2O2F4Cl2 [M + H]+ 380.9817 380.98152 0.2 0.5Lufenuron C17H8N2O3F8Cl2 [M + H]+ 510.9863 510.98570 0.6 1.2Flufenoxuron C21H11N2O3F6Cl [M + H]+ 489.0425 489.04351 �1.0 �2.1
Trends Trends in Analytical Chemistry, Vol. XX, No. X, 2005
ARTICLE IN PRESS
In the example shown in Table 1 [25], the goodaccuracy of the results obtained can be attributed to theway instruments process ‘‘all the data, all the time’’ andcalculate the accurate mass. The new generation of TOFinstruments usually uses a dual-nebulizer ion source toperform accurate mass calibration automatically, intro-ducing the reference masses at a very low flow rate(continuously or otherwise) along with the output flowstream of the high-performance liquid chromatography(HPLC) system. This feature is combined with advancedsoftware, which constantly auto-calibrates and recordsthe results of the internal reference masses along withthe raw data. This approach enhances accuracy com-pared to many previous TOF instruments, in which masscalibration was external [14].The effect of different concentration levels and matrix
complexity on the accuracy of mass measurements wasalso evaluated in all matrices tested at different con-centration levels across the working range (0.01–0.5 mg/kg). No significant differences were observed inthe accuracy obtained in the various matrix-matchedstandards compared to those prepared with pure sol-vents, the error being kept far below 5 ppm, with aver-age values of about 1 ppm for all the pesticides [25].
2.2. Fragmentation by LC-TOF-MSThe fragmentor role in LC–MS is crucial for efficienttransmission of the ions to obtain the best balancebetween sensitivity and fragmentation. The generationof alternative confirmatory ions happens at the expenseof molecular ion intensity. Usually, the fragmentorvoltage cannot be fixed for each pesticide independentlybecause of the proximity of other target analytes, so itplays an important role in both sensitivity and
4 http://www.elsevier.com/locate/trac
fragmentation. This parameter is important, because itprovides valuable structural information (characteristicfragmentation for each pesticide), making attainable theaccurate mass of each characteristic fragment ion to-gether with its elemental composition [16,17], whichcan be used with confidence to meet the criteria foridentifying the molecular ion.Usually, fragmentor voltages of 250 V or higher lead to
extensive fragmentation, even of the reference masses.Voltages of about 120 V provide minimal fragmentationin most pesticides. The following were explored as optimalfragmentation voltages [25]: 190 V [which provides amild in-source collision-induced dissociation (CID) frag-mentation]; and, 230 V (for extensive fragmentation).Table 2 compares the typical fragment ions obtained andsummarizes their relative abundances. Some compoundspresented characteristic fragmentations at a higherfragmentor voltage, such as neonicotinoid pesticides(imidacloprid, acetamiprid, and thiacloprid). Similarly,cyromazine, carbendazim, azoxystrobin and dim-ethomorph also needed a high voltage to fragment.However, methomyl gave abundant fragmentation evenat the low fragmentor voltage of 190 V. Finally, thia-bendazole, hexaflumuron, teflubenzuron, lufenuron,flufenoxuron and spinosad did not fragment clearly evenat a high fragmentor voltage. As a compromise valuebetween sensitivity for quantitation (using the protonatedmolecule) and ‘‘rich’’ information mass spectra, 190 Vwas chosen for further experiments. In some exceptionalcases (i.e., triflumizol), a lower voltage yields bettersensitivity as well as enhanced fragmentation.Using the capabilities for optimizing in-source frag-
mentation, LC-TOF-MS becomes an attractive tool for theunequivocal identification of pesticides. The proposed

Table 2. Typical fragmentation obtained by in-source collision-induced dissociation (CID) in electrospray time-of-flight massspectrometry (ESI-TOF-MS): study of fragmentor voltage [25]
m/z Relative abundance
190 V 230 V
Cyromazine 167b 100 100125 <5 2285 <5 24
Carbendazim 192b 100 17160 43 100
Thiabendazole 202b 100 100175 <5 9
Imidacloprid 278a – 38256b 100 48210 24 20209 20 56175 24 100
Acetamiprid 245a – 25223b 100 77126 15 10099 – 12
Thiacloprid 275a – 24253b 100 83126 16 10099 – 11
Hexaflumuron 483a 100 100461b 94 80
Teflubenzuron 403a 100 100381b 64 30
Azoxystrobin 404b 100 19372 31 100344 – 11
Dimethomorph 388b 100 100301 <5 10
Triflumizol 346b 24 5278 100 100
Methomyl 185a 13 7163b 6 –106 32 1488 100 8673 20 100
Lufenuron 533a 100 100511b 70 70
Flufenoxuron 511a 100 100489b 92 46
Spinosad A 732 100 100544 <5 <5
Spinosad D 746 100 100558 <5 <5
aSodium adduct.bProtonated molecule (used for quantitation).
Trends in Analytical Chemistry, Vol. XX, No. X, 2005 Trends
ARTICLE IN PRESS
approach fulfils all the European Commission (EC)criteria for the spectrometric identification and confir-mation of organic residues and contaminants, even
those based on the use of identification points (IPs). ECDecision 2002/657/EC established the need to obtainthree IPs to confirm organic residues of drugs in food(four if they are banned substances) [21]. In this respect,for LC-single quadrupole MS analysis at low resolution,three or four ions (depending of the commodity or pes-ticide) are necessary for confirmation. In MS2 analysis,the selection of one precursor ion and the recording oftwo product ions at low resolution would result in fourpoints for a safe positive finding, which is enough for anycombination of pesticide and commodity. Using theaccurate mass of the protonated molecule along withthat of an additional characteristic fragment ion, theproposed technique meets these regulations. It is clearthat the application of these criteria for pesticide-residueanalysis should convert many positive findings usuallyreported into questionable or negative findings.
2.3. Selectivity with accurate massThe selectivity of LC-TOF-MS relies on the resolvingpower of the instrument on the m/z axis. The higher theresolution provided by the instrument, the better theselectivity for unequivocal identification. Taking intoaccount that the resolving power of a TOF instrument isin the range of 5000–10,000 [18], it can discriminatebetween ‘‘isobaric’’ interferences within 0.05 Da massdifference (e.g., using an ion at 350 m/z). An isobaricinterference in LC-TOF-MS analyses would thereforearise only if an interfering species with the same timeretention of the target analyte had the same exact mass(differences less than 0.05 Da). This selectivity is signif-icantly higher than that provided by any other LC–MSinstrument. In addition and as an alternative, using anoptimized fragmentor voltage, the accurate mass of anyother characteristic fragment ion could be employed forquantitation in order to avoid this potential isobaricinterference.However, compared with TQ instruments, the accu-
rate mass measurements of TOF instruments can providevaluable evidence for an unavoidable isobaric interfer-ence, which might occur in complex samples. This kindof interference yields well-known overestimation errors(e.g., in LC-Q-MS and LC-(TQ)-MS2 instruments). Forexample, overestimation errors due to the contributionfrom the signal of the 13C isotope of an interferent speciecannot be avoided (or even detected) with other LC–MS(-MS) instruments in selected ion monitoring (SIM) orSRM modes. Taking advantage of the m/z resolvingpower of the instrument, accurate mass measurementswith LC-TOF-MS can at least reveal the existence of theseinevitably isobaric interferences. In this sense, tocircumvent these interferences, other characteristicfragment ions from accurate mass spectra of the targetedspecies could be employed a posteriori, since LC-TOF-MSrecords the full-scan spectra at all times.
http://www.elsevier.com/locate/trac 5
Trends Trends in Analytical Chemistry, Vol. XX, No. X, 2005
ARTICLE IN PRESS
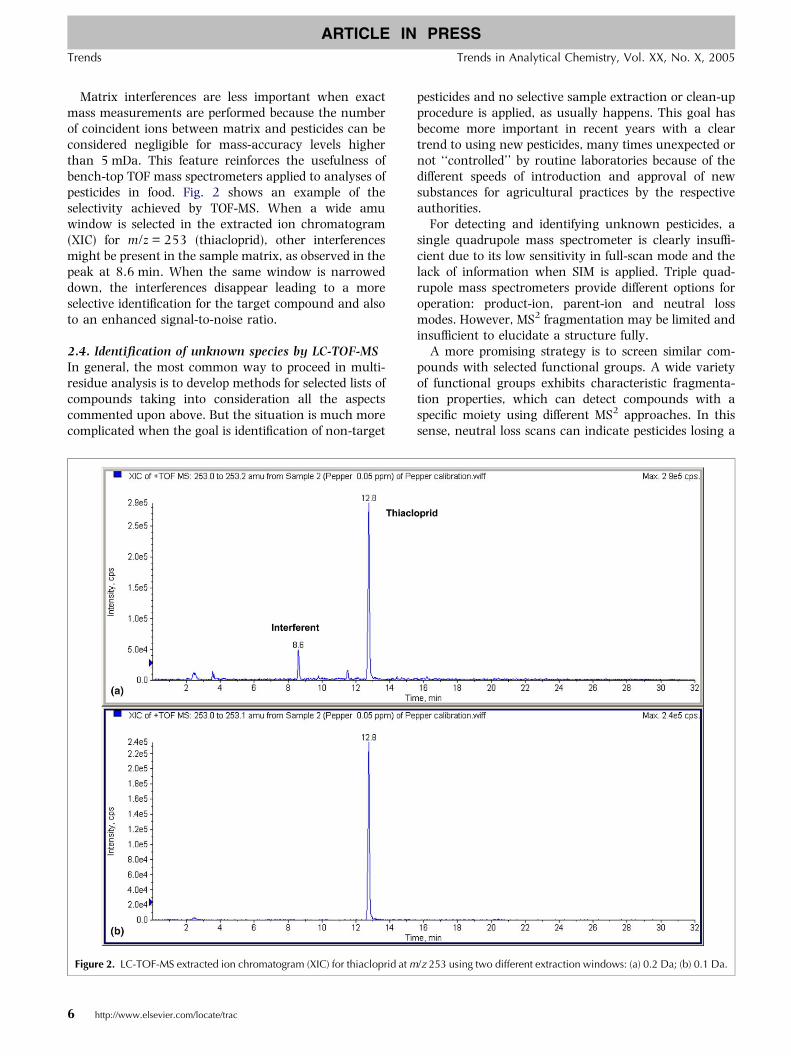
Matrix interferences are less important when exactmass measurements are performed because the numberof coincident ions between matrix and pesticides can beconsidered negligible for mass-accuracy levels higherthan 5 mDa. This feature reinforces the usefulness ofbench-top TOF mass spectrometers applied to analyses ofpesticides in food. Fig. 2 shows an example of theselectivity achieved by TOF-MS. When a wide amuwindow is selected in the extracted ion chromatogram(XIC) for m/z = 253 (thiacloprid), other interferencesmight be present in the sample matrix, as observed in thepeak at 8.6 min. When the same window is narroweddown, the interferences disappear leading to a moreselective identification for the target compound and alsoto an enhanced signal-to-noise ratio.
2.4. Identification of unknown species by LC-TOF-MSIn general, the most common way to proceed in multi-residue analysis is to develop methods for selected lists ofcompounds taking into consideration all the aspectscommented upon above. But the situation is much morecomplicated when the goal is identification of non-target
Figure 2. LC-TOF-MS extracted ion chromatogram (XIC) for thiacloprid atm
6 http://www.elsevier.com/locate/trac
pesticides and no selective sample extraction or clean-upprocedure is applied, as usually happens. This goal hasbecome more important in recent years with a cleartrend to using new pesticides, many times unexpected ornot ‘‘controlled’’ by routine laboratories because of thedifferent speeds of introduction and approval of newsubstances for agricultural practices by the respectiveauthorities.For detecting and identifying unknown pesticides, a
single quadrupole mass spectrometer is clearly insuffi-cient due to its low sensitivity in full-scan mode and thelack of information when SIM is applied. Triple quad-rupole mass spectrometers provide different options foroperation: product-ion, parent-ion and neutral lossmodes. However, MS2 fragmentation may be limited andinsufficient to elucidate a structure fully.A more promising strategy is to screen similar com-
pounds with selected functional groups. A wide varietyof functional groups exhibits characteristic fragmenta-tion properties, which can detect compounds with aspecific moiety using different MS2 approaches. In thissense, neutral loss scans can indicate pesticides losing a
/z 253 using two different extraction windows: (a) 0.2 Da; (b) 0.1 Da.

Trends in Analytical Chemistry, Vol. XX, No. X, 2005 Trends
ARTICLE IN PRESS
specific non-ionic fragment. The selection of a constantneutral loss (CNL) along with the chromatogram com-bined from parent-ion scans provides molecular massidentification and subsequent confirmation. The poten-tial members of a particular compound class in thesamples can be detected in this way. This concept hasbeen successfully applied to water and effluent samplesfor identifying compounds with characteristic fragmen-tation [26–28]. For example, CNL of methylisocyanatefrom N-methylcarbamates (constant m/z difference 57)can screen and identify this class of compounds [29].Depending on the experimental conditions, some
variations can be expected; for example some N-methyl-carbamates are very prone to form adducts [M + NH4]
+
and the neutral loss value can change. However, thisrule has important exceptions with N-methylcarbamatestypically used in food samples that do not yield thecharacteristic moiety, such as aldicarb, ethiofencarb andfenoxycarb. As a consequence, due to the relevantstructural differences that are typically present, even inpesticides of the same family, this procedure hasimportant limitations. Moreover, the sensitivitydecreases markedly when the TQ is operated in neutralloss mode.Another mode of operation is the precursor ion scan
that gives typical or diagnostic fragment ions. Forexample, some of the neonicotinoid insecticides, whichare relevant in food analysis, present a diagnostic ion atm/z 126 [30,31].Ion-trap mass spectrometers present higher sensitivity
in the scanning mode and can perform MSn experiments,so they are very well suited to detecting unknowncompounds, provided time and personal skills are avail-able. Until now, there have been no reports in theliterature in this promising direction in the analysis ofpesticides in food, probably because of the need for high-throughput sampling in methods for analyzing pesticidesin foods that makes this procedure not very suitable forroutine laboratories.In this sense, bench-top TOF-MS has important
advantages, which make this instrument attractivewhen screening for unknown compounds. The higherresolution and mass accuracy in full-scan mode can bereadily provided by bench-top TOF-MS. Sometimes it canbe enough to provide a molecular formula and to con-firm or deny a suggested structure [24,32]. The newgeneration of TOF-MS is very well suited to the purposesof screening food for pesticides [23,24].The application of TOF-MS for identification of un-
knowns has been reported [23]. Based on the accuratemass, the elemental composition of the unknown peak ofinterest is calculated using the elemental compositiontool. By using this data and the information of theappropriate number of chlorines in the molecule, deter-mined from the isotopic pattern, the search is performedin a pesticide database, obtaining the unequivocal
identification of the unknown with a mass deviation ofless than 5 ppm. It is clear that TOF-MS can be verysuitable for the main analytical requirements of analyz-ing pesticides in food. For these reasons, an importantincrease in the application of these systems to pesticidesin food can be expected in the next few years. Even moreuseful in terms of identification is the hybrid quadrupole-TOF combination (Q-TOF) as it allows MS2 to be used.Similarly, Fourier transform ion cyclotron resonance(FT-ICR) mass spectrometers can be used, although weconsider these instruments outside the scope of routineapplications for analyzing pesticides in food.
3. Quantitation by LC-TOF-MS
3.1. Analytical performanceSensitivity in LC–MS is related to many operationalparameters (e.g., flow rate and mobile phase), so thesensitivity achieved by LC-TOF-MS methods has to beconsidered as a whole. However, on the basis of currentLC–MS multi-residue methods, we can evaluate thesuitability of LC-TOF-MS.In recent years, the analytical linearity response of
TOF instruments has not enabled its application forquantitative purposes. These instruments usually suf-fered from narrow dynamic ranges, requiring mathe-matical algorithms, such as the ‘‘time to digitalcorrection’’, in order to attain a longer linear dynamicrange, and this therefore severely limited the usability ofTOF-MS [18]. This disadvantage was overcome in newinstruments, which offered a linear dynamic range ofabout two orders of magnitude, which was enough tomake possible successful quantitative applications inroutine analyses of pesticide residues.As an example, Fig. 3 shows the linearity obtained by
TOF-MS, by comparing the slopes obtained from matrix-matched standards solutions with those obtained withpure solvents for two pesticides (thiabendazole andazoxystrobin) [25]. This study was accomplished at sixdifferent concentration levels in the range 0.01–0.5mg/kg.Table 3 provides another example, which included the
results obtained for four selected fungicides (thiabenda-zole, azoxystrobin, carbendazim and spinosad) in fivedifferent vegetable matrices (pepper, broccoli, orange,lemon and melon) [25]. As can be seen, linearity ofanalytical response across the range studied is excellent,with correlation coefficients higher that 0.98 in mostcases. This analytical performance in terms of linearitycan compare very well with typical instruments used forquantitation purposes (e.g., single quadrupole or TQ).By using the peak areas of XICs for the protonated
molecule, the typical LODs observed were in the lowrange of lg/kg (Table 4). The narrower the m/z windowchosen for the XIC, the higher the selectivity obtained, so
http://www.elsevier.com/locate/trac 7

THIABENDAZOLE AZOXYSTROBIN
C (mg/Kg)
y = 73.498x + 2.6198R
2= 0.9921
y = 69.497x + 2.4041R
2= 0.9843
y = 60.339x + 1.1753R
2= 0.9965
y = 63.951x + 2.2768R
2= 0.986
y = 73.409x + 3.5373R
2= 0.9901
0
10
20
30
40
50
0 0.1 0.2 0.3 0.4 0.5 0.6
Are
a x
10 E
+06
SOLVENT
PEPPER
BROCCOLI
LEMON
ORANGE
MELON
SOLVENT
PEPPER
BROCCOLI
LEMON
ORANGE
MELON
C (mg/Kg)
y = 73.033x + 0.9555R2 = 0.998
y = 73.086x + 1.2958R 2 = 0.996
y = 67.753x + 0.977R2 = 0.9949
y = 80.597x + 0.5314R
2= 0.9986
y = 83.025x + 0.894R2 = 0.999
y = 76.48x + 1.0377R2 = 0.9997
0
10
20
30
40
50
60
0 0.1 0.2 0.3 0.4 0.5 0.6
Are
a x
10 E
+06
SOLVENT
PEPPER
BROCCOLI
LEMON
ORANGE
MELON
PEPPER
SOLVENT
BROCCOLI
LEMON
ORANGE
MELON
y = 69.497x + 2.4041R
2= 0.9843
y = 60.339x + 1.1753R
2= 0.9965
y = 69.497x + 2.4041R
2= 0.9843
y = 60.339x + 1.1753R
2= 0.9965
y = 73.409x + 3.5373R
2= 0.9901
SOLVENT
PEPPER
BROCCOLI
LEMON
ORANGE
MELON
SOLVENT
PEPPER
BROCCOLI
LEMON
ORANGE
MELON
SOLVENT
PEPPER
BROCCOLI
LEMON
ORANGE
MELON
SOLVENT
PEPPER
BROCCOLI
LEMON
ORANGE
MELON
y = 73.033x + 0.9555R2 = 0.998
y = 67.753x + 0.977R2 = 0.9949
y = 80.597x + 0.5314R
2= 0.9986
y = 83.025x + 0.894R2 = 0.999
y = 76.48x + 1.0377R2 = 0.9997
SOLVENT
PEPPER
BROCCOLI
LEMON
ORANGE
MELON
PEPPER
SOLVENT
BROCCOLI
LEMON
ORANGE
MELON
y = 73.033x + 0.9555R2 = 0.998
y = 67.753x + 0.977R2 = 0.9949
y = 80.597x + 0.5314R
2= 0.9986
y = 83.025x + 0.894R2 = 0.999
y = 76.48x + 1.0377R2 = 0.9997
y = 73.033x + 0.9555R2 = 0.998
y = 67.753x + 0.977R2 = 0.9949
y = 80.597x + 0.5314R
2= 0.9986
y = 83.025x + 0.894R2 = 0.999
y = 76.48x + 1.0377R2 = 0.9997
SOLVENT
PEPPER
BROCCOLI
LEMON
ORANGE
MELON
PEPPER
SOLVENT
BROCCOLI
LEMON
ORANGE
MELON
y = 76.669x + 3.1278R
2= 0.9886
y = 76.669x + 3.1278R
2= 0.9886
y = 76.669x + 3.1278R
2= 0.9886
(a) (b)
Figure 3. Comparison of the calibration curve slopes obtained for (a) thiabendazole and (b) azoxystrobin, using matrix-matched standards fromdifferent fruit and vegetable extracts and solvent-based standards.
Trends Trends in Analytical Chemistry, Vol. XX, No. X, 2005
ARTICLE IN PRESS
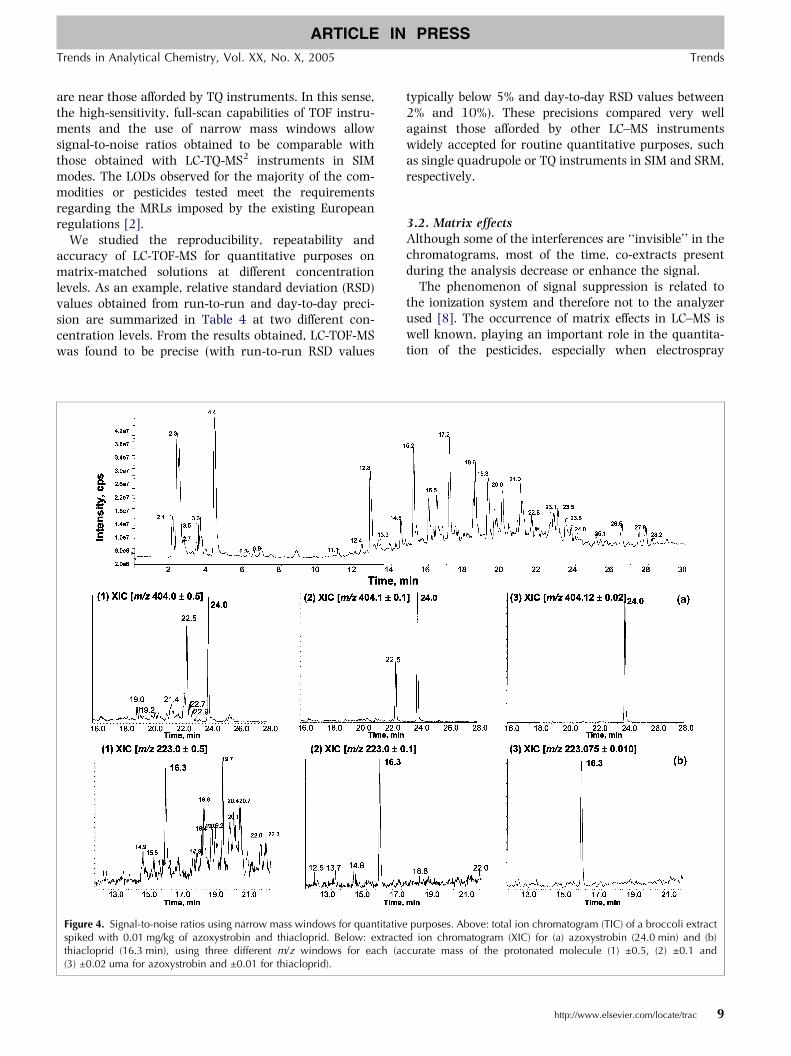
a better signal-to-noise ratio was achieved. The use ofnarrow mass windows (i.e., accurate mass of the targetspecies ±0.02–0.1 Da) provides a remarkable enhance-ment of the LODs, as can be observed in Fig. 4. Thisexample showed a typical total ion chromatogram of a
Table 3. Linearity obtained by liquid chromatography time-of-flight mass spectrometry (LC-TOF-MS)
Matrix Calibration equation R2
Thiabendazole Solvent y = 7.3 · 107x + 1295800 0.996Pepper y = 7.3 · 107x + 955500 0.998Broccoli y = 6.8 · 107x + 977000 0.995Lemon y = 8.1 · 107x + 531400 0.999Orange y = 8.3 · 107x + 894000 0.999Melon y = 7.6 · 107x + 1037700 0.999
Azoxystrobin Solvent y = 7.3 · 107x + 2619800 0.992Pepper y = 7.7 · 107x + 3127800 0.989Broccoli y = 6.9 · 107x + 2404100 0.984Lemon y = 6.0 · 107x + 1175300 0.996Orange y = 6.4 · 107x + 2276800 0.986Melon y = 7.3 · 107x + 3537300 0.990
Carbendazim Solvent y = 4.9 · 107x + 1221700 0.993Pepper y = 4.8 · 107x + 1109200 0.995Broccoli y = 4.9 · 107x + 637400 0.993Lemon y = 5.4 · 107x + 251200 0.998Orange y = 4.9 · 107x + 2009200 0.998Melon y = 5.1 · 107x + 1783200 0.997
Spinosad Solvent y = 6.5 · 107x � 701500 0.995Pepper y = 7.3 · 107x � 414800 0.999Broccoli y = 6.5 · 107x + 467000 0.997Lemon y = 7.7 · 107x + 187000 0.999Orange y = 7.3 · 107x + 47900 0.999Melon y = 6.7 · 107x + 1240700 0.995
Comparison of the regression equation and regression coefficients(R2) obtained from the calibration curves of four selected pesticidesin five different vegetable matrices [25].
8 http://www.elsevier.com/locate/trac
0.01 mg/kg matrix-matched standard from a broccolisample together with the XICs used for quantificationpurposes for two of the selected pesticides. In Fig. 4(a),the XIC of azoxystrobin is shown, using three differentmass windows [(1) ±0.5; (2) ±0.1; and (3) ±0.02]. Byusing such narrow mass windows, the signal-to-noiseratio is higher, yielding thus better LODs than thoseachievable using low resolution instruments [1 Da masswindow; (see Fig. 4(a.1) and (b.1)). Similar results areobtained for thiacloprid (Fig. 4(b)). The LODs obtained
Table 4. Analytical features of liquid chromatography time-of-flight mass spectrometry (LC-TOF-MS) for quantitative pesticide-residue analyses
Pesticide Intra-day Inter-day LOD (lg/kg)
Amount added (mg/kg)
0.05 mg/kg 0.25 mg/kg
RSD (%)
Cyromazine 7.1 5.9 5Carbendazim 2.7 6.0 5Thiabendazole 2.2 3.6 10Methomyl 6.0 10.0 30Imidacloprid 3.1 6.1 10Acetamiprid 0.8 7.7 5Thiacloprid 2.1 10.0 4Spinosad 2.6 2.6 1Dimethomorph 2.9 10.4 2Azoxystrobin 3.1 5.7 0.3Triflumizol 3.8 9.4 0.9Hexaflumuron 2.6 11.0 10Teflubenzuron 5.8 10.0 10Lufenuron 5.6 8.0 10Flufenoxuron 5.3 9.2 10
Run-to-run and day-to-day relative standard deviations (RSD (%))in matrix-matched standards and LODs obtained using a masswindow of 0.2 Da in a pepper extract [25].
Trends in Analytical Chemistry, Vol. XX, No. X, 2005 Trends
ARTICLE IN PRESS
are near those afforded by TQ instruments. In this sense,the high-sensitivity, full-scan capabilities of TOF instru-ments and the use of narrow mass windows allowsignal-to-noise ratios obtained to be comparable withthose obtained with LC-TQ-MS2 instruments in SIMmodes. The LODs observed for the majority of the com-modities or pesticides tested meet the requirementsregarding the MRLs imposed by the existing Europeanregulations [2].We studied the reproducibility, repeatability and
accuracy of LC-TOF-MS for quantitative purposes onmatrix-matched solutions at different concentrationlevels. As an example, relative standard deviation (RSD)values obtained from run-to-run and day-to-day preci-sion are summarized in Table 4 at two different con-centration levels. From the results obtained, LC-TOF-MSwas found to be precise (with run-to-run RSD values
Figure 4. Signal-to-noise ratios using narrow mass windows for quantitativespiked with 0.01 mg/kg of azoxystrobin and thiacloprid. Below: extractethiacloprid (16.3 min), using three different m/z windows for each (ac(3) ±0.02 uma for azoxystrobin and ±0.01 for thiacloprid).
typically below 5% and day-to-day RSD values between2% and 10%). These precisions compared very wellagainst those afforded by other LC–MS instrumentswidely accepted for routine quantitative purposes, suchas single quadrupole or TQ instruments in SIM and SRM,respectively.
3.2. Matrix effectsAlthough some of the interferences are ‘‘invisible’’ in thechromatograms, most of the time, co-extracts presentduring the analysis decrease or enhance the signal.The phenomenon of signal suppression is related to
the ionization system and therefore not to the analyzerused [8]. The occurrence of matrix effects in LC–MS iswell known, playing an important role in the quantita-tion of the pesticides, especially when electrospray
purposes. Above: total ion chromatogram (TIC) of a broccoli extractd ion chromatogram (XIC) for (a) azoxystrobin (24.0 min) and (b)curate mass of the protonated molecule (1) ±0.5, (2) ±0.1 and
http://www.elsevier.com/locate/trac 9
Trends Trends in Analytical Chemistry, Vol. XX, No. X, 2005
ARTICLE IN PRESS
ionization (ESI) is used. Matrix effects can both reduceand enhance the response when compared to ‘‘solvent’’standards. The signal suppression or enhancement de-pends strongly on:
� the interface used (ESI in positive mode usuallysuffers higher signal suppression/enhancementthan negative mode);
� each individual pesticide;� each matrix tested (i.e., the amount of matrix per
mL of extract); and, also,� the sample-treatment procedure (e.g., extraction
solvent and clean-up procedure).To evaluate the signal suppression/matrix effects, the
slopes obtained in calibration with solvent-based stan-dards for each pesticide can be measured and the sloperatios (matrix/solvent) in the various different matricestested can be calculated. Another way would be bycomparing the signals obtained for a specific pesticidepresent at a certain concentration in different matrices.Fig. 3 shows the linear calibration curves of two selectedpesticides in fruit and vegetable matrices along with thestandard prepared in pure solvents; the variations inresponse of both thiabendazole and azoxystrobin areshown for different fruit and vegetable matrices. In thisexample, the matrix effects are only significant for
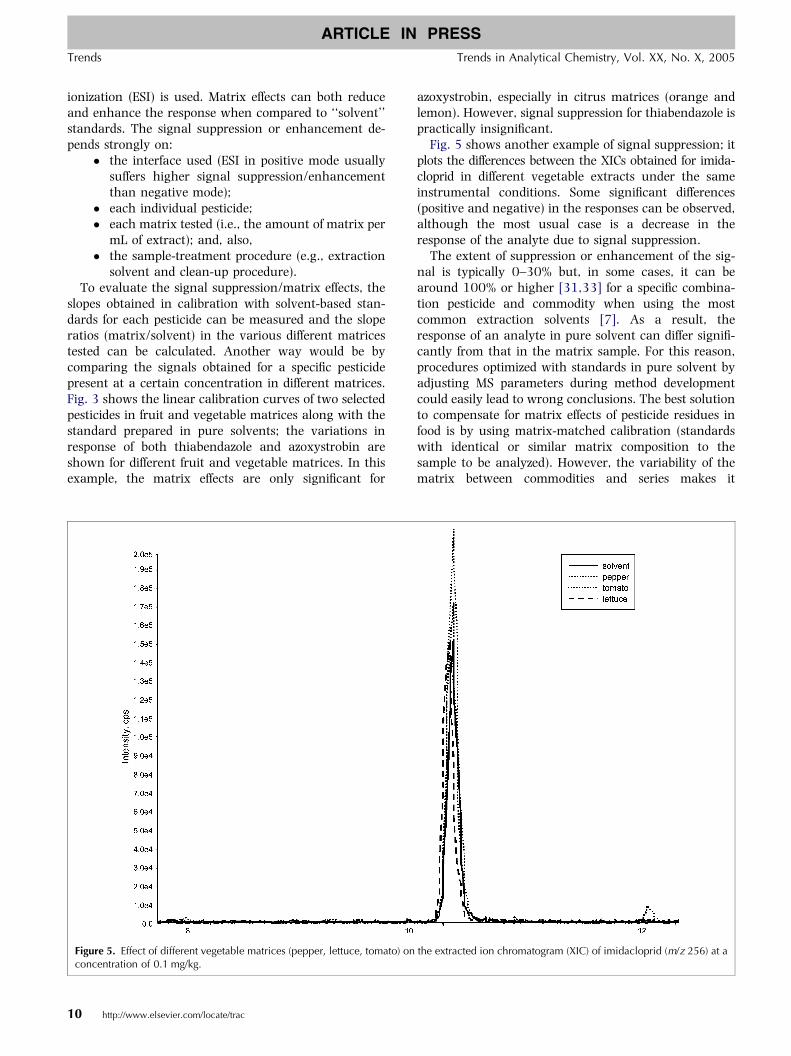
Figure 5. Effect of different vegetable matrices (pepper, lettuce, tomato) onconcentration of 0.1 mg/kg.
10 http://www.elsevier.com/locate/trac
azoxystrobin, especially in citrus matrices (orange andlemon). However, signal suppression for thiabendazole ispractically insignificant.Fig. 5 shows another example of signal suppression; it
plots the differences between the XICs obtained for imida-cloprid in different vegetable extracts under the sameinstrumental conditions. Some significant differences(positive and negative) in the responses can be observed,although the most usual case is a decrease in theresponse of the analyte due to signal suppression.The extent of suppression or enhancement of the sig-
nal is typically 0–30% but, in some cases, it can bearound 100% or higher [31,33] for a specific combina-tion pesticide and commodity when using the mostcommon extraction solvents [7]. As a result, theresponse of an analyte in pure solvent can differ signifi-cantly from that in the matrix sample. For this reason,procedures optimized with standards in pure solvent byadjusting MS parameters during method developmentcould easily lead to wrong conclusions. The best solutionto compensate for matrix effects of pesticide residues infood is by using matrix-matched calibration (standardswith identical or similar matrix composition to thesample to be analyzed). However, the variability of thematrix between commodities and series makes it
the extracted ion chromatogram (XIC) of imidacloprid (m/z 256) at a
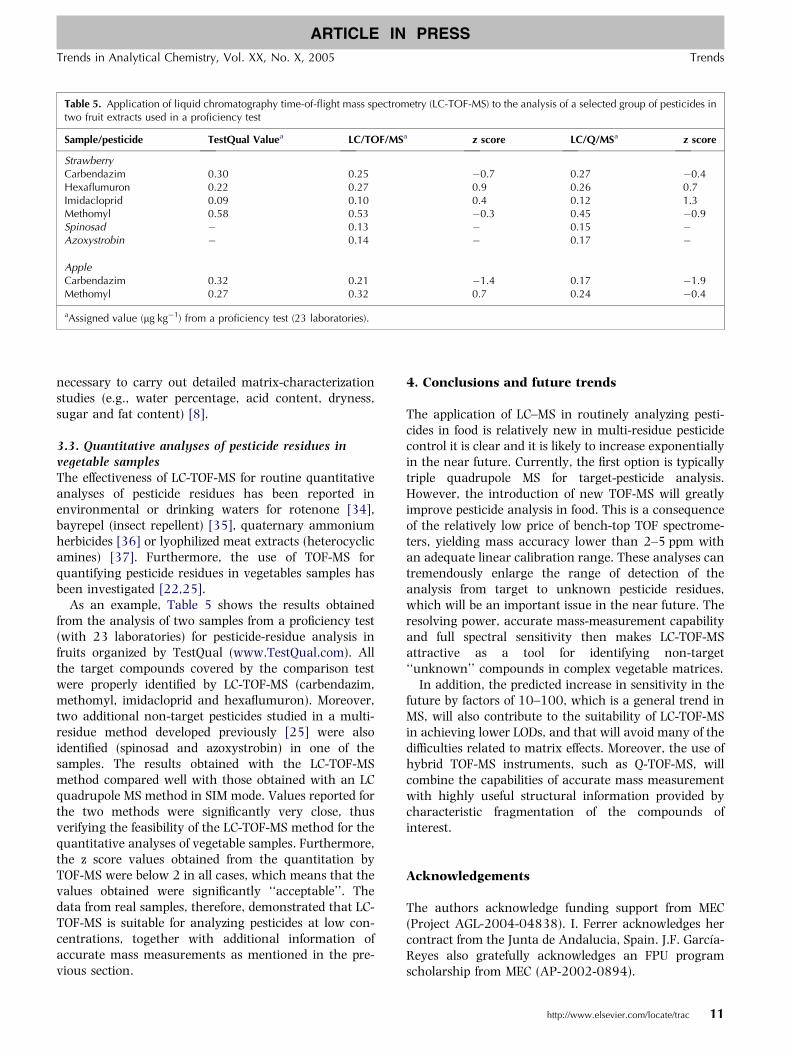
Table 5. Application of liquid chromatography time-of-flight mass spectrometry (LC-TOF-MS) to the analysis of a selected group of pesticides intwo fruit extracts used in a proficiency test
Sample/pesticide TestQual Valuea LC/TOF/MSa z score LC/Q/MSa z score
StrawberryCarbendazim 0.30 0.25 �0.7 0.27 �0.4Hexaflumuron 0.22 0.27 0.9 0.26 0.7Imidacloprid 0.09 0.10 0.4 0.12 1.3Methomyl 0.58 0.53 �0.3 0.45 �0.9Spinosad � 0.13 � 0.15 �Azoxystrobin � 0.14 � 0.17 �
AppleCarbendazim 0.32 0.21 �1.4 0.17 �1.9Methomyl 0.27 0.32 0.7 0.24 �0.4
aAssigned value (lg kg�1) from a proficiency test (23 laboratories).
Trends in Analytical Chemistry, Vol. XX, No. X, 2005 Trends
ARTICLE IN PRESS
necessary to carry out detailed matrix-characterizationstudies (e.g., water percentage, acid content, dryness,sugar and fat content) [8].
3.3. Quantitative analyses of pesticide residues invegetable samplesThe effectiveness of LC-TOF-MS for routine quantitativeanalyses of pesticide residues has been reported inenvironmental or drinking waters for rotenone [34],bayrepel (insect repellent) [35], quaternary ammoniumherbicides [36] or lyophilized meat extracts (heterocyclicamines) [37]. Furthermore, the use of TOF-MS forquantifying pesticide residues in vegetables samples hasbeen investigated [22,25].As an example, Table 5 shows the results obtained
from the analysis of two samples from a proficiency test(with 23 laboratories) for pesticide-residue analysis infruits organized by TestQual (www.TestQual.com). Allthe target compounds covered by the comparison testwere properly identified by LC-TOF-MS (carbendazim,methomyl, imidacloprid and hexaflumuron). Moreover,two additional non-target pesticides studied in a multi-residue method developed previously [25] were alsoidentified (spinosad and azoxystrobin) in one of thesamples. The results obtained with the LC-TOF-MSmethod compared well with those obtained with an LCquadrupole MS method in SIM mode. Values reported forthe two methods were significantly very close, thusverifying the feasibility of the LC-TOF-MS method for thequantitative analyses of vegetable samples. Furthermore,the z score values obtained from the quantitation byTOF-MS were below 2 in all cases, which means that thevalues obtained were significantly ‘‘acceptable’’. Thedata from real samples, therefore, demonstrated that LC-TOF-MS is suitable for analyzing pesticides at low con-centrations, together with additional information ofaccurate mass measurements as mentioned in the pre-vious section.
4. Conclusions and future trends
The application of LC–MS in routinely analyzing pesti-cides in food is relatively new in multi-residue pesticidecontrol it is clear and it is likely to increase exponentiallyin the near future. Currently, the first option is typicallytriple quadrupole MS for target-pesticide analysis.However, the introduction of new TOF-MS will greatlyimprove pesticide analysis in food. This is a consequenceof the relatively low price of bench-top TOF spectrome-ters, yielding mass accuracy lower than 2–5 ppm withan adequate linear calibration range. These analyses cantremendously enlarge the range of detection of theanalysis from target to unknown pesticide residues,which will be an important issue in the near future. Theresolving power, accurate mass-measurement capabilityand full spectral sensitivity then makes LC-TOF-MSattractive as a tool for identifying non-target‘‘unknown’’ compounds in complex vegetable matrices.In addition, the predicted increase in sensitivity in the
future by factors of 10–100, which is a general trend inMS, will also contribute to the suitability of LC-TOF-MSin achieving lower LODs, and that will avoid many of thedifficulties related to matrix effects. Moreover, the use ofhybrid TOF-MS instruments, such as Q-TOF-MS, willcombine the capabilities of accurate mass measurementwith highly useful structural information provided bycharacteristic fragmentation of the compounds ofinterest.
Acknowledgements
The authors acknowledge funding support from MEC(Project AGL-2004-04838). I. Ferrer acknowledges hercontract from the Junta de Andalucia, Spain. J.F. Garcıa-Reyes also gratefully acknowledges an FPU programscholarship from MEC (AP-2002-0894).
http://www.elsevier.com/locate/trac 11

Trends Trends in Analytical Chemistry, Vol. XX, No. X, 2005
ARTICLE IN PRESS
References
[1] europa.eu.int/comm/food/index_en.htm.
[2] European Commission, Commission Directive (EC) 1999/39 of 6
May 1999, Off. J. Eur. Commun. L124 (1999) 8.
[3] A. Aguera, S. Lopez, A.R. Fernandez-Alba, M. Contreras,
J. Crespo, L. Piedra, J. Chromatogr. A 1045 (2004) 125.
[4] Y. Pico, C. Blasco, G. Font, Mass Spectrom. Rev. 23 (2004) 45.
[5] C. Jansson, T. Pihlstrom, B-G. Osterdahl, K.E. Markides, J. Chro-
matogr. A 1023 (2004) 93.
[6] H.G.J. Mol, R.C.J. Van Dam, R.J. Vreeken, O.M. Steijger, J. AOAC
Int. 83 (2000) 742.
[7] H.G.J. Mol, R.C.J. Van Dam, O.M. Steijger, J. Chromatogr. A 1015
(2003) 119.
[8] A.R. Fernandez-Alba (Editor), Chromatographic Mass Spectromet-
ric Food Analysis for Trace Determination of Pesticide Residues,
Elsevier, Amsterdam, The Netherlands, 2005.
[9] M.J. Taylor, K. Hunter, K.B. Hunter, D. Lindsay, S. Le Bouhellec,
J. Chromatogr. A 982 (2002) 225.
[10] O.J. Pozo, J.M. Marin, J.V. Sancho, F. Hernandez, J. Chromatogr.
A 992 (2003) 133.
[11] J. Hau, S. Riediker, N. Varga, R.H. Stadler, J. Chromatogr. A 878
(2000) 77.
[12] S. Riediker, H. Obrist, N. Varga, R.H. Stadler, J. Chromatogr. A
966 (2002) 15.
[13] J.V. Sancho, O.J. Pozo, T. Zamora, S. Grimalt, F. Hernandez,
J. Agric. Food Chem. 51 (2003) 4202.
[14] I. Ferrer, M. Mezcua, M.J. Gomez, E.M. Thurman, A. Aguera,
M.D. Hernando, A.R. Fernandez-Alba, Rapid Commun. Mass
Spectrom. 18 (2004) 443.
[15] E.M. Thurman, I. Ferrer, R.J. Parry, J. Chromatogr. 957 (2002) 3.
[16] E.M. Thurman, I. Ferrer, M. Benotti, C.E. Heine, Anal. Chem. 76
(2004) 1228.
[17] I. Ferrer, C.E. Heine, E.M. Thurman, Anal. Chem. 76 (2004)
1437.
[18] I. Ferrer, E.M. Thurman, Trends Anal. Chem. 22 (2003) 750.
12 http://www.elsevier.com/locate/trac
[19] M. Ibanez, J.V. Sancho, O.J. Pozo, F. Hernandez, Anal. Chem. 76
(2004) 1328.
[20] I. Ferrer, E.M. Thurman (Editors), Liquid Chromatography Mass
Spectrometry/mass Spectrometry, Ms/ms and Time-of-flight MS:
Analysis of Emerging Contaminants, Am. Chem. Soc. Symp. Ser.,
850, Oxford University Press, New York, USA, 2003.
[21] F. Hernandez, M. Ibanez, J.V. Sancho, O.J. Pozo, Anal. Chem. 76
(2004) 4349.
[22] I. Ferrer, E.M. Thurman, A.R. Fernandez-Alba, Anal. Chem. 77
(2005) 2118.
[23] E.M. Thurman, I. Ferrer, A.R. Fernandez-Alba, J. Chromatogr. A
(2005) 127.
[24] E.M. Thurman, I. Ferrer, J.A. Zweigenbaum, J.F. Garcıa-Reyes,
M. Woodman, A.R. Fernandez-Alba, J. Chromatogr. A 2005 (in
press).
[25] I. Ferrer, J.F. Garcıa-Reyes, M. Mezcua, E.M. Thurman,
A.R. Fernandez-Alba, J. Chromatogr. A 2005 (in press).
[26] H.F. Schroder, Water Sci. Technol. 23 (1991) 339.
[27] H.F. Schroder, J. Chromatogr. 647 (1993) 219.
[28] H-Q. Li, F. Jiku, H.F. Schroder, J. Chromatogr. A 889 (2000) 155.
[29] D.A. Volmer, J.P.M. Hui, Arch. Environ. Contam. Toxicol. 35
(1998) 1.
[30] A.R. Fernandez-Alba, A. Tejedor, A. Aguera, M. Contreras,
J. Garrido, J. AOAC Int. 83 (2000) 748.
[31] C. Jansson, T. Pihlstrom, B.-G. Osterdahl, K.E. Markides, J. Chro-
matogr. A 1023 (2004) 93.
[32] N. Zhang, S.T. Fountain, H. Bi, D.T. Rossi, Anal. Chem. 72
(2000) 800.
[33] J. Klein, L. Alder, J. AOAC Int. 86 (2003) 1015.
[34] A. Holm, P. Molander, E. Lundanes, T. Greibrokk, J. Chromatogr.
A 983 (2003) 43.
[35] T.P. Knepper, J. Chromatogr. A 1046 (2004) 159.
[36] O. Nunez, E. Moyano, M.T. Galceran, Anal. Chim. Acta 525
(2004) 183.
[37] E. Barcelo-Barrachina, E. Moyano, M.T. Galceran, J. Chromatogr.
A 1054 (2004) 409.